The Robert BertramDoctoral Research Awards
2011 RESEARCH REPORT
Shareholder Rights, Managerial Incentives, and Firm Value
Feng Zhang David Eccles School of Business, University of Utah
1
Final Report of the Project Funded by The Canadian Foundation for Governance Research
Robert Bertram Doctoral Research Awards
Feng Zhang September 30, 2011
First of all, I thank the Canadian Foundation for Governance Research for the Robert Bertram Doctoral Research Awards. The awards have motivated me to work hard on this project and to contribute to our understanding of corporate governance. I have been working on this project since early 2010. The output of this project is a paper titled “Shareholder Rights, Managerial Incentives, and Firm Value,” which served as my job market while I was on the job market from late 2010 to early 2011. The paper helped me win the position of an assistant professor of finance at the Eccles School of Business, the University of Utah. It has been presented at the University of British Columbia, the University of Utah, the University of Toronto, the 2010 Northern Finance Association conference, and the 2011 China International Conference in Finance. I briefly summarize the paper in the following. One important task of the board of directors is to decide the top managers’ compensation. The board usually grants stocks and options to the managers to alleviate the agency problem between the managers and the shareholders, which stems from the fact that the managers usually do not own the firm. Managerial ownership is supposed to incentivize the managers to work for the shareholders’ interest and has been shown to enhance firm value, at least at low levels of managerial ownership. Too much managerial ownership, however, will damage firm value because it helps entrench the managers with the associated voting power. In this project, I find that managerial ownership enhances firm value in firms with strong shareholder rights, but damages firm value in those with weak shareholder rights. Shareholder rights are measured with antitakeover provisions, which protect the managers from takeovers. There are two reasons why the effect of managerial ownership on firm value depends on the strength of antitakeover provisions. First, antitakeover provisions intensify the entrenchment effect of managerial ownership. For example, with a staggered board, the managers can use their voting power in more than one year to prevent the raider from replacing the directors who do not agree with the acquisition. Second, antitakeover provisions weaken the incentive effect of managerial ownership. Antitakeover provisions increase the target firm’s bargaining position against the acquirer and thus increase the proportion of the synergy gains that accrues to the target. Synergy increases when the target managers exert less effort. Therefore, antitakeover provisions induce the target managers to exert less effort, i.e., decrease the incentive effect of managerial ownership, ceteris paribus. My findings have two important implications for board directors. First, directors should not grant stocks to the managers when shareholder rights are weak. Managerial ownership enhances firm value only when shareholder rights are strong. Second, my findings suggest that shareholder rights and managerial ownership are complementary governance mechanisms. Therefore,
2
directors should balance shareholder rights and managerial ownership when designing corporate governance mechanisms. Again, I deeply appreciate the support of the Canadian Foundation for Governance Research for my research, and look forward to talking about this project on October 11th, 2011 in Toronto. Sincerely yours, Feng Zhang Assistant Professor of Finance David Eccles School of Business University of Utah 1645 East Campus Center Drive Room 329 Salt Lake City, Utah 84112 Tel: 801-587-9476 Email: [email protected] Webpage: http://faculty.utah.edu/u0783034-Feng_Zhang/biography/index.hml
Shareholder Rights, Managerial Incentives,
and Firm Value ∗
Feng Zhang†
David Eccles School of BusinessUniversity of Utah
October 1, 2011
Abstract
This paper investigates interactions between two central corporate governancemechanisms: shareholder rights and managerial ownership. I find that the effect ofmanagerial ownership on firm value crucially depends on the strength of sharehold-er rights. For firms with strong shareholder rights, managerial ownership enhancesfirm value. For firms with weak shareholder rights, however, managerial ownershipdestroys firm value. The announcement return of manager share purchases in theopen market is significantly lower in firms with weak shareholder rights. Firms withweak shareholder rights also have significantly lower managerial ownership. Thefindings are robust to various measures of managerial ownership, different estima-tion methods, and endogeneity concerns. The evidence supports that shareholderrights and managerial ownership are complementary governance mechanisms.
∗This paper is based on the first chapter of my dissertation at the University of British Columbia.It was circulated under the title ”Antitakeover Provisions, Managerial Incentives, and Firm Value.” Ithank Rob Heinkel, Thomas Hellmann, and Kai Li for many insightful comments and discussions. Inaddition, I am grateful to Jan Bena, Ling Cen, Jason Chen, Glen Donaldson, Ron Giammarino, AlanKraus, Ali Lazrak, Mike Lemmon, Maurice Levi, Hernan Ortiz-Molina, Ning Tang, Liyan Yang, andseminar participants at UBC, University of Toronto, University of Utah, the 2010 Northern FinanceAssociation meetings, and the 2011 China International Conference in Finance meetings for their com-ments and suggestions. Financial support from the Canadian Foundation for Governance Research’sRobert Bertram Doctoral Research Awards is gratefully acknowledged. All remaining errors are mine.
†David Eccles School of Business, University of Utah, 1645 East Campus Center Drive, Salt LakeCity, Utah 84112. Email: [email protected]; Phone: 801-587-9476.
Shareholder Rights, Managerial Incentives,and Firm Value
Abstract
This paper investigates interactions between two central corporate governancemechanisms: shareholder rights and managerial ownership. I find that the effect ofmanagerial ownership on firm value crucially depends on the strength of sharehold-er rights. For firms with strong shareholder rights, managerial ownership enhancesfirm value. For firms with weak shareholder rights, however, managerial ownershipdestroys firm value. The announcement return of manager share purchases in theopen market is significantly lower in firms with weak shareholder rights. Firms withweak shareholder rights also have significantly lower managerial ownership. Thefindings are robust to various measures of managerial ownership, different estima-tion methods, and endogeneity concerns. The evidence supports that shareholderrights and managerial ownership are complementary governance mechanisms.
1 Introduction
Managerial ownership has two effects on corporate governance: the incentive effect and
the entrenchment effect. First, managerial ownership incentivizes a manager to act in the
shareholders’ interest (Jensen and Meckling, 1976). Second, it entrenches the manager
because of the associated voting power of ownership (Stulz, 1988). Shareholder rights,
as measured by antitakeover provisions, also have two effects on corporate governance.
Antitakeover provisions entrench the manager by protecting him/her from takeovers. In
addition, antitakeover provisions enhance a target firm’s bargaining position against the
acquirer and thus raise the bid premium.1 Shareholder rights and managerial ownership
work together to affect a firm’s governance. This paper investigates how the two central
governance mechanisms interact to affect managerial incentives and firm value. The
questions of interest are: Do shareholder rights affect the incentives generated by manager
shareholdings? How do shareholder rights and managerial ownership interact in affecting
firm value? And how do shareholders adjust managerial ownership with respect to the
strength of shareholder rights?
Theories suggest three channels of interaction between antitakeover provisions (share-
holder rights) and managerial ownership. First, antitakeover provisions and managerial
ownership may magnify each other’s entrenchment effect. Before the passage of the
second-generation antitakeover laws in the 1980s, an acquirer can purchase a significant
proportion of a target firm’s shares and then dismiss the target’s managers with the
voting power of the acquired shares, even if the target managers also hold non-trivial
ownership. The second-generation antitakeover laws usually require that the acquirer
must receive the approval of a supermajority of the target firm’s shareholders before the
acquirer purchases significant amounts of the target’s shares. The supermajority require-
ment to approve a merger makes the target manager’s voting power pivotal, and thus
1See DeAngelo and Rice (1983), Comment and Schwert (1995), and Heron and Lie (2006).
1
magnifies the entrenchment effect of managerial ownership. A staggered board—a widely
adopted antitakeover provision—may also magnify the entrenchment effect of managerial
ownership. With a staggered board, only a fraction (often one third) of the members
of the board is elected each year instead of en masse (where all directors have one-year
terms). The managers of a target firm with a staggered board are able to use their voting
power in more than one year to prevent the acquirer from replacing the target directors
who oppose the acquisition. Therefore, a staggered board magnifies the entrenchment
effect of the target managers’ ownership.
Second, antitakeover provisions may weaken the incentive effect of managerial own-
ership. When the manager exerts less effort, the firm’s stand-alone value is lower and
so acquiring this firm will generate a greater synergy gain. That is, less managerial
effort leads to greater synergies. When the target firm is able to seize a larger frac-
tion of the synergy with the help of antitakeover provisions which enhance the target
firm’s bargaining position against the acquirer, the target’s manager has incentives to
increase the size of the synergy by reducing effort, ceteris paribus. This implies that
antitakeover provisions reduce managerial effort; or put another way, since managerial
ownership leads to increased manager effort, antitakeover provisions weaken the incen-
tive effect of managerial ownership. In consequence, the effect of managerial ownership
on firm value decreases with the strength of antitakeover provisions.2 This is consistent
with Jensen (1993) who suggests that internal corporate governance mechanisms (includ-
ing managerial ownership) do not function without the existence of an active takeover
market.
Third, antitakeover provisions may enhance the effect of managerial ownership on
long-term investment. A manager may sacrifice long-term growth for short-term ob-
jectives, hurting the shareholders’ interests. Managerial ownership motivates the man-
2The model in the Appendix formalizes the impact of antitakeover provisions on the incentive effectof managerial ownership.
2
agers to commit to long-term investment and thus alleviates the “managerial myopia”
problem.3 Antitakeover provisions also alleviate the “managerial myopia” problem. Stein
(1988) shows that, facing the threat of being acquired, the manager has incentives to in-
vest in suboptimal short-term projects to boost short-term profits. Protecting the man-
ager from takeovers, antitakeover provisions encourage him/her to commit to optimal
long-term investment. Antitakeover provisions and managerial ownership may reinforce
each other’s effect on the “managerial myopia” problem.
The first two channels of interaction state that antitakeover provisions magnify the
entrenchment effect of managerial ownership and weaken the incentive effect of manage-
rial ownership, respectively. These two channels of interaction imply that antitakeover
provisions decrease the overall firm value effect of managerial ownership. The third chan-
nel of interaction, in contrast, implies that antitakeover provisions enhance the incentive
effect of managerial ownership and thus increase the firm value effect of managerial
ownership.
No paper to my knowledge has developed or tested these channels of interaction
between antitakeover provisions and managerial ownership. This study fills the void.
Understanding the interactions between shareholder rights and managerial ownership is
of considerable practical importance for the shareholders and boards of directors who
design governance mechanisms for their firms. It is also important for legislators and
regulators who may intervene in both firms’ executive compensation practices, which
may affect managerial ownership, and antitakeover provisions.
I measure the strength of shareholder rights with the entrenchment index (E index
hereafter) constructed by Bebchuk, Cohen, and Ferrell (2009) using six antitakeover
provisions. A greater E index indicates weaker shareholder rights (stronger antitakeover
provisions). As a robustness check, I also examine the interaction between managerial
3See Bizjak, Brickley, and Coles (1993), and Narayanan (1996).
3
ownership and individual antitakeover provisions. Managerial ownership is measured
with the stock ownership and/or pay-performance sensitivity of the top five executives
(or the CEO) of each firm. Firm value is measured with Tobin’s Q.
The main findings of this paper are as follows. I find that antitakeover provisions
significantly, both statistically and economically, decrease the effect of managerial own-
ership on firm value. Each additional antitakeover provision in the E index reduces the
marginal effect of managerial ownership on firm value by approximately 30 percent. The
impact of antitakeover provisions is so large that the effect of managerial ownership on
firm value becomes negative when the E index is above the median. In contrast, man-
agerial ownership enhances firm value when the E index is below the median, unless
the managers have very high levels of ownership. The six antitakeover provisions in the
E index weaken the incentive effect of managerial ownership not only in aggregate but
also individually. The results are robust to a battery of robustness checks, including
alternative measures of managerial ownership and different econometric models.
The results are prone to endogeneity concerns because, arguably, both the level of
managerial ownership and the strength of antitakeover provisions are endogenously de-
termined. I deal with potential endogeneity issues by controlling for firm fixed effects,
conducting an event study, running instrumental variable regressions, and excluding al-
ternative explanations. The results of these endogeneity analyses uniformly support that
antitakeover provisions decrease the effect of managerial ownership on firm value. For
example, the event study shows that antitakeover provisions decrease the announcement
return of manager share purchases in the open market.
The findings in this paper are consistent with the the first two channels of interaction
between antitakeover provisions and managerial ownership, i.e., antitakeover provisions
magnify the entrenchment effect of managerial ownership and/or weaken the incentive
effect of managerial ownership. Aware of the negative impact of antitakeover provisions
4
on the value effect of managerial ownership, the shareholders should grant fewer shares to
the manager when antitakeover provisions are strong.4 Consistent with this prediction, I
find that managerial ownership decreases significantly with the strength of antitakeover
provisions. On average, the combined ownership of the top five executives is 7.6% in the
firms with the weakest antitakeover provisions, and 2.1% in the firms with the strongest
antitakeover provisions. These results corroborate the findings that antitakeover provi-
sions decrease the value effect of managerial ownership.
This paper contributes to the literature on the value effect of managerial ownership,
which documents an inverse U-shaped relation between managerial ownership and firm
value.5 The inverse U-shaped relation suggests that the incentive effect of managerial
ownership dominates the entrenchment effect of managerial ownership at low levels of
managerial ownership, while the entrenchment effect dominates the incentive effect at
high levels of managerial ownership. Claessens, Djankov, Fan, and Lang (2002), Lin-
s (2003), and Gompers, Ishii, and Metrick (2010) try to disentangle the incentive and
entrenchment effects of managerial ownership, and find that firm value increases with
managers’ cash flow right but decreases with their control right. This paper finds the the
value effect of managerial ownership depends on another important corporate governance
mechanism, shareholder rights. The inverse U-shaped relation holds only when share-
holder rights are strong. With weak shareholder rights, increasing managerial ownership
always destroys firm value, because antitakeover provisions magnify the entrenchment ef-
fect of managerial ownership and/or weaken the incentive effect of managerial ownership:
The magnified entrenchment effect of managerial ownership prevail over the weakened
incentive effect of managerial ownership even at low levels of managerial ownership.
This paper also contributes to a growing literature on the interactions between corpo-
4The model in the Appendix formalizes this prediction.5See, among others, Morck, Shleifer, and Vishny (1988), McConnell and Servaes (1990), Hermalin
and Weisbach (1991), Kole (1995), and Holderness, Kroszner, Sheehan (1999), McConnell, Servaes, andLins (2008), and Fahlenbrach and Stulz (2009).
5
rate governance mechanisms. Cremers and Nair (2005); Cremers, Nair, and Wei (2007);
Huson, Parrino, and Starks (2001); and Kini, Kracaw, and Mian (2004) study how the
market for corporate control interacts with the board of directors and/or institutional
investor monitoring. Cohn and Rajan (2010) model the interaction between the board
and activist investors. Giroud and Mueller (2010, 2011) study the interaction between
shareholder rights and product market competition. Kim and Lu (2011) study whether
and how CEO ownership interacts with product market competition and institutional
investor monitoring. Bertrand and Mullainathan (1999, 2000), and Cheng and Indje-
jikian (2009) study how the second-generation state takeover laws affect the level and
structure of executive compensation. This paper contributes to the literature by show-
ing that shareholder rights and managerial ownership, two central corporate governance
mechanisms, complement each other.
The rest of the paper is organized as follows. Section 2 describes the data and
methodology. Section 3 presents the empirical results and implements various robustness
checks. Section 4 addresses potential endogeneity issues. Section 5 examines the rela-
tion between managerial ownership and the strength of antitakeover provisions. Finally,
section 6 concludes the paper.
2 Methodology and Data
2.1 Methodology
Following the literature (e.g., Morck, Shleifer, and Vishny, 1988), firm value is measured
with Tobin’s Q. Managerial ownership is calculated as the aggregate ownership of the
top five executives covered in the Standard and Poor’s ExecuComp database. Restricted
stocks are included in the calculation, while stock options are excluded. Including stock
options does not qualitatively affect the results, as will be shown in section 3.
6
The strength of a firm’s antitakeover provisions is measured with the E index con-
structed by Bebchuk, Cohen, and Ferrell (2009) using six antitakeover provisions: stag-
gered boards, poison pills, supermajority requirement for mergers, limits to amend by-
laws, limits to amend charter, and golden parachutes. The E index increases by one for
each antitakeover provision in place. Therefore, it takes values from zero (for the weakest
antitakeover provisions) to six (for the strongest antitakeover provisions).
The following econometric model is employed to test the interaction between anti-
takeover provision and managerial ownership:
Qit = β0 + β1 ×Managerial ownershipit + β2 ×Managerial ownership2it
+β3 × E indexit + β4 ×Managerial ownershipit × E indexit
+β5 ×Xit + uit. (1)
where Qit is the Tobin’s Q of stock i in year t; Xit is a vector of control variables; and
uit is the residual. The interaction variable of managerial ownership and the E index
captures the impact of antitakeover provisions on the effect of managerial ownership on
firm value. The square of managerial ownership is also added to capture the non-linear
effect of managerial ownership on firm value.6 Tobin’s Q may have measurement errors.
I alleviate this problem by using industry-adjusted Tobin’s Q and controlling for firm
fixed effects. Also, I cluster the residuals by firm and control for year fixed effects to
account for cross-sectional and time-series dependence in the residuals, as suggested by
Petersen (2009).
Following Himmelberg, Hubbard, and Palia (1999), I control for possible determi-
nants of managerial ownership in the regression. Firms whose assets are difficult to
monitor should provide greater incentives to their managers in order to mitigate the
6See Footnote 3 for the literature on the inverse U-shaped relation between managerial ownershipand firm value.
7
moral hazard problem. Therefore, the following variables are included as proxies for the
scope of managerial discretionary spending: capital-to-sales ratio, research and develop-
ment (R&D) spending, advertisement spending, investment, and profit margin. The first
three variables are related to asset tangibility; profit margin measures the gross cash flows
available for operation; and investment measures the scope for discretionary projects. All
else being equal, managers in firms with greater idiosyncratic risks prefer lower ownership
for the reason of diversification. Therefore, idiosyncratic risk is also included as a control
variable. In addition, I control for firm size as measured by sales.7 Descriptions of these
variables can be found in the Appendix.
2.2 Data
The data on managerial ownership are retrieved from Standard and Poor’s ExecuComp
database. Standard and Poor’s collects the ownership data directly from companies’
annual proxy since 1992. For each fiscal year from 1992-2007, managerial ownership is
calculated as the total number of shares owned by the top five executives divided by
the total number of shares outstanding. Stock return data are retrieved from the CRSP
database, accounting numbers from the Compustat database, and corporate governance
data from the RiskMetrics database. Utilities (SIC codes 4900-4949) and financial firms
(SIC codes 6000-6999) are excluded from the sample. Including them in the sample yields
similar results throughout. The final sample has 14,962 firm-year observations.
Table 1 Panel A presents the summary statistics of managerial ownership over the
sample period. There are 524 firms in the sample in 1992. The number of firms increases
to more than 700 during the period 1993-1997, and reaches 1,000 in 1998. The number
stays stable at around 1,000 firms during the period 1998-2001, and further increases to
more than 1,100 firms after 2001. On average, the top five executives own 3.9 percent
7The results are robust to other measures of firm size including total assets and book equity.
8
of their companies. The distribution of managerial ownership is positive-skewed with a
median of 0.8 percent. The mean managerial ownership is more than 4 percent in the
1990s and gradually decreases to 2.7 percent in 2007.
RiskMetrics collects data on antitakeover provisions for the S&P 1500 firms in the
years of 1990, 1993, 1995, 1998, 2000, 2002, 2004, and 2006. For the years when the
antitakeover provision data are not updated, the most recent data are used following
Bebchuk, Cohen, and Ferrell (2009). Table 1 Panel B presents the summary statistics of
the E index for the years when the antitakeover provision data are updated.8 The mean
E index is around 2.3 in the 1990s and increases slightly to around 2.5 in the 2000s. The
median E index is 2 or 3 over the sample period. The summary statistics are similar to
those of Bebchuk et al. (2009).
Table 1 Panel C presents the frequencies of the six antitakeover provisions in the E
index. Golden parachutes, staggered boards, and poison pills are the most commonly
adopted provisions. On average, 62 percent of firms have golden parachutes in place,
59 percent have staggered boards, and 59 percent have poison pills. A supermajority
requirement to approve mergers and limits to amend bylaws are adopted by 18 percent of
the firms. Limits to amend charter is the least commonly adopted antitakeover provision
among the six: On average, only 2 percent of firms have it. The frequencies of staggered
boards, poison pills, and limits to amend charter are stable during the sample period
with only small fluctuations over the years. The frequency of having a supermajority
requirement to approve mergers steadily decreased from approximately 40 percent in
1992 to less than 33 percent in 2006. On the contrary, limits to amend bylaws gained
popularity during this period—its frequency increased from 13 percent in 1992 to 19
percent in 2006. The most salient changes however happened to golden parachutes: The
proportion of firms that had golden parachutes increased from about 50 percent in 1992
8I also include the year of 1992, the first year of the sample period.
9
to about 75 percent in 2006.
Table 2 Panel A presents the summary statistics of Tobin’s Q, managerial ownership,
the E index, and the control variables. The mean Tobin’s Q and industry-adjusted
Tobin’s Q are 2.0 and 0.4, respectively. As shown in Table 1, the mean managerial
ownership is 3.9 percent; the mean E index is 2.4. The average firm has annual sales of
approximately $5 billion. On average, property, plant, and equipment (PPE) accounts
for 38 percent of annual sales. The mean idiosyncratic risk is about 2.4 percent, while the
mean profit margin is about 15 percent. On average, the sample firms spend 28 percent
of PPE on R&D, 9.5 percent on advertisement, and 23 percent on investment. Lastly,
the data on R&D spending and advertisement spending are available for 64 percent and
36 percent of the firms, respectively.
Before presenting the multivariate regression results, it is necessary to examine the
correlations between the variables, which are presented in Table 2 Panel B. Managerial
ownership is positively and significantly correlated with both Tobin’s Q and industry-
adjusted Tobin’s Q; while the E index is negatively and significantly correlated with
Tobin’s Q, industry-adjusted Tobin’s Q, and managerial ownership. The extent of the
correlation among most pairs of variables raises little concern for multicollinearity in the
regression analyses.
3 Interaction between Antitakeover Provisions and
Managerial Ownership
3.1 Main Results
Table 3 presents the multivariate regression results of model (1). Column (1) reports the
pooled OLS regression results. The residuals in the regression may be correlated across
firm or over time, leading to over- or under-stated standard errors in the pooled OLS
10
regressions. Following the suggestions of Petersen (2009), I control for year fixed effects
and cluster the residuals by firm in column (2) to have robust standard errors. Column
(2) also controls for industry fixed effects. As an alternative way to show the impact of
antitakeover provisions on the effect of managerial ownership on firm value, the sample
is divided into two sub-samples based on the E index: the firms in the first sub-sample
have an E index between 0 and 2, while those in the second sub-sample have an E index
between 3 and 6.9 Columns (3) and (4) of Table 3 present the regression results for these
two sub-samples, respectively. In column (5), the dependent variable is replaced with
the industry-adjusted Tobin’s Q as an alternative way to control for industry effects. As
another robustness check, the interaction variable of managerial ownership squared and
the E index is added to the right hand side of the regression in column (6).
The results in column (1) indicate that managerial ownership is positively and signif-
icantly associated with Tobin’s Q at the one percent level; the coefficient on managerial
ownership squared is negative and statistically significant at the ten percent level; and
the E index is negatively and significantly associated with Tobin’s Q at the one percent
level. These findings are consistent with the previous literature. More interestingly, the
coefficient on the interaction variable of managerial ownership and the E index is negative
and statistically significant at the one percent level, suggesting that the marginal effect
of managerial ownership on firm value decreases with the E index. This interaction is
also economically significant. When the E index increases by one, the marginal effect of
managerial ownership on Tobin’s Q decreases by 0.552, which is approximately one third
of the coefficient on managerial ownership (1.635).
The results are robust when controlling for industry and year fixed effects and clus-
tering standard errors by firm: the results in columns (2) and (5) are qualitatively similar
to those in column (1).
9Figure 1 suggests that the effect of managerial ownership on firm value becomes negative for firmswith an E index above 2.
11
The results in columns (3) and (4) confirm that the effect of managerial ownership on
firm value depends significantly on the E index. The coefficient on managerial ownership
is positive and statistically significant at the five percent level in column (3), where the
firms have an E index from 0 to 2. The coefficient on managerial ownership becomes
negative and statistically significant at the ten percent level in column (4), where the
firms have an E index from 3 to 6.
Figure 1 plots the fitted value of Tobin’s Q against managerial ownership at dif-
ferent E indexes. The fitted value of Tobin’s Q is generated using the regression re-
sults in column (2) of Table 3: Q = 3.574 + 1.858 × Managerial ownership − 1.360 ×
Managerial ownership2 − 0.044× E index− 0.536×Managerial ownership×E index. S-
ince the top five executives in almost all firms have ownership below 20 percent, the figure
focuses on the relation between managerial ownership and Tobin’s Q over this empirical
range of managerial ownership.10 It shows that for the firms with an E index below 3,
firm value increases with managerial ownership over the empirical range of managerial
ownership. The effect of managerial ownership on firm value is indistinguishable from
zero for the firms with an E index of 3, and becomes negative as the E index reaches
above 3.11
Column (6) shows that the coefficient on the interaction variable of managerial own-
ership squared and the E index is statistically indifferent from zero. Also, adding this
interaction variable does not affect the main results of the paper: the coefficient on the
interaction variable of managerial ownership and the E index is still significantly negative.
Table 3 also shows that firms with smaller sales, less intangible assets, lower id-
iosyncratic risks, greater profit margins, more R&D spending, and more investments are
positively associated with Tobin’s Q. Moreover, sales squared and tangibility squared are
10The 95th percentile of managerial ownership is just above 20 percent in the sample.11Over the full range of managerial ownership (from 0 to 100 percent) there is an inverse U-shaped
relation between managerial ownership and Tobin’s Q for the firms with an E index below 3. For thefirms with an E index between 3 and 6, increasing managerial ownership always destroys firm value.
12
positively associated with Tobin’s Q.
3.2 Different Measures of Managerial Ownership
Stock options have been widely used to compensate executives since the early 1990s
(Hall and Liebman, 1998, and Aggarwal and Samwick, 2003). They are expected to
provide similar incentives for executives as stock grants. As a robustness check, in this
section I include stock options as part of managerial ownership. Usually the CEO makes
the most important corporate decisions and thus has the biggest impact on firm value.
Therefore as another robustness check, this section also singles out the CEO’s ownership
and investigates its effect on firm value.
Pay-performance sensitivity (PPS) is commonly used to measure managers’ incen-
tives when both stocks and stock options are considered. For stocks, PPS is simply the
percentage stock ownership; for stock options, PPS equals the number of shares under-
lying the options times the delta of each option divided by the total number of shares
outstanding. The delta is defined as the partial derivative of the option value with re-
spect to stock price. Managerial PPS is computed following Guay (1999) and Core and
Guay (2002).
Table 4 Panel A reports the means of six measures of managerial ownership for
each year from 1992-2007. The six measures are managerial stock ownership, managerial
PPS of stock options, managerial PPS of both stocks and stock options, CEO stock
ownership, CEO PPS of stock options, and CEO PPS of both stocks and stock options.
The mean stock ownership of the top five executives was more than 4 percent in the
1990s and gradually decreased to 2.7 percent in 2007. In contrast with the declining
trend in managerial stock ownership, the mean managerial PPS of stock options gradually
increased from 0.8 percent in 1992 to 2.5 percent in the new millennium, and then slightly
decreased to 2.1 percent in 2007. The mean managerial PPS—sum of managerial stock
13
ownership and managerial PPS of stock options—was 5 percent in 1992, increased to 7
percent in the new millennium, and then decreased to 4.7 percent in 2007. The CEO
stock ownership was on average 2.9 percent in 1992, slightly increased to its peak value
of 3.2 percent in 1998, and then gradually decreased to 1.7 percent in 2007. On average,
the CEO PPS of stock options was merely 0.2 percent in 1992, gradually increased to
1.2 percent in 2002, and then slightly decreased to 1.1 percent in 2007. Finally, the
mean CEO PPS was 3.1 percent in 1992, increased to more than 4.1 percent during the
“Internet Bubble” (1998-2000), and then decreased to 2.7 percent in 2007.
Table 4 Panel B reports the medians of the six measures of managerial ownership
for each year from 1992-2007. The medians are much lower than their respective means
in Panel A, but follow similar patterns as the means over the sample period. Taken
together, the period 1992-2007 has exhibited diminishing managerial stock ownership
and an increasing popularity in stock options as a component of executive compensation,
while the total managerial PPS remained stable over the sample period. The temporal
patterns observed in my sample are consistent with previous studies such as Hall and
Liebman (1998) and Aggarwal and Samwick (2003).
To assess the robustness of the results in Table 3, I estimate model (1) using three
alternative measures of managerial ownership: managerial PPS, CEO stock ownership,
and CEO PPS. The results are reported in Table 4 Panel C. All these three measures
of managerial ownership are positively associated with the industry-adjusted Tobin’s Q,
and all the associations are statistically significant. The coefficient on CEO stock own-
ership squared is negative and statistically significant at the ten percent level, whereas
the coefficients on the squares of the other two measures are negative but statistically
insignificant from zero. The E index is negatively and significantly associated with the
industry-adjusted Tobin’s Q in all three columns. In addition, the coefficients on the
interaction variables between the E index and the three measures of managerial owner-
14
ship are all negative and statistically significant at the one percent or five percent level.
Finally, the coefficients on the control variables have similar economic and statistical
significances across the three regressions. Overall, the results in section 3.1 are robust to
different measures of managerial ownership.
3.3 Individual Antitakeover Provisions
The results in the last two sections suggest that the six antitakeover provisions in the
E index as a whole decrease the marginal effect of managerial ownership on firm value.
Does each individual antitakeover provision interact with managerial ownership? This
section answers this question.
Poison pills and staggered boards make it almost impossible for a takeover to succeed
without negotiating with the target’s board of directors. The number of directors is
much smaller than the number of shareholders and the directors meet frequently. This
makes it easier for the board to form a cartelized response to the acquirer and thereby
enhances the target firm’s bargaining position (DeAngelo and Rice, 1983). An enhanced
bargaining position increases the proportion of the synergy that accrues to the target’s
shareholders, and consequently weakens the manager’s incentives to work hard ex ante.
Therefore, poison pills and staggered boards are expected to weaken the incentive effect
of managerial ownership. Recall that this is the second channel of interaction between
antitakeover provisions and managerial ownership developed in the introduction and the
model in the Appendix. Protecting the manager from a takeover in more than one year,
a staggered board magnifies the entrenchment effect of managerial ownership. This is
the first channel of interaction. Managerial ownership encourages the manager to make
long-run investment. Protecting the manager from takeovers, poison pills and staggered
boards also encourage the manager to make long-run investment (Stein, 1988), and may
enhance the effect of managerial ownership on long-run investment. Recall that this is the
15
third channel of interaction between antitakeoeve provisions and managerial ownership
developed in the introduction. In summary, staggered boards are expected to interact
with managerial ownership through all three channels, while poison pills are expected to
interact with managerial ownership through the first and the third channel.
Limits to amend bylaws and limits to amend charter usually require a superma-
jority vote in order to pass an amendment. Limits to amend bylaws/charter as well
as a supermajority requirement to approve mergers make the manager’s voting power
more pivotal and thus magnify the entrenchment effect of managerial ownership. From
the perspective of each individual shareholder, these supermajority provisions encourage
him/her to hold out for a higher bid price in an acquisition, and thus will increase the
bid premium. Hence, these three supermajority provisions are also expected to weaken
the incentive effect of managerial ownership through the second channel of interaction.
These three supermajority provisions protect the manager from takeovers and thus may
enhance the effect of managerial ownership on long-run investment through the third
channel of interaction. In summary, limits to amend bylaws, limits to amend charter,
and supermajority requirement to approve mergers are expected to interact with man-
agerial ownership through all three channels of interaction.
Most managers lose their jobs after their firms are acquired, and fail to find a com-
parable job in other institutions (Hartzell, Ofek, and Yermack, 2004). This is probably
because they have firm-specific skills which are not desirable for other firms. Such per-
sonal losses could lead the target’s managers to resist merger proposals that benefit the
shareholders. Golden parachutes, by reducing the target managers’ personal losses, may
induce them to agree with the acquisition. In other words, golden parachutes increase
the probability of takeover and thus increase the expected bid premium to be received
by the target’s shareholders.12 Harris (1990) shows that golden parachutes increase the
12Bebchuk, Cohen, and Wang (2010) and Fich, Tran, and Walkling (2011) find that golden parachutesincrease the probability of receiving an M&A bid and the expected bid premium.
16
proportion of the synergy that accrues to the target firm using the Nash bargaining solu-
tion. Hence, golden parachutes are expected to weaken the incentive effect of managerial
ownership through the second channel of interaction.
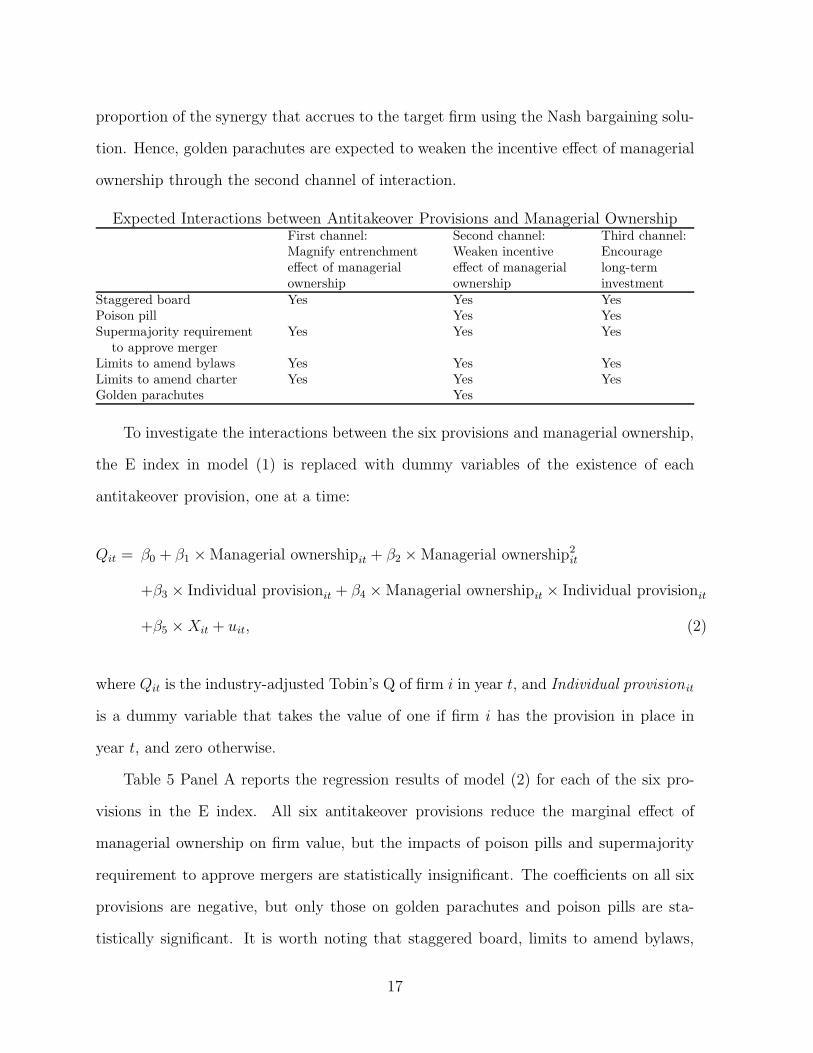
Expected Interactions between Antitakeover Provisions and Managerial OwnershipFirst channel: Second channel: Third channel:Magnify entrenchment Weaken incentive Encourageeffect of managerial effect of managerial long-termownership ownership investment
Staggered board Yes Yes YesPoison pill Yes YesSupermajority requirement Yes Yes Yes
to approve mergerLimits to amend bylaws Yes Yes YesLimits to amend charter Yes Yes YesGolden parachutes Yes
To investigate the interactions between the six provisions and managerial ownership,
the E index in model (1) is replaced with dummy variables of the existence of each
antitakeover provision, one at a time:
Qit = β0 + β1 ×Managerial ownershipit + β2 ×Managerial ownership2it
+β3 × Individual provisionit + β4 ×Managerial ownershipit × Individual provisionit
+β5 ×Xit + uit, (2)
where Qit is the industry-adjusted Tobin’s Q of firm i in year t, and Individual provision it
is a dummy variable that takes the value of one if firm i has the provision in place in
year t, and zero otherwise.
Table 5 Panel A reports the regression results of model (2) for each of the six pro-
visions in the E index. All six antitakeover provisions reduce the marginal effect of
managerial ownership on firm value, but the impacts of poison pills and supermajority
requirement to approve mergers are statistically insignificant. The coefficients on all six
provisions are negative, but only those on golden parachutes and poison pills are sta-
tistically significant. It is worth noting that staggered board, limits to amend bylaws,
17
and limits to amend charter significantly affect firm value only through their interactions
with managerial ownership.
RiskMetrics also collects information on the other eighteen antitakeover provisions in
addition to the six provisions in the E index. The twenty four provisions constitute the G
index developed by Gompers, Ishii, and Metrick (2003). I replace the E index in model
(1) with the G index and present the regression results in column (2) of Table 5 Panel
B. The results show that the G index is negatively associated with the industry-adjusted
Tobin’s Q, with the effect statistically significant at the one percent level. However, the
G index does not significantly interact with managerial ownership in affecting firm value.
Taken as a whole, the results in Table 5 suggest that the six antitakeover provisions
in the E index decrease the effect of managerial ownership on firm value not only in aggre-
gate but also individually. However, not all the six antitakeover provisions individually
affect the value effect of managerial ownership. The twenty four antitakeover provisions
in the RiskMetrics database in aggregate also do not affect the value effect of managerial
ownership. One possible reason is that some individual provisions and the twenty four
provisions in aggregate are noisy measures of shareholder rights. Interacting these prox-
ies for shareholder rights that have measurement errors with managerial ownership will
militate again finding significant effects (see Green, 2000).
4 Dealing with Endogeneity
The results in section 3 have established that managerial ownership, the E index and
their interaction are significantly associated with firm value. The statistical associations,
however, do not necessarily imply that managerial ownership or the E index causes vari-
ations in firm value. Managerial ownership, antitakeover provisions, and firm value may
be simultaneously determined by some fundamental firm characteristics. These funda-
mental firm characteristics are usually unobserved by researchers and thus result in the
18
unobserved heterogeneity problem. If this problem is indeed relevant, the statistical rela-
tions will disappear once the relevant fundamental firm characteristics are appropriately
controlled for.
This section addresses the unobserved heterogeneity concern in four ways. First, I use
firm fixed effects to control for time-invariant firm characteristics. Second, I investigate
the impact of antitakeover provisions on the announcement return of manager share
purchases in the open market. Third, I construct instrumental variables for managerial
ownership and the E index. Lastly, I propose and test an alternative explanation for the
results in section 3.
4.1 Firm Fixed Effects
If the unobserved firm characteristics are constant over time, adding firm fixed effects
in the regression can effectively resolve the unobserved heterogeneity problem. This
observation motivates Himmelberg, Hubbard, and Palia (1999) to employ firm fixed
effects to deal with the endogeneity issue concerning managerial ownership.
I run OLS regressions with firm fixed effects for Tobin’s Q and the industry-adjusted
Tobin’s Q and present the results in the two columns of Table 6, respectively. Managerial
ownership is positively associated with Tobin’s Q and the industry-adjusted Tobin’s Q,
and both effects are significant at the one percent level. The coefficients on managerial
ownership squared in the two columns are negative and statistically significant at the one
percent level. The coefficients on the E index become statistically indifferent from zero.
They are statistically significant at the one percent level in Table 3 where firm fixed effects
are not controlled for. The coefficients on the interaction variable of managerial ownership
and the E index are negative and statistically significant at the five percent and one
percent level in the two columns, respectively. These results indicate that antitakeover
provisions affect firm value only through their interactions with managerial ownership.
19
Zhou (2001) points out that managerial ownership changes slowly from year to year
within a company, and argues that small, one-year changes in ownership are unlikely to
provide sufficient incentives that would lead to substantive within-year changes in firm
value. By relying on within variations, regressions with firm fixed effects may not detect
an effect of managerial ownership on firm value even if one exists. This argument also
applies to the E index, which shows small variations over the sample period (Table 1).
Zhou’s argument implies that firm fixed effects militate against finding significant
effects of managerial ownership and the E index on firm value. Even so, I find that
antitakeover provisions still significantly decrease the effect of managerial ownership on
firm value after controlling for firm fixed effects. Meanwhile, the E index is no longer
directly associated with firm value after controlling for firm fixed effects, suggesting
that antitakeover provisions affect firm value only through their impacts on managerial
incentives.
4.2 An Event Study
Another way to resolve the unobserved heterogeneity problem is to investigate how an-
titakeover provisions affect the value effect of changes in managerial ownership. This
method has two merits relative to the firm fixed effects approach. First, by relating
changes in managerial ownership to changes in firm value, it controls for any unobserved
firm-specific fixed effects. Second, changes in firm value within a short event window
contain less “noise” than the annual changes in firm value using the firm fixed effects
approach. Following McConnell, Servaes, and Lins (2008), I study the market reactions
to announcements of manager share purchases in the open market. Share sales are ex-
cluded because they usually occur after option exercises and thereby are anticipated by
the market (Ofek and Yermack, 2000).
I merge the ExecuComp database with the Thomson Reuters insider trading database
20
to retrieve open market stock purchases by the top executives whose shareholdings are
reported in the ExecuComp database. Multiple manager share purchase announcements
on the same day are combined into one. During the period 1993-2008, the top executives
announced 4,162 stock purchases of the firms they manage. The mean (median) size
of share purchases is 0.065 (0.008) percent of the total number of shares outstanding.
Similar to McConnell et al., I compute the 7-day ([-1, +5]) cumulative abnormal returns
(CARs) around the share purchase announcement. This 7-day window is chosen because
the information usually does not enter the public domain for several days after being
filed with the SEC (Lakonishok and Lee, 2001). The announcements are greeted with a
mean (median) 7-day CARs of 2.08 (0.86) percent. The 5-day ([-1, +3]) CARs are also
computed as a robustness check of the following regression analysis.
The following model is employed to investigate how antitakeover provisions influence
the effect of manager share purchases on firm value:
CARs = β0 + β1 ×Manager share purchasesi
+β2 × Pre-purchase managerial ownershipi + β3 × E indexi
+β4 ×Manager share purchasesi × Pre-purchase managerial ownershipi
+β5 ×Manager share purchasesi × E indexi + ui. (3)
where Manager share purchases is the number of shares the manager purchases divided
by the total number of shares outstanding, and Pre-purchase managerial ownership is
the managerial ownership at the beginning of the fiscal year.13 The model is similar to
13The regression results are qualitatively unchanged if the managerial ownership right before theshare purchase is used instead. This alternative measure requires tracking the changes in managerialownership from the beginning of the fiscal year to the open market stock purchase, which are very smalland thus do not change the results. The changes in managerial ownership during that period are hard tocompute because the Thomson Reuters insider trading database only records open-market transactionsand exercises of stock options, but does not include other changes in managerial ownership such as grantsof restricted stocks. Therefore, the managerial ownership at the beginning of the fiscal year is preferable.
21
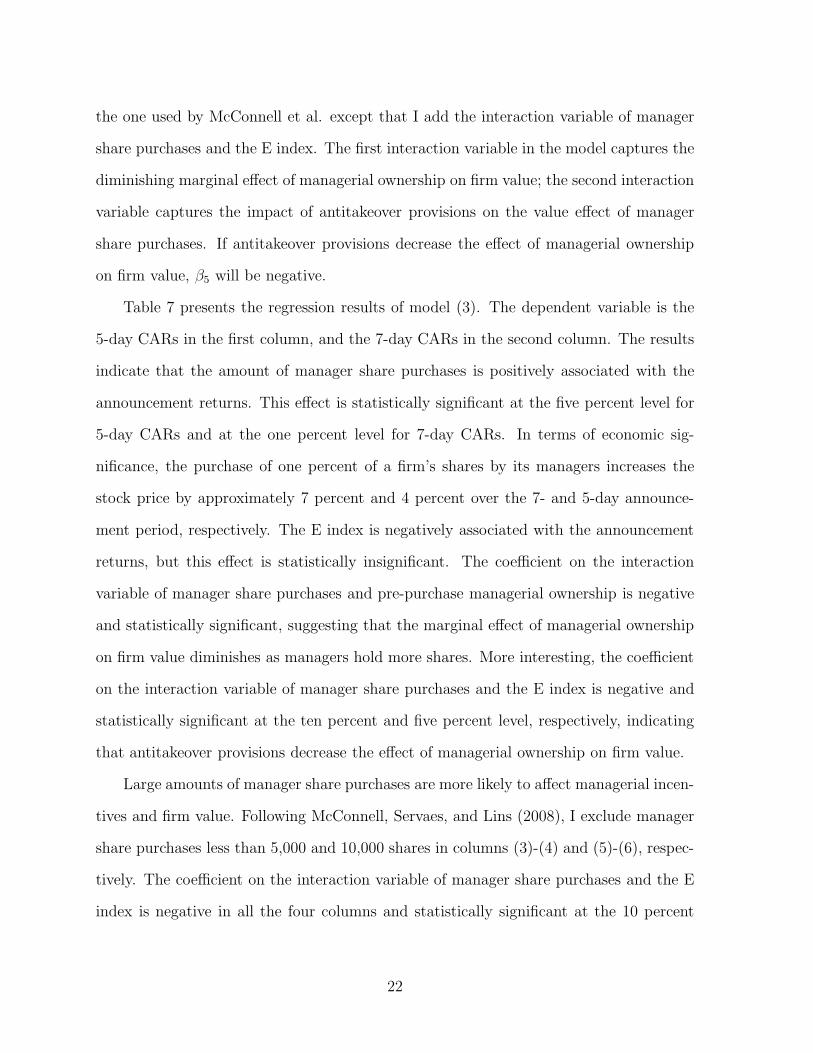
the one used by McConnell et al. except that I add the interaction variable of manager
share purchases and the E index. The first interaction variable in the model captures the
diminishing marginal effect of managerial ownership on firm value; the second interaction
variable captures the impact of antitakeover provisions on the value effect of manager
share purchases. If antitakeover provisions decrease the effect of managerial ownership
on firm value, β5 will be negative.
Table 7 presents the regression results of model (3). The dependent variable is the
5-day CARs in the first column, and the 7-day CARs in the second column. The results
indicate that the amount of manager share purchases is positively associated with the
announcement returns. This effect is statistically significant at the five percent level for
5-day CARs and at the one percent level for 7-day CARs. In terms of economic sig-
nificance, the purchase of one percent of a firm’s shares by its managers increases the
stock price by approximately 7 percent and 4 percent over the 7- and 5-day announce-
ment period, respectively. The E index is negatively associated with the announcement
returns, but this effect is statistically insignificant. The coefficient on the interaction
variable of manager share purchases and pre-purchase managerial ownership is negative
and statistically significant, suggesting that the marginal effect of managerial ownership
on firm value diminishes as managers hold more shares. More interesting, the coefficient
on the interaction variable of manager share purchases and the E index is negative and
statistically significant at the ten percent and five percent level, respectively, indicating
that antitakeover provisions decrease the effect of managerial ownership on firm value.
Large amounts of manager share purchases are more likely to affect managerial incen-
tives and firm value. Following McConnell, Servaes, and Lins (2008), I exclude manager
share purchases less than 5,000 and 10,000 shares in columns (3)-(4) and (5)-(6), respec-
tively. The coefficient on the interaction variable of manager share purchases and the E
index is negative in all the four columns and statistically significant at the 10 percent
22
or 5 percent level in columns (3), (4), and (6), suggesting that the results are robust to
excluding small amounts of manager share purchases.
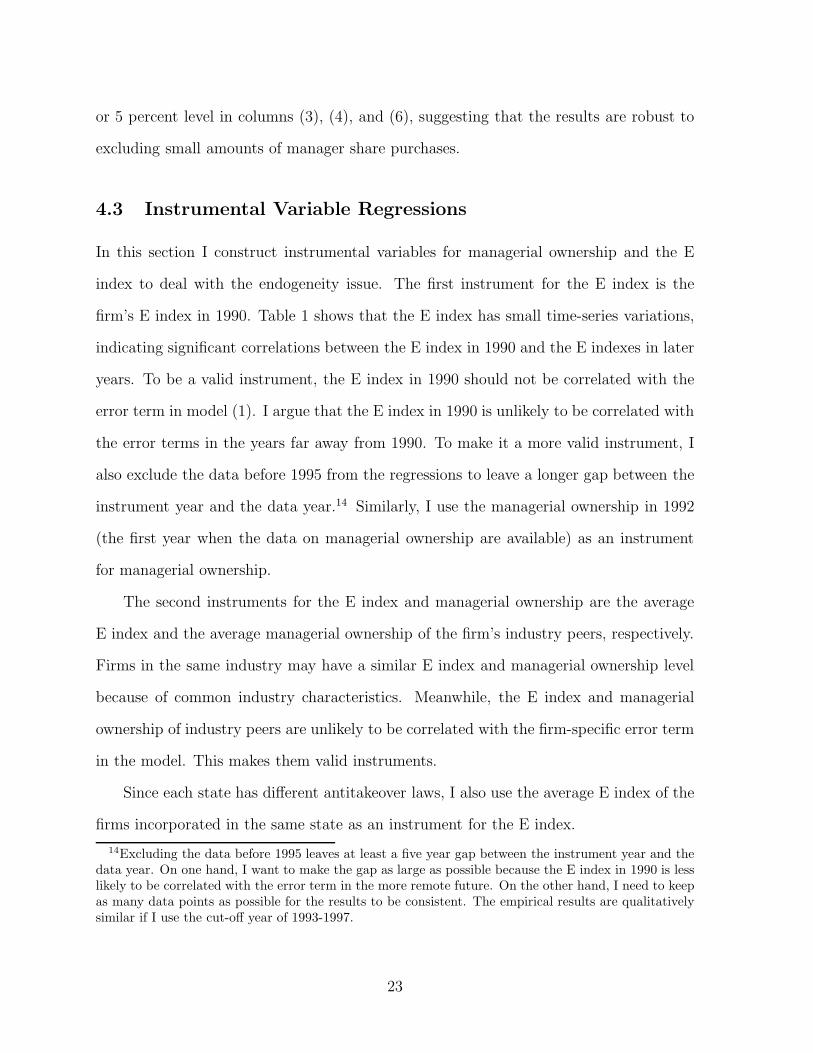
4.3 Instrumental Variable Regressions
In this section I construct instrumental variables for managerial ownership and the E
index to deal with the endogeneity issue. The first instrument for the E index is the
firm’s E index in 1990. Table 1 shows that the E index has small time-series variations,
indicating significant correlations between the E index in 1990 and the E indexes in later
years. To be a valid instrument, the E index in 1990 should not be correlated with the
error term in model (1). I argue that the E index in 1990 is unlikely to be correlated with
the error terms in the years far away from 1990. To make it a more valid instrument, I
also exclude the data before 1995 from the regressions to leave a longer gap between the
instrument year and the data year.14 Similarly, I use the managerial ownership in 1992
(the first year when the data on managerial ownership are available) as an instrument
for managerial ownership.
The second instruments for the E index and managerial ownership are the average
E index and the average managerial ownership of the firm’s industry peers, respectively.
Firms in the same industry may have a similar E index and managerial ownership level
because of common industry characteristics. Meanwhile, the E index and managerial
ownership of industry peers are unlikely to be correlated with the firm-specific error term
in the model. This makes them valid instruments.
Since each state has different antitakeover laws, I also use the average E index of the
firms incorporated in the same state as an instrument for the E index.
14Excluding the data before 1995 leaves at least a five year gap between the instrument year and thedata year. On one hand, I want to make the gap as large as possible because the E index in 1990 is lesslikely to be correlated with the error term in the more remote future. On the other hand, I need to keepas many data points as possible for the results to be consistent. The empirical results are qualitativelysimilar if I use the cut-off year of 1993-1997.
23
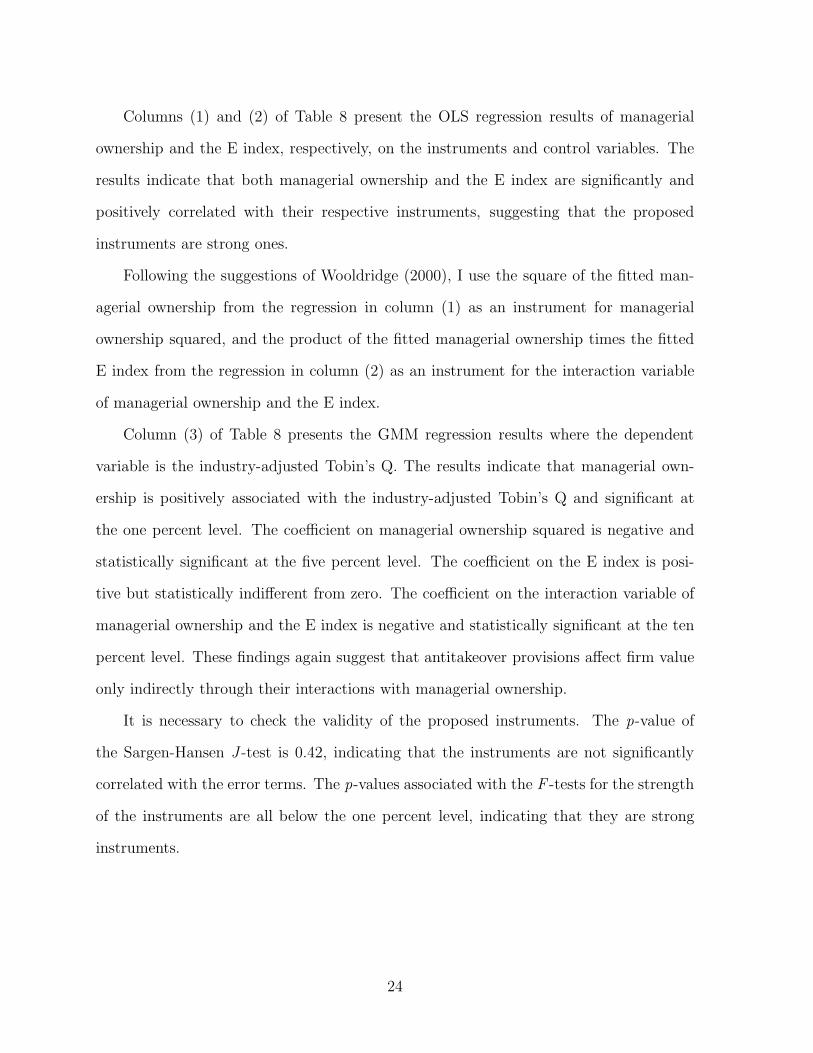
Columns (1) and (2) of Table 8 present the OLS regression results of managerial
ownership and the E index, respectively, on the instruments and control variables. The
results indicate that both managerial ownership and the E index are significantly and
positively correlated with their respective instruments, suggesting that the proposed
instruments are strong ones.
Following the suggestions of Wooldridge (2000), I use the square of the fitted man-
agerial ownership from the regression in column (1) as an instrument for managerial
ownership squared, and the product of the fitted managerial ownership times the fitted
E index from the regression in column (2) as an instrument for the interaction variable
of managerial ownership and the E index.
Column (3) of Table 8 presents the GMM regression results where the dependent
variable is the industry-adjusted Tobin’s Q. The results indicate that managerial own-
ership is positively associated with the industry-adjusted Tobin’s Q and significant at
the one percent level. The coefficient on managerial ownership squared is negative and
statistically significant at the five percent level. The coefficient on the E index is posi-
tive but statistically indifferent from zero. The coefficient on the interaction variable of
managerial ownership and the E index is negative and statistically significant at the ten
percent level. These findings again suggest that antitakeover provisions affect firm value
only indirectly through their interactions with managerial ownership.
It is necessary to check the validity of the proposed instruments. The p-value of
the Sargen-Hansen J -test is 0.42, indicating that the instruments are not significantly
correlated with the error terms. The p-values associated with the F -tests for the strength
of the instruments are all below the one percent level, indicating that they are strong
instruments.
24
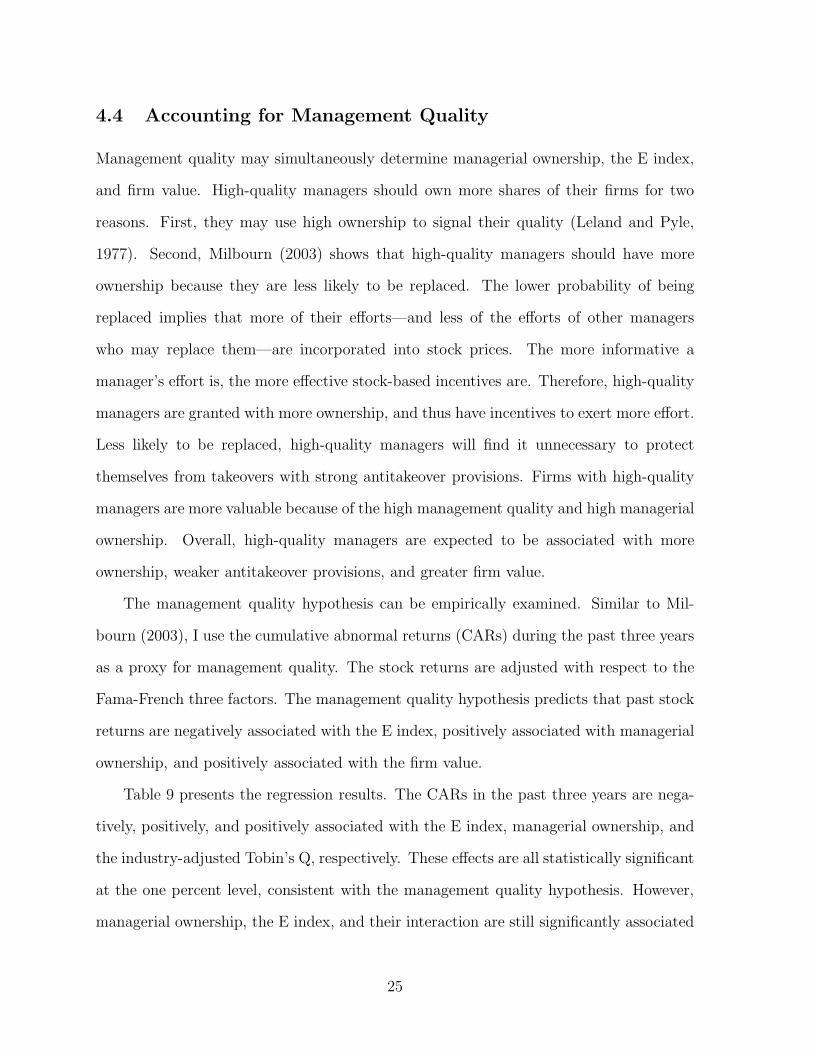
4.4 Accounting for Management Quality
Management quality may simultaneously determine managerial ownership, the E index,
and firm value. High-quality managers should own more shares of their firms for two
reasons. First, they may use high ownership to signal their quality (Leland and Pyle,
1977). Second, Milbourn (2003) shows that high-quality managers should have more
ownership because they are less likely to be replaced. The lower probability of being
replaced implies that more of their efforts—and less of the efforts of other managers
who may replace them—are incorporated into stock prices. The more informative a
manager’s effort is, the more effective stock-based incentives are. Therefore, high-quality
managers are granted with more ownership, and thus have incentives to exert more effort.
Less likely to be replaced, high-quality managers will find it unnecessary to protect
themselves from takeovers with strong antitakeover provisions. Firms with high-quality
managers are more valuable because of the high management quality and high managerial
ownership. Overall, high-quality managers are expected to be associated with more
ownership, weaker antitakeover provisions, and greater firm value.
The management quality hypothesis can be empirically examined. Similar to Mil-
bourn (2003), I use the cumulative abnormal returns (CARs) during the past three years
as a proxy for management quality. The stock returns are adjusted with respect to the
Fama-French three factors. The management quality hypothesis predicts that past stock
returns are negatively associated with the E index, positively associated with managerial
ownership, and positively associated with the firm value.
Table 9 presents the regression results. The CARs in the past three years are nega-
tively, positively, and positively associated with the E index, managerial ownership, and
the industry-adjusted Tobin’s Q, respectively. These effects are all statistically significant
at the one percent level, consistent with the management quality hypothesis. However,
managerial ownership, the E index, and their interaction are still significantly associated
25
with the industry-adjusted Tobin’s Q after controlling for past stock returns. The result-
s suggest that management quality is not the driving force behind the findings of this
paper.
4.5 Reverse Causality?
The above analyses focus on the direction of causation from managerial ownership and
antitakeover provisions to firm value. The direction of causation, however, may be the
opposite, i.e., from firm value to managerial ownership and antitakeover provisions. For
instance, managers may adjust their shareholdings in anticipation of changes in firm val-
ue: They increase (decrease) their ownership if they expect high (low) firm performance.
Since the amount of synergy gain decreases with firm performance, firms may adopt
weaker (stronger) antitakeover provisions if they expect high (low) performance. This
reverse causality hypothesis predicts a positive relation between managerial ownership
and firm value, and a negative relation between antitakeover provisions and firm value.
This reverse causality hypothesis is able to explain the negative association between
the E index and firm value. It is also consistent with the positive relation between man-
agerial ownership and firm value for firms with low E indexes. However, this hypothesis
predicts that the positive relation between managerial ownership and firm value does
not depend on the strength of antitakeover provisions, and therefore fails to explain the
negative association between managerial ownership and firm value for firms with high
E indexes. Therefore, the findings support the direction of causation from antitakeover
provisions and managerial ownership to firm value.
26
5 Managerial Ownership and Strength of Antitakeover
Provisions
Sections 3 and 4 show that antitakeover provisions decrease the effect of managerial
ownership on firm value. The results are consistent with the the first two channels of
interaction between antitakeover provisions and managerial ownership, i.e., antitakeover
provisions magnify the entrenchment effect of managerial ownership and/or weaken the
incentive effect of managerial ownership. If shareholders are aware of the negative im-
pact of antitakeover provisions on the value effect of managerial ownership and optimally
adjust managerial ownership, they should grant fewer stocks to managers when anti-
takeover provisions are strong. Note that antitakeover provisions protect the managers
from takeovers, but shall not prevent the shareholders from adjusting the managers’ com-
pensation structure. This predicts a negative association between managerial ownership
and the strength of antitakeover provisions.15 An alternative view is that antitakeover
provisions enable the managers to enjoy excess compensation.16 This alternative view
predicts a positive association between managerial ownership and the strength of anti-
takeover provisions.
Table 10 Panel A presents the summary statistics of managerial ownership for five
groups of firms based on the E index. The first four groups of firms have an E index of
0, 1, 2, and 3, respectively. The last group of firms has an E index between 4 and 6. The
firms with an E index of 5 and 6 account for only 2.5 percent of the sample, and thus are
grouped together with the firms with an E index of 4. Managerial ownership decreases
15See the model in the Appendix for a formal proof of the negative association between managerialownership and strength of antitakeover provisions.
16Borokhovich, Brunarski, and Parrino (1997) find that the CEOs of the ninety-four firms that adoptedantitakeover provisions over the period 1978-1987 were compensated with more salary and bonus andwere granted with more stock options. On the other hand, Dai, Jin, and Zhang (2011) find thatantitakeover provisions do not affect the dynamics of pay-for-performance sensitivity over the CEO’stenure.
27
significantly as the E index increases. The mean managerial ownership is 7.6 percent for
the firms with an E index of 0, and 2.1 percent for the firms with an E index above 3.
Table 10 Panel B presents the regression results of the stock ownership and the PPS
of the top five executives and the CEO on the E index and the control variables. The E
index is negatively associated with all four measures of managerial ownership, and this
effect is statistically significant at the one percent level. In terms of economic significance,
each additional antitakeover provision in the E index decreases the ownership (options
excluded) of the top five executives and the CEO by 1.1 percentage points and 0.8
percentage points, respectively. Recall that the mean managerial ownership of the top
five executives is 3.9 percent, while the mean ownership of the CEO is 2.6 percent.
Table 10 shows a significant negative association between managerial ownership and
the strength of antitakeover provisions. These results are consistent with the view that
managerial ownership is adjusted with respect to the strength of antitakeover provisions,
and corroborate the findings in sections 3 and 4 that antitakeover provisions decrease the
value effect of managerial ownership.
6 Conclusions
This paper investigates the interactions between antitakeover provisions and managerial
ownership, two corporate governance mechanisms. Antitakeover provisions may magnify
the entrenchment effect of managerial ownership, weaken the incentive effect of manage-
rial ownership, and enhance the effect of managerial ownership on long-term investment.
The first two channels of interaction predict that antitakeover provisions decrease the
effect of managerial ownership on firm value, while the third channel predicts that anti-
takeover provisions increase the effect of managerial ownership on firm value.
The impact of antitakeover provisions on the value effect of managerial ownership
is then empirically tested. I find that the effect of managerial ownership on firm val-
28
ue decreases significantly with the strength of antitakeover provisions. For firms with
weak antitakeover provisions, managerial ownership enhances firm value unless the man-
agers have very high levels of ownership. For firms with strong antitakeover provisions,
however, increasing managerial ownership always destroys firm value. Antitakeover pro-
visions decrease the value effect of managerial ownership not only in aggregate but also
individually.
The analyses with firm fixed effects and instrumental variables show that antitakeover
provisions do not directly affect firm value. They affect firm value only indirectly by
decreasing the value effect of managerial ownership. These findings highlight the impor-
tance of investigating the interactions between antitakeover provisions and managerial
ownership.
29
Appendix A: Antitakeover Provisions and Incentive
Effect of Managerial Ownership
The shareholders hire a professional manager to run their firm. They compensate the
manager with a salary, s, and a certain amount of ownership, α ∈ [0, 1].17 The share-
holders are assumed to be risk neutral.
The manager decides how much effort to exert given the compensation contract.
The effort exerted by the manager is neither observed by the shareholders, nor is it
contractible. The manager’s effort is denoted as e, and is costly to the manager. For
simplicity, the cost-of-effort function is assumed to be quadratic: C(e) = 12ke2, where
k > 0. A greater k indicates a lower cost of effort. The firm’s stand-alone value is equal
to the manager’s effort plus a noise: φ = e+ ǫ, where ǫ is normally distributed with zero
mean and variance σ2. The manager has a mean-variance risk preference represented by
the following utility function:
u(w, e) = E [w − C(e)]−η
2var(w), (A-1)
where w is the amount of compensation the manager receives, E(.) and var(.) are the
mean and variance operators, respectively, and η > 0 is the coefficient of risk aversion.18
The manager’s reservation utility is u, which is known to the shareholders.
The above model setup is standard in the literature on linear compensation con-
tracts (Bolton and Dewatripont, 2005). New to the literature, this paper introduces
antitakeover provisions to the model and explores how they affect the contract and man-
17This compensation contract may not be the optimal one. A linear contract is the second-bestsolution under certain conditions, as shown by Holmstrom and Milgrom (1987). This linear contractis used for its simplicity. A complex compensation contract would make it difficult to highlight theeconomic intuition.
18When the amount of compensation follows a normal distribution, this mean-variance utility functionis equivalent to the constant absolute risk-averse (CARA) utility function with coefficient of absoluterisk aversion η: u(w, e) = − exp {−η [w − C(e)]}.
30
agerial incentives. Antitakeover provisions are assumed to be exogenously given. This
simplifies the algebra and thereby allows me to clearly demonstrate the impact of anti-
takeover provisions on managerial incentives.19
A raider tries to acquire the firm mentioned above at the end of the model. The
value of the target firm to the raider is: τ = v + ǫ, where ǫ is the same noise that affects
the stand-alone value of the target firm, and v is the intrinsic value of the target firm to
the raider.20 Thus, the synergy gain associated with the takeover is: τ − φ = v − e.
How the synergy is divided between the raider and the target depends on the target’s
bargaining position, which in turn is determined by the strength of the target firm’s
antitakeover provisions. Stronger antitakeover provisions enable the target shareholders
to form a cartelized response to the takeover bid and therefore enhance the target’s
bargaining position. That is, stronger antitakeover provisions enable the target to seize
a larger share of the synergy.21 Suppose the target’s antitakeover provisions allow it to
seize p ∈ (0, 1) of the synergy. In other words, the raider will pay a bid premium p (v − e)
to the target’s shareholders.
The shareholders choose a compensation contract (s and α) to maximize their ex-
pected wealth, subject to the manager’s optimal choice of effort and the manager’s par-
ticipation constraint:
maxs,α
ψ = (1− α)[e+ p(v − e)]− s (A-2)
s.t. e ∈ argmax
{
s + α [e+ p(v − e)]−1
2ke2 −
η
2α2σ2
}
(A-3)
s+ α [e+ p(v − e)]−1
2ke2 −
η
2α2σ2 ≥ u. (A-4)
19In an extended version of this model, I show that antitakeover provisions can be endogenized withoutaffecting the main results of the model. For the reason of simplicity, only the simplified model is presentedin the Appendix.
20The results are not affected if v is assumed to depend on e as long as the synergy decreases with e.The results are also not affected if τ does not depend on ǫ.
21I discuss how antitakeover provisions enhance the target’s bargaining position in more detail at theend of this appendix.
31
The optimal managerial ownership and the optimal managerial effort are:
α∗ =k(1− p)2
k(1− p)2 + ησ2, (A-5)
e∗ = kα∗(1− p) =k2(1− p)4
k(1− p)2 + ησ2. (A-6)
Proposition 1. Antitakeover provisions have the following impacts on managerial in-
centives:
(1) Antitakeover provisions reduce managerial effort (de∗
dp≤ 0).
(2) Antitakeover provisions decrease the marginal effect of managerial ownership on
firm value ( ∂2π∂α∂p
≤ 0, where π denotes firm value).
(3) Managerial ownership decreases with the strength of antitakeover provisions (dα∗
dp≤
0).
Proof. Solving the manager’s problem yields the optimal managerial effort:
e∗ = kα(1− p). (A-7)
In equilibrium, the shareholders offer the lowest salary to the manager so that the par-
ticipation constraint is binding. Then the participation constraint becomes:
s + α[e+ (1− p)(v − e)] = u+1
2ke2 +
η
2α2σ2. (A-8)
Plugging (A-8) and (A-7) into the shareholders’ objective function yields the following
problem:
maxα
[
kα(1− p)2 + pv]
−
[
u+k
2(1− p)2α2 +
η
2α2σ2
]
. (A-9)
32
The first-order condition of (A-9) yields the optimal managerial ownership in equilibrium:
α∗ =k(1− p)2
k(1− p)2 + ησ2. (A-10)
Then
e∗ = kα(1− p) =k2(1− p)4
k(1− p)2 + ησ2, (A-11)
dα∗
dp= −
2ησ2k(1− p)
k(1 − p)2 + ησ2≤ 0 (A-12)
de∗
dp= −
2k2(1− p)3 [k(1− p)2 + 2ησ2]
[k(1− p)2 + ησ2]2≤ 0. (A-13)
Note that the terms in the first bracket of (A-9) are the expected firm value which
equals to the target’s stand-alone value plus bid premium. Define the expected firm value
as π. Then equation (A-9) becomes:
maxα
π −
[
u+k
2(1− p)2α2 +
η
2α2σ2
]
. (A-14)
The first-order condition is:
∂π
∂α− k(1− p)2α− ησ2α = 0. (A-15)
Differentiating both sides of (A-15) yields:
d
(
∂π
∂α
)
− (1− p)2dk− k(1− p)2dα− 2(1− p)dp−σ2αdη− ηαdσ2− ησ2dα = 0. (A-16)
33
Then:
d
dp
(
∂π
∂α
)
=[
k(1− q)2 + ηασ2] dα
dp− 2(1− p)
= −2ησ2k(1− p)
k(1 − p)2 + ησ2− 2(1− p) < 0. (A-17)
Q.E.D.
The intuition behind Proposition 1 can be explained as follows. Less managerial
effort leads to a greater synergy gain, which is divided between the target and the raider.
Stronger antitakeover provisions raise the target’s share of the synergy, and thus encour-
age the manager to exert less effort because more of the synergy accrues to the target
with stronger antitakeover provisions. That is, antitakeover provisions reduce manage-
rial effort, ceteris paribus. A high managerial ownership incentivizes the manager to
exert more effort. Antitakeover provisions weaken this incentive effect by reducing man-
agerial effort. Consequently, the marginal effect of managerial ownership on firm value
decreases with the strength of antitakeover provisions. Aware of this negative impact
of antitakeover provisions on the incentive effect of managerial ownership, shareholders
grant fewer shares to the manager when there are stronger antitakeover provisions.
Antitakeover Provisions and Target Firms’ Bargaining Position
This section discusses how antitakeover provisions enhance a target firm’s bargaining
position against an acquirer, which is a key assumption in the model.
Suppose a raider launches a takeover bid to acquire up to 100% of the target firm’s
shares. The bid succeeds if more than 50% of the shares are tendered. Grossman and
Hart (1980) suggest that a necessary condition for the bid to succeed is that the offer
price must be greater than the stock price of the target after the bid succeeds. Otherwise,
the free rider problem arises and no shareholder will tender.
34
The target’s shareholders as a group have an incentive to not tender their shares (hold
up) in order to push up the bid price. If the shareholders are able to form a cartel then
no shareholder will tender at a low price, and consequently they will be able to bargain
for a higher offer. However on an individual level, each shareholder has an incentive to
tender at a low price because the bid premium will be lost if he or she holds up while
other shareholders tender more than 50% of the total shares of the firm. In other words,
individual shareholders have an incentive to rush, while as a group they have an incentive
to hold up.
DeAngelo and Rice (1983) suggest that antitakeover provisions help the target’s
shareholders form a cartelized response to a tender offer and thus enhance their bargaining
position. For example, supermajority provisions raise the level of ownership that must be
purchased in order to ensure subsequent shareholder approval of a merger, and therefore
encourage shareholders to hold out for a higher price.
Another example of antitakeover provisions is poison pills, which make it almost
impossible for a bid to succeed without the approval of the target’s board. Poison pills
can be removed by the board without the approval of shareholders. Therefore, one
way to circumvent poison pills is to initiate a proxy fight in the hope of replacing the
directors who resist the acquisition. The proxy fight may not succeed given that many
firms have staggered boards, which would prevent the raider from replacing the directors
all at once and would thus increase the cost of the proxy fight. Hence, poison pills
and staggered boards force the raider to negotiate directly with the target’s directors
on the bid premium. Since there are fewer directors than shareholders, and since the
directors meet frequently, they can collude at a lower cost and therefore bargain for
better acquisition terms. This enhanced bargaining position will increase the proportion
of the synergy that accrues to the target’s shareholders, provided that the board is acting
in the shareholders’ interest.
35
The above discussions suggest that antitakeover provisions enhance the bargaining
position of the target firm, and therefore enable the target to seize a larger share of the
synergy. Consistent with these discussions, Comment and Schwert (1995) and Heron
and Lie (2006) find that antitakeover provisions significantly increase the bid premium
in large samples of takeovers.
36
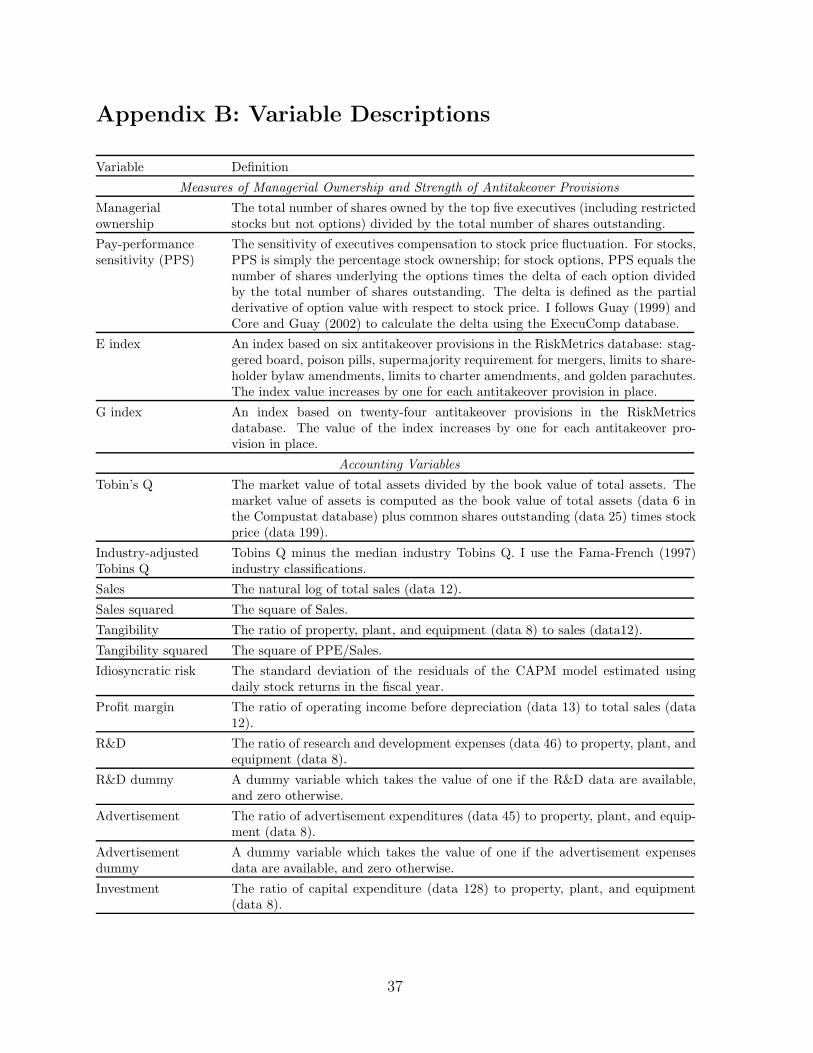
Appendix B: Variable Descriptions
Variable Definition
Measures of Managerial Ownership and Strength of Antitakeover Provisions
Managerialownership
The total number of shares owned by the top five executives (including restrictedstocks but not options) divided by the total number of shares outstanding.
Pay-performancesensitivity (PPS)
The sensitivity of executives compensation to stock price fluctuation. For stocks,PPS is simply the percentage stock ownership; for stock options, PPS equals thenumber of shares underlying the options times the delta of each option dividedby the total number of shares outstanding. The delta is defined as the partialderivative of option value with respect to stock price. I follows Guay (1999) andCore and Guay (2002) to calculate the delta using the ExecuComp database.
E index An index based on six antitakeover provisions in the RiskMetrics database: stag-gered board, poison pills, supermajority requirement for mergers, limits to share-holder bylaw amendments, limits to charter amendments, and golden parachutes.The index value increases by one for each antitakeover provision in place.
G index An index based on twenty-four antitakeover provisions in the RiskMetricsdatabase. The value of the index increases by one for each antitakeover pro-vision in place.
Accounting Variables
Tobin’s Q The market value of total assets divided by the book value of total assets. Themarket value of assets is computed as the book value of total assets (data 6 inthe Compustat database) plus common shares outstanding (data 25) times stockprice (data 199).
Industry-adjustedTobins Q
Tobins Q minus the median industry Tobins Q. I use the Fama-French (1997)industry classifications.
Sales The natural log of total sales (data 12).
Sales squared The square of Sales.
Tangibility The ratio of property, plant, and equipment (data 8) to sales (data12).
Tangibility squared The square of PPE/Sales.
Idiosyncratic risk The standard deviation of the residuals of the CAPM model estimated usingdaily stock returns in the fiscal year.
Profit margin The ratio of operating income before depreciation (data 13) to total sales (data12).
R&D The ratio of research and development expenses (data 46) to property, plant, andequipment (data 8).
R&D dummy A dummy variable which takes the value of one if the R&D data are available,and zero otherwise.
Advertisement The ratio of advertisement expenditures (data 45) to property, plant, and equip-ment (data 8).
Advertisementdummy
A dummy variable which takes the value of one if the advertisement expensesdata are available, and zero otherwise.
Investment The ratio of capital expenditure (data 128) to property, plant, and equipment(data 8).
37
Variable Descriptions (Continued)
Variable Definition
Stock returns
CARs in past threeyears
The cumulative abnormal stock returns over the 36-month period ending at thebeginning of the fiscal year. The returns are adjusted with respect to the Fama-French three factors.
Announcementreturns of managershare purchase in theopen market
The cumulative abnormal return over the trading days [-1, +5] or [-1, +3] aroundthe share purchase announcement. The returns are adjusted with the CAPMmodel. The estimation window for the market model is [-252,-42] days prior tothe announcement.
38
References
Aggarwal, R. K., and A. A. Samwick, 2003, Performance incentives within firms: The effect of managerialresponsibility, Journal of Finance 58, 1613-1649.
Andreoni, J., W. Harbaugh, and L. Vesterlund, 2003, The carrot or the stick: Rewards, punishments,and cooperation, American Economic Review 93, 893-902.
Bebchuk, L., and A. Cohen, 2005, The costs of entrenched boards, Journal of Financial Economics 78,409-433.
Bebchuk, L., A. Cohen, and A. Ferrell, 2009, What matters in corporate governance?,Review of Financial
Studies 22, 783-827.
Bebchuk, L., A. Cohen, and C. C. Y. Wang, 2010, Golden parachutes and the wealth of shareholders,NBER working paper.
Bebchuk, L., and J. M. Fried, 2005, Pay without performance: Overview of the issues, Journal of AppliedCorporate Finance 17, 8-23.
Berle, A., and G. Means, 1932, The modern corporation and private property, Macmillan, New York.
Bertrand, M., and S. Mullainathan, 1999, Is there discretion in wage setting? A test using takeoverlegislation, RAND Journal of Economics 30, 535-554.
Bertrand, M., and S. Mullainathan, 2000, Agents with and without principals, American Economic
Review 90, 203-208.
Bertrand, M., and S. Mullainathan, 2003, Enjoying the quiet life? Managerial behavior following anti-takeover legislation, Journal of Political Economy 111, 1043-1075.
Betton, S., B. E. Eckbo, and K. Thorburn, 2008, Corporate takeovers, in: Eckbo, B.E. (Ed.), Handbookof Corporate Finance: Empirical Corporate Finance Vol. II, Elsevier/North-Holland, 291-429.
Bhagat, S., and B. Bolton, 2008, Corporate governance and firm performance, Journal of Corporate
Finance 14, 257-273.
Bhagat, S., and R. Romano, 2001, Event studies and the law: Part II—Empirical studies of corporatelaw, Yale University working paper.
Bizjak, J., J. Brickley, and J. Coles, 1993, Stock-based incentive compensation, asymmetric informationand investment behavior, Journal of Accounting and Economics 16, 349-372.
Bolton, P., and M. Dewatripont, 2005, Contract Theory, The MIT Press.
Cheng, S., and R. J. Indjejikian, 2009, The market for corporate control and CEO compensation:Complements or substitutes?, Contemporary Accounting Research 26, 701-728.
Cheng, S., V. Nagar, and M. Rajan, 2005, Identifying control motives in managerial ownership: Evidenceof anti-takeover legislation, Review of Financial Studies 18, 637-672.
Chi, J. D., 2005, Understanding the endogeneity between firm value and shareholder rights, FinancialManagement 34, 65-76.
39
Claessens, S., S. Djankov, J. P. H. Fan, and L. H. P. Lang, 2002, Disentangling the incentive andentrenchment effects of large shareholdings, Journal of Finance 57, 2741-2771.
Cohn, J. B., and U. Rajan, 2010, Corporate governance and managerial reputational concerns, Univer-sity of Texas Austin working paper.
Coles, J. L., M. L. Lemmon, and J. F. Meschke, 2007, Structural models and endogeneity in corporatefinance: the link between managerial ownership and corporate performance, Arizona State Universityworking paper.
Comment, R., and G. W. Schwert, 1995, Poison or placebo? Evidence on the deterrence and wealtheffects of modern antitakeover measures, Journal of Financial Economics 39, 3-43.
Core, J. E., and W. R. Guay, 2002, Estimating the value of employee stock option portfolios and theirsensitivities to price and volatility, Journal of Accounting Research 40, 613-630.
Core, J. E., W. R. Guay, and T. O. Rusticus, 2006, Does weak governance cause weak stock returns? Anexamination of firm operating performance and investors’ expectations, Journal of Finance 61, 655-687.
Core, J., and D. Larcker, 2002, Performance consequences of mandatory increases in executive stockownership, Journal of Financial Economics 64, 317–340.
Cremers, K. J., and V. B. Nair, 2005, Governance mechanisms and equity prices, Journal of Finance60, 2859-2894.
Cremers, K. J., V. B. Nair, and J. Wei, 2007, Governance mechanisms and bond prices, Review of
Financial Studies 20, 1359-1388.
Dai, Z., L. Jin, and W. Zhang, 2010, CEO incentive dynamics and their effect on firm value, Unpublishedworking paper.
DeAngelo, H., and E. M. Rice, 1983, Antitakeover charter amendments and stockholder wealth, Journalof Financial Economics 11, 329-360.
Demsetz, H., 1983, The structure of ownership and the theory of the firm, Journal of Law and Economics
26, 375-390.
Demsetz, H., and K. Lehn, 1985, The structure of corporate ownership: Causes and consequences,Journal of Political Economy 93, 1155-1177.
Demsetz, H., and B. Villalonga, 2001, Ownership structure and corporate performance, Journal of
Corporate Finance 7, 209-233.
Fahlenbrach, R., 2009, Shareholder rights, boards, and executive compensation, Review of Finance 13,81-113.
Fahlenbrach, R., and R. M. Stulz, 2009, Managerial ownership dynamics and firm value, Journal ofFinancial Economics 92, 342-361.
Faleye, O., 2007, Classified boards, firm value, and managerial entrenchment, Journal of Financial
Economics 83, 501-529.
Fama, E., and K. French, 1997, Industry costs of equity, Journal of Financial Economics43, 153-193.
40
Fama, E., and K. French, 2000, Forecasting profitability and earnings, Journal of Business 73, 161-175.
Fama, E., and M. Jensen, 1983, Separation of ownership and control, Journal of Law and Economics
26, 301-325.
Fama, E. F., and J. D. MacBeth, 1973, Risk, return, and equilibrium: empirical tests, Journal of PoliticalEconomy 81, 607-636.
Fich, E. M., and A. Shivdasani, 2006, Are busy boards effective monitors?, Journal of Finance 61,689-724.
Fich, E. M., A. L. Tran, and R. A. Walkling, 2011, On the importance of golden parachutes, Unpublishedworking paper.
Giroud, X., and H. M. Mueller, 2010, Does corporate governance matter in competitive industries?,Journal of Financial Economics 95, 312-331.
Giroud, X., and H. M. Mueller, 2011, Corporate governance, product market competition, and equityprices, Journal of Finance 66, 563-600.
Gompers, P., J. Ishii, and A. Metrick, 2003, Corporate governance and equity prices, Quarterly Journal
of Economics 118, 107-155.
Gompers, P., J. Ishii, and A. Metrick, 2010, Extreme governance: An analysis of dual-class firms in theUnited States, Review of Financial Studies 23, 1051-1088.
Green, W. H., 2000, Econometric Analysis, Fourth Edition, Prentice Hall.
Goyal V. K., and C. W. Park, 2002, Board leadership structure and CEO turnover, Journal of CorporateFinance 8, 49-66.
Grossman, S. J., O. D. Hart, 1980, Takeover bids, the free-rider problem, and the theory of the corpo-ration, Bell Journal of Economics 11, 42-64.
Guay, W. K., 1999, The sensitivity of CEO wealth to equity risk: An analysis of the magnitude anddeterminants, Journal of Financial Economics 53, 43-71.
Hall, B., and J. Liebman, 1998, Are CEOs really paid like bureaucrats?, Quarterly Journal of Economics
113, 653-691.
Harris, E. G., 1990, Antitakeover measures, golden parachutes, and target firm shareholder welfare,RAND Journal of Economics 21, 614-625.
Hartzell, J. C., E. Ofek, and D. Yermack, 2004, What’s in it for me? CEOs whose firms are acquired,Review of Financial Studies 17, 37-61.
Hermalin, B., and M. Weisbach, 1991, The effects of board compensation and direct incentives on firmperformance, Financial Management 20, 101-112.
Heron, R. A., and E. Lie, 2006, On the use of poison pills and defensive payouts by takeover targets,Journal of Business 79, 1783-1807.
41
Himmelberg, C. P., R. G. Hubbard, and D. Palia, 1999, Understanding the determinants of managerialownership and the link between ownership and performance, Journal of Financial Economics 53, 353-384.
Holderness, C., R. Kroszner, and D. Sheehan, 1999, Were the good old days that good?: Evolution ofmanagerial stock ownership and corporate governance since the great depression, Journal of Finance 54,435-469.
Holmstrom, B., and S. N. Kaplan, 2001, Corporate governance and merger activity in the U.S.: Makingsense of the 1980s and 1990s, Journal of Economic Perspectives 15, 121-144.
Holmstrom, B., and P. Milgrom, 1987, Aggregation and linearity in the provision of intertemporalincentives, Econometrica 55, 303-328.
Huson, M. R., R. Parrino, and L. Starks, 2001, Internal monitoring mechanisms and CEO turnover: Along term perspective, Journal of Finance 56, 2265-2297.
Jensen, M., 1993, The modern industrial revolution, exit and the failure of internal control systems,Journal of Finance 48, 831-880.
Jensen, M., andW. Meckling, 1976, Theory of the firm: Managerial behavior, agency costs and ownershipstructure, Journal of Financial Economics 3, 305-360.
Jenter, D., 2005, Market timing and managerial portfolio decisions, Journal of Finance 60, 1903-1949.
John, K., and S. Kedia, 2003, Design of corporate governance: Role of ownership structure, takeovers,bank debt and large shareholder monitoring, New York University working paper.
Johnson, S. A., T. C. Moorman, and S. Sorescu, 2009, A reexamination of corporate governance andequity prices, Review of Financial Studies 22, 4753-4786.
Kim, E. H. and Y. Lu, 2011, CEO ownership, external governance, and risk-taking, Journal of FinancialEconomics 102, 272-292.
Kini, O., W. Kracaw, and S. Mian, 2004, The nature of discipline by corporate takeovers, Journal ofFinance 59, 1511-1552.
Kole, S. R., 1995, Measuring managerial equity ownership: a comparison of sources of ownership data,Journal of Corporate Finance 1, 413-435.
Kole, S. R., 1997, The complexity of compensation contracts, Journal of Financial Economics 43, 79-104.
Lakonishok, J., and I. Lee, 2001, Are insider trades informative?, Review of Financial Studies 14, 79-111.
Lee, I., 1997, Do firms knowingly sell overvalued equity?, Journal of Finance 52, 1439-1466.
Lefanowicz, C. E., J. R. Robinson, and R. Smith, 2000, Golden parachutes and managerial incentives incorporate acquisitions: Evidence from the 1980s and 1990s, Journal of Corporate Finance 6, 215-239.
Lehn, K., S. Patro, and M. Zhao, 2007, Governance indexes and valuation: Which causes which?, Journalof Corporate Finance 13, 907-928.
42
Leland, H. E., and D. Pyle, 1977, Information asymmetries, financial structure, and financial interme-diation, Journal of Finance 32, 371-387.
Lins, K. V., 2003, Equity ownership and firm value in emerging markets, Journal of Financial and
Quantitative Analysis 30, 159-184.
McConnell, J., and H. Servaes, 1990, Additional evidence on equity ownership and corporate value,Journal of Financial Economics 27, 595-612.
McConnell, J., H. Servaes, and K. Lins, 2008, Changes in insider ownership and changes in the marketvalue of the firm, Journal of Corporate Finance 14, 92-106.
Narayanan, M. P., 1996, Form of compensation and managerial decision horizon, Journal of Financialand Quantitative Analysis 31, 467-491.
Morck, R., A. Shleifer, and R. Vishny, 1988, Management ownership and market valuation, Journal ofFinancial Economics 20, 293-315.
Parrino, R., R. W. Sias, and L. T. Starks, 2003, Voting with their feet: Institutional investors and CEOturnover, Journal of Financial Economics 68, 3-64.
Petersen, M. A., 2009, Estimating standard errors in finance panel data sets: Comparing approaches,Review of Financial Studies 22, 435-480.
Stein, J. C., 1988, Takeover threats and managerial myopia, Journal of Political Economy 96, 61-80.
Stulz, R. M., 1988, Managerial control of voting rights: Financing policies and the market for corporatecontrol, Journal of Financial Economics 20, 25-54.
Weisbach, M. S., 1988, Outside directors and CEO turnover, Journal of Financial Economics 20, 431-460.
Williamson, O. E., 1983, Organizational form, residual claimants, and corporate control, Journal of Lawand Economics 26, 351-366.
Wooldridge, J., 2000, Econometric Analysis of Cross Section and Panel Data, MIT Press.
Yermack, D., 1996, Higher valuation of companies with a small board of directors, Journal of FinancialEconomics 40, 185-212.
Zhou, X., 2001, Understanding the determinants of managerial ownership and the link between ownershipand performance: comment, Journal of Financial Economics 62, 559-571.
43

Figure 1: Relation between Managerial Ownership and Tobin’s Q by the E IndexThis figure plots the fitted value of Tobin’s Q against managerial ownership at different values of theE index. The X-axis is managerial ownership (in percentage). The Y-axis is Tobin’s Q. The valuesof Tobin’s Q are estimated from the regression results in column (2) of Table 3: Q = 3.574 + 1.858 ×Managerial ownership−1.360×Managerial ownership2−0.044×E index−0.536×Managerial ownership×E index. Managerial ownership ranges from 0 to 20 percent in the figure since almost all firms in thesample have managerial ownership below 20 percent.
0 10 20
3.6
3.8
4E index = 0
0 10 20
3.6
3.8
4E index = 1
0 10 20
3.6
3.8
4E index = 2
0 10 203
3.5E index = 3
0 10 203
3.5E index = 4
0 10 203
3.5E index = 5
0 10 203
3.5E index = 6
44
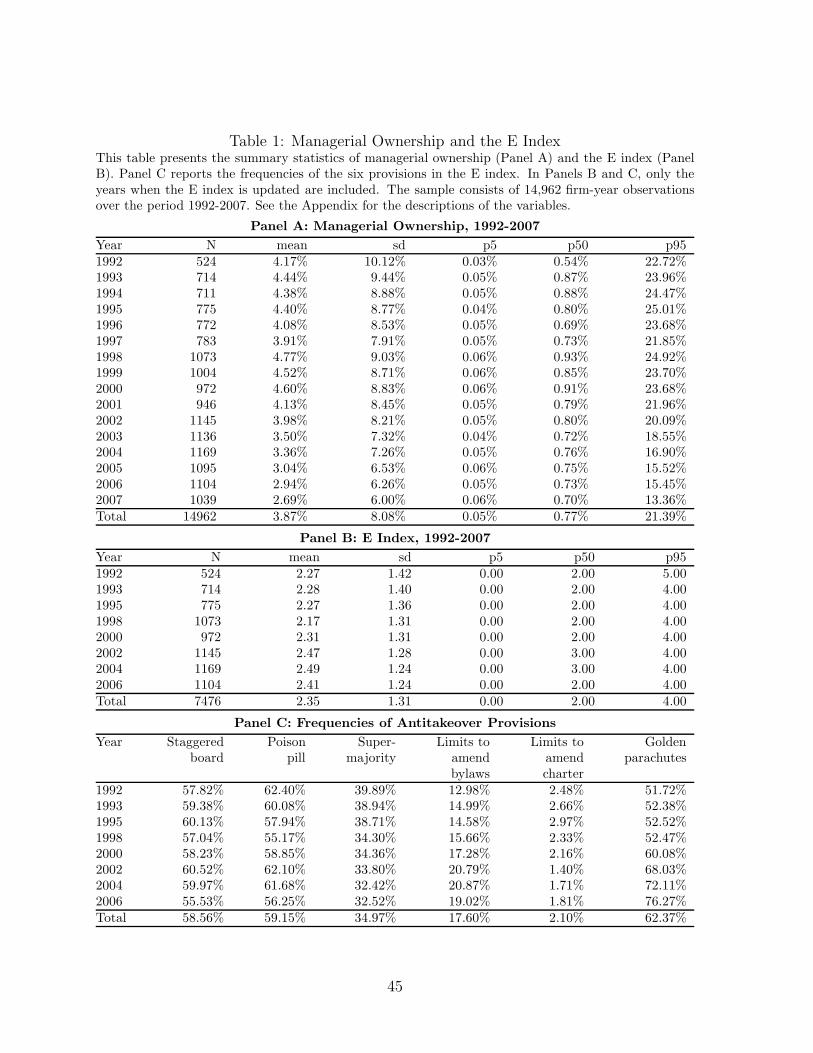
Table 1: Managerial Ownership and the E IndexThis table presents the summary statistics of managerial ownership (Panel A) and the E index (PanelB). Panel C reports the frequencies of the six provisions in the E index. In Panels B and C, only theyears when the E index is updated are included. The sample consists of 14,962 firm-year observationsover the period 1992-2007. See the Appendix for the descriptions of the variables.
Panel A: Managerial Ownership, 1992-2007
Year N mean sd p5 p50 p951992 524 4.17% 10.12% 0.03% 0.54% 22.72%1993 714 4.44% 9.44% 0.05% 0.87% 23.96%1994 711 4.38% 8.88% 0.05% 0.88% 24.47%1995 775 4.40% 8.77% 0.04% 0.80% 25.01%1996 772 4.08% 8.53% 0.05% 0.69% 23.68%1997 783 3.91% 7.91% 0.05% 0.73% 21.85%1998 1073 4.77% 9.03% 0.06% 0.93% 24.92%1999 1004 4.52% 8.71% 0.06% 0.85% 23.70%2000 972 4.60% 8.83% 0.06% 0.91% 23.68%2001 946 4.13% 8.45% 0.05% 0.79% 21.96%2002 1145 3.98% 8.21% 0.05% 0.80% 20.09%2003 1136 3.50% 7.32% 0.04% 0.72% 18.55%2004 1169 3.36% 7.26% 0.05% 0.76% 16.90%2005 1095 3.04% 6.53% 0.06% 0.75% 15.52%2006 1104 2.94% 6.26% 0.05% 0.73% 15.45%2007 1039 2.69% 6.00% 0.06% 0.70% 13.36%Total 14962 3.87% 8.08% 0.05% 0.77% 21.39%
Panel B: E Index, 1992-2007
Year N mean sd p5 p50 p951992 524 2.27 1.42 0.00 2.00 5.001993 714 2.28 1.40 0.00 2.00 4.001995 775 2.27 1.36 0.00 2.00 4.001998 1073 2.17 1.31 0.00 2.00 4.002000 972 2.31 1.31 0.00 2.00 4.002002 1145 2.47 1.28 0.00 3.00 4.002004 1169 2.49 1.24 0.00 3.00 4.002006 1104 2.41 1.24 0.00 2.00 4.00Total 7476 2.35 1.31 0.00 2.00 4.00
Panel C: Frequencies of Antitakeover Provisions
Year Staggered Poison Super- Limits to Limits to Goldenboard pill majority amend amend parachutes
bylaws charter1992 57.82% 62.40% 39.89% 12.98% 2.48% 51.72%1993 59.38% 60.08% 38.94% 14.99% 2.66% 52.38%1995 60.13% 57.94% 38.71% 14.58% 2.97% 52.52%1998 57.04% 55.17% 34.30% 15.66% 2.33% 52.47%2000 58.23% 58.85% 34.36% 17.28% 2.16% 60.08%2002 60.52% 62.10% 33.80% 20.79% 1.40% 68.03%2004 59.97% 61.68% 32.42% 20.87% 1.71% 72.11%2006 55.53% 56.25% 32.52% 19.02% 1.81% 76.27%Total 58.56% 59.15% 34.97% 17.60% 2.10% 62.37%
45
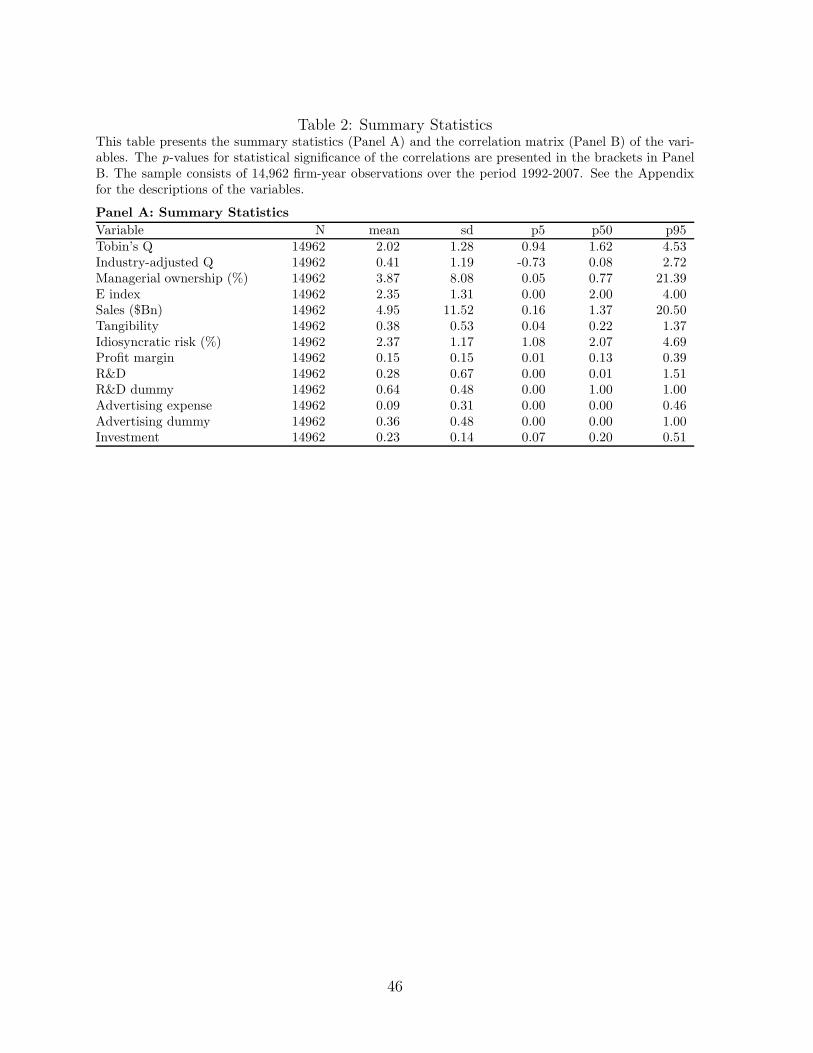
Table 2: Summary StatisticsThis table presents the summary statistics (Panel A) and the correlation matrix (Panel B) of the vari-ables. The p-values for statistical significance of the correlations are presented in the brackets in PanelB. The sample consists of 14,962 firm-year observations over the period 1992-2007. See the Appendixfor the descriptions of the variables.
Panel A: Summary Statistics
Variable N mean sd p5 p50 p95Tobin’s Q 14962 2.02 1.28 0.94 1.62 4.53Industry-adjusted Q 14962 0.41 1.19 -0.73 0.08 2.72Managerial ownership (%) 14962 3.87 8.08 0.05 0.77 21.39E index 14962 2.35 1.31 0.00 2.00 4.00Sales ($Bn) 14962 4.95 11.52 0.16 1.37 20.50Tangibility 14962 0.38 0.53 0.04 0.22 1.37Idiosyncratic risk (%) 14962 2.37 1.17 1.08 2.07 4.69Profit margin 14962 0.15 0.15 0.01 0.13 0.39R&D 14962 0.28 0.67 0.00 0.01 1.51R&D dummy 14962 0.64 0.48 0.00 1.00 1.00Advertising expense 14962 0.09 0.31 0.00 0.00 0.46Advertising dummy 14962 0.36 0.48 0.00 0.00 1.00Investment 14962 0.23 0.14 0.07 0.20 0.51
46
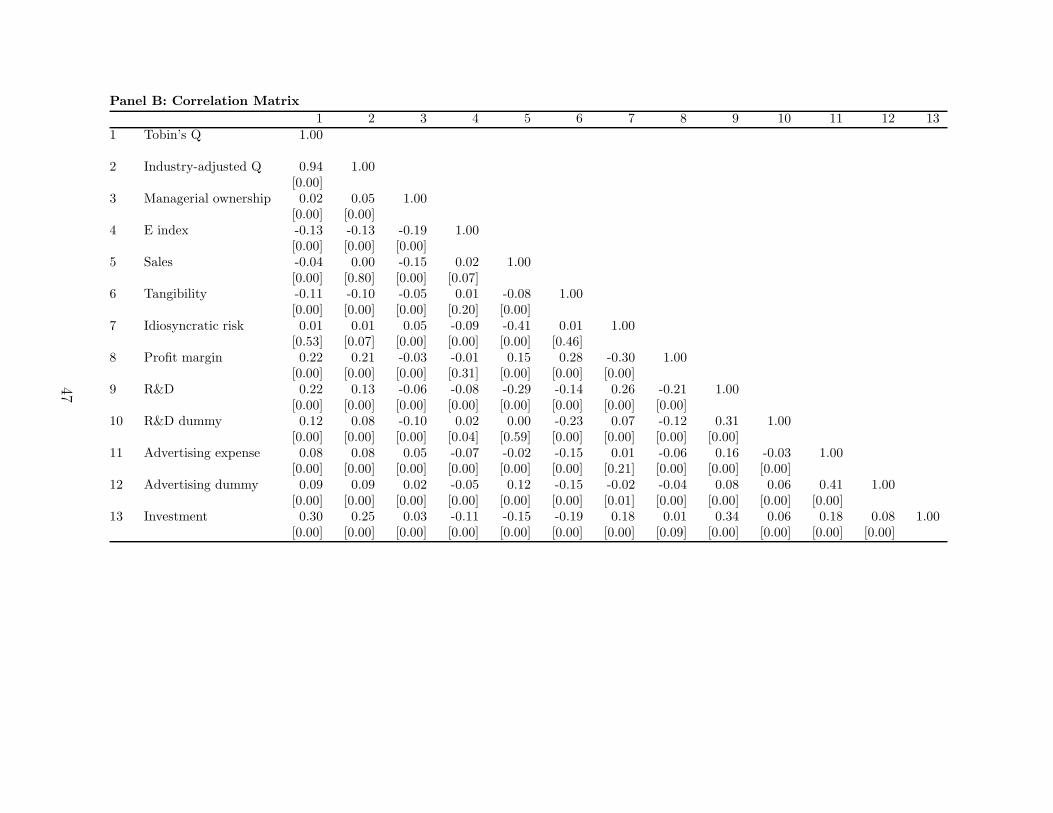
Panel B: Correlation Matrix
1 2 3 4 5 6 7 8 9 10 11 12 131 Tobin’s Q 1.00
2 Industry-adjusted Q 0.94 1.00[0.00]
3 Managerial ownership 0.02 0.05 1.00[0.00] [0.00]
4 E index -0.13 -0.13 -0.19 1.00[0.00] [0.00] [0.00]
5 Sales -0.04 0.00 -0.15 0.02 1.00[0.00] [0.80] [0.00] [0.07]
6 Tangibility -0.11 -0.10 -0.05 0.01 -0.08 1.00[0.00] [0.00] [0.00] [0.20] [0.00]
7 Idiosyncratic risk 0.01 0.01 0.05 -0.09 -0.41 0.01 1.00[0.53] [0.07] [0.00] [0.00] [0.00] [0.46]
8 Profit margin 0.22 0.21 -0.03 -0.01 0.15 0.28 -0.30 1.00[0.00] [0.00] [0.00] [0.31] [0.00] [0.00] [0.00]
9 R&D 0.22 0.13 -0.06 -0.08 -0.29 -0.14 0.26 -0.21 1.00[0.00] [0.00] [0.00] [0.00] [0.00] [0.00] [0.00] [0.00]
10 R&D dummy 0.12 0.08 -0.10 0.02 0.00 -0.23 0.07 -0.12 0.31 1.00[0.00] [0.00] [0.00] [0.04] [0.59] [0.00] [0.00] [0.00] [0.00]
11 Advertising expense 0.08 0.08 0.05 -0.07 -0.02 -0.15 0.01 -0.06 0.16 -0.03 1.00[0.00] [0.00] [0.00] [0.00] [0.00] [0.00] [0.21] [0.00] [0.00] [0.00]
12 Advertising dummy 0.09 0.09 0.02 -0.05 0.12 -0.15 -0.02 -0.04 0.08 0.06 0.41 1.00[0.00] [0.00] [0.00] [0.00] [0.00] [0.00] [0.01] [0.00] [0.00] [0.00] [0.00]
13 Investment 0.30 0.25 0.03 -0.11 -0.15 -0.19 0.18 0.01 0.34 0.06 0.18 0.08 1.00[0.00] [0.00] [0.00] [0.00] [0.00] [0.00] [0.00] [0.09] [0.00] [0.00] [0.00] [0.00]
47
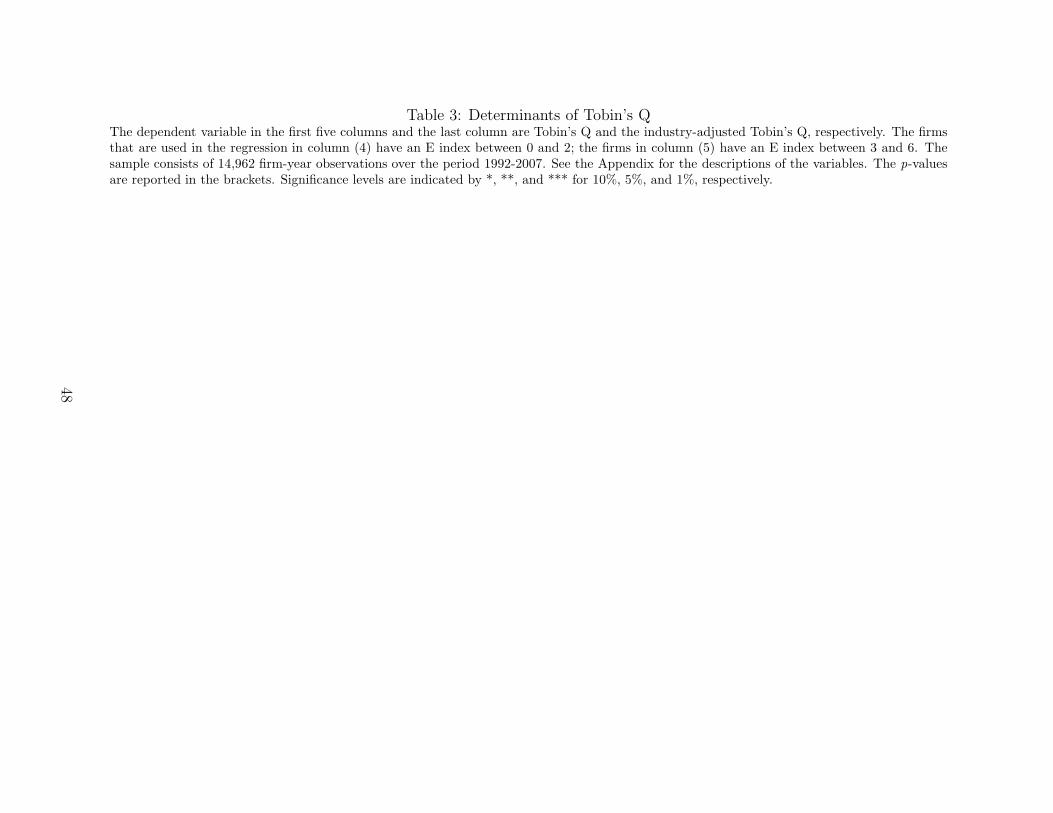
Table 3: Determinants of Tobin’s QThe dependent variable in the first five columns and the last column are Tobin’s Q and the industry-adjusted Tobin’s Q, respectively. The firmsthat are used in the regression in column (4) have an E index between 0 and 2; the firms in column (5) have an E index between 3 and 6. Thesample consists of 14,962 firm-year observations over the period 1992-2007. See the Appendix for the descriptions of the variables. The p-valuesare reported in the brackets. Significance levels are indicated by *, **, and *** for 10%, 5%, and 1%, respectively.
48
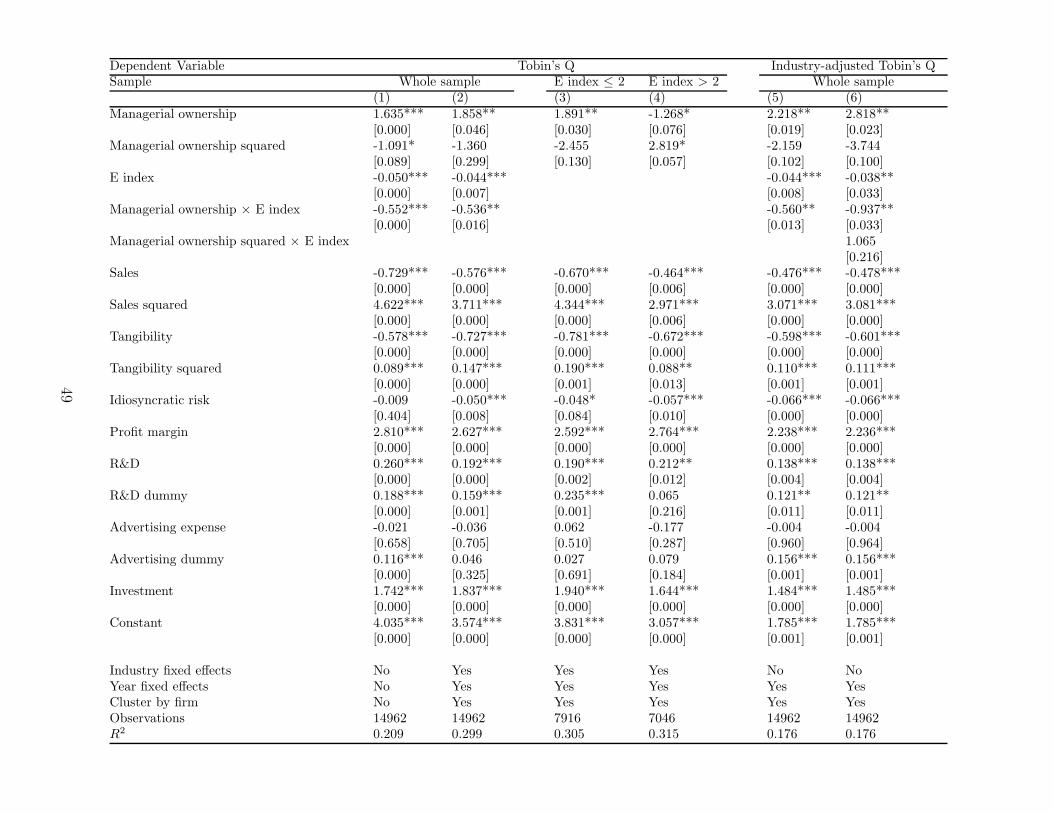
Dependent Variable Tobin’s Q Industry-adjusted Tobin’s QSample Whole sample E index ≤ 2 E index > 2 Whole sample
(1) (2) (3) (4) (5) (6)Managerial ownership 1.635*** 1.858** 1.891** -1.268* 2.218** 2.818**
[0.000] [0.046] [0.030] [0.076] [0.019] [0.023]Managerial ownership squared -1.091* -1.360 -2.455 2.819* -2.159 -3.744
[0.089] [0.299] [0.130] [0.057] [0.102] [0.100]E index -0.050*** -0.044*** -0.044*** -0.038**
[0.000] [0.007] [0.008] [0.033]Managerial ownership × E index -0.552*** -0.536** -0.560** -0.937**
[0.000] [0.016] [0.013] [0.033]Managerial ownership squared × E index 1.065
[0.216]Sales -0.729*** -0.576*** -0.670*** -0.464*** -0.476*** -0.478***
[0.000] [0.000] [0.000] [0.006] [0.000] [0.000]Sales squared 4.622*** 3.711*** 4.344*** 2.971*** 3.071*** 3.081***
[0.000] [0.000] [0.000] [0.006] [0.000] [0.000]Tangibility -0.578*** -0.727*** -0.781*** -0.672*** -0.598*** -0.601***
[0.000] [0.000] [0.000] [0.000] [0.000] [0.000]Tangibility squared 0.089*** 0.147*** 0.190*** 0.088** 0.110*** 0.111***
[0.000] [0.000] [0.001] [0.013] [0.001] [0.001]Idiosyncratic risk -0.009 -0.050*** -0.048* -0.057*** -0.066*** -0.066***
[0.404] [0.008] [0.084] [0.010] [0.000] [0.000]Profit margin 2.810*** 2.627*** 2.592*** 2.764*** 2.238*** 2.236***
[0.000] [0.000] [0.000] [0.000] [0.000] [0.000]R&D 0.260*** 0.192*** 0.190*** 0.212** 0.138*** 0.138***
[0.000] [0.000] [0.002] [0.012] [0.004] [0.004]R&D dummy 0.188*** 0.159*** 0.235*** 0.065 0.121** 0.121**
[0.000] [0.001] [0.001] [0.216] [0.011] [0.011]Advertising expense -0.021 -0.036 0.062 -0.177 -0.004 -0.004
[0.658] [0.705] [0.510] [0.287] [0.960] [0.964]Advertising dummy 0.116*** 0.046 0.027 0.079 0.156*** 0.156***
[0.000] [0.325] [0.691] [0.184] [0.001] [0.001]Investment 1.742*** 1.837*** 1.940*** 1.644*** 1.484*** 1.485***
[0.000] [0.000] [0.000] [0.000] [0.000] [0.000]Constant 4.035*** 3.574*** 3.831*** 3.057*** 1.785*** 1.785***
[0.000] [0.000] [0.000] [0.000] [0.001] [0.001]
Industry fixed effects No Yes Yes Yes No NoYear fixed effects No Yes Yes Yes Yes YesCluster by firm No Yes Yes Yes Yes YesObservations 14962 14962 7916 7046 14962 14962R2 0.209 0.299 0.305 0.315 0.176 0.176
49
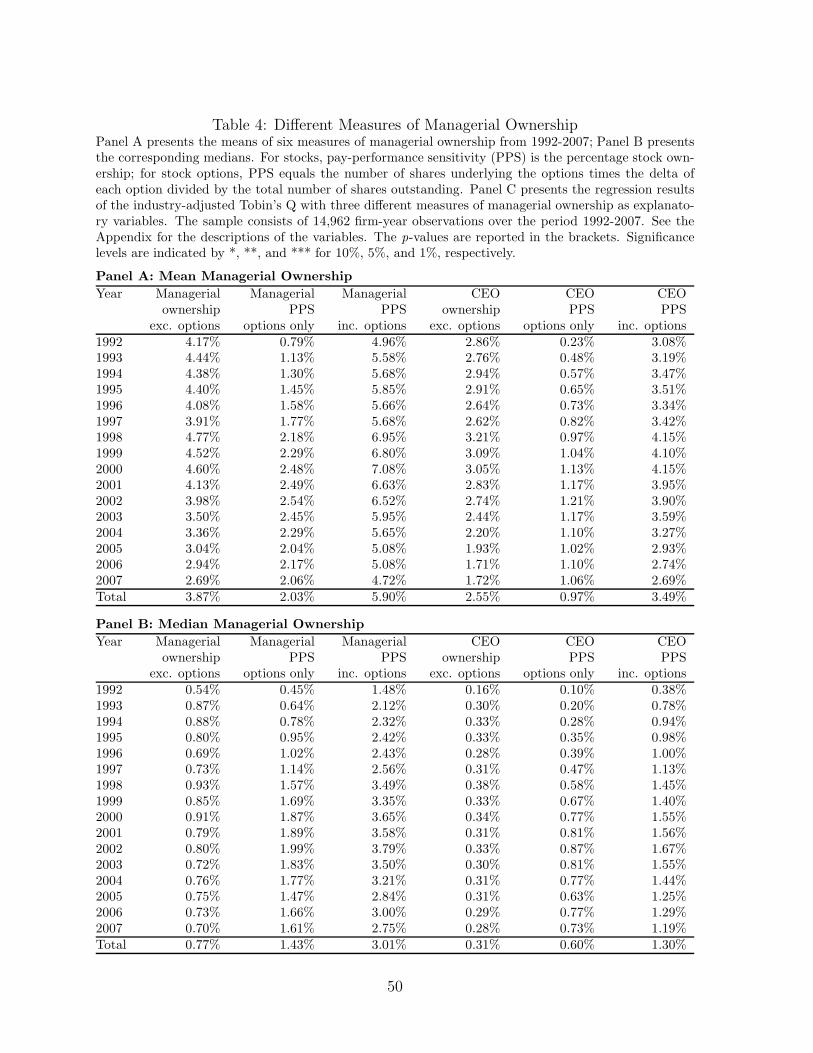
Table 4: Different Measures of Managerial OwnershipPanel A presents the means of six measures of managerial ownership from 1992-2007; Panel B presentsthe corresponding medians. For stocks, pay-performance sensitivity (PPS) is the percentage stock own-ership; for stock options, PPS equals the number of shares underlying the options times the delta ofeach option divided by the total number of shares outstanding. Panel C presents the regression resultsof the industry-adjusted Tobin’s Q with three different measures of managerial ownership as explanato-ry variables. The sample consists of 14,962 firm-year observations over the period 1992-2007. See theAppendix for the descriptions of the variables. The p-values are reported in the brackets. Significancelevels are indicated by *, **, and *** for 10%, 5%, and 1%, respectively.
Panel A: Mean Managerial Ownership
Year Managerial Managerial Managerial CEO CEO CEOownership PPS PPS ownership PPS PPS
exc. options options only inc. options exc. options options only inc. options1992 4.17% 0.79% 4.96% 2.86% 0.23% 3.08%1993 4.44% 1.13% 5.58% 2.76% 0.48% 3.19%1994 4.38% 1.30% 5.68% 2.94% 0.57% 3.47%1995 4.40% 1.45% 5.85% 2.91% 0.65% 3.51%1996 4.08% 1.58% 5.66% 2.64% 0.73% 3.34%1997 3.91% 1.77% 5.68% 2.62% 0.82% 3.42%1998 4.77% 2.18% 6.95% 3.21% 0.97% 4.15%1999 4.52% 2.29% 6.80% 3.09% 1.04% 4.10%2000 4.60% 2.48% 7.08% 3.05% 1.13% 4.15%2001 4.13% 2.49% 6.63% 2.83% 1.17% 3.95%2002 3.98% 2.54% 6.52% 2.74% 1.21% 3.90%2003 3.50% 2.45% 5.95% 2.44% 1.17% 3.59%2004 3.36% 2.29% 5.65% 2.20% 1.10% 3.27%2005 3.04% 2.04% 5.08% 1.93% 1.02% 2.93%2006 2.94% 2.17% 5.08% 1.71% 1.10% 2.74%2007 2.69% 2.06% 4.72% 1.72% 1.06% 2.69%Total 3.87% 2.03% 5.90% 2.55% 0.97% 3.49%
Panel B: Median Managerial Ownership
Year Managerial Managerial Managerial CEO CEO CEOownership PPS PPS ownership PPS PPS
exc. options options only inc. options exc. options options only inc. options1992 0.54% 0.45% 1.48% 0.16% 0.10% 0.38%1993 0.87% 0.64% 2.12% 0.30% 0.20% 0.78%1994 0.88% 0.78% 2.32% 0.33% 0.28% 0.94%1995 0.80% 0.95% 2.42% 0.33% 0.35% 0.98%1996 0.69% 1.02% 2.43% 0.28% 0.39% 1.00%1997 0.73% 1.14% 2.56% 0.31% 0.47% 1.13%1998 0.93% 1.57% 3.49% 0.38% 0.58% 1.45%1999 0.85% 1.69% 3.35% 0.33% 0.67% 1.40%2000 0.91% 1.87% 3.65% 0.34% 0.77% 1.55%2001 0.79% 1.89% 3.58% 0.31% 0.81% 1.56%2002 0.80% 1.99% 3.79% 0.33% 0.87% 1.67%2003 0.72% 1.83% 3.50% 0.30% 0.81% 1.55%2004 0.76% 1.77% 3.21% 0.31% 0.77% 1.44%2005 0.75% 1.47% 2.84% 0.31% 0.63% 1.25%2006 0.73% 1.66% 3.00% 0.29% 0.77% 1.29%2007 0.70% 1.61% 2.75% 0.28% 0.73% 1.19%Total 0.77% 1.43% 3.01% 0.31% 0.60% 1.30%
50
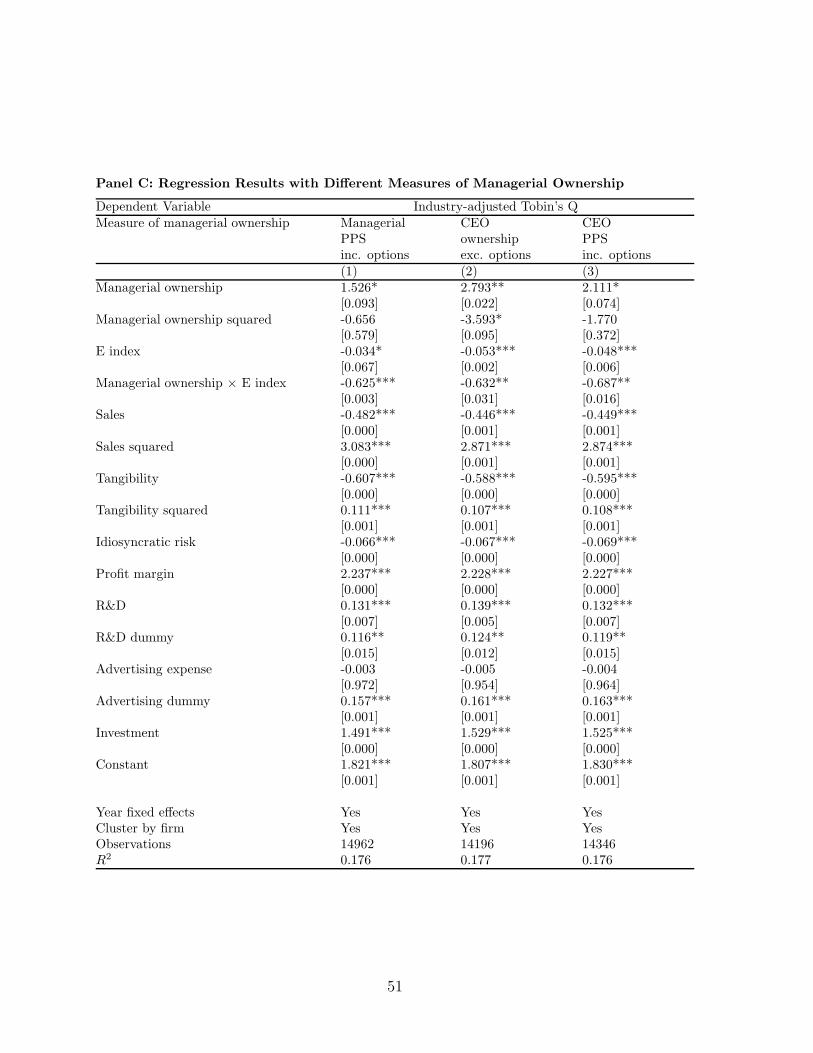
Panel C: Regression Results with Different Measures of Managerial Ownership
Dependent Variable Industry-adjusted Tobin’s QMeasure of managerial ownership Managerial CEO CEO
PPS ownership PPSinc. options exc. options inc. options(1) (2) (3)
Managerial ownership 1.526* 2.793** 2.111*[0.093] [0.022] [0.074]
Managerial ownership squared -0.656 -3.593* -1.770[0.579] [0.095] [0.372]
E index -0.034* -0.053*** -0.048***[0.067] [0.002] [0.006]
Managerial ownership × E index -0.625*** -0.632** -0.687**[0.003] [0.031] [0.016]
Sales -0.482*** -0.446*** -0.449***[0.000] [0.001] [0.001]
Sales squared 3.083*** 2.871*** 2.874***[0.000] [0.001] [0.001]
Tangibility -0.607*** -0.588*** -0.595***[0.000] [0.000] [0.000]
Tangibility squared 0.111*** 0.107*** 0.108***[0.001] [0.001] [0.001]
Idiosyncratic risk -0.066*** -0.067*** -0.069***[0.000] [0.000] [0.000]
Profit margin 2.237*** 2.228*** 2.227***[0.000] [0.000] [0.000]
R&D 0.131*** 0.139*** 0.132***[0.007] [0.005] [0.007]
R&D dummy 0.116** 0.124** 0.119**[0.015] [0.012] [0.015]
Advertising expense -0.003 -0.005 -0.004[0.972] [0.954] [0.964]
Advertising dummy 0.157*** 0.161*** 0.163***[0.001] [0.001] [0.001]
Investment 1.491*** 1.529*** 1.525***[0.000] [0.000] [0.000]
Constant 1.821*** 1.807*** 1.830***[0.001] [0.001] [0.001]
Year fixed effects Yes Yes YesCluster by firm Yes Yes YesObservations 14962 14196 14346R2 0.176 0.177 0.176
51
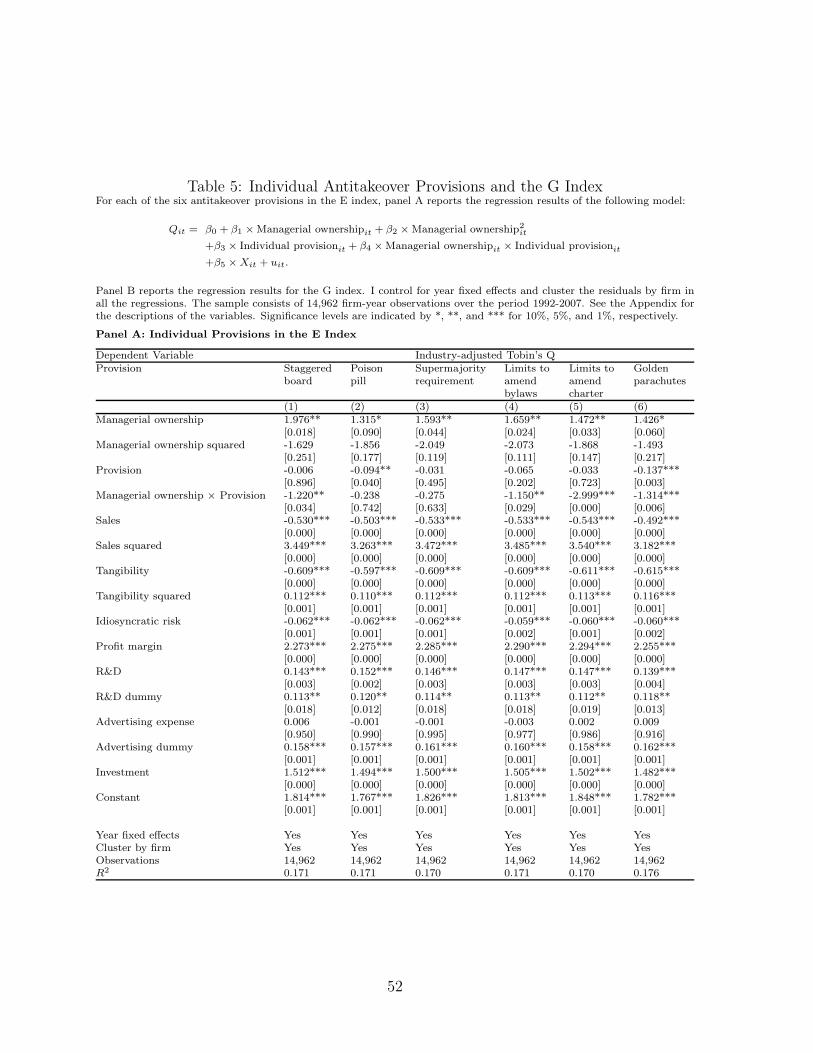
Table 5: Individual Antitakeover Provisions and the G IndexFor each of the six antitakeover provisions in the E index, panel A reports the regression results of the following model:
Qit = β0 + β1 ×Managerial ownershipit+ β2 ×Managerial ownership2
it
+β3 × Individual provisionit+ β4 ×Managerial ownership
it× Individual provision
it
+β5 ×Xit + uit.
Panel B reports the regression results for the G index. I control for year fixed effects and cluster the residuals by firm inall the regressions. The sample consists of 14,962 firm-year observations over the period 1992-2007. See the Appendix forthe descriptions of the variables. Significance levels are indicated by *, **, and *** for 10%, 5%, and 1%, respectively.
Panel A: Individual Provisions in the E Index
Dependent Variable Industry-adjusted Tobin’s QProvision Staggered Poison Supermajority Limits to Limits to Golden
board pill requirement amend amend parachutesbylaws charter
(1) (2) (3) (4) (5) (6)Managerial ownership 1.976** 1.315* 1.593** 1.659** 1.472** 1.426*
[0.018] [0.090] [0.044] [0.024] [0.033] [0.060]Managerial ownership squared -1.629 -1.856 -2.049 -2.073 -1.868 -1.493
[0.251] [0.177] [0.119] [0.111] [0.147] [0.217]Provision -0.006 -0.094** -0.031 -0.065 -0.033 -0.137***
[0.896] [0.040] [0.495] [0.202] [0.723] [0.003]Managerial ownership × Provision -1.220** -0.238 -0.275 -1.150** -2.999*** -1.314***
[0.034] [0.742] [0.633] [0.029] [0.000] [0.006]Sales -0.530*** -0.503*** -0.533*** -0.533*** -0.543*** -0.492***
[0.000] [0.000] [0.000] [0.000] [0.000] [0.000]Sales squared 3.449*** 3.263*** 3.472*** 3.485*** 3.540*** 3.182***
[0.000] [0.000] [0.000] [0.000] [0.000] [0.000]Tangibility -0.609*** -0.597*** -0.609*** -0.609*** -0.611*** -0.615***
[0.000] [0.000] [0.000] [0.000] [0.000] [0.000]Tangibility squared 0.112*** 0.110*** 0.112*** 0.112*** 0.113*** 0.116***
[0.001] [0.001] [0.001] [0.001] [0.001] [0.001]Idiosyncratic risk -0.062*** -0.062*** -0.062*** -0.059*** -0.060*** -0.060***
[0.001] [0.001] [0.001] [0.002] [0.001] [0.002]Profit margin 2.273*** 2.275*** 2.285*** 2.290*** 2.294*** 2.255***
[0.000] [0.000] [0.000] [0.000] [0.000] [0.000]R&D 0.143*** 0.152*** 0.146*** 0.147*** 0.147*** 0.139***
[0.003] [0.002] [0.003] [0.003] [0.003] [0.004]R&D dummy 0.113** 0.120** 0.114** 0.113** 0.112** 0.118**
[0.018] [0.012] [0.018] [0.018] [0.019] [0.013]Advertising expense 0.006 -0.001 -0.001 -0.003 0.002 0.009
[0.950] [0.990] [0.995] [0.977] [0.986] [0.916]Advertising dummy 0.158*** 0.157*** 0.161*** 0.160*** 0.158*** 0.162***
[0.001] [0.001] [0.001] [0.001] [0.001] [0.001]Investment 1.512*** 1.494*** 1.500*** 1.505*** 1.502*** 1.482***
[0.000] [0.000] [0.000] [0.000] [0.000] [0.000]Constant 1.814*** 1.767*** 1.826*** 1.813*** 1.848*** 1.782***
[0.001] [0.001] [0.001] [0.001] [0.001] [0.001]
Year fixed effects Yes Yes Yes Yes Yes YesCluster by firm Yes Yes Yes Yes Yes YesObservations 14,962 14,962 14,962 14,962 14,962 14,962R2 0.171 0.171 0.170 0.171 0.170 0.176
52
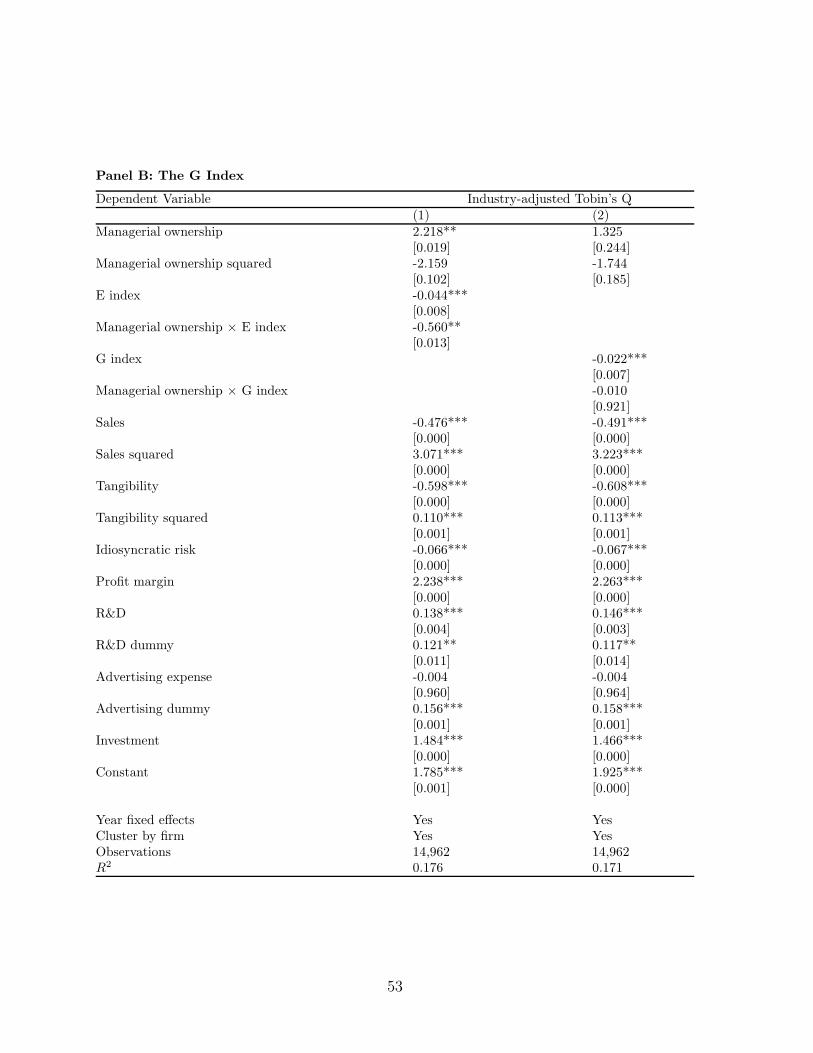
Panel B: The G Index
Dependent Variable Industry-adjusted Tobin’s Q(1) (2)
Managerial ownership 2.218** 1.325[0.019] [0.244]
Managerial ownership squared -2.159 -1.744[0.102] [0.185]
E index -0.044***[0.008]
Managerial ownership × E index -0.560**[0.013]
G index -0.022***[0.007]
Managerial ownership × G index -0.010[0.921]
Sales -0.476*** -0.491***[0.000] [0.000]
Sales squared 3.071*** 3.223***[0.000] [0.000]
Tangibility -0.598*** -0.608***[0.000] [0.000]
Tangibility squared 0.110*** 0.113***[0.001] [0.001]
Idiosyncratic risk -0.066*** -0.067***[0.000] [0.000]
Profit margin 2.238*** 2.263***[0.000] [0.000]
R&D 0.138*** 0.146***[0.004] [0.003]
R&D dummy 0.121** 0.117**[0.011] [0.014]
Advertising expense -0.004 -0.004[0.960] [0.964]
Advertising dummy 0.156*** 0.158***[0.001] [0.001]
Investment 1.484*** 1.466***[0.000] [0.000]
Constant 1.785*** 1.925***[0.001] [0.000]
Year fixed effects Yes YesCluster by firm Yes YesObservations 14,962 14,962R2 0.176 0.171
53
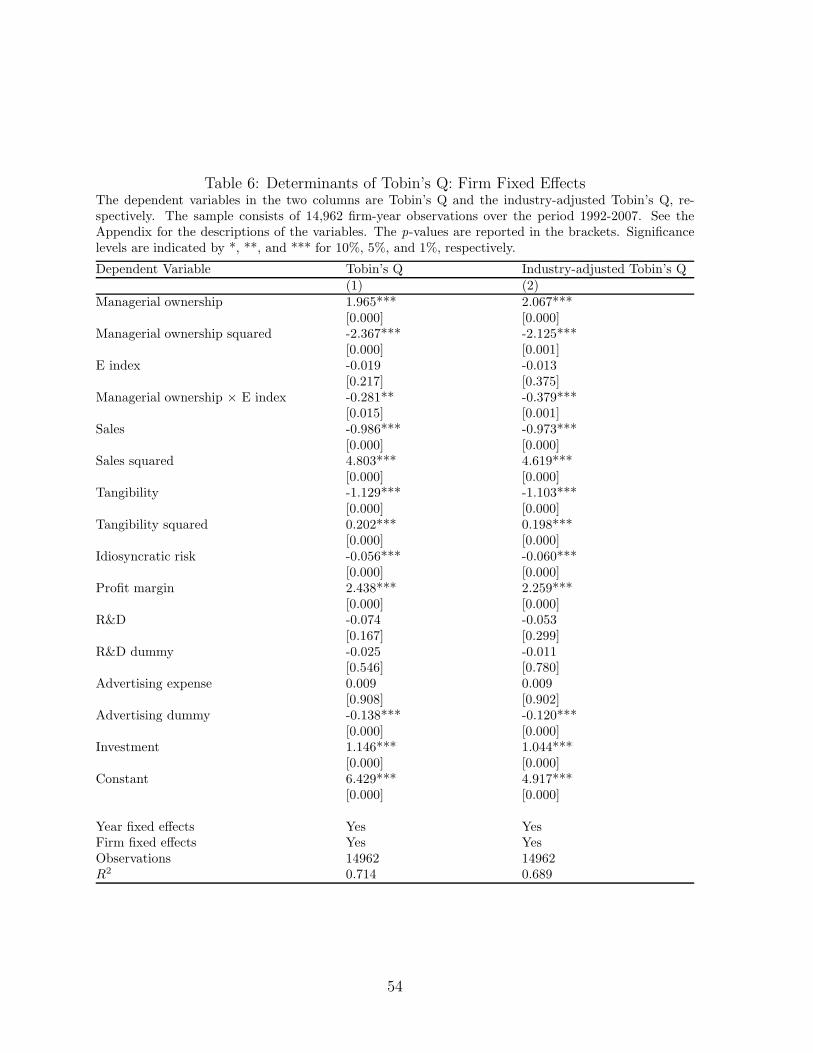
Table 6: Determinants of Tobin’s Q: Firm Fixed EffectsThe dependent variables in the two columns are Tobin’s Q and the industry-adjusted Tobin’s Q, re-spectively. The sample consists of 14,962 firm-year observations over the period 1992-2007. See theAppendix for the descriptions of the variables. The p-values are reported in the brackets. Significancelevels are indicated by *, **, and *** for 10%, 5%, and 1%, respectively.
Dependent Variable Tobin’s Q Industry-adjusted Tobin’s Q(1) (2)
Managerial ownership 1.965*** 2.067***[0.000] [0.000]
Managerial ownership squared -2.367*** -2.125***[0.000] [0.001]
E index -0.019 -0.013[0.217] [0.375]
Managerial ownership × E index -0.281** -0.379***[0.015] [0.001]
Sales -0.986*** -0.973***[0.000] [0.000]
Sales squared 4.803*** 4.619***[0.000] [0.000]
Tangibility -1.129*** -1.103***[0.000] [0.000]
Tangibility squared 0.202*** 0.198***[0.000] [0.000]
Idiosyncratic risk -0.056*** -0.060***[0.000] [0.000]
Profit margin 2.438*** 2.259***[0.000] [0.000]
R&D -0.074 -0.053[0.167] [0.299]
R&D dummy -0.025 -0.011[0.546] [0.780]
Advertising expense 0.009 0.009[0.908] [0.902]
Advertising dummy -0.138*** -0.120***[0.000] [0.000]
Investment 1.146*** 1.044***[0.000] [0.000]
Constant 6.429*** 4.917***[0.000] [0.000]
Year fixed effects Yes YesFirm fixed effects Yes YesObservations 14962 14962R2 0.714 0.689
54
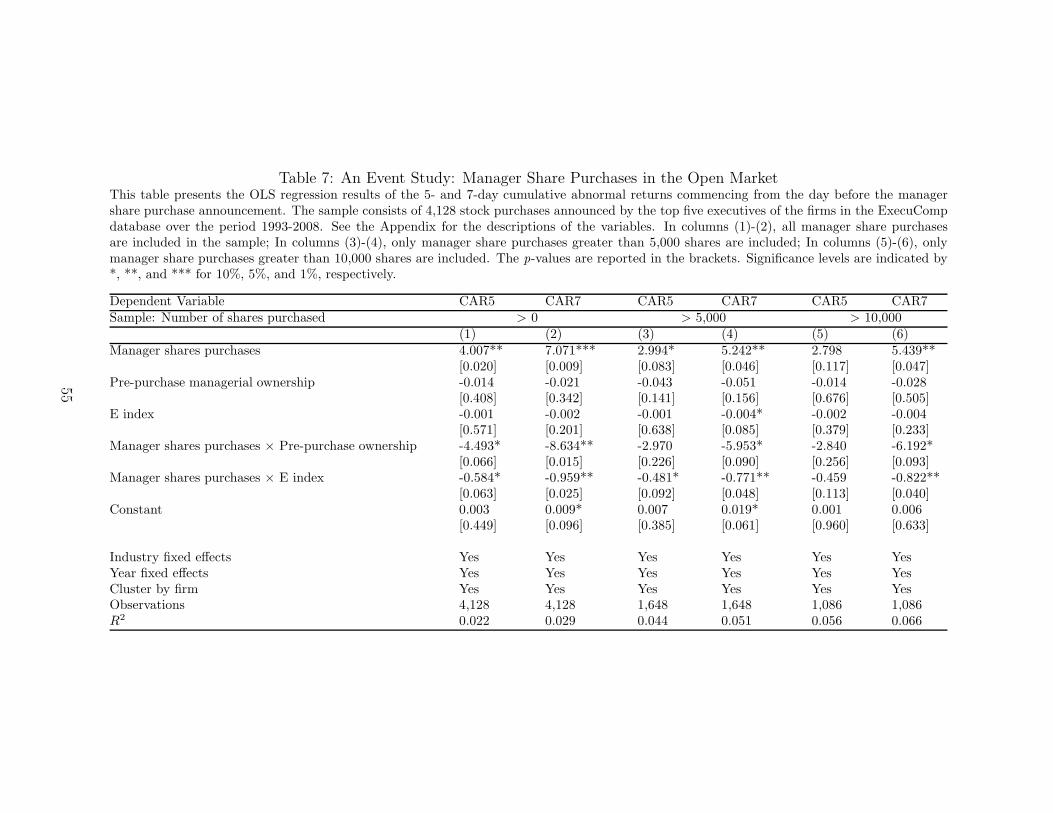
Table 7: An Event Study: Manager Share Purchases in the Open MarketThis table presents the OLS regression results of the 5- and 7-day cumulative abnormal returns commencing from the day before the managershare purchase announcement. The sample consists of 4,128 stock purchases announced by the top five executives of the firms in the ExecuCompdatabase over the period 1993-2008. See the Appendix for the descriptions of the variables. In columns (1)-(2), all manager share purchasesare included in the sample; In columns (3)-(4), only manager share purchases greater than 5,000 shares are included; In columns (5)-(6), onlymanager share purchases greater than 10,000 shares are included. The p-values are reported in the brackets. Significance levels are indicated by*, **, and *** for 10%, 5%, and 1%, respectively.
Dependent Variable CAR5 CAR7 CAR5 CAR7 CAR5 CAR7Sample: Number of shares purchased > 0 > 5,000 > 10,000
(1) (2) (3) (4) (5) (6)Manager shares purchases 4.007** 7.071*** 2.994* 5.242** 2.798 5.439**
[0.020] [0.009] [0.083] [0.046] [0.117] [0.047]Pre-purchase managerial ownership -0.014 -0.021 -0.043 -0.051 -0.014 -0.028
[0.408] [0.342] [0.141] [0.156] [0.676] [0.505]E index -0.001 -0.002 -0.001 -0.004* -0.002 -0.004
[0.571] [0.201] [0.638] [0.085] [0.379] [0.233]Manager shares purchases × Pre-purchase ownership -4.493* -8.634** -2.970 -5.953* -2.840 -6.192*
[0.066] [0.015] [0.226] [0.090] [0.256] [0.093]Manager shares purchases × E index -0.584* -0.959** -0.481* -0.771** -0.459 -0.822**
[0.063] [0.025] [0.092] [0.048] [0.113] [0.040]Constant 0.003 0.009* 0.007 0.019* 0.001 0.006
[0.449] [0.096] [0.385] [0.061] [0.960] [0.633]
Industry fixed effects Yes Yes Yes Yes Yes YesYear fixed effects Yes Yes Yes Yes Yes YesCluster by firm Yes Yes Yes Yes Yes YesObservations 4,128 4,128 1,648 1,648 1,086 1,086R2 0.022 0.029 0.044 0.051 0.056 0.066
55
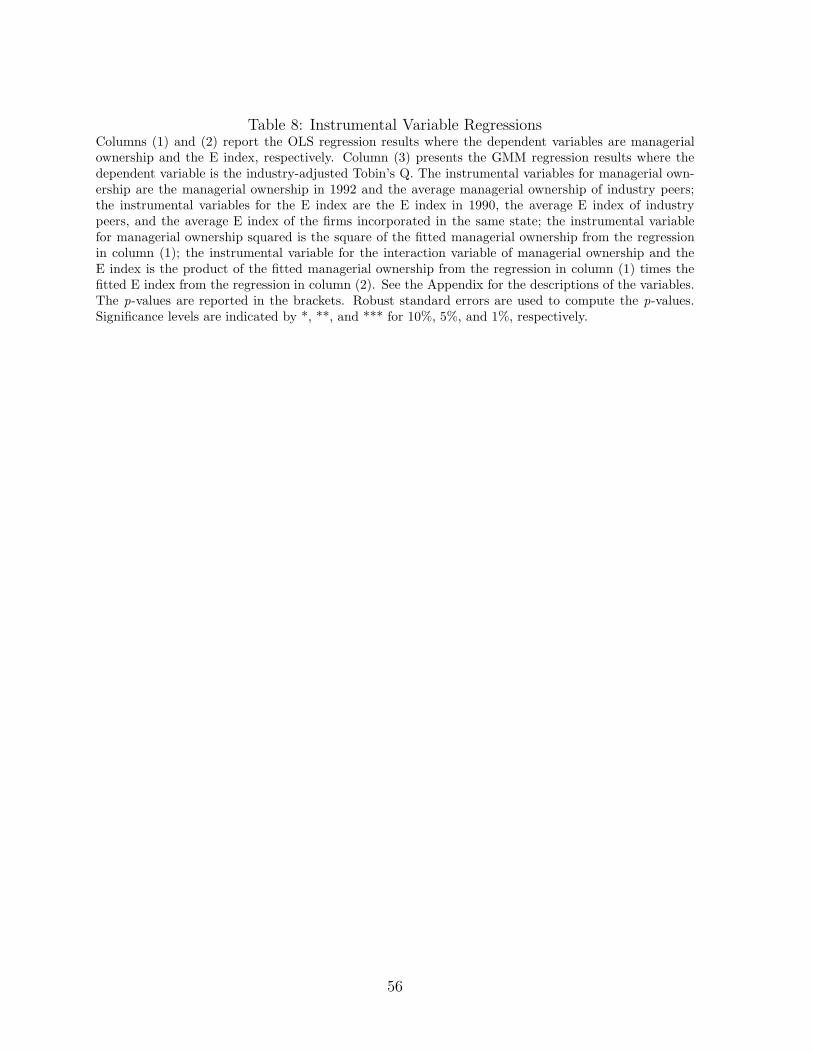
Table 8: Instrumental Variable RegressionsColumns (1) and (2) report the OLS regression results where the dependent variables are managerialownership and the E index, respectively. Column (3) presents the GMM regression results where thedependent variable is the industry-adjusted Tobin’s Q. The instrumental variables for managerial own-ership are the managerial ownership in 1992 and the average managerial ownership of industry peers;the instrumental variables for the E index are the E index in 1990, the average E index of industrypeers, and the average E index of the firms incorporated in the same state; the instrumental variablefor managerial ownership squared is the square of the fitted managerial ownership from the regressionin column (1); the instrumental variable for the interaction variable of managerial ownership and theE index is the product of the fitted managerial ownership from the regression in column (1) times thefitted E index from the regression in column (2). See the Appendix for the descriptions of the variables.The p-values are reported in the brackets. Robust standard errors are used to compute the p-values.Significance levels are indicated by *, **, and *** for 10%, 5%, and 1%, respectively.
56
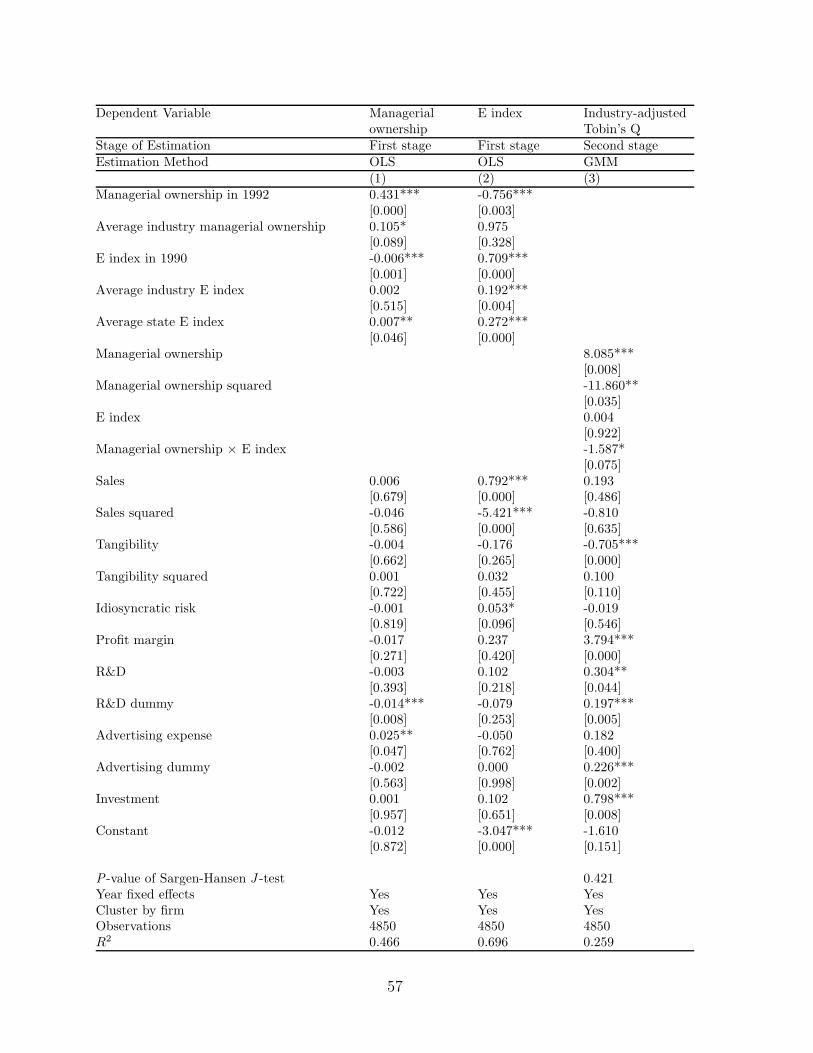
Dependent Variable Managerial E index Industry-adjustedownership Tobin’s Q
Stage of Estimation First stage First stage Second stageEstimation Method OLS OLS GMM
(1) (2) (3)Managerial ownership in 1992 0.431*** -0.756***
[0.000] [0.003]Average industry managerial ownership 0.105* 0.975
[0.089] [0.328]E index in 1990 -0.006*** 0.709***
[0.001] [0.000]Average industry E index 0.002 0.192***
[0.515] [0.004]Average state E index 0.007** 0.272***
[0.046] [0.000]Managerial ownership 8.085***
[0.008]Managerial ownership squared -11.860**
[0.035]E index 0.004
[0.922]Managerial ownership × E index -1.587*
[0.075]Sales 0.006 0.792*** 0.193
[0.679] [0.000] [0.486]Sales squared -0.046 -5.421*** -0.810
[0.586] [0.000] [0.635]Tangibility -0.004 -0.176 -0.705***
[0.662] [0.265] [0.000]Tangibility squared 0.001 0.032 0.100
[0.722] [0.455] [0.110]Idiosyncratic risk -0.001 0.053* -0.019
[0.819] [0.096] [0.546]Profit margin -0.017 0.237 3.794***
[0.271] [0.420] [0.000]R&D -0.003 0.102 0.304**
[0.393] [0.218] [0.044]R&D dummy -0.014*** -0.079 0.197***
[0.008] [0.253] [0.005]Advertising expense 0.025** -0.050 0.182
[0.047] [0.762] [0.400]Advertising dummy -0.002 0.000 0.226***
[0.563] [0.998] [0.002]Investment 0.001 0.102 0.798***
[0.957] [0.651] [0.008]Constant -0.012 -3.047*** -1.610
[0.872] [0.000] [0.151]
P -value of Sargen-Hansen J -test 0.421Year fixed effects Yes Yes YesCluster by firm Yes Yes YesObservations 4850 4850 4850R2 0.466 0.696 0.259
57
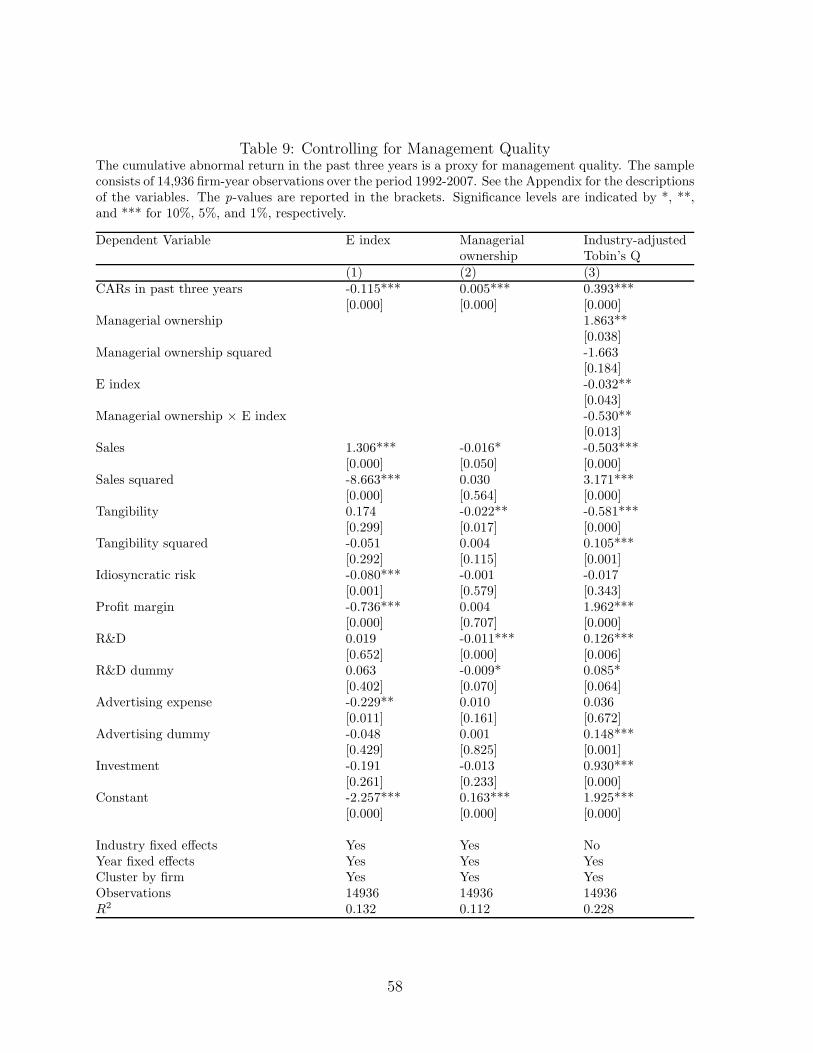
Table 9: Controlling for Management QualityThe cumulative abnormal return in the past three years is a proxy for management quality. The sampleconsists of 14,936 firm-year observations over the period 1992-2007. See the Appendix for the descriptionsof the variables. The p-values are reported in the brackets. Significance levels are indicated by *, **,and *** for 10%, 5%, and 1%, respectively.
Dependent Variable E index Managerial Industry-adjustedownership Tobin’s Q
(1) (2) (3)CARs in past three years -0.115*** 0.005*** 0.393***
[0.000] [0.000] [0.000]Managerial ownership 1.863**
[0.038]Managerial ownership squared -1.663
[0.184]E index -0.032**
[0.043]Managerial ownership × E index -0.530**
[0.013]Sales 1.306*** -0.016* -0.503***
[0.000] [0.050] [0.000]Sales squared -8.663*** 0.030 3.171***
[0.000] [0.564] [0.000]Tangibility 0.174 -0.022** -0.581***
[0.299] [0.017] [0.000]Tangibility squared -0.051 0.004 0.105***
[0.292] [0.115] [0.001]Idiosyncratic risk -0.080*** -0.001 -0.017
[0.001] [0.579] [0.343]Profit margin -0.736*** 0.004 1.962***
[0.000] [0.707] [0.000]R&D 0.019 -0.011*** 0.126***
[0.652] [0.000] [0.006]R&D dummy 0.063 -0.009* 0.085*
[0.402] [0.070] [0.064]Advertising expense -0.229** 0.010 0.036
[0.011] [0.161] [0.672]Advertising dummy -0.048 0.001 0.148***
[0.429] [0.825] [0.001]Investment -0.191 -0.013 0.930***
[0.261] [0.233] [0.000]Constant -2.257*** 0.163*** 1.925***
[0.000] [0.000] [0.000]
Industry fixed effects Yes Yes NoYear fixed effects Yes Yes YesCluster by firm Yes Yes YesObservations 14936 14936 14936R2 0.132 0.112 0.228
58
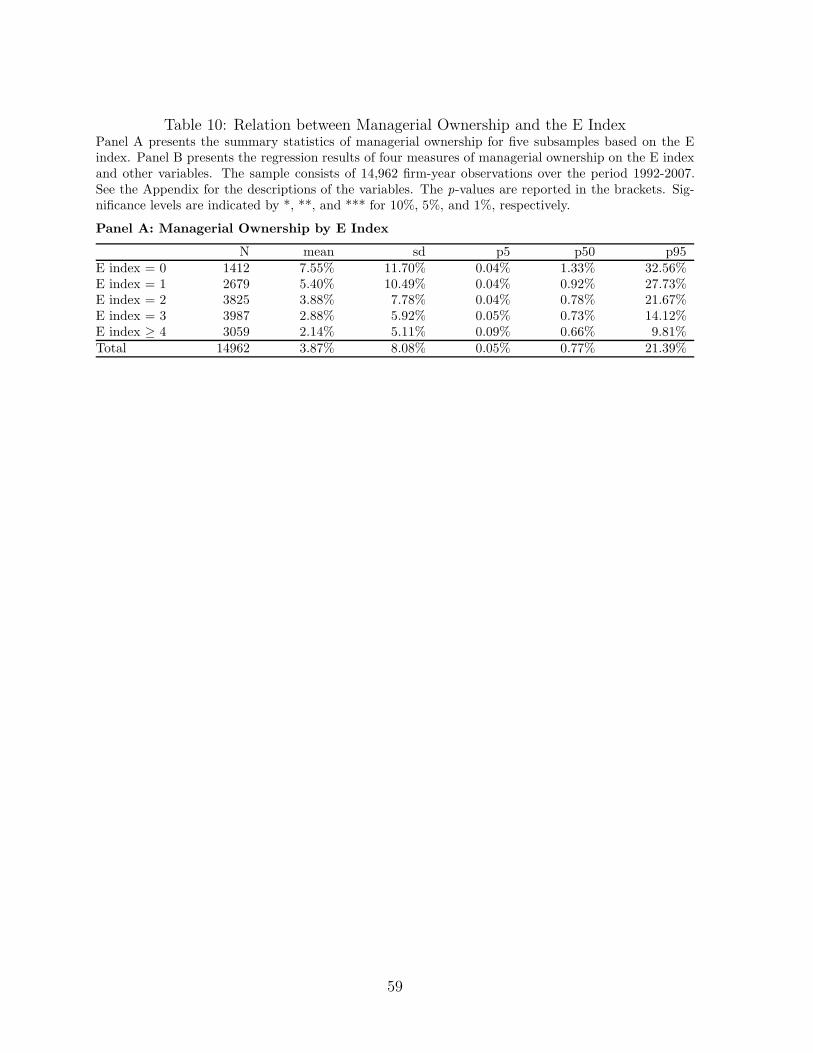
Table 10: Relation between Managerial Ownership and the E IndexPanel A presents the summary statistics of managerial ownership for five subsamples based on the Eindex. Panel B presents the regression results of four measures of managerial ownership on the E indexand other variables. The sample consists of 14,962 firm-year observations over the period 1992-2007.See the Appendix for the descriptions of the variables. The p-values are reported in the brackets. Sig-nificance levels are indicated by *, **, and *** for 10%, 5%, and 1%, respectively.
Panel A: Managerial Ownership by E Index
N mean sd p5 p50 p95E index = 0 1412 7.55% 11.70% 0.04% 1.33% 32.56%E index = 1 2679 5.40% 10.49% 0.04% 0.92% 27.73%E index = 2 3825 3.88% 7.78% 0.04% 0.78% 21.67%E index = 3 3987 2.88% 5.92% 0.05% 0.73% 14.12%E index ≥ 4 3059 2.14% 5.11% 0.09% 0.66% 9.81%Total 14962 3.87% 8.08% 0.05% 0.77% 21.39%
59
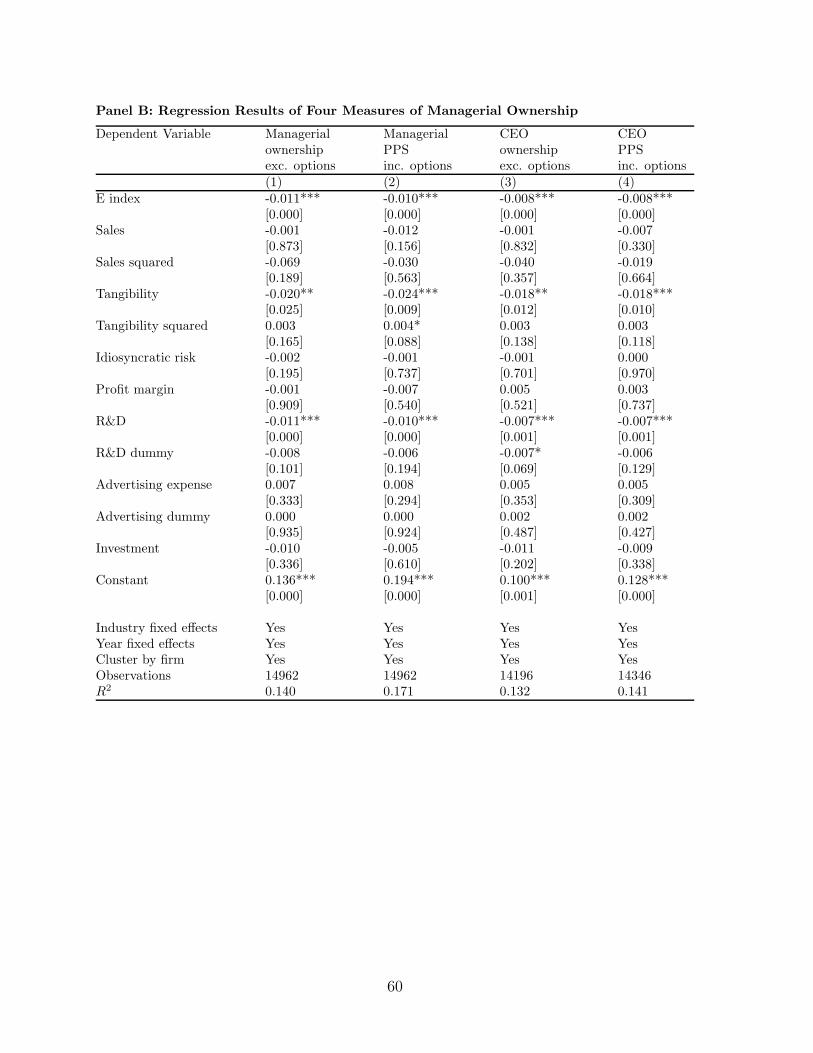
Panel B: Regression Results of Four Measures of Managerial Ownership
Dependent Variable Managerial Managerial CEO CEOownership PPS ownership PPSexc. options inc. options exc. options inc. options(1) (2) (3) (4)
E index -0.011*** -0.010*** -0.008*** -0.008***[0.000] [0.000] [0.000] [0.000]
Sales -0.001 -0.012 -0.001 -0.007[0.873] [0.156] [0.832] [0.330]
Sales squared -0.069 -0.030 -0.040 -0.019[0.189] [0.563] [0.357] [0.664]
Tangibility -0.020** -0.024*** -0.018** -0.018***[0.025] [0.009] [0.012] [0.010]
Tangibility squared 0.003 0.004* 0.003 0.003[0.165] [0.088] [0.138] [0.118]
Idiosyncratic risk -0.002 -0.001 -0.001 0.000[0.195] [0.737] [0.701] [0.970]
Profit margin -0.001 -0.007 0.005 0.003[0.909] [0.540] [0.521] [0.737]
R&D -0.011*** -0.010*** -0.007*** -0.007***[0.000] [0.000] [0.001] [0.001]
R&D dummy -0.008 -0.006 -0.007* -0.006[0.101] [0.194] [0.069] [0.129]
Advertising expense 0.007 0.008 0.005 0.005[0.333] [0.294] [0.353] [0.309]
Advertising dummy 0.000 0.000 0.002 0.002[0.935] [0.924] [0.487] [0.427]
Investment -0.010 -0.005 -0.011 -0.009[0.336] [0.610] [0.202] [0.338]
Constant 0.136*** 0.194*** 0.100*** 0.128***[0.000] [0.000] [0.001] [0.000]
Industry fixed effects Yes Yes Yes YesYear fixed effects Yes Yes Yes YesCluster by firm Yes Yes Yes YesObservations 14962 14962 14196 14346R2 0.140 0.171 0.132 0.141
60
Recommended