West Chester UniversityDigital Commons @ West Chester University
WCU Campus Sustainability Initiatives Sustainability Research & Creative Activities @WCU
8-2019
Spring 2019 Commuting and Parking SurveyReport prepared for West Chester UniversityEric K. Foster
Follow this and additional works at: https://digitalcommons.wcupa.edu/srca_csiPart of the Urban Studies and Planning Commons
Spring 2019
Commuting and Parking Survey
Report
prepared for
John Villella, Ed.D.
Vice President for University Affairs, Chief of Staff, and
Chair, Strategic Transportation and Parking Task Force
and
Bradley Flamm, PhD
Director, Office of Sustainability
703 South High Street, Room 101
by
www.MDFresearch.com
August 2019
ERIC K. FOSTER, PHD PRINCIPAL

West Chester University 2019 Commuter Survey Report Page ii
West Chester University 2019 Commuter Survey Report Page iii
Contents
Introduction ..................................................................................................................................... 1
Assumptions about respondents and data ......................................................................... 3
Results ............................................................................................................................................ 5
Student drivers .................................................................................................................... 5
Faculty and staff drivers ...................................................................................................... 5
Total annual WCU commuting fuel use .............................................................................. 6
Modes of commuting .......................................................................................................... 9
Carpooling ......................................................................................................................... 11
Parking .............................................................................................................................. 12
Knowledge and attitudes about alternative transportation ............................................. 14
Conclusion ...................................................................................................................................... 15
Comparing 2018 and 2019 results .................................................................................... 15
Technical and logistical notes ........................................................................................... 18
Appendix A – The instrument ........................................................................................................ 19
Appendix B – Margin of error chart ............................................................................................... 28

West Chester University 2019 Commuter Survey Report Page iv
West Chester University 2019 Commuter Survey Report Page 1
INTRODUCTION
A second annual commuter survey was conducted at West Chester University in the spring of 2019. The
purpose of the survey was to measure community members’ current commuting and parking habits and to
informally investigate their willingness to participate in alternate forms of transportation. Data from the
previous year’s survey is compared to 2018 survey data.
As in 2018, for several reasons, one out of seven University members was selected randomly for
participation in the survey. The fraction was estimated to provide sufficient statistical precision for the
year-over-year comparison. The cost of sampling is typically lower than attempting to solicit the entire
population (a census). In addition, because the survey is being repeated, a sample is desirable to reduce
“survey fatigue” in the population. There was a 6% overlap of the student sample selected the previous
year, and 17% of the faculty and staff also overlapped the previous year’s sample.
The sample was drawn from ten strata: four student levels and seniors with 120+ credit hours; full and
part-time faculty; regular staff; USHC employees; and ARAmark employees. In most analyses in this
report, the strata examined are on-campus students, off-campus students, full-time faculty, part-time
faculty, and a combined three groups of staff. 2,297 email addresses were supplied. After removing
bounced emails and a few other ineligible cases (totaling just 22 ineligibles), the total adjusted population
was 13,545 eligible students, 959 faculty, and 1,421 staff being represented.
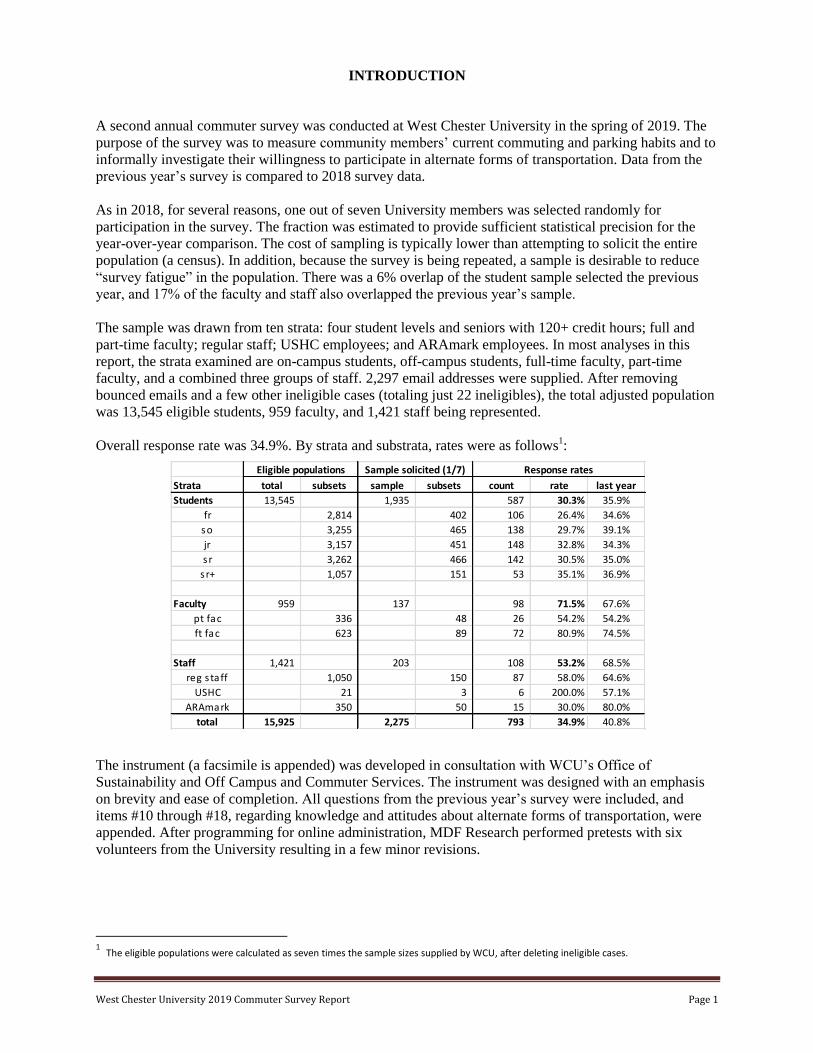
Overall response rate was 34.9%. By strata and substrata, rates were as follows1:
The instrument (a facsimile is appended) was developed in consultation with WCU’s Office of
Sustainability and Off Campus and Commuter Services. The instrument was designed with an emphasis
on brevity and ease of completion. All questions from the previous year’s survey were included, and
items #10 through #18, regarding knowledge and attitudes about alternate forms of transportation, were
appended. After programming for online administration, MDF Research performed pretests with six
volunteers from the University resulting in a few minor revisions.
1 The eligible populations were calculated as seven times the sample sizes supplied by WCU, after deleting ineligible cases.
Strata total subsets sample subsets count rate last year
Students 13,545 1,935 587 30.3% 35.9%
fr 2,814 402 106 26.4% 34.6%
so 3,255 465 138 29.7% 39.1%
jr 3,157 451 148 32.8% 34.3%
sr 3,262 466 142 30.5% 35.0%
sr+ 1,057 151 53 35.1% 36.9%
Faculty 959 137 98 71.5% 67.6%
pt fac 336 48 26 54.2% 54.2%
ft fac 623 89 72 80.9% 74.5%
Staff 1,421 203 108 53.2% 68.5%
reg s taff 1,050 150 87 58.0% 64.6%
USHC 21 3 6 200.0% 57.1%
ARAmark 350 50 15 30.0% 80.0%
total 15,925 2,275 793 34.9% 40.8%
Eligible populations Sample solicited (1/7) Response rates
West Chester University 2019 Commuter Survey Report Page 2
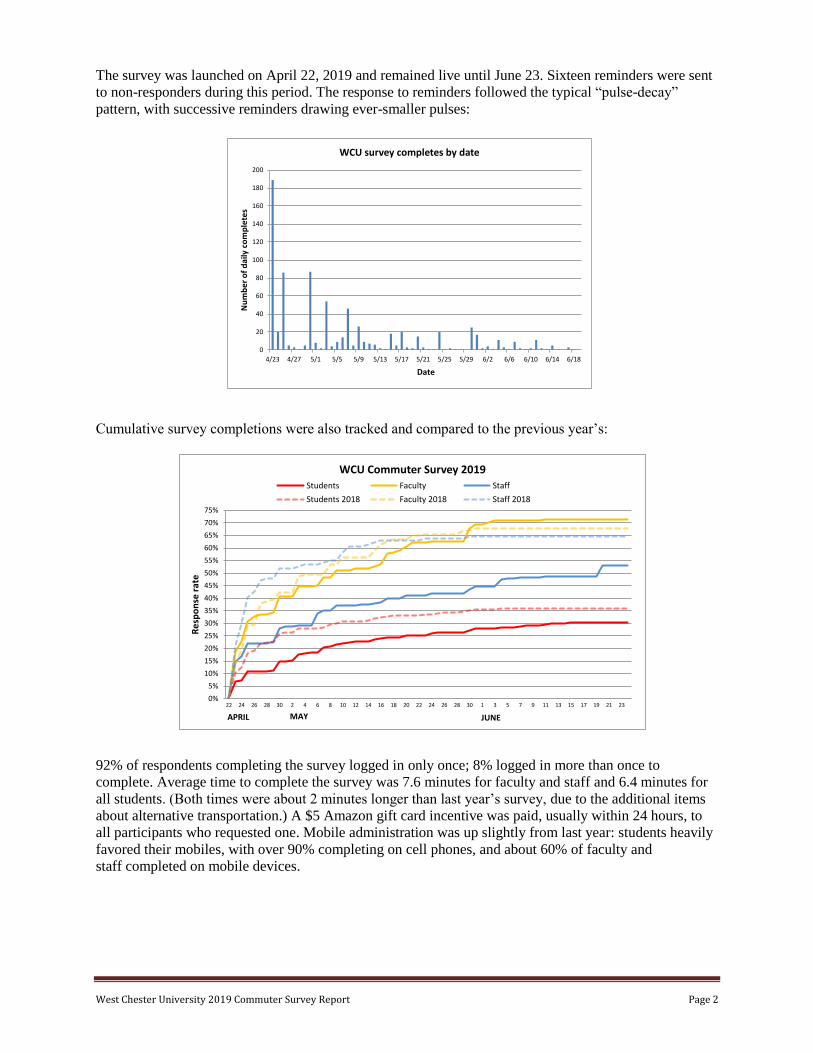
The survey was launched on April 22, 2019 and remained live until June 23. Sixteen reminders were sent
to non-responders during this period. The response to reminders followed the typical “pulse-decay”
pattern, with successive reminders drawing ever-smaller pulses:
Cumulative survey completions were also tracked and compared to the previous year’s:
92% of respondents completing the survey logged in only once; 8% logged in more than once to
complete. Average time to complete the survey was 7.6 minutes for faculty and staff and 6.4 minutes for
all students. (Both times were about 2 minutes longer than last year’s survey, due to the additional items
about alternative transportation.) A $5 Amazon gift card incentive was paid, usually within 24 hours, to
all participants who requested one. Mobile administration was up slightly from last year: students heavily
favored their mobiles, with over 90% completing on cell phones, and about 60% of faculty and
staff completed on mobile devices.
0
20
40
60
80
100
120
140
160
180
200
4/23 4/27 5/1 5/5 5/9 5/13 5/17 5/21 5/25 5/29 6/2 6/6 6/10 6/14 6/18
Nu
mb
er
of
dai
ly c
om
ple
tes
Date
WCU survey completes by date
0%
5%
10%
15%
20%
25%
30%
35%
40%
45%
50%
55%
60%
65%
70%
75%
22 24 26 28 30 2 4 6 8 10 12 14 16 18 20 22 24 26 28 30 1 3 5 7 9 11 13 15 17 19 21 23
Re
spo
nse
rat
e
WCU Commuter Survey 2019Students Faculty Staff
Students 2018 Faculty 2018 Staff 2018
MAY JUNEAPRIL
West Chester University 2019 Commuter Survey Report Page 3
Assumptions about respondents and data
Capturing and recording the commuting behavior of large groups of people can become an enormously
complex enterprise. Budget, time, and effort (both respondent and researcher) can balloon if great
precision is required from smaller segments of the target population. Consistent and varying multimode
commutes are difficult to capture accurately2. However, previous studies indicated that about 85% of
commuters do travel nearly the same way every day and that “to” and “from” commutes were also
identical in most cases. Data from the current survey, in fact, confirmed (and exceeded) the percentage of
these habits, as did last year’s data. Thus, to stay within budget and time constraints, although multimode
commuting is still reported, this study relied on the fact that most people (85%+) have single mode, non-
variable commutes on the days they do commute.
Consequently, the survey instrument asked respondents to consider and describe their typical commute.
We asked what mode of transportation was used at least once per week, and then, in analysis, we assumed
that this mode was used on all the days respondents said they commuted. These simplifying assumptions
allowed for a cost-effective data collection, an instrument that was not burdensome for respondents, and,
we hoped, data that would be accurate enough to detect the effects of future interventions intended to alter
commuting behaviors at WCU.
Because a sample was drawn rather than a census, in some instances, no one may have reported a certain
commuting behavior (off-campus students using regional rail, for example). This does not mean that no
off-campus students use regional rail. It only means that in our randomly drawn sample, no one in this
group reported it. For most summary percentage data in this report, it is reasonable to assume they are
accurate to within roughly +/-4%, but the response may not be precise enough to capture very small
groups of people in some behavioral categories. Statistically, the more extreme the percentages (i.e., when
they are closer to 100% or to 0%), the lower the margin of error. For percentages closer to the middle
range (i.e., around 50%), the margin of error is larger. But this pattern is also contingent on size of
sample, with smaller ones having larger margins of error. Interested readers may consult the chart in
Appendix B showing margins of error for percentage data.
Relatedly, confidence intervals (that is, the margin of error on either side of reported point estimates) are
not displayed in the body of this report because readers usually ignore them or find them confusing when
processing the point estimates. All readers are advised that the point estimates are just that – estimates,
based on a sample. Standard errors, calculated from the raw data, are applied in the Conclusion section to
detect statistically significant changes in fuel use from the previous year.
Answers to most of the research questions in this study required projecting survey results to the whole
WCU population. This is a relatively simple calculation of weighting the data “up” to population size. For
example, if 100 randomly sampled people respond from a population of 1,000, we can sum a given
variable and then multiply by 10 to arrive at a reasonable estimate of the variable at the population level.
Weighting of this kind is done routinely for national economic and labor estimates, for instance, because
censuses are rarely performed. But because a sample was taken, there is necessarily a confidence interval,
a degree of uncertainty, that must be allowed for around the point estimate. This is the margin of error
referred to above.
2 Generally, to get accurate data for multimode commuting, respondents must know and record miles for each leg of their commute. Variable
multimode commutes (different each day) add complexity to observing and recording (using a diary or other medium) this small proportion of all commuting. With a $5 incentive and a short data collection period available, the diary method with its concurrent additional logistical demands was not a feasible protocol. In addition, matching the protocol to the previous year’s was also advantageous (“apples to apples”).
West Chester University 2019 Commuter Survey Report Page 4
In addition to sampling error, there are also unknown non-sampling errors that all surveys reports should
declare and which contribute to variation from the true values in the population. These errors may or may
not be biased, that is, lead to over- or under-estimates, rather than randomly affecting the point estimates.
Among the non-sampling errors is response bias, that non-respondents might have responded in a
different way from the respondents. Even if biases do exist, however, they will be less of a problem when
results are compared to a replication of the survey using the same instrument under similar conditions3.
In any case, broad population estimates are best measured and understood over time with as many data
points (sets) as possible. As expected, figures in the present report vary from last year’s report (although
not greatly), due to sampling, non-sampling, and other natural variation factors. While these factors can
never be eliminated, data from each successive year can increase our confidence that the survey results
are closer to the reality of the WCU community’s commuting profile.
3 To understand why bias is less problematic when a replication is performed, consider a weight loss program. Suppose the scale is biased by
adding 3 additional pounds to the clients. One weighs in at 210 at the beginning of the program – but the true weight is 207. At the end of the program, the reported weight is 185 (it’s a great program!), but the true weight is 182. The key statistic, accurately captured, is the loss of 25 pounds, which is unaffected by the bias in the scale. In the current situation, WCU interventions designed to affect commuting and parking habits are the equivalent of the weight loss program, and the survey is the scale. The degree to which the intervention is effective is unaffected by any bias, provided the same instrument is administered under similar conditions.
West Chester University 2019 Commuter Survey Report Page 5
RESULTS
Student drivers
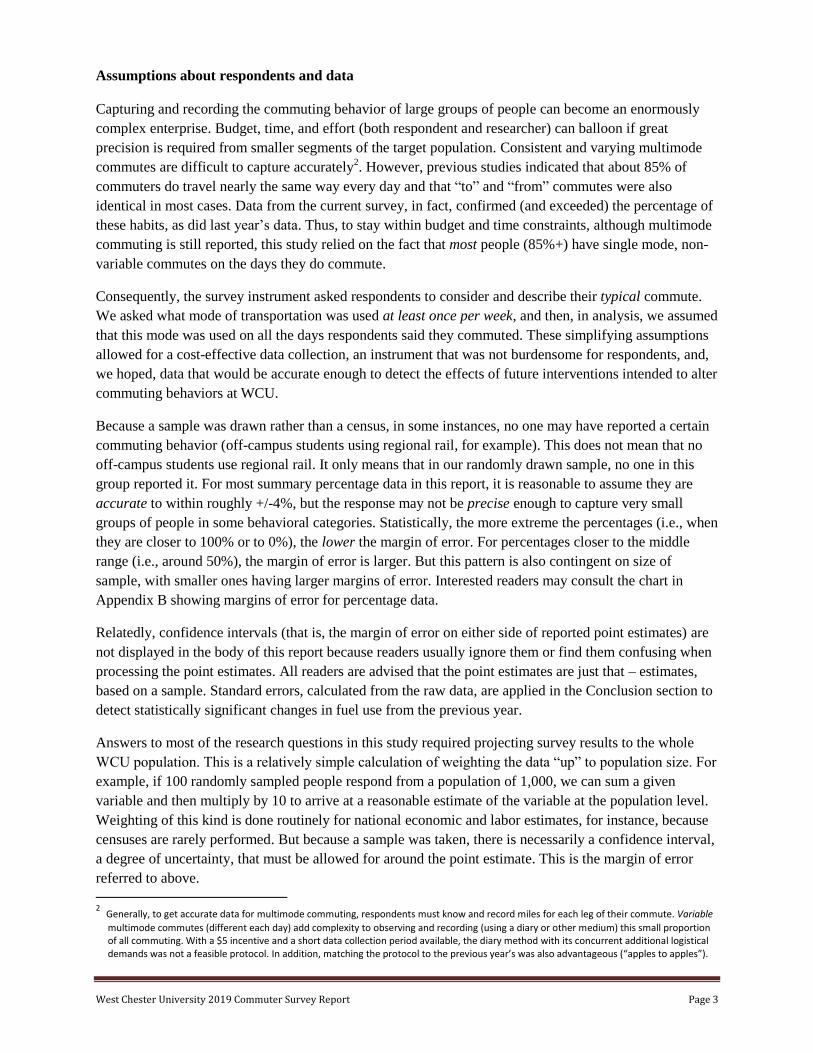
Of the 241 students who indicated they live on campus, 124 (51%) indicated they only walked to classes,
and 86 (36%) use the WCU shuttle at least once per week. However, 62 (26%)4 also say they drive at
least once per week to commute, though they live on campus. (This mode’s default commute distance was
set as one mile for on-campus students.)
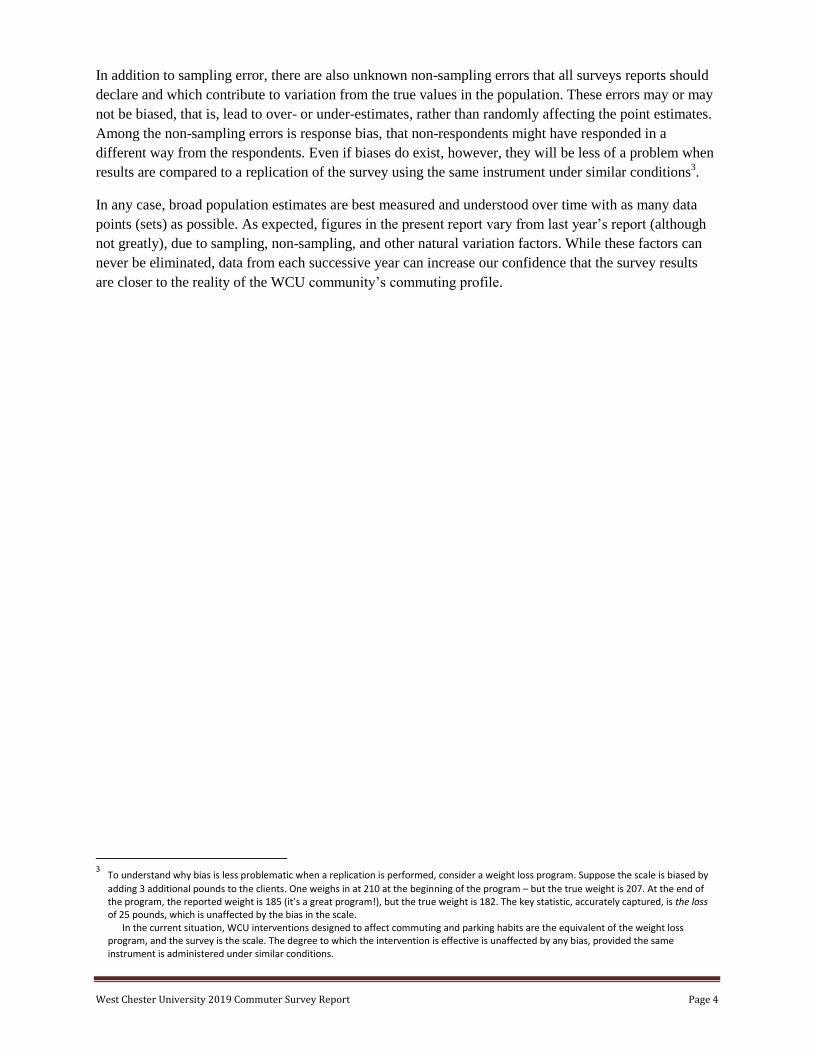
As expected, off-campus students, with 345 responding, have a very different transportation profile. The
majority (78%) report driving, with 39% walking (14% only walk). 11% say they carpool as passengers,
and 10% report using the shuttle.
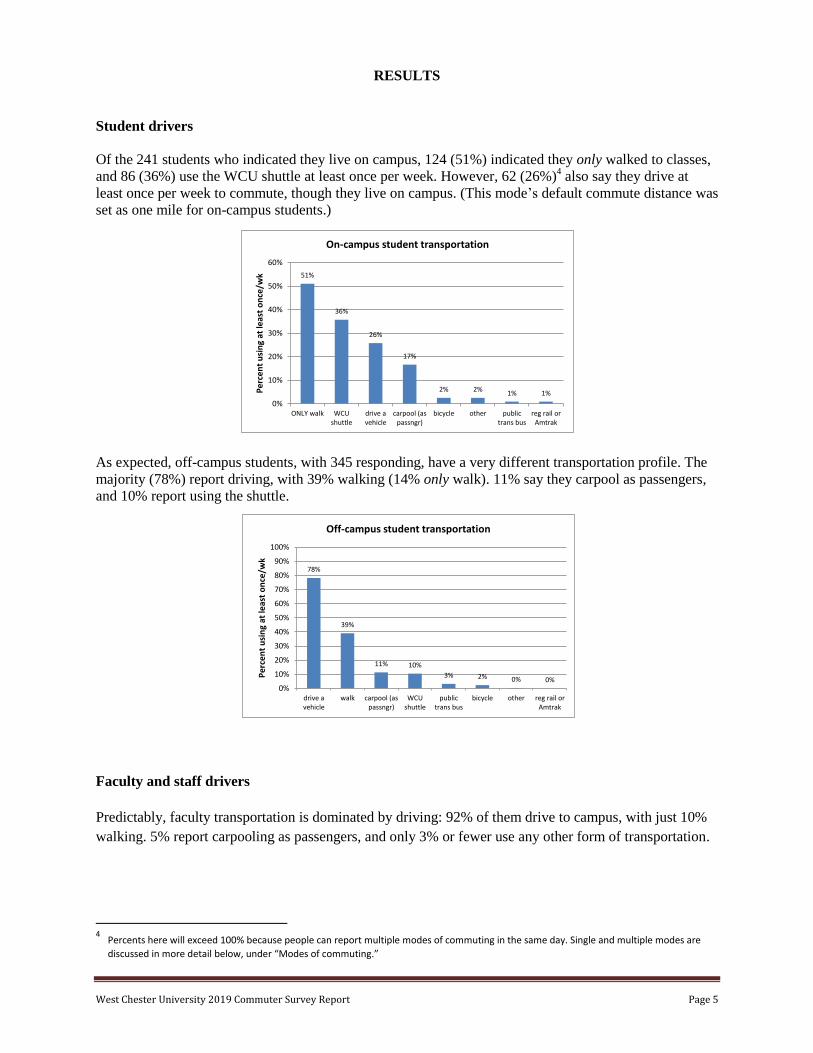
Faculty and staff drivers
Predictably, faculty transportation is dominated by driving: 92% of them drive to campus, with just 10%
walking. 5% report carpooling as passengers, and only 3% or fewer use any other form of transportation.
4 Percents here will exceed 100% because people can report multiple modes of commuting in the same day. Single and multiple modes are
discussed in more detail below, under “Modes of commuting.”
51%
36%
26%
17%
2% 2%1% 1%
0%
10%
20%
30%
40%
50%
60%
ONLY walk WCUshuttle
drive avehicle
carpool (aspassngr)
bicycle other publictrans bus
reg rail orAmtrak
Pe
rce
nt
usi
ng
at le
ast
on
ce/w
k
On-campus student transportation
78%
39%
11% 10%
3% 2% 0% 0%0%
10%
20%
30%
40%
50%
60%
70%
80%
90%
100%
drive avehicle
walk carpool (aspassngr)
WCUshuttle
publictrans bus
bicycle other reg rail orAmtrak
Pe
rce
nt
usi
ng
at le
ast
on
ce/w
k
Off-campus student transportation
West Chester University 2019 Commuter Survey Report Page 6
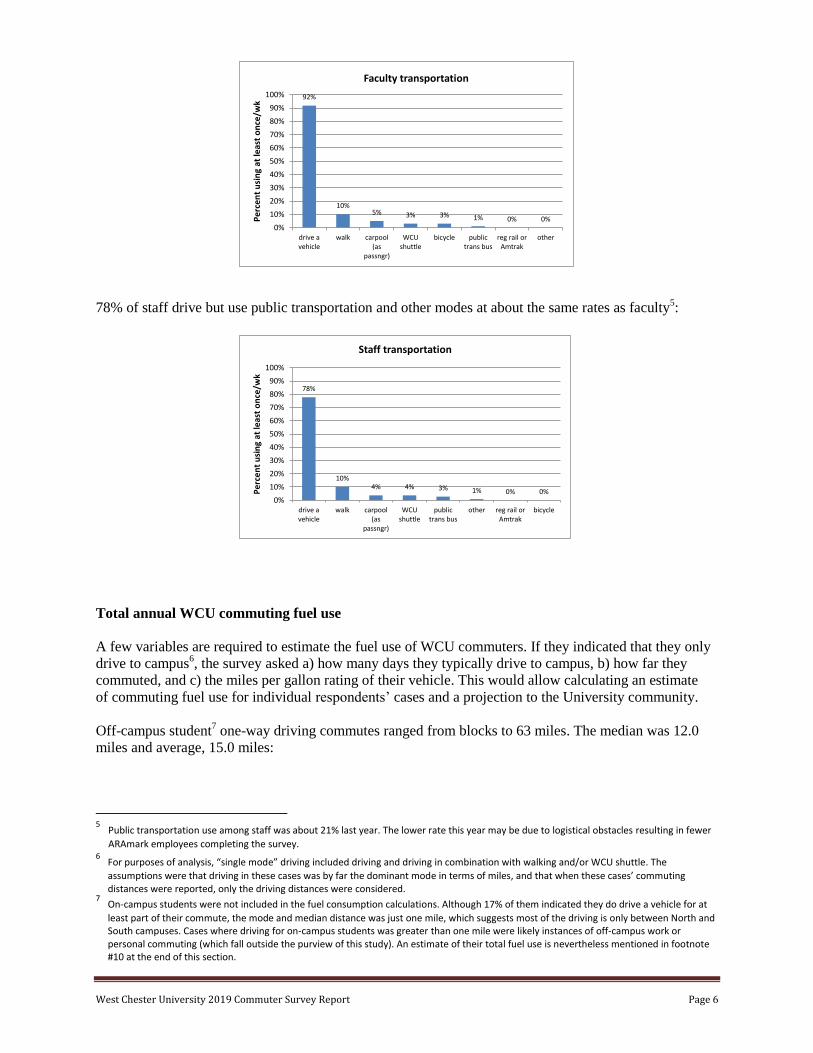
78% of staff drive but use public transportation and other modes at about the same rates as faculty5:
Total annual WCU commuting fuel use
A few variables are required to estimate the fuel use of WCU commuters. If they indicated that they only
drive to campus6, the survey asked a) how many days they typically drive to campus, b) how far they
commuted, and c) the miles per gallon rating of their vehicle. This would allow calculating an estimate
of commuting fuel use for individual respondents’ cases and a projection to the University community.
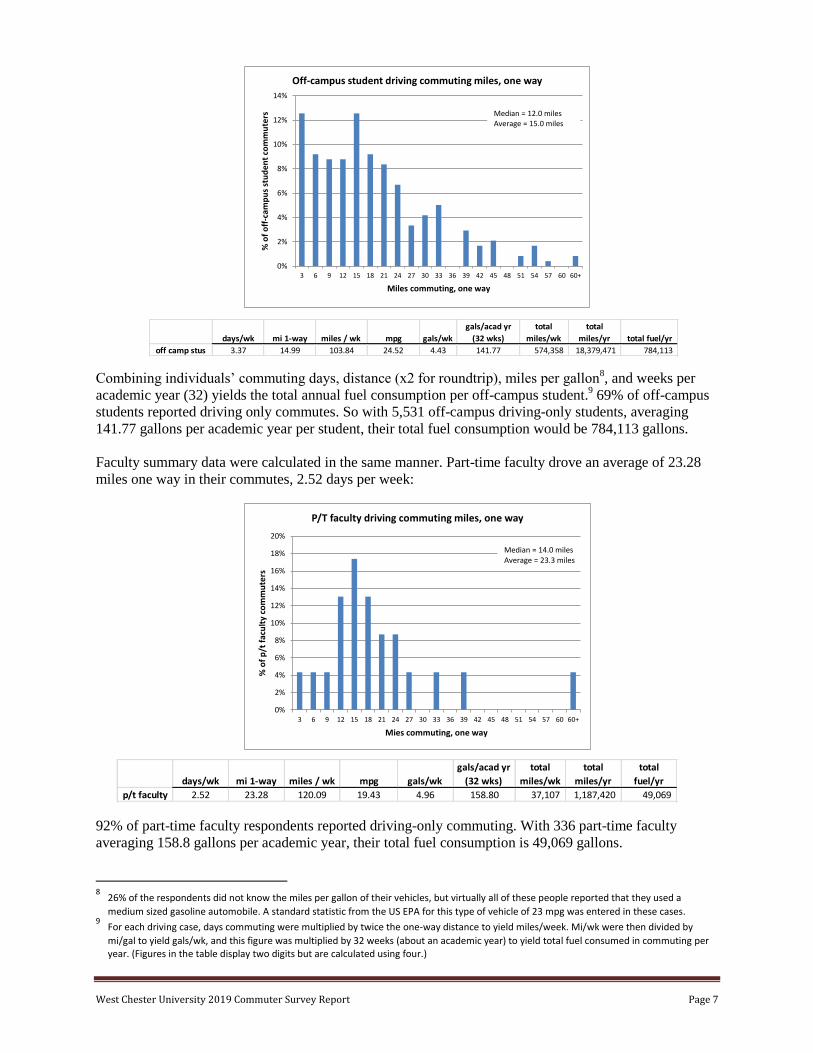
Off-campus student7 one-way driving commutes ranged from blocks to 63 miles. The median was 12.0
miles and average, 15.0 miles:
5 Public transportation use among staff was about 21% last year. The lower rate this year may be due to logistical obstacles resulting in fewer
ARAmark employees completing the survey. 6 For purposes of analysis, “single mode” driving included driving and driving in combination with walking and/or WCU shuttle. The
assumptions were that driving in these cases was by far the dominant mode in terms of miles, and that when these cases’ commuting distances were reported, only the driving distances were considered.
7 On-campus students were not included in the fuel consumption calculations. Although 17% of them indicated they do drive a vehicle for at
least part of their commute, the mode and median distance was just one mile, which suggests most of the driving is only between North and South campuses. Cases where driving for on-campus students was greater than one mile were likely instances of off-campus work or personal commuting (which fall outside the purview of this study). An estimate of their total fuel use is nevertheless mentioned in footnote #10 at the end of this section.
78%
10%4% 4% 3% 1% 0% 0%
0%
10%
20%
30%
40%
50%
60%
70%
80%
90%
100%
drive avehicle
walk carpool(as
passngr)
WCUshuttle
publictrans bus
other reg rail orAmtrak
bicycle
Pe
rce
nt
usi
ng
at le
ast
on
ce/w
k
Staff transportation
92%
10%5% 3% 3% 1% 0% 0%
0%
10%
20%
30%
40%
50%
60%
70%
80%
90%
100%
drive avehicle
walk carpool(as
passngr)
WCUshuttle
bicycle publictrans bus
reg rail orAmtrak
other
Pe
rce
nt
usi
ng
at le
ast
on
ce/w
k
Faculty transportation
West Chester University 2019 Commuter Survey Report Page 7
Combining individuals’ commuting days, distance (x2 for roundtrip), miles per gallon8, and weeks per
academic year (32) yields the total annual fuel consumption per off-campus student.9 69% of off-campus
students reported driving only commutes. So with 5,531 off-campus driving-only students, averaging
141.77 gallons per academic year per student, their total fuel consumption would be 784,113 gallons.
Faculty summary data were calculated in the same manner. Part-time faculty drove an average of 23.28
miles one way in their commutes, 2.52 days per week:
92% of part-time faculty respondents reported driving-only commuting. With 336 part-time faculty
averaging 158.8 gallons per academic year, their total fuel consumption is 49,069 gallons.
8 26% of the respondents did not know the miles per gallon of their vehicles, but virtually all of these people reported that they used a
medium sized gasoline automobile. A standard statistic from the US EPA for this type of vehicle of 23 mpg was entered in these cases. 9 For each driving case, days commuting were multiplied by twice the one-way distance to yield miles/week. Mi/wk were then divided by
mi/gal to yield gals/wk, and this figure was multiplied by 32 weeks (about an academic year) to yield total fuel consumed in commuting per year. (Figures in the table display two digits but are calculated using four.)
days/wk mi 1-way miles / wk mpg gals/wk
gals/acad yr
(32 wks)
total
miles/wk
total
miles/yr
total
fuel/yr
p/t faculty 2.52 23.28 120.09 19.43 4.96 158.80 37,107 1,187,420 49,069
days/wk mi 1-way miles / wk mpg gals/wk
gals/acad yr
(32 wks)
total
miles/wk
total
miles/yr total fuel/yr
off camp stus 3.37 14.99 103.84 24.52 4.43 141.77 574,358 18,379,471 784,113
0%
2%
4%
6%
8%
10%
12%
14%
3 6 9 12 15 18 21 24 27 30 33 36 39 42 45 48 51 54 57 60 60+
% o
f o
ff-c
amp
us
stu
de
nt
com
mu
ters
Miles commuting, one way
Off-campus student driving commuting miles, one way
Median = 12.0 milesAverage = 15.0 miles
0%
2%
4%
6%
8%
10%
12%
14%
16%
18%
20%
3 6 9 12 15 18 21 24 27 30 33 36 39 42 45 48 51 54 57 60 60+
% o
f p
/t f
acu
lty
com
mu
ters
Mies commuting, one way
P/T faculty driving commuting miles, one way
Median = 14.0 milesAverage = 23.3 miles
West Chester University 2019 Commuter Survey Report Page 8
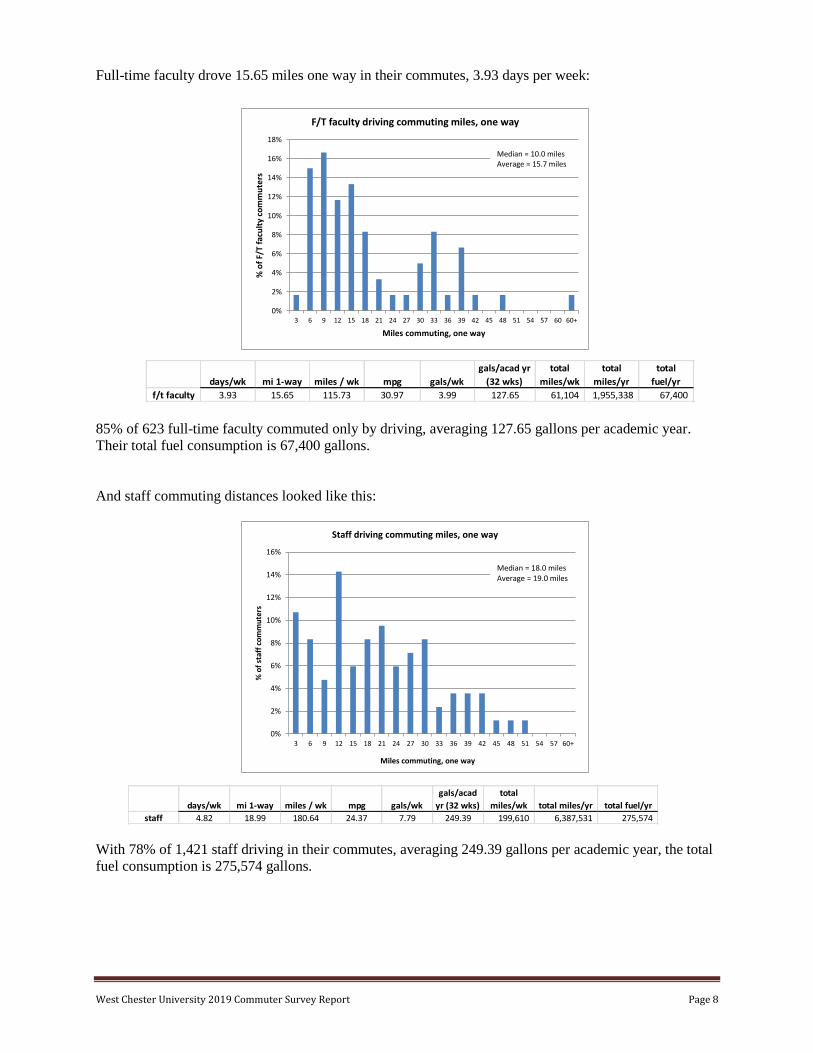
Full-time faculty drove 15.65 miles one way in their commutes, 3.93 days per week:
85% of 623 full-time faculty commuted only by driving, averaging 127.65 gallons per academic year.
Their total fuel consumption is 67,400 gallons.
And staff commuting distances looked like this:
With 78% of 1,421 staff driving in their commutes, averaging 249.39 gallons per academic year, the total
fuel consumption is 275,574 gallons.
days/wk mi 1-way miles / wk mpg gals/wk
gals/acad yr
(32 wks)
total
miles/wk
total
miles/yr
total
fuel/yr
f/t faculty 3.93 15.65 115.73 30.97 3.99 127.65 61,104 1,955,338 67,400
days/wk mi 1-way miles / wk mpg gals/wk
gals/acad
yr (32 wks)
total
miles/wk total miles/yr total fuel/yr
staff 4.82 18.99 180.64 24.37 7.79 249.39 199,610 6,387,531 275,574
0%
2%
4%
6%
8%
10%
12%
14%
16%
18%
3 6 9 12 15 18 21 24 27 30 33 36 39 42 45 48 51 54 57 60 60+
% o
f F/
T fa
cult
y co
mm
ute
rs
Miles commuting, one way
F/T faculty driving commuting miles, one way
Median = 10.0 milesAverage = 15.7 miles
0%
2%
4%
6%
8%
10%
12%
14%
16%
3 6 9 12 15 18 21 24 27 30 33 36 39 42 45 48 51 54 57 60+
% o
f st
aff
com
mu
ters
Miles commuting, one way
Staff driving commuting miles, one way
Median = 18.0 milesAverage = 19.0 miles
West Chester University 2019 Commuter Survey Report Page 9
Total drive-only fuel consumption, then, for off-campus students, faculty, and staff at the University is
36,923 gallons per week or 1,176,156 gallons per year10
, equivalent to the volume of nearly two Olympic
swimming pools. All single-mode drivers accumulate approximately 872,180 miles per week in their
commutes, which is nearly 28 million miles per year.
Modes of commuting
Students, faculty, and staff vary in commuting to campus, although all three groups have a very high
proportion of driving cars as their single mode of transportation11
. There are a few other modes
(“alternative” modes) that are used in much smaller degree and in various combinations, as shown in the
following charts.
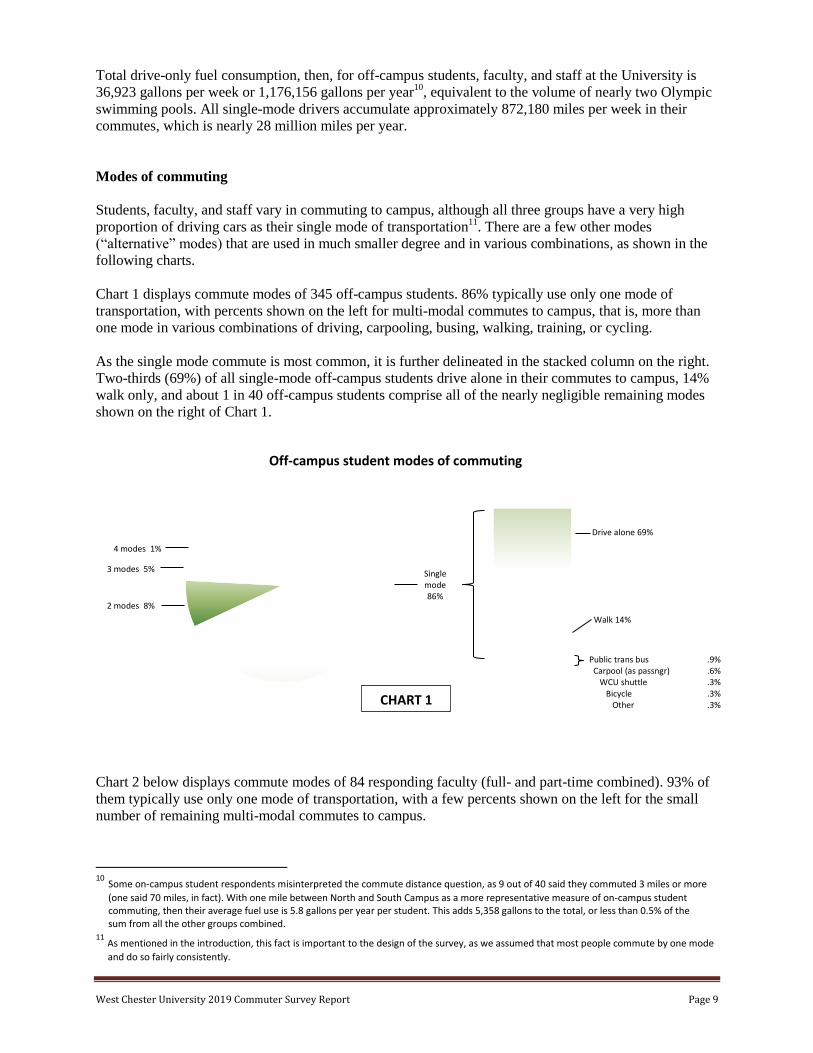
Chart 1 displays commute modes of 345 off-campus students. 86% typically use only one mode of
transportation, with percents shown on the left for multi-modal commutes to campus, that is, more than
one mode in various combinations of driving, carpooling, busing, walking, training, or cycling.
As the single mode commute is most common, it is further delineated in the stacked column on the right.
Two-thirds (69%) of all single-mode off-campus students drive alone in their commutes to campus, 14%
walk only, and about 1 in 40 off-campus students comprise all of the nearly negligible remaining modes
shown on the right of Chart 1.
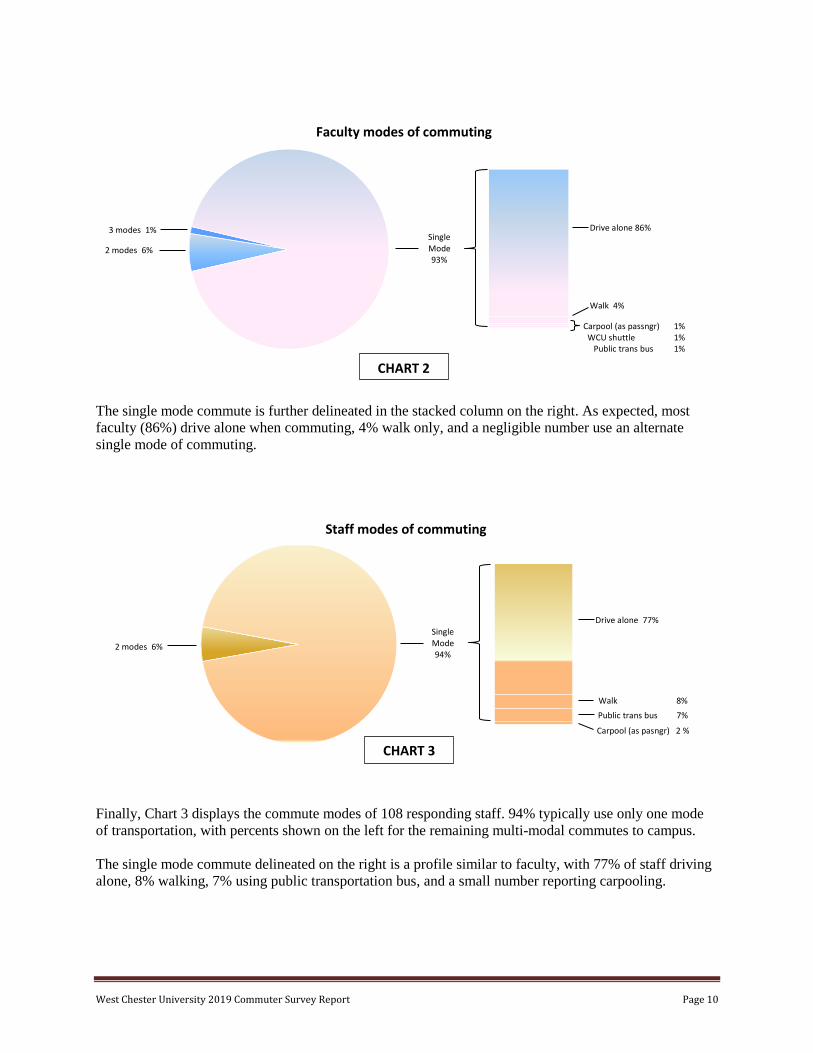
Chart 2 below displays commute modes of 84 responding faculty (full- and part-time combined). 93% of
them typically use only one mode of transportation, with a few percents shown on the left for the small
number of remaining multi-modal commutes to campus.
10
Some on-campus student respondents misinterpreted the commute distance question, as 9 out of 40 said they commuted 3 miles or more
(one said 70 miles, in fact). With one mile between North and South Campus as a more representative measure of on-campus student commuting, then their average fuel use is 5.8 gallons per year per student. This adds 5,358 gallons to the total, or less than 0.5% of the sum from all the other groups combined.
11 As mentioned in the introduction, this fact is important to the design of the survey, as we assumed that most people commute by one mode
and do so fairly consistently.
4 modes 1%
3 modes 5%
2 modes 8%
Single mode 86%
Public trans bus .9% Carpool (as passngr) .6% WCU shuttle .3% Bicycle .3% Other .3%
Walk 14%
Drive alone 69%
Off-campus student modes of commuting
CHART 1
West Chester University 2019 Commuter Survey Report Page 10
The single mode commute is further delineated in the stacked column on the right. As expected, most
faculty (86%) drive alone when commuting, 4% walk only, and a negligible number use an alternate
single mode of commuting.
Finally, Chart 3 displays the commute modes of 108 responding staff. 94% typically use only one mode
of transportation, with percents shown on the left for the remaining multi-modal commutes to campus.
The single mode commute delineated on the right is a profile similar to faculty, with 77% of staff driving
alone, 8% walking, 7% using public transportation bus, and a small number reporting carpooling.
Single Mode 94%
2 modes 6%
Drive alone 77%
Public trans bus 7%
Walk 8%
Carpool (as pasngr) 2 %
Staff modes of commuting
CHART 3
Faculty modes of commuting
CHART 2
2 modes 6%
3 modes 1% Single Mode 93%
Drive alone 86%
Walk 4%
Carpool (as passngr) 1% WCU shuttle 1% Public trans bus 1%
West Chester University 2019 Commuter Survey Report Page 11
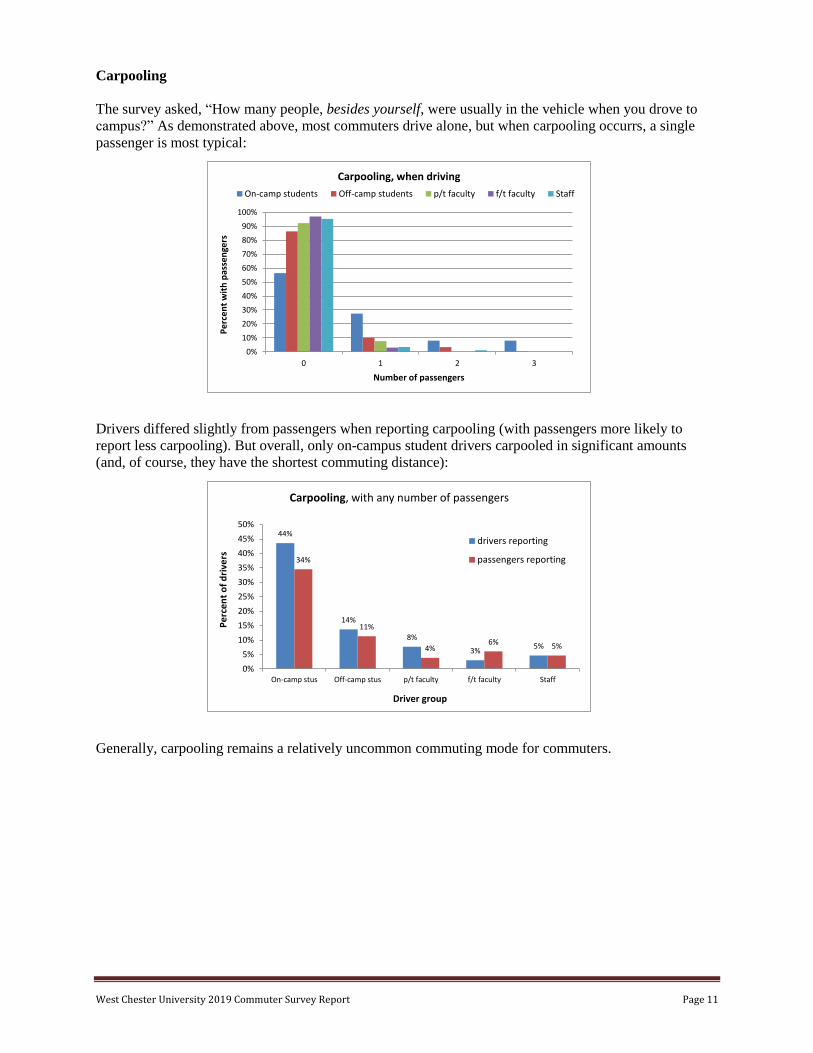
Carpooling
The survey asked, “How many people, besides yourself, were usually in the vehicle when you drove to
campus?” As demonstrated above, most commuters drive alone, but when carpooling occurrs, a single
passenger is most typical:
Drivers differed slightly from passengers when reporting carpooling (with passengers more likely to
report less carpooling). But overall, only on-campus student drivers carpooled in significant amounts
(and, of course, they have the shortest commuting distance):
Generally, carpooling remains a relatively uncommon commuting mode for commuters.
44%
14%
8%
3%5%
34%
11%
4%6% 5%
0%
5%
10%
15%
20%
25%
30%
35%
40%
45%
50%
On-camp stus Off-camp stus p/t faculty f/t faculty Staff
Pe
rce
nt
of
dri
vers
Driver group
Carpooling, with any number of passengers
drivers reporting
passengers reporting
0%
10%
20%
30%
40%
50%
60%
70%
80%
90%
100%
0 1 2 3
Pe
rce
nt
wit
h p
asse
nge
rs
Number of passengers
Carpooling, when driving
On-camp students Off-camp students p/t faculty f/t faculty Staff
West Chester University 2019 Commuter Survey Report Page 12
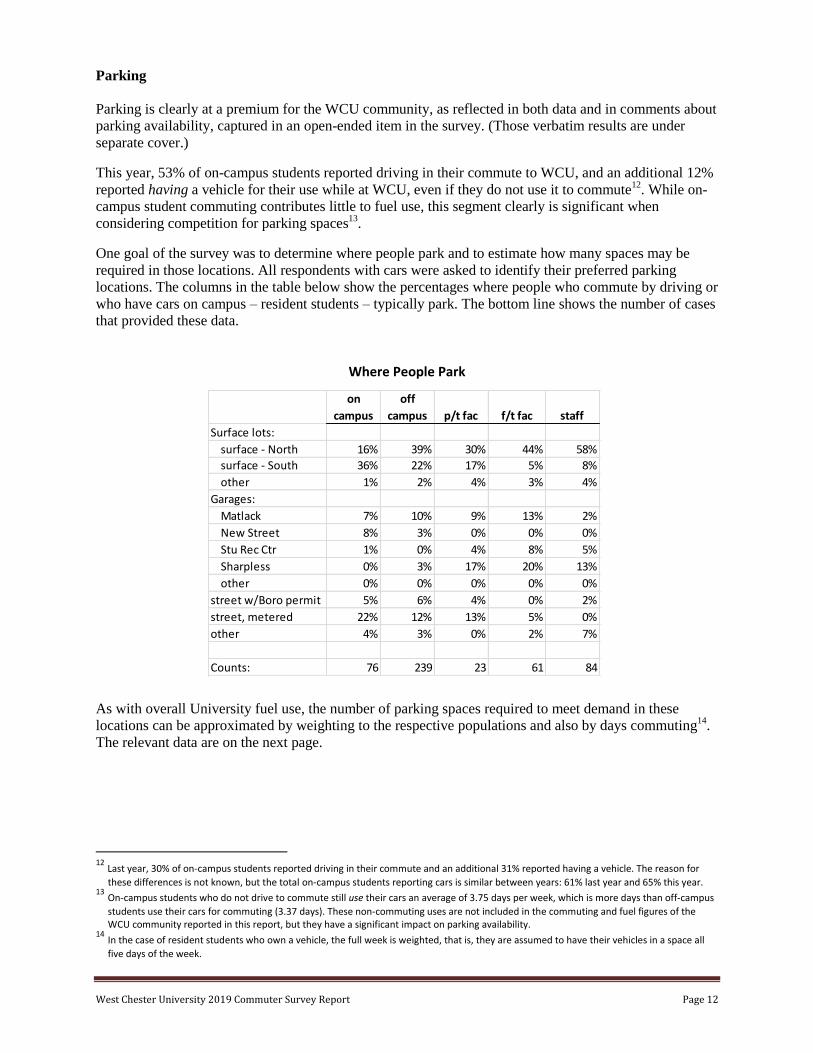
Parking
Parking is clearly at a premium for the WCU community, as reflected in both data and in comments about
parking availability, captured in an open-ended item in the survey. (Those verbatim results are under
separate cover.)
This year, 53% of on-campus students reported driving in their commute to WCU, and an additional 12%
reported having a vehicle for their use while at WCU, even if they do not use it to commute12
. While on-
campus student commuting contributes little to fuel use, this segment clearly is significant when
considering competition for parking spaces13
.
One goal of the survey was to determine where people park and to estimate how many spaces may be
required in those locations. All respondents with cars were asked to identify their preferred parking
locations. The columns in the table below show the percentages where people who commute by driving or
who have cars on campus – resident students – typically park. The bottom line shows the number of cases
that provided these data.
Where People Park
As with overall University fuel use, the number of parking spaces required to meet demand in these
locations can be approximated by weighting to the respective populations and also by days commuting14
.
The relevant data are on the next page.
12
Last year, 30% of on-campus students reported driving in their commute and an additional 31% reported having a vehicle. The reason for
these differences is not known, but the total on-campus students reporting cars is similar between years: 61% last year and 65% this year. 13
On-campus students who do not drive to commute still use their cars an average of 3.75 days per week, which is more days than off-campus
students use their cars for commuting (3.37 days). These non-commuting uses are not included in the commuting and fuel figures of the WCU community reported in this report, but they have a significant impact on parking availability.
14 In the case of resident students who own a vehicle, the full week is weighted, that is, they are assumed to have their vehicles in a space all
five days of the week.
on
campus
off
campus p/t fac f/t fac staff
Surface lots:
surface - North 16% 39% 30% 44% 58%
surface - South 36% 22% 17% 5% 8%
other 1% 2% 4% 3% 4%
Garages:
Matlack 7% 10% 9% 13% 2%
New Street 8% 3% 0% 0% 0%
Stu Rec Ctr 1% 0% 4% 8% 5%
Sharpless 0% 3% 17% 20% 13%
other 0% 0% 0% 0% 0%
street w/Boro permit 5% 6% 4% 0% 2%
street, metered 22% 12% 13% 5% 0%
other 4% 3% 0% 2% 7%
Counts: 76 239 23 61 84
West Chester University 2019 Commuter Survey Report Page 13
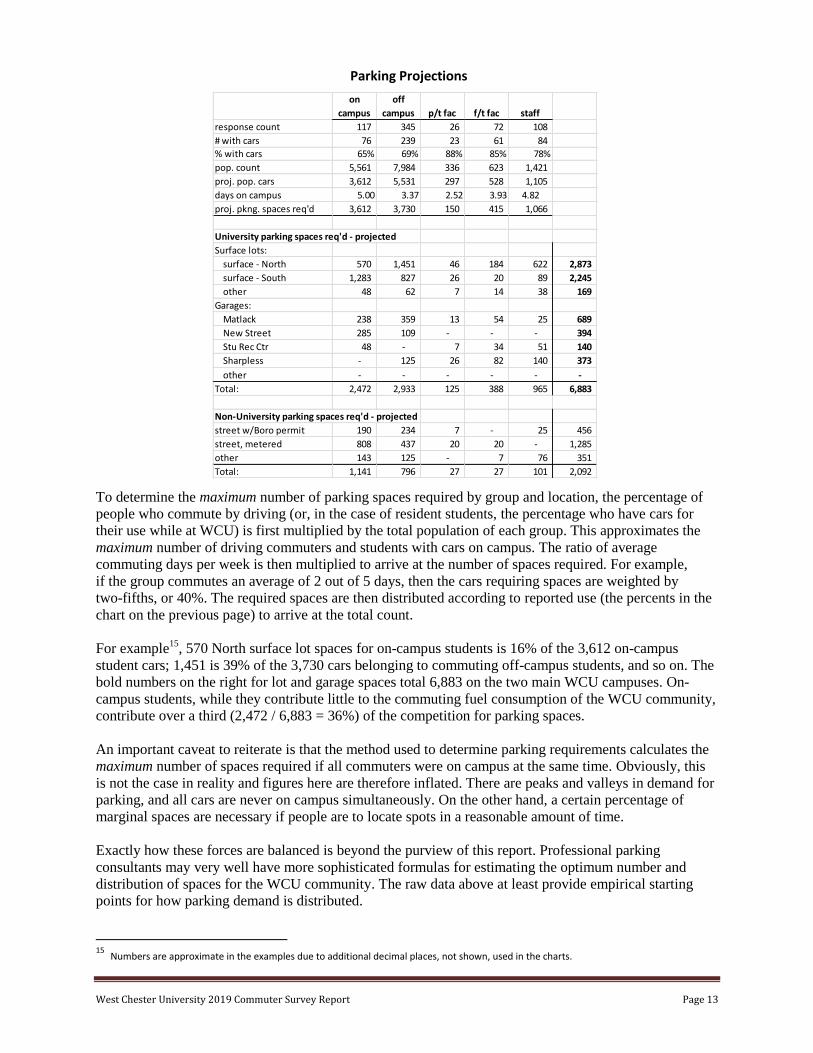
Parking Projections
To determine the maximum number of parking spaces required by group and location, the percentage of
people who commute by driving (or, in the case of resident students, the percentage who have cars for
their use while at WCU) is first multiplied by the total population of each group. This approximates the
maximum number of driving commuters and students with cars on campus. The ratio of average
commuting days per week is then multiplied to arrive at the number of spaces required. For example,
if the group commutes an average of 2 out of 5 days, then the cars requiring spaces are weighted by
two-fifths, or 40%. The required spaces are then distributed according to reported use (the percents in the
chart on the previous page) to arrive at the total count.
For example15
, 570 North surface lot spaces for on-campus students is 16% of the 3,612 on-campus
student cars; 1,451 is 39% of the 3,730 cars belonging to commuting off-campus students, and so on. The
bold numbers on the right for lot and garage spaces total 6,883 on the two main WCU campuses. On-
campus students, while they contribute little to the commuting fuel consumption of the WCU community,
contribute over a third (2,472 / 6,883 = 36%) of the competition for parking spaces.
An important caveat to reiterate is that the method used to determine parking requirements calculates the
maximum number of spaces required if all commuters were on campus at the same time. Obviously, this
is not the case in reality and figures here are therefore inflated. There are peaks and valleys in demand for
parking, and all cars are never on campus simultaneously. On the other hand, a certain percentage of
marginal spaces are necessary if people are to locate spots in a reasonable amount of time.
Exactly how these forces are balanced is beyond the purview of this report. Professional parking
consultants may very well have more sophisticated formulas for estimating the optimum number and
distribution of spaces for the WCU community. The raw data above at least provide empirical starting
points for how parking demand is distributed.
15
Numbers are approximate in the examples due to additional decimal places, not shown, used in the charts.
on
campus
off
campus p/t fac f/t fac staff
response count 117 345 26 72 108
# with cars 76 239 23 61 84
% with cars 65% 69% 88% 85% 78%
pop. count 5,561 7,984 336 623 1,421
proj. pop. cars 3,612 5,531 297 528 1,105
days on campus 5.00 3.37 2.52 3.93 4.82
proj. pkng. spaces req'd 3,612 3,730 150 415 1,066
University parking spaces req'd - projected
Surface lots:
surface - North 570 1,451 46 184 622 2,873
surface - South 1,283 827 26 20 89 2,245
other 48 62 7 14 38 169
Garages:
Matlack 238 359 13 54 25 689
New Street 285 109 - - - 394
Stu Rec Ctr 48 - 7 34 51 140
Sharpless - 125 26 82 140 373
other - - - - - -
Total: 2,472 2,933 125 388 965 6,883
Non-University parking spaces req'd - projected
street w/Boro permit 190 234 7 - 25 456
street, metered 808 437 20 20 - 1,285
other 143 125 - 7 76 351
Total: 1,141 796 27 27 101 2,092
West Chester University 2019 Commuter Survey Report Page 14
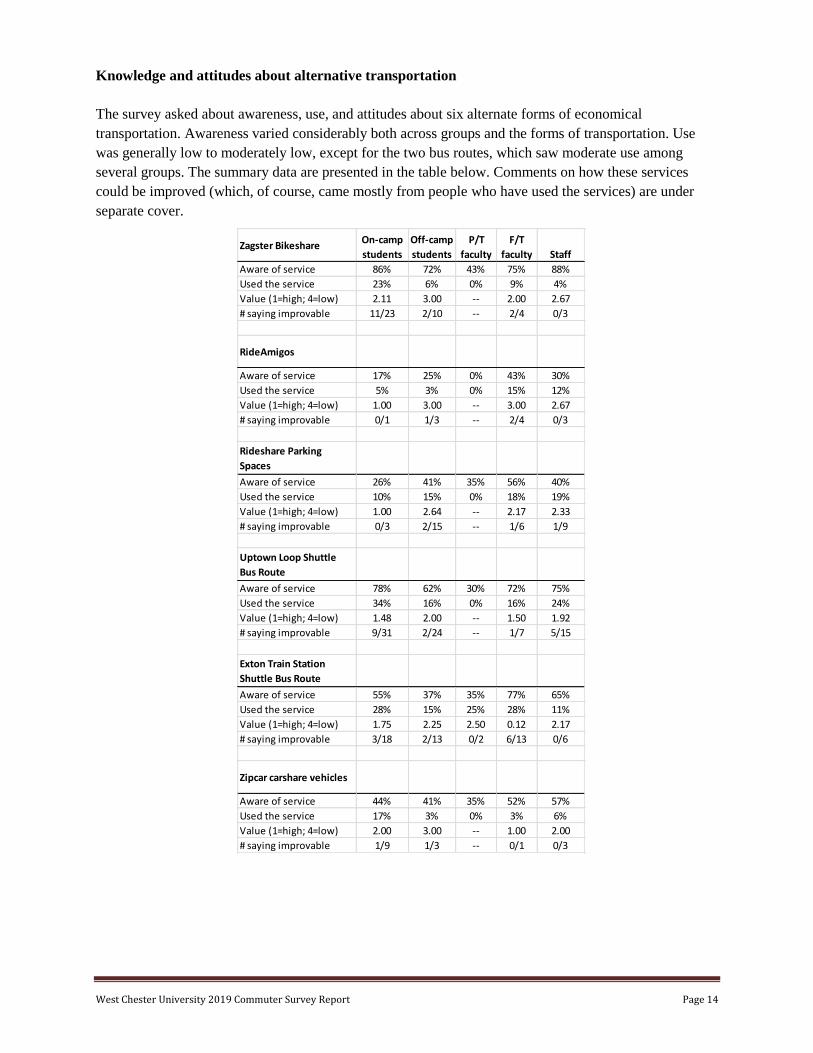
Knowledge and attitudes about alternative transportation
The survey asked about awareness, use, and attitudes about six alternate forms of economical
transportation. Awareness varied considerably both across groups and the forms of transportation. Use
was generally low to moderately low, except for the two bus routes, which saw moderate use among
several groups. The summary data are presented in the table below. Comments on how these services
could be improved (which, of course, came mostly from people who have used the services) are under
separate cover.
Zagster BikeshareOn-camp
students
Off-camp
students
P/T
faculty
F/T
faculty Staff
Aware of service 86% 72% 43% 75% 88%
Used the service 23% 6% 0% 9% 4%
Value (1=high; 4=low) 2.11 3.00 -- 2.00 2.67
# saying improvable 11/23 2/10 -- 2/4 0/3
RideAmigos
Aware of service 17% 25% 0% 43% 30%
Used the service 5% 3% 0% 15% 12%
Value (1=high; 4=low) 1.00 3.00 -- 3.00 2.67
# saying improvable 0/1 1/3 -- 2/4 0/3
Rideshare Parking
Spaces
Aware of service 26% 41% 35% 56% 40%
Used the service 10% 15% 0% 18% 19%
Value (1=high; 4=low) 1.00 2.64 -- 2.17 2.33
# saying improvable 0/3 2/15 -- 1/6 1/9
Uptown Loop Shuttle
Bus Route
Aware of service 78% 62% 30% 72% 75%
Used the service 34% 16% 0% 16% 24%
Value (1=high; 4=low) 1.48 2.00 -- 1.50 1.92
# saying improvable 9/31 2/24 -- 1/7 5/15
Exton Train Station
Shuttle Bus Route
Aware of service 55% 37% 35% 77% 65%
Used the service 28% 15% 25% 28% 11%
Value (1=high; 4=low) 1.75 2.25 2.50 0.12 2.17
# saying improvable 3/18 2/13 0/2 6/13 0/6
Zipcar carshare vehicles
Aware of service 44% 41% 35% 52% 57%
Used the service 17% 3% 0% 3% 6%
Value (1=high; 4=low) 2.00 3.00 -- 1.00 2.00
# saying improvable 1/9 1/3 -- 0/1 0/3
West Chester University 2019 Commuter Survey Report Page 15
CONCLUSION
Comparing 2018 and 2019 results
With about a 40% response rate last year and 35% this year, a reasonable question to ask is how close are
the two survey results? If they are fairly close, we can have some assurance that response bias, at least,
has not greatly changed the data. But as with any complex phenomena, multiple data points help us to
zero in on the reality of the variables, and trend lines are especially helpful in this regard. So two data
points not only supply confidence in the instrument and survey methods (where results are close), but
they also begin the process of establishing trends that contribute to understanding the phenomena under
scrutiny. To this end, key survey results from both years are compared in the following tables.
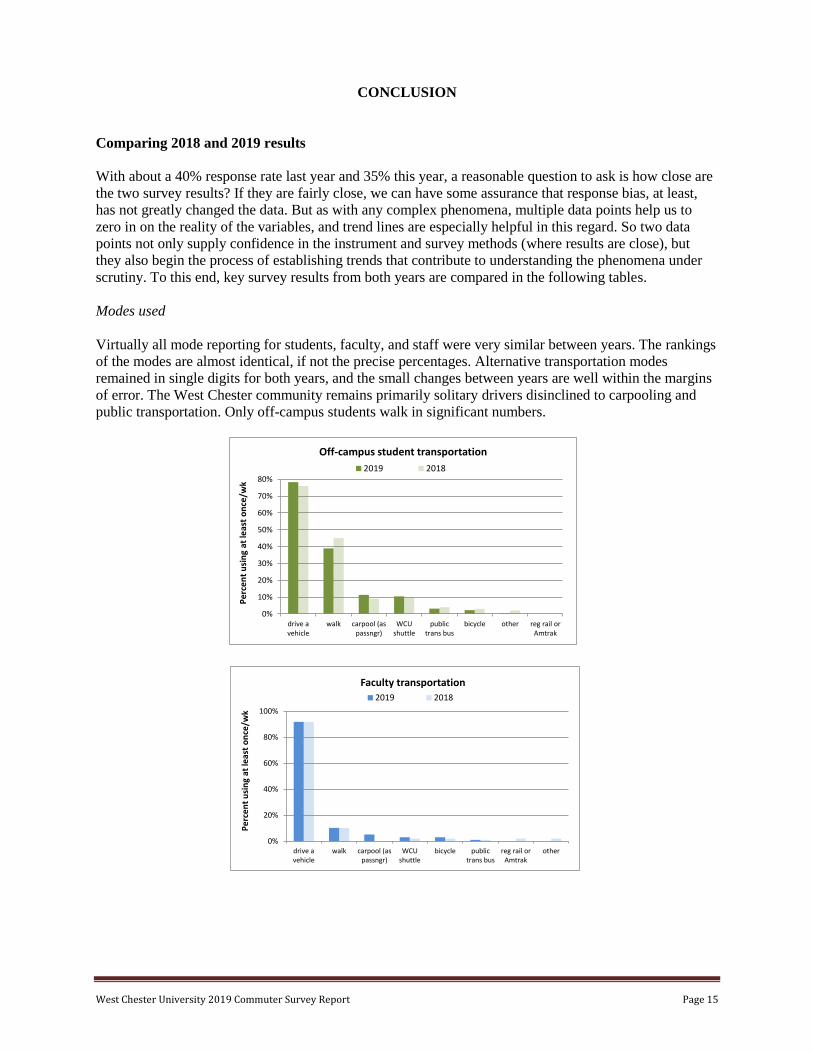
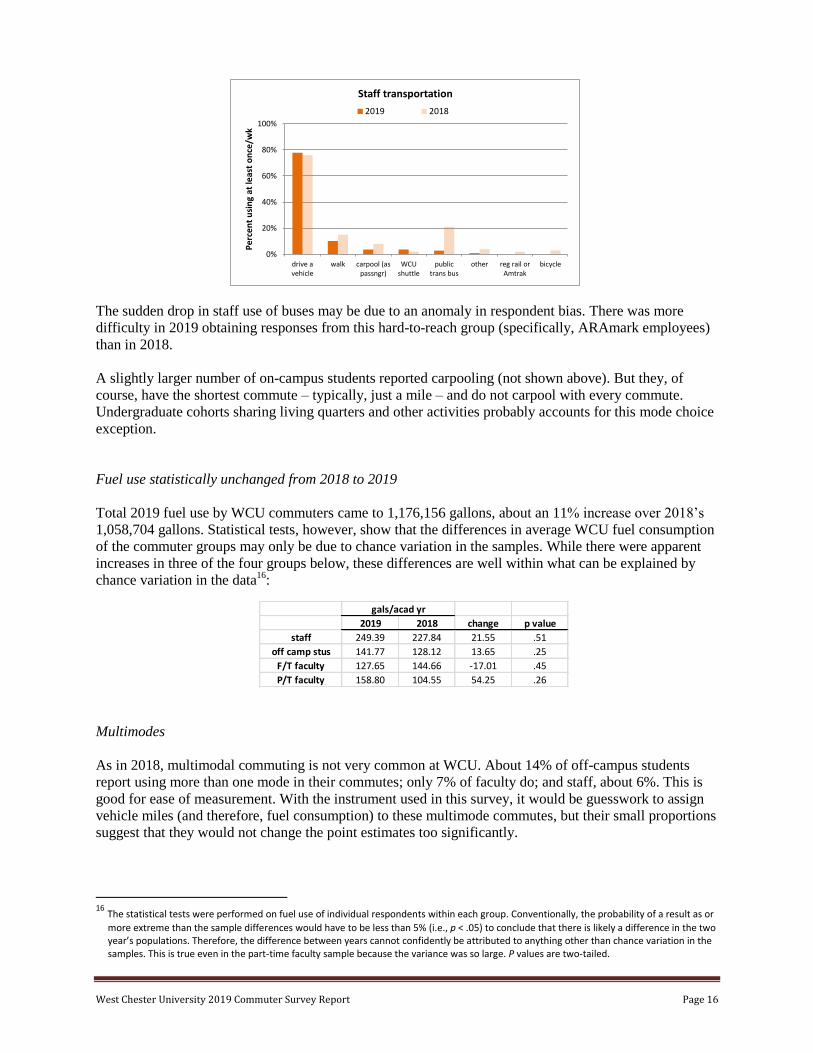
Modes used
Virtually all mode reporting for students, faculty, and staff were very similar between years. The rankings
of the modes are almost identical, if not the precise percentages. Alternative transportation modes
remained in single digits for both years, and the small changes between years are well within the margins
of error. The West Chester community remains primarily solitary drivers disinclined to carpooling and
public transportation. Only off-campus students walk in significant numbers.
0%
10%
20%
30%
40%
50%
60%
70%
80%
drive avehicle
walk carpool (aspassngr)
WCUshuttle
publictrans bus
bicycle other reg rail orAmtrak
Pe
rce
nt
usi
ng
at le
ast
on
ce/w
k
Off-campus student transportation
2019 2018
0%
20%
40%
60%
80%
100%
drive avehicle
walk carpool (aspassngr)
WCUshuttle
bicycle publictrans bus
reg rail orAmtrak
other
Pe
rce
nt
usi
ng
at le
ast
on
ce/w
k
Faculty transportation
2019 2018
West Chester University 2019 Commuter Survey Report Page 16
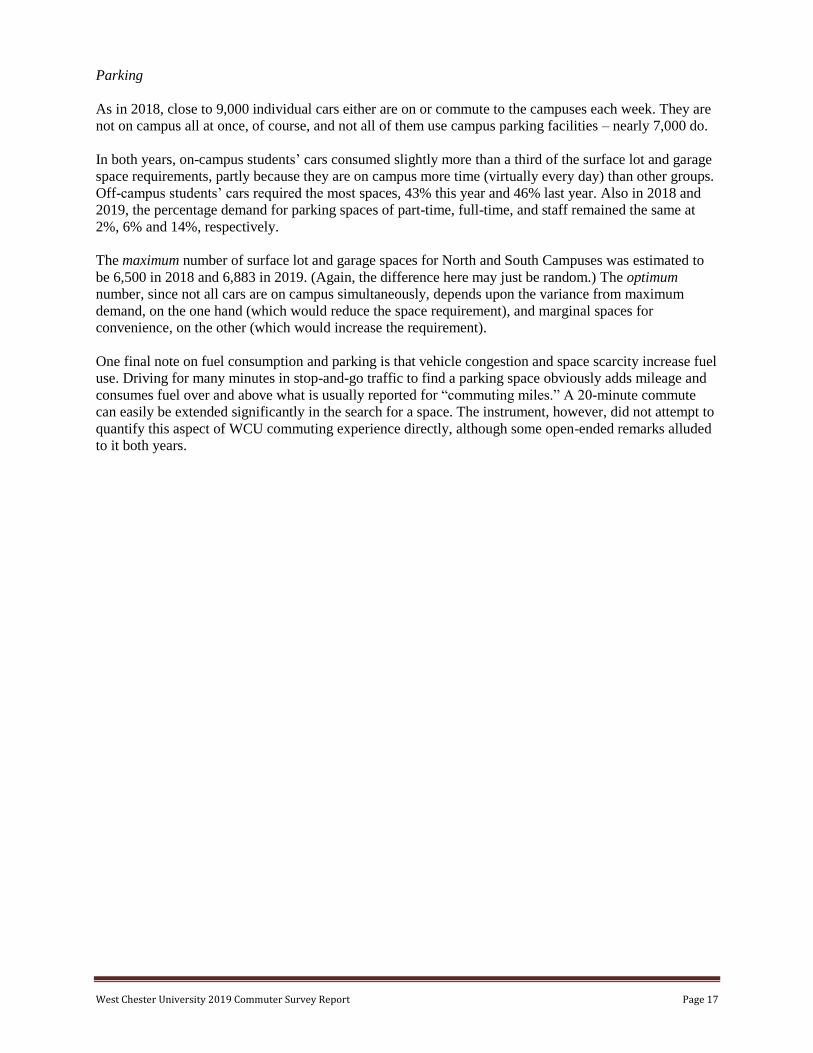
The sudden drop in staff use of buses may be due to an anomaly in respondent bias. There was more
difficulty in 2019 obtaining responses from this hard-to-reach group (specifically, ARAmark employees)
than in 2018.
A slightly larger number of on-campus students reported carpooling (not shown above). But they, of
course, have the shortest commute – typically, just a mile – and do not carpool with every commute.
Undergraduate cohorts sharing living quarters and other activities probably accounts for this mode choice
exception.
Fuel use statistically unchanged from 2018 to 2019
Total 2019 fuel use by WCU commuters came to 1,176,156 gallons, about an 11% increase over 2018’s
1,058,704 gallons. Statistical tests, however, show that the differences in average WCU fuel consumption
of the commuter groups may only be due to chance variation in the samples. While there were apparent
increases in three of the four groups below, these differences are well within what can be explained by
chance variation in the data16
:
Multimodes
As in 2018, multimodal commuting is not very common at WCU. About 14% of off-campus students
report using more than one mode in their commutes; only 7% of faculty do; and staff, about 6%. This is
good for ease of measurement. With the instrument used in this survey, it would be guesswork to assign
vehicle miles (and therefore, fuel consumption) to these multimode commutes, but their small proportions
suggest that they would not change the point estimates too significantly.
16
The statistical tests were performed on fuel use of individual respondents within each group. Conventionally, the probability of a result as or
more extreme than the sample differences would have to be less than 5% (i.e., p < .05) to conclude that there is likely a difference in the two year’s populations. Therefore, the difference between years cannot confidently be attributed to anything other than chance variation in the samples. This is true even in the part-time faculty sample because the variance was so large. P values are two-tailed.
0%
20%
40%
60%
80%
100%
drive avehicle
walk carpool (aspassngr)
WCUshuttle
publictrans bus
other reg rail orAmtrak
bicycle
Pe
rce
nt
usi
ng
at le
ast
on
ce/w
k
Staff transportation
2019 2018
2019 2018 change p value
staff 249.39 227.84 21.55 .51
off camp stus 141.77 128.12 13.65 .25
F/T faculty 127.65 144.66 -17.01 .45
P/T faculty 158.80 104.55 54.25 .26
gals/acad yr
West Chester University 2019 Commuter Survey Report Page 17
Parking
As in 2018, close to 9,000 individual cars either are on or commute to the campuses each week. They are
not on campus all at once, of course, and not all of them use campus parking facilities – nearly 7,000 do.
In both years, on-campus students’ cars consumed slightly more than a third of the surface lot and garage
space requirements, partly because they are on campus more time (virtually every day) than other groups.
Off-campus students’ cars required the most spaces, 43% this year and 46% last year. Also in 2018 and
2019, the percentage demand for parking spaces of part-time, full-time, and staff remained the same at
2%, 6% and 14%, respectively.
The maximum number of surface lot and garage spaces for North and South Campuses was estimated to
be 6,500 in 2018 and 6,883 in 2019. (Again, the difference here may just be random.) The optimum
number, since not all cars are on campus simultaneously, depends upon the variance from maximum
demand, on the one hand (which would reduce the space requirement), and marginal spaces for
convenience, on the other (which would increase the requirement).
One final note on fuel consumption and parking is that vehicle congestion and space scarcity increase fuel
use. Driving for many minutes in stop-and-go traffic to find a parking space obviously adds mileage and
consumes fuel over and above what is usually reported for “commuting miles.” A 20-minute commute
can easily be extended significantly in the search for a space. The instrument, however, did not attempt to
quantify this aspect of WCU commuting experience directly, although some open-ended remarks alluded
to it both years.
West Chester University 2019 Commuter Survey Report Page 18
Technical and logistical notes
The online instrument again worked perfectly. No technological impediments were encountered. The web
mode served the aims of the study well, gathering a large amount of data in a short period of time. (One
small segment – ARA staff – were solicited personally rather than by email at a central location but still
completed online.) Electronic administration also allowed numerous reminders to nonresponders and
more than doubled the initial response. Programming logic minimized respondent burden, and data
checks resulted in minimal missing or out of range data.
Most of the simplifying assumptions about commuting behavior mentioned at the beginning of this report
were borne out by the data. Most people use a single mode of transportation and, of these, most of them
drive alone. Most people also commute in a consistent pattern across commuting days.
Little imputation of data was required. 26% of driving respondents did not know the miles per gallon of
their vehicles, but a follow up question in these cases successfully captured the kind of vehicle they
drove. With this information, standard EPA information supplied reasonable estimates of vehicle mpg.
Though there is certainly measurement error in how precisely people report commuting driving distances,
previous commuter studies demonstrate that there is little bias in this statistic. Consequently, coupled with
mpg and days commuting, the estimate of annual fuel use by the entire community is relatively robust.
Nevertheless, summary data in this report, because of the sampling method, have confidence intervals
around them that can be easily calculated or interpolated using the appended margin of error chart.
During the data collection period, the survey database must be regularly monitored for hacking and
inadmissible cases. This is just a reality of the digital world today. This year did not experience any such
cases, but last year, the database did receive a small number, which were caught the day they were
recorded and promptly removed. Professional surveyors can usually spot and remedy such problems
quickly. The “captcha” mechanism at login virtually eliminates the possibility of thousands of “robo-
cases,” but there is still the possibility of manual mischief.
The response rate was serviceable, but could be improved. Though small, the incentive seemed sufficient
for the length of the survey and certainly contributed favorably to the response rate. However, increasing
it to $8 or $10 would improve the response by perhaps 10-20 percentage points, particularly among
students, the lowest responding group. In turn, this would, for statistical reasons, make future changes in
key variables easier to detect. The costs could be offset by soliciting fewer people, 1/8 or 1/9, for instance.
Incentives and sample fraction are, of course, contingent on budget. The 2019 survey launch date was
earlier than in 2018 to avoid conflict with final exams. It was assumed that the 2018 response rate may
have been depressed due to this conflict. Nevertheless, the rate decreased in 2019. We still recommend
avoiding finals and any other events that may inordinately compete for the community’s awareness
and time.
Page 19
Appendix A The Instrument
Facsimile of online version, with programming instructions
= = = = = = = = = = = = = = = = = = = = = = = = = = WCU COMMUTING SURVEY
4.16.19h
You are part of a small random sample selected from the WCU community. For this reason, we greatly appreciate your help
in completing this brief survey of commuting information and habits.
For your time – just a few minutes – we will send you a $5 Amazon gift card upon completion.
While you may not have exact answers to all the survey items, we hope you will answer to the best of your ability and be
entirely candid in your responses.
Your responses are completely CONFIDENTIAL. An outside research firm has been enlisted to collect the data. You will not be
identified in any results. Your participation is voluntary, and completing the survey indicates your consent.
We thank you again for contributing to this important research.
[ login etc. ]
West Chester University 703 South High St., Rm 101 West Chester, PA 19383 610-436-2053
= = = = =
[ screen header,
opening screen only ]
[ survey screen footer ]

Page 20
You are about to enter the survey. To go back a page, please use the
survey's red "Back" button, not your browser's back button.
Your answers will be saved each time you click "Next."
You may leave the survey and return multiple times. If you do return,
after entering your login code again, you will be placed in the screen you last visited.
= = = = =
Page 21
Commuting Survey 2019 Please read and answer each question below. Please be as accurate as possible. All your answers will be confidential.
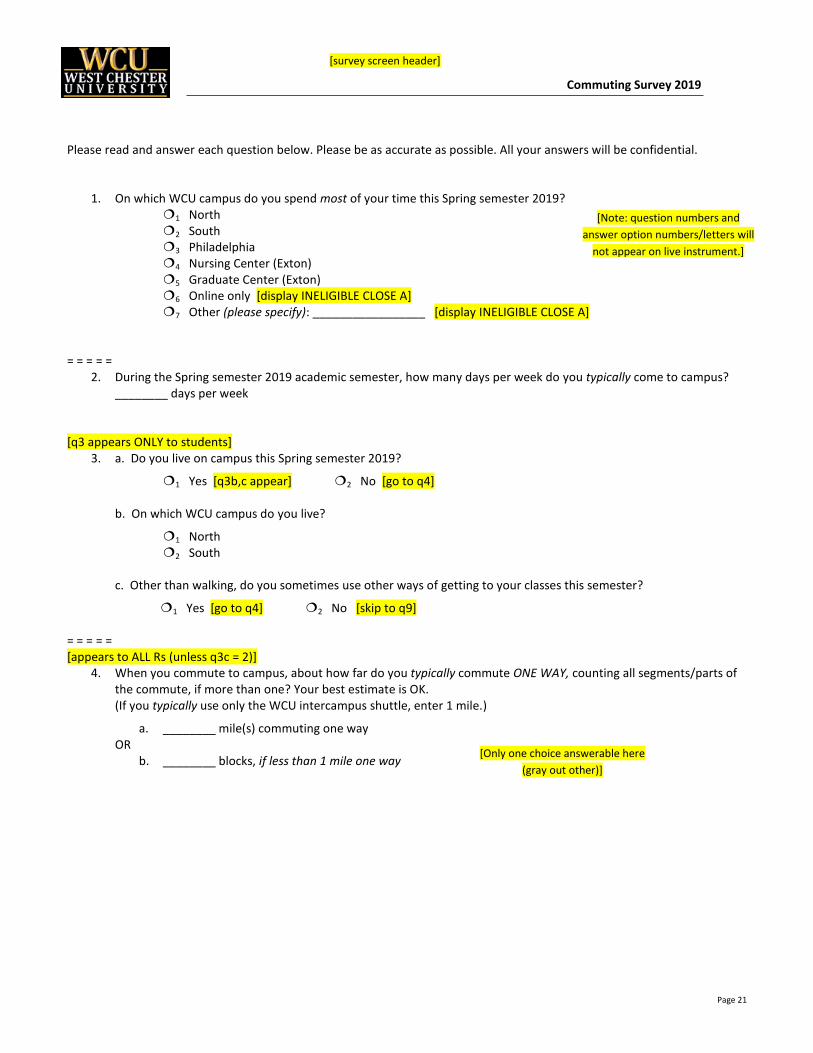
1. On which WCU campus do you spend most of your time this Spring semester 2019? 1 North 2 South 3 Philadelphia 4 Nursing Center (Exton) 5 Graduate Center (Exton) 6 Online only [display INELIGIBLE CLOSE A] 7 Other (please specify): _________________ [display INELIGIBLE CLOSE A]
= = = = =
2. During the Spring semester 2019 academic semester, how many days per week do you typically come to campus? ________ days per week
[q3 appears ONLY to students]
3. a. Do you live on campus this Spring semester 2019?
1 Yes [q3b,c appear] 2 No [go to q4]
b. On which WCU campus do you live?
1 North 2 South
c. Other than walking, do you sometimes use other ways of getting to your classes this semester?
1 Yes [go to q4] 2 No [skip to q9] = = = = = [appears to ALL Rs (unless q3c = 2)]
4. When you commute to campus, about how far do you typically commute ONE WAY, counting all segments/parts of the commute, if more than one? Your best estimate is OK. (If you typically use only the WCU intercampus shuttle, enter 1 mile.)
a. ________ mile(s) commuting one way OR
b. ________ blocks, if less than 1 mile one way
[Note: question numbers and
answer option numbers/letters will
not appear on live instrument.]
[survey screen header]
[Only one choice answerable here
(gray out other)]
Page 22
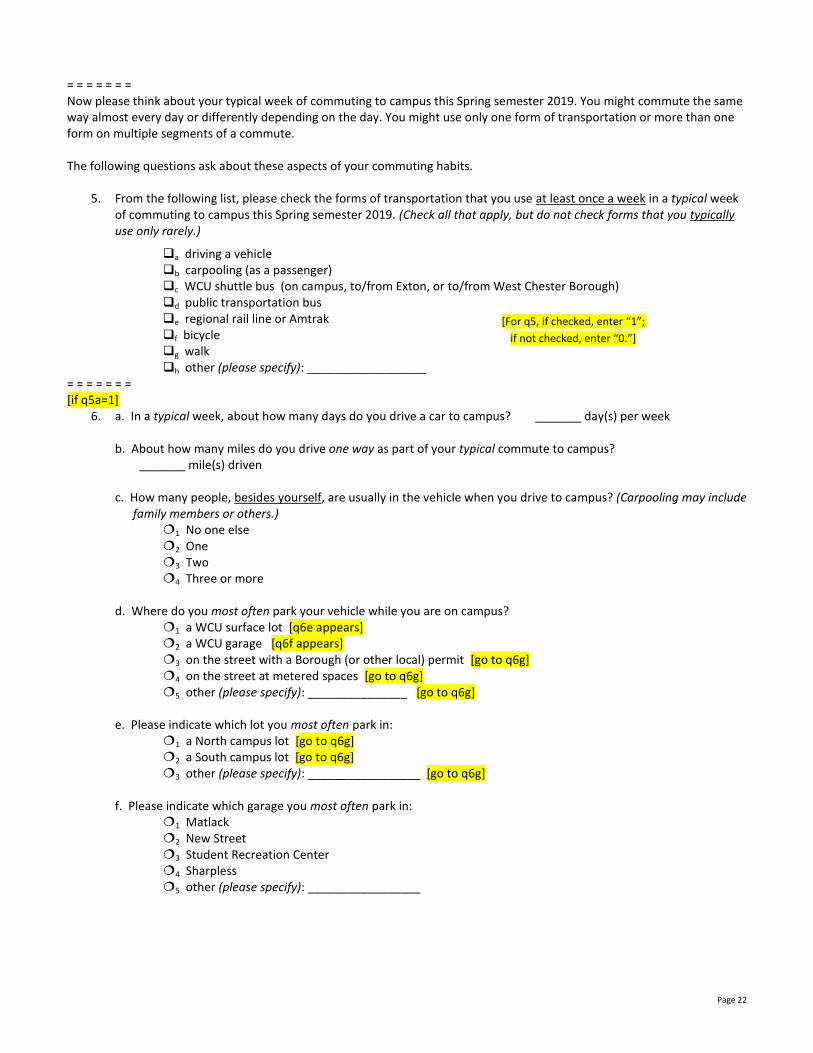
= = = = = = = Now please think about your typical week of commuting to campus this Spring semester 2019. You might commute the same way almost every day or differently depending on the day. You might use only one form of transportation or more than one form on multiple segments of a commute. The following questions ask about these aspects of your commuting habits.
5. From the following list, please check the forms of transportation that you use at least once a week in a typical week of commuting to campus this Spring semester 2019. (Check all that apply, but do not check forms that you typically use only rarely.)
a driving a vehicle b carpooling (as a passenger) c WCU shuttle bus (on campus, to/from Exton, or to/from West Chester Borough) d public transportation bus e regional rail line or Amtrak f bicycle g walk h other (please specify): __________________
= = = = = = = [if q5a=1]
6. a. In a typical week, about how many days do you drive a car to campus? _______ day(s) per week
b. About how many miles do you drive one way as part of your typical commute to campus? _______ mile(s) driven
c. How many people, besides yourself, are usually in the vehicle when you drive to campus? (Carpooling may include
family members or others.) 1 No one else 2 One 3 Two 4 Three or more
d. Where do you most often park your vehicle while you are on campus?
1 a WCU surface lot [q6e appears] 2 a WCU garage [q6f appears] 3 on the street with a Borough (or other local) permit [go to q6g] 4 on the street at metered spaces [go to q6g] 5 other (please specify): _______________ [go to q6g]
e. Please indicate which lot you most often park in:
1 a North campus lot [go to q6g] 2 a South campus lot [go to q6g] 3 other (please specify): _________________ [go to q6g]
f. Please indicate which garage you most often park in:
1 Matlack 2 New Street 3 Student Recreation Center 4 Sharpless 5 other (please specify): _________________
[For q5, if checked, enter “1”;
if not checked, enter “0.”]
Page 23
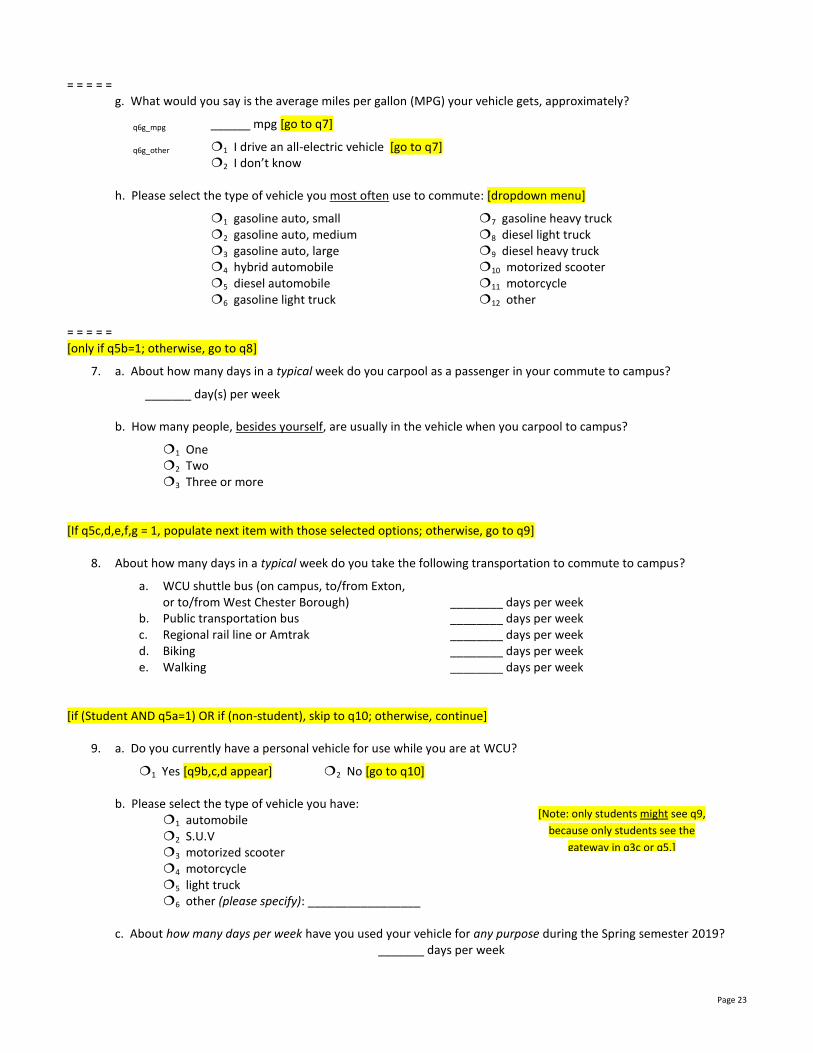
= = = = = g. What would you say is the average miles per gallon (MPG) your vehicle gets, approximately?
q6g_mpg ______ mpg [go to q7]
q6g_other 1 I drive an all-electric vehicle [go to q7] 2 I don’t know
h. Please select the type of vehicle you most often use to commute: [dropdown menu]
1 gasoline auto, small 2 gasoline auto, medium 3 gasoline auto, large 4 hybrid automobile 5 diesel automobile 6 gasoline light truck
7 gasoline heavy truck 8 diesel light truck 9 diesel heavy truck 10 motorized scooter 11 motorcycle 12 other
= = = = = [only if q5b=1; otherwise, go to q8]
7. a. About how many days in a typical week do you carpool as a passenger in your commute to campus?
_______ day(s) per week b. How many people, besides yourself, are usually in the vehicle when you carpool to campus?
1 One 2 Two 3 Three or more
[If q5c,d,e,f,g = 1, populate next item with those selected options; otherwise, go to q9]
8. About how many days in a typical week do you take the following transportation to commute to campus?
a. WCU shuttle bus (on campus, to/from Exton, or to/from West Chester Borough) ________ days per week
b. Public transportation bus ________ days per week c. Regional rail line or Amtrak ________ days per week d. Biking ________ days per week e. Walking ________ days per week
[if (Student AND q5a=1) OR if (non-student), skip to q10; otherwise, continue]
9. a. Do you currently have a personal vehicle for use while you are at WCU?
1 Yes [q9b,c,d appear] 2 No [go to q10]
b. Please select the type of vehicle you have: 1 automobile 2 S.U.V 3 motorized scooter 4 motorcycle 5 light truck 6 other (please specify): _________________
c. About how many days per week have you used your vehicle for any purpose during the Spring semester 2019?
_______ days per week
[Note: only students might see q9,
because only students see the
gateway in q3c or q5.]
Page 24
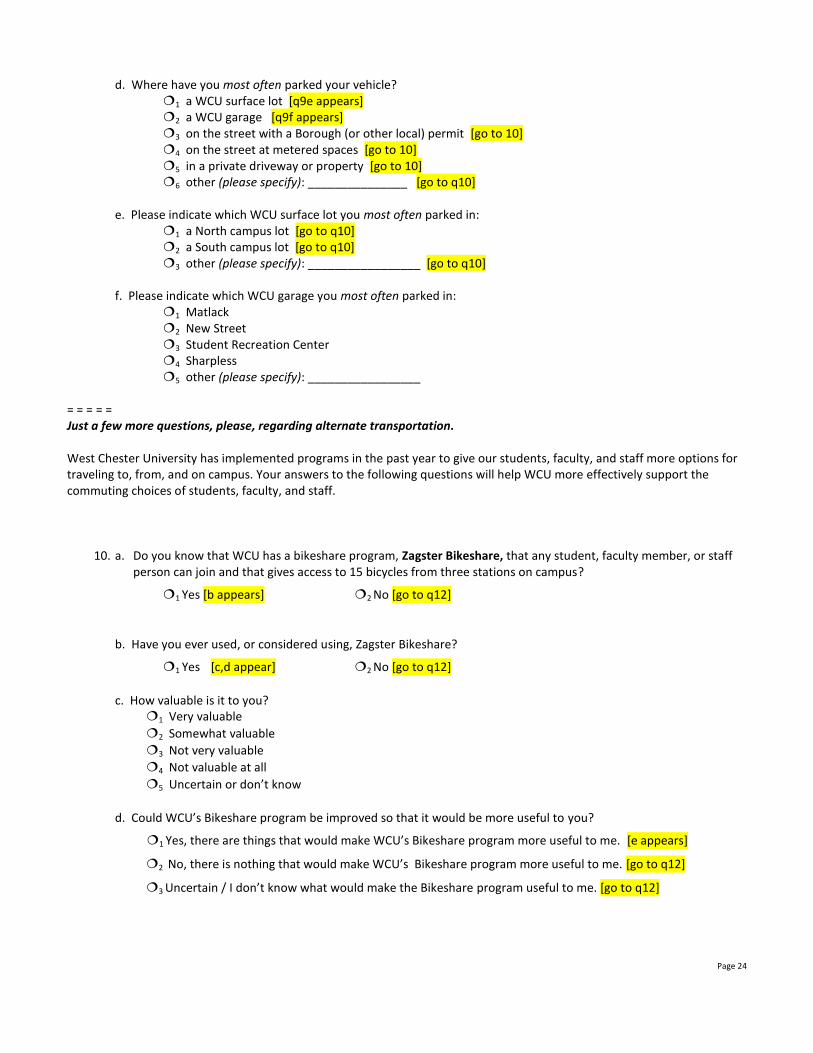
d. Where have you most often parked your vehicle? 1 a WCU surface lot [q9e appears] 2 a WCU garage [q9f appears] 3 on the street with a Borough (or other local) permit [go to 10] 4 on the street at metered spaces [go to 10] 5 in a private driveway or property [go to 10] 6 other (please specify): _______________ [go to q10]
e. Please indicate which WCU surface lot you most often parked in: 1 a North campus lot [go to q10] 2 a South campus lot [go to q10] 3 other (please specify): _________________ [go to q10]
f. Please indicate which WCU garage you most often parked in:
1 Matlack 2 New Street 3 Student Recreation Center 4 Sharpless 5 other (please specify): _________________
= = = = = Just a few more questions, please, regarding alternate transportation. West Chester University has implemented programs in the past year to give our students, faculty, and staff more options for traveling to, from, and on campus. Your answers to the following questions will help WCU more effectively support the commuting choices of students, faculty, and staff.
10. a. Do you know that WCU has a bikeshare program, Zagster Bikeshare, that any student, faculty member, or staff
person can join and that gives access to 15 bicycles from three stations on campus?
1 Yes [b appears] 2 No [go to q12]
b. Have you ever used, or considered using, Zagster Bikeshare?
1 Yes [c,d appear] 2 No [go to q12]
c. How valuable is it to you?
1 Very valuable
2 Somewhat valuable
3 Not very valuable
4 Not valuable at all
5 Uncertain or don’t know
d. Could WCU’s Bikeshare program be improved so that it would be more useful to you?
1 Yes, there are things that would make WCU’s Bikeshare program more useful to me. [e appears]
2 No, there is nothing that would make WCU’s Bikeshare program more useful to me. [go to q12]
3 Uncertain / I don’t know what would make the Bikeshare program useful to me. [go to q12]
Page 25
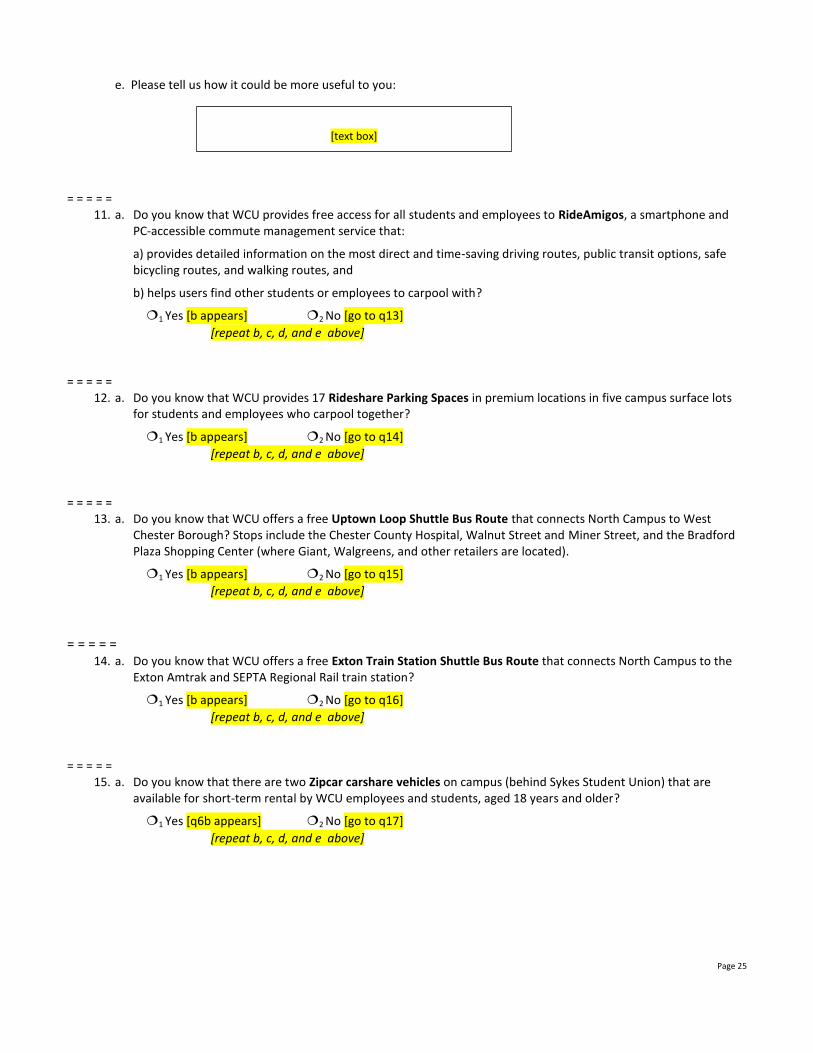
e. Please tell us how it could be more useful to you:
= = = = =
11. a. Do you know that WCU provides free access for all students and employees to RideAmigos, a smartphone and PC-accessible commute management service that:
a) provides detailed information on the most direct and time-saving driving routes, public transit options, safe bicycling routes, and walking routes, and
b) helps users find other students or employees to carpool with?
1 Yes [b appears] 2 No [go to q13]
[repeat b, c, d, and e above]
= = = = =
12. a. Do you know that WCU provides 17 Rideshare Parking Spaces in premium locations in five campus surface lots for students and employees who carpool together?
1 Yes [b appears] 2 No [go to q14]
[repeat b, c, d, and e above] = = = = =
13. a. Do you know that WCU offers a free Uptown Loop Shuttle Bus Route that connects North Campus to West Chester Borough? Stops include the Chester County Hospital, Walnut Street and Miner Street, and the Bradford Plaza Shopping Center (where Giant, Walgreens, and other retailers are located).
1 Yes [b appears] 2 No [go to q15]
[repeat b, c, d, and e above]
= = = = =
14. a. Do you know that WCU offers a free Exton Train Station Shuttle Bus Route that connects North Campus to the Exton Amtrak and SEPTA Regional Rail train station?
1 Yes [b appears] 2 No [go to q16]
[repeat b, c, d, and e above] = = = = =
15. a. Do you know that there are two Zipcar carshare vehicles on campus (behind Sykes Student Union) that are available for short-term rental by WCU employees and students, aged 18 years and older?
1 Yes [q6b appears] 2 No [go to q17]
[repeat b, c, d, and e above]
[text box]
Page 26
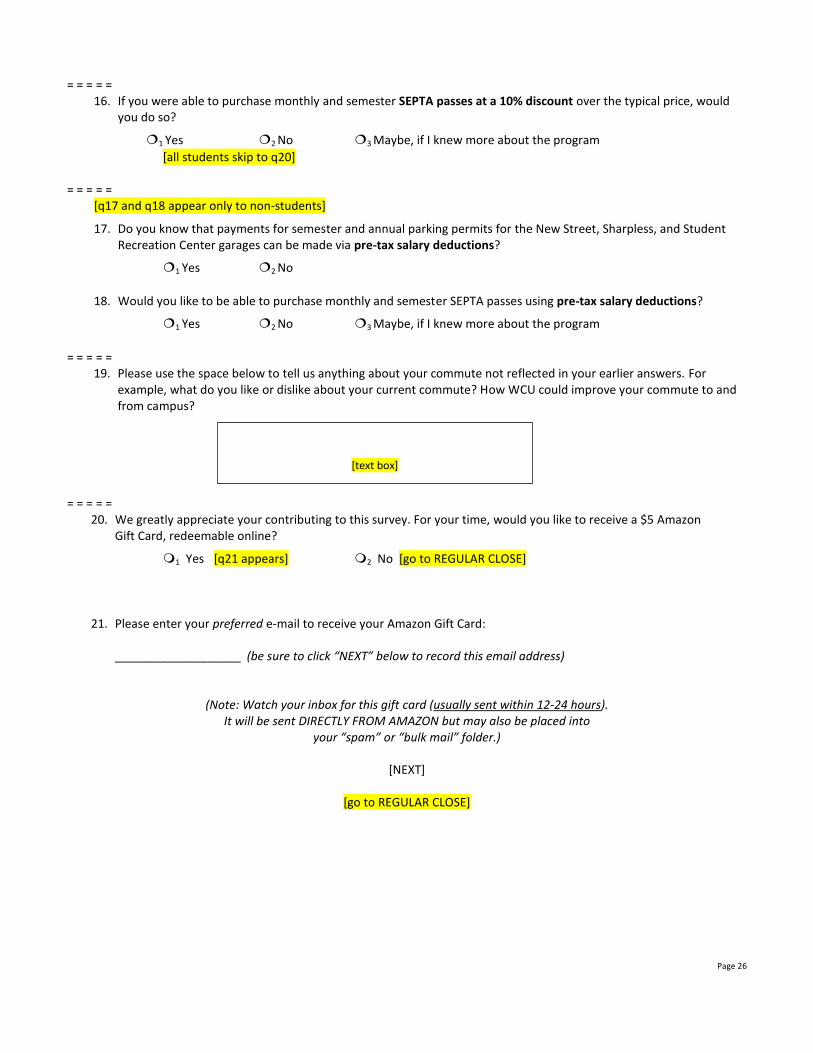
= = = = = 16. If you were able to purchase monthly and semester SEPTA passes at a 10% discount over the typical price, would
you do so?
1 Yes 2 No 3 Maybe, if I knew more about the program
[all students skip to q20] = = = = =
[q17 and q18 appear only to non-students]
17. Do you know that payments for semester and annual parking permits for the New Street, Sharpless, and Student Recreation Center garages can be made via pre-tax salary deductions?
1 Yes 2 No
18. Would you like to be able to purchase monthly and semester SEPTA passes using pre-tax salary deductions?
1 Yes 2 No 3 Maybe, if I knew more about the program
= = = = =
19. Please use the space below to tell us anything about your commute not reflected in your earlier answers. For example, what do you like or dislike about your current commute? How WCU could improve your commute to and from campus?
= = = = =
20. We greatly appreciate your contributing to this survey. For your time, would you like to receive a $5 Amazon Gift Card, redeemable online?
1 Yes [q21 appears] 2 No [go to REGULAR CLOSE]
21. Please enter your preferred e-mail to receive your Amazon Gift Card: ___________________ (be sure to click “NEXT” below to record this email address)
(Note: Watch your inbox for this gift card (usually sent within 12-24 hours). It will be sent DIRECTLY FROM AMAZON but may also be placed into
your “spam” or “bulk mail” folder.)
[NEXT]
[go to REGULAR CLOSE]
[text box]
Page 27
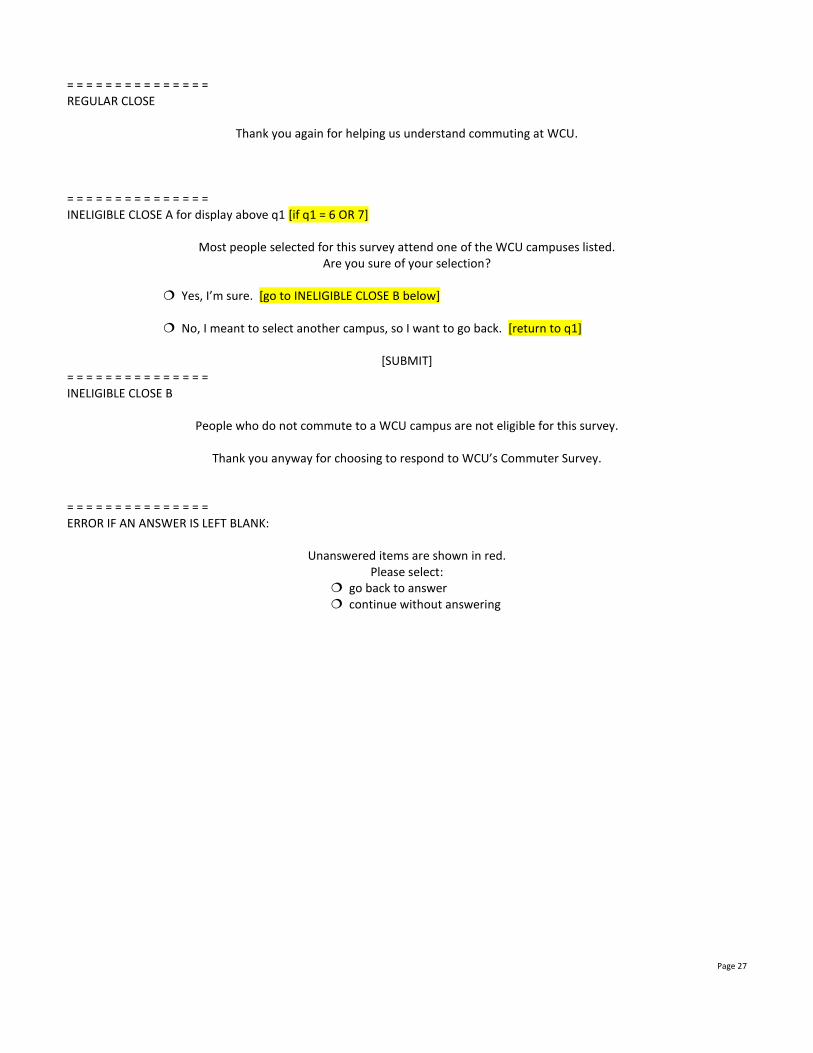
= = = = = = = = = = = = = = = REGULAR CLOSE
Thank you again for helping us understand commuting at WCU.
= = = = = = = = = = = = = = = INELIGIBLE CLOSE A for display above q1 [if q1 = 6 OR 7]
Most people selected for this survey attend one of the WCU campuses listed. Are you sure of your selection?
Yes, I’m sure. [go to INELIGIBLE CLOSE B below]
No, I meant to select another campus, so I want to go back. [return to q1]
[SUBMIT] = = = = = = = = = = = = = = = INELIGIBLE CLOSE B
People who do not commute to a WCU campus are not eligible for this survey.
Thank you anyway for choosing to respond to WCU’s Commuter Survey. = = = = = = = = = = = = = = = ERROR IF AN ANSWER IS LEFT BLANK:
Unanswered items are shown in red. Please select:
go back to answer continue without answering
Page 28
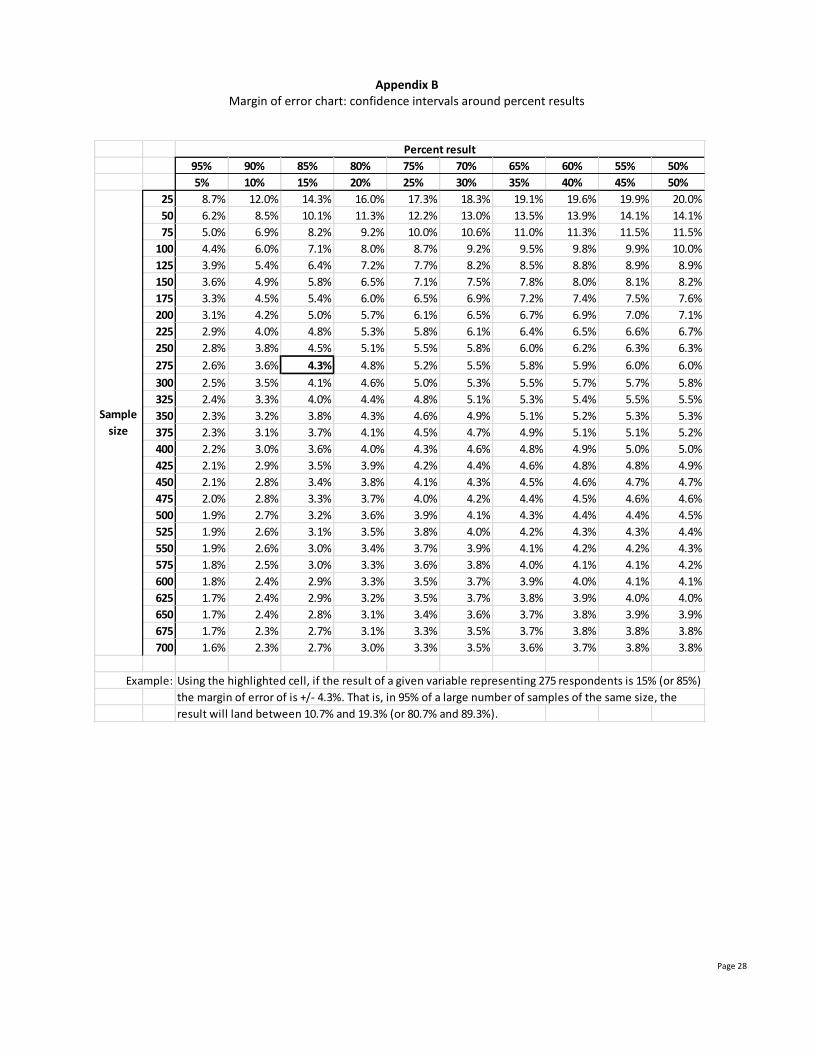
Appendix B Margin of error chart: confidence intervals around percent results
95% 90% 85% 80% 75% 70% 65% 60% 55% 50%
5% 10% 15% 20% 25% 30% 35% 40% 45% 50%
25 8.7% 12.0% 14.3% 16.0% 17.3% 18.3% 19.1% 19.6% 19.9% 20.0%
50 6.2% 8.5% 10.1% 11.3% 12.2% 13.0% 13.5% 13.9% 14.1% 14.1%
75 5.0% 6.9% 8.2% 9.2% 10.0% 10.6% 11.0% 11.3% 11.5% 11.5%
100 4.4% 6.0% 7.1% 8.0% 8.7% 9.2% 9.5% 9.8% 9.9% 10.0%
125 3.9% 5.4% 6.4% 7.2% 7.7% 8.2% 8.5% 8.8% 8.9% 8.9%
150 3.6% 4.9% 5.8% 6.5% 7.1% 7.5% 7.8% 8.0% 8.1% 8.2%
175 3.3% 4.5% 5.4% 6.0% 6.5% 6.9% 7.2% 7.4% 7.5% 7.6%
200 3.1% 4.2% 5.0% 5.7% 6.1% 6.5% 6.7% 6.9% 7.0% 7.1%
225 2.9% 4.0% 4.8% 5.3% 5.8% 6.1% 6.4% 6.5% 6.6% 6.7%
250 2.8% 3.8% 4.5% 5.1% 5.5% 5.8% 6.0% 6.2% 6.3% 6.3%
275 2.6% 3.6% 4.3% 4.8% 5.2% 5.5% 5.8% 5.9% 6.0% 6.0%
300 2.5% 3.5% 4.1% 4.6% 5.0% 5.3% 5.5% 5.7% 5.7% 5.8%
325 2.4% 3.3% 4.0% 4.4% 4.8% 5.1% 5.3% 5.4% 5.5% 5.5%
350 2.3% 3.2% 3.8% 4.3% 4.6% 4.9% 5.1% 5.2% 5.3% 5.3%
375 2.3% 3.1% 3.7% 4.1% 4.5% 4.7% 4.9% 5.1% 5.1% 5.2%
400 2.2% 3.0% 3.6% 4.0% 4.3% 4.6% 4.8% 4.9% 5.0% 5.0%
425 2.1% 2.9% 3.5% 3.9% 4.2% 4.4% 4.6% 4.8% 4.8% 4.9%
450 2.1% 2.8% 3.4% 3.8% 4.1% 4.3% 4.5% 4.6% 4.7% 4.7%
475 2.0% 2.8% 3.3% 3.7% 4.0% 4.2% 4.4% 4.5% 4.6% 4.6%
500 1.9% 2.7% 3.2% 3.6% 3.9% 4.1% 4.3% 4.4% 4.4% 4.5%
525 1.9% 2.6% 3.1% 3.5% 3.8% 4.0% 4.2% 4.3% 4.3% 4.4%
550 1.9% 2.6% 3.0% 3.4% 3.7% 3.9% 4.1% 4.2% 4.2% 4.3%
575 1.8% 2.5% 3.0% 3.3% 3.6% 3.8% 4.0% 4.1% 4.1% 4.2%
600 1.8% 2.4% 2.9% 3.3% 3.5% 3.7% 3.9% 4.0% 4.1% 4.1%
625 1.7% 2.4% 2.9% 3.2% 3.5% 3.7% 3.8% 3.9% 4.0% 4.0%
650 1.7% 2.4% 2.8% 3.1% 3.4% 3.6% 3.7% 3.8% 3.9% 3.9%
675 1.7% 2.3% 2.7% 3.1% 3.3% 3.5% 3.7% 3.8% 3.8% 3.8%
700 1.6% 2.3% 2.7% 3.0% 3.3% 3.5% 3.6% 3.7% 3.8% 3.8%
Example: Using the highlighted cell, if the result of a given variable representing 275 respondents is 15% (or 85%)
the margin of error of is +/- 4.3%. That is, in 95% of a large number of samples of the same size, the
result will land between 10.7% and 19.3% (or 80.7% and 89.3%).
Sample
size
Percent result

Page 29
Recommended