Embed Size (px)
Citation preview
DOWNTOWN PARKING STUDY AUSTIN, TEXAS Prepared for: TC AUSTIN DEVELOPMENT, INC CITY OF AUSTIN
WALKER PARKING CONSULTANTS 6602 E. 75th Street, Suite 210 Indianapolis, Indiana 46250
Voice: 317.842.6890 Fax: 317.577.6500 www.walkerparking.com
February 2, 2009, revised 2/12/09 Mr. Tim McCabe TC Austin Development, Inc. 100 Congress Avenue, Suite 225 Austin, Texas 78701 Re: Green Water Treatment Plant - Downtown Parking Supply/Demand Analysis Walker Project No. 25-1524.00 Dear Tim: Walker Parking Consultants is pleased to submit the attached report of the 2008 Downtown Parking Supply/Demand Analysis Report for TC Austin Development, Inc the City of Austin. This report documents our findings and includes comments and revisions noted by Trammel Crow and the City of Austin representatives. We appreciate the opportunity to be of service to you. If you have any questions or comments, please call. Sincerely, WALKER PARKING CONSULTANTS
Jody L. Todd, CPP Parking Consultant cc: Kenneth C. Wagner, P.E., Managing Principal, Houston office, Walker Parking Consultants
DOWNTOWN PARKING SUPPLY/DEMAND ANALYSIS AUSTIN, TEXAS Prepared for: TC AUSTIN DEVELOPMENT, INC. CITY OF AUSTIN PROJECT NO. 25-1524.00
DOWNTOWN PARKING SUPPLY/DEMAND ANALYSIS AUSTIN, TEXAS FEBRUARY 2, 2009, REVISED 2/12/09 PROJECT #25-1524.00
EXECUTIVE SUMMARY ........................................................... i INTRODUCTION Study Methodology ...................................................... 1 Scope of Services ......................................................... 2 Definition of Terms ....................................................... 4 Background ................................................................. 5 Study Area ................................................................. 6 CURRENT CONDITIONS ...................................................... 8 Parking Supply ............................................................ 8 Effective Parking Supply ................................................ 9 Parking Occupancy ................................................... 11 Occupancy by Zone ................................................... 14 Zone NW ......................................................... 14 Zone CW ......................................................... 14 Zone SW .......................................................... 16 Zone NE .......................................................... 16 Zone SE ........................................................... 17 Zone LC ........................................................... 18 Parking Adequacy ...................................................... 20 EVENT PARKING ............................................................... 22 FUTURE PARKING CONDITIONS Projected Parking Demand ........................................... 30 Shared Parking Demand ............................................. 32 Future Parking Adequacy .............................................. 33 CONCLUSION ................................................................. 36 APPENDIX A OFF-STREET PARKING APPENDIX B: ON-STREET PARKING APPENDIX C: PARKING MAPS BY ZONE
TABLE OF CONTENTS
LIST OF TABLES Table 1: Study Area - Zone Boundaries 6 Table 2: Parking Supply Summary 9 Table 3: Effective Parking Supply 10 Table 4: Parking Occupancy Summary -
Weekday 12 Table 5: Parking Occupancy Summary -
Weekend 13 Table 6: Zone NW Occupancy 14 Table 7: Zone CW Occupancy 15 Table 8: Zone SW Occupancy 16 Table 9: Zone NE Occupancy 17 Table 10: Zone SE Occupancy 18 Table 11: Zone LC Occupancy 19 Table 12: Summary of Current Weekday
Peak Parking Adequacy 20 Table 13: Current parking Adequacy by
Type 21 Table 14: Austin Convention Center Events
25 Table 15: Palmer Events Center Events 25 Table 16: Zilker Park Events 27 Table 17: Ballet Austin Events 28 Table 18: New Improvement Assumptions
31 Table 19: Future Weekday Parking
Adequacy by Zone – 5 Year 34 Table 20: Sensitivity Analysis 34
LIST OF FIGURES
Figure 1: Study Area Map 7 Figure 2: Special Event Venues 23
DOWNTOWN PARKING SUPPLY/DEMAND ANALYSIS AUSTIN, TEXAS FEBRUARY 2, 2009, REVISED 2/12/09 PROJECT #25-1524.00
i
The primary conclusion of the following report is that the supply of parking in the Austin CBD is adequate to meet parking demand during most occasions and we anticipate that the existing parking supply will adequately serve those known prospective developments that are projected to be completed within the next five years. However, certain areas or zones within the downtown are projected to reach a parking occupancy at or above 85 percent within the planning horizon. CURRENT PARKING CONDITIONS To understand the adequacy of the existing parking supply, field surveys were performed, including a parking occupancy study that was conducted at four time periods during the week of December 1, 2008; 1) weekday daytime, 2) weekday evening, 3) weekend daytime and 4) weekend evening. The weekday daytime count is judged to well represent a typical day, including an event at the Convention Center. An estimated 48,912 parking spaces were identified through field surveys1 and 30,103, or 62% of these spaces were occupied during peak weekday business hours between 9:00 AM to 4:00 PM. During these counts, over 18,809 spaces were found to be vacant, but many of these are located on the upper floors of parking structures and are not visible to the casual motorist driving through the downtown. The 200+-block Study Area is divided into zones to help pinpoint whether certain zones had parking adequacy issues. Each zone showed a significant parking surplus during the weekday daytime period, which coincides with the overall peak demand period, as seen in the summary table of Current Parking Adequacy on the following page.
1 Parking inventory was limited to those marked parking spaces identified within the CBD and in the Long Center Corridor. Some private facilities were not accessible. In some cases the inventory was provided by the City and noted in the Appendices. However, parking occupancy counts were not performed due to inaccessibility. Therefore, the parking inventory and occupancy for such facilities is not reflected in this analysis.
EXECUTIVE SUMMARY
DOWNTOWN PARKING SUPPLY/DEMAND ANALYSIS AUSTIN, TEXAS FEBRUARY 2, 2009, REVISED 2/12/09 PROJECT #25-1524.00
ii
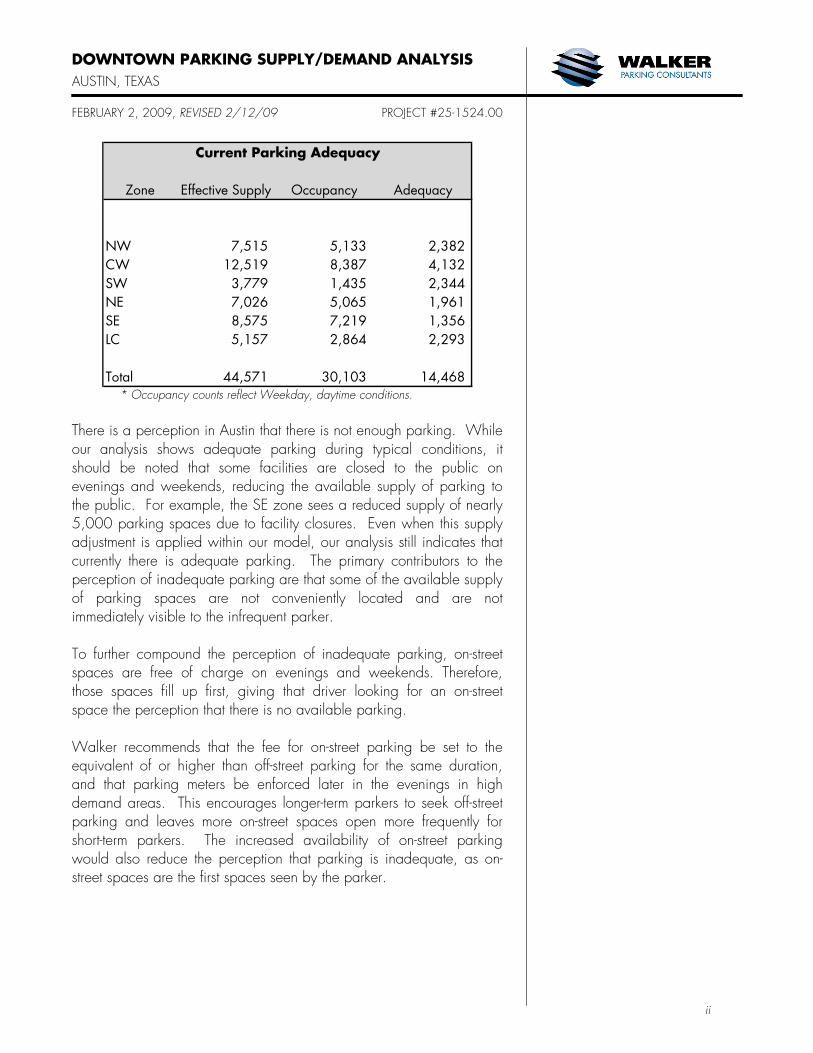
Zone Effective Supply Occupancy Adequacy
NW 7,515 5,133 2,382CW 12,519 8,387 4,132SW 3,779 1,435 2,344NE 7,026 5,065 1,961SE 8,575 7,219 1,356LC 5,157 2,864 2,293
Total 44,571 30,103 14,468
Current Parking Adequacy
* Occupancy counts reflect Weekday, daytime conditions. There is a perception in Austin that there is not enough parking. While our analysis shows adequate parking during typical conditions, it should be noted that some facilities are closed to the public on evenings and weekends, reducing the available supply of parking to the public. For example, the SE zone sees a reduced supply of nearly 5,000 parking spaces due to facility closures. Even when this supply adjustment is applied within our model, our analysis still indicates that currently there is adequate parking. The primary contributors to the perception of inadequate parking are that some of the available supply of parking spaces are not conveniently located and are not immediately visible to the infrequent parker. To further compound the perception of inadequate parking, on-street spaces are free of charge on evenings and weekends. Therefore, those spaces fill up first, giving that driver looking for an on-street space the perception that there is no available parking. Walker recommends that the fee for on-street parking be set to the equivalent of or higher than off-street parking for the same duration, and that parking meters be enforced later in the evenings in high demand areas. This encourages longer-term parkers to seek off-street parking and leaves more on-street spaces open more frequently for short-term parkers. The increased availability of on-street parking would also reduce the perception that parking is inadequate, as on-street spaces are the first spaces seen by the parker.
DOWNTOWN PARKING SUPPLY/DEMAND ANALYSIS AUSTIN, TEXAS FEBRUARY 2, 2009, REVISED 2/12/09 PROJECT #25-1524.00
iii
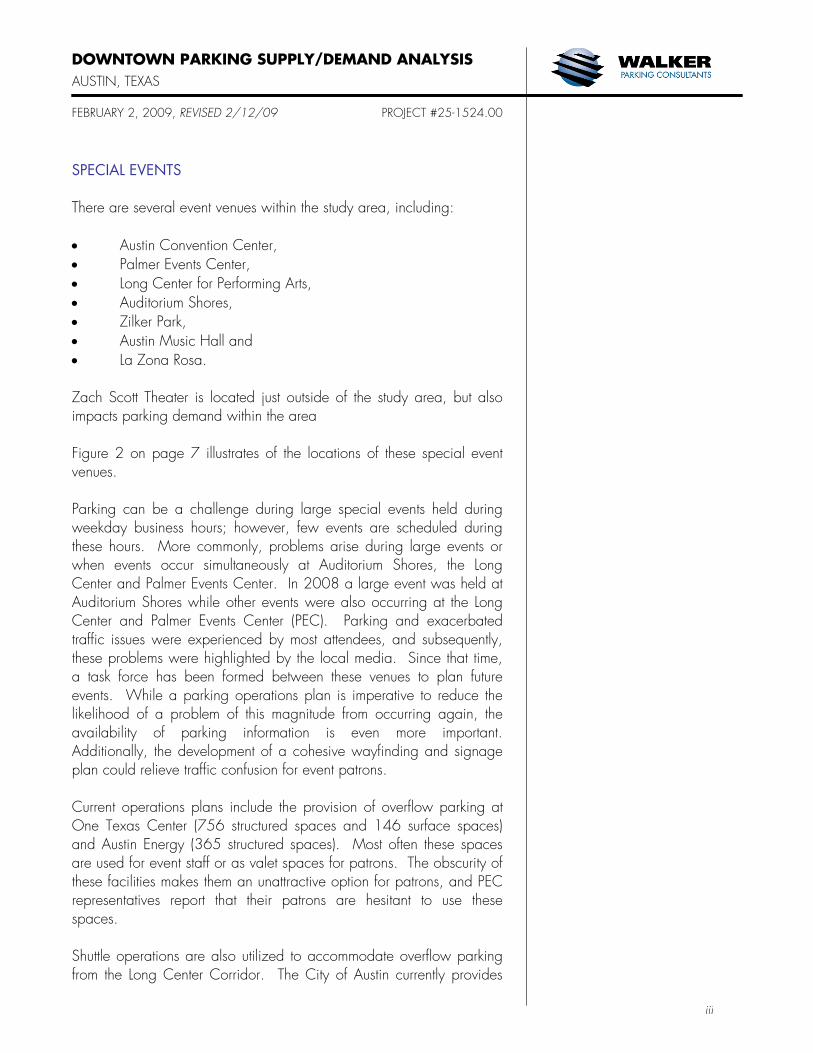
SPECIAL EVENTS There are several event venues within the study area, including: • Austin Convention Center, • Palmer Events Center, • Long Center for Performing Arts, • Auditorium Shores, • Zilker Park, • Austin Music Hall and • La Zona Rosa. Zach Scott Theater is located just outside of the study area, but also impacts parking demand within the area Figure 2 on page 7 illustrates of the locations of these special event venues. Parking can be a challenge during large special events held during weekday business hours; however, few events are scheduled during these hours. More commonly, problems arise during large events or when events occur simultaneously at Auditorium Shores, the Long Center and Palmer Events Center. In 2008 a large event was held at Auditorium Shores while other events were also occurring at the Long Center and Palmer Events Center (PEC). Parking and exacerbated traffic issues were experienced by most attendees, and subsequently, these problems were highlighted by the local media. Since that time, a task force has been formed between these venues to plan future events. While a parking operations plan is imperative to reduce the likelihood of a problem of this magnitude from occurring again, the availability of parking information is even more important. Additionally, the development of a cohesive wayfinding and signage plan could relieve traffic confusion for event patrons. Current operations plans include the provision of overflow parking at One Texas Center (756 structured spaces and 146 surface spaces) and Austin Energy (365 structured spaces). Most often these spaces are used for event staff or as valet spaces for patrons. The obscurity of these facilities makes them an unattractive option for patrons, and PEC representatives report that their patrons are hesitant to use these spaces. Shuttle operations are also utilized to accommodate overflow parking from the Long Center Corridor. The City of Austin currently provides
DOWNTOWN PARKING SUPPLY/DEMAND ANALYSIS AUSTIN, TEXAS FEBRUARY 2, 2009, REVISED 2/12/09 PROJECT #25-1524.00
iv
shuttle services for Long Center patrons when an event is occurring simultaneously at the Palmer Events Center. Patrons are instructed to park at the Convention Center garage, which is one mile from the Long Center in the heart of the SE zone. The GWTP site will be 0.7 mile from the Long Center and visible across Lady Bird Lake. Independent event organizers are required to provide shuttle services for large events at Auditorium Shores. Most of these services reportedly park in the CBD. The GWTP site is less than one half-mile from Auditorium Shores, or a 10 to 15 minute walk using the pedestrian bridge over Lady Bird Lake. The W Hotel is currently under construction and will reportedly contain 252 hotel rooms, 159 condos, 37,000 s.f. of office, 18,000 s.f. of retail and a 2,700 seat music venue. The venue will be used 200 nights per year for television show tapings and 70 nights per year for large special events. The development has planned parking to support the typical demand, but does not have adequate parking to accommodate special events. This demand will be required to be met within the SW zone. The W Hotel will be located two blocks from the GWTP site. FUTURE PARKING CONDITIONS A significant number of improvements are either under construction or planned to be constructed within the study area over the next five years. Some of these improvements have included parking facilities to accommodate their demand. However, some of the planned developments have not yet indicated how much parking they will include, if any. Based on input from the City of Austin, Walker assumes that in instances where planned parking is not indicated, the development will include the 80% of the minimum parking required. A summary table of Future Parking Adequacy is shown on the following page.
DOWNTOWN PARKING SUPPLY/DEMAND ANALYSIS AUSTIN, TEXAS FEBRUARY 2, 2009, REVISED 2/12/09 PROJECT #25-1524.00
v
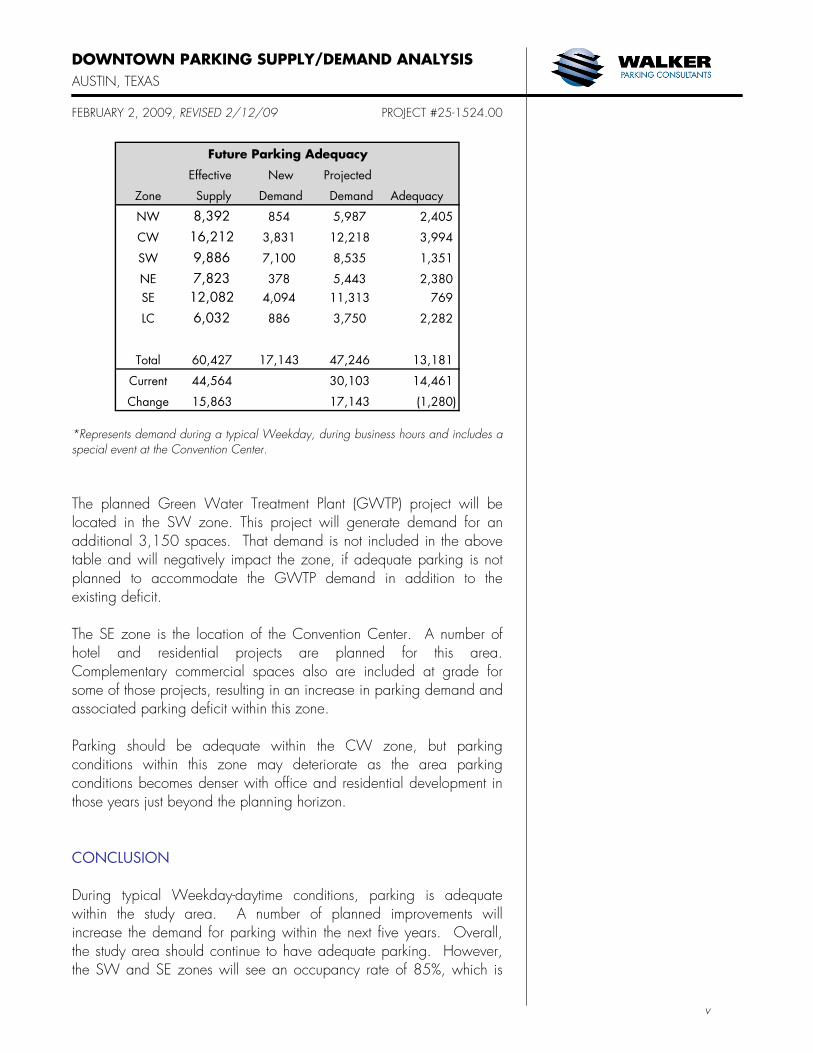
Effective New Projected
Zone Supply Demand Demand Adequacy
NW 8,392 854 5,987 2,405
CW 16,212 3,831 12,218 3,994
SW 9,886 7,100 8,535 1,351
NE 7,823 378 5,443 2,380SE 12,082 4,094 11,313 769
LC 6,032 886 3,750 2,282
Total 60,427 17,143 47,246 13,181
Current 44,564 30,103 14,461
Change 15,863 17,143 (1,280)
Future Parking Adequacy
*Represents demand during a typical Weekday, during business hours and includes a special event at the Convention Center. The planned Green Water Treatment Plant (GWTP) project will be located in the SW zone. This project will generate demand for an additional 3,150 spaces. That demand is not included in the above table and will negatively impact the zone, if adequate parking is not planned to accommodate the GWTP demand in addition to the existing deficit. The SE zone is the location of the Convention Center. A number of hotel and residential projects are planned for this area. Complementary commercial spaces also are included at grade for some of those projects, resulting in an increase in parking demand and associated parking deficit within this zone. Parking should be adequate within the CW zone, but parking conditions within this zone may deteriorate as the area parking conditions becomes denser with office and residential development in those years just beyond the planning horizon. CONCLUSION During typical Weekday-daytime conditions, parking is adequate within the study area. A number of planned improvements will increase the demand for parking within the next five years. Overall, the study area should continue to have adequate parking. However, the SW and SE zones will see an occupancy rate of 85%, which is
DOWNTOWN PARKING SUPPLY/DEMAND ANALYSIS AUSTIN, TEXAS FEBRUARY 2, 2009, REVISED 2/12/09 PROJECT #25-1524.00
vi
about the maximum occupancy to maintain optimum parking efficiency. Parking is generally adequate to accommodate typical events occurring during evenings and weekends. The observed breakdown in the parking system occurs during large events and when events occur simultaneously. Based on our analysis of event schedules, this occurs six to ten times per year. Although the number of occurrences is relatively low, the magnitude of the parking deficit during such conditions is significant. Given the concentration of event venues within a one mile radius (specifically on the boundaries of the SW and LC zones), the parking supply in these zones are challenged during these simultaneous events. While operations plans are in place and mobilized during these overlapping events, it is difficult to get information to patrons on where to park, given that the location of available parking changes based on the type of events. A static supply of overflow parking would help ensure that the user knows where to park before arriving downtown. The GWTP site is the prime option for providing this additional parking supply, given its location within the CBD and proximity and line of sight to the event venues south of Lady Bird Lake. While it may not be financially practical to provide enough parking spaces at the GWTP site to accommodate all special events, our analysis concludes that it is logical to increase the supply at the GWTP site by more than just what is required to serve the GWTP development. While it may not be financially feasible to provide enough parking spaces to accommodate all special events at the GWTP site, our analysis concludes that it is the logical location to serve special events near Lady Bird Lake. A financial analysis should be performed to determine how many spaces could be supported above the GWTP demand. Otherwise, adequate parking is projected within a five-year planning horizon.
DOWNTOWN PARKING SUPPLY/DEMAND ANALYSIS AUSTIN, TEXAS FEBRUARY 2, 2009 PROJECT # 25-1524.00
1
TC Austin Development, Inc. was selected by the Austin City Council to redevelop the Thomas Green Water Treatment Plant (GWTP). The project spans four city blocks and will include residential, hotels, retail, restaurant, office, and entertainment space. The project will also include a parking garage to support the development. To successfully integrate the GWTP project into the downtown Central Business District (CBD), TC Austin Development, Inc. and the City of Austin, Texas (City) engaged Walker Parking Consultants (Walker) to conduct an analysis of the current and future parking supply and demand to determine the adequacy of the parking system, and understand the impact of the GWTP project. The supply/demand analysis provides a report of the current parking supply and recent trends in overall parking occupancy and by zone. Based on Walker-generated field data and redevelopment plans provided by local representatives, future parking demand projections are made for the next five-year projection period. Based on these projections and comparisons to the current parking supply, Walker quantified the number of parking spaces required to support future growth over this planning horizon. STUDY METHODOLOGY In order to complete the objectives of this study, Walker conducted a physical inventory of all parking spaces within a defined geographical area of study. The inventory was tabulated by block and categorized by on-street vs. off-street, public or private, and surface or garage. Occupancy counts were taken, resulting in a tabulation of the physical number of vehicles found utilizing parking spaces. A count was taken during the week of December 1st through December 6th, during four time intervals: Weekday business hours Weekday evening Saturday daytime Saturday evening The survey dates and times were selected to accommodate the project schedule, avoid atypical Thanksgiving holiday conditions and capture normal peak activity in the downtown study area. By comparing the parking space supply with the observed occupancy of the parking facilities on a block-by-block basis, Walker was able to determine the occupancy levels of each block and quantify specific demand for each block.
INTRODUCTION
DOWNTOWN PARKING SUPPLY/DEMAND ANALYSIS AUSTIN, TEXAS FEBRUARY 2, 2009 PROJECT # 25-1524.00
2
SCOPE OF SERVICES Walker was engaged to perform the following services: 1. Meet with representatives of TC Austin Development Inc. (“Client”) to further clarify study’s objectives, review the work plan, set work session dates, and finalize the project schedule. At this meeting, the lines of communication and a schedule of deliverables will also be established.
2. Obtain the following information from the Client: a. Building occupancy – The occupancy of major buildings and the city’s best estimate for other buildings, or a list of building owners and/or real estate professionals that may be contacted to obtain such data. b. Employment – The most recent and accurate data available for the central business district. c. Future developments – This includes type of land use, square footage, seating capacity, or number of hotel rooms, expected completion date, location, number of parking spaces, and whether any existing parking spaces will be displaced. d. Copies of any previous parking studies, community master plans or downtown market studies. e. AutoCAD base drawings of the study area. f. Information describing special events hosted within the downtown area over the last year including the name of the event, date(s), estimated attendance, and special transportation arrangements made in advance of these events.
3. Conduct an inventory of on- and off-street parking spaces in the 188-block study area. Inventory will be tabulated and summarized on a block-by-block basis. Tabulation will include block identification, capacity, public vs. private, and time restrictions.
4. Perform one-time parking occupancy counts for all parking spaces located within the 188-block study area under the following conditions: a) weekday business hours; b) weekday evening; c) weekend daytime; and d) weekend evening.
5. Analyze special event information and quantify the size and frequency of impact that these events have on downtown parking conditions.
6. Compare the observed parking demand to the existing parking supply to determine the existing parking surplus or deficit on a block-by-block basis in the study area.
DOWNTOWN PARKING SUPPLY/DEMAND ANALYSIS AUSTIN, TEXAS FEBRUARY 2, 2009 PROJECT # 25-1524.00
3
7. Project future parking surpluses and deficiencies (through 2014) by block within the study area based on available local data, national averages, and Walker Parking Consultants’ experience.
8. Prepare a map in AutoCAD format showing the location of significant parking assets.
9. Prepare one draft task memorandum report to include our findings and recommendations. Obtain feedback from the Client and Client’s representatives.
10. Submit one electronic .PDF file of the final report via email. Submit five (5) bound, color copies of the final report to the Client.
DOWNTOWN PARKING SUPPLY/DEMAND ANALYSIS AUSTIN, TEXAS FEBRUARY 2, 2009 PROJECT # 25-1524.00
4
DEFINITION OF TERMS Several terms are used in this report that might be considered parking jargon and thus not readily understood by the reader. Definitions of these terms are presented below.
Inventory – The total number of parking spaces identified and counted during survey day observations. The intent of this study is to account for all parking within a defined geographical area of study.
Effective Supply – The inventory adjusted by the optimum utilization factor.
Effective Supply Factor or Optimum Utilization Factor – The occupancy rate at which a parking facility operates at peak efficiency. This factor allows patrons to spend less time looking for the last available spaces and allows for the dynamics of vehicles moving in and out of spaces. It also allows for spaces lost to poor or improper parking, snow removal, derelict vehicles, and spaces lost for repair.
Demand – The number of spaces required to satisfy visitor, employee and resident needs on a given day.
Occupancy (Counts) – The number of vehicles observed parked on a survey day.
Parking Adequacy – The difference between parking supply and demand.
Demand Generator – Any building, structure, business or attraction that brings individuals into the downtown, thereby increasing parking demand and occupancy.
Survey Day – The day that the parking occupancy counts were conducted.
Shared Parking - Shared parking is the use of a parking space by vehicles generated by more than one land use. The ability to share parking spaces is the result of two conditions: o Variations in the accumulation of vehicles by hour, by day or by season at the individual land uses. o Relationships among the land uses that result in visiting multiple land uses on the same auto trip.
DOWNTOWN PARKING SUPPLY/DEMAND ANALYSIS AUSTIN, TEXAS FEBRUARY 2, 2009, REVISED 2/12/09 PROJECT # 25-1524.00
5
BACKGROUND GWTP The GWTP project will transform the landscape along Lady Bird Lake. The redevelopment project is planned to begin construction in 2010. The current program includes: Market Residential ......................... 474 units Senior Residential .......................... 281 units High-rise Hotel ............................ 250 rooms Boutique Hotel ............................ 100 rooms Retail ..................................... 140,000 s.f. Office .................................... 588,000 s.f. Public Plaza .............................. 10,000 s.f. Walker analyzed the planned program and projects a future need for approximately 2,900 shared parking spaces to support the development. The results of this supply/demand analysis indicate that more parking spaces should be constructed at GWTP, based on current and future parking adequacy in the surrounding downtown market. Additionally, a 160,000 sf Central Library is planned adjacent to GWTP. This library is projected to generate demand for an additional 240 spaces. Current plans include 3,260 parking spaces to support the GWTP development and the Library project. While it may not be financially feasible to provide enough parking spaces to accommodate all special events at the GWTP site, our analysis concludes that it is the logical location to serve special events near Lady Bird Lake. A financial analysis should be performed to determine how many spaces could be supported above the GWTP demand. Otherwise, adequate parking is projected within a five-year planning horizon.
DOWNTOWN PARKING SUPPLY/DEMAND ANALYSIS AUSTIN, TEXAS FEBRUARY 2, 2009 PROJECT # 25-1524.00
6
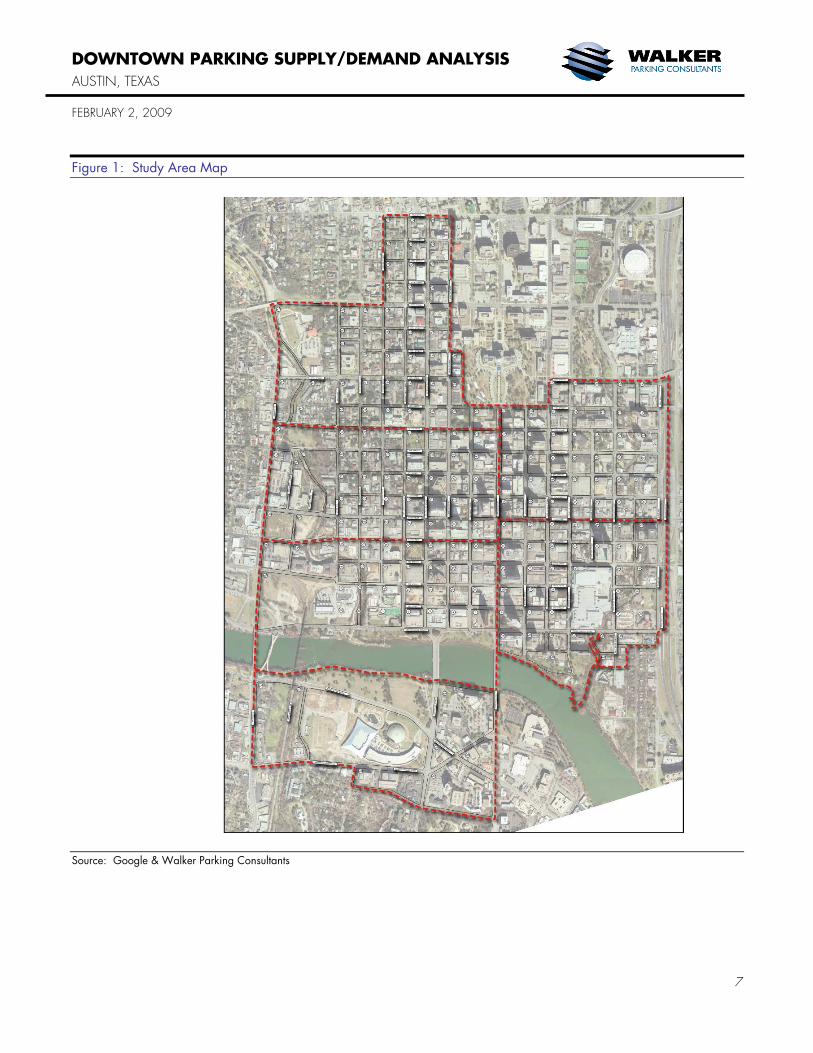
STUDY AREA For purposes of analysis, a geographic area of study is identified and is referred to throughout this document as the Study Area. The Study Area consists of approximately 188 city blocks generally located in the CBD of Austin, Texas. The Study Area is generally bordered by Lamar Boulevard to the west, and IH-35 to the East. The north and south boundaries are varied through the area to best capture the CBD. Walker was also asked to consider an area south of Lady Bird Lake that includes hotels, offices, retail, restaurant, the Palmer Events Center, Long Center for Performing Arts and Auditorium Shores. This area is generally referred to as the Long Center Corridor. The smaller GWTP market area is bounded by 5th Street to the north, Congress to the east, Lady Bird Lake to the south and Lamar Boulevard to the west. For ease of presentation and for data collection purposes the study area is divided into the following sub-areas, or zones: Table 1: Study Area - Zone Boundaries
Zone North East South West
NW MLK, Jr. Lavaca 10th LamarCW 10th Congress 5th LamarSW * 5th Congress Lady Bird Lake LamarNE 12th IH 35 6th CongressSE 6th IH 35 Lady Bird Lake CongressLC Lady Bird Lake Congress Barton Springs Lamar
*GWTP market area
General Zone Boundary
A map of the complete Study Area is detailed in the following figure.
DOWNTOWN PARKING SUPPLY/DEMAND ANALYSIS AUSTIN, TEXAS FEBRUARY 2, 2009
7
Figure 1: Study Area Map
Source: Google & Walker Parking Consultants
DOWNTOWN PARKING SUPPLY/DEMAND ANALYSIS AUSTIN, TEXAS FEBRUARY 2, 2009 PROJECT # 25-1524.00
8
This section of the report presents our understanding of the current parking characteristics of the Study Area. The information contained herein serves as the basis for analysis of the parking supply and parking needs of the Study Area. Included in this section is a discussion of parking supply, effective supply, observed parking occupancy, current parking demand and the dynamics of the parking system. PARKING SUPPLY The foundation of a parking supply and demand study is an inventory of the existing parking supply. Parking within the Study Area is available in several forms. On-street parking is offered at both metered and non-metered spaces. Metered parking is limited to mostly two-hour time limits, with some three- and five-hour meters. For the most part, on-street parking is signed and restrictions are clearly marked. Off-street parking is available to the public in lots and structures, which are both publicly- and privately-owned facilities. Private parking is available for specific user groups in lots and is often restricted for use by the individual businesses. The inventory is compared to the parking demand to quantify the existence of a parking surplus or deficit. We conducted this analysis on a block-by-block basis within the Study Area, segmenting the demand by block. Based on the data Walker collected, there are a total of 48,912± spaces in the Study Area. Of these spaces, 4,583± are on-street and 44,329± are off-street. Of the off-street spaces, 28,753± are open to the public (65%) and 15,576± are private or restricted-use spaces (35%). Some private parking facilities are not accessible to the public due to gates, or denied entry by other means; and therefore, are not included in the above figures. The table below summarizes the parking supply by zone. A complete block-by-block listing of the parking supply is listed in Appendix A.
CURRENT CONDITIONS
DOWNTOWN PARKING SUPPLY/DEMAND ANALYSIS AUSTIN, TEXAS FEBRUARY 2, 2009 PROJECT # 25-1524.00
9
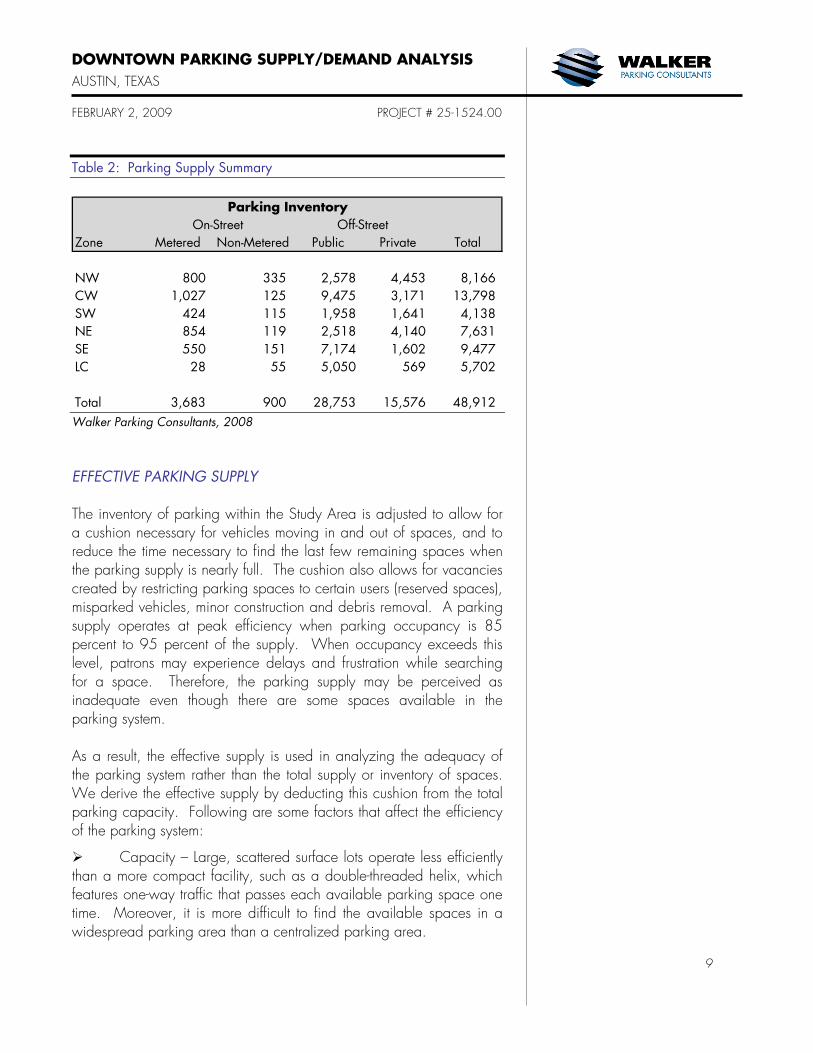
Table 2: Parking Supply Summary
Zone Metered Non-Metered Public Private Total
NW 800 335 2,578 4,453 8,166CW 1,027 125 9,475 3,171 13,798SW 424 115 1,958 1,641 4,138NE 854 119 2,518 4,140 7,631SE 550 151 7,174 1,602 9,477LC 28 55 5,050 569 5,702
Total 3,683 900 28,753 15,576 48,912
On-Street Off-StreetParking Inventory
Walker Parking Consultants, 2008 EFFECTIVE PARKING SUPPLY The inventory of parking within the Study Area is adjusted to allow for a cushion necessary for vehicles moving in and out of spaces, and to reduce the time necessary to find the last few remaining spaces when the parking supply is nearly full. The cushion also allows for vacancies created by restricting parking spaces to certain users (reserved spaces), misparked vehicles, minor construction and debris removal. A parking supply operates at peak efficiency when parking occupancy is 85 percent to 95 percent of the supply. When occupancy exceeds this level, patrons may experience delays and frustration while searching for a space. Therefore, the parking supply may be perceived as inadequate even though there are some spaces available in the parking system. As a result, the effective supply is used in analyzing the adequacy of the parking system rather than the total supply or inventory of spaces. We derive the effective supply by deducting this cushion from the total parking capacity. Following are some factors that affect the efficiency of the parking system:
Capacity – Large, scattered surface lots operate less efficiently than a more compact facility, such as a double-threaded helix, which features one-way traffic that passes each available parking space one time. Moreover, it is more difficult to find the available spaces in a widespread parking area than a centralized parking area.
DOWNTOWN PARKING SUPPLY/DEMAND ANALYSIS AUSTIN, TEXAS FEBRUARY 2, 2009 PROJECT # 25-1524.00
10
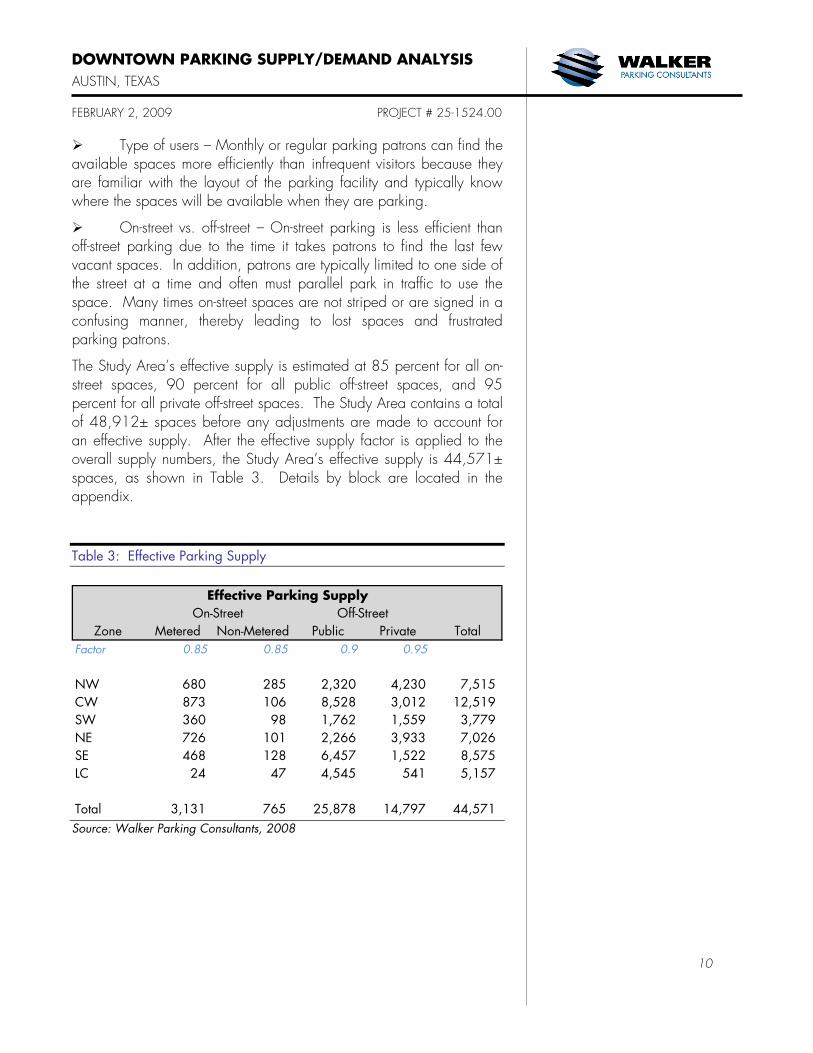
Type of users – Monthly or regular parking patrons can find the available spaces more efficiently than infrequent visitors because they are familiar with the layout of the parking facility and typically know where the spaces will be available when they are parking.
On-street vs. off-street – On-street parking is less efficient than off-street parking due to the time it takes patrons to find the last few vacant spaces. In addition, patrons are typically limited to one side of the street at a time and often must parallel park in traffic to use the space. Many times on-street spaces are not striped or are signed in a confusing manner, thereby leading to lost spaces and frustrated parking patrons.
The Study Area’s effective supply is estimated at 85 percent for all on-street spaces, 90 percent for all public off-street spaces, and 95 percent for all private off-street spaces. The Study Area contains a total of 48,912± spaces before any adjustments are made to account for an effective supply. After the effective supply factor is applied to the overall supply numbers, the Study Area’s effective supply is 44,571± spaces, as shown in Table 3. Details by block are located in the appendix. Table 3: Effective Parking Supply
Zone Metered Non-Metered Public Private TotalFactor 0.85 0.85 0.9 0.95
NW 680 285 2,320 4,230 7,515CW 873 106 8,528 3,012 12,519SW 360 98 1,762 1,559 3,779NE 726 101 2,266 3,933 7,026SE 468 128 6,457 1,522 8,575LC 24 47 4,545 541 5,157
Total 3,131 765 25,878 14,797 44,571
On-Street Off-StreetEffective Parking Supply
Source: Walker Parking Consultants, 2008
DOWNTOWN PARKING SUPPLY/DEMAND ANALYSIS AUSTIN, TEXAS FEBRUARY 2, 2009 PROJECT # 25-1524.00
11
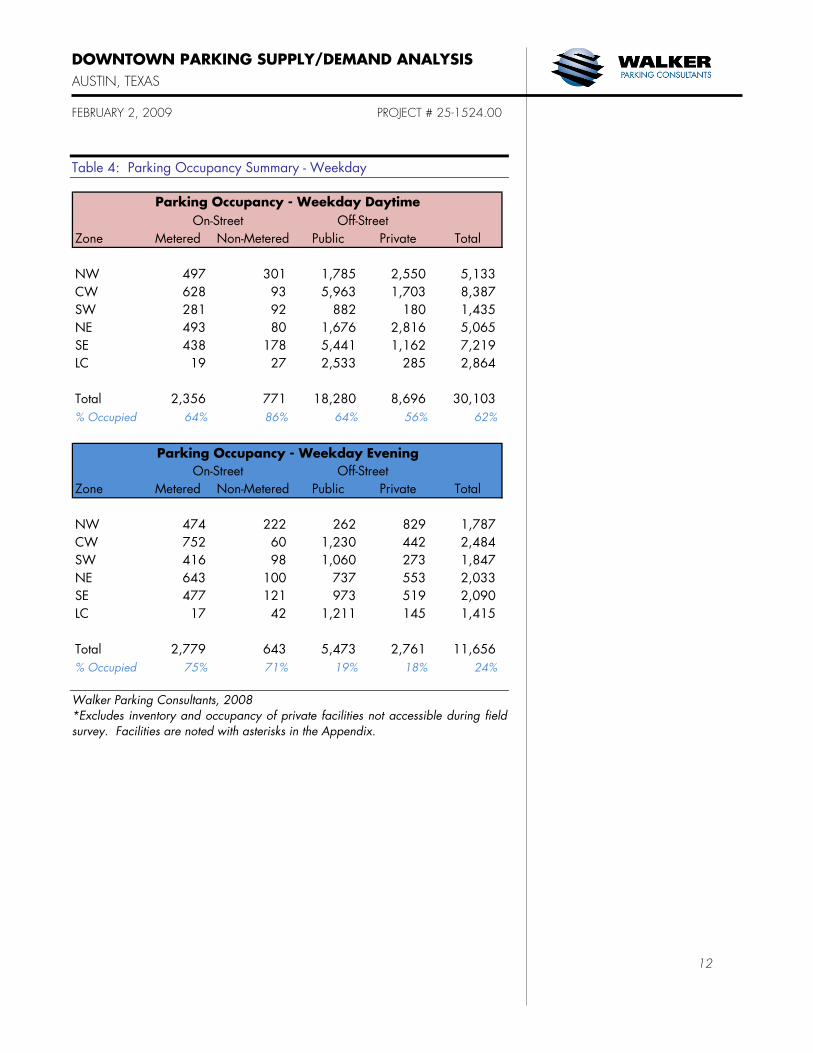
PARKING OCCUPANCY To determine the parking patterns of patrons in the Study Area, the usage of all parking facilities located in the Study Area is evaluated. An understanding of these parking patterns helps define both patron types and parking locations. Occupancy counts were recorded for all on- and off-street parking spaces from December 1st through December 6th, 2008. This date is judged to be representative of a typical weekday and Saturday in Austin. Occupancy counts were performed during: • Weekday business hours • Weekday evening • Saturday daytime • Saturday evening The following table summarizes the observed occupancy rates for on-street and off-street parking by zone. Specific occupancy numbers, on a block-by-block basis are listed in the Appendix B.
DOWNTOWN PARKING SUPPLY/DEMAND ANALYSIS AUSTIN, TEXAS FEBRUARY 2, 2009 PROJECT # 25-1524.00
12
Table 4: Parking Occupancy Summary - Weekday
Zone Metered Non-Metered Public Private Total
NW 497 301 1,785 2,550 5,133CW 628 93 5,963 1,703 8,387SW 281 92 882 180 1,435NE 493 80 1,676 2,816 5,065SE 438 178 5,441 1,162 7,219LC 19 27 2,533 285 2,864
Total 2,356 771 18,280 8,696 30,103% Occupied 64% 86% 64% 56% 62%
Zone Metered Non-Metered Public Private Total
NW 474 222 262 829 1,787CW 752 60 1,230 442 2,484SW 416 98 1,060 273 1,847NE 643 100 737 553 2,033SE 477 121 973 519 2,090LC 17 42 1,211 145 1,415
Total 2,779 643 5,473 2,761 11,656% Occupied 75% 71% 19% 18% 24%
Parking Occupancy - Weekday DaytimeOn-Street Off-Street
Parking Occupancy - Weekday EveningOn-Street Off-Street
Walker Parking Consultants, 2008 *Excludes inventory and occupancy of private facilities not accessible during field survey. Facilities are noted with asterisks in the Appendix.
DOWNTOWN PARKING SUPPLY/DEMAND ANALYSIS AUSTIN, TEXAS FEBRUARY 2, 2009 PROJECT # 25-1524.00
13
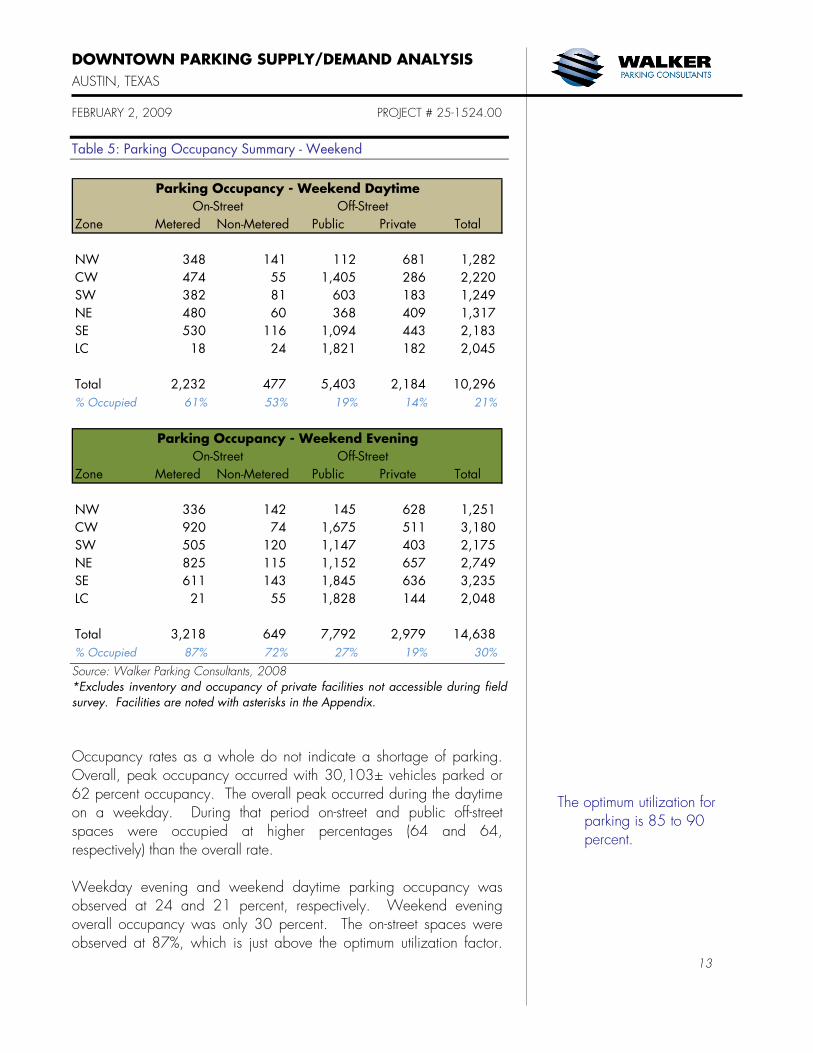
Table 5: Parking Occupancy Summary - Weekend
Zone Metered Non-Metered Public Private Total
NW 348 141 112 681 1,282CW 474 55 1,405 286 2,220SW 382 81 603 183 1,249NE 480 60 368 409 1,317SE 530 116 1,094 443 2,183LC 18 24 1,821 182 2,045
Total 2,232 477 5,403 2,184 10,296% Occupied 61% 53% 19% 14% 21%
Zone Metered Non-Metered Public Private Total
NW 336 142 145 628 1,251CW 920 74 1,675 511 3,180SW 505 120 1,147 403 2,175NE 825 115 1,152 657 2,749SE 611 143 1,845 636 3,235LC 21 55 1,828 144 2,048
Total 3,218 649 7,792 2,979 14,638% Occupied 87% 72% 27% 19% 30%
Parking Occupancy - Weekend DaytimeOn-Street Off-Street
Parking Occupancy - Weekend EveningOn-Street Off-Street
Source: Walker Parking Consultants, 2008 *Excludes inventory and occupancy of private facilities not accessible during field survey. Facilities are noted with asterisks in the Appendix. Occupancy rates as a whole do not indicate a shortage of parking. Overall, peak occupancy occurred with 30,103± vehicles parked or 62 percent occupancy. The overall peak occurred during the daytime on a weekday. During that period on-street and public off-street spaces were occupied at higher percentages (64 and 64, respectively) than the overall rate. Weekday evening and weekend daytime parking occupancy was observed at 24 and 21 percent, respectively. Weekend evening overall occupancy was only 30 percent. The on-street spaces were observed at 87%, which is just above the optimum utilization factor.
The optimum utilization for parking is 85 to 90 percent.
DOWNTOWN PARKING SUPPLY/DEMAND ANALYSIS AUSTIN, TEXAS FEBRUARY 2, 2009 PROJECT # 25-1524.00
14
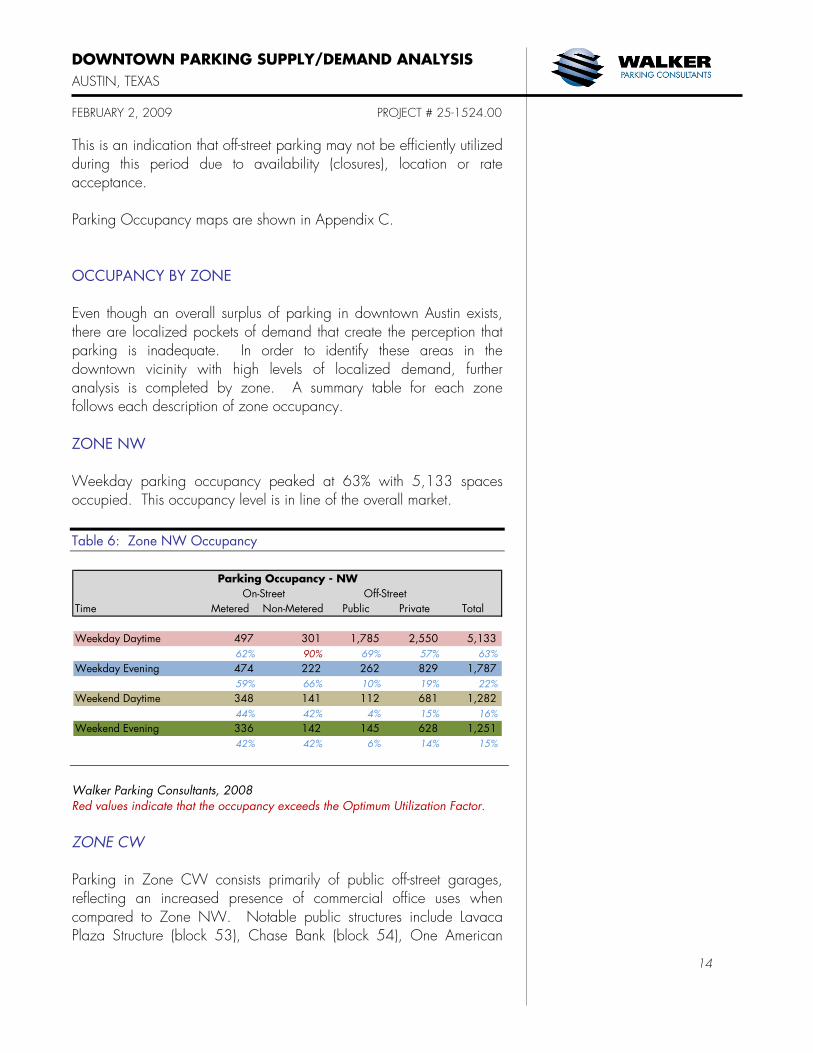
This is an indication that off-street parking may not be efficiently utilized during this period due to availability (closures), location or rate acceptance. Parking Occupancy maps are shown in Appendix C. OCCUPANCY BY ZONE Even though an overall surplus of parking in downtown Austin exists, there are localized pockets of demand that create the perception that parking is inadequate. In order to identify these areas in the downtown vicinity with high levels of localized demand, further analysis is completed by zone. A summary table for each zone follows each description of zone occupancy. ZONE NW Weekday parking occupancy peaked at 63% with 5,133 spaces occupied. This occupancy level is in line of the overall market. Table 6: Zone NW Occupancy
Time Metered Non-Metered Public Private Total
Weekday Daytime 497 301 1,785 2,550 5,13362% 90% 69% 57% 63%
Weekday Evening 474 222 262 829 1,78759% 66% 10% 19% 22%
Weekend Daytime 348 141 112 681 1,28244% 42% 4% 15% 16%
Weekend Evening 336 142 145 628 1,25142% 42% 6% 14% 15%
On-Street Off-StreetParking Occupancy - NW
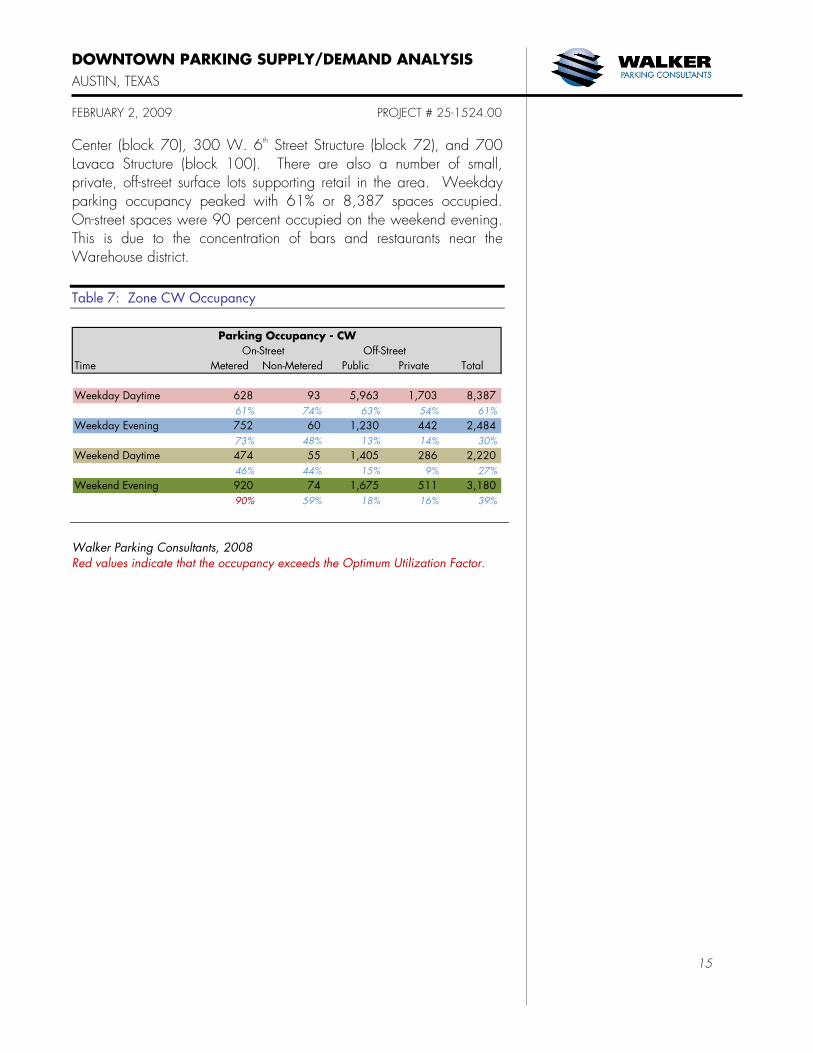
Walker Parking Consultants, 2008 Red values indicate that the occupancy exceeds the Optimum Utilization Factor. ZONE CW Parking in Zone CW consists primarily of public off-street garages, reflecting an increased presence of commercial office uses when compared to Zone NW. Notable public structures include Lavaca Plaza Structure (block 53), Chase Bank (block 54), One American
DOWNTOWN PARKING SUPPLY/DEMAND ANALYSIS AUSTIN, TEXAS FEBRUARY 2, 2009 PROJECT # 25-1524.00
15
Center (block 70), 300 W. 6th Street Structure (block 72), and 700 Lavaca Structure (block 100). There are also a number of small, private, off-street surface lots supporting retail in the area. Weekday parking occupancy peaked with 61% or 8,387 spaces occupied. On-street spaces were 90 percent occupied on the weekend evening. This is due to the concentration of bars and restaurants near the Warehouse district. Table 7: Zone CW Occupancy
Time Metered Non-Metered Public Private Total
Weekday Daytime 628 93 5,963 1,703 8,38761% 74% 63% 54% 61%
Weekday Evening 752 60 1,230 442 2,48473% 48% 13% 14% 30%
Weekend Daytime 474 55 1,405 286 2,22046% 44% 15% 9% 27%
Weekend Evening 920 74 1,675 511 3,18090% 59% 18% 16% 39%
Parking Occupancy - CWOn-Street Off-Street
Walker Parking Consultants, 2008 Red values indicate that the occupancy exceeds the Optimum Utilization Factor.
DOWNTOWN PARKING SUPPLY/DEMAND ANALYSIS AUSTIN, TEXAS FEBRUARY 2, 2009 PROJECT # 25-1524.00
16
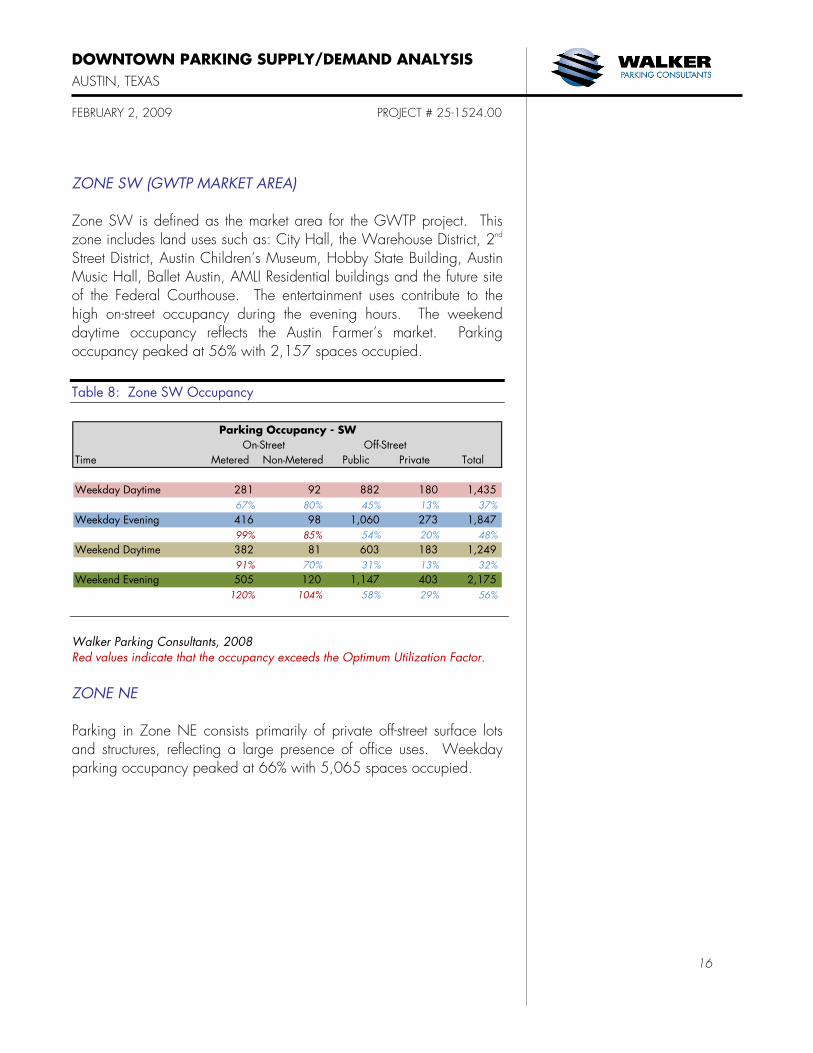
ZONE SW (GWTP MARKET AREA) Zone SW is defined as the market area for the GWTP project. This zone includes land uses such as: City Hall, the Warehouse District, 2nd Street District, Austin Children’s Museum, Hobby State Building, Austin Music Hall, Ballet Austin, AMLI Residential buildings and the future site of the Federal Courthouse. The entertainment uses contribute to the high on-street occupancy during the evening hours. The weekend daytime occupancy reflects the Austin Farmer’s market. Parking occupancy peaked at 56% with 2,157 spaces occupied. Table 8: Zone SW Occupancy
Time Metered Non-Metered Public Private Total
Weekday Daytime 281 92 882 180 1,43567% 80% 45% 13% 37%
Weekday Evening 416 98 1,060 273 1,84799% 85% 54% 20% 48%
Weekend Daytime 382 81 603 183 1,24991% 70% 31% 13% 32%
Weekend Evening 505 120 1,147 403 2,175120% 104% 58% 29% 56%
Parking Occupancy - SWOn-Street Off-Street
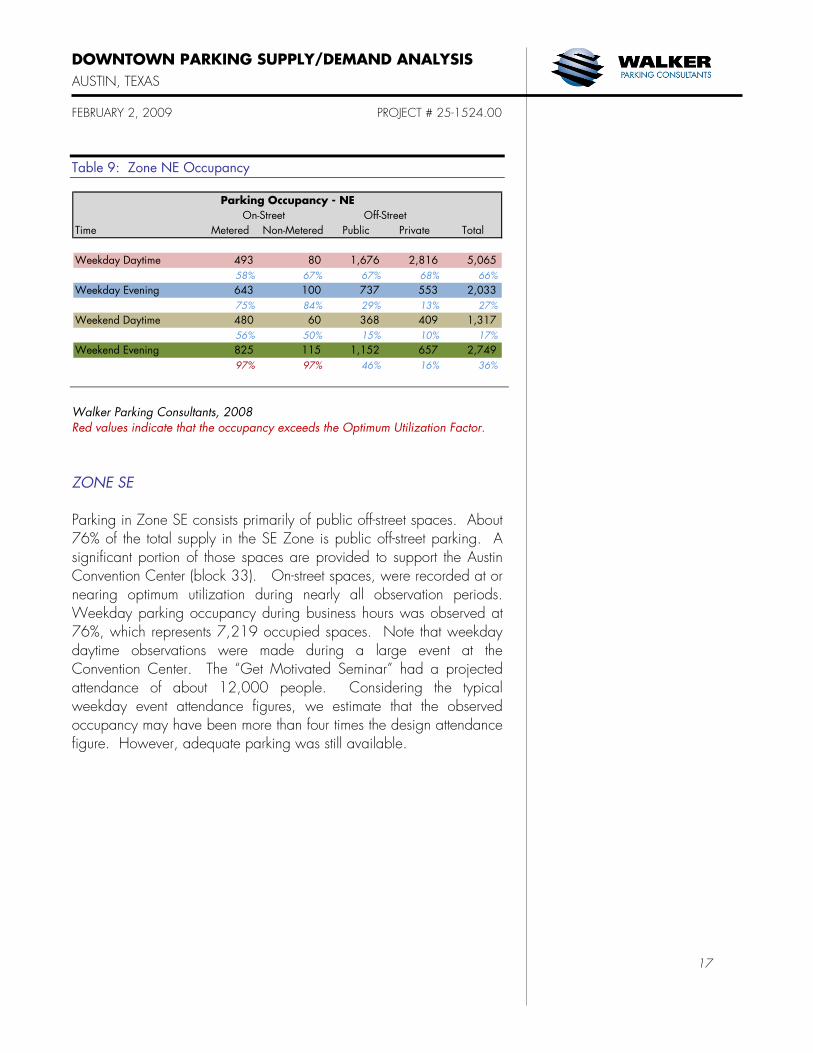
Walker Parking Consultants, 2008 Red values indicate that the occupancy exceeds the Optimum Utilization Factor. ZONE NE Parking in Zone NE consists primarily of private off-street surface lots and structures, reflecting a large presence of office uses. Weekday parking occupancy peaked at 66% with 5,065 spaces occupied.
DOWNTOWN PARKING SUPPLY/DEMAND ANALYSIS AUSTIN, TEXAS FEBRUARY 2, 2009 PROJECT # 25-1524.00
17
Table 9: Zone NE Occupancy
Time Metered Non-Metered Public Private Total
Weekday Daytime 493 80 1,676 2,816 5,06558% 67% 67% 68% 66%
Weekday Evening 643 100 737 553 2,03375% 84% 29% 13% 27%
Weekend Daytime 480 60 368 409 1,31756% 50% 15% 10% 17%
Weekend Evening 825 115 1,152 657 2,74997% 97% 46% 16% 36%
Parking Occupancy - NEOn-Street Off-Street
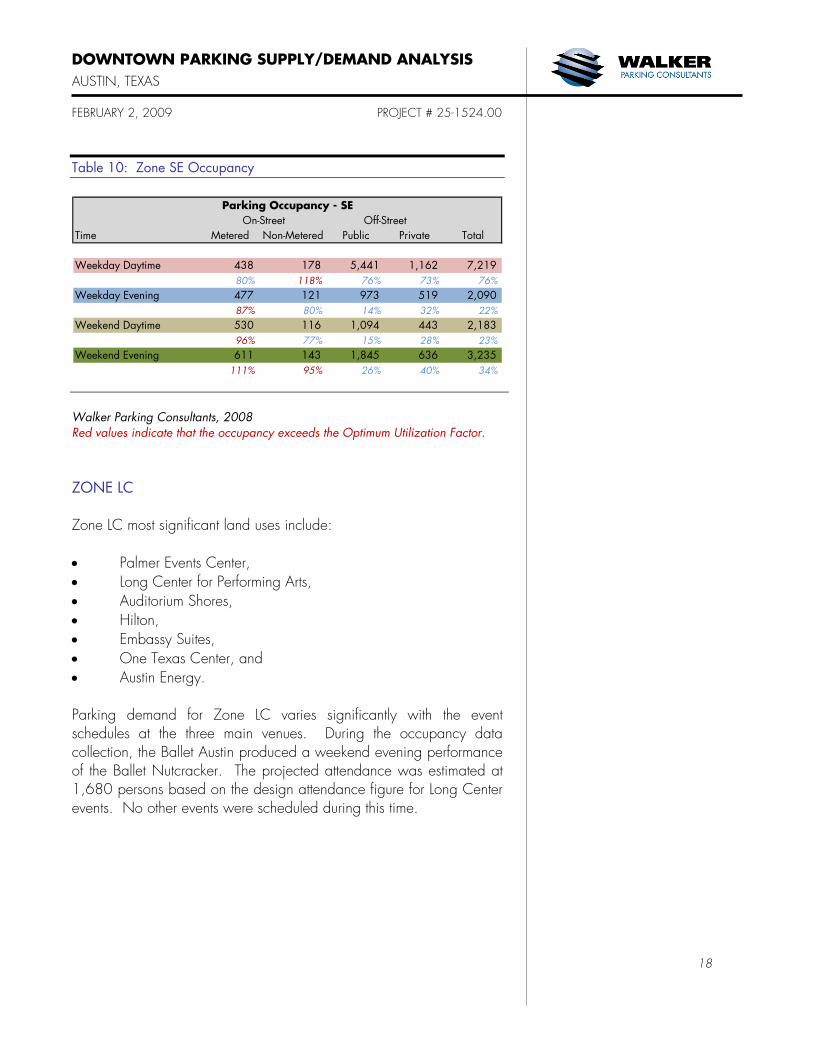
Walker Parking Consultants, 2008 Red values indicate that the occupancy exceeds the Optimum Utilization Factor. ZONE SE Parking in Zone SE consists primarily of public off-street spaces. About 76% of the total supply in the SE Zone is public off-street parking. A significant portion of those spaces are provided to support the Austin Convention Center (block 33). On-street spaces, were recorded at or nearing optimum utilization during nearly all observation periods. Weekday parking occupancy during business hours was observed at 76%, which represents 7,219 occupied spaces. Note that weekday daytime observations were made during a large event at the Convention Center. The “Get Motivated Seminar” had a projected attendance of about 12,000 people. Considering the typical weekday event attendance figures, we estimate that the observed occupancy may have been more than four times the design attendance figure. However, adequate parking was still available.
DOWNTOWN PARKING SUPPLY/DEMAND ANALYSIS AUSTIN, TEXAS FEBRUARY 2, 2009 PROJECT # 25-1524.00
18
Table 10: Zone SE Occupancy
Time Metered Non-Metered Public Private Total
Weekday Daytime 438 178 5,441 1,162 7,21980% 118% 76% 73% 76%
Weekday Evening 477 121 973 519 2,09087% 80% 14% 32% 22%
Weekend Daytime 530 116 1,094 443 2,18396% 77% 15% 28% 23%
Weekend Evening 611 143 1,845 636 3,235111% 95% 26% 40% 34%
Parking Occupancy - SEOn-Street Off-Street
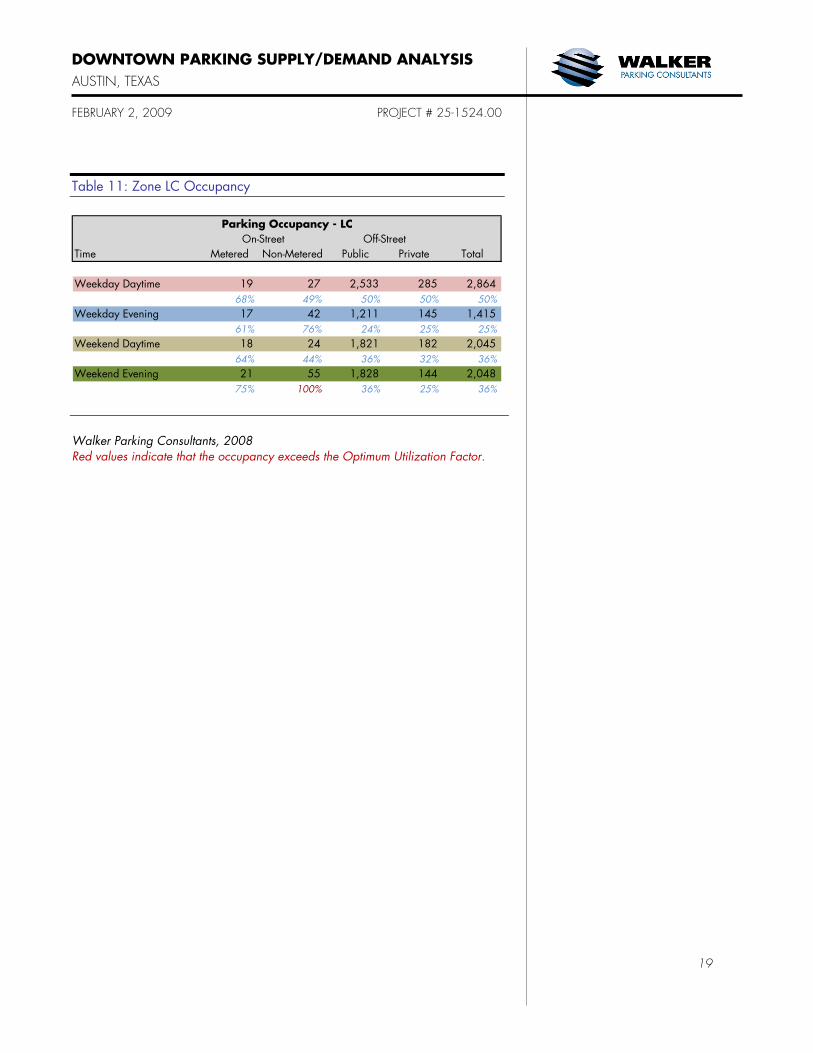
Walker Parking Consultants, 2008 Red values indicate that the occupancy exceeds the Optimum Utilization Factor. ZONE LC Zone LC most significant land uses include: • Palmer Events Center, • Long Center for Performing Arts, • Auditorium Shores, • Hilton, • Embassy Suites, • One Texas Center, and • Austin Energy. Parking demand for Zone LC varies significantly with the event schedules at the three main venues. During the occupancy data collection, the Ballet Austin produced a weekend evening performance of the Ballet Nutcracker. The projected attendance was estimated at 1,680 persons based on the design attendance figure for Long Center events. No other events were scheduled during this time.
DOWNTOWN PARKING SUPPLY/DEMAND ANALYSIS AUSTIN, TEXAS FEBRUARY 2, 2009 PROJECT # 25-1524.00
19
Table 11: Zone LC Occupancy
Time Metered Non-Metered Public Private Total
Weekday Daytime 19 27 2,533 285 2,86468% 49% 50% 50% 50%
Weekday Evening 17 42 1,211 145 1,41561% 76% 24% 25% 25%
Weekend Daytime 18 24 1,821 182 2,04564% 44% 36% 32% 36%
Weekend Evening 21 55 1,828 144 2,04875% 100% 36% 25% 36%
Parking Occupancy - LCOn-Street Off-Street
Walker Parking Consultants, 2008 Red values indicate that the occupancy exceeds the Optimum Utilization Factor.
DOWNTOWN PARKING SUPPLY/DEMAND ANALYSIS AUSTIN, TEXAS FEBRUARY 2, 2009 PROJECT # 25-1524.00
20
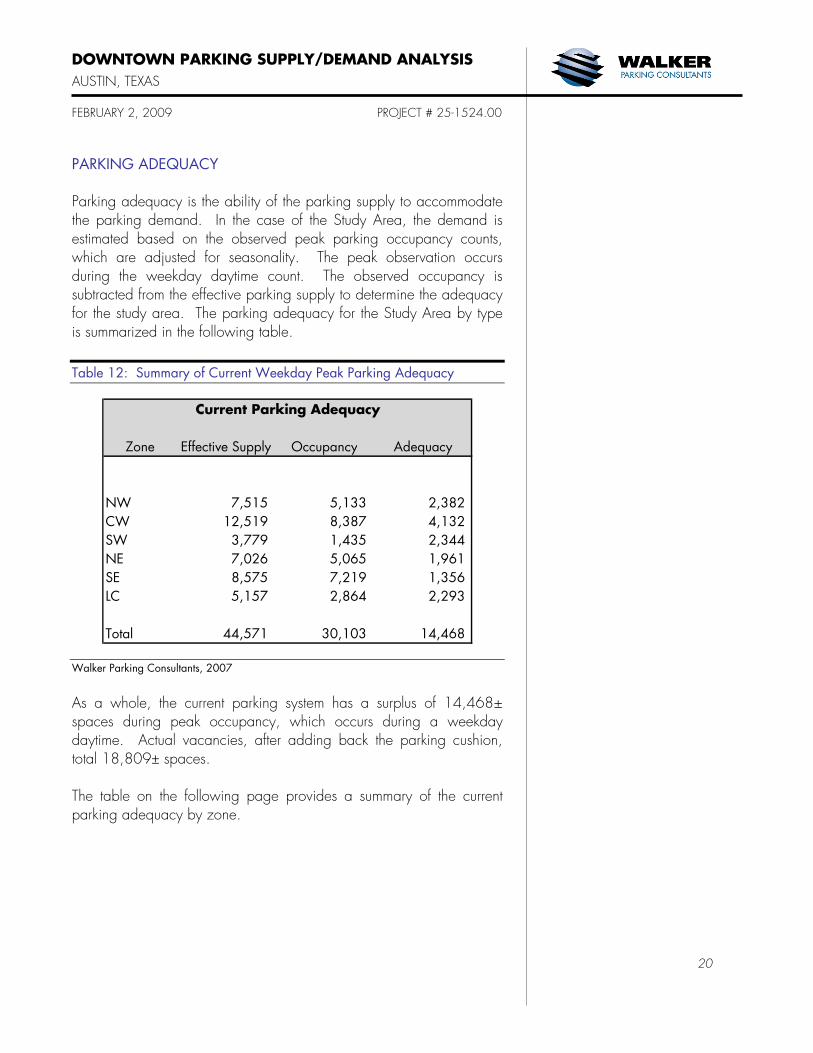
PARKING ADEQUACY Parking adequacy is the ability of the parking supply to accommodate the parking demand. In the case of the Study Area, the demand is estimated based on the observed peak parking occupancy counts, which are adjusted for seasonality. The peak observation occurs during the weekday daytime count. The observed occupancy is subtracted from the effective parking supply to determine the adequacy for the study area. The parking adequacy for the Study Area by type is summarized in the following table. Table 12: Summary of Current Weekday Peak Parking Adequacy
Zone Effective Supply Occupancy Adequacy
NW 7,515 5,133 2,382CW 12,519 8,387 4,132SW 3,779 1,435 2,344NE 7,026 5,065 1,961SE 8,575 7,219 1,356LC 5,157 2,864 2,293
Total 44,571 30,103 14,468
Current Parking Adequacy
Walker Parking Consultants, 2007
As a whole, the current parking system has a surplus of 14,468± spaces during peak occupancy, which occurs during a weekday daytime. Actual vacancies, after adding back the parking cushion, total 18,809± spaces. The table on the following page provides a summary of the current parking adequacy by zone.
DOWNTOWN PARKING SUPPLY/DEMAND ANALYSIS AUSTIN, TEXAS FEBRUARY 2, 2009 PROJECT # 25-1524.00
21
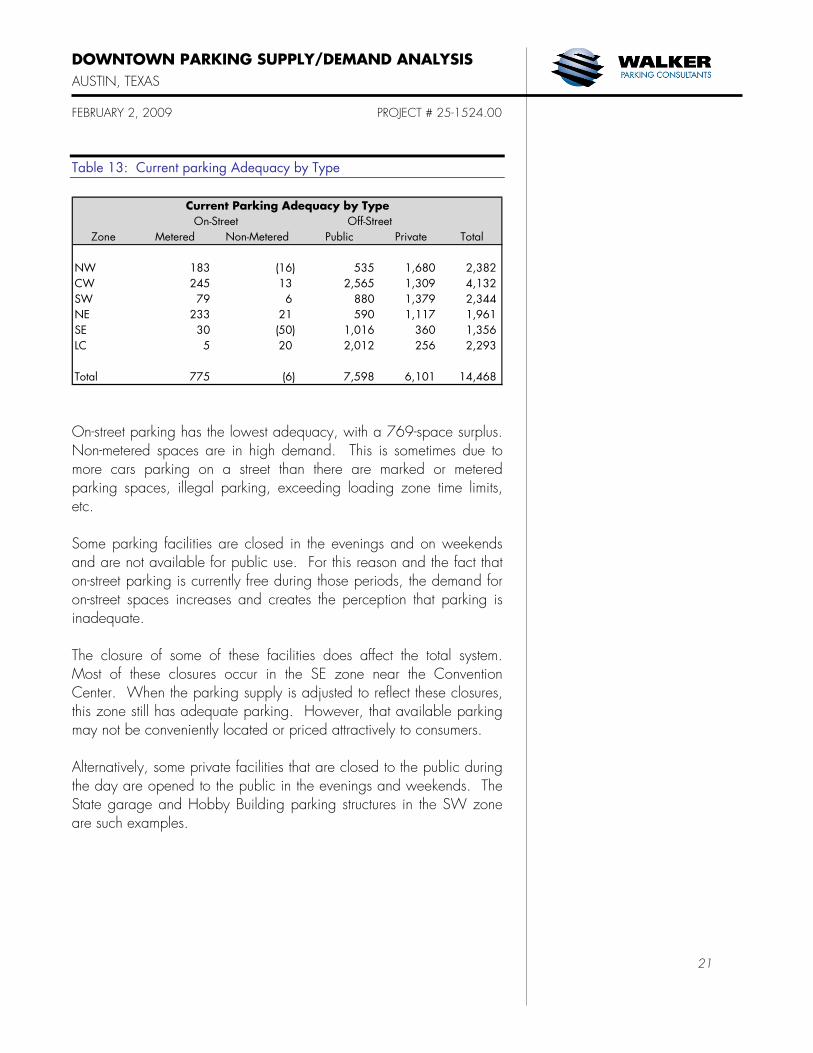
Table 13: Current parking Adequacy by Type
Zone Metered Non-Metered Public Private Total
NW 183 (16) 535 1,680 2,382CW 245 13 2,565 1,309 4,132SW 79 6 880 1,379 2,344NE 233 21 590 1,117 1,961SE 30 (50) 1,016 360 1,356LC 5 20 2,012 256 2,293
Total 775 (6) 7,598 6,101 14,468
Off-StreetCurrent Parking Adequacy by Type
On-Street
On-street parking has the lowest adequacy, with a 769-space surplus. Non-metered spaces are in high demand. This is sometimes due to more cars parking on a street than there are marked or metered parking spaces, illegal parking, exceeding loading zone time limits, etc. Some parking facilities are closed in the evenings and on weekends and are not available for public use. For this reason and the fact that on-street parking is currently free during those periods, the demand for on-street spaces increases and creates the perception that parking is inadequate. The closure of some of these facilities does affect the total system. Most of these closures occur in the SE zone near the Convention Center. When the parking supply is adjusted to reflect these closures, this zone still has adequate parking. However, that available parking may not be conveniently located or priced attractively to consumers. Alternatively, some private facilities that are closed to the public during the day are opened to the public in the evenings and weekends. The State garage and Hobby Building parking structures in the SW zone are such examples.
DOWNTOWN PARKING SUPPLY/DEMAND ANALYSIS AUSTIN, TEXAS FEBRUARY 2, 2009 PROJECT # 25-1524.00
22
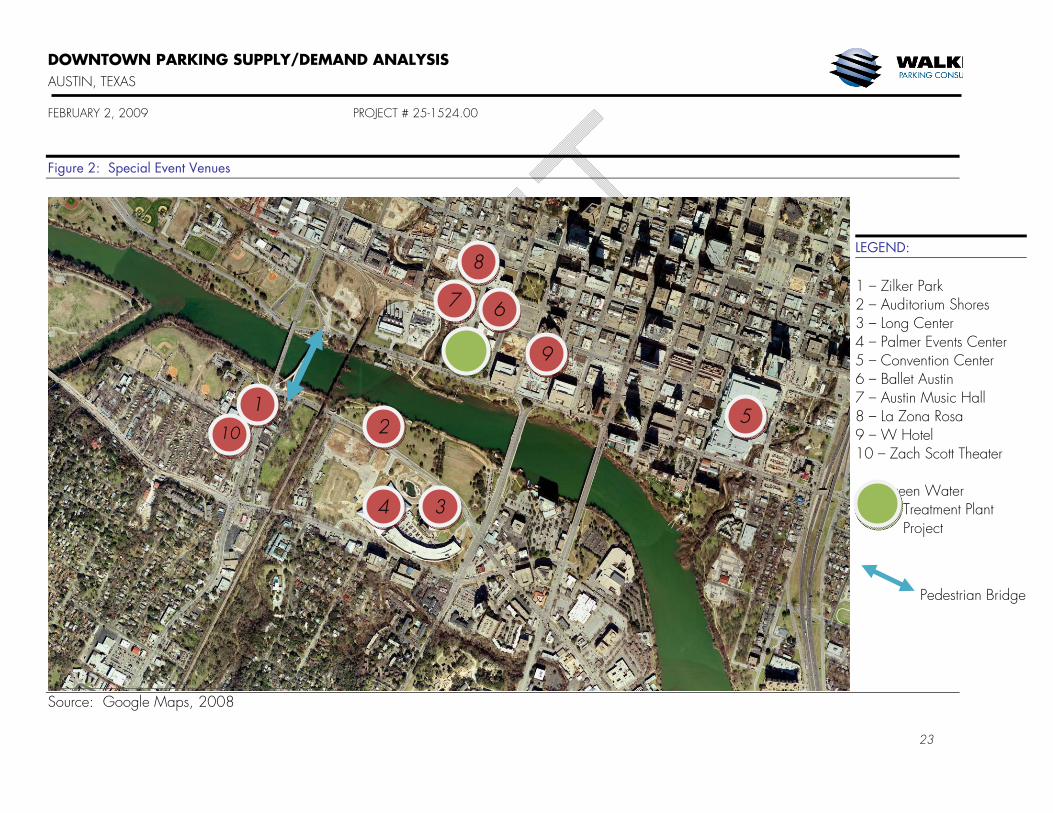
Downtown Austin is host to numerous special events throughout the year. Dubbed the “Live Music Capital of the World,” a number of venues support the local music scene. Austin’s vibrant nightlife supports a number of annual festivals. The mild climate lends itself to a significant number of races and outdoor sporting events. In addition to special events, there are several event venues within the study area, including: • Austin Convention Center, • Palmer Events Center, • Long Center for Performing Arts, • Auditorium Shores, • Zilker Park, • Austin Music Hall and • La Zona Rosa. Zach Scott Theater is just outside of the study area, but events held at this venue also impact parking demand within the area. A map of the local event venues is shown on the following page.
EVENT PARKING
DOWNTOWN PARKING SUPPLY/DEMAND ANALYSIS AUSTIN, TEXAS FEBRUARY 2, 2009 PROJECT # 25-1524.00
23
Figure 2: Special Event Venues
Source: Google Maps, 2008
9
2
34
5
67
8
1 10
LEGEND: 1 – Zilker Park 2 – Auditorium Shores 3 – Long Center 4 – Palmer Events Center 5 – Convention Center 6 – Ballet Austin 7 – Austin Music Hall 8 – La Zona Rosa 9 – W Hotel 10 – Zach Scott Theater Green Water
Treatment Plant Project
Pedestrian Bridge
DOWNTOWN PARKING SUPPLY/DEMAND ANALYSIS AUSTIN, TEXAS FEBRUARY 2, 2009 PROJECT # 25-1524.00
24
While each of these venues has a parking operations plan in place, when events occur simultaneously, parking and traffic conditions may be severely impacted. Large annual events in which parking demand exceeds the supply within a reasonable walking distance of the subject property include: • Reggae Fest (Auditorium Shores): A two day festival with total attendance of 50,000.
• Feast of Sharing (Palmer Events Center): A one-day meal sharing program with total attendance over 9,000.
• Kite Festival (Zilker Park): A one-day event occurring on the first Sunday in March. Estimated attendance is between 15,000 and 20,000.
• Austin City Limits (Zilker Park): Fall festival occurring over a Friday, Saturday and Sunday with a daily attendance over 65,000 people.
• 4th of July celebration (Auditorium Shores): One-day event with over 75,000 attendees.
• Trail of Lights (Zilker Park): Ten day event in late December with 150,000 total attendees. Walker interviewed representatives from each of the venues and in some cases reviewed annual event schedules and attendance data. Our findings are summarized below. AUSTIN CONVENTION CENTER (BLOCK 33) The Austin Convention Center (ACC) encompasses 6 blocks in the SE zone. The 881,400 square foot center caters to local, regional and national shows. In 2008, the ACC held 268 events, with a total of 378,438 attendees. Parking is typically accommodated by the two City-owned parking structures that serve the development; a 1,010-space structure on block 7 and a 650-space structure on block 38. On-street parking is also available in the area. A review of 2008 events shows that parking demand exceeds the convention center supply approximately 20 times. The largest events are shown in the following table. The additional parking is supplied within the SE zone.
DOWNTOWN PARKING SUPPLY/DEMAND ANALYSIS AUSTIN, TEXAS FEBRUARY 2, 2009 PROJECT # 25-1524.00
25
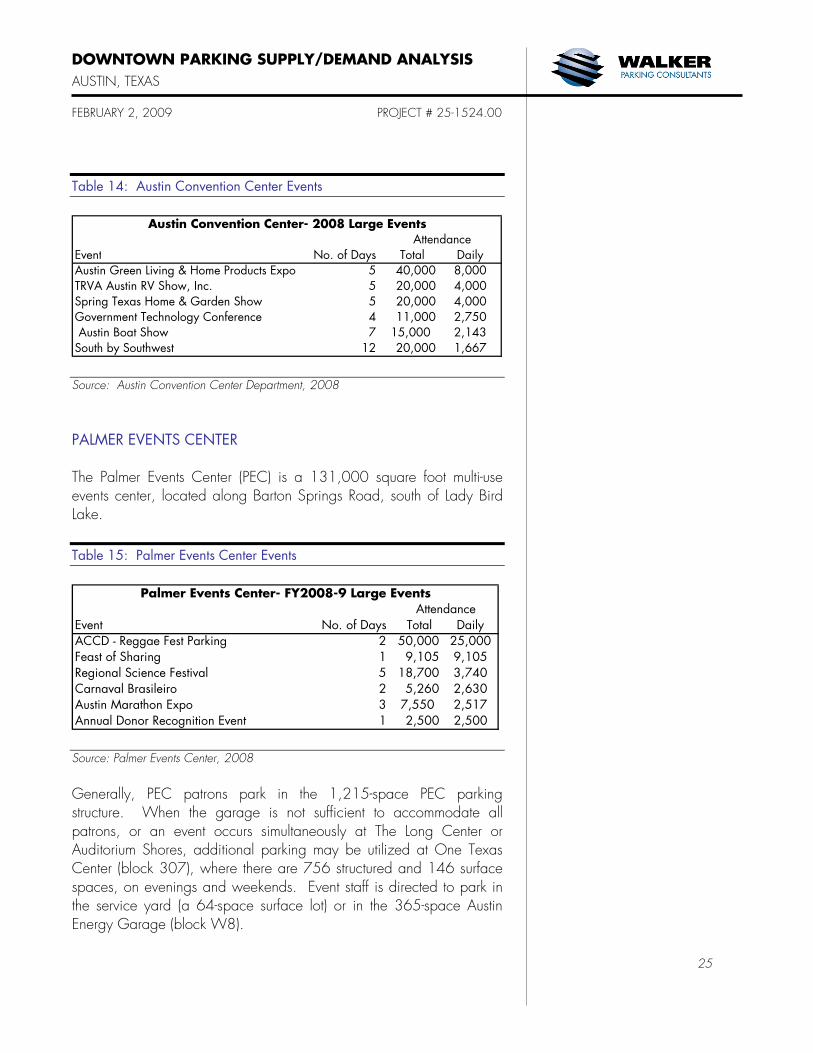
Table 14: Austin Convention Center Events
Event No. of Days Total Daily Austin Green Living & Home Products Expo 5 40,000 8,000TRVA Austin RV Show, Inc. 5 20,000 4,000Spring Texas Home & Garden Show 5 20,000 4,000Government Technology Conference 4 11,000 2,750 Austin Boat Show 7 15,000 2,143South by Southwest 12 20,000 1,667
AttendanceAustin Convention Center- 2008 Large Events
Source: Austin Convention Center Department, 2008 PALMER EVENTS CENTER The Palmer Events Center (PEC) is a 131,000 square foot multi-use events center, located along Barton Springs Road, south of Lady Bird Lake. Table 15: Palmer Events Center Events
Event No. of Days Total Daily ACCD - Reggae Fest Parking 2 50,000 25,000Feast of Sharing 1 9,105 9,105Regional Science Festival 5 18,700 3,740Carnaval Brasileiro 2 5,260 2,630Austin Marathon Expo 3 7,550 2,517Annual Donor Recognition Event 1 2,500 2,500
Palmer Events Center- FY2008-9 Large EventsAttendance
Source: Palmer Events Center, 2008 Generally, PEC patrons park in the 1,215-space PEC parking structure. When the garage is not sufficient to accommodate all patrons, or an event occurs simultaneously at The Long Center or Auditorium Shores, additional parking may be utilized at One Texas Center (block 307), where there are 756 structured and 146 surface spaces, on evenings and weekends. Event staff is directed to park in the service yard (a 64-space surface lot) or in the 365-space Austin Energy Garage (block W8).
DOWNTOWN PARKING SUPPLY/DEMAND ANALYSIS AUSTIN, TEXAS FEBRUARY 2, 2009 PROJECT # 25-1524.00
26
PEC representatives indicate that the biggest parking issues occur during simultaneous events with Auditorium Shores and/or The Long Center. While, adequate parking may exist to accommodate all events, roadway congestion and wayfinding seem to be the biggest problems. Additionally, patrons perceive the alternative parking at One Texas Center and Austin Energy to be too far to walk. This may be a line-of-sight issue, as the parking structures are hidden behind their respective buildings. The approximate distance from the One Texas garage to PEC is 0.15 mile, or 801 feet. Austin Energy is even closer. LONG CENTER FOR PERFORMING ARTS The Long Center for Performing Arts is located adjacent to the Palmer Events Center on West River Drive. The Long Center opened in March 2008 and includes Dell Hall (2,400 seats), Rollins Studio Theater (up to 100 seats), and City Terrace (an outdoor venue). With little historical attendance data to review, Long Center reports average attendance of 1,330 and a design attendance of 1,680 and projects 110 events per year. Assuming 2.5 people per car, that equates to a projected need for 672 parking spaces for patrons. Patrons are directed to park in PEC garage, unless an event is occurring simultaneously at the PEC. The City pays to shuttle patrons from the Convention Center garage during those parking conflicts. The Convention Center garage is in the heart of the SE zone, approximately one mile from the Long Center. The planned GWTP garage will be approximately 0.7 mile from the Long Center. Again, staff is directed to park in the service yard or at One Texas Center or Austin Energy on evenings and weekends. AUDITORIUM SHORES Auditorium Shores is an outdoor venue along the southern bank of Lady Bird Lake. Events typically run from March to December, with 19 events days per year. Event attendance ranges from 2,500+ for marathons to 150,000+ for the First Night Austin, New Year’s celebration (1,000+ to 32,000+ cars). If no events are occurring simultaneously at PEC or Long Center, patrons may park at the PEC garage, One Texas Center, Austin
DOWNTOWN PARKING SUPPLY/DEMAND ANALYSIS AUSTIN, TEXAS FEBRUARY 2, 2009 PROJECT # 25-1524.00
27
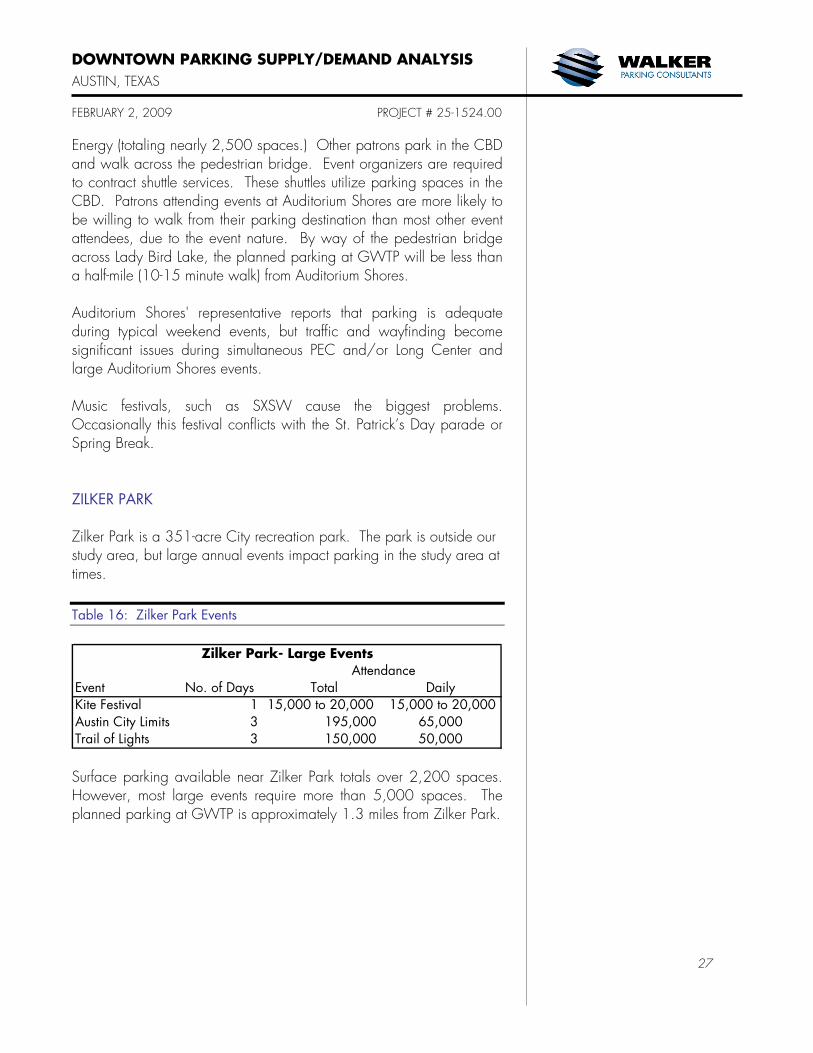
Energy (totaling nearly 2,500 spaces.) Other patrons park in the CBD and walk across the pedestrian bridge. Event organizers are required to contract shuttle services. These shuttles utilize parking spaces in the CBD. Patrons attending events at Auditorium Shores are more likely to be willing to walk from their parking destination than most other event attendees, due to the event nature. By way of the pedestrian bridge across Lady Bird Lake, the planned parking at GWTP will be less than a half-mile (10-15 minute walk) from Auditorium Shores. Auditorium Shores' representative reports that parking is adequate during typical weekend events, but traffic and wayfinding become significant issues during simultaneous PEC and/or Long Center and large Auditorium Shores events. Music festivals, such as SXSW cause the biggest problems. Occasionally this festival conflicts with the St. Patrick’s Day parade or Spring Break. ZILKER PARK Zilker Park is a 351-acre City recreation park. The park is outside our study area, but large annual events impact parking in the study area at times. Table 16: Zilker Park Events
Event No. of Days Total Daily Kite Festival 1 15,000 to 20,000 15,000 to 20,000Austin City Limits 3 195,000 65,000Trail of Lights 3 150,000 50,000
Zilker Park- Large EventsAttendance
Surface parking available near Zilker Park totals over 2,200 spaces. However, most large events require more than 5,000 spaces. The planned parking at GWTP is approximately 1.3 miles from Zilker Park.
DOWNTOWN PARKING SUPPLY/DEMAND ANALYSIS AUSTIN, TEXAS FEBRUARY 2, 2009 PROJECT # 25-1524.00
28
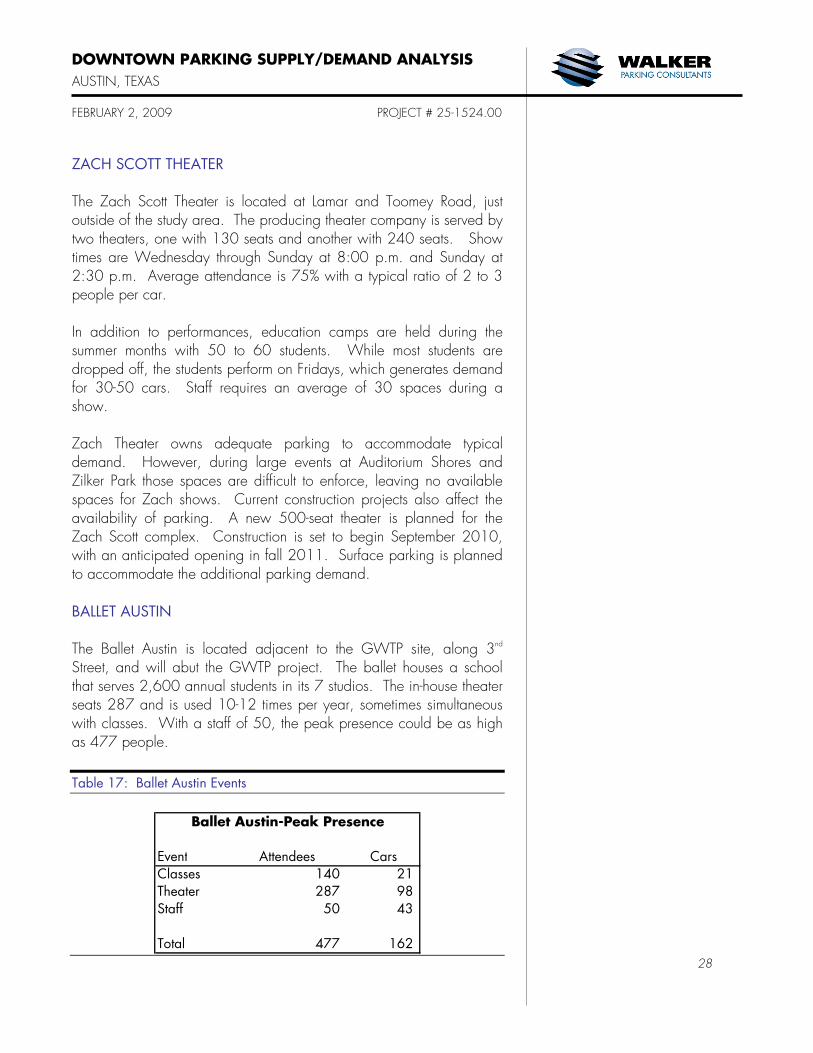
ZACH SCOTT THEATER The Zach Scott Theater is located at Lamar and Toomey Road, just outside of the study area. The producing theater company is served by two theaters, one with 130 seats and another with 240 seats. Show times are Wednesday through Sunday at 8:00 p.m. and Sunday at 2:30 p.m. Average attendance is 75% with a typical ratio of 2 to 3 people per car. In addition to performances, education camps are held during the summer months with 50 to 60 students. While most students are dropped off, the students perform on Fridays, which generates demand for 30-50 cars. Staff requires an average of 30 spaces during a show. Zach Theater owns adequate parking to accommodate typical demand. However, during large events at Auditorium Shores and Zilker Park those spaces are difficult to enforce, leaving no available spaces for Zach shows. Current construction projects also affect the availability of parking. A new 500-seat theater is planned for the Zach Scott complex. Construction is set to begin September 2010, with an anticipated opening in fall 2011. Surface parking is planned to accommodate the additional parking demand. BALLET AUSTIN The Ballet Austin is located adjacent to the GWTP site, along 3nd Street, and will abut the GWTP project. The ballet houses a school that serves 2,600 annual students in its 7 studios. The in-house theater seats 287 and is used 10-12 times per year, sometimes simultaneous with classes. With a staff of 50, the peak presence could be as high as 477 people. Table 17: Ballet Austin Events
Event Attendees CarsClasses 140 21Theater 287 98Staff 50 43
Total 477 162
Ballet Austin-Peak Presence
DOWNTOWN PARKING SUPPLY/DEMAND ANALYSIS AUSTIN, TEXAS FEBRUARY 2, 2009 PROJECT # 25-1524.00
29
The Ballet maintains 30-40 parking spaces in its lot, but also instructs their patrons to park in City Hall (2 hr. validation), which is a 1,200 ft. walk, or at meters. Staff has secured three-year contracts with the adjacent State Garage. AUSTIN MUSIC HALL The Austin Music Hall is located adjacent to the Austin Ballet on block 188. This venue and Zona Rosa (a smaller entertainment venue one block away) reportedly will have a combined 230 events per year with a typical attendance of 1,500 patrons. This is projected to add about 500 cars to the area per event. W HOTEL The W Hotel is currently under construction on block 21, just two blocks from the GWTP site. The hotel is reported to contain 252 hotel rooms, 159 condos, 37,000 s.f. of office, 18,000 s.f. of retail, and a 2,700 seat music venue. The venue will be used 200 nights per year for television show tapings and 70 nights per year for large special events. The development has planned parking to support the typical demand, but not enough parking to accommodate special events. This demand will be required to be met within the SW zone.
DOWNTOWN PARKING SUPPLY/DEMAND ANALYSIS AUSTIN, TEXAS FEBRUARY 2, 2009 PROJECT # 25-1524.00
30
There are basically two different methods for projecting future parking volumes. One method involves the use of historical growth rates. The other method involves the collection of information regarding the proposed development that is likely to occur in terms of land use and square footage changes. This information regarding future developments allows the projecting of vehicular volumes and parking demands for these new uses. However, as the planning horizon is projected further and further into the future, the ability to predict these changes becomes more and more difficult and less accurate. Because the City tracks all future developments, we are able to evaluate future parking demand, based on actual planned developments. PROJECTED PARKING DEMAND Parking demand refers to the amount of parking that is estimated to be used at a particular time, place, and price. It is a critical factor in evaluating parking problems and solutions. Parking demand is affected by vehicle ownership, trip rates, mode split, length of stay, geographic location, type of trip (work, shopping, special event), the quality of public transportation and factors such as fuel and parking costs. The methodology employed by Walker to project future demand combines the baseline demand which is equal to the observed peak weekday occupancy level, and any incremental change or growth in demand resulting from new land uses entering the Study Area. The baseline and incremental increase in demand are added together and then compared to the existing effective parking supply to determine the overall parking adequacy. New land uses to be located in the defined Study Area can impact the general need for parking. It is important to understand that parking is a derived demand and is susceptible to fluctuations based on changes in underlying economic conditions that drive the demand for primary activities in the Study Area. The City of Austin has exhibited a positive growth trend during the past decade with an elevated level of community development and revitalization. There are several proposed urban renewal and new downtown development projects that may directly impact public parking in downtown Austin. City representatives provided Walker with a list of developments that may come to fruition within the next five years.
FUTURE PARKING CONDITIONS
DOWNTOWN PARKING SUPPLY/DEMAND ANALYSIS AUSTIN, TEXAS FEBRUARY 2, 2009 PROJECT # 25-1524.00
31
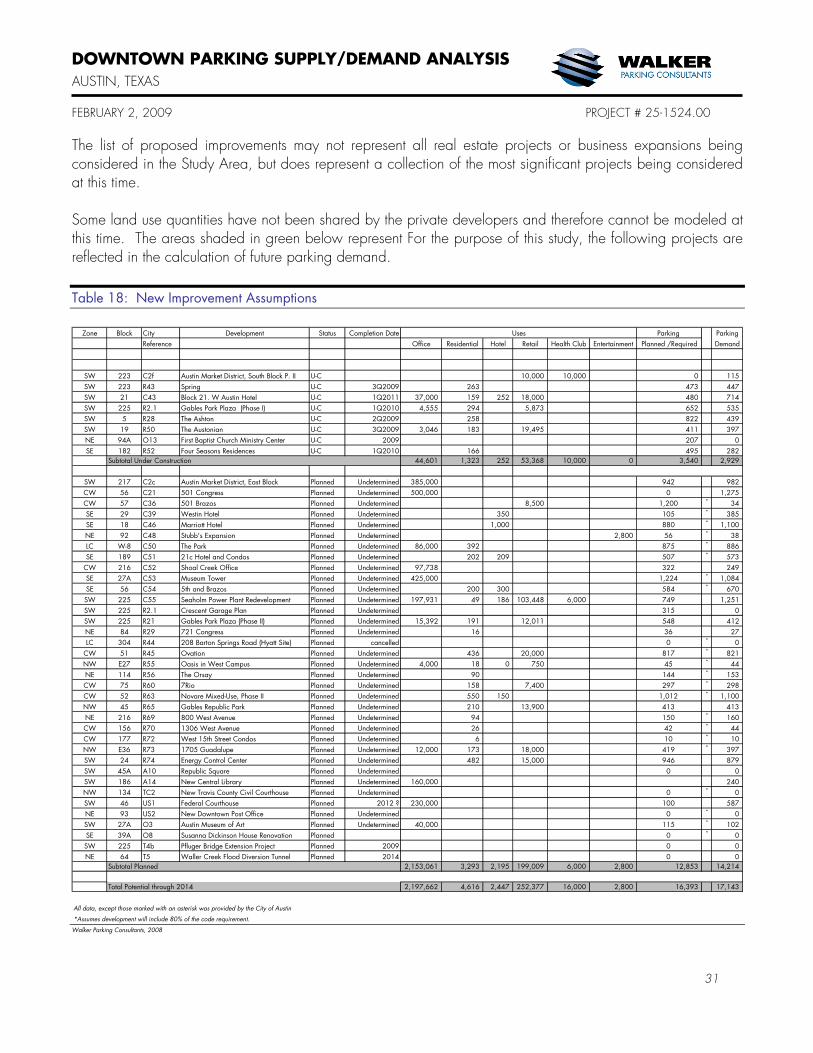
The list of proposed improvements may not represent all real estate projects or business expansions being considered in the Study Area, but does represent a collection of the most significant projects being considered at this time. Some land use quantities have not been shared by the private developers and therefore cannot be modeled at this time. The areas shaded in green below represent For the purpose of this study, the following projects are reflected in the calculation of future parking demand. Table 18: New Improvement Assumptions
Zone Block City Development Status Completion Date Parking ParkingReference Office Residential Hotel Retail Health Club Entertainment Planned /Required Demand
ULI 3.00 1.70 1.10 4.00 7.50 13.50Code 2.88 1.60 0.88 5.99 2.00 20.00
SW 223 C2f Austin Market District, South Block P. II U-C 10,000 10,000 0 115SW 223 R43 Spring U-C 3Q2009 263 473 447SW 21 C43 Block 21. W Austin Hotel U-C 1Q2011 37,000 159 252 18,000 480 714SW 225 R2.1 Gables Park Plaza (Phase I) U-C 1Q2010 4,555 294 5,873 652 535SW 5 R28 The Ashton U-C 2Q2009 258 822 439SW 19 R50 The Austonian U-C 3Q2009 3,046 183 19,495 411 397NE 94A O13 First Baptist Church Ministry Center U-C 2009 207 0SE 182 R52 Four Seasons Residences U-C 1Q2010 166 495 282
44,601 1,323 252 53,368 10,000 0 3,540 2,929
SW 217 C2c Austin Market District, East Block Planned Undetermined 385,000 942 982CW 56 C21 501 Congress Planned Undetermined 500,000 0 1,275CW 57 C36 501 Brazos Planned Undetermined 8,500 1,200 * 34SE 29 C39 Westin Hotel Planned Undetermined 350 105 * 385SE 18 C46 Marriott Hotel Planned Undetermined 1,000 880 * 1,100NE 92 C48 Stubb's Expansion Planned Undetermined 2,800 56 * 38LC W-8 C50 The Park Planned Undetermined 86,000 392 875 * 886SE 189 C51 21c Hotel and Condos Planned Undetermined 202 209 507 * 573
CW 216 C52 Shoal Creek Office Planned Undetermined 97,738 322 249SE 27A C53 Museum Tower Planned Undetermined 425,000 1,224 * 1,084SE 56 C54 5th and Brazos Planned Undetermined 200 300 584 * 670SW 225 C55 Seaholm Power Plant Redevelopment Planned Undetermined 197,931 49 186 103,448 6,000 749 1,251SW 225 R2.1 Crescent Garage Plan Planned Undetermined 315 0SW 225 R21 Gables Park Plaza (Phase II) Planned Undetermined 15,392 191 12,011 548 412NE 84 R29 721 Congress Planned Undetermined 16 36 27LC 304 R44 208 Barton Springs Road (Hyatt Site) Planned cancelled 0 * 0
CW 51 R45 Ovation Planned Undetermined 436 20,000 817 * 821NW E27 R55 Oasis in West Campus Planned Undetermined 4,000 18 0 750 45 * 44NE 114 R56 The Orsay Planned Undetermined 90 144 * 153CW 75 R60 7Rio Planned Undetermined 158 7,400 297 * 298CW 52 R63 Novare Mixed-Use, Phase II Planned Undetermined 550 150 1,012 * 1,100NW 45 R65 Gables Republic Park Planned Undetermined 210 13,900 413 413NE 216 R69 800 West Avenue Planned Undetermined 94 150 * 160CW 156 R70 1306 West Avenue Planned Undetermined 26 42 * 44CW 177 R72 West 15th Street Condos Planned Undetermined 6 10 * 10NW E36 R73 1705 Guadalupe Planned Undetermined 12,000 173 18,000 419 * 397SW 24 R74 Energy Control Center Planned Undetermined 482 15,000 946 879SW 45A A10 Republic Square Planned Undetermined 0 0SW 186 A14 New Central Library Planned Undetermined 160,000 240NW 134 TC2 New Travis County Civil Courthouse Planned Undetermined 0 * 0SW 46 US1 Federal Courthouse Planned 2012 ? 230,000 100 587NE 93 US2 New Downtown Post Office Planned Undetermined 0 * 0SW 27A O3 Austin Museum of Art Planned Undetermined 40,000 115 * 102SE 39A O8 Susanna Dickinson House Renovation Planned 0 * 0SW 225 T4b Pfluger Bridge Extension Project Planned 2009 0 0NE 64 T5 Waller Creek Flood Diversion Tunnel Planned 2014 0 0
2,153,061 3,293 2,195 199,009 6,000 2,800 12,853 14,214
2,197,662 4,616 2,447 252,377 16,000 2,800 16,393 17,143
All data, except those marked with an asterisk was provided by the City of Austin
*Assumes development will include 80% of the code requirement.
Subtotal Under Construction
Subtotal Planned
Total Potential through 2014
Uses
Walker Parking Consultants, 2008
DOWNTOWN PARKING SUPPLY/DEMAND ANALYSIS AUSTIN, TEXAS FEBRUARY 2, 2009 PROJECT # 25-1524.00
32
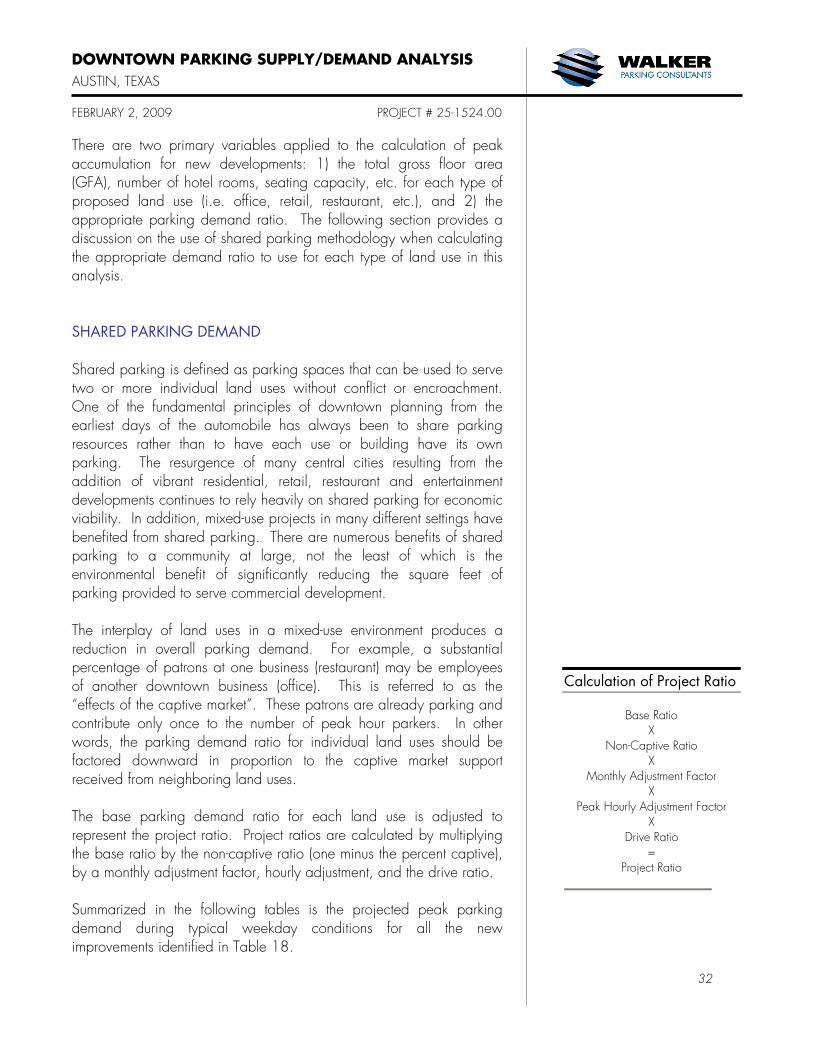
There are two primary variables applied to the calculation of peak accumulation for new developments: 1) the total gross floor area (GFA), number of hotel rooms, seating capacity, etc. for each type of proposed land use (i.e. office, retail, restaurant, etc.), and 2) the appropriate parking demand ratio. The following section provides a discussion on the use of shared parking methodology when calculating the appropriate demand ratio to use for each type of land use in this analysis. SHARED PARKING DEMAND Shared parking is defined as parking spaces that can be used to serve two or more individual land uses without conflict or encroachment. One of the fundamental principles of downtown planning from the earliest days of the automobile has always been to share parking resources rather than to have each use or building have its own parking. The resurgence of many central cities resulting from the addition of vibrant residential, retail, restaurant and entertainment developments continues to rely heavily on shared parking for economic viability. In addition, mixed-use projects in many different settings have benefited from shared parking. There are numerous benefits of shared parking to a community at large, not the least of which is the environmental benefit of significantly reducing the square feet of parking provided to serve commercial development. The interplay of land uses in a mixed-use environment produces a reduction in overall parking demand. For example, a substantial percentage of patrons at one business (restaurant) may be employees of another downtown business (office). This is referred to as the “effects of the captive market”. These patrons are already parking and contribute only once to the number of peak hour parkers. In other words, the parking demand ratio for individual land uses should be factored downward in proportion to the captive market support received from neighboring land uses. The base parking demand ratio for each land use is adjusted to represent the project ratio. Project ratios are calculated by multiplying the base ratio by the non-captive ratio (one minus the percent captive), by a monthly adjustment factor, hourly adjustment, and the drive ratio. Summarized in the following tables is the projected peak parking demand during typical weekday conditions for all the new improvements identified in Table 18.
Calculation of Project Ratio
Base Ratio X
Non-Captive Ratio X
Monthly Adjustment Factor X
Peak Hourly Adjustment Factor X
Drive Ratio =
Project Ratio
DOWNTOWN PARKING SUPPLY/DEMAND ANALYSIS AUSTIN, TEXAS FEBRUARY 2, 2009 PROJECT # 25-1524.00
33
Captive ratios, presence factors and absorption estimates have been incorporated into the calculations used to derive Table 18. Please note that projected ratios represent an average number of spaces required per land use type under shared parking conditions. That is, if the demand ratio is applied to the square footage of a specific business or building, the calculated demand may or may not accurately represent one particular business. Rather, individual estimates may be low, whereas others may be high. FUTURE PARKING ADEQUACY A fundamental aspect of any central business district or downtown area is the interplay of activities from block to block. Commonly, patrons of a downtown area park on one block and go to work and/or patronize a business on another block. Additionally, not all of the parking patrons bound for a particular block will choose to park if there is a sufficient amount of available space. Market factors, especially price, walking distance and convenient access will result in significant interplay between blocks. For these reasons, it is not critical to focus on the balance for any individual block. Rather, the focus is on the defined zones within each of the districts. Parking adequacy is the difference between effective parking supply and projected demand. As with the analysis of existing parking conditions, Walker evaluated future parking adequacy within five (5) zones. Each zone encompasses a unique representation of land uses with different parking demand characteristics. Table 19, on the following page, identifies and summarizes the projected future weekday parking adequacy for each zone.
DOWNTOWN PARKING SUPPLY/DEMAND ANALYSIS AUSTIN, TEXAS FEBRUARY 2, 2009 PROJECT # 25-1524.00
34
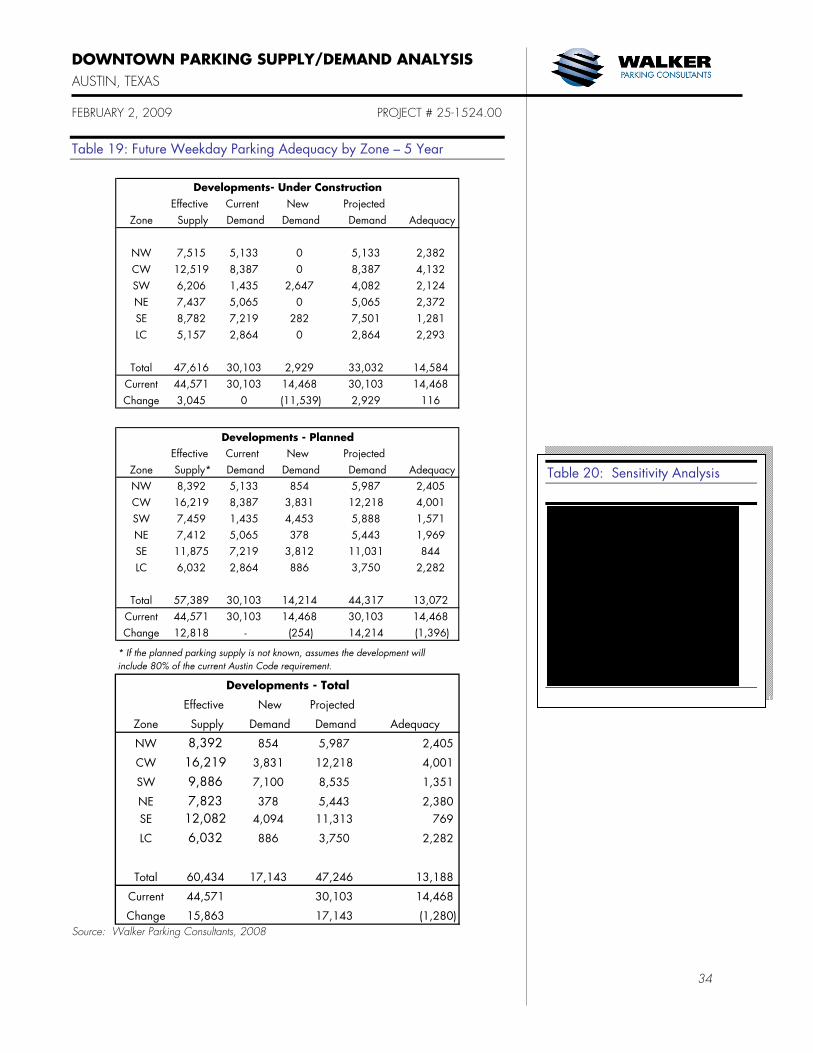
Table 19: Future Weekday Parking Adequacy by Zone – 5 Year
Effective Current New Projected Zone Supply Demand Demand Demand Adequacy
NW 7,515 5,133 0 5,133 2,382CW 12,519 8,387 0 8,387 4,132SW 6,206 1,435 2,647 4,082 2,124NE 7,437 5,065 0 5,065 2,372SE 8,782 7,219 282 7,501 1,281LC 5,157 2,864 0 2,864 2,293
Total 47,616 30,103 2,929 33,032 14,584Current 44,571 30,103 14,468 30,103 14,468Change 3,045 0 (11,539) 2,929 116
Developments- Under Construction
Effective Current New Projected Zone Supply* Demand Demand Demand AdequacyNW 8,392 5,133 854 5,987 2,405CW 16,219 8,387 3,831 12,218 4,001SW 7,459 1,435 4,453 5,888 1,571NE 7,412 5,065 378 5,443 1,969SE 11,875 7,219 3,812 11,031 844LC 6,032 2,864 886 3,750 2,282
Total 57,389 30,103 14,214 44,317 13,072Current 44,571 30,103 14,468 30,103 14,468Change 12,818 - (254) 14,214 (1,396)
Developments - Planned
* If the planned parking supply is not known, assumes the development will include 80% of the current Austin Code requirement.
Effective New Projected
Zone Supply Demand Demand Adequacy
NW 8,392 854 5,987 2,405
CW 16,219 3,831 12,218 4,001
SW 9,886 7,100 8,535 1,351
NE 7,823 378 5,443 2,380SE 12,082 4,094 11,313 769
LC 6,032 886 3,750 2,282
Total 60,434 17,143 47,246 13,188
Current 44,571 30,103 14,468
Change 15,863 17,143 (1,280)
Developments - Total
Source: Walker Parking Consultants, 2008
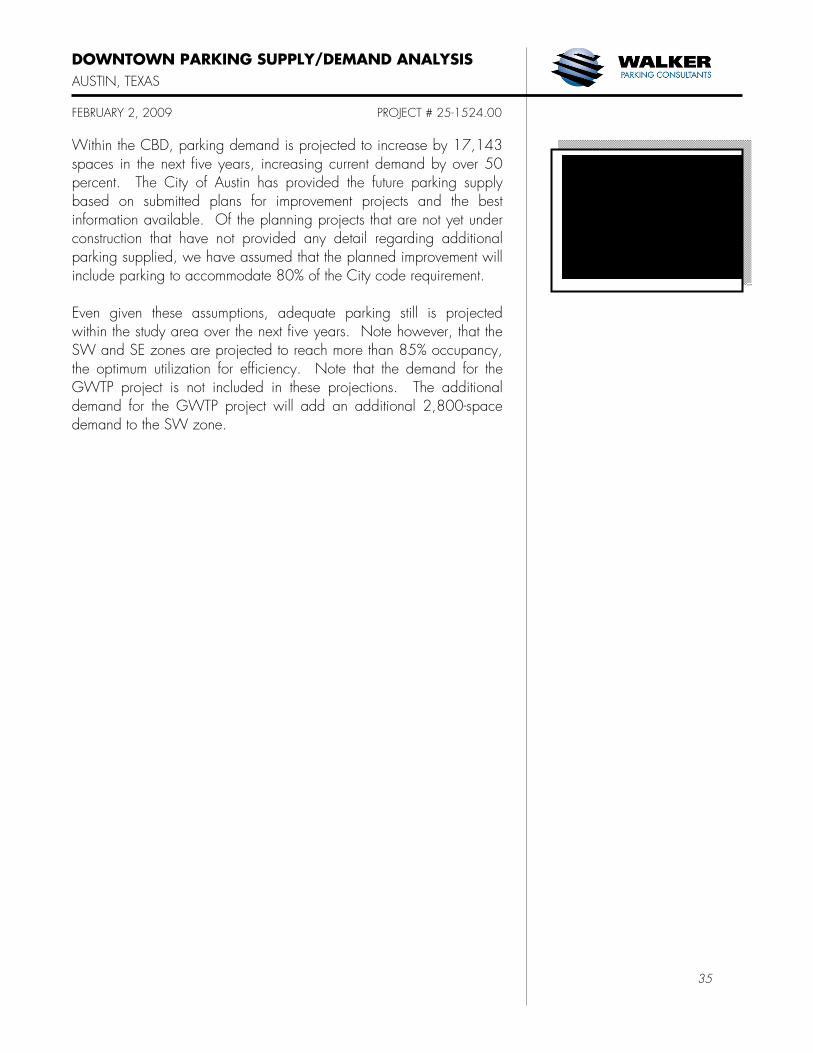
Table 20: Sensitivity Analysis
Zone 20% 60% 80% 100%
NW 2,057 2,289 2,405 2,521
CW 2,366 3,456 4,001 4,545
SW 1,265 1,322 1,351 1,380
NE 2,160 2,307 2,380 2,454
SE (1,627) (30) 769 1,568
LC 1,626 2,063 2,282 2,501
Total 7,847 11,407 13,188 14,969
Current 14,468 14,468 14,468 14,468
Change (6,621) (3,061) (1,280) 501
Future Parking Adequacy
Adequacy, with a variable Supply - % of Code
DOWNTOWN PARKING SUPPLY/DEMAND ANALYSIS AUSTIN, TEXAS FEBRUARY 2, 2009 PROJECT # 25-1524.00
35
Within the CBD, parking demand is projected to increase by 17,143 spaces in the next five years, increasing current demand by over 50 percent. The City of Austin has provided the future parking supply based on submitted plans for improvement projects and the best information available. Of the planning projects that are not yet under construction that have not provided any detail regarding additional parking supplied, we have assumed that the planned improvement will include parking to accommodate 80% of the City code requirement. Even given these assumptions, adequate parking still is projected within the study area over the next five years. Note however, that the SW and SE zones are projected to reach more than 85% occupancy, the optimum utilization for efficiency. Note that the demand for the GWTP project is not included in these projections. The additional demand for the GWTP project will add an additional 2,800-space demand to the SW zone.
Base RequirementOffice 3.60 ksfRetail 3.60 ksfRestaurant 13.33 ksfHotel 1.10 roomResidential 2.00 unitCocktail Lounge 20.00 ksfHealth club 2.00 ksf
City of Austin Code Requirements
DOWNTOWN PARKING SUPPLY/DEMAND ANALYSIS AUSTIN, TEXAS FEBRUARY 2, 2009 PROJECT # 25-1524.00
36
During typical weekday-daytime conditions, parking is adequate within the study area. Even as a number of planned developments will increase the demand for parking within the next five years; overall, the study area still will have adequate parking. However, the SW and SE zones will see an occupancy rate of more than 85%, which approaches the maximum occupancy to maintain normal parking system efficiency. Typical events occurring during evenings and weekends are generally accommodated with adequate parking. The breakdown in the parking system occurs during large events and when events occur simultaneously. Based on our analysis of event schedules, this occurs six to ten times per year. Although the number of occurrences is relatively low, the magnitude of parking required is significant. Given the concentration of many of the event venues within about a mile of the subject site (specifically on the boundaries of the SW and LC zones), the parking supply in that area is particularly challenged during these overlapping events. While operations plans are in place to address these overlapping events, it is difficult to get information to patrons as to where to park, given that the location changes based on the type of events occurring. A static supply of overflow parking would ensure that the user knows where to park before arriving downtown. The GWTP site is a prime option for additional parking supply, given its location within the CBD, and proximity and line-of-sight to the event venues south of Lady Bird Lake. While it may not be financially feasible to provide enough parking spaces to accommodate all special events at the GWTP site, our analysis concludes that it is the logical location to serve special events near Lady Bird Lake. A financial analysis should be performed to determine how many spaces could be supported above the GWTP demand. Otherwise, adequate parking is projected within a five-year planning horizon.
CONCLUSION
APPENDIX
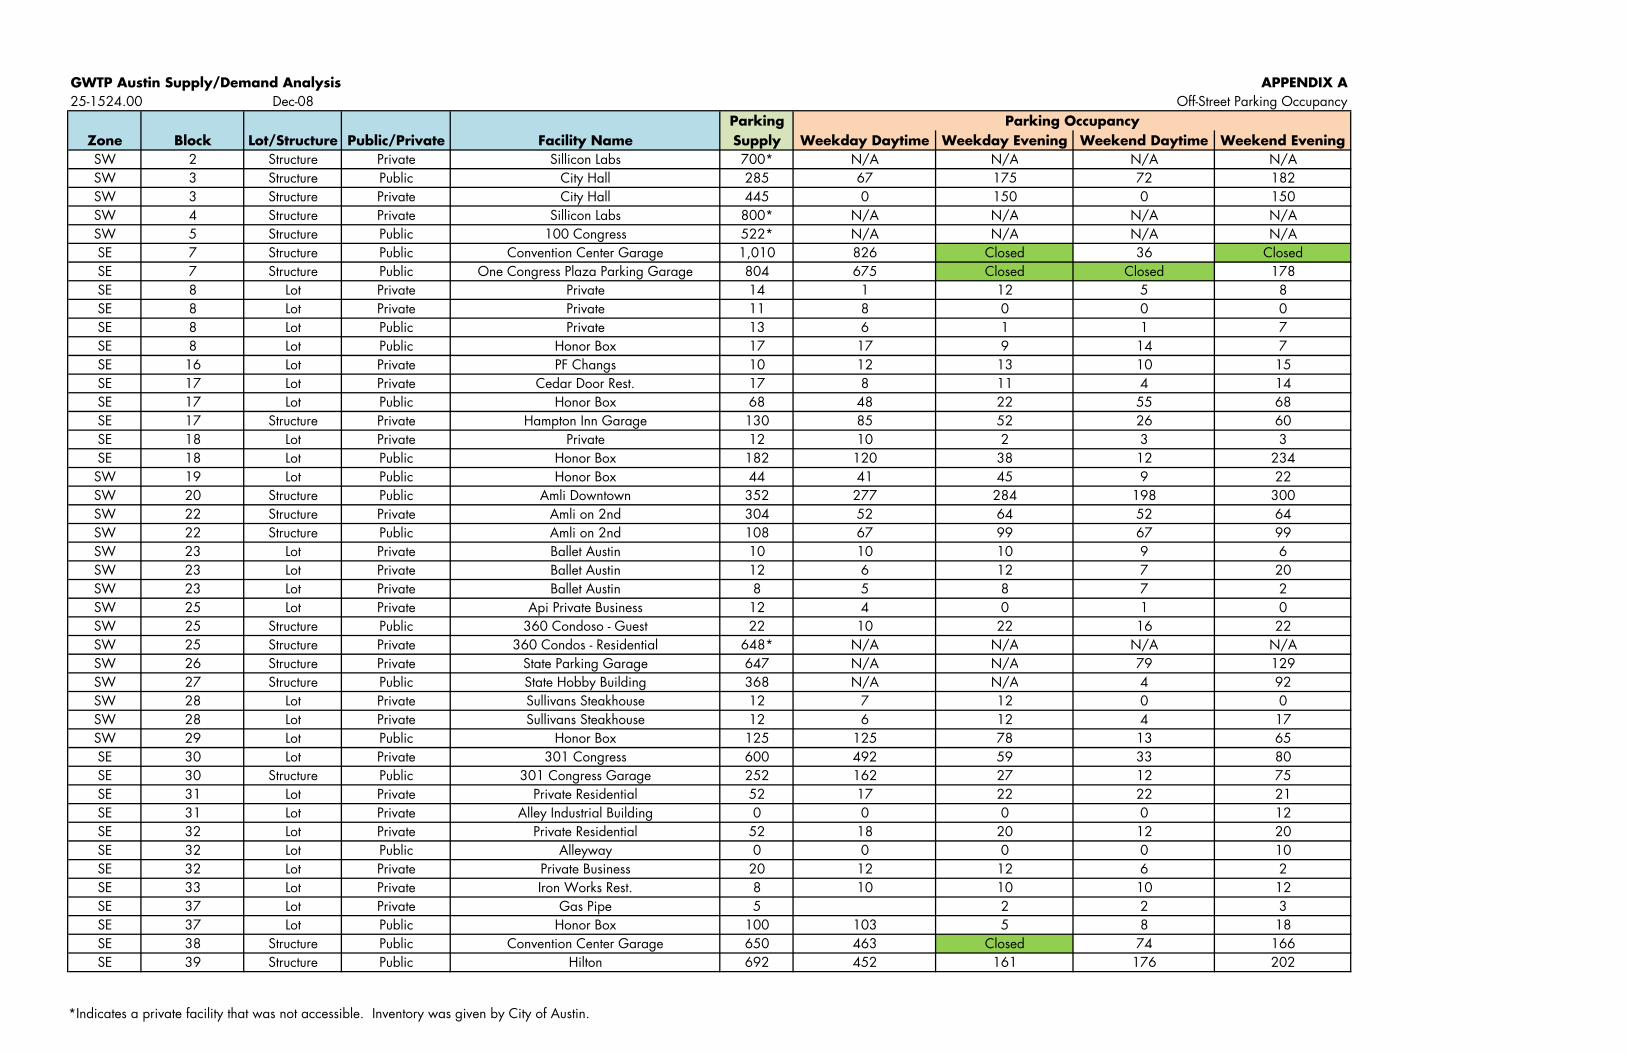
GWTP Austin Supply/Demand Analysis APPENDIX A25-1524.00 Dec-08 Off-Street Parking Occupancy
ParkingZone Block Lot/Structure Public/Private Facility Name Supply Weekday Daytime Weekday Evening Weekend Daytime Weekend EveningSW 2 Structure Private Sillicon Labs 700* N/A N/A N/A N/ASW 3 Structure Public City Hall 285 67 175 72 182SW 3 Structure Private City Hall 445 0 150 0 150SW 4 Structure Private Sillicon Labs 800* N/A N/A N/A N/ASW 5 Structure Public 100 Congress 522* N/A N/A N/A N/ASE 7 Structure Public Convention Center Garage 1,010 826 Closed 36 ClosedSE 7 Structure Public One Congress Plaza Parking Garage 804 675 Closed Closed 178SE 8 Lot Private Private 14 1 12 5 8SE 8 Lot Private Private 11 8 0 0 0SE 8 Lot Public Private 13 6 1 1 7SE 8 Lot Public Honor Box 17 17 9 14 7SE 16 Lot Private PF Changs 10 12 13 10 15SE 17 Lot Private Cedar Door Rest. 17 8 11 4 14SE 17 Lot Public Honor Box 68 48 22 55 68SE 17 Structure Private Hampton Inn Garage 130 85 52 26 60SE 18 Lot Private Private 12 10 2 3 3SE 18 Lot Public Honor Box 182 120 38 12 234SW 19 Lot Public Honor Box 44 41 45 9 22SW 20 Structure Public Amli Downtown 352 277 284 198 300SW 22 Structure Private Amli on 2nd 304 52 64 52 64SW 22 Structure Public Amli on 2nd 108 67 99 67 99SW 23 Lot Private Ballet Austin 10 10 10 9 6SW 23 Lot Private Ballet Austin 12 6 12 7 20SW 23 Lot Private Ballet Austin 8 5 8 7 2SW 25 Lot Private Api Private Business 12 4 0 1 0SW 25 Structure Public 360 Condoso - Guest 22 10 22 16 22SW 25 Structure Private 360 Condos - Residential 648* N/A N/A N/A N/ASW 26 Structure Private State Parking Garage 647 N/A N/A 79 129SW 27 Structure Public State Hobby Building 368 N/A N/A 4 92SW 28 Lot Private Sullivans Steakhouse 12 7 12 0 0SW 28 Lot Private Sullivans Steakhouse 12 6 12 4 17SW 29 Lot Public Honor Box 125 125 78 13 65SE 30 Lot Private 301 Congress 600 492 59 33 80SE 30 Structure Public 301 Congress Garage 252 162 27 12 75SE 31 Lot Private Private Residential 52 17 22 22 21SE 31 Lot Private Alley Industrial Building 0 0 0 0 12SE 32 Lot Private Private Residential 52 18 20 12 20SE 32 Lot Public Alleyway 0 0 0 0 10SE 32 Lot Private Private Business 20 12 12 6 2SE 33 Lot Private Iron Works Rest. 8 10 10 10 12SE 37 Lot Private Gas Pipe 5 2 2 3SE 37 Lot Public Honor Box 100 103 5 8 18SE 38 Structure Public Convention Center Garage 650 463 Closed 74 166SE 39 Structure Public Hilton 692 452 161 176 202
Parking Occupancy
*Indicates a private facility that was not accessible. Inventory was given by City of Austin.
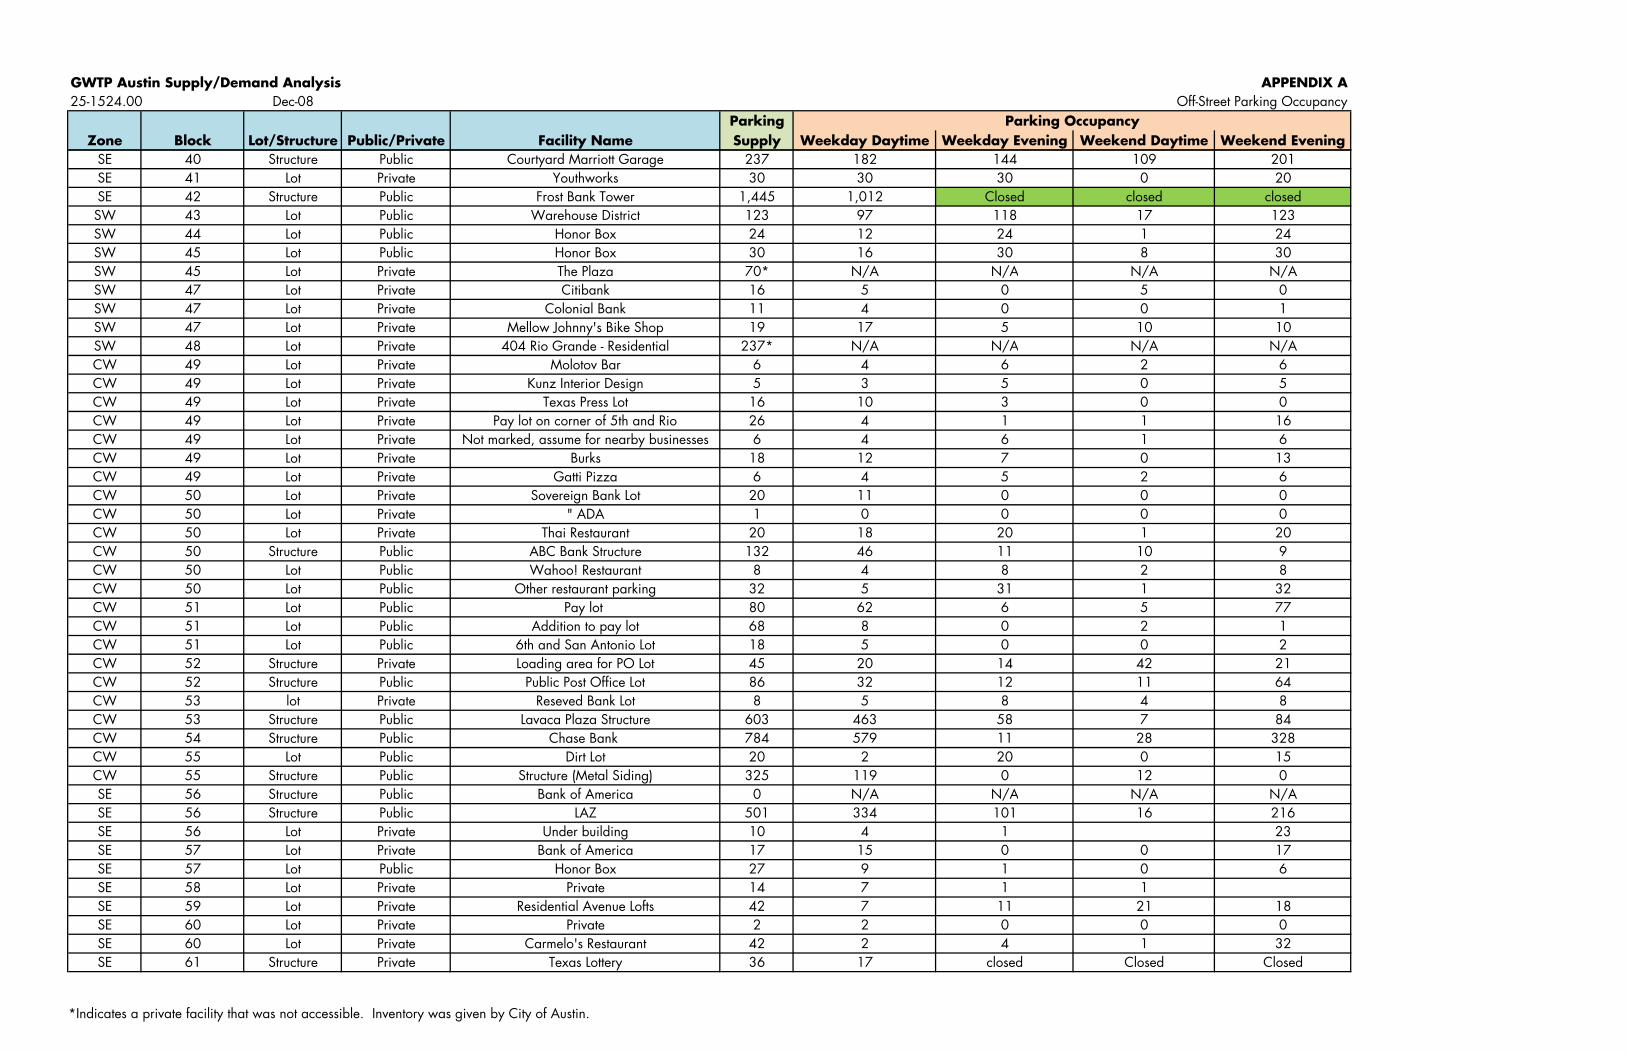
GWTP Austin Supply/Demand Analysis APPENDIX A25-1524.00 Dec-08 Off-Street Parking Occupancy
ParkingZone Block Lot/Structure Public/Private Facility Name Supply Weekday Daytime Weekday Evening Weekend Daytime Weekend Evening
Parking Occupancy
SE 40 Structure Public Courtyard Marriott Garage 237 182 144 109 201SE 41 Lot Private Youthworks 30 30 30 0 20SE 42 Structure Public Frost Bank Tower 1,445 1,012 Closed closed closedSW 43 Lot Public Warehouse District 123 97 118 17 123SW 44 Lot Public Honor Box 24 12 24 1 24SW 45 Lot Public Honor Box 30 16 30 8 30SW 45 Lot Private The Plaza 70* N/A N/A N/A N/ASW 47 Lot Private Citibank 16 5 0 5 0SW 47 Lot Private Colonial Bank 11 4 0 0 1SW 47 Lot Private Mellow Johnny's Bike Shop 19 17 5 10 10SW 48 Lot Private 404 Rio Grande - Residential 237* N/A N/A N/A N/ACW 49 Lot Private Molotov Bar 6 4 6 2 6CW 49 Lot Private Kunz Interior Design 5 3 5 0 5CW 49 Lot Private Texas Press Lot 16 10 3 0 0CW 49 Lot Private Pay lot on corner of 5th and Rio 26 4 1 1 16CW 49 Lot Private Not marked, assume for nearby businesses 6 4 6 1 6CW 49 Lot Private Burks 18 12 7 0 13CW 49 Lot Private Gatti Pizza 6 4 5 2 6CW 50 Lot Private Sovereign Bank Lot 20 11 0 0 0CW 50 Lot Private " ADA 1 0 0 0 0CW 50 Lot Private Thai Restaurant 20 18 20 1 20CW 50 Structure Public ABC Bank Structure 132 46 11 10 9CW 50 Lot Public Wahoo! Restaurant 8 4 8 2 8CW 50 Lot Public Other restaurant parking 32 5 31 1 32CW 51 Lot Public Pay lot 80 62 6 5 77CW 51 Lot Public Addition to pay lot 68 8 0 2 1CW 51 Lot Public 6th and San Antonio Lot 18 5 0 0 2CW 52 Structure Private Loading area for PO Lot 45 20 14 42 21CW 52 Structure Public Public Post Office Lot 86 32 12 11 64CW 53 lot Private Reseved Bank Lot 8 5 8 4 8CW 53 Structure Public Lavaca Plaza Structure 603 463 58 7 84CW 54 Structure Public Chase Bank 784 579 11 28 328CW 55 Lot Public Dirt Lot 20 2 20 0 15CW 55 Structure Public Structure (Metal Siding) 325 119 0 12 0SE 56 Structure Public Bank of America 0 N/A N/A N/A N/ASE 56 Structure Public LAZ 501 334 101 16 216SE 56 Lot Private Under building 10 4 1 23SE 57 Lot Private Bank of America 17 15 0 0 17SE 57 Lot Public Honor Box 27 9 1 0 6SE 58 Lot Private Private 14 7 1 1SE 59 Lot Private Residential Avenue Lofts 42 7 11 21 18SE 60 Lot Private Private 2 2 0 0 0SE 60 Lot Private Carmelo's Restaurant 42 2 4 1 32SE 61 Structure Private Texas Lottery 36 17 closed Closed Closed
*Indicates a private facility that was not accessible. Inventory was given by City of Austin.

GWTP Austin Supply/Demand Analysis APPENDIX A25-1524.00 Dec-08 Off-Street Parking Occupancy
ParkingZone Block Lot/Structure Public/Private Facility Name Supply Weekday Daytime Weekday Evening Weekend Daytime Weekend Evening
Parking Occupancy
SE 61 Lot Private Texas Lottery 105 95 12 2 8SE 62 Lot Private Private 6 3 5 4 0SE 62 Lot Private Hilton Garden Inn 207 180 139 160 125NE 63 Lot Public Surface Lot (7th St.) 42 21 6 0 31NE 63 Lot Private Texaco Gas Station 8 7 7 6 6NE 63 Lot Public Surface Lot (I35) 19 17 5 5 6NE 63 Lot Private Permit only lot (I35/6th) 32 20 4 10 5NE 63 Lot Private Habana Parking Only 13 1 8 3 11NE 64 Lot Public Surface Lot (7th/Sabine) 8 7 6 3 3NE 64 Lot Private Permit only (Sabine/6th) 14 6 0 1 8NE 65 Lot Public Surface Lot/Old Liquor Store 18 0 0 18 6NE 65 Lot Private Tenants only (Red River/6th) 10 6 0 0 0NE 65 Lot Private Reserved Lot (Red River/6th) 12 11 2 4 8NE 66 Lot Public Surface Lot (7th/Neches) 50 47 19 0 49NE 67 Lot Private Surface Lot (7th/San Jacinto) 52 40 20 5 53NE 67 Lot Public Surface Lot (7th/Trinity) 53 52 25 11 51NE 68 Structure Private 8 Level Gated private 0 0 0 0 0NE 69 Lot Public Surface Lot (7th/Congress) 24 20 17 7 21CW 70 Lot Public Public Lot 27 15 9 1 21CW 70 Lot Public Reserved for Bank Customers 4 0 0 0 0CW 70 Lot Public Unstriped Bank Lot 8 1 8 1 1CW 70 Structure Public One American Center 690 586 189 68 129CW 70 Structure Private One American Center - Reserved 216 140 4 15 0CW 71 Structure Private UT Main Garage 180 134 0 16 0CW 71 Structure Private UT Garage Lower Level 26 21 0 0 0CW 71 Structure Private Ashbel Hall Garage 77 67 0 0 0CW 71 Structure Private UT "Garage #1" 89 72 0 0 0CW 72 Structure Public 300 W 6th Street Structure 2,091 1,387 0 61 0CW 73 Lot Private Extended Stay Lot 97 42 57 43 68CW 73 Lot Public Perpendicular Meters 10 0 10 1 10CW 74 Lot Private Stafford Office 7 7 2 2 7CW 74 Lot Private " ADA 1 1 0 0 0CW 74 Lot Private Stafford Tenants 30 17 15 2 29CW 74 Lot Private " ADA 1 1 0 0 1CW 74 Lot Public Austin Wine Merchants 11 6 11 1 11CW 74 Structure Private Stafford Garage (closed and gated) 150 38 0 0 0CW 75 Lot Public Public Pay Lot 15 1 7 0 15CW 75 Lot Private Katz Restaurant 9 5 2 7 9CW 75 Lot Private 617 W 7th 6 0 2 5 6CW 75 Lot Public Public Lot 21 11 7 2 21CW 75 Lot Public " ADA 1 0 0 0 0CW 75 Lot Private Mechanic's Lot 12 6 0 0 0
CW 75 Lot Public 616 Bar 5 4 8 1 16CW 75 Lot Public "Residential" parking 50 0 31 5 50
*Indicates a private facility that was not accessible. Inventory was given by City of Austin.
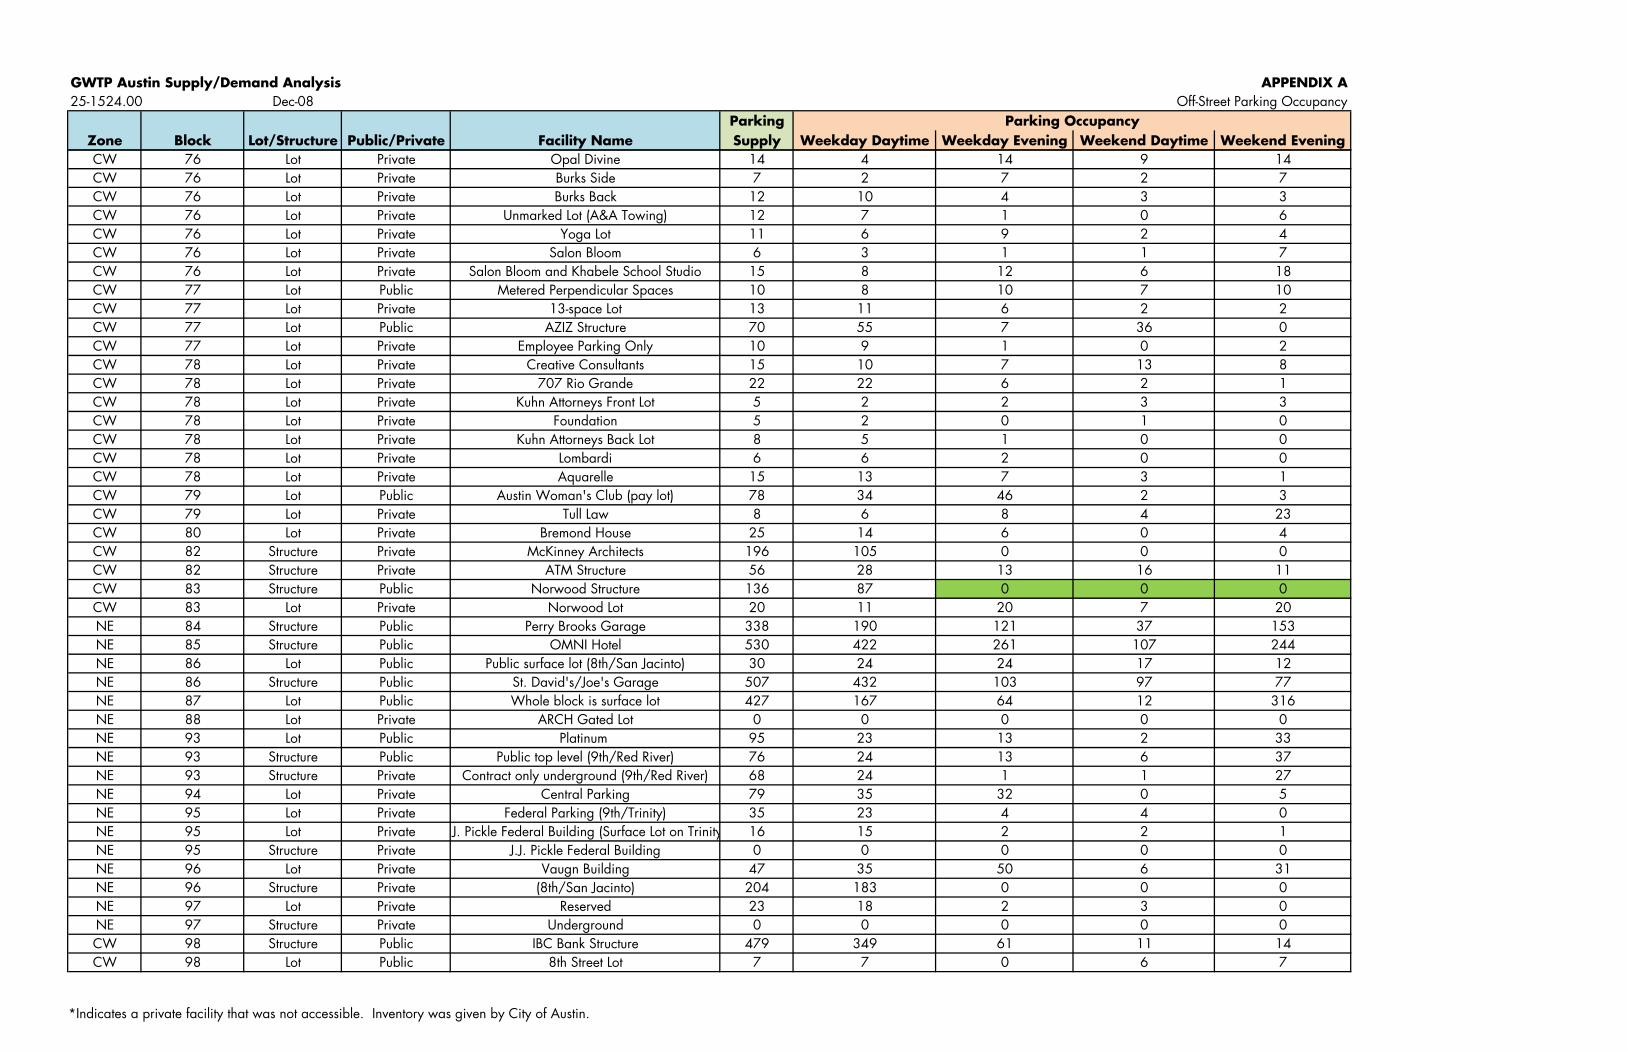
GWTP Austin Supply/Demand Analysis APPENDIX A25-1524.00 Dec-08 Off-Street Parking Occupancy
ParkingZone Block Lot/Structure Public/Private Facility Name Supply Weekday Daytime Weekday Evening Weekend Daytime Weekend Evening
Parking Occupancy
CW 76 Lot Private Opal Divine 14 4 14 9 14CW 76 Lot Private Burks Side 7 2 7 2 7CW 76 Lot Private Burks Back 12 10 4 3 3CW 76 Lot Private Unmarked Lot (A&A Towing) 12 7 1 0 6CW 76 Lot Private Yoga Lot 11 6 9 2 4CW 76 Lot Private Salon Bloom 6 3 1 1 7CW 76 Lot Private Salon Bloom and Khabele School Studio 15 8 12 6 18CW 77 Lot Public Metered Perpendicular Spaces 10 8 10 7 10CW 77 Lot Private 13-space Lot 13 11 6 2 2CW 77 Lot Public AZIZ Structure 70 55 7 36 0CW 77 Lot Private Employee Parking Only 10 9 1 0 2CW 78 Lot Private Creative Consultants 15 10 7 13 8CW 78 Lot Private 707 Rio Grande 22 22 6 2 1CW 78 Lot Private Kuhn Attorneys Front Lot 5 2 2 3 3CW 78 Lot Private Foundation 5 2 0 1 0CW 78 Lot Private Kuhn Attorneys Back Lot 8 5 1 0 0CW 78 Lot Private Lombardi 6 6 2 0 0CW 78 Lot Private Aquarelle 15 13 7 3 1CW 79 Lot Public Austin Woman's Club (pay lot) 78 34 46 2 3CW 79 Lot Private Tull Law 8 6 8 4 23CW 80 Lot Private Bremond House 25 14 6 0 4CW 82 Structure Private McKinney Architects 196 105 0 0 0CW 82 Structure Private ATM Structure 56 28 13 16 11CW 83 Structure Public Norwood Structure 136 87 0 0 0CW 83 Lot Private Norwood Lot 20 11 20 7 20NE 84 Structure Public Perry Brooks Garage 338 190 121 37 153NE 85 Structure Public OMNI Hotel 530 422 261 107 244NE 86 Lot Public Public surface lot (8th/San Jacinto) 30 24 24 17 12NE 86 Structure Public St. David's/Joe's Garage 507 432 103 97 77NE 87 Lot Public Whole block is surface lot 427 167 64 12 316NE 88 Lot Private ARCH Gated Lot 0 0 0 0 0NE 93 Lot Public Platinum 95 23 13 2 33NE 93 Structure Public Public top level (9th/Red River) 76 24 13 6 37NE 93 Structure Private Contract only underground (9th/Red River) 68 24 1 1 27NE 94 Lot Private Central Parking 79 35 32 0 5NE 95 Lot Private Federal Parking (9th/Trinity) 35 23 4 4 0NE 95 Lot Private .J. Pickle Federal Building (Surface Lot on Trinity 16 15 2 2 1NE 95 Structure Private J.J. Pickle Federal Building 0 0 0 0 0NE 96 Lot Private Vaugn Building 47 35 50 6 31NE 96 Structure Private (8th/San Jacinto) 204 183 0 0 0NE 97 Lot Private Reserved 23 18 2 3 0NE 97 Structure Private Underground 0 0 0 0 0CW 98 Structure Public IBC Bank Structure 479 349 61 11 14CW 98 Lot Public 8th Street Lot 7 7 0 6 7
*Indicates a private facility that was not accessible. Inventory was given by City of Austin.
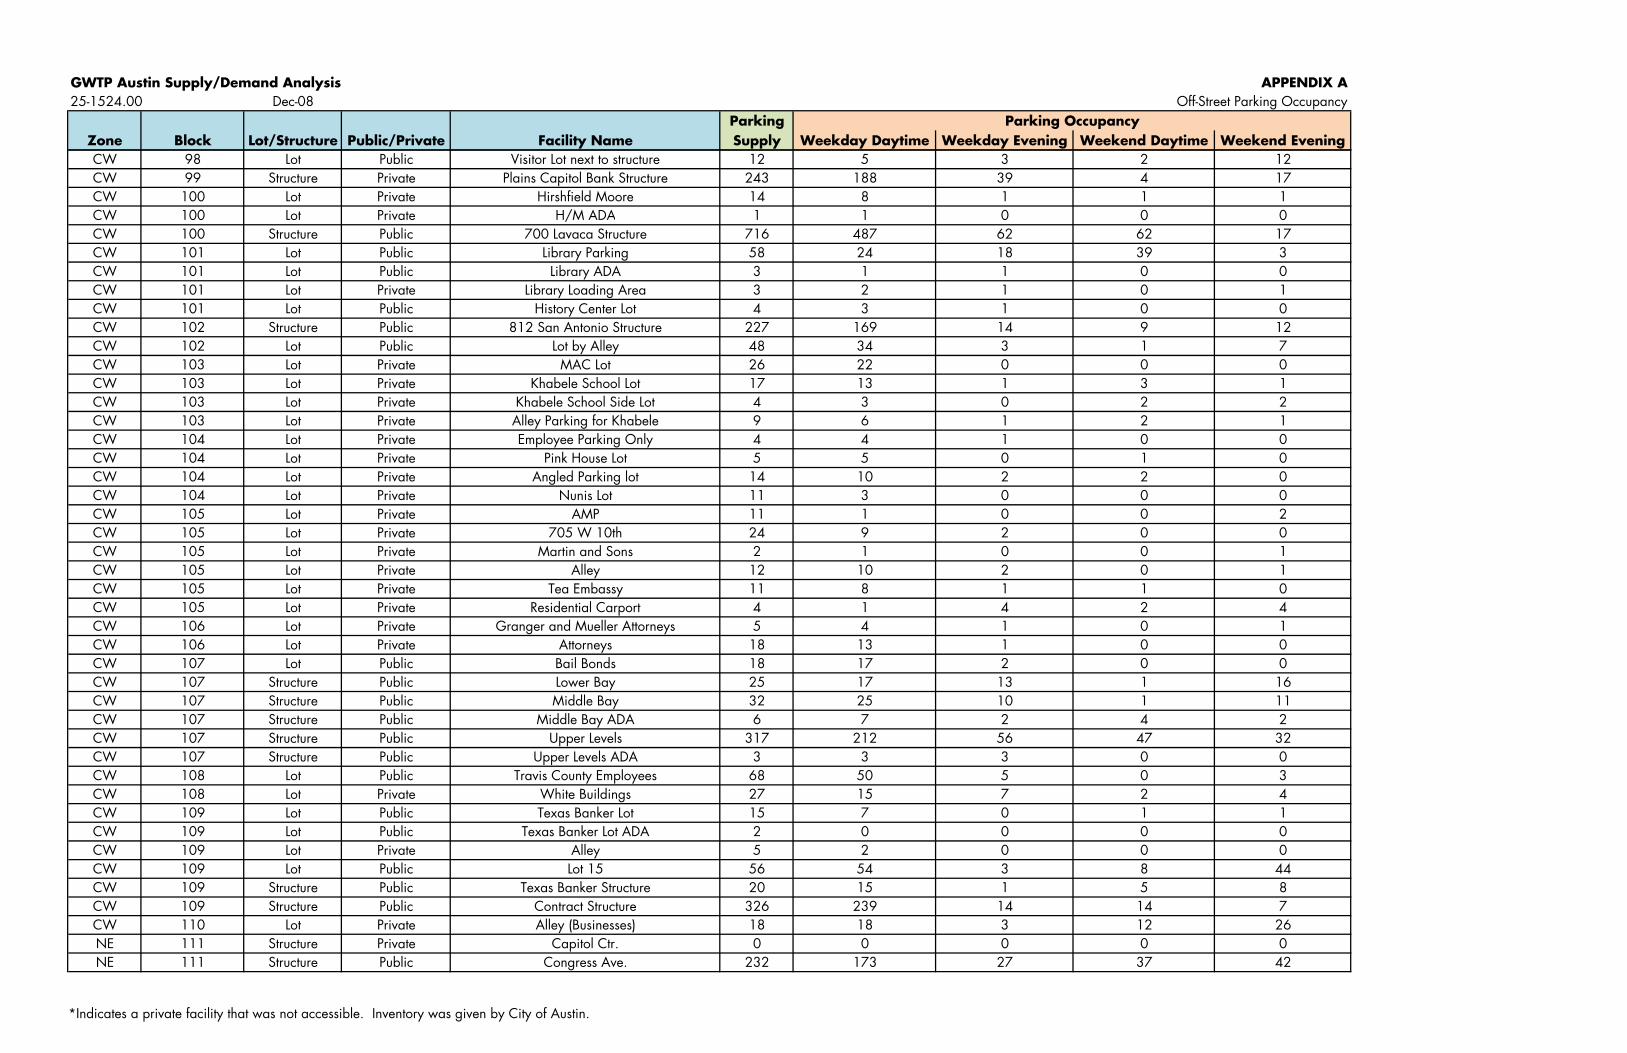
GWTP Austin Supply/Demand Analysis APPENDIX A25-1524.00 Dec-08 Off-Street Parking Occupancy
ParkingZone Block Lot/Structure Public/Private Facility Name Supply Weekday Daytime Weekday Evening Weekend Daytime Weekend Evening
Parking Occupancy
CW 98 Lot Public Visitor Lot next to structure 12 5 3 2 12CW 99 Structure Private Plains Capitol Bank Structure 243 188 39 4 17CW 100 Lot Private Hirshfield Moore 14 8 1 1 1CW 100 Lot Private H/M ADA 1 1 0 0 0CW 100 Structure Public 700 Lavaca Structure 716 487 62 62 17CW 101 Lot Public Library Parking 58 24 18 39 3CW 101 Lot Public Library ADA 3 1 1 0 0CW 101 Lot Private Library Loading Area 3 2 1 0 1CW 101 Lot Public History Center Lot 4 3 1 0 0CW 102 Structure Public 812 San Antonio Structure 227 169 14 9 12CW 102 Lot Public Lot by Alley 48 34 3 1 7CW 103 Lot Private MAC Lot 26 22 0 0 0CW 103 Lot Private Khabele School Lot 17 13 1 3 1CW 103 Lot Private Khabele School Side Lot 4 3 0 2 2CW 103 Lot Private Alley Parking for Khabele 9 6 1 2 1CW 104 Lot Private Employee Parking Only 4 4 1 0 0CW 104 Lot Private Pink House Lot 5 5 0 1 0CW 104 Lot Private Angled Parking lot 14 10 2 2 0CW 104 Lot Private Nunis Lot 11 3 0 0 0CW 105 Lot Private AMP 11 1 0 0 2CW 105 Lot Private 705 W 10th 24 9 2 0 0CW 105 Lot Private Martin and Sons 2 1 0 0 1CW 105 Lot Private Alley 12 10 2 0 1CW 105 Lot Private Tea Embassy 11 8 1 1 0CW 105 Lot Private Residential Carport 4 1 4 2 4CW 106 Lot Private Granger and Mueller Attorneys 5 4 1 0 1CW 106 Lot Private Attorneys 18 13 1 0 0CW 107 Lot Public Bail Bonds 18 17 2 0 0CW 107 Structure Public Lower Bay 25 17 13 1 16CW 107 Structure Public Middle Bay 32 25 10 1 11CW 107 Structure Public Middle Bay ADA 6 7 2 4 2CW 107 Structure Public Upper Levels 317 212 56 47 32CW 107 Structure Public Upper Levels ADA 3 3 3 0 0CW 108 Lot Public Travis County Employees 68 50 5 0 3CW 108 Lot Private White Buildings 27 15 7 2 4CW 109 Lot Public Texas Banker Lot 15 7 0 1 1CW 109 Lot Public Texas Banker Lot ADA 2 0 0 0 0CW 109 Lot Private Alley 5 2 0 0 0CW 109 Lot Public Lot 15 56 54 3 8 44CW 109 Structure Public Texas Banker Structure 20 15 1 5 8CW 109 Structure Public Contract Structure 326 239 14 14 7CW 110 Lot Private Alley (Businesses) 18 18 3 12 26NE 111 Structure Private Capitol Ctr. 0 0 0 0 0NE 111 Structure Public Congress Ave. 232 173 27 37 42
*Indicates a private facility that was not accessible. Inventory was given by City of Austin.
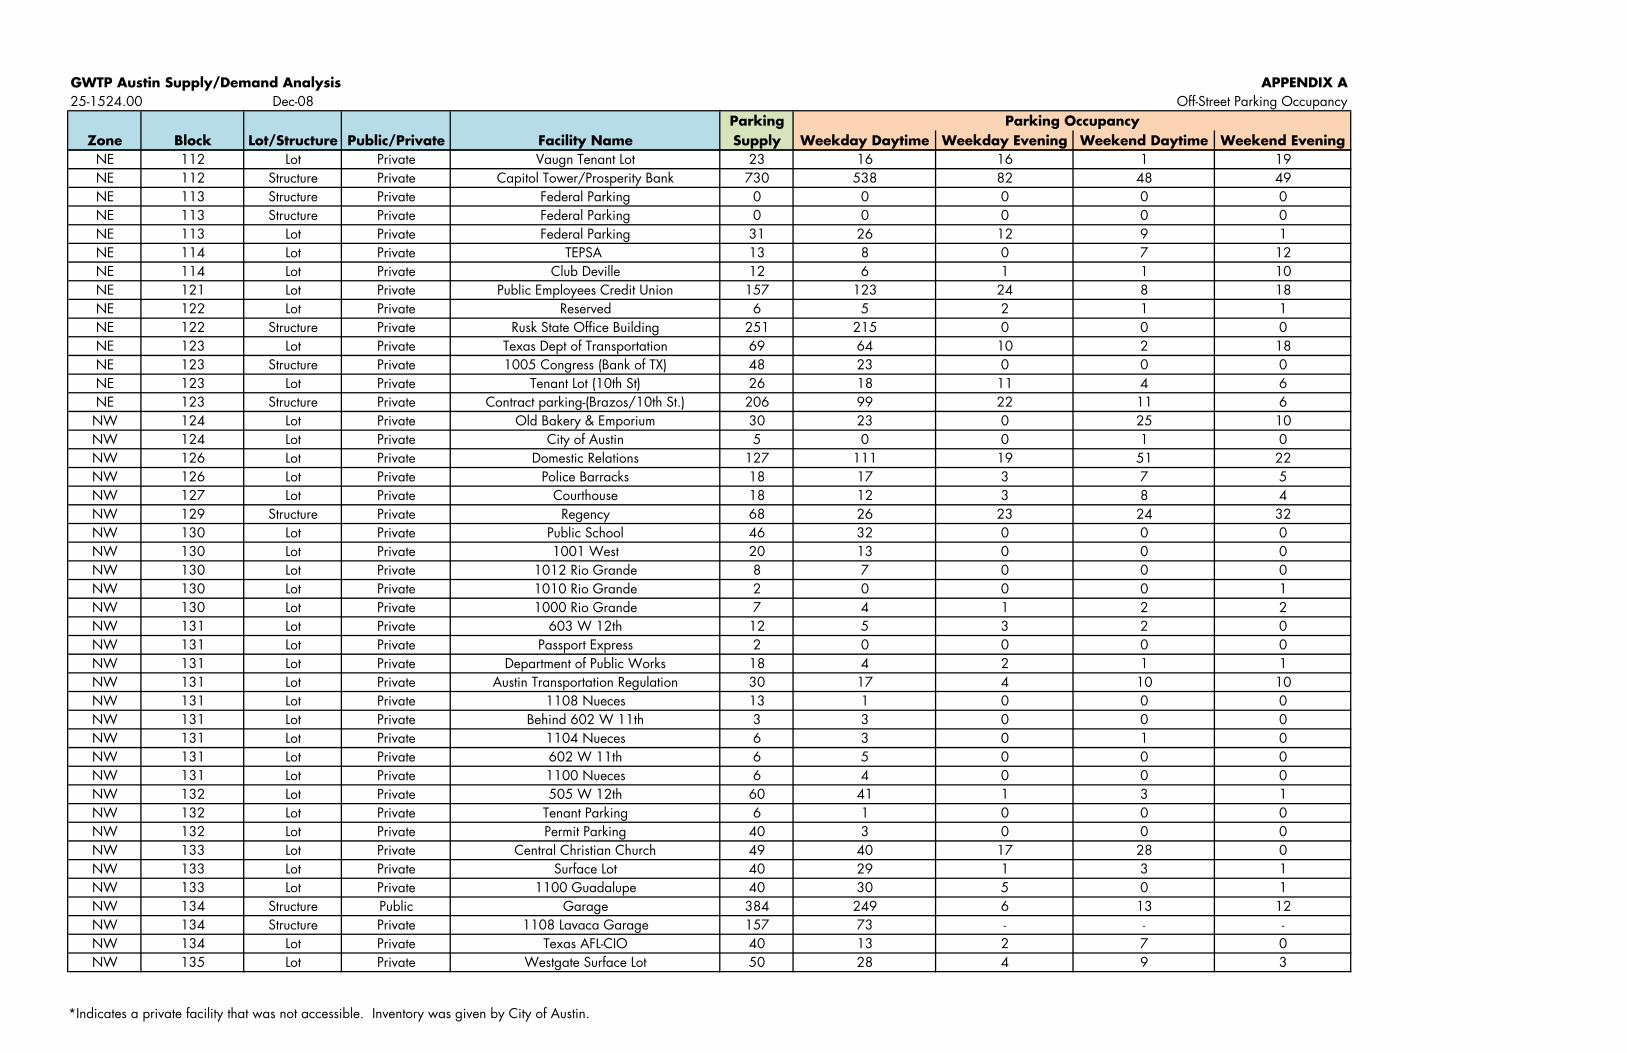
GWTP Austin Supply/Demand Analysis APPENDIX A25-1524.00 Dec-08 Off-Street Parking Occupancy
ParkingZone Block Lot/Structure Public/Private Facility Name Supply Weekday Daytime Weekday Evening Weekend Daytime Weekend Evening
Parking Occupancy
NE 112 Lot Private Vaugn Tenant Lot 23 16 16 1 19NE 112 Structure Private Capitol Tower/Prosperity Bank 730 538 82 48 49NE 113 Structure Private Federal Parking 0 0 0 0 0NE 113 Structure Private Federal Parking 0 0 0 0 0NE 113 Lot Private Federal Parking 31 26 12 9 1NE 114 Lot Private TEPSA 13 8 0 7 12NE 114 Lot Private Club Deville 12 6 1 1 10NE 121 Lot Private Public Employees Credit Union 157 123 24 8 18NE 122 Lot Private Reserved 6 5 2 1 1NE 122 Structure Private Rusk State Office Building 251 215 0 0 0NE 123 Lot Private Texas Dept of Transportation 69 64 10 2 18NE 123 Structure Private 1005 Congress (Bank of TX) 48 23 0 0 0NE 123 Lot Private Tenant Lot (10th St) 26 18 11 4 6NE 123 Structure Private Contract parking-(Brazos/10th St.) 206 99 22 11 6NW 124 Lot Private Old Bakery & Emporium 30 23 0 25 10NW 124 Lot Private City of Austin 5 0 0 1 0NW 126 Lot Private Domestic Relations 127 111 19 51 22NW 126 Lot Private Police Barracks 18 17 3 7 5NW 127 Lot Private Courthouse 18 12 3 8 4NW 129 Structure Private Regency 68 26 23 24 32NW 130 Lot Private Public School 46 32 0 0 0NW 130 Lot Private 1001 West 20 13 0 0 0NW 130 Lot Private 1012 Rio Grande 8 7 0 0 0NW 130 Lot Private 1010 Rio Grande 2 0 0 0 1NW 130 Lot Private 1000 Rio Grande 7 4 1 2 2NW 131 Lot Private 603 W 12th 12 5 3 2 0NW 131 Lot Private Passport Express 2 0 0 0 0NW 131 Lot Private Department of Public Works 18 4 2 1 1NW 131 Lot Private Austin Transportation Regulation 30 17 4 10 10NW 131 Lot Private 1108 Nueces 13 1 0 0 0NW 131 Lot Private Behind 602 W 11th 3 3 0 0 0NW 131 Lot Private 1104 Nueces 6 3 0 1 0NW 131 Lot Private 602 W 11th 6 5 0 0 0NW 131 Lot Private 1100 Nueces 6 4 0 0 0NW 132 Lot Private 505 W 12th 60 41 1 3 1NW 132 Lot Private Tenant Parking 6 1 0 0 0NW 132 Lot Private Permit Parking 40 3 0 0 0NW 133 Lot Private Central Christian Church 49 40 17 28 0NW 133 Lot Private Surface Lot 40 29 1 3 1NW 133 Lot Private 1100 Guadalupe 40 30 5 0 1NW 134 Structure Public Garage 384 249 6 13 12NW 134 Structure Private 1108 Lavaca Garage 157 73 - - -NW 134 Lot Private Texas AFL-CIO 40 13 2 7 0NW 135 Lot Private Westgate Surface Lot 50 28 4 9 3
*Indicates a private facility that was not accessible. Inventory was given by City of Austin.

GWTP Austin Supply/Demand Analysis APPENDIX A25-1524.00 Dec-08 Off-Street Parking Occupancy
ParkingZone Block Lot/Structure Public/Private Facility Name Supply Weekday Daytime Weekday Evening Weekend Daytime Weekend Evening
Parking Occupancy
NW 135 Structure Private Westgate Garage - - - -NE 137 Lot Private Trinity Academic Physicians 72 64 0 0 0NE 137 Structure Private Texas Association of Realtors 0 0 0 0 0NE 137 Structure Private La Quinta Inn 86 18 15 24 26NE 140 Lot Private ASO Staff Parking 18 11 6 0 4NE 140 Structure Private Credit Union Visitor/Employee 95 40 13 0 10NE 141 Lot Private Credit Union Employee/Visitor Lot 92 69 1 0 2NE 141 Lot Private DMV 38 29 2 10 36NE 141 Lot Private Rent-a-car 22 9 12 16 18NW 148 Lot Private 1st United Methodist 42 18 8 5 10NW 149 Structure Private 1220 Colorado Garage 161 55 7 4 13NW 149 Structure Private Texas State Teachers Association 104 66 10 36 0NW 149 Lot Private Surface Lot Behind Garage 6 5 0 0 0NW 149 Lot Private Surface Lot 6 3 0 0 0NW 150 Structure Private Private Structure 119 87 16 11 23NW 150 Structure Private Garage - - - - -NW 150 Lot Private Delta Kappa Gamma Lot 18 12 0 0 0NW 150 Lot Public Central Parking Surface Lot 20 15 0 0 0NW 151 Structure Private Subgrade Garage 287 172 - - -NW 151 Structure Private Private Structure TAC 50 27 1 13 0NW 151 Lot Private Chamber of Commerce 14 9 2 0 0NW 151 Lot Private 1205 Nueces 5 4 0 0 0NW 151 Lot Private Surface Lot 10 6 0 0 0NW 151 Lot Private 1201 Nueces 6 5 0 0 0NW 151 Lot Private Surface Lot 3 2 0 0 0NW 151 Lot Private Surface Lot 5 0 0 0 0NW 151 Lot Private 502 12th St 9 6 2 0 0NW 152 Lot Private Attache Building 16 12 6 4 7NW 152 Lot Private Behind 608 W 12th 51 33 3 2 1NW 152 Lot Private Peach St Offices Front 6 3 1 2 0NW 152 Lot Private Peach St Offices Back 14 14 3 2 0NW 152 Lot Private 600 W 12th 7 3 0 0 0NW 152 Lot Private Doctors Offices 6 3 0 0 0NW 152 Lot Private Law Offices 17 15 2 0 0NW 152 Lot Private Law Offices 3 3 0 0 0NW 153 Lot Private Law Offices Botsford & Roark 12 4 0 0 1NW 153 Lot Private 709 W 14th 10 0 0 1 0NW 154 Lot Private Surface Lot 5 5 1 2 0NW 154 Lot Private ID-One 25 15 2 0 0NW 154 Lot Private Headmasters 10 5 0 0 0NW 154 Lot Private Tenant Parking 14 6 0 10 0NW 154 Lot Private Garcia & True 4 2 0 0 1NW 155 Lot Private 505 W 14th 7 7 0 2 0NW 155 Lot Private Surface Lot 7 7 0 0 0
*Indicates a private facility that was not accessible. Inventory was given by City of Austin.
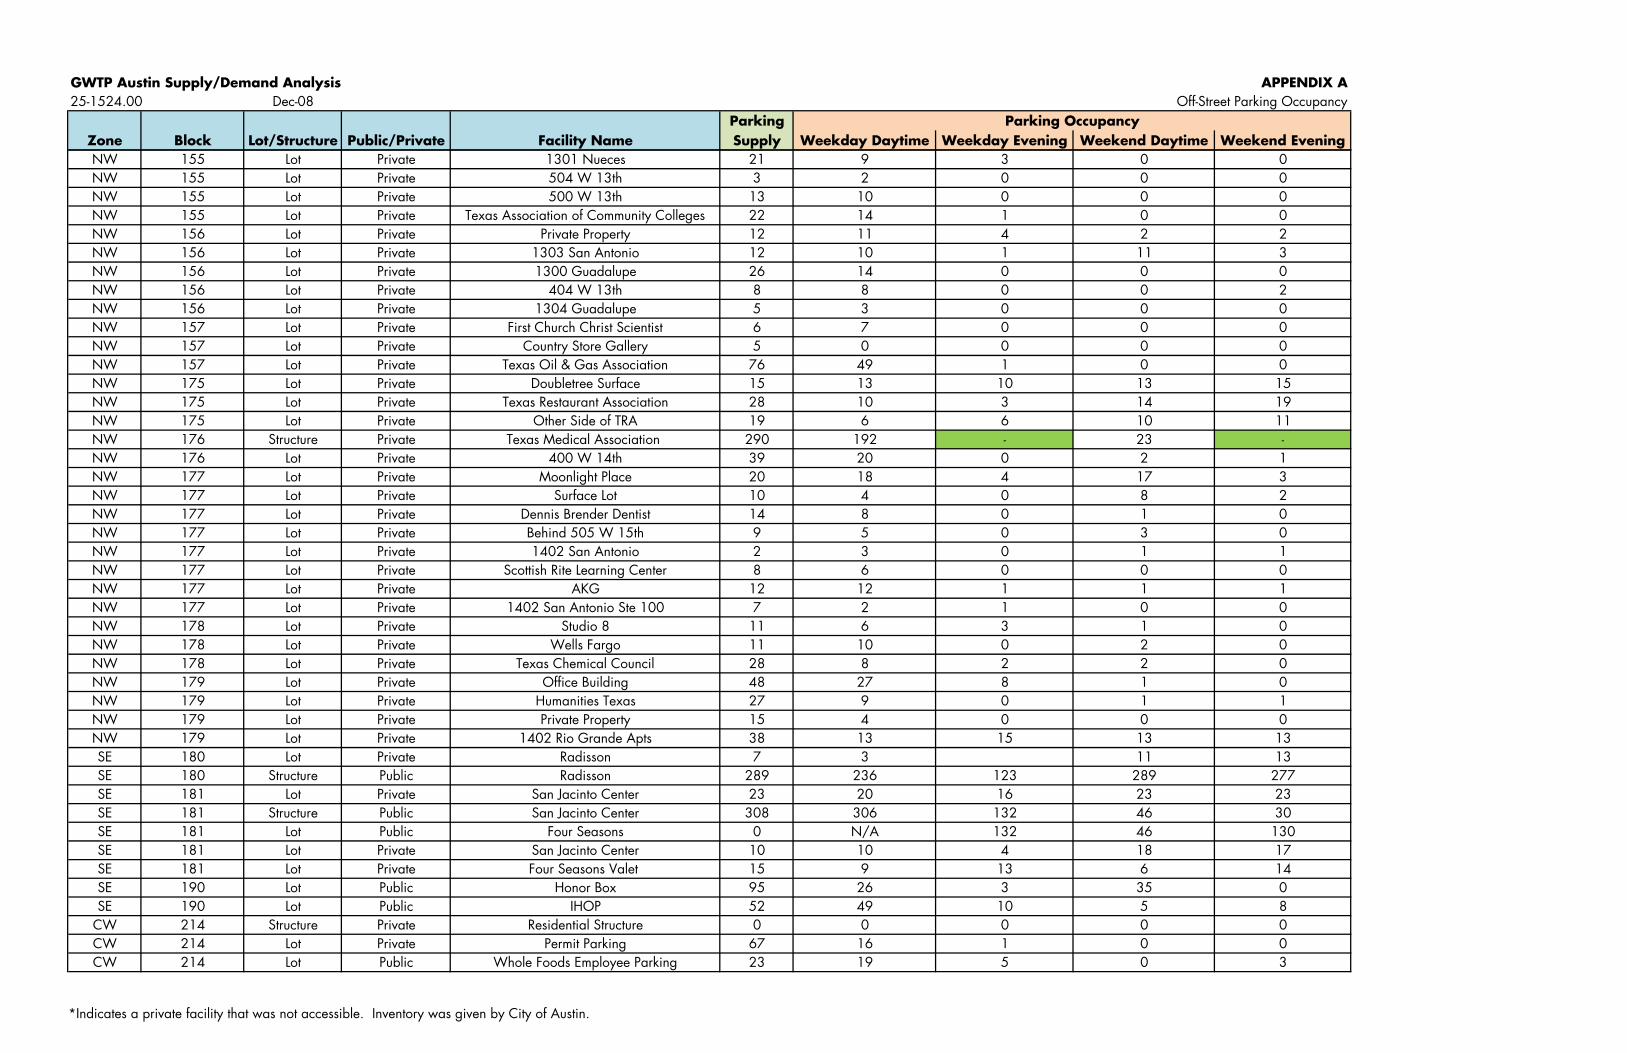
GWTP Austin Supply/Demand Analysis APPENDIX A25-1524.00 Dec-08 Off-Street Parking Occupancy
ParkingZone Block Lot/Structure Public/Private Facility Name Supply Weekday Daytime Weekday Evening Weekend Daytime Weekend Evening
Parking Occupancy
NW 155 Lot Private 1301 Nueces 21 9 3 0 0NW 155 Lot Private 504 W 13th 3 2 0 0 0NW 155 Lot Private 500 W 13th 13 10 0 0 0NW 155 Lot Private Texas Association of Community Colleges 22 14 1 0 0NW 156 Lot Private Private Property 12 11 4 2 2NW 156 Lot Private 1303 San Antonio 12 10 1 11 3NW 156 Lot Private 1300 Guadalupe 26 14 0 0 0NW 156 Lot Private 404 W 13th 8 8 0 0 2NW 156 Lot Private 1304 Guadalupe 5 3 0 0 0NW 157 Lot Private First Church Christ Scientist 6 7 0 0 0NW 157 Lot Private Country Store Gallery 5 0 0 0 0NW 157 Lot Private Texas Oil & Gas Association 76 49 1 0 0NW 175 Lot Private Doubletree Surface 15 13 10 13 15NW 175 Lot Private Texas Restaurant Association 28 10 3 14 19NW 175 Lot Private Other Side of TRA 19 6 6 10 11NW 176 Structure Private Texas Medical Association 290 192 - 23 -NW 176 Lot Private 400 W 14th 39 20 0 2 1NW 177 Lot Private Moonlight Place 20 18 4 17 3NW 177 Lot Private Surface Lot 10 4 0 8 2NW 177 Lot Private Dennis Brender Dentist 14 8 0 1 0NW 177 Lot Private Behind 505 W 15th 9 5 0 3 0NW 177 Lot Private 1402 San Antonio 2 3 0 1 1NW 177 Lot Private Scottish Rite Learning Center 8 6 0 0 0NW 177 Lot Private AKG 12 12 1 1 1NW 177 Lot Private 1402 San Antonio Ste 100 7 2 1 0 0NW 178 Lot Private Studio 8 11 6 3 1 0NW 178 Lot Private Wells Fargo 11 10 0 2 0NW 178 Lot Private Texas Chemical Council 28 8 2 2 0NW 179 Lot Private Office Building 48 27 8 1 0NW 179 Lot Private Humanities Texas 27 9 0 1 1NW 179 Lot Private Private Property 15 4 0 0 0NW 179 Lot Private 1402 Rio Grande Apts 38 13 15 13 13SE 180 Lot Private Radisson 7 3 11 13SE 180 Structure Public Radisson 289 236 123 289 277SE 181 Lot Private San Jacinto Center 23 20 16 23 23SE 181 Structure Public San Jacinto Center 308 306 132 46 30SE 181 Lot Public Four Seasons 0 N/A 132 46 130SE 181 Lot Private San Jacinto Center 10 10 4 18 17SE 181 Lot Private Four Seasons Valet 15 9 13 6 14SE 190 Lot Public Honor Box 95 26 3 35 0SE 190 Lot Public IHOP 52 49 10 5 8
CW 214 Structure Private Residential Structure 0 0 0 0 0CW 214 Lot Private Permit Parking 67 16 1 0 0CW 214 Lot Public Whole Foods Employee Parking 23 19 5 0 3
*Indicates a private facility that was not accessible. Inventory was given by City of Austin.
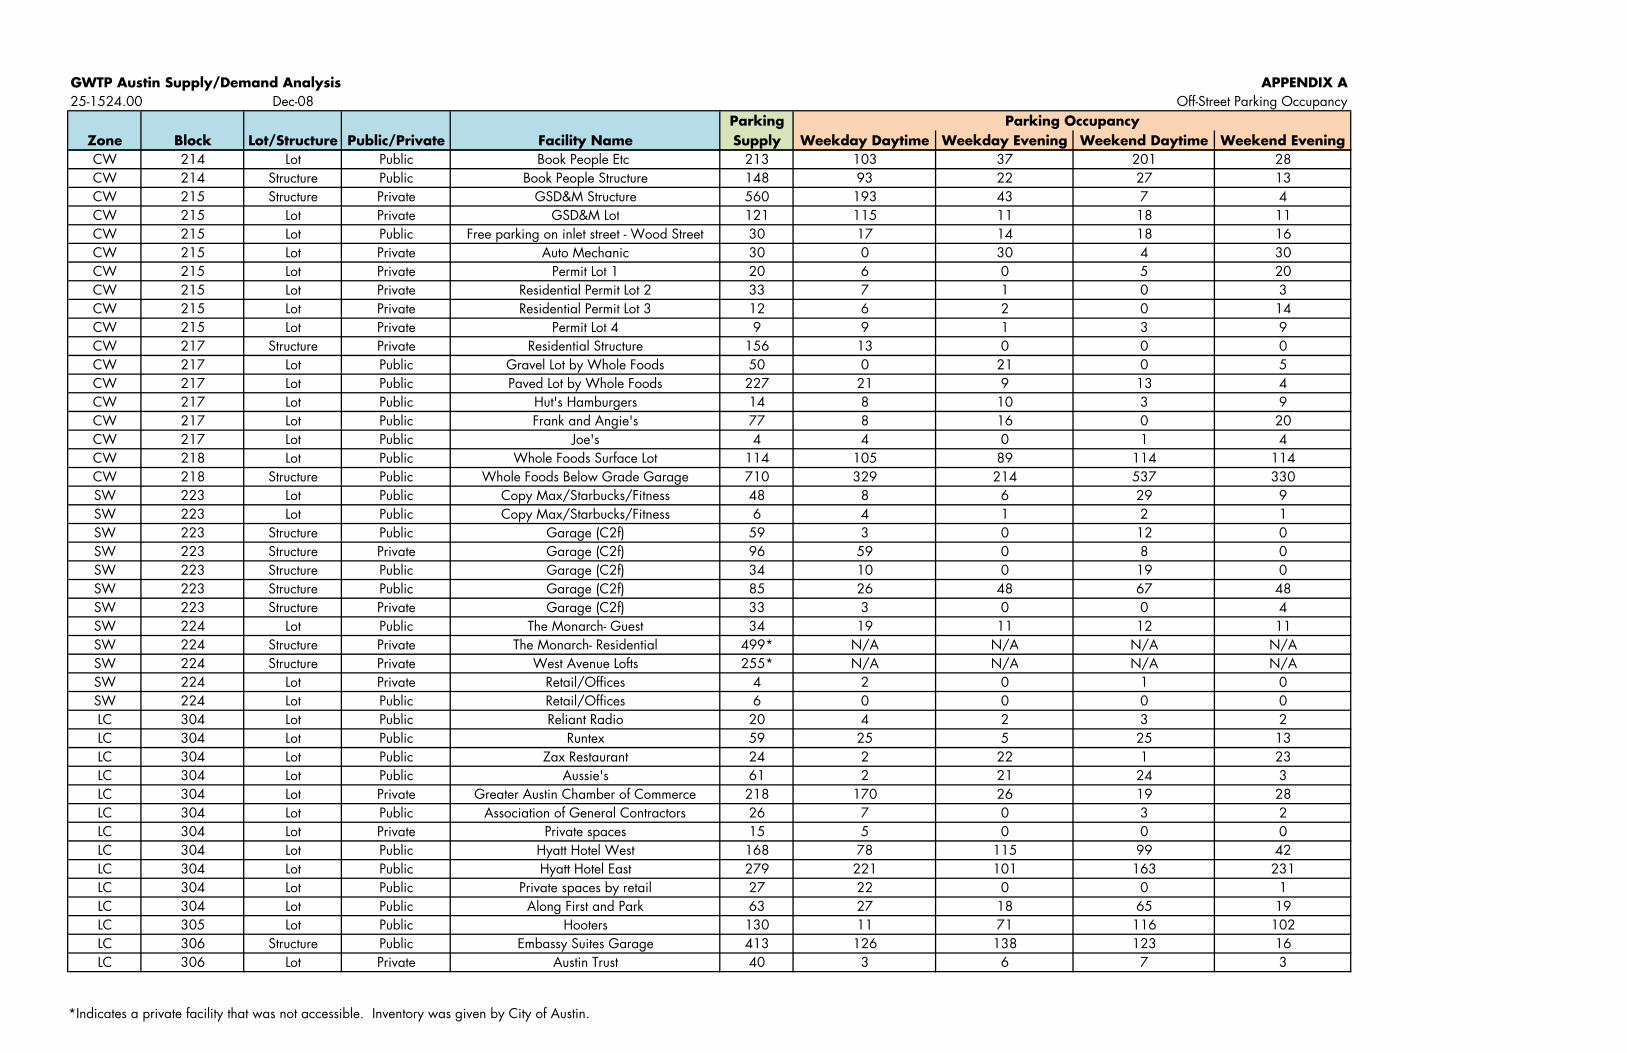
GWTP Austin Supply/Demand Analysis APPENDIX A25-1524.00 Dec-08 Off-Street Parking Occupancy
ParkingZone Block Lot/Structure Public/Private Facility Name Supply Weekday Daytime Weekday Evening Weekend Daytime Weekend Evening
Parking Occupancy
CW 214 Lot Public Book People Etc 213 103 37 201 28CW 214 Structure Public Book People Structure 148 93 22 27 13CW 215 Structure Private GSD&M Structure 560 193 43 7 4CW 215 Lot Private GSD&M Lot 121 115 11 18 11CW 215 Lot Public Free parking on inlet street - Wood Street 30 17 14 18 16CW 215 Lot Private Auto Mechanic 30 0 30 4 30CW 215 Lot Private Permit Lot 1 20 6 0 5 20CW 215 Lot Private Residential Permit Lot 2 33 7 1 0 3CW 215 Lot Private Residential Permit Lot 3 12 6 2 0 14CW 215 Lot Private Permit Lot 4 9 9 1 3 9CW 217 Structure Private Residential Structure 156 13 0 0 0CW 217 Lot Public Gravel Lot by Whole Foods 50 0 21 0 5CW 217 Lot Public Paved Lot by Whole Foods 227 21 9 13 4CW 217 Lot Public Hut's Hamburgers 14 8 10 3 9CW 217 Lot Public Frank and Angie's 77 8 16 0 20CW 217 Lot Public Joe's 4 4 0 1 4CW 218 Lot Public Whole Foods Surface Lot 114 105 89 114 114CW 218 Structure Public Whole Foods Below Grade Garage 710 329 214 537 330SW 223 Lot Public Copy Max/Starbucks/Fitness 48 8 6 29 9SW 223 Lot Public Copy Max/Starbucks/Fitness 6 4 1 2 1SW 223 Structure Public Garage (C2f) 59 3 0 12 0SW 223 Structure Private Garage (C2f) 96 59 0 8 0SW 223 Structure Public Garage (C2f) 34 10 0 19 0SW 223 Structure Public Garage (C2f) 85 26 48 67 48SW 223 Structure Private Garage (C2f) 33 3 0 0 4SW 224 Lot Public The Monarch- Guest 34 19 11 12 11SW 224 Structure Private The Monarch- Residential 499* N/A N/A N/A N/ASW 224 Structure Private West Avenue Lofts 255* N/A N/A N/A N/ASW 224 Lot Private Retail/Offices 4 2 0 1 0SW 224 Lot Public Retail/Offices 6 0 0 0 0LC 304 Lot Public Reliant Radio 20 4 2 3 2LC 304 Lot Public Runtex 59 25 5 25 13LC 304 Lot Public Zax Restaurant 24 2 22 1 23LC 304 Lot Public Aussie's 61 2 21 24 3LC 304 Lot Private Greater Austin Chamber of Commerce 218 170 26 19 28LC 304 Lot Public Association of General Contractors 26 7 0 3 2LC 304 Lot Private Private spaces 15 5 0 0 0LC 304 Lot Public Hyatt Hotel West 168 78 115 99 42LC 304 Lot Public Hyatt Hotel East 279 221 101 163 231LC 304 Lot Public Private spaces by retail 27 22 0 0 1LC 304 Lot Public Along First and Park 63 27 18 65 19LC 305 Lot Public Hooters 130 11 71 116 102LC 306 Structure Public Embassy Suites Garage 413 126 138 123 16LC 306 Lot Private Austin Trust 40 3 6 7 3
*Indicates a private facility that was not accessible. Inventory was given by City of Austin.
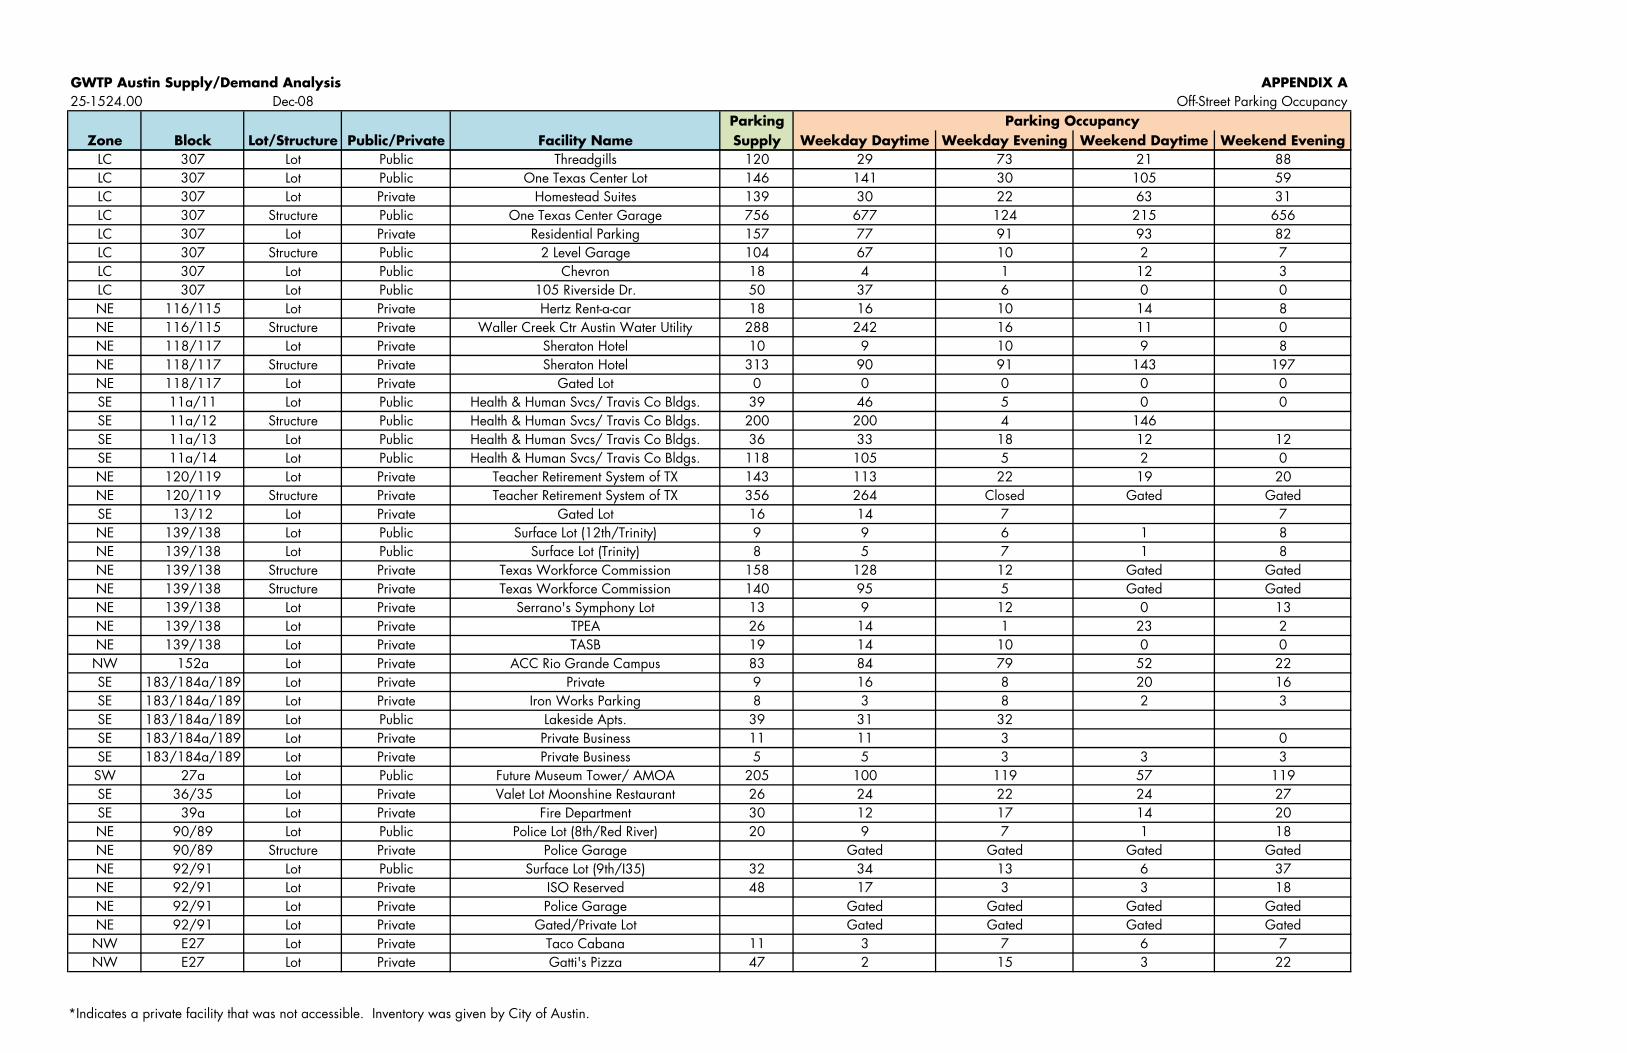
GWTP Austin Supply/Demand Analysis APPENDIX A25-1524.00 Dec-08 Off-Street Parking Occupancy
ParkingZone Block Lot/Structure Public/Private Facility Name Supply Weekday Daytime Weekday Evening Weekend Daytime Weekend Evening
Parking Occupancy
LC 307 Lot Public Threadgills 120 29 73 21 88LC 307 Lot Public One Texas Center Lot 146 141 30 105 59LC 307 Lot Private Homestead Suites 139 30 22 63 31LC 307 Structure Public One Texas Center Garage 756 677 124 215 656LC 307 Lot Private Residential Parking 157 77 91 93 82LC 307 Structure Public 2 Level Garage 104 67 10 2 7LC 307 Lot Public Chevron 18 4 1 12 3LC 307 Lot Public 105 Riverside Dr. 50 37 6 0 0NE 116/115 Lot Private Hertz Rent-a-car 18 16 10 14 8NE 116/115 Structure Private Waller Creek Ctr Austin Water Utility 288 242 16 11 0NE 118/117 Lot Private Sheraton Hotel 10 9 10 9 8NE 118/117 Structure Private Sheraton Hotel 313 90 91 143 197NE 118/117 Lot Private Gated Lot 0 0 0 0 0SE 11a/11 Lot Public Health & Human Svcs/ Travis Co Bldgs. 39 46 5 0 0SE 11a/12 Structure Public Health & Human Svcs/ Travis Co Bldgs. 200 200 4 146SE 11a/13 Lot Public Health & Human Svcs/ Travis Co Bldgs. 36 33 18 12 12SE 11a/14 Lot Public Health & Human Svcs/ Travis Co Bldgs. 118 105 5 2 0NE 120/119 Lot Private Teacher Retirement System of TX 143 113 22 19 20NE 120/119 Structure Private Teacher Retirement System of TX 356 264 Closed Gated GatedSE 13/12 Lot Private Gated Lot 16 14 7 7NE 139/138 Lot Public Surface Lot (12th/Trinity) 9 9 6 1 8NE 139/138 Lot Public Surface Lot (Trinity) 8 5 7 1 8NE 139/138 Structure Private Texas Workforce Commission 158 128 12 Gated GatedNE 139/138 Structure Private Texas Workforce Commission 140 95 5 Gated GatedNE 139/138 Lot Private Serrano's Symphony Lot 13 9 12 0 13NE 139/138 Lot Private TPEA 26 14 1 23 2NE 139/138 Lot Private TASB 19 14 10 0 0NW 152a Lot Private ACC Rio Grande Campus 83 84 79 52 22SE 183/184a/189 Lot Private Private 9 16 8 20 16SE 183/184a/189 Lot Private Iron Works Parking 8 3 8 2 3SE 183/184a/189 Lot Public Lakeside Apts. 39 31 32SE 183/184a/189 Lot Private Private Business 11 11 3 0SE 183/184a/189 Lot Private Private Business 5 5 3 3 3SW 27a Lot Public Future Museum Tower/ AMOA 205 100 119 57 119SE 36/35 Lot Private Valet Lot Moonshine Restaurant 26 24 22 24 27SE 39a Lot Private Fire Department 30 12 17 14 20NE 90/89 Lot Public Police Lot (8th/Red River) 20 9 7 1 18NE 90/89 Structure Private Police Garage Gated Gated Gated GatedNE 92/91 Lot Public Surface Lot (9th/I35) 32 34 13 6 37NE 92/91 Lot Private ISO Reserved 48 17 3 3 18NE 92/91 Lot Private Police Garage Gated Gated Gated GatedNE 92/91 Lot Private Gated/Private Lot Gated Gated Gated GatedNW E27 Lot Private Taco Cabana 11 3 7 6 7NW E27 Lot Private Gatti's Pizza 47 2 15 3 22
*Indicates a private facility that was not accessible. Inventory was given by City of Austin.
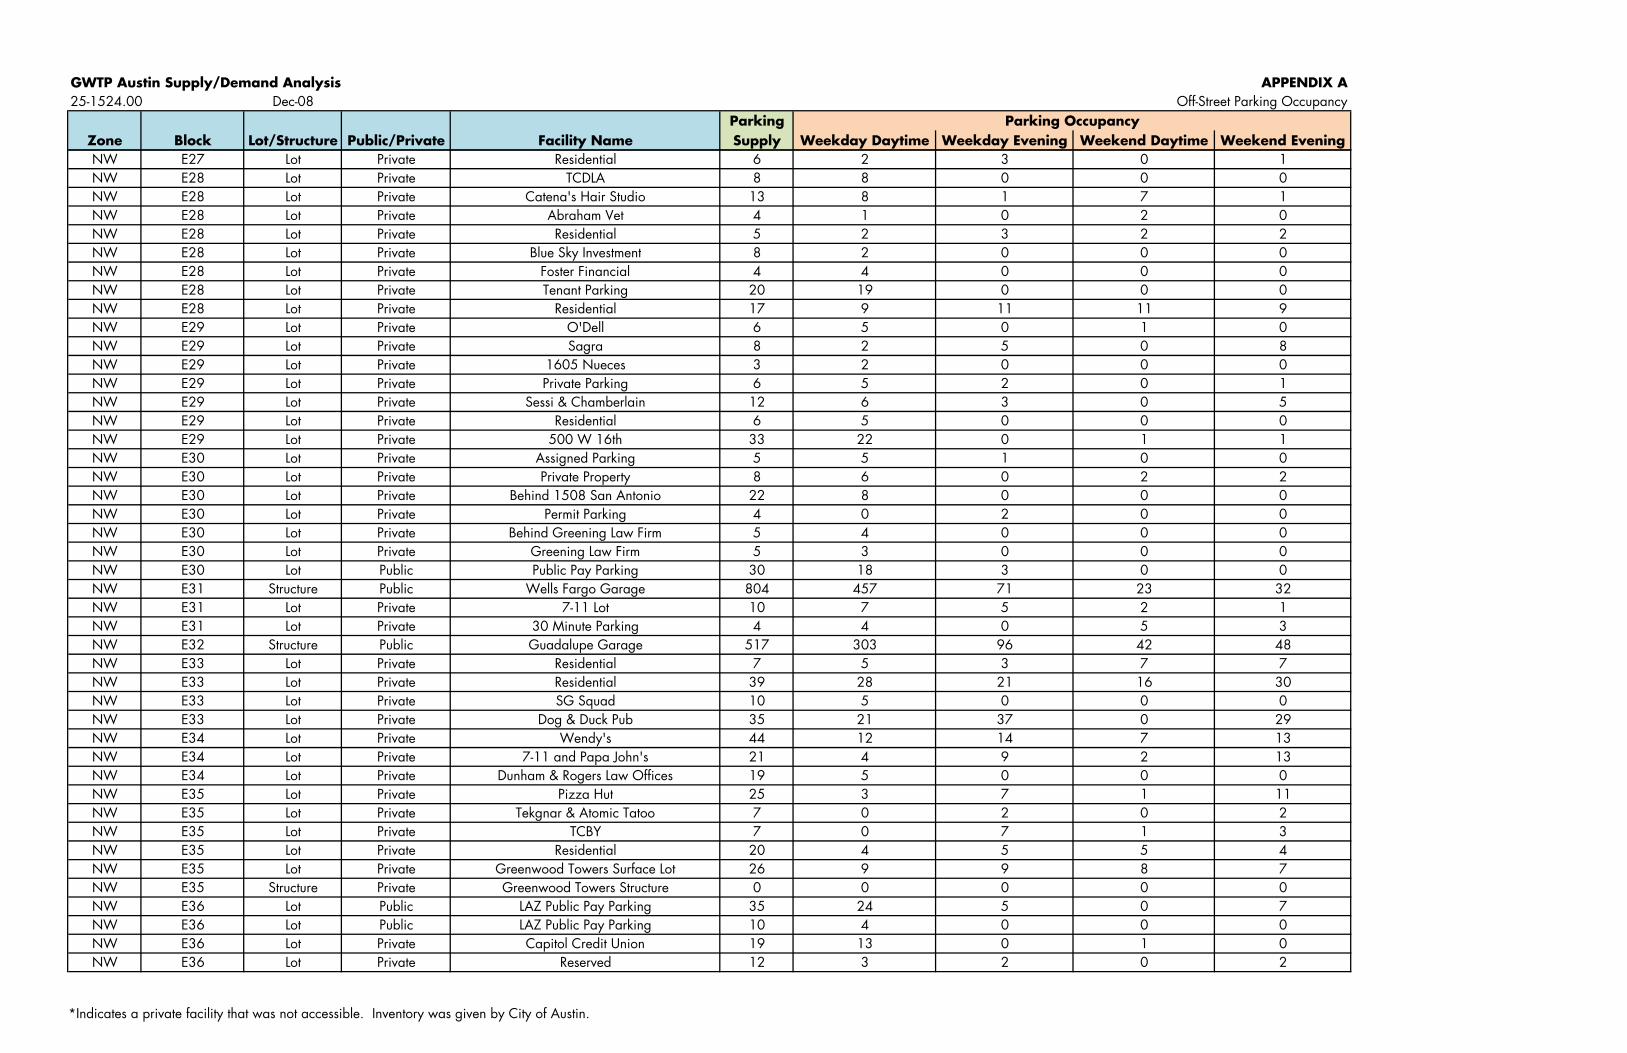
GWTP Austin Supply/Demand Analysis APPENDIX A25-1524.00 Dec-08 Off-Street Parking Occupancy
ParkingZone Block Lot/Structure Public/Private Facility Name Supply Weekday Daytime Weekday Evening Weekend Daytime Weekend Evening
Parking Occupancy
NW E27 Lot Private Residential 6 2 3 0 1NW E28 Lot Private TCDLA 8 8 0 0 0NW E28 Lot Private Catena's Hair Studio 13 8 1 7 1NW E28 Lot Private Abraham Vet 4 1 0 2 0NW E28 Lot Private Residential 5 2 3 2 2NW E28 Lot Private Blue Sky Investment 8 2 0 0 0NW E28 Lot Private Foster Financial 4 4 0 0 0NW E28 Lot Private Tenant Parking 20 19 0 0 0NW E28 Lot Private Residential 17 9 11 11 9NW E29 Lot Private O'Dell 6 5 0 1 0NW E29 Lot Private Sagra 8 2 5 0 8NW E29 Lot Private 1605 Nueces 3 2 0 0 0NW E29 Lot Private Private Parking 6 5 2 0 1NW E29 Lot Private Sessi & Chamberlain 12 6 3 0 5NW E29 Lot Private Residential 6 5 0 0 0NW E29 Lot Private 500 W 16th 33 22 0 1 1NW E30 Lot Private Assigned Parking 5 5 1 0 0NW E30 Lot Private Private Property 8 6 0 2 2NW E30 Lot Private Behind 1508 San Antonio 22 8 0 0 0NW E30 Lot Private Permit Parking 4 0 2 0 0NW E30 Lot Private Behind Greening Law Firm 5 4 0 0 0NW E30 Lot Private Greening Law Firm 5 3 0 0 0NW E30 Lot Public Public Pay Parking 30 18 3 0 0NW E31 Structure Public Wells Fargo Garage 804 457 71 23 32NW E31 Lot Private 7-11 Lot 10 7 5 2 1NW E31 Lot Private 30 Minute Parking 4 4 0 5 3NW E32 Structure Public Guadalupe Garage 517 303 96 42 48NW E33 Lot Private Residential 7 5 3 7 7NW E33 Lot Private Residential 39 28 21 16 30NW E33 Lot Private SG Squad 10 5 0 0 0NW E33 Lot Private Dog & Duck Pub 35 21 37 0 29NW E34 Lot Private Wendy's 44 12 14 7 13NW E34 Lot Private 7-11 and Papa John's 21 4 9 2 13NW E34 Lot Private Dunham & Rogers Law Offices 19 5 0 0 0NW E35 Lot Private Pizza Hut 25 3 7 1 11NW E35 Lot Private Tekgnar & Atomic Tatoo 7 0 2 0 2NW E35 Lot Private TCBY 7 0 7 1 3NW E35 Lot Private Residential 20 4 5 5 4NW E35 Lot Private Greenwood Towers Surface Lot 26 9 9 8 7NW E35 Structure Private Greenwood Towers Structure 0 0 0 0 0NW E36 Lot Public LAZ Public Pay Parking 35 24 5 0 7NW E36 Lot Public LAZ Public Pay Parking 10 4 0 0 0NW E36 Lot Private Capitol Credit Union 19 13 0 1 0NW E36 Lot Private Reserved 12 3 2 0 2
*Indicates a private facility that was not accessible. Inventory was given by City of Austin.
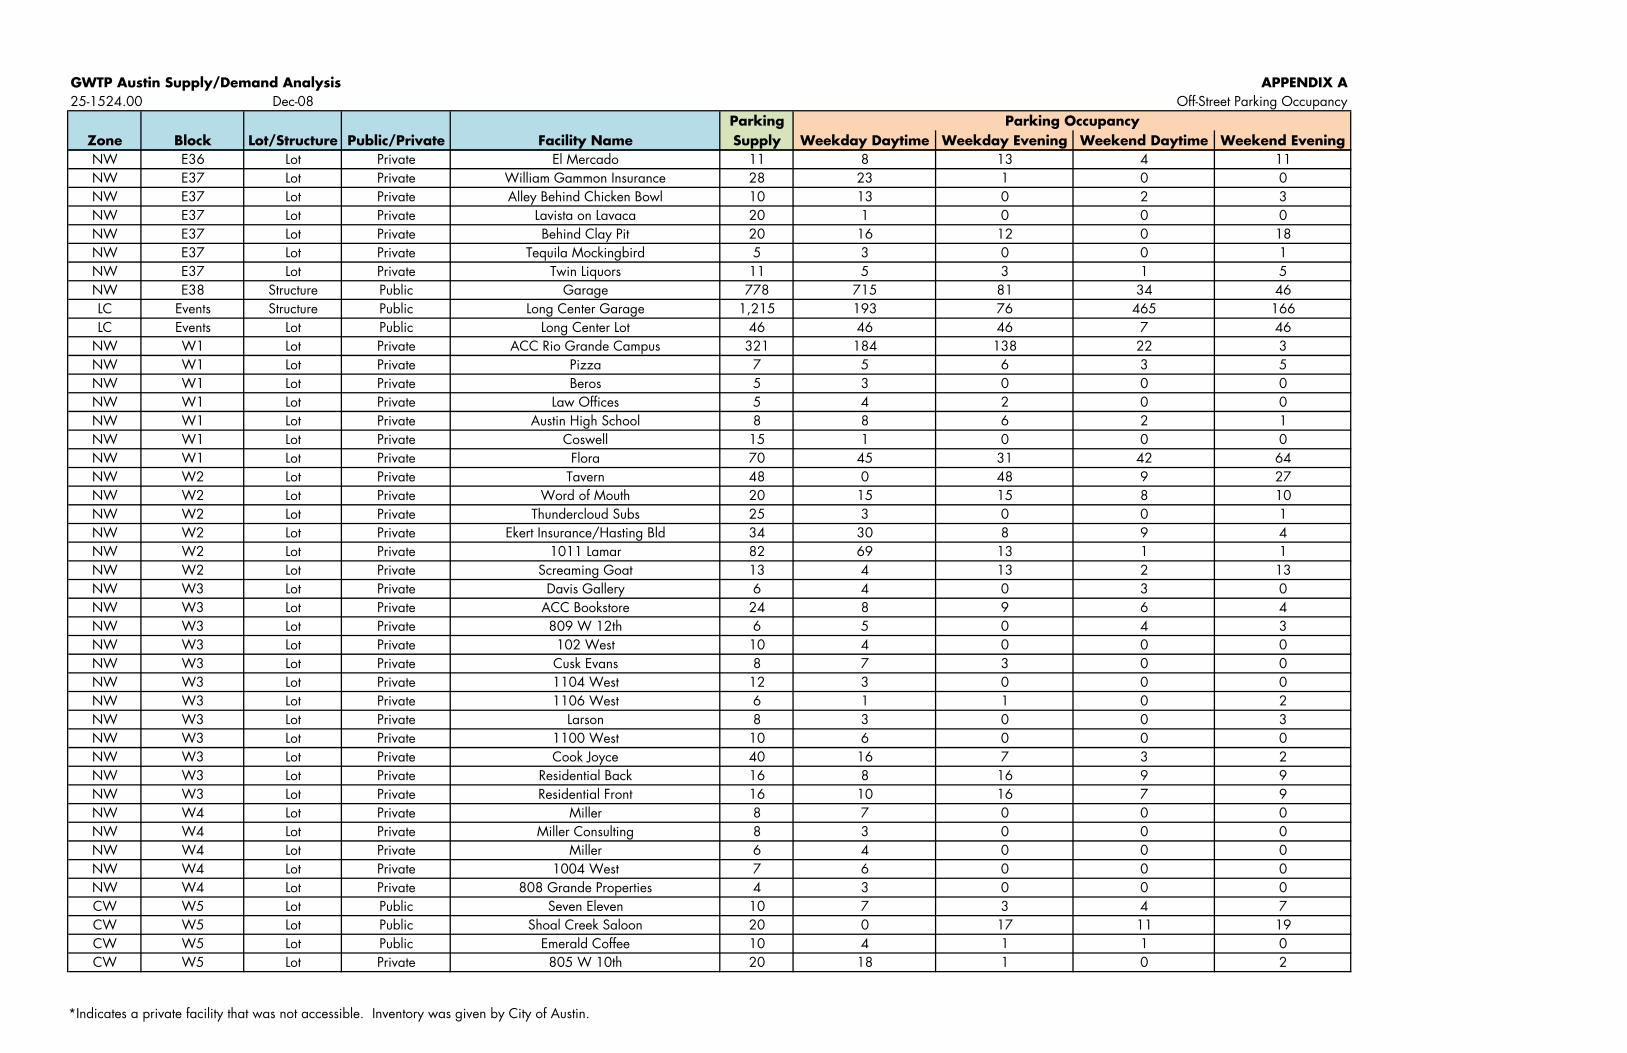
GWTP Austin Supply/Demand Analysis APPENDIX A25-1524.00 Dec-08 Off-Street Parking Occupancy
ParkingZone Block Lot/Structure Public/Private Facility Name Supply Weekday Daytime Weekday Evening Weekend Daytime Weekend Evening
Parking Occupancy
NW E36 Lot Private El Mercado 11 8 13 4 11NW E37 Lot Private William Gammon Insurance 28 23 1 0 0NW E37 Lot Private Alley Behind Chicken Bowl 10 13 0 2 3NW E37 Lot Private Lavista on Lavaca 20 1 0 0 0NW E37 Lot Private Behind Clay Pit 20 16 12 0 18NW E37 Lot Private Tequila Mockingbird 5 3 0 0 1NW E37 Lot Private Twin Liquors 11 5 3 1 5NW E38 Structure Public Garage 778 715 81 34 46LC Events Structure Public Long Center Garage 1,215 193 76 465 166LC Events Lot Public Long Center Lot 46 46 46 7 46
NW W1 Lot Private ACC Rio Grande Campus 321 184 138 22 3NW W1 Lot Private Pizza 7 5 6 3 5NW W1 Lot Private Beros 5 3 0 0 0NW W1 Lot Private Law Offices 5 4 2 0 0NW W1 Lot Private Austin High School 8 8 6 2 1NW W1 Lot Private Coswell 15 1 0 0 0NW W1 Lot Private Flora 70 45 31 42 64NW W2 Lot Private Tavern 48 0 48 9 27NW W2 Lot Private Word of Mouth 20 15 15 8 10NW W2 Lot Private Thundercloud Subs 25 3 0 0 1NW W2 Lot Private Ekert Insurance/Hasting Bld 34 30 8 9 4NW W2 Lot Private 1011 Lamar 82 69 13 1 1NW W2 Lot Private Screaming Goat 13 4 13 2 13NW W3 Lot Private Davis Gallery 6 4 0 3 0NW W3 Lot Private ACC Bookstore 24 8 9 6 4NW W3 Lot Private 809 W 12th 6 5 0 4 3NW W3 Lot Private 102 West 10 4 0 0 0NW W3 Lot Private Cusk Evans 8 7 3 0 0NW W3 Lot Private 1104 West 12 3 0 0 0NW W3 Lot Private 1106 West 6 1 1 0 2NW W3 Lot Private Larson 8 3 0 0 3NW W3 Lot Private 1100 West 10 6 0 0 0NW W3 Lot Private Cook Joyce 40 16 7 3 2NW W3 Lot Private Residential Back 16 8 16 9 9NW W3 Lot Private Residential Front 16 10 16 7 9NW W4 Lot Private Miller 8 7 0 0 0NW W4 Lot Private Miller Consulting 8 3 0 0 0NW W4 Lot Private Miller 6 4 0 0 0NW W4 Lot Private 1004 West 7 6 0 0 0NW W4 Lot Private 808 Grande Properties 4 3 0 0 0CW W5 Lot Public Seven Eleven 10 7 3 4 7CW W5 Lot Public Shoal Creek Saloon 20 0 17 11 19CW W5 Lot Public Emerald Coffee 10 4 1 1 0CW W5 Lot Private 805 W 10th 20 18 1 0 2
*Indicates a private facility that was not accessible. Inventory was given by City of Austin.
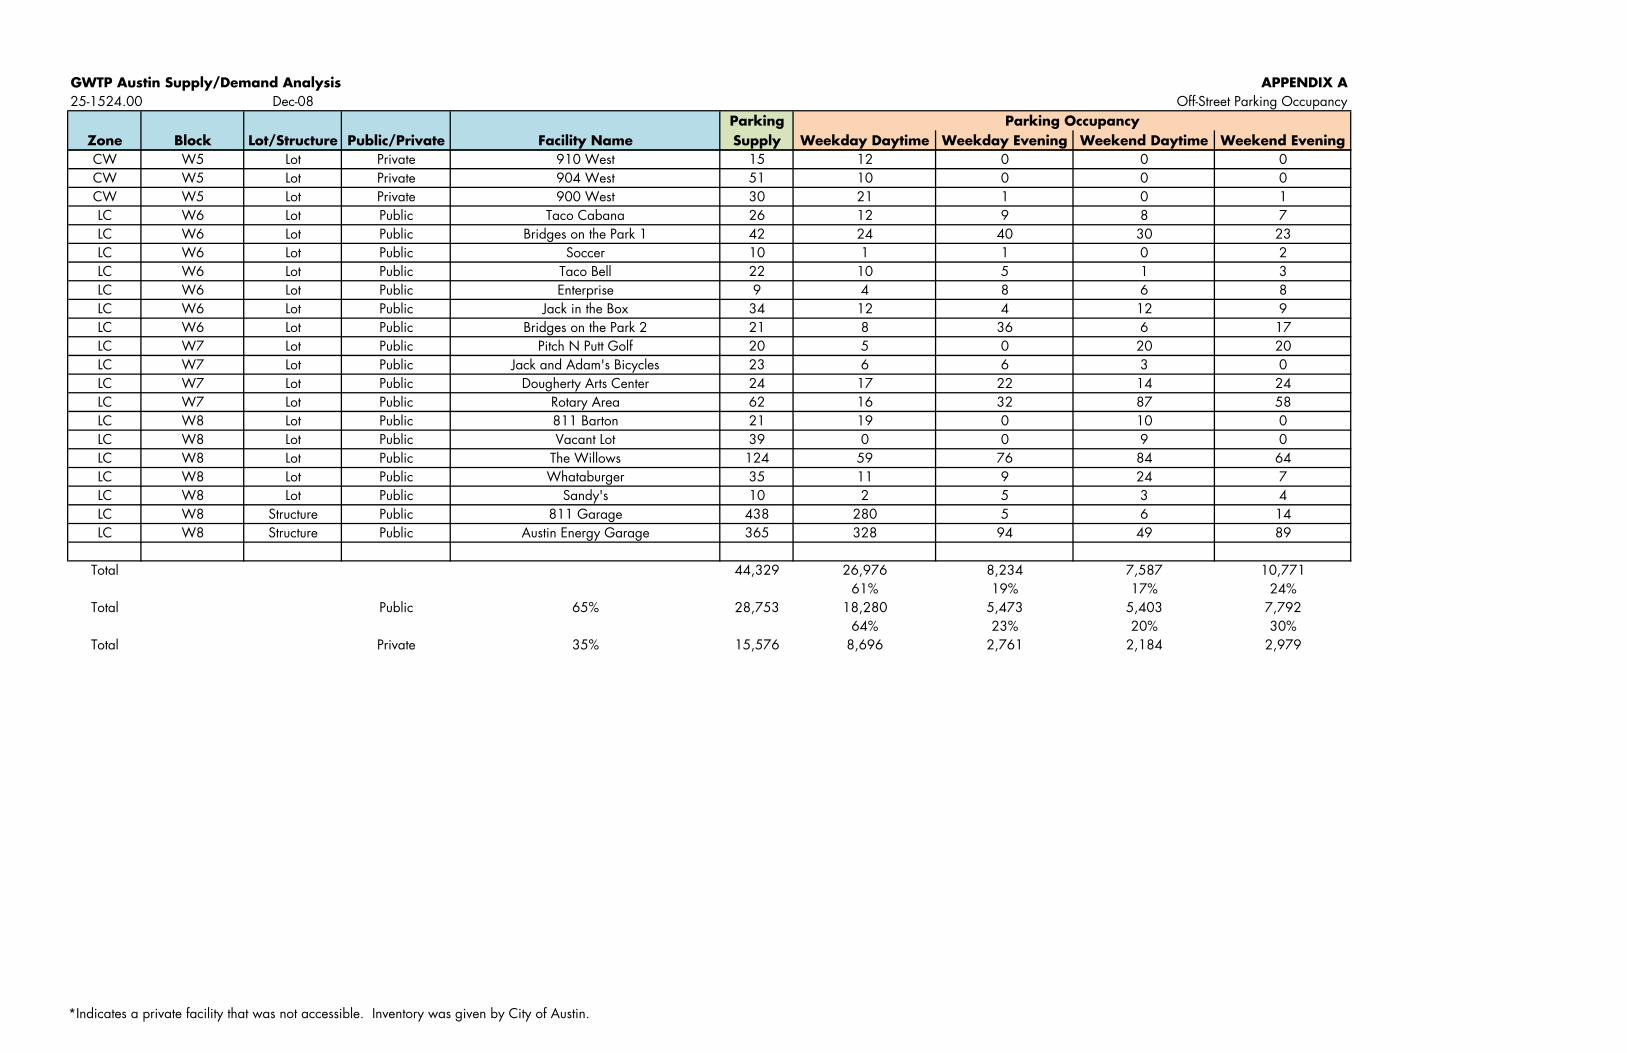
GWTP Austin Supply/Demand Analysis APPENDIX A25-1524.00 Dec-08 Off-Street Parking Occupancy
ParkingZone Block Lot/Structure Public/Private Facility Name Supply Weekday Daytime Weekday Evening Weekend Daytime Weekend Evening
Parking Occupancy
CW W5 Lot Private 910 West 15 12 0 0 0CW W5 Lot Private 904 West 51 10 0 0 0CW W5 Lot Private 900 West 30 21 1 0 1LC W6 Lot Public Taco Cabana 26 12 9 8 7LC W6 Lot Public Bridges on the Park 1 42 24 40 30 23LC W6 Lot Public Soccer 10 1 1 0 2LC W6 Lot Public Taco Bell 22 10 5 1 3LC W6 Lot Public Enterprise 9 4 8 6 8LC W6 Lot Public Jack in the Box 34 12 4 12 9LC W6 Lot Public Bridges on the Park 2 21 8 36 6 17LC W7 Lot Public Pitch N Putt Golf 20 5 0 20 20LC W7 Lot Public Jack and Adam's Bicycles 23 6 6 3 0LC W7 Lot Public Dougherty Arts Center 24 17 22 14 24LC W7 Lot Public Rotary Area 62 16 32 87 58LC W8 Lot Public 811 Barton 21 19 0 10 0LC W8 Lot Public Vacant Lot 39 0 0 9 0LC W8 Lot Public The Willows 124 59 76 84 64LC W8 Lot Public Whataburger 35 11 9 24 7LC W8 Lot Public Sandy's 10 2 5 3 4LC W8 Structure Public 811 Garage 438 280 5 6 14LC W8 Structure Public Austin Energy Garage 365 328 94 49 89
Total 44,329 26,976 8,234 7,587 10,77161% 19% 17% 24%
Total Public 65% 28,753 18,280 5,473 5,403 7,79264% 23% 20% 30%
Total Private 35% 15,576 8,696 2,761 2,184 2,979
*Indicates a private facility that was not accessible. Inventory was given by City of Austin.
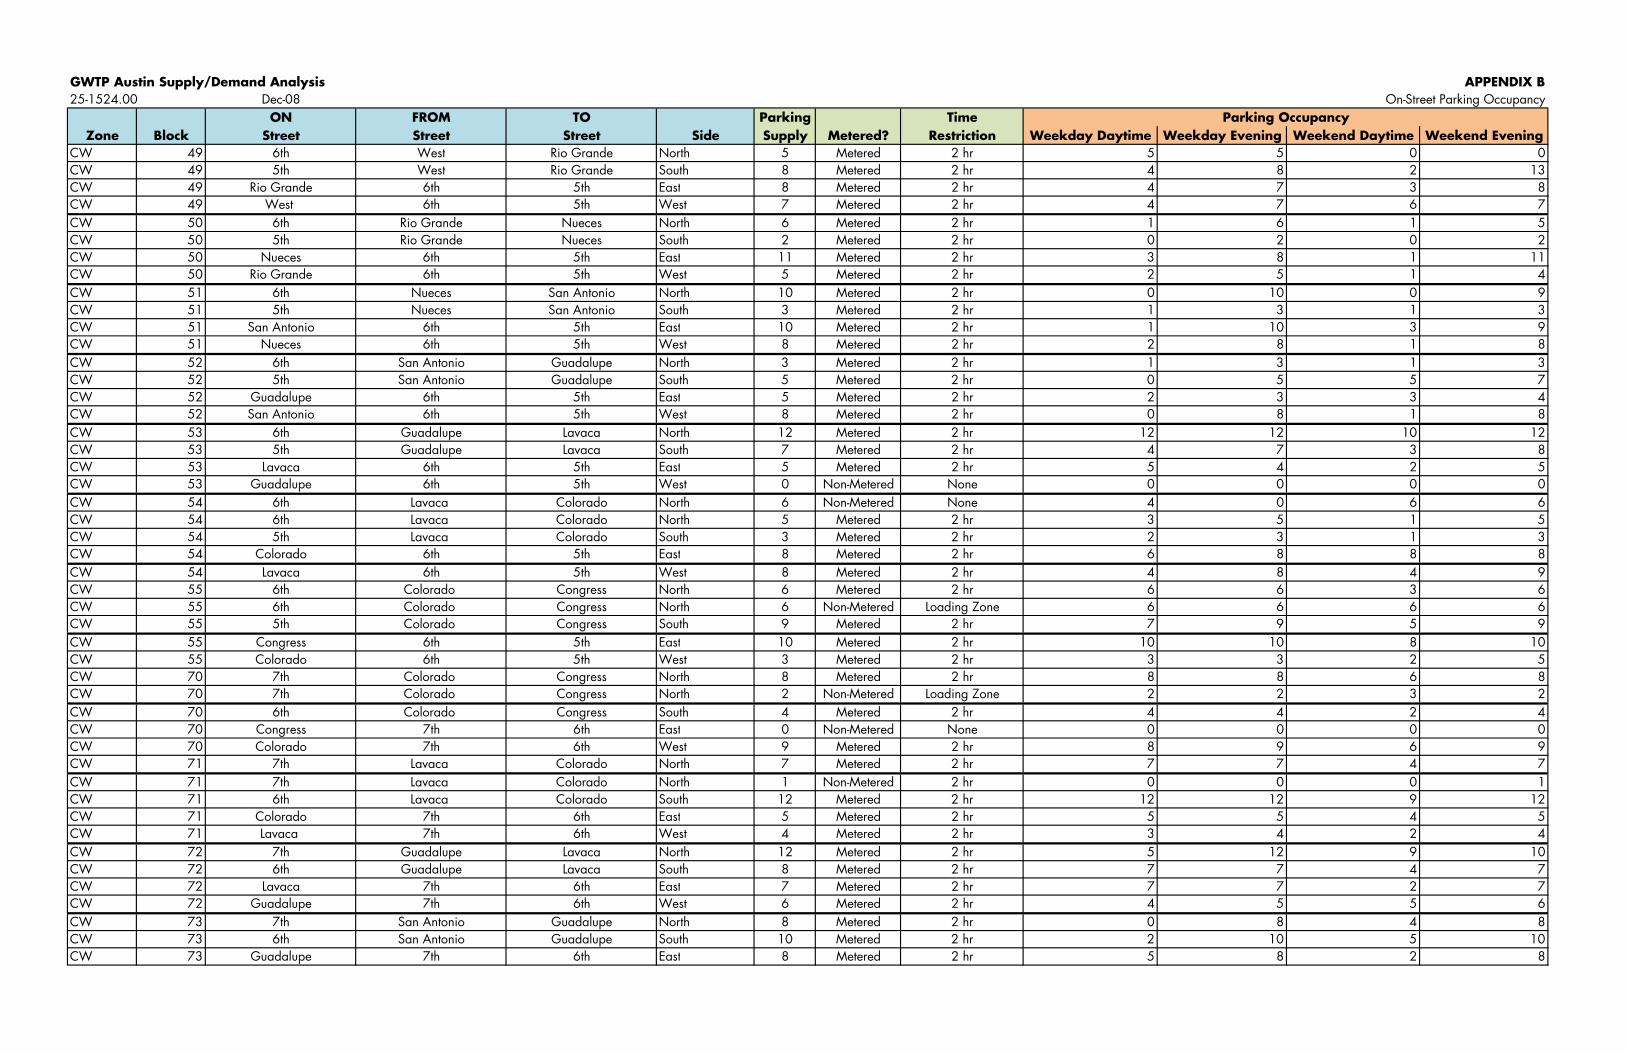
GWTP Austin Supply/Demand Analysis APPENDIX B25-1524.00 Dec-08 On-Street Parking Occupancy
ON FROM TO Parking TimeZone Block Street Street Street Side Supply Metered? Restriction Weekday Daytime Weekday Evening Weekend Daytime Weekend Evening
CW 49 6th West Rio Grande North 5 Metered 2 hr 5 5 0 0CW 49 5th West Rio Grande South 8 Metered 2 hr 4 8 2 13CW 49 Rio Grande 6th 5th East 8 Metered 2 hr 4 7 3 8CW 49 West 6th 5th West 7 Metered 2 hr 4 7 6 7CW 50 6th Rio Grande Nueces North 6 Metered 2 hr 1 6 1 5CW 50 5th Rio Grande Nueces South 2 Metered 2 hr 0 2 0 2
Parking Occupancy
CW 50 Nueces 6th 5th East 11 Metered 2 hr 3 8 1 11CW 50 Rio Grande 6th 5th West 5 Metered 2 hr 2 5 1 4CW 51 6th Nueces San Antonio North 10 Metered 2 hr 0 10 0 9CW 51 5th Nueces San Antonio South 3 Metered 2 hr 1 3 1 3CW 51 San Antonio 6th 5th East 10 Metered 2 hr 1 10 3 9CW 51 Nueces 6th 5th West 8 Metered 2 hr 2 8 1 8CW 52 6th San Antonio Guadalupe North 3 Metered 2 hr 1 3 1 3CW 52 5th San Antonio Guadalupe South 5 Metered 2 hr 0 5 5 7CW 52 Guadalupe 6th 5th East 5 Metered 2 hr 2 3 3 4CW 52 San Antonio 6th 5th West 8 Metered 2 hr 0 8 1 8CW 53 6th Guadalupe Lavaca North 12 Metered 2 hr 12 12 10 12CW 53 5th Guadalupe Lavaca South 7 Metered 2 hr 4 7 3 8CW 53 Lavaca 6th 5th East 5 Metered 2 hr 5 4 2 5CW 53 Guadalupe 6th 5th West 0 Non-Metered None 0 0 0 0CW 54 6th Lavaca Colorado North 6 Non-Metered None 4 0 6 6CW 54 6th Lavaca Colorado North 5 Metered 2 hr 3 5 1 5CW 54 5th Lavaca Colorado South 3 Metered 2 hr 2 3 1 3CW 54 Colorado 6th 5th East 8 Metered 2 hr 6 8 8 8CW 54 Lavaca 6th 5th West 8 Metered 2 hr 4 8 4 9CW 55 6th Colorado Congress North 6 Metered 2 hr 6 6 3 6CW 55 6th Colorado Congress North 6 Non-Metered Loading Zone 6 6 6 6CW 55 5th Colorado Congress South 9 Metered 2 hr 7 9 5 9CW 55 Congress 6th 5th East 10 Metered 2 hr 10 10 8 10CW 55 Colorado 6th 5th West 3 Metered 2 hr 3 3 2 5CW 70 7th Colorado Congress North 8 Metered 2 hr 8 8 6 8CW 70 7th Colorado Congress North 2 Non-Metered Loading Zone 2 2 3 2CW 70 6th Colorado Congress South 4 Metered 2 hr 4 4 2 4CW 70 Congress 7th 6th East 0 Non-Metered None 0 0 0 0CW 70 Colorado 7th 6th West 9 Metered 2 hr 8 9 6 9CW 71 7th Lavaca Colorado North 7 Metered 2 hr 7 7 4 7CW 71 7th Lavaca Colorado North 1 Non-Metered 2 hr 0 0 0 1CW 71 6th Lavaca Colorado South 12 Metered 2 hr 12 12 9 12CW 71 Colorado 7th 6th East 5 Metered 2 hr 5 5 4 5CW 71 Lavaca 7th 6th West 4 Metered 2 hr 3 4 2 4CW 72 7th Guadalupe Lavaca North 12 Metered 2 hr 5 12 9 10CW 72 6th Guadalupe Lavaca South 8 Metered 2 hr 7 7 4 7CW 72 Lavaca 7th 6th East 7 Metered 2 hr 7 7 2 7CW 72 Guadalupe 7th 6th West 6 Metered 2 hr 4 5 5 6CW 73 7th San Antonio Guadalupe North 8 Metered 2 hr 0 8 4 8CW 73 6th San Antonio Guadalupe South 10 Metered 2 hr 2 10 5 10CW 73 Guadalupe 7th 6th East 8 Metered 2 hr 5 8 2 8

GWTP Austin Supply/Demand Analysis APPENDIX B25-1524.00 Dec-08 On-Street Parking Occupancy
ON FROM TO Parking TimeZone Block Street Street Street Side Supply Metered? Restriction Weekday Daytime Weekday Evening Weekend Daytime Weekend Evening
Parking Occupancy
CW 73 San Antonio 7th 6th West 5 Metered 2 hr 1 4 2 5CW 74 7th Nueces San Antonio North 3 Metered 2 hr 2 13 3 11CW 74 6th Nueces San Antonio South 8 Metered 2 hr 4 8 2 8CW 74 San Antonio 7th 6th East 6 Metered 2 hr 3 4 3 6CW 74 Nueces 7th 6th West 4 Metered 2 hr 2 4 2 9CW 75 7th Rio Grande Nueces North 2 Metered 2 hr 0 2 0 2CW 75 6th Rio Grande Nueces South 3 Metered 2 hr 0 3 3 7CW 75 Nueces 7th 6th East 3 Metered 2 hr 0 3 0 5CW 75 Rio Grande 7th 6th West 3 Metered 2 hr 2 3 3 5CW 76 7th West Rio Grande North 2 Metered 2 hr 2 2 2 2CW 76 6th West Rio Grande South 12 Metered 2 hr 2 12 5 12CW 76 Rio Grande 7th 6th East 8 Metered 2 hr 3 8 5 12CW 76 West 7th 6th West 8 Metered 2 hr 1 8 2 9CW 77 8th West Rio Grande North 5 Metered 2 hr 2 5 2 6CW 77 7th West Rio Grande South 4 Metered 2 hr 1 4 3 5CW 77 7th West Rio Grande South 3 Non-Metered None 3 3 1 3CW 77 Rio Grande 8th 7th East 6 Metered 2 hr 3 5 5 6CW 77 West 8th 7th West 4 Metered 2 hr 0 4 0 3CW 78 8th Rio Grande Nueces North 6 Metered 2 hr 3 4 0 6CW 78 7th Rio Grande Nueces South 8 Metered 2 hr 7 8 2 7CW 78 Nueces 8th 7th East 5 Metered 2 hr 2 5 1 5CW 78 Rio Grande 8th 7th West 6 Metered 2 hr 2 6 1 5CW 79 8th Nueces San Antonio North 7 Metered 2 hr 1 2 6 7CW 79 7th Nueces San Antonio South 7 Metered 2 hr 4 7 2 5CW 79 San Antonio 8th 7th East 0 Non-Metered None 0 0 0 0CW 79 Nueces 8th 7th West 10 Metered 2 hr 6 5 1 9CW 80 8th San Antonio Guadalupe North 9 Metered 2 hr 3 4 3 10CW 80 7th San Antonio Guadalupe South 8 Metered 2 hr 0 8 3 12CW 80 Guadalupe 8th 7th East 9 Metered 2 hr 0 7 3 9CW 80 San Antonio 8th 7th West 0 Non-Metered None 0 0 0 0CW 81 8th Guadalupe Lavaca North 6 Metered 2 hr 6 9 2CW 81 7th Guadalupe Lavaca South 10 Metered 2 hr 2 10 4 7CW 81 Lavaca 8th 7th East 10 Metered 2 hr 10 9 5 9CW 81 Guadalupe 8th 7th West 8 Metered 2 hr 5 7 0 12CW 82 8th Lavaca Colorado North 6 Metered 2 hr 3 0 0 4CW 82 7th Lavaca Colorado South 9 Metered 2 hr 8 9 2 10CW 82 Colorado 8th 7th East 5 Metered 2 hr 4 4 3 5CW 82 Lavaca 8th 7th West 12 Metered 2 hr 9 11 7 10CW 83 8th Colorado Congress North 10 Metered 2 hr 9 13 10 17CW 83 7th Colorado Congress South 10 Non-Metered Loading Zone 6 10 6 9CW 83 Congress 8th 7th East 10 Metered 2 hr 10 10 10 10CW 83 Colorado 8th 7th West 8 Metered 2 hr 6 8 4 11CW 98 9th Colorado Congress North 4 Metered 2 hr 3 2 3 4CW 98 8th Colorado Congress South 5 Metered 2 hr 5 6 3 6CW 98 Congress 9th 8th East 10 Metered 2 hr 10 10 10 10CW 98 Colorado 9th 8th West 6 Metered 2 hr 5 2 1 6CW 99 9th Lavaca Colorado North 6 Metered 2 hr 4 5 3 6
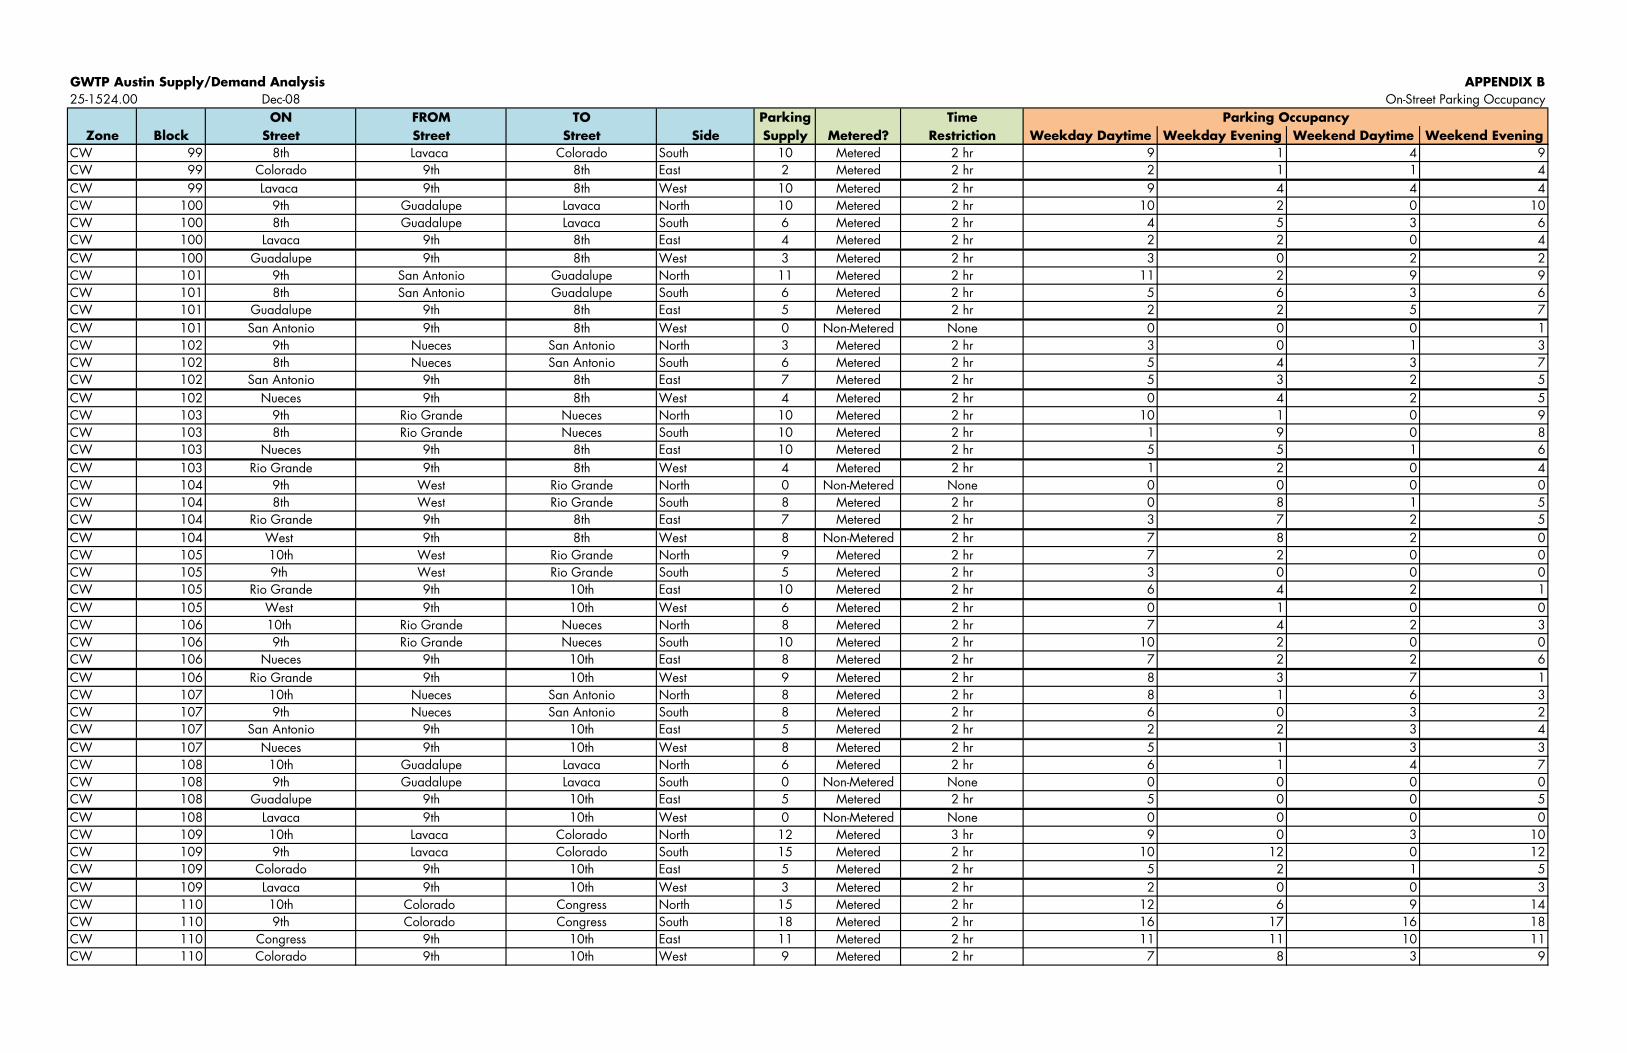
GWTP Austin Supply/Demand Analysis APPENDIX B25-1524.00 Dec-08 On-Street Parking Occupancy
ON FROM TO Parking TimeZone Block Street Street Street Side Supply Metered? Restriction Weekday Daytime Weekday Evening Weekend Daytime Weekend Evening
Parking Occupancy
CW 99 8th Lavaca Colorado South 10 Metered 2 hr 9 1 4 9CW 99 Colorado 9th 8th East 2 Metered 2 hr 2 1 1 4CW 99 Lavaca 9th 8th West 10 Metered 2 hr 9 4 4 4CW 100 9th Guadalupe Lavaca North 10 Metered 2 hr 10 2 0 10CW 100 8th Guadalupe Lavaca South 6 Metered 2 hr 4 5 3 6CW 100 Lavaca 9th 8th East 4 Metered 2 hr 2 2 0 4CW 100 Guadalupe 9th 8th West 3 Metered 2 hr 3 0 2 2CW 101 9th San Antonio Guadalupe North 11 Metered 2 hr 11 2 9 9CW 101 8th San Antonio Guadalupe South 6 Metered 2 hr 5 6 3 6CW 101 Guadalupe 9th 8th East 5 Metered 2 hr 2 2 5 7CW 101 San Antonio 9th 8th West 0 Non-Metered None 0 0 0 1CW 102 9th Nueces San Antonio North 3 Metered 2 hr 3 0 1 3CW 102 8th Nueces San Antonio South 6 Metered 2 hr 5 4 3 7CW 102 San Antonio 9th 8th East 7 Metered 2 hr 5 3 2 5CW 102 Nueces 9th 8th West 4 Metered 2 hr 0 4 2 5CW 103 9th Rio Grande Nueces North 10 Metered 2 hr 10 1 0 9CW 103 8th Rio Grande Nueces South 10 Metered 2 hr 1 9 0 8CW 103 Nueces 9th 8th East 10 Metered 2 hr 5 5 1 6CW 103 Rio Grande 9th 8th West 4 Metered 2 hr 1 2 0 4CW 104 9th West Rio Grande North 0 Non-Metered None 0 0 0 0CW 104 8th West Rio Grande South 8 Metered 2 hr 0 8 1 5CW 104 Rio Grande 9th 8th East 7 Metered 2 hr 3 7 2 5CW 104 West 9th 8th West 8 Non-Metered 2 hr 7 8 2 0CW 105 10th West Rio Grande North 9 Metered 2 hr 7 2 0 0CW 105 9th West Rio Grande South 5 Metered 2 hr 3 0 0 0CW 105 Rio Grande 9th 10th East 10 Metered 2 hr 6 4 2 1CW 105 West 9th 10th West 6 Metered 2 hr 0 1 0 0CW 106 10th Rio Grande Nueces North 8 Metered 2 hr 7 4 2 3CW 106 9th Rio Grande Nueces South 10 Metered 2 hr 10 2 0 0CW 106 Nueces 9th 10th East 8 Metered 2 hr 7 2 2 6CW 106 Rio Grande 9th 10th West 9 Metered 2 hr 8 3 7 1CW 107 10th Nueces San Antonio North 8 Metered 2 hr 8 1 6 3CW 107 9th Nueces San Antonio South 8 Metered 2 hr 6 0 3 2CW 107 San Antonio 9th 10th East 5 Metered 2 hr 2 2 3 4CW 107 Nueces 9th 10th West 8 Metered 2 hr 5 1 3 3CW 108 10th Guadalupe Lavaca North 6 Metered 2 hr 6 1 4 7CW 108 9th Guadalupe Lavaca South 0 Non-Metered None 0 0 0 0CW 108 Guadalupe 9th 10th East 5 Metered 2 hr 5 0 0 5CW 108 Lavaca 9th 10th West 0 Non-Metered None 0 0 0 0CW 109 10th Lavaca Colorado North 12 Metered 3 hr 9 0 3 10CW 109 9th Lavaca Colorado South 15 Metered 2 hr 10 12 0 12CW 109 Colorado 9th 10th East 5 Metered 2 hr 5 2 1 5CW 109 Lavaca 9th 10th West 3 Metered 2 hr 2 0 0 3CW 110 10th Colorado Congress North 15 Metered 2 hr 12 6 9 14CW 110 9th Colorado Congress South 18 Metered 2 hr 16 17 16 18CW 110 Congress 9th 10th East 11 Metered 2 hr 11 11 10 11CW 110 Colorado 9th 10th West 9 Metered 2 hr 7 8 3 9
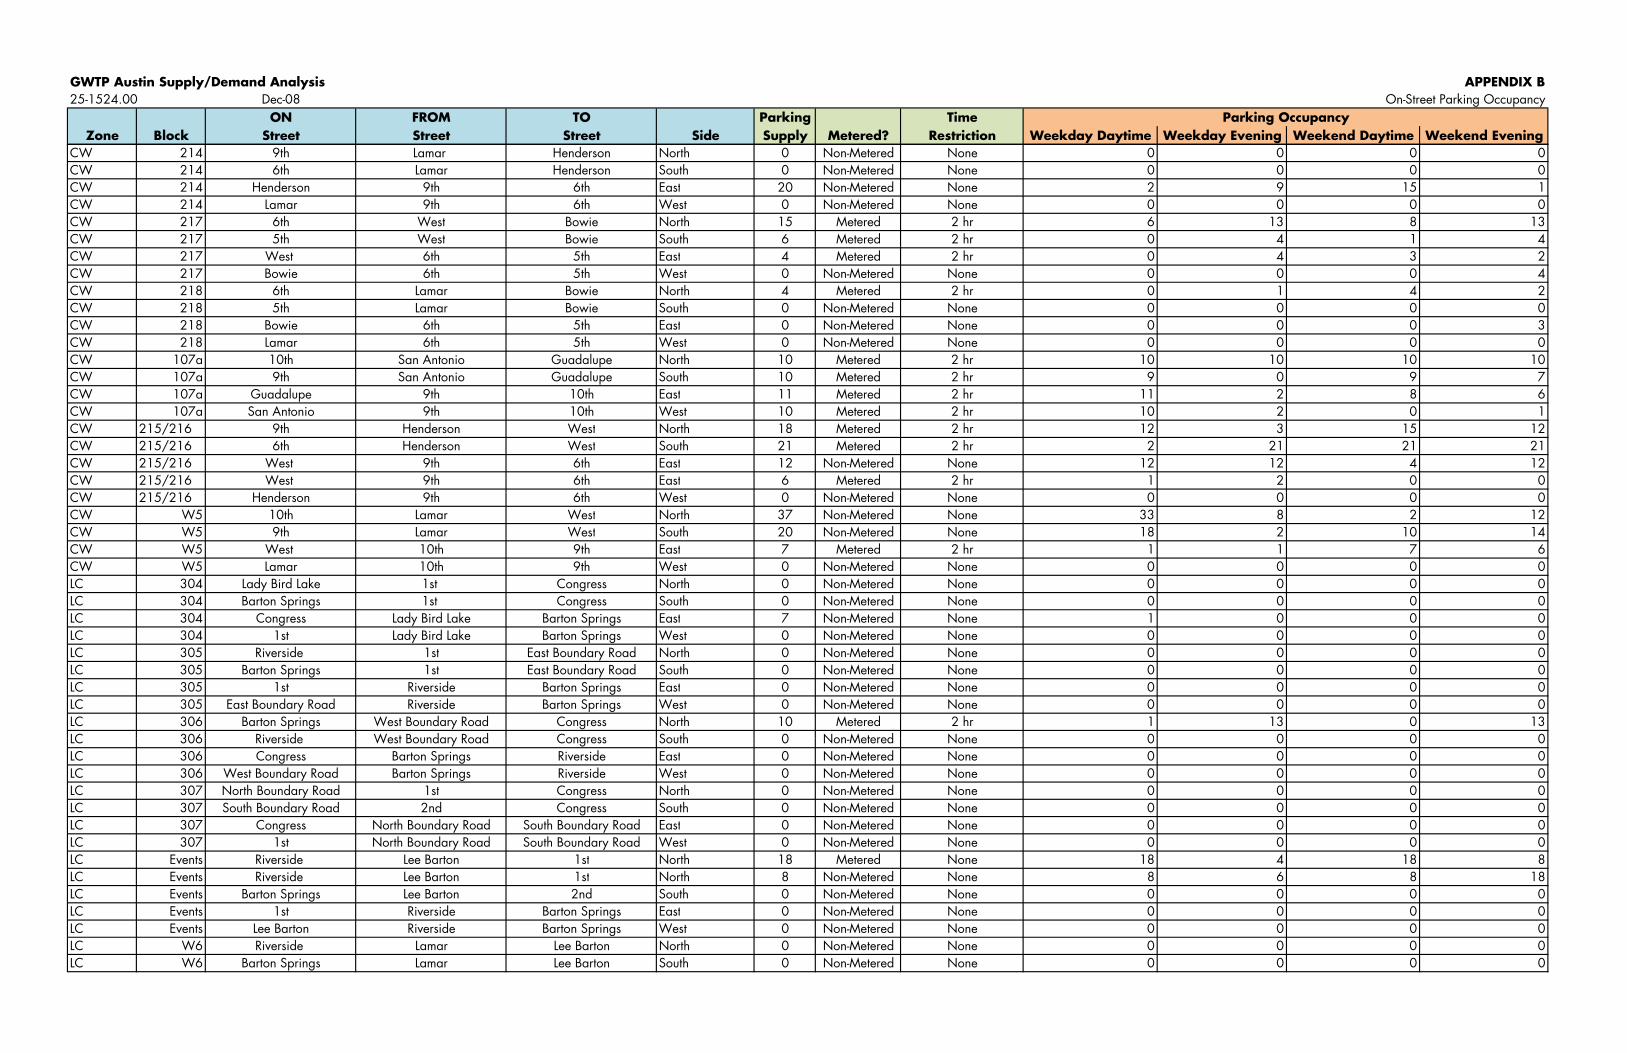
GWTP Austin Supply/Demand Analysis APPENDIX B25-1524.00 Dec-08 On-Street Parking Occupancy
ON FROM TO Parking TimeZone Block Street Street Street Side Supply Metered? Restriction Weekday Daytime Weekday Evening Weekend Daytime Weekend Evening
Parking Occupancy
CW 214 9th Lamar Henderson North 0 Non-Metered None 0 0 0 0CW 214 6th Lamar Henderson South 0 Non-Metered None 0 0 0 0CW 214 Henderson 9th 6th East 20 Non-Metered None 2 9 15 1CW 214 Lamar 9th 6th West 0 Non-Metered None 0 0 0 0CW 217 6th West Bowie North 15 Metered 2 hr 6 13 8 13CW 217 5th West Bowie South 6 Metered 2 hr 0 4 1 4CW 217 West 6th 5th East 4 Metered 2 hr 0 4 3 2CW 217 Bowie 6th 5th West 0 Non-Metered None 0 0 0 4CW 218 6th Lamar Bowie North 4 Metered 2 hr 0 1 4 2CW 218 5th Lamar Bowie South 0 Non-Metered None 0 0 0 0CW 218 Bowie 6th 5th East 0 Non-Metered None 0 0 0 3CW 218 Lamar 6th 5th West 0 Non-Metered None 0 0 0 0CW 107a 10th San Antonio Guadalupe North 10 Metered 2 hr 10 10 10 10CW 107a 9th San Antonio Guadalupe South 10 Metered 2 hr 9 0 9 7CW 107a Guadalupe 9th 10th East 11 Metered 2 hr 11 2 8 6CW 107a San Antonio 9th 10th West 10 Metered 2 hr 10 2 0 1CW 215/216 9th Henderson West North 18 Metered 2 hr 12 3 15 12CW 215/216 6th Henderson West South 21 Metered 2 hr 2 21 21 21CW 215/216 West 9th 6th East 12 Non-Metered None 12 12 4 12CW 215/216 West 9th 6th East 6 Metered 2 hr 1 2 0 0
W / d h h W N M d NCW 215/216 Henderson 9th 6th West 0 Non-Metered None 0 0 0 0CW W5 10th Lamar West North 37 Non-Metered None 33 8 2 12CW W5 9th Lamar West South 20 Non-Metered None 18 2 10 14CW W5 West 10th 9th East 7 Metered 2 hr 1 1 7 6CW W5 Lamar 10th 9th West 0 Non-Metered None 0 0 0 0LC 304 Lady Bird Lake 1st Congress North 0 Non-Metered None 0 0 0 0LC 304 Barton Springs 1st Congress South 0 Non-Metered None 0 0 0 0LC 304 Congress Lady Bird Lake Barton Springs East 7 Non-Metered None 1 0 0 0LC 304 1st Lady Bird Lake Barton Springs West 0 Non-Metered None 0 0 0 0LC 305 Riverside 1st East Boundary Road North 0 Non-Metered None 0 0 0 0LC 305 Barton Springs 1st East Boundary Road South 0 Non-Metered None 0 0 0 0LC 305 1st Riverside Barton Springs East 0 Non-Metered None 0 0 0 0LC 305 East Boundary Road Riverside Barton Springs West 0 Non-Metered None 0 0 0 0LC 306 Barton Springs West Boundary Road Congress North 10 Metered 2 hr 1 13 0 13LC 306 Riverside West Boundary Road Congress South 0 Non Metered None 0 0 0 0LC 306 Riverside West Boundary Road Congress South 0 Non-Metered None 0 0 0 0LC 306 Congress Barton Springs Riverside East 0 Non-Metered None 0 0 0 0LC 306 West Boundary Road Barton Springs Riverside West 0 Non-Metered None 0 0 0 0LC 307 North Boundary Road 1st Congress North 0 Non-Metered None 0 0 0 0LC 307 South Boundary Road 2nd Congress South 0 Non-Metered None 0 0 0 0LC 307 Congress North Boundary Road South Boundary Road East 0 Non-Metered None 0 0 0 0LC 307 1st North Boundary Road South Boundary Road West 0 Non-Metered None 0 0 0 0LC Events Riverside Lee Barton 1st North 18 Metered None 18 4 18 8LC Events Riverside Lee Barton 1st North 8 Non-Metered None 8 6 8 18LC Events Barton Springs Lee Barton 2nd South 0 Non-Metered None 0 0 0 0LC Events 1st Riverside Barton Springs East 0 Non-Metered None 0 0 0 0LC Events Lee Barton Riverside Barton Springs West 0 Non-Metered None 0 0 0 0LC W6 Riverside Lamar Lee Barton North 0 Non-Metered None 0 0 0 0LC W6 Barton Springs Lamar Lee Barton South 0 Non-Metered None 0 0 0 0
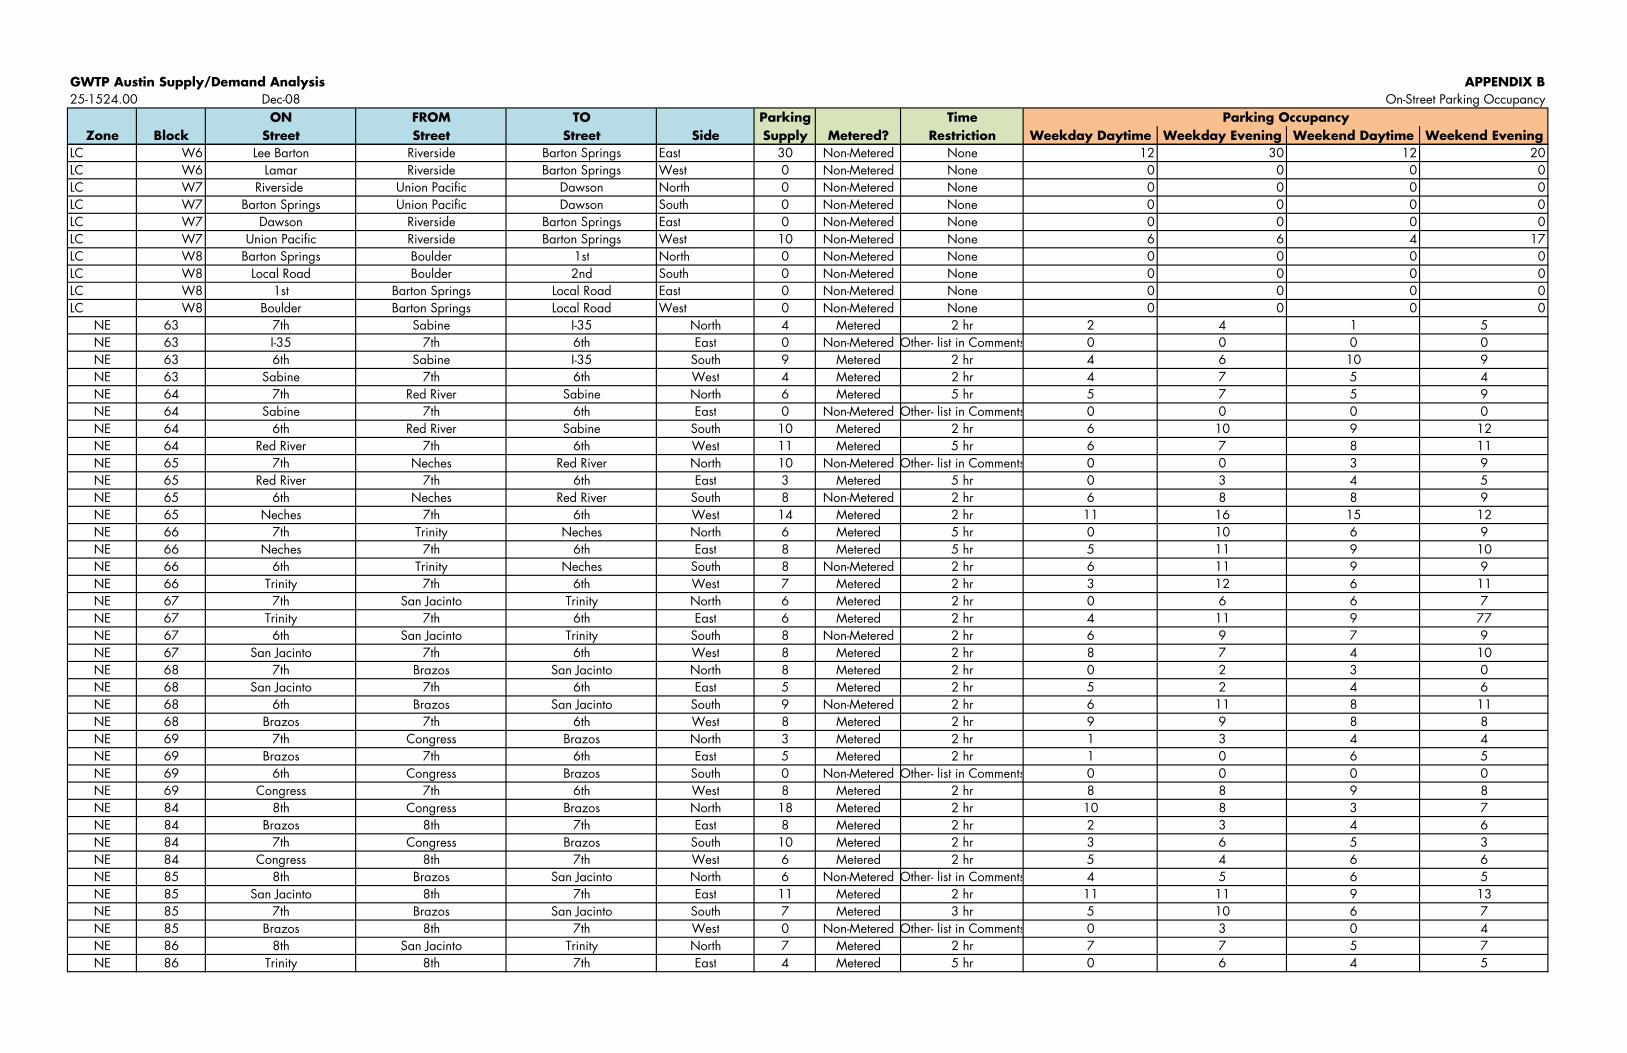
GWTP Austin Supply/Demand Analysis APPENDIX B25-1524.00 Dec-08 On-Street Parking Occupancy
ON FROM TO Parking TimeZone Block Street Street Street Side Supply Metered? Restriction Weekday Daytime Weekday Evening Weekend Daytime Weekend Evening
Parking Occupancy
LC W6 Lee Barton Riverside Barton Springs East 30 Non-Metered None 12 30 12 20LC W6 Lamar Riverside Barton Springs West 0 Non-Metered None 0 0 0 0LC W7 Riverside Union Pacific Dawson North 0 Non-Metered None 0 0 0 0LC W7 Barton Springs Union Pacific Dawson South 0 Non-Metered None 0 0 0 0LC W7 Dawson Riverside Barton Springs East 0 Non-Metered None 0 0 0 0LC W7 Union Pacific Riverside Barton Springs West 10 Non-Metered None 6 6 4 17p gLC W8 Barton Springs Boulder 1st North 0 Non-Metered None 0 0 0 0LC W8 Local Road Boulder 2nd South 0 Non-Metered None 0 0 0 0LC W8 1st Barton Springs Local Road East 0 Non-Metered None 0 0 0 0LC W8 Boulder Barton Springs Local Road West 0 Non-Metered None 0 0 0 0
NE 63 7th Sabine I-35 North 4 Metered 2 hr 2 4 1 5NE 63 I-35 7th 6th East 0 Non-Metered Other- list in Comments 0 0 0 0NE 63 6th Sabine I-35 South 9 Metered 2 hr 4 6 10 9NE 63 Sabine 7th 6th West 4 Metered 2 hr 4 7 5 4NE 64 7th Red River Sabine North 6 Metered 5 hr 5 7 5 9NE 64 Sabine 7th 6th East 0 Non-Metered Other- list in Comments 0 0 0 0NE 64 6th Red River Sabine South 10 Metered 2 hr 6 10 9 12NE 64 Red River 7th 6th West 11 Metered 5 hr 6 7 8 11NE 65 7th Neches Red River North 10 Non-Metered Other- list in Comments 0 0 3 9NE 65 Red River 7th 6th East 3 Metered 5 hr 0 3 4 5N h N h d h N M d hNE 65 6th Neches Red River South 8 Non-Metered 2 hr 6 8 8 9NE 65 Neches 7th 6th West 14 Metered 2 hr 11 16 15 12NE 66 7th Trinity Neches North 6 Metered 5 hr 0 10 6 9NE 66 Neches 7th 6th East 8 Metered 5 hr 5 11 9 10NE 66 6th Trinity Neches South 8 Non-Metered 2 hr 6 11 9 9NE 66 Trinity 7th 6th West 7 Metered 2 hr 3 12 6 11NE 67 7th San Jacinto Trinity North 6 Metered 2 hr 0 6 6 7NE 67 Trinity 7th 6th East 6 Metered 2 hr 4 11 9 77NE 67 6th San Jacinto Trinity South 8 Non-Metered 2 hr 6 9 7 9NE 67 San Jacinto 7th 6th West 8 Metered 2 hr 8 7 4 10NE 68 7th Brazos San Jacinto North 8 Metered 2 hr 0 2 3 0NE 68 San Jacinto 7th 6th East 5 Metered 2 hr 5 2 4 6NE 68 6th Brazos San Jacinto South 9 Non-Metered 2 hr 6 11 8 11NE 68 Brazos 7th 6th West 8 Metered 2 hr 9 9 8 8NE 69 7th Congress Brazos North 3 Metered 2 hr 1 3 4 4NE 69 7th Congress Brazos North 3 Metered 2 hr 1 3 4 4NE 69 Brazos 7th 6th East 5 Metered 2 hr 1 0 6 5NE 69 6th Congress Brazos South 0 Non-Metered Other- list in Comments 0 0 0 0NE 69 Congress 7th 6th West 8 Metered 2 hr 8 8 9 8NE 84 8th Congress Brazos North 18 Metered 2 hr 10 8 3 7NE 84 Brazos 8th 7th East 8 Metered 2 hr 2 3 4 6NE 84 7th Congress Brazos South 10 Metered 2 hr 3 6 5 3NE 84 Congress 8th 7th West 6 Metered 2 hr 5 4 6 6NE 85 8th Brazos San Jacinto North 6 Non-Metered Other- list in Comments 4 5 6 5NE 85 San Jacinto 8th 7th East 11 Metered 2 hr 11 11 9 13NE 85 7th Brazos San Jacinto South 7 Metered 3 hr 5 10 6 7NE 85 Brazos 8th 7th West 0 Non-Metered Other- list in Comments 0 3 0 4NE 86 8th San Jacinto Trinity North 7 Metered 2 hr 7 7 5 7NE 86 Trinity 8th 7th East 4 Metered 5 hr 0 6 4 5
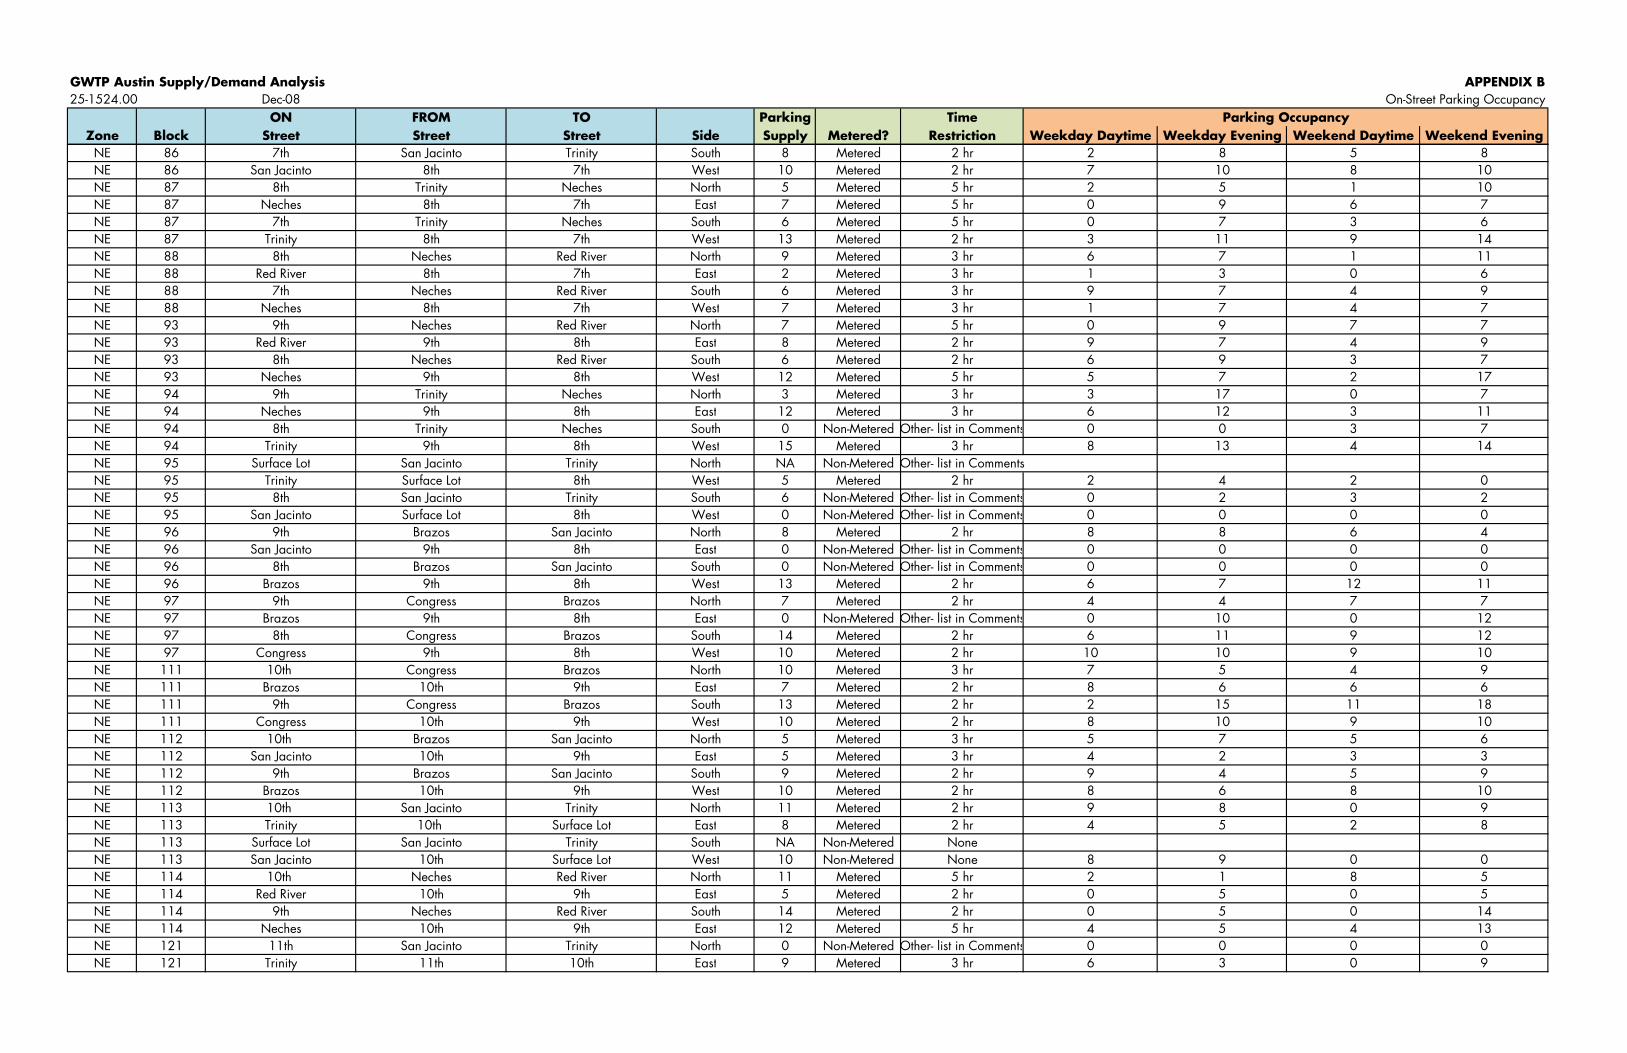
GWTP Austin Supply/Demand Analysis APPENDIX B25-1524.00 Dec-08 On-Street Parking Occupancy
ON FROM TO Parking TimeZone Block Street Street Street Side Supply Metered? Restriction Weekday Daytime Weekday Evening Weekend Daytime Weekend Evening
Parking Occupancy
NE 86 7th San Jacinto Trinity South 8 Metered 2 hr 2 8 5 8NE 86 San Jacinto 8th 7th West 10 Metered 2 hr 7 10 8 10NE 87 8th Trinity Neches North 5 Metered 5 hr 2 5 1 10NE 87 Neches 8th 7th East 7 Metered 5 hr 0 9 6 7NE 87 7th Trinity Neches South 6 Metered 5 hr 0 7 3 6NE 87 Trinity 8th 7th West 13 Metered 2 hr 3 11 9 14yNE 88 8th Neches Red River North 9 Metered 3 hr 6 7 1 11NE 88 Red River 8th 7th East 2 Metered 3 hr 1 3 0 6NE 88 7th Neches Red River South 6 Metered 3 hr 9 7 4 9NE 88 Neches 8th 7th West 7 Metered 3 hr 1 7 4 7NE 93 9th Neches Red River North 7 Metered 5 hr 0 9 7 7NE 93 Red River 9th 8th East 8 Metered 2 hr 9 7 4 9NE 93 8th Neches Red River South 6 Metered 2 hr 6 9 3 7NE 93 Neches 9th 8th West 12 Metered 5 hr 5 7 2 17NE 94 9th Trinity Neches North 3 Metered 3 hr 3 17 0 7NE 94 Neches 9th 8th East 12 Metered 3 hr 6 12 3 11NE 94 8th Trinity Neches South 0 Non-Metered Other- list in Comments 0 0 3 7NE 94 Trinity 9th 8th West 15 Metered 3 hr 8 13 4 14NE 95 Surface Lot San Jacinto Trinity North NA Non-Metered Other- list in CommentsNE 95 Trinity Surface Lot 8th West 5 Metered 2 hr 2 4 2 0N h h N M d h lNE 95 8th San Jacinto Trinity South 6 Non-Metered Other- list in Comments 0 2 3 2NE 95 San Jacinto Surface Lot 8th West 0 Non-Metered Other- list in Comments 0 0 0 0NE 96 9th Brazos San Jacinto North 8 Metered 2 hr 8 8 6 4NE 96 San Jacinto 9th 8th East 0 Non-Metered Other- list in Comments 0 0 0 0NE 96 8th Brazos San Jacinto South 0 Non-Metered Other- list in Comments 0 0 0 0NE 96 Brazos 9th 8th West 13 Metered 2 hr 6 7 12 11NE 97 9th Congress Brazos North 7 Metered 2 hr 4 4 7 7NE 97 Brazos 9th 8th East 0 Non-Metered Other- list in Comments 0 10 0 12NE 97 8th Congress Brazos South 14 Metered 2 hr 6 11 9 12NE 97 Congress 9th 8th West 10 Metered 2 hr 10 10 9 10NE 111 10th Congress Brazos North 10 Metered 3 hr 7 5 4 9NE 111 Brazos 10th 9th East 7 Metered 2 hr 8 6 6 6NE 111 9th Congress Brazos South 13 Metered 2 hr 2 15 11 18NE 111 Congress 10th 9th West 10 Metered 2 hr 8 10 9 10NE 112 10th Brazos San Jacinto North 5 Metered 3 hr 5 7 5 6NE 112 10th Brazos San Jacinto North 5 Metered 3 hr 5 7 5 6NE 112 San Jacinto 10th 9th East 5 Metered 3 hr 4 2 3 3NE 112 9th Brazos San Jacinto South 9 Metered 2 hr 9 4 5 9NE 112 Brazos 10th 9th West 10 Metered 2 hr 8 6 8 10NE 113 10th San Jacinto Trinity North 11 Metered 2 hr 9 8 0 9NE 113 Trinity 10th Surface Lot East 8 Metered 2 hr 4 5 2 8NE 113 Surface Lot San Jacinto Trinity South NA Non-Metered NoneNE 113 San Jacinto 10th Surface Lot West 10 Non-Metered None 8 9 0 0NE 114 10th Neches Red River North 11 Metered 5 hr 2 1 8 5NE 114 Red River 10th 9th East 5 Metered 2 hr 0 5 0 5NE 114 9th Neches Red River South 14 Metered 2 hr 0 5 0 14NE 114 Neches 10th 9th East 12 Metered 5 hr 4 5 4 13NE 121 11th San Jacinto Trinity North 0 Non-Metered Other- list in Comments 0 0 0 0NE 121 Trinity 11th 10th East 9 Metered 3 hr 6 3 0 9
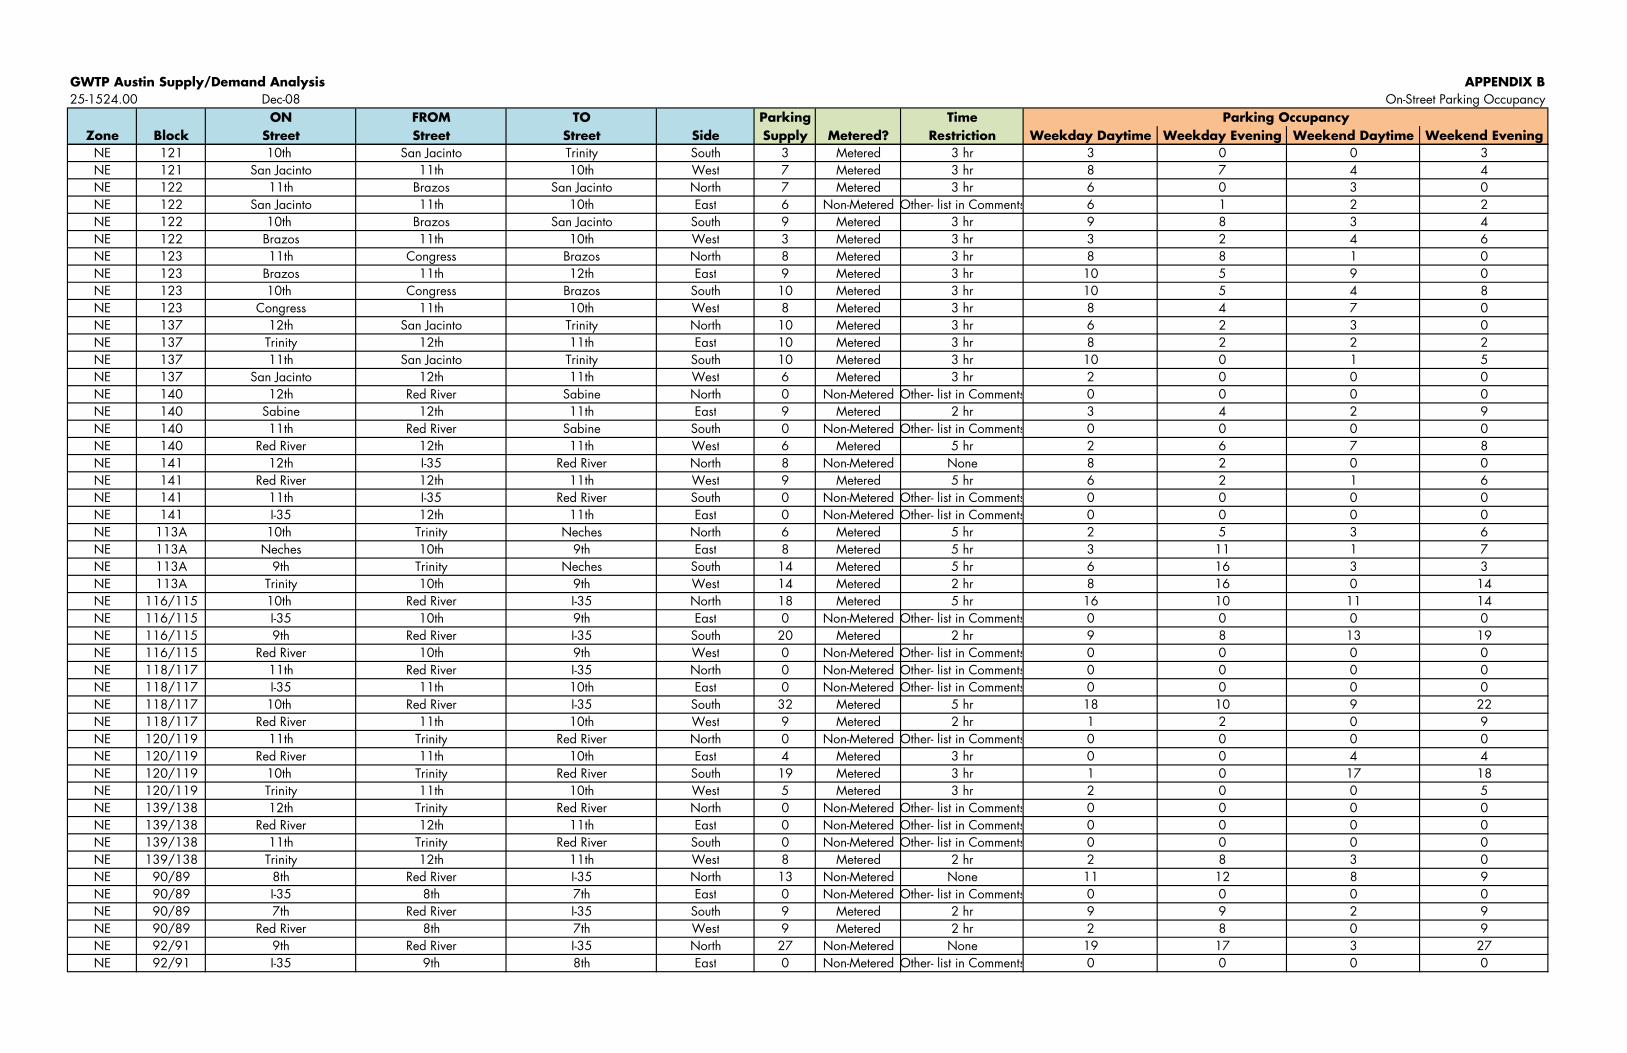
GWTP Austin Supply/Demand Analysis APPENDIX B25-1524.00 Dec-08 On-Street Parking Occupancy
ON FROM TO Parking TimeZone Block Street Street Street Side Supply Metered? Restriction Weekday Daytime Weekday Evening Weekend Daytime Weekend Evening
Parking Occupancy
NE 121 10th San Jacinto Trinity South 3 Metered 3 hr 3 0 0 3NE 121 San Jacinto 11th 10th West 7 Metered 3 hr 8 7 4 4NE 122 11th Brazos San Jacinto North 7 Metered 3 hr 6 0 3 0NE 122 San Jacinto 11th 10th East 6 Non-Metered Other- list in Comments 6 1 2 2NE 122 10th Brazos San Jacinto South 9 Metered 3 hr 9 8 3 4NE 122 Brazos 11th 10th West 3 Metered 3 hr 3 2 4 6NE 123 11th Congress Brazos North 8 Metered 3 hr 8 8 1 0NE 123 Brazos 11th 12th East 9 Metered 3 hr 10 5 9 0NE 123 10th Congress Brazos South 10 Metered 3 hr 10 5 4 8NE 123 Congress 11th 10th West 8 Metered 3 hr 8 4 7 0NE 137 12th San Jacinto Trinity North 10 Metered 3 hr 6 2 3 0NE 137 Trinity 12th 11th East 10 Metered 3 hr 8 2 2 2NE 137 11th San Jacinto Trinity South 10 Metered 3 hr 10 0 1 5NE 137 San Jacinto 12th 11th West 6 Metered 3 hr 2 0 0 0NE 140 12th Red River Sabine North 0 Non-Metered Other- list in Comments 0 0 0 0NE 140 Sabine 12th 11th East 9 Metered 2 hr 3 4 2 9NE 140 11th Red River Sabine South 0 Non-Metered Other- list in Comments 0 0 0 0NE 140 Red River 12th 11th West 6 Metered 5 hr 2 6 7 8NE 141 12th I-35 Red River North 8 Non-Metered None 8 2 0 0NE 141 Red River 12th 11th West 9 Metered 5 hr 6 2 1 6N 4 h d h N M d h lNE 141 11th I-35 Red River South 0 Non-Metered Other- list in Comments 0 0 0 0NE 141 I-35 12th 11th East 0 Non-Metered Other- list in Comments 0 0 0 0NE 113A 10th Trinity Neches North 6 Metered 5 hr 2 5 3 6NE 113A Neches 10th 9th East 8 Metered 5 hr 3 11 1 7NE 113A 9th Trinity Neches South 14 Metered 5 hr 6 16 3 3NE 113A Trinity 10th 9th West 14 Metered 2 hr 8 16 0 14NE 116/115 10th Red River I-35 North 18 Metered 5 hr 16 10 11 14NE 116/115 I-35 10th 9th East 0 Non-Metered Other- list in Comments 0 0 0 0NE 116/115 9th Red River I-35 South 20 Metered 2 hr 9 8 13 19NE 116/115 Red River 10th 9th West 0 Non-Metered Other- list in Comments 0 0 0 0NE 118/117 11th Red River I-35 North 0 Non-Metered Other- list in Comments 0 0 0 0NE 118/117 I-35 11th 10th East 0 Non-Metered Other- list in Comments 0 0 0 0NE 118/117 10th Red River I-35 South 32 Metered 5 hr 18 10 9 22NE 118/117 Red River 11th 10th West 9 Metered 2 hr 1 2 0 9NE 120/119 11th Trinity Red River North 0 Non Metered Other list in Comments 0 0 0 0NE 120/119 11th Trinity Red River North 0 Non-Metered Other- list in Comments 0 0 0 0NE 120/119 Red River 11th 10th East 4 Metered 3 hr 0 0 4 4NE 120/119 10th Trinity Red River South 19 Metered 3 hr 1 0 17 18NE 120/119 Trinity 11th 10th West 5 Metered 3 hr 2 0 0 5NE 139/138 12th Trinity Red River North 0 Non-Metered Other- list in Comments 0 0 0 0NE 139/138 Red River 12th 11th East 0 Non-Metered Other- list in Comments 0 0 0 0NE 139/138 11th Trinity Red River South 0 Non-Metered Other- list in Comments 0 0 0 0NE 139/138 Trinity 12th 11th West 8 Metered 2 hr 2 8 3 0NE 90/89 8th Red River I-35 North 13 Non-Metered None 11 12 8 9NE 90/89 I-35 8th 7th East 0 Non-Metered Other- list in Comments 0 0 0 0NE 90/89 7th Red River I-35 South 9 Metered 2 hr 9 9 2 9NE 90/89 Red River 8th 7th West 9 Metered 2 hr 2 8 0 9NE 92/91 9th Red River I-35 North 27 Non-Metered None 19 17 3 27NE 92/91 I-35 9th 8th East 0 Non-Metered Other- list in Comments 0 0 0 0
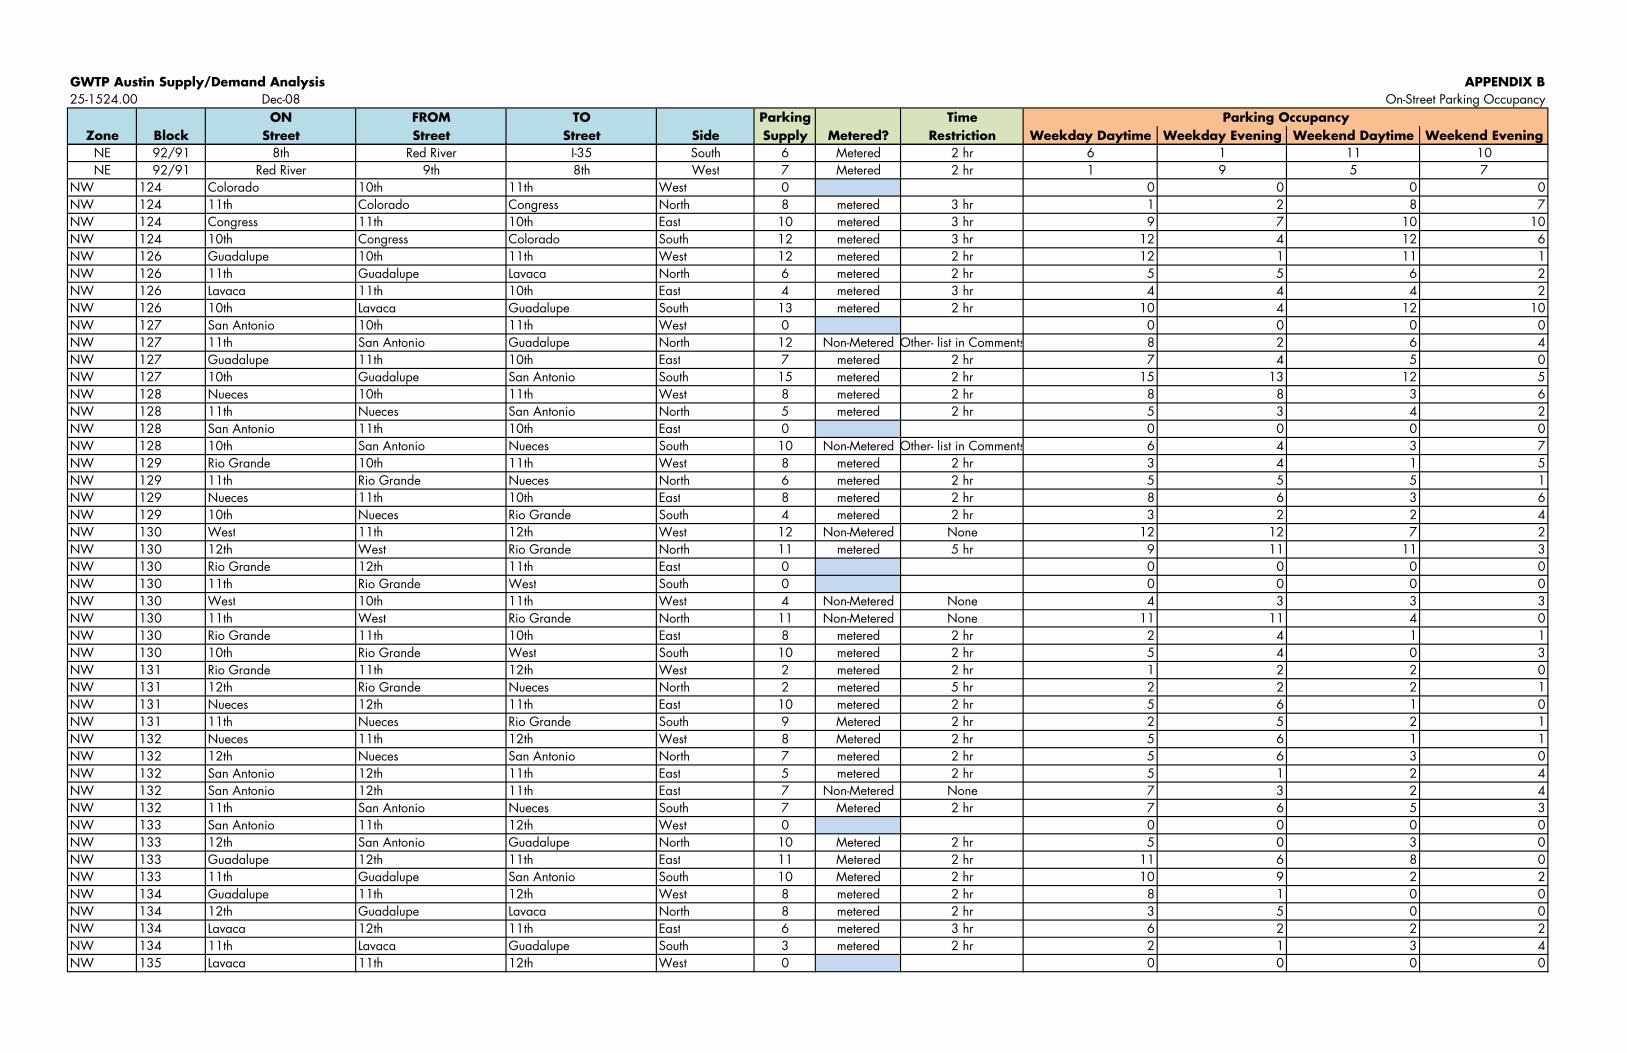
GWTP Austin Supply/Demand Analysis APPENDIX B25-1524.00 Dec-08 On-Street Parking Occupancy
ON FROM TO Parking TimeZone Block Street Street Street Side Supply Metered? Restriction Weekday Daytime Weekday Evening Weekend Daytime Weekend Evening
Parking Occupancy
NE 92/91 8th Red River I-35 South 6 Metered 2 hr 6 1 11 10NE 92/91 Red River 9th 8th West 7 Metered 2 hr 1 9 5 7
NW 124 Colorado 10th 11th West 0 0 0 0 0NW 124 11th Colorado Congress North 8 metered 3 hr 1 2 8 7NW 124 Congress 11th 10th East 10 metered 3 hr 9 7 10 10NW 124 10th Congress Colorado South 12 metered 3 hr 12 4 12 6gNW 126 Guadalupe 10th 11th West 12 metered 2 hr 12 1 11 1NW 126 11th Guadalupe Lavaca North 6 metered 2 hr 5 5 6 2NW 126 Lavaca 11th 10th East 4 metered 3 hr 4 4 4 2NW 126 10th Lavaca Guadalupe South 13 metered 2 hr 10 4 12 10NW 127 San Antonio 10th 11th West 0 0 0 0 0NW 127 11th San Antonio Guadalupe North 12 Non-Metered Other- list in Comments 8 2 6 4NW 127 Guadalupe 11th 10th East 7 metered 2 hr 7 4 5 0NW 127 10th Guadalupe San Antonio South 15 metered 2 hr 15 13 12 5NW 128 Nueces 10th 11th West 8 metered 2 hr 8 8 3 6NW 128 11th Nueces San Antonio North 5 metered 2 hr 5 3 4 2NW 128 San Antonio 11th 10th East 0 0 0 0 0NW 128 10th San Antonio Nueces South 10 Non-Metered Other- list in Comments 6 4 3 7NW 129 Rio Grande 10th 11th West 8 metered 2 hr 3 4 1 5NW 129 11th Rio Grande Nueces North 6 metered 2 hr 5 5 5 1NW N h h d hNW 129 Nueces 11th 10th East 8 metered 2 hr 8 6 3 6NW 129 10th Nueces Rio Grande South 4 metered 2 hr 3 2 2 4NW 130 West 11th 12th West 12 Non-Metered None 12 12 7 2NW 130 12th West Rio Grande North 11 metered 5 hr 9 11 11 3NW 130 Rio Grande 12th 11th East 0 0 0 0 0NW 130 11th Rio Grande West South 0 0 0 0 0NW 130 West 10th 11th West 4 Non-Metered None 4 3 3 3NW 130 11th West Rio Grande North 11 Non-Metered None 11 11 4 0NW 130 Rio Grande 11th 10th East 8 metered 2 hr 2 4 1 1NW 130 10th Rio Grande West South 10 metered 2 hr 5 4 0 3NW 131 Rio Grande 11th 12th West 2 metered 2 hr 1 2 2 0NW 131 12th Rio Grande Nueces North 2 metered 5 hr 2 2 2 1NW 131 Nueces 12th 11th East 10 metered 2 hr 5 6 1 0NW 131 11th Nueces Rio Grande South 9 Metered 2 hr 2 5 2 1NW 132 Nueces 11th 12th West 8 Metered 2 hr 5 6 1 1NW 132 Nueces 11th 12th West 8 Metered 2 hr 5 6 1 1NW 132 12th Nueces San Antonio North 7 metered 2 hr 5 6 3 0NW 132 San Antonio 12th 11th East 5 metered 2 hr 5 1 2 4NW 132 San Antonio 12th 11th East 7 Non-Metered None 7 3 2 4NW 132 11th San Antonio Nueces South 7 Metered 2 hr 7 6 5 3NW 133 San Antonio 11th 12th West 0 0 0 0 0NW 133 12th San Antonio Guadalupe North 10 Metered 2 hr 5 0 3 0NW 133 Guadalupe 12th 11th East 11 Metered 2 hr 11 6 8 0NW 133 11th Guadalupe San Antonio South 10 Metered 2 hr 10 9 2 2NW 134 Guadalupe 11th 12th West 8 metered 2 hr 8 1 0 0NW 134 12th Guadalupe Lavaca North 8 metered 2 hr 3 5 0 0NW 134 Lavaca 12th 11th East 6 metered 3 hr 6 2 2 2NW 134 11th Lavaca Guadalupe South 3 metered 2 hr 2 1 3 4NW 135 Lavaca 11th 12th West 0 0 0 0 0
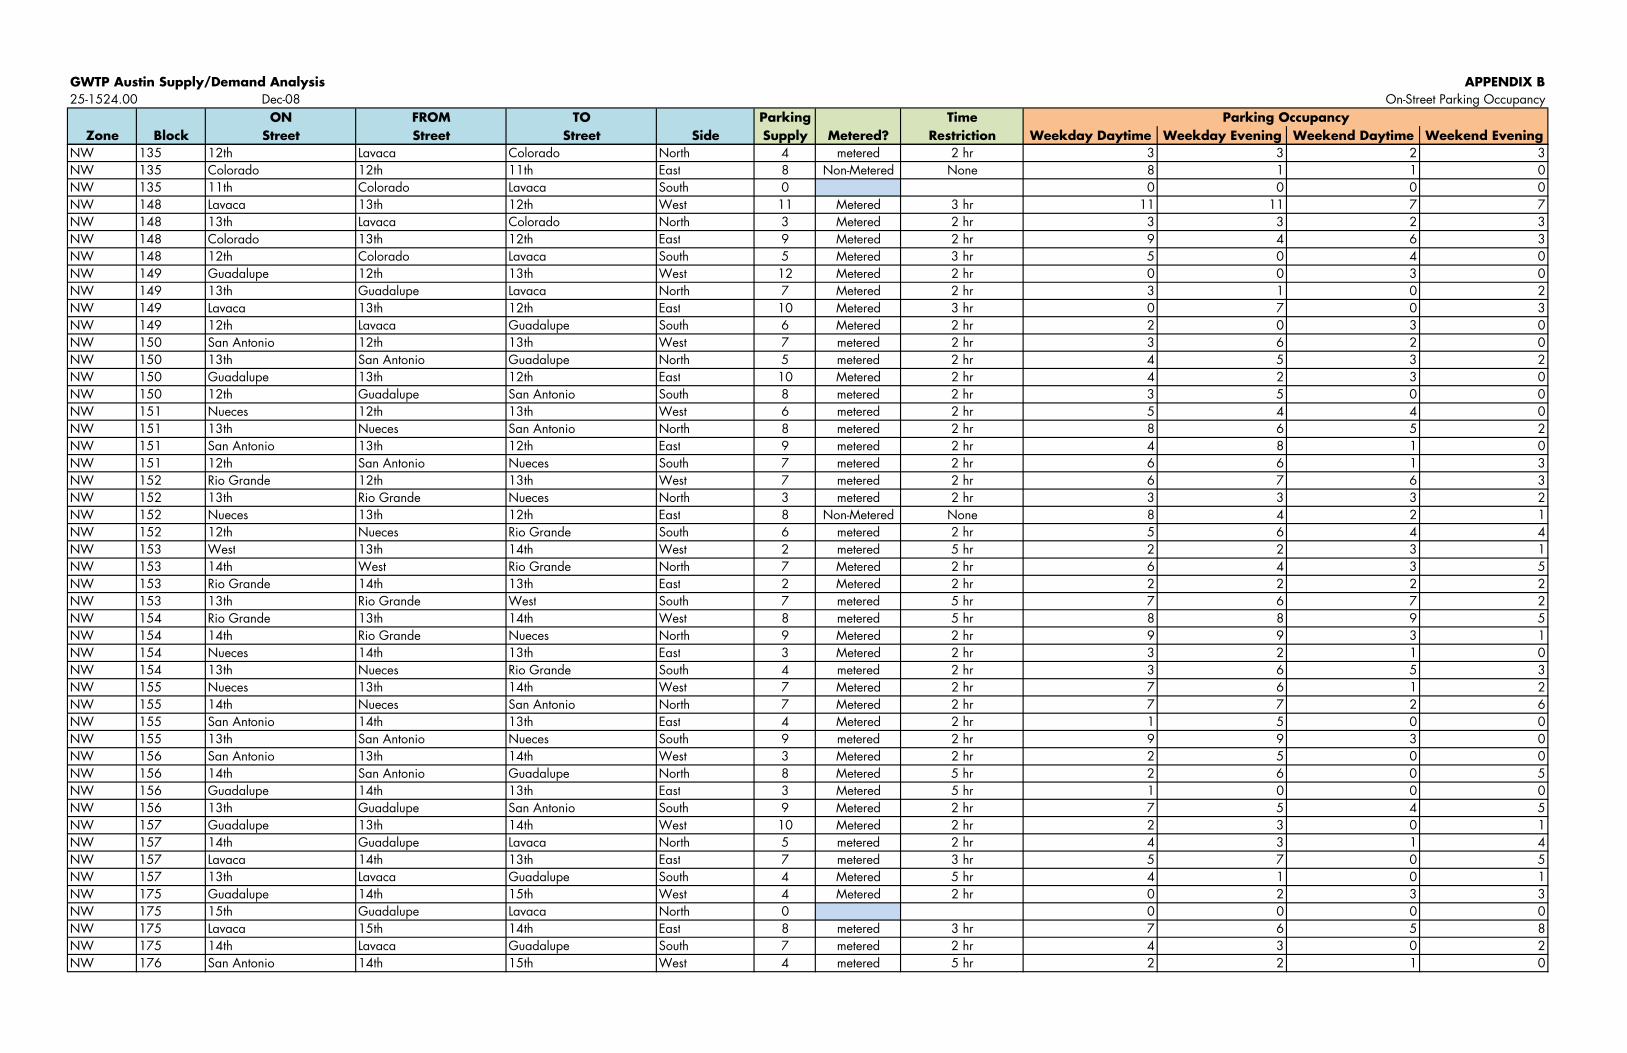
GWTP Austin Supply/Demand Analysis APPENDIX B25-1524.00 Dec-08 On-Street Parking Occupancy
ON FROM TO Parking TimeZone Block Street Street Street Side Supply Metered? Restriction Weekday Daytime Weekday Evening Weekend Daytime Weekend Evening
Parking Occupancy
NW 135 12th Lavaca Colorado North 4 metered 2 hr 3 3 2 3NW 135 Colorado 12th 11th East 8 Non-Metered None 8 1 1 0NW 135 11th Colorado Lavaca South 0 0 0 0 0NW 148 Lavaca 13th 12th West 11 Metered 3 hr 11 11 7 7NW 148 13th Lavaca Colorado North 3 Metered 2 hr 3 3 2 3NW 148 Colorado 13th 12th East 9 Metered 2 hr 9 4 6 3NW 148 12th Colorado Lavaca South 5 Metered 3 hr 5 0 4 0NW 149 Guadalupe 12th 13th West 12 Metered 2 hr 0 0 3 0NW 149 13th Guadalupe Lavaca North 7 Metered 2 hr 3 1 0 2NW 149 Lavaca 13th 12th East 10 Metered 3 hr 0 7 0 3NW 149 12th Lavaca Guadalupe South 6 Metered 2 hr 2 0 3 0NW 150 San Antonio 12th 13th West 7 metered 2 hr 3 6 2 0NW 150 13th San Antonio Guadalupe North 5 metered 2 hr 4 5 3 2NW 150 Guadalupe 13th 12th East 10 Metered 2 hr 4 2 3 0NW 150 12th Guadalupe San Antonio South 8 metered 2 hr 3 5 0 0NW 151 Nueces 12th 13th West 6 metered 2 hr 5 4 4 0NW 151 13th Nueces San Antonio North 8 metered 2 hr 8 6 5 2NW 151 San Antonio 13th 12th East 9 metered 2 hr 4 8 1 0NW 151 12th San Antonio Nueces South 7 metered 2 hr 6 6 1 3NW 152 Rio Grande 12th 13th West 7 metered 2 hr 6 7 6 3NW h d N N h d hNW 152 13th Rio Grande Nueces North 3 metered 2 hr 3 3 3 2NW 152 Nueces 13th 12th East 8 Non-Metered None 8 4 2 1NW 152 12th Nueces Rio Grande South 6 metered 2 hr 5 6 4 4NW 153 West 13th 14th West 2 metered 5 hr 2 2 3 1NW 153 14th West Rio Grande North 7 Metered 2 hr 6 4 3 5NW 153 Rio Grande 14th 13th East 2 Metered 2 hr 2 2 2 2NW 153 13th Rio Grande West South 7 metered 5 hr 7 6 7 2NW 154 Rio Grande 13th 14th West 8 metered 5 hr 8 8 9 5NW 154 14th Rio Grande Nueces North 9 Metered 2 hr 9 9 3 1NW 154 Nueces 14th 13th East 3 Metered 2 hr 3 2 1 0NW 154 13th Nueces Rio Grande South 4 metered 2 hr 3 6 5 3NW 155 Nueces 13th 14th West 7 Metered 2 hr 7 6 1 2NW 155 14th Nueces San Antonio North 7 Metered 2 hr 7 7 2 6NW 155 San Antonio 14th 13th East 4 Metered 2 hr 1 5 0 0NW 155 13th San Antonio Nueces South 9 metered 2 hr 9 9 3 0NW 155 13th San Antonio Nueces South 9 metered 2 hr 9 9 3 0NW 156 San Antonio 13th 14th West 3 Metered 2 hr 2 5 0 0NW 156 14th San Antonio Guadalupe North 8 Metered 5 hr 2 6 0 5NW 156 Guadalupe 14th 13th East 3 Metered 5 hr 1 0 0 0NW 156 13th Guadalupe San Antonio South 9 Metered 2 hr 7 5 4 5NW 157 Guadalupe 13th 14th West 10 Metered 2 hr 2 3 0 1NW 157 14th Guadalupe Lavaca North 5 metered 2 hr 4 3 1 4NW 157 Lavaca 14th 13th East 7 metered 3 hr 5 7 0 5NW 157 13th Lavaca Guadalupe South 4 Metered 5 hr 4 1 0 1NW 175 Guadalupe 14th 15th West 4 Metered 2 hr 0 2 3 3NW 175 15th Guadalupe Lavaca North 0 0 0 0 0NW 175 Lavaca 15th 14th East 8 metered 3 hr 7 6 5 8NW 175 14th Lavaca Guadalupe South 7 metered 2 hr 4 3 0 2NW 176 San Antonio 14th 15th West 4 metered 5 hr 2 2 1 0
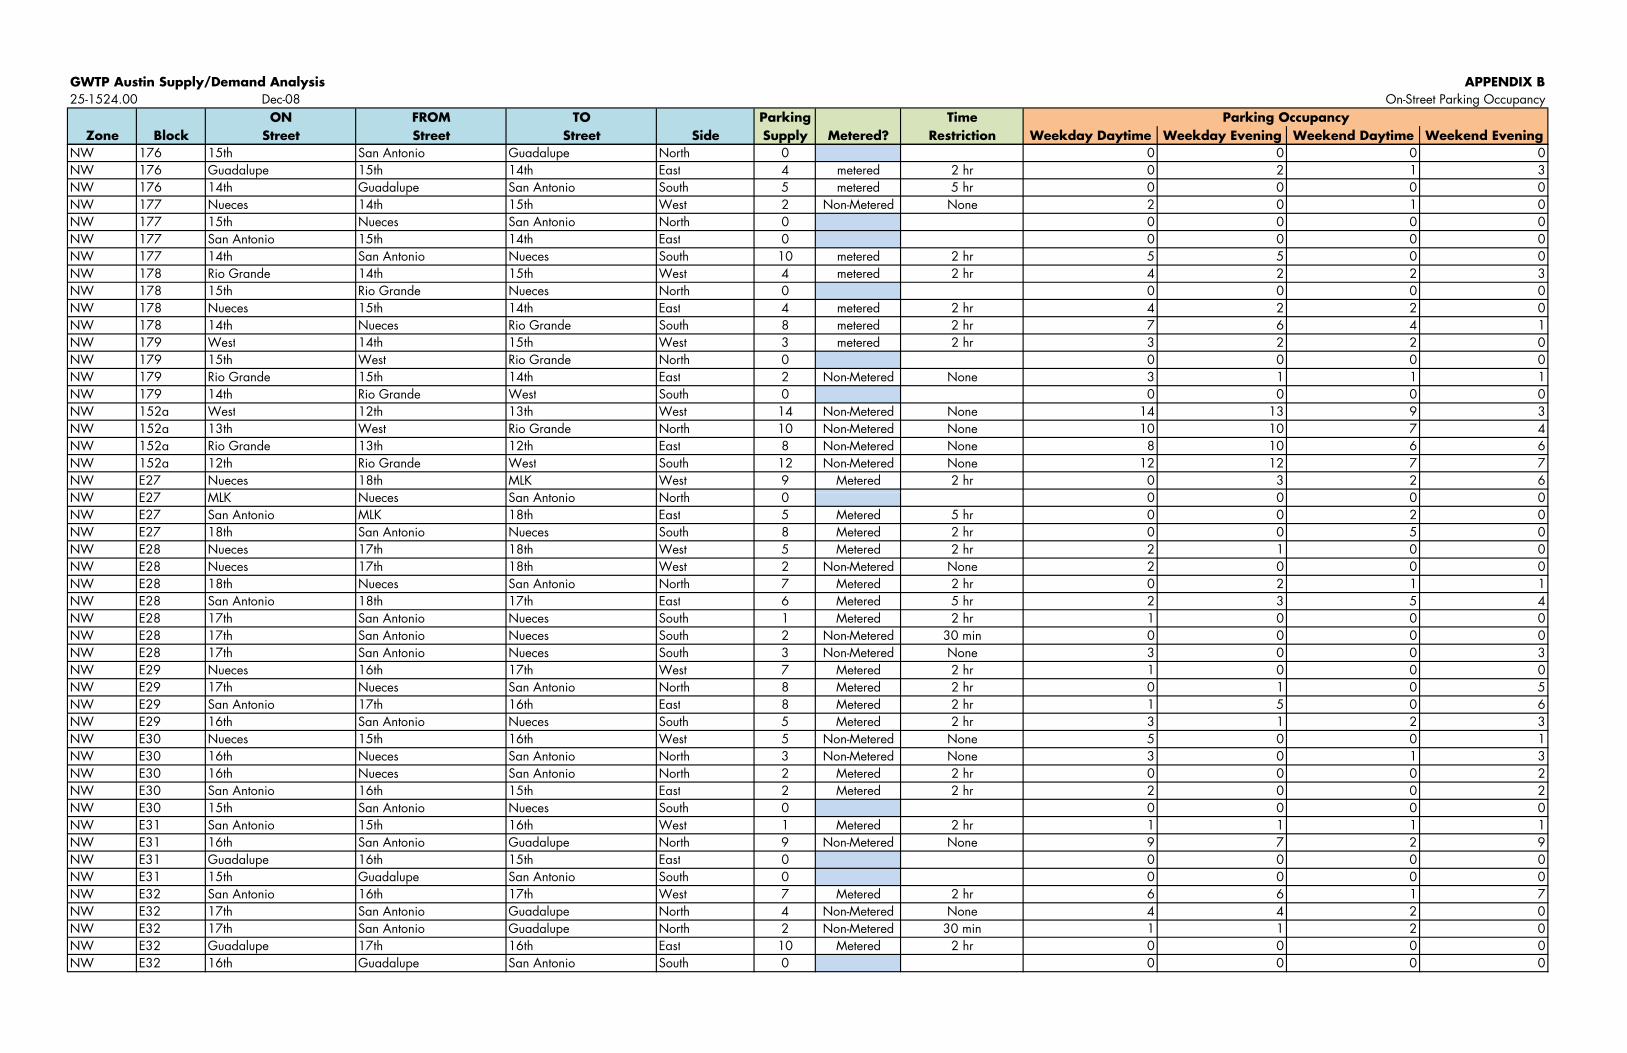
GWTP Austin Supply/Demand Analysis APPENDIX B25-1524.00 Dec-08 On-Street Parking Occupancy
ON FROM TO Parking TimeZone Block Street Street Street Side Supply Metered? Restriction Weekday Daytime Weekday Evening Weekend Daytime Weekend Evening
Parking Occupancy
NW 176 15th San Antonio Guadalupe North 0 0 0 0 0NW 176 Guadalupe 15th 14th East 4 metered 2 hr 0 2 1 3NW 176 14th Guadalupe San Antonio South 5 metered 5 hr 0 0 0 0NW 177 Nueces 14th 15th West 2 Non-Metered None 2 0 1 0NW 177 15th Nueces San Antonio North 0 0 0 0 0NW 177 San Antonio 15th 14th East 0 0 0 0 0NW 177 14th San Antonio Nueces South 10 metered 2 hr 5 5 0 0NW 178 Rio Grande 14th 15th West 4 metered 2 hr 4 2 2 3NW 178 15th Rio Grande Nueces North 0 0 0 0 0NW 178 Nueces 15th 14th East 4 metered 2 hr 4 2 2 0NW 178 14th Nueces Rio Grande South 8 metered 2 hr 7 6 4 1NW 179 West 14th 15th West 3 metered 2 hr 3 2 2 0NW 179 15th West Rio Grande North 0 0 0 0 0NW 179 Rio Grande 15th 14th East 2 Non-Metered None 3 1 1 1NW 179 14th Rio Grande West South 0 0 0 0 0NW 152a West 12th 13th West 14 Non-Metered None 14 13 9 3NW 152a 13th West Rio Grande North 10 Non-Metered None 10 10 7 4NW 152a Rio Grande 13th 12th East 8 Non-Metered None 8 10 6 6NW 152a 12th Rio Grande West South 12 Non-Metered None 12 12 7 7NW E27 Nueces 18th MLK West 9 Metered 2 hr 0 3 2 6NW M N A N hNW E27 MLK Nueces San Antonio North 0 0 0 0 0NW E27 San Antonio MLK 18th East 5 Metered 5 hr 0 0 2 0NW E27 18th San Antonio Nueces South 8 Metered 2 hr 0 0 5 0NW E28 Nueces 17th 18th West 5 Metered 2 hr 2 1 0 0NW E28 Nueces 17th 18th West 2 Non-Metered None 2 0 0 0NW E28 18th Nueces San Antonio North 7 Metered 2 hr 0 2 1 1NW E28 San Antonio 18th 17th East 6 Metered 5 hr 2 3 5 4NW E28 17th San Antonio Nueces South 1 Metered 2 hr 1 0 0 0NW E28 17th San Antonio Nueces South 2 Non-Metered 30 min 0 0 0 0NW E28 17th San Antonio Nueces South 3 Non-Metered None 3 0 0 3NW E29 Nueces 16th 17th West 7 Metered 2 hr 1 0 0 0NW E29 17th Nueces San Antonio North 8 Metered 2 hr 0 1 0 5NW E29 San Antonio 17th 16th East 8 Metered 2 hr 1 5 0 6NW E29 16th San Antonio Nueces South 5 Metered 2 hr 3 1 2 3NW E30 Nueces 15th 16th West 5 Non Metered None 5 0 0 1NW E30 Nueces 15th 16th West 5 Non-Metered None 5 0 0 1NW E30 16th Nueces San Antonio North 3 Non-Metered None 3 0 1 3NW E30 16th Nueces San Antonio North 2 Metered 2 hr 0 0 0 2NW E30 San Antonio 16th 15th East 2 Metered 2 hr 2 0 0 2NW E30 15th San Antonio Nueces South 0 0 0 0 0NW E31 San Antonio 15th 16th West 1 Metered 2 hr 1 1 1 1NW E31 16th San Antonio Guadalupe North 9 Non-Metered None 9 7 2 9NW E31 Guadalupe 16th 15th East 0 0 0 0 0NW E31 15th Guadalupe San Antonio South 0 0 0 0 0NW E32 San Antonio 16th 17th West 7 Metered 2 hr 6 6 1 7NW E32 17th San Antonio Guadalupe North 4 Non-Metered None 4 4 2 0NW E32 17th San Antonio Guadalupe North 2 Non-Metered 30 min 1 1 2 0NW E32 Guadalupe 17th 16th East 10 Metered 2 hr 0 0 0 0NW E32 16th Guadalupe San Antonio South 0 0 0 0 0
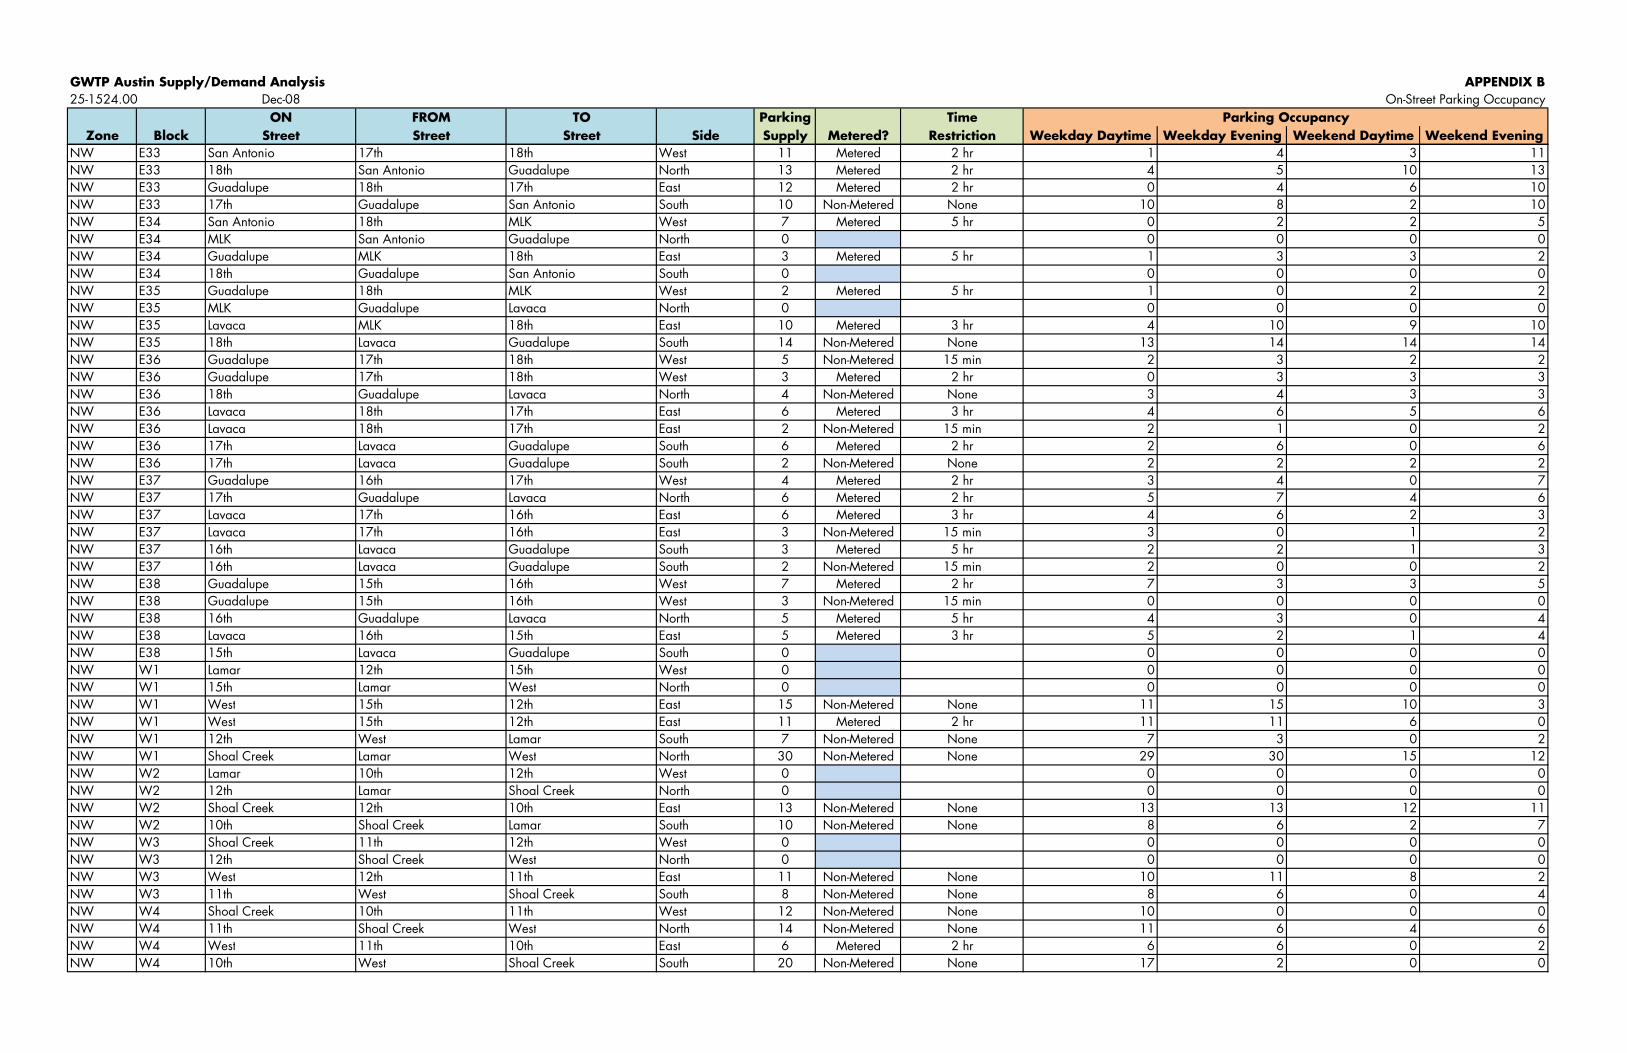
GWTP Austin Supply/Demand Analysis APPENDIX B25-1524.00 Dec-08 On-Street Parking Occupancy
ON FROM TO Parking TimeZone Block Street Street Street Side Supply Metered? Restriction Weekday Daytime Weekday Evening Weekend Daytime Weekend Evening
Parking Occupancy
NW E33 San Antonio 17th 18th West 11 Metered 2 hr 1 4 3 11NW E33 18th San Antonio Guadalupe North 13 Metered 2 hr 4 5 10 13NW E33 Guadalupe 18th 17th East 12 Metered 2 hr 0 4 6 10NW E33 17th Guadalupe San Antonio South 10 Non-Metered None 10 8 2 10NW E34 San Antonio 18th MLK West 7 Metered 5 hr 0 2 2 5NW E34 MLK San Antonio Guadalupe North 0 0 0 0 0pNW E34 Guadalupe MLK 18th East 3 Metered 5 hr 1 3 3 2NW E34 18th Guadalupe San Antonio South 0 0 0 0 0NW E35 Guadalupe 18th MLK West 2 Metered 5 hr 1 0 2 2NW E35 MLK Guadalupe Lavaca North 0 0 0 0 0NW E35 Lavaca MLK 18th East 10 Metered 3 hr 4 10 9 10NW E35 18th Lavaca Guadalupe South 14 Non-Metered None 13 14 14 14NW E36 Guadalupe 17th 18th West 5 Non-Metered 15 min 2 3 2 2NW E36 Guadalupe 17th 18th West 3 Metered 2 hr 0 3 3 3NW E36 18th Guadalupe Lavaca North 4 Non-Metered None 3 4 3 3NW E36 Lavaca 18th 17th East 6 Metered 3 hr 4 6 5 6NW E36 Lavaca 18th 17th East 2 Non-Metered 15 min 2 1 0 2NW E36 17th Lavaca Guadalupe South 6 Metered 2 hr 2 6 0 6NW E36 17th Lavaca Guadalupe South 2 Non-Metered None 2 2 2 2NW E37 Guadalupe 16th 17th West 4 Metered 2 hr 3 4 0 7NW h d l N h M d h 4NW E37 17th Guadalupe Lavaca North 6 Metered 2 hr 5 7 4 6NW E37 Lavaca 17th 16th East 6 Metered 3 hr 4 6 2 3NW E37 Lavaca 17th 16th East 3 Non-Metered 15 min 3 0 1 2NW E37 16th Lavaca Guadalupe South 3 Metered 5 hr 2 2 1 3NW E37 16th Lavaca Guadalupe South 2 Non-Metered 15 min 2 0 0 2NW E38 Guadalupe 15th 16th West 7 Metered 2 hr 7 3 3 5NW E38 Guadalupe 15th 16th West 3 Non-Metered 15 min 0 0 0 0NW E38 16th Guadalupe Lavaca North 5 Metered 5 hr 4 3 0 4NW E38 Lavaca 16th 15th East 5 Metered 3 hr 5 2 1 4NW E38 15th Lavaca Guadalupe South 0 0 0 0 0NW W1 Lamar 12th 15th West 0 0 0 0 0NW W1 15th Lamar West North 0 0 0 0 0NW W1 West 15th 12th East 15 Non-Metered None 11 15 10 3NW W1 West 15th 12th East 11 Metered 2 hr 11 11 6 0NW W1 12th West Lamar South 7 Non Metered None 7 3 0 2NW W1 12th West Lamar South 7 Non-Metered None 7 3 0 2NW W1 Shoal Creek Lamar West North 30 Non-Metered None 29 30 15 12NW W2 Lamar 10th 12th West 0 0 0 0 0NW W2 12th Lamar Shoal Creek North 0 0 0 0 0NW W2 Shoal Creek 12th 10th East 13 Non-Metered None 13 13 12 11NW W2 10th Shoal Creek Lamar South 10 Non-Metered None 8 6 2 7NW W3 Shoal Creek 11th 12th West 0 0 0 0 0NW W3 12th Shoal Creek West North 0 0 0 0 0NW W3 West 12th 11th East 11 Non-Metered None 10 11 8 2NW W3 11th West Shoal Creek South 8 Non-Metered None 8 6 0 4NW W4 Shoal Creek 10th 11th West 12 Non-Metered None 10 0 0 0NW W4 11th Shoal Creek West North 14 Non-Metered None 11 6 4 6NW W4 West 11th 10th East 6 Metered 2 hr 6 6 0 2NW W4 10th West Shoal Creek South 20 Non-Metered None 17 2 0 0
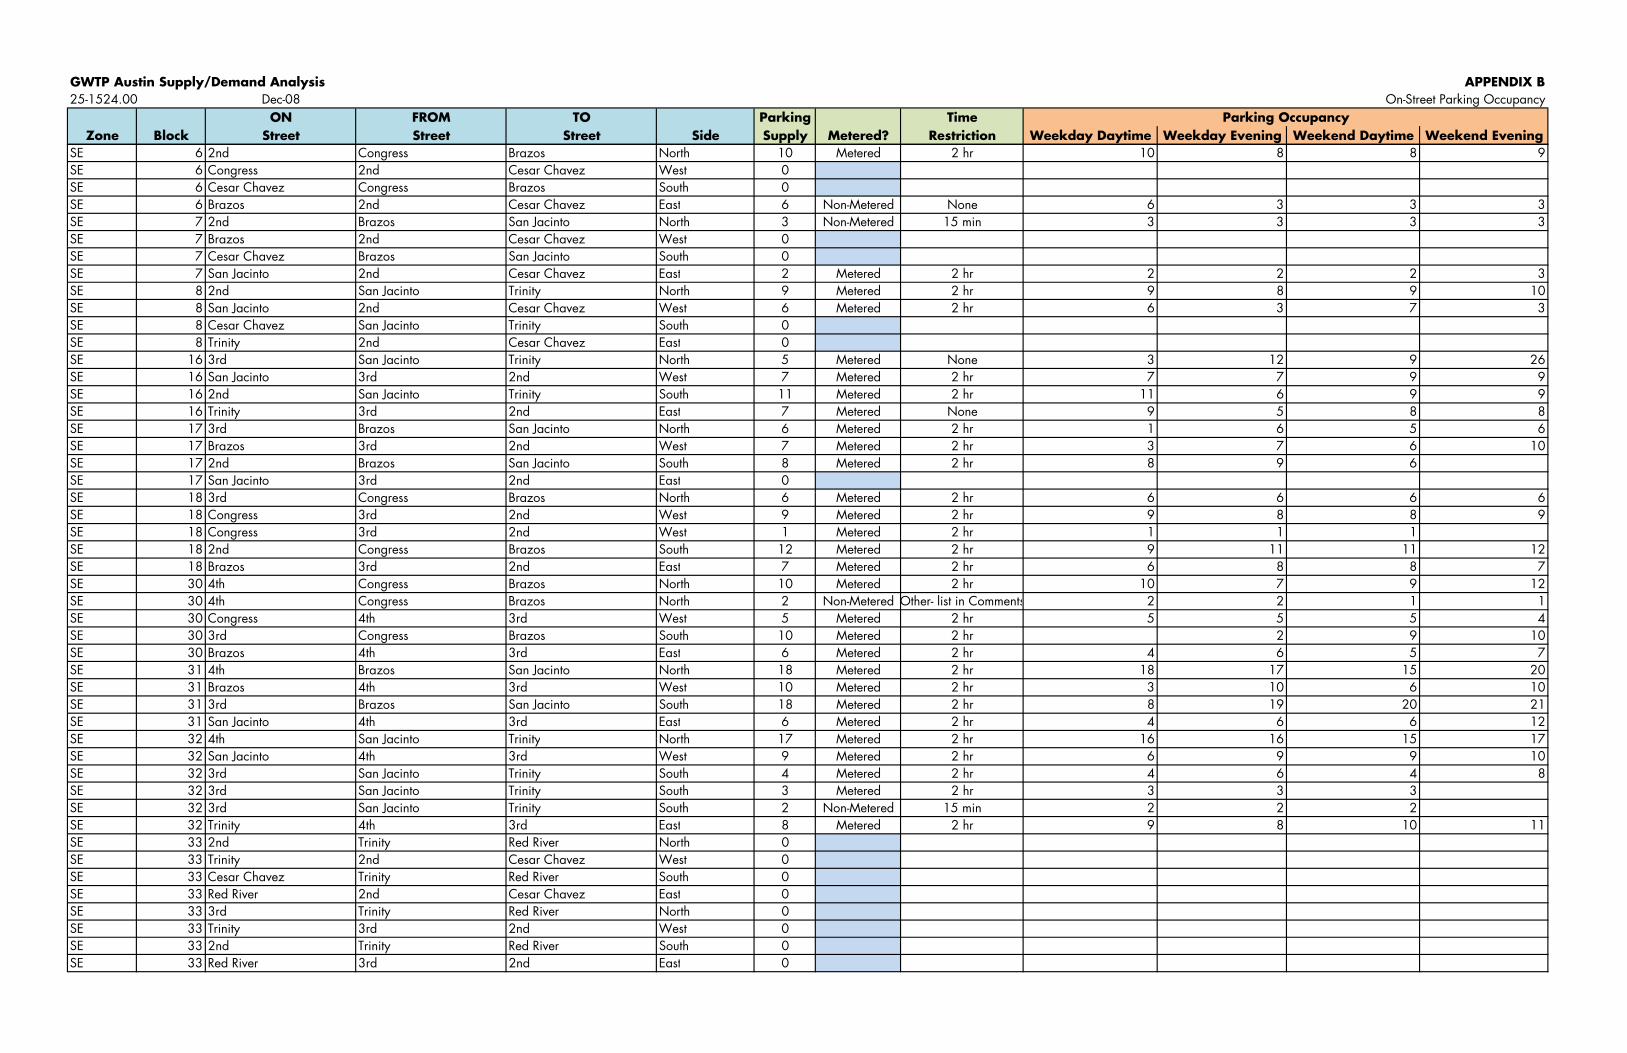
GWTP Austin Supply/Demand Analysis APPENDIX B25-1524.00 Dec-08 On-Street Parking Occupancy
ON FROM TO Parking TimeZone Block Street Street Street Side Supply Metered? Restriction Weekday Daytime Weekday Evening Weekend Daytime Weekend Evening
Parking Occupancy
SE 6 2nd Congress Brazos North 10 Metered 2 hr 10 8 8 9SE 6 Congress 2nd Cesar Chavez West 0SE 6 Cesar Chavez Congress Brazos South 0SE 6 Brazos 2nd Cesar Chavez East 6 Non-Metered None 6 3 3 3SE 7 2nd Brazos San Jacinto North 3 Non-Metered 15 min 3 3 3 3SE 7 Brazos 2nd Cesar Chavez West 0SE 7 Cesar Chavez Brazos San Jacinto South 0SE 7 San Jacinto 2nd Cesar Chavez East 2 Metered 2 hr 2 2 2 3SE 8 2nd San Jacinto Trinity North 9 Metered 2 hr 9 8 9 10SE 8 San Jacinto 2nd Cesar Chavez West 6 Metered 2 hr 6 3 7 3SE 8 Cesar Chavez San Jacinto Trinity South 0SE 8 Trinity 2nd Cesar Chavez East 0SE 16 3rd San Jacinto Trinity North 5 Metered None 3 12 9 26SE 16 San Jacinto 3rd 2nd West 7 Metered 2 hr 7 7 9 9SE 16 2nd San Jacinto Trinity South 11 Metered 2 hr 11 6 9 9SE 16 Trinity 3rd 2nd East 7 Metered None 9 5 8 8SE 17 3rd Brazos San Jacinto North 6 Metered 2 hr 1 6 5 6SE 17 Brazos 3rd 2nd West 7 Metered 2 hr 3 7 6 10SE 17 2nd Brazos San Jacinto South 8 Metered 2 hr 8 9 6SE 17 San Jacinto 3rd 2nd East 0
d N h M d hSE 18 3rd Congress Brazos North 6 Metered 2 hr 6 6 6 6SE 18 Congress 3rd 2nd West 9 Metered 2 hr 9 8 8 9SE 18 Congress 3rd 2nd West 1 Metered 2 hr 1 1 1SE 18 2nd Congress Brazos South 12 Metered 2 hr 9 11 11 12SE 18 Brazos 3rd 2nd East 7 Metered 2 hr 6 8 8 7SE 30 4th Congress Brazos North 10 Metered 2 hr 10 7 9 12SE 30 4th Congress Brazos North 2 Non-Metered Other- list in Comments 2 2 1 1SE 30 Congress 4th 3rd West 5 Metered 2 hr 5 5 5 4SE 30 3rd Congress Brazos South 10 Metered 2 hr 2 9 10SE 30 Brazos 4th 3rd East 6 Metered 2 hr 4 6 5 7SE 31 4th Brazos San Jacinto North 18 Metered 2 hr 18 17 15 20SE 31 Brazos 4th 3rd West 10 Metered 2 hr 3 10 6 10SE 31 3rd Brazos San Jacinto South 18 Metered 2 hr 8 19 20 21SE 31 San Jacinto 4th 3rd East 6 Metered 2 hr 4 6 6 12SE 32 4th San Jacinto Trinity North 17 Metered 2 hr 16 16 15 17SE 32 4th San Jacinto Trinity North 17 Metered 2 hr 16 16 15 17SE 32 San Jacinto 4th 3rd West 9 Metered 2 hr 6 9 9 10SE 32 3rd San Jacinto Trinity South 4 Metered 2 hr 4 6 4 8SE 32 3rd San Jacinto Trinity South 3 Metered 2 hr 3 3 3SE 32 3rd San Jacinto Trinity South 2 Non-Metered 15 min 2 2 2SE 32 Trinity 4th 3rd East 8 Metered 2 hr 9 8 10 11SE 33 2nd Trinity Red River North 0SE 33 Trinity 2nd Cesar Chavez West 0SE 33 Cesar Chavez Trinity Red River South 0SE 33 Red River 2nd Cesar Chavez East 0SE 33 3rd Trinity Red River North 0SE 33 Trinity 3rd 2nd West 0SE 33 2nd Trinity Red River South 0SE 33 Red River 3rd 2nd East 0
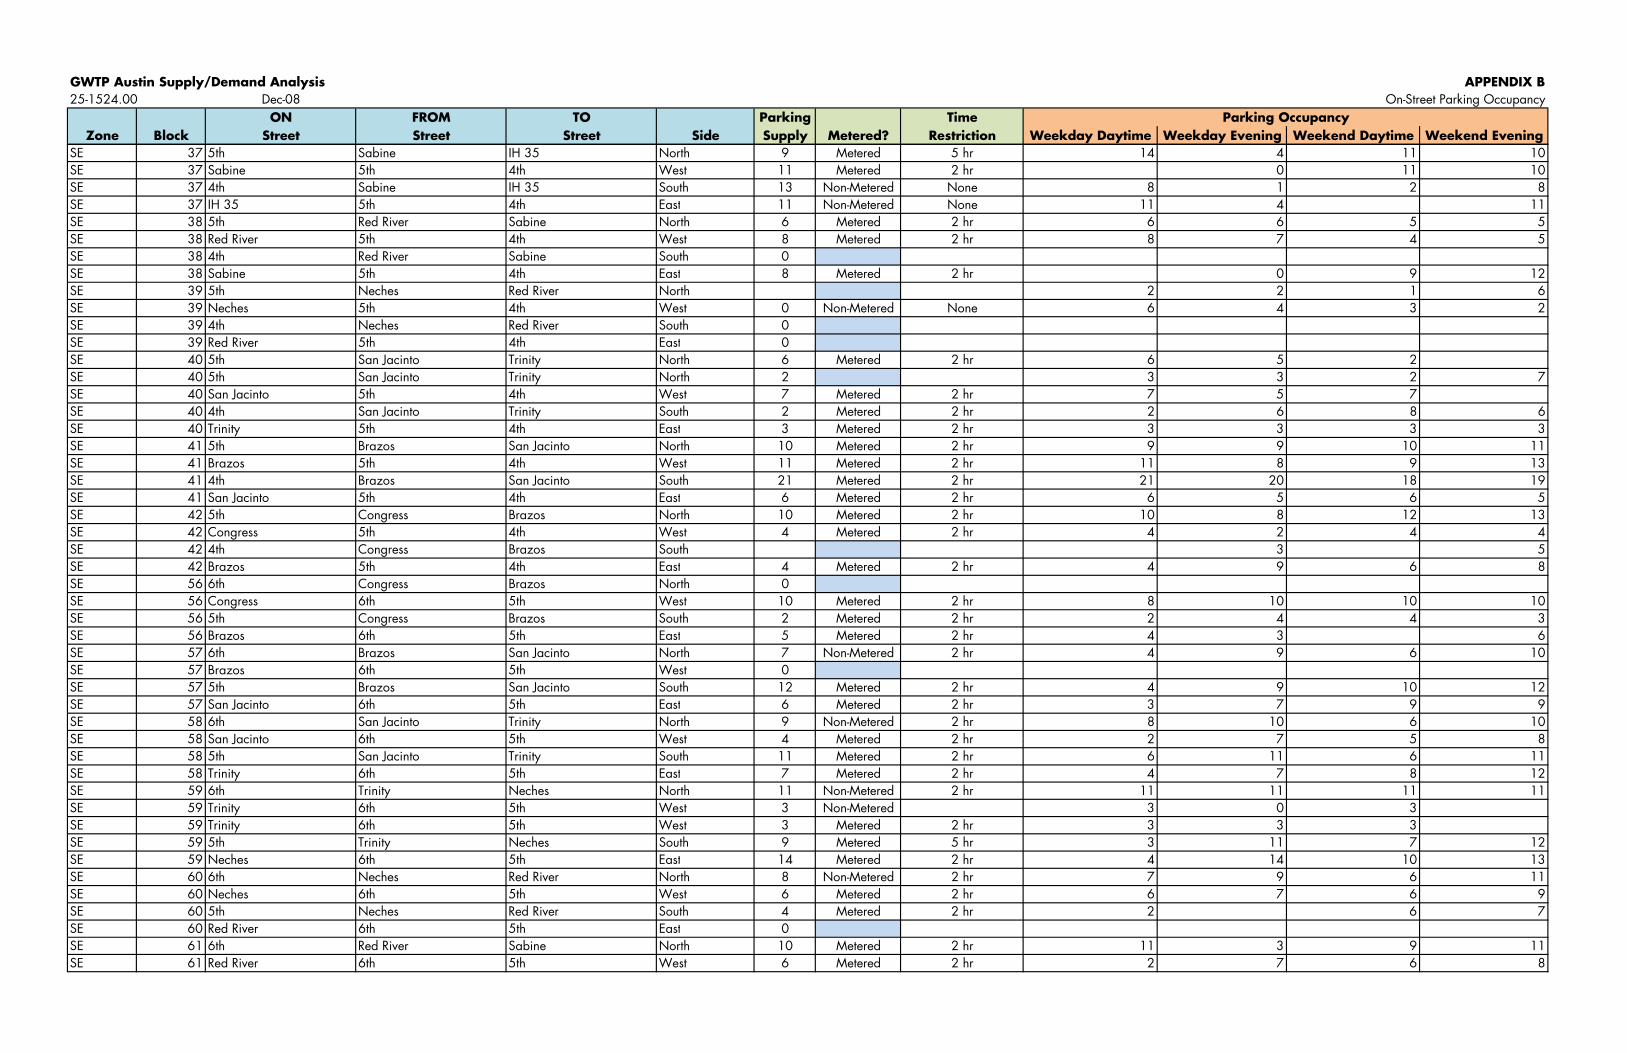
GWTP Austin Supply/Demand Analysis APPENDIX B25-1524.00 Dec-08 On-Street Parking Occupancy
ON FROM TO Parking TimeZone Block Street Street Street Side Supply Metered? Restriction Weekday Daytime Weekday Evening Weekend Daytime Weekend Evening
Parking Occupancy
SE 37 5th Sabine IH 35 North 9 Metered 5 hr 14 4 11 10SE 37 Sabine 5th 4th West 11 Metered 2 hr 0 11 10SE 37 4th Sabine IH 35 South 13 Non-Metered None 8 1 2 8SE 37 IH 35 5th 4th East 11 Non-Metered None 11 4 11SE 38 5th Red River Sabine North 6 Metered 2 hr 6 6 5 5SE 38 Red River 5th 4th West 8 Metered 2 hr 8 7 4 5SE 38 4th Red River Sabine South 0SE 38 Sabine 5th 4th East 8 Metered 2 hr 0 9 12SE 39 5th Neches Red River North 2 2 1 6SE 39 Neches 5th 4th West 0 Non-Metered None 6 4 3 2SE 39 4th Neches Red River South 0SE 39 Red River 5th 4th East 0SE 40 5th San Jacinto Trinity North 6 Metered 2 hr 6 5 2SE 40 5th San Jacinto Trinity North 2 3 3 2 7SE 40 San Jacinto 5th 4th West 7 Metered 2 hr 7 5 7SE 40 4th San Jacinto Trinity South 2 Metered 2 hr 2 6 8 6SE 40 Trinity 5th 4th East 3 Metered 2 hr 3 3 3 3SE 41 5th Brazos San Jacinto North 10 Metered 2 hr 9 9 10 11SE 41 Brazos 5th 4th West 11 Metered 2 hr 11 8 9 13SE 41 4th Brazos San Jacinto South 21 Metered 2 hr 21 20 18 19
4 h 4 h M d hSE 41 San Jacinto 5th 4th East 6 Metered 2 hr 6 5 6 5SE 42 5th Congress Brazos North 10 Metered 2 hr 10 8 12 13SE 42 Congress 5th 4th West 4 Metered 2 hr 4 2 4 4SE 42 4th Congress Brazos South 3 5SE 42 Brazos 5th 4th East 4 Metered 2 hr 4 9 6 8SE 56 6th Congress Brazos North 0SE 56 Congress 6th 5th West 10 Metered 2 hr 8 10 10 10SE 56 5th Congress Brazos South 2 Metered 2 hr 2 4 4 3SE 56 Brazos 6th 5th East 5 Metered 2 hr 4 3 6SE 57 6th Brazos San Jacinto North 7 Non-Metered 2 hr 4 9 6 10SE 57 Brazos 6th 5th West 0SE 57 5th Brazos San Jacinto South 12 Metered 2 hr 4 9 10 12SE 57 San Jacinto 6th 5th East 6 Metered 2 hr 3 7 9 9SE 58 6th San Jacinto Trinity North 9 Non-Metered 2 hr 8 10 6 10SE 58 San Jacinto 6th 5th West 4 Metered 2 hr 2 7 5 8SE 58 San Jacinto 6th 5th West 4 Metered 2 hr 2 7 5 8SE 58 5th San Jacinto Trinity South 11 Metered 2 hr 6 11 6 11SE 58 Trinity 6th 5th East 7 Metered 2 hr 4 7 8 12SE 59 6th Trinity Neches North 11 Non-Metered 2 hr 11 11 11 11SE 59 Trinity 6th 5th West 3 Non-Metered 3 0 3SE 59 Trinity 6th 5th West 3 Metered 2 hr 3 3 3SE 59 5th Trinity Neches South 9 Metered 5 hr 3 11 7 12SE 59 Neches 6th 5th East 14 Metered 2 hr 4 14 10 13SE 60 6th Neches Red River North 8 Non-Metered 2 hr 7 9 6 11SE 60 Neches 6th 5th West 6 Metered 2 hr 6 7 6 9SE 60 5th Neches Red River South 4 Metered 2 hr 2 6 7SE 60 Red River 6th 5th East 0SE 61 6th Red River Sabine North 10 Metered 2 hr 11 3 9 11SE 61 Red River 6th 5th West 6 Metered 2 hr 2 7 6 8
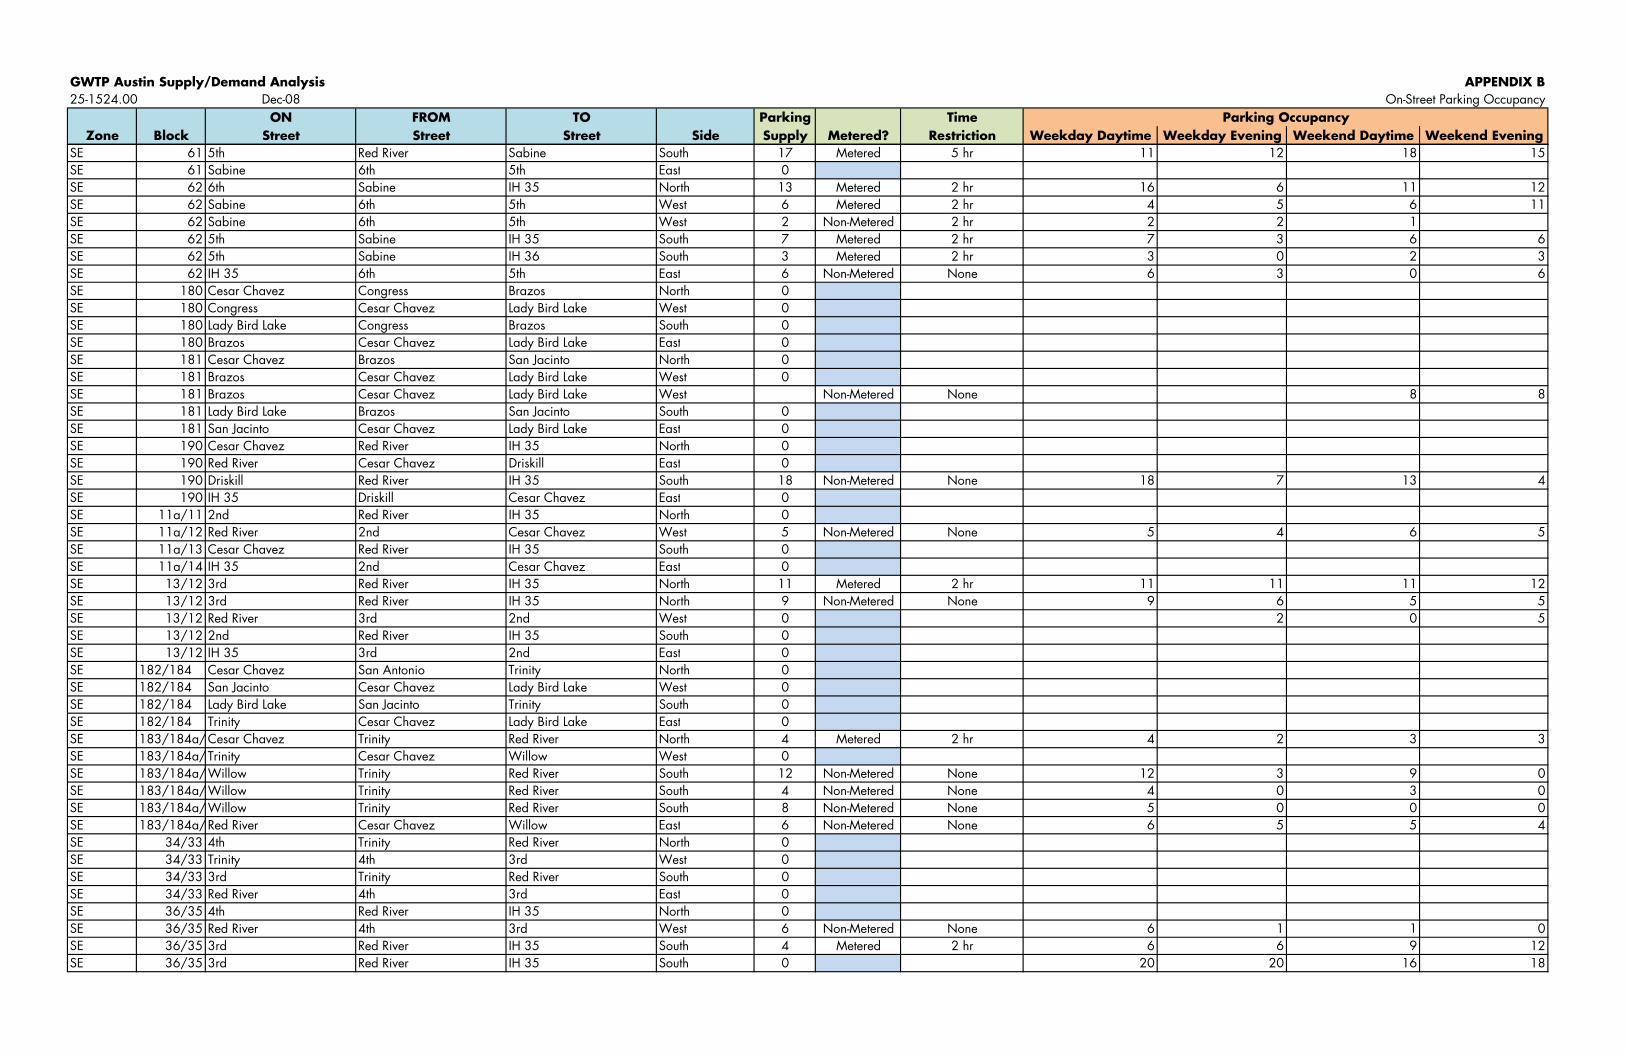
GWTP Austin Supply/Demand Analysis APPENDIX B25-1524.00 Dec-08 On-Street Parking Occupancy
ON FROM TO Parking TimeZone Block Street Street Street Side Supply Metered? Restriction Weekday Daytime Weekday Evening Weekend Daytime Weekend Evening
Parking Occupancy
SE 61 5th Red River Sabine South 17 Metered 5 hr 11 12 18 15SE 61 Sabine 6th 5th East 0SE 62 6th Sabine IH 35 North 13 Metered 2 hr 16 6 11 12SE 62 Sabine 6th 5th West 6 Metered 2 hr 4 5 6 11SE 62 Sabine 6th 5th West 2 Non-Metered 2 hr 2 2 1SE 62 5th Sabine IH 35 South 7 Metered 2 hr 7 3 6 6SE 62 5th Sabine IH 36 South 3 Metered 2 hr 3 0 2 3SE 62 IH 35 6th 5th East 6 Non-Metered None 6 3 0 6SE 180 Cesar Chavez Congress Brazos North 0SE 180 Congress Cesar Chavez Lady Bird Lake West 0SE 180 Lady Bird Lake Congress Brazos South 0SE 180 Brazos Cesar Chavez Lady Bird Lake East 0SE 181 Cesar Chavez Brazos San Jacinto North 0SE 181 Brazos Cesar Chavez Lady Bird Lake West 0SE 181 Brazos Cesar Chavez Lady Bird Lake West Non-Metered None 8 8SE 181 Lady Bird Lake Brazos San Jacinto South 0SE 181 San Jacinto Cesar Chavez Lady Bird Lake East 0SE 190 Cesar Chavez Red River IH 35 North 0SE 190 Red River Cesar Chavez Driskill East 0SE 190 Driskill Red River IH 35 South 18 Non-Metered None 18 7 13 4
k ll hSE 190 IH 35 Driskill Cesar Chavez East 0SE 11a/11 2nd Red River IH 35 North 0SE 11a/12 Red River 2nd Cesar Chavez West 5 Non-Metered None 5 4 6 5SE 11a/13 Cesar Chavez Red River IH 35 South 0SE 11a/14 IH 35 2nd Cesar Chavez East 0SE 13/12 3rd Red River IH 35 North 11 Metered 2 hr 11 11 11 12SE 13/12 3rd Red River IH 35 North 9 Non-Metered None 9 6 5 5SE 13/12 Red River 3rd 2nd West 0 2 0 5SE 13/12 2nd Red River IH 35 South 0SE 13/12 IH 35 3rd 2nd East 0SE 182/184 Cesar Chavez San Antonio Trinity North 0SE 182/184 San Jacinto Cesar Chavez Lady Bird Lake West 0SE 182/184 Lady Bird Lake San Jacinto Trinity South 0SE 182/184 Trinity Cesar Chavez Lady Bird Lake East 0SE 183/184a/Cesar Chavez Trinity Red River North 4 Metered 2 hr 4 2 3 3SE 183/184a/Cesar Chavez Trinity Red River North 4 Metered 2 hr 4 2 3 3SE 183/184a/Trinity Cesar Chavez Willow West 0SE 183/184a/Willow Trinity Red River South 12 Non-Metered None 12 3 9 0SE 183/184a/Willow Trinity Red River South 4 Non-Metered None 4 0 3 0SE 183/184a/Willow Trinity Red River South 8 Non-Metered None 5 0 0 0SE 183/184a/Red River Cesar Chavez Willow East 6 Non-Metered None 6 5 5 4SE 34/33 4th Trinity Red River North 0SE 34/33 Trinity 4th 3rd West 0SE 34/33 3rd Trinity Red River South 0SE 34/33 Red River 4th 3rd East 0SE 36/35 4th Red River IH 35 North 0SE 36/35 Red River 4th 3rd West 6 Non-Metered None 6 1 1 0SE 36/35 3rd Red River IH 35 South 4 Metered 2 hr 6 6 9 12SE 36/35 3rd Red River IH 35 South 0 20 20 16 18
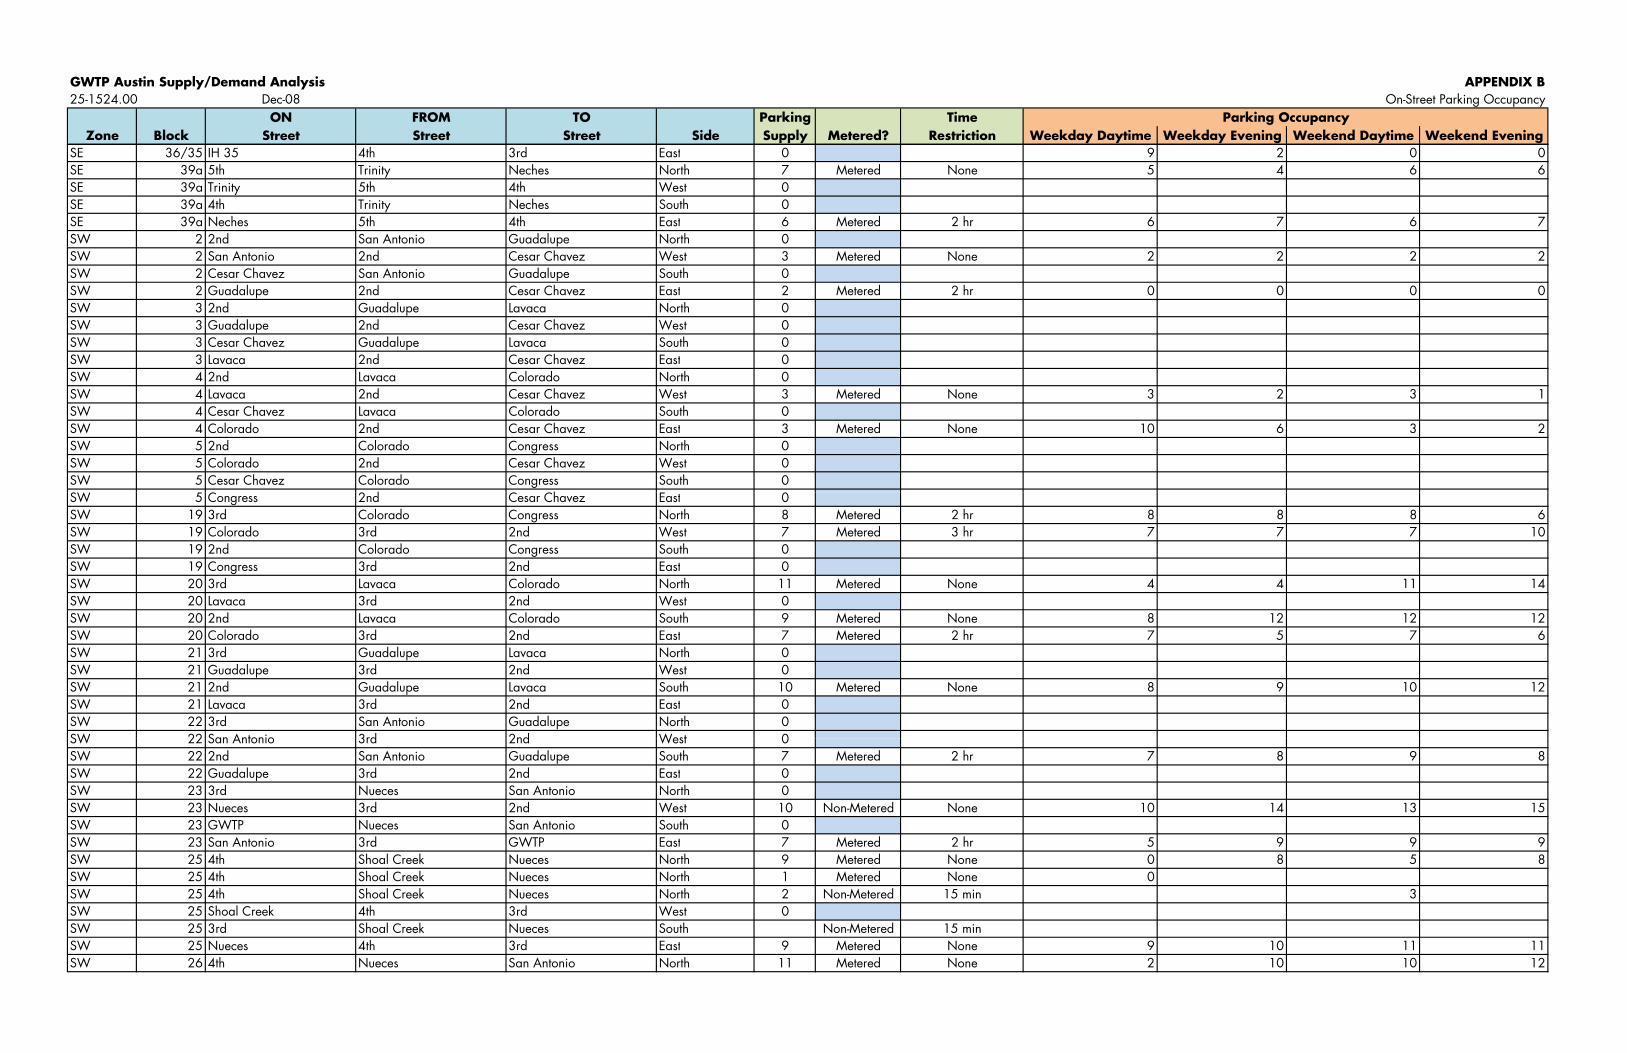
GWTP Austin Supply/Demand Analysis APPENDIX B25-1524.00 Dec-08 On-Street Parking Occupancy
ON FROM TO Parking TimeZone Block Street Street Street Side Supply Metered? Restriction Weekday Daytime Weekday Evening Weekend Daytime Weekend Evening
Parking Occupancy
SE 36/35 IH 35 4th 3rd East 0 9 2 0 0SE 39a 5th Trinity Neches North 7 Metered None 5 4 6 6SE 39a Trinity 5th 4th West 0SE 39a 4th Trinity Neches South 0SE 39a Neches 5th 4th East 6 Metered 2 hr 6 7 6 7SW 2 2nd San Antonio Guadalupe North 0pSW 2 San Antonio 2nd Cesar Chavez West 3 Metered None 2 2 2 2SW 2 Cesar Chavez San Antonio Guadalupe South 0SW 2 Guadalupe 2nd Cesar Chavez East 2 Metered 2 hr 0 0 0 0SW 3 2nd Guadalupe Lavaca North 0SW 3 Guadalupe 2nd Cesar Chavez West 0SW 3 Cesar Chavez Guadalupe Lavaca South 0SW 3 Lavaca 2nd Cesar Chavez East 0SW 4 2nd Lavaca Colorado North 0SW 4 Lavaca 2nd Cesar Chavez West 3 Metered None 3 2 3 1SW 4 Cesar Chavez Lavaca Colorado South 0SW 4 Colorado 2nd Cesar Chavez East 3 Metered None 10 6 3 2SW 5 2nd Colorado Congress North 0SW 5 Colorado 2nd Cesar Chavez West 0SW 5 Cesar Chavez Colorado Congress South 0W d hSW 5 Congress 2nd Cesar Chavez East 0
SW 19 3rd Colorado Congress North 8 Metered 2 hr 8 8 8 6SW 19 Colorado 3rd 2nd West 7 Metered 3 hr 7 7 7 10SW 19 2nd Colorado Congress South 0SW 19 Congress 3rd 2nd East 0SW 20 3rd Lavaca Colorado North 11 Metered None 4 4 11 14SW 20 Lavaca 3rd 2nd West 0SW 20 2nd Lavaca Colorado South 9 Metered None 8 12 12 12SW 20 Colorado 3rd 2nd East 7 Metered 2 hr 7 5 7 6SW 21 3rd Guadalupe Lavaca North 0SW 21 Guadalupe 3rd 2nd West 0SW 21 2nd Guadalupe Lavaca South 10 Metered None 8 9 10 12SW 21 Lavaca 3rd 2nd East 0SW 22 3rd San Antonio Guadalupe North 0SW 22 San Antonio 3rd 2nd West 0SW 22 San Antonio 3rd 2nd West 0SW 22 2nd San Antonio Guadalupe South 7 Metered 2 hr 7 8 9 8SW 22 Guadalupe 3rd 2nd East 0SW 23 3rd Nueces San Antonio North 0SW 23 Nueces 3rd 2nd West 10 Non-Metered None 10 14 13 15SW 23 GWTP Nueces San Antonio South 0SW 23 San Antonio 3rd GWTP East 7 Metered 2 hr 5 9 9 9SW 25 4th Shoal Creek Nueces North 9 Metered None 0 8 5 8SW 25 4th Shoal Creek Nueces North 1 Metered None 0SW 25 4th Shoal Creek Nueces North 2 Non-Metered 15 min 3SW 25 Shoal Creek 4th 3rd West 0SW 25 3rd Shoal Creek Nueces South Non-Metered 15 minSW 25 Nueces 4th 3rd East 9 Metered None 9 10 11 11SW 26 4th Nueces San Antonio North 11 Metered None 2 10 10 12
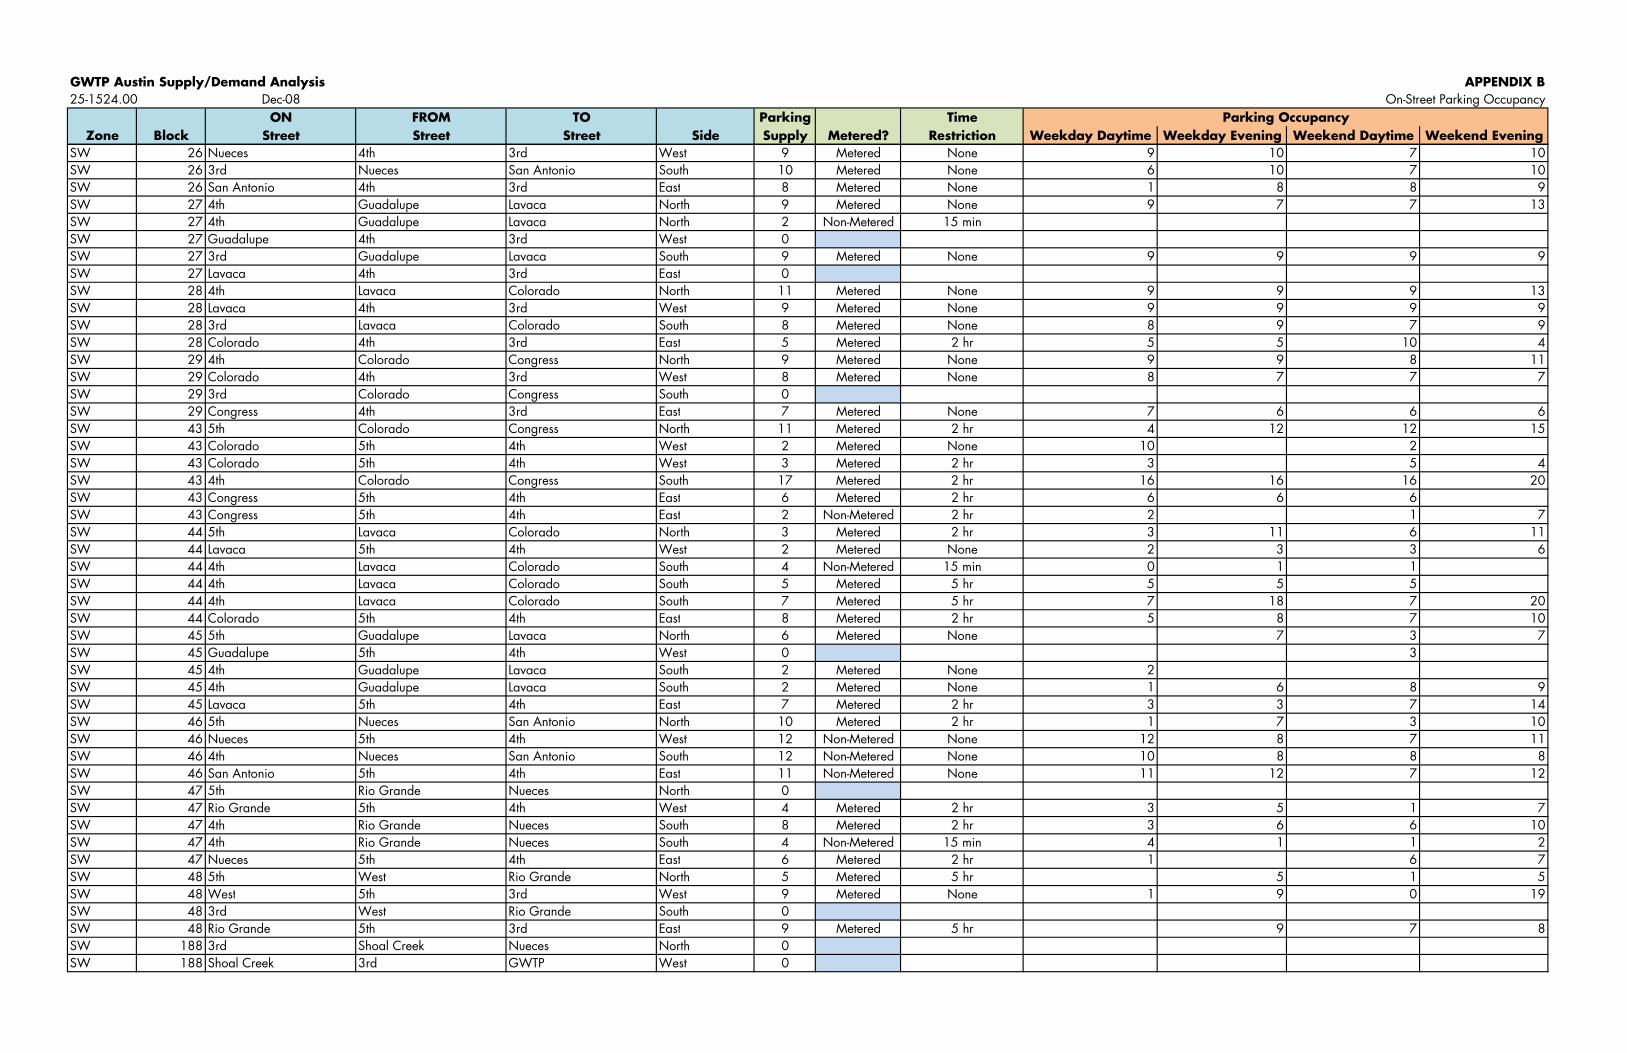
GWTP Austin Supply/Demand Analysis APPENDIX B25-1524.00 Dec-08 On-Street Parking Occupancy
ON FROM TO Parking TimeZone Block Street Street Street Side Supply Metered? Restriction Weekday Daytime Weekday Evening Weekend Daytime Weekend Evening
Parking Occupancy
SW 26 Nueces 4th 3rd West 9 Metered None 9 10 7 10SW 26 3rd Nueces San Antonio South 10 Metered None 6 10 7 10SW 26 San Antonio 4th 3rd East 8 Metered None 1 8 8 9SW 27 4th Guadalupe Lavaca North 9 Metered None 9 7 7 13SW 27 4th Guadalupe Lavaca North 2 Non-Metered 15 minSW 27 Guadalupe 4th 3rd West 0pSW 27 3rd Guadalupe Lavaca South 9 Metered None 9 9 9 9SW 27 Lavaca 4th 3rd East 0SW 28 4th Lavaca Colorado North 11 Metered None 9 9 9 13SW 28 Lavaca 4th 3rd West 9 Metered None 9 9 9 9SW 28 3rd Lavaca Colorado South 8 Metered None 8 9 7 9SW 28 Colorado 4th 3rd East 5 Metered 2 hr 5 5 10 4SW 29 4th Colorado Congress North 9 Metered None 9 9 8 11SW 29 Colorado 4th 3rd West 8 Metered None 8 7 7 7SW 29 3rd Colorado Congress South 0SW 29 Congress 4th 3rd East 7 Metered None 7 6 6 6SW 43 5th Colorado Congress North 11 Metered 2 hr 4 12 12 15SW 43 Colorado 5th 4th West 2 Metered None 10 2SW 43 Colorado 5th 4th West 3 Metered 2 hr 3 5 4SW 43 4th Colorado Congress South 17 Metered 2 hr 16 16 16 20W 4 h 4 h M d hSW 43 Congress 5th 4th East 6 Metered 2 hr 6 6 6
SW 43 Congress 5th 4th East 2 Non-Metered 2 hr 2 1 7SW 44 5th Lavaca Colorado North 3 Metered 2 hr 3 11 6 11SW 44 Lavaca 5th 4th West 2 Metered None 2 3 3 6SW 44 4th Lavaca Colorado South 4 Non-Metered 15 min 0 1 1SW 44 4th Lavaca Colorado South 5 Metered 5 hr 5 5 5SW 44 4th Lavaca Colorado South 7 Metered 5 hr 7 18 7 20SW 44 Colorado 5th 4th East 8 Metered 2 hr 5 8 7 10SW 45 5th Guadalupe Lavaca North 6 Metered None 7 3 7SW 45 Guadalupe 5th 4th West 0 3SW 45 4th Guadalupe Lavaca South 2 Metered None 2SW 45 4th Guadalupe Lavaca South 2 Metered None 1 6 8 9SW 45 Lavaca 5th 4th East 7 Metered 2 hr 3 3 7 14SW 46 5th Nueces San Antonio North 10 Metered 2 hr 1 7 3 10SW 46 Nueces 5th 4th West 12 Non Metered None 12 8 7 11SW 46 Nueces 5th 4th West 12 Non-Metered None 12 8 7 11SW 46 4th Nueces San Antonio South 12 Non-Metered None 10 8 8 8SW 46 San Antonio 5th 4th East 11 Non-Metered None 11 12 7 12SW 47 5th Rio Grande Nueces North 0SW 47 Rio Grande 5th 4th West 4 Metered 2 hr 3 5 1 7SW 47 4th Rio Grande Nueces South 8 Metered 2 hr 3 6 6 10SW 47 4th Rio Grande Nueces South 4 Non-Metered 15 min 4 1 1 2SW 47 Nueces 5th 4th East 6 Metered 2 hr 1 6 7SW 48 5th West Rio Grande North 5 Metered 5 hr 5 1 5SW 48 West 5th 3rd West 9 Metered None 1 9 0 19SW 48 3rd West Rio Grande South 0SW 48 Rio Grande 5th 3rd East 9 Metered 5 hr 9 7 8SW 188 3rd Shoal Creek Nueces North 0SW 188 Shoal Creek 3rd GWTP West 0
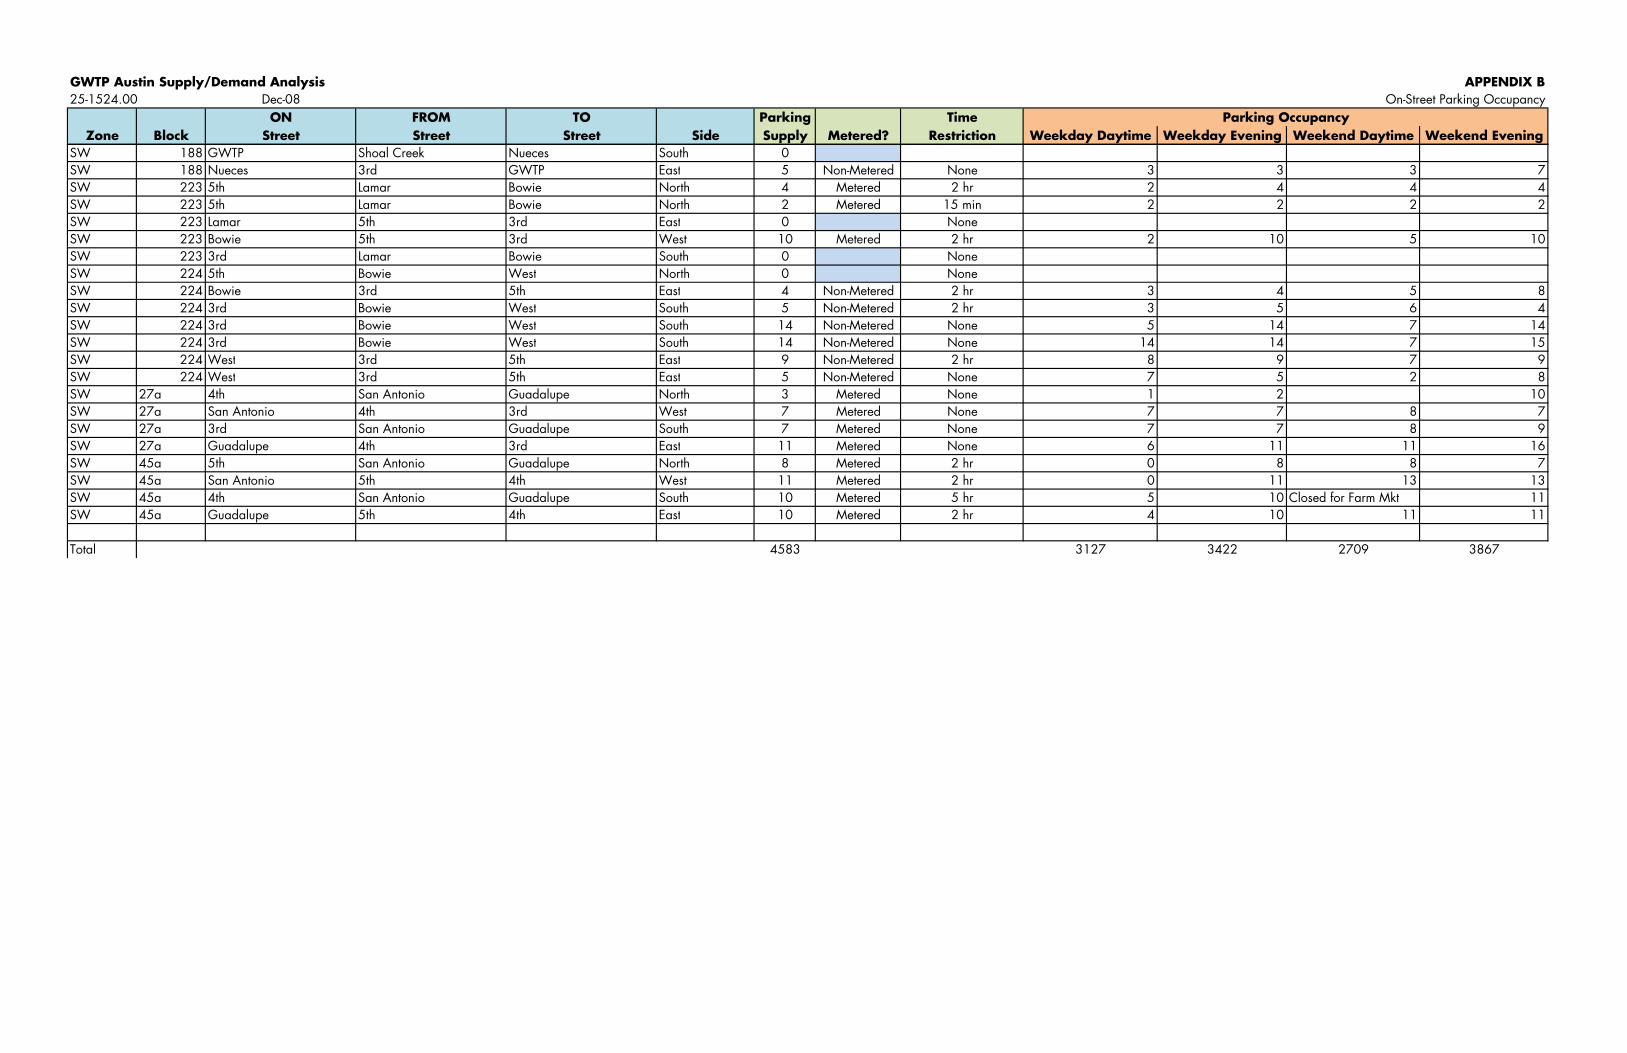
GWTP Austin Supply/Demand Analysis APPENDIX B25-1524.00 Dec-08 On-Street Parking Occupancy
ON FROM TO Parking TimeZone Block Street Street Street Side Supply Metered? Restriction Weekday Daytime Weekday Evening Weekend Daytime Weekend Evening
Parking Occupancy
SW 188 GWTP Shoal Creek Nueces South 0SW 188 Nueces 3rd GWTP East 5 Non-Metered None 3 3 3 7SW 223 5th Lamar Bowie North 4 Metered 2 hr 2 4 4 4SW 223 5th Lamar Bowie North 2 Metered 15 min 2 2 2 2SW 223 Lamar 5th 3rd East 0 NoneSW 223 Bowie 5th 3rd West 10 Metered 2 hr 2 10 5 10SW 223 3rd Lamar Bowie South 0 NoneSW 224 5th Bowie West North 0 NoneSW 224 Bowie 3rd 5th East 4 Non-Metered 2 hr 3 4 5 8SW 224 3rd Bowie West South 5 Non-Metered 2 hr 3 5 6 4SW 224 3rd Bowie West South 14 Non-Metered None 5 14 7 14SW 224 3rd Bowie West South 14 Non-Metered None 14 14 7 15SW 224 West 3rd 5th East 9 Non-Metered 2 hr 8 9 7 9SW 224 West 3rd 5th East 5 Non-Metered None 7 5 2 8SW 27a 4th San Antonio Guadalupe North 3 Metered None 1 2 10SW 27a San Antonio 4th 3rd West 7 Metered None 7 7 8 7SW 27a 3rd San Antonio Guadalupe South 7 Metered None 7 7 8 9SW 27a Guadalupe 4th 3rd East 11 Metered None 6 11 11 16SW 45a 5th San Antonio Guadalupe North 8 Metered 2 hr 0 8 8 7SW 45a San Antonio 5th 4th West 11 Metered 2 hr 0 11 13 13W 4 4 h A d l h M d h l d f MkSW 45a 4th San Antonio Guadalupe South 10 Metered 5 hr 5 10 Closed for Farm Mkt 11
SW 45a Guadalupe 5th 4th East 10 Metered 2 hr 4 10 11 11
Total 4583 3127 3422 2709 3867
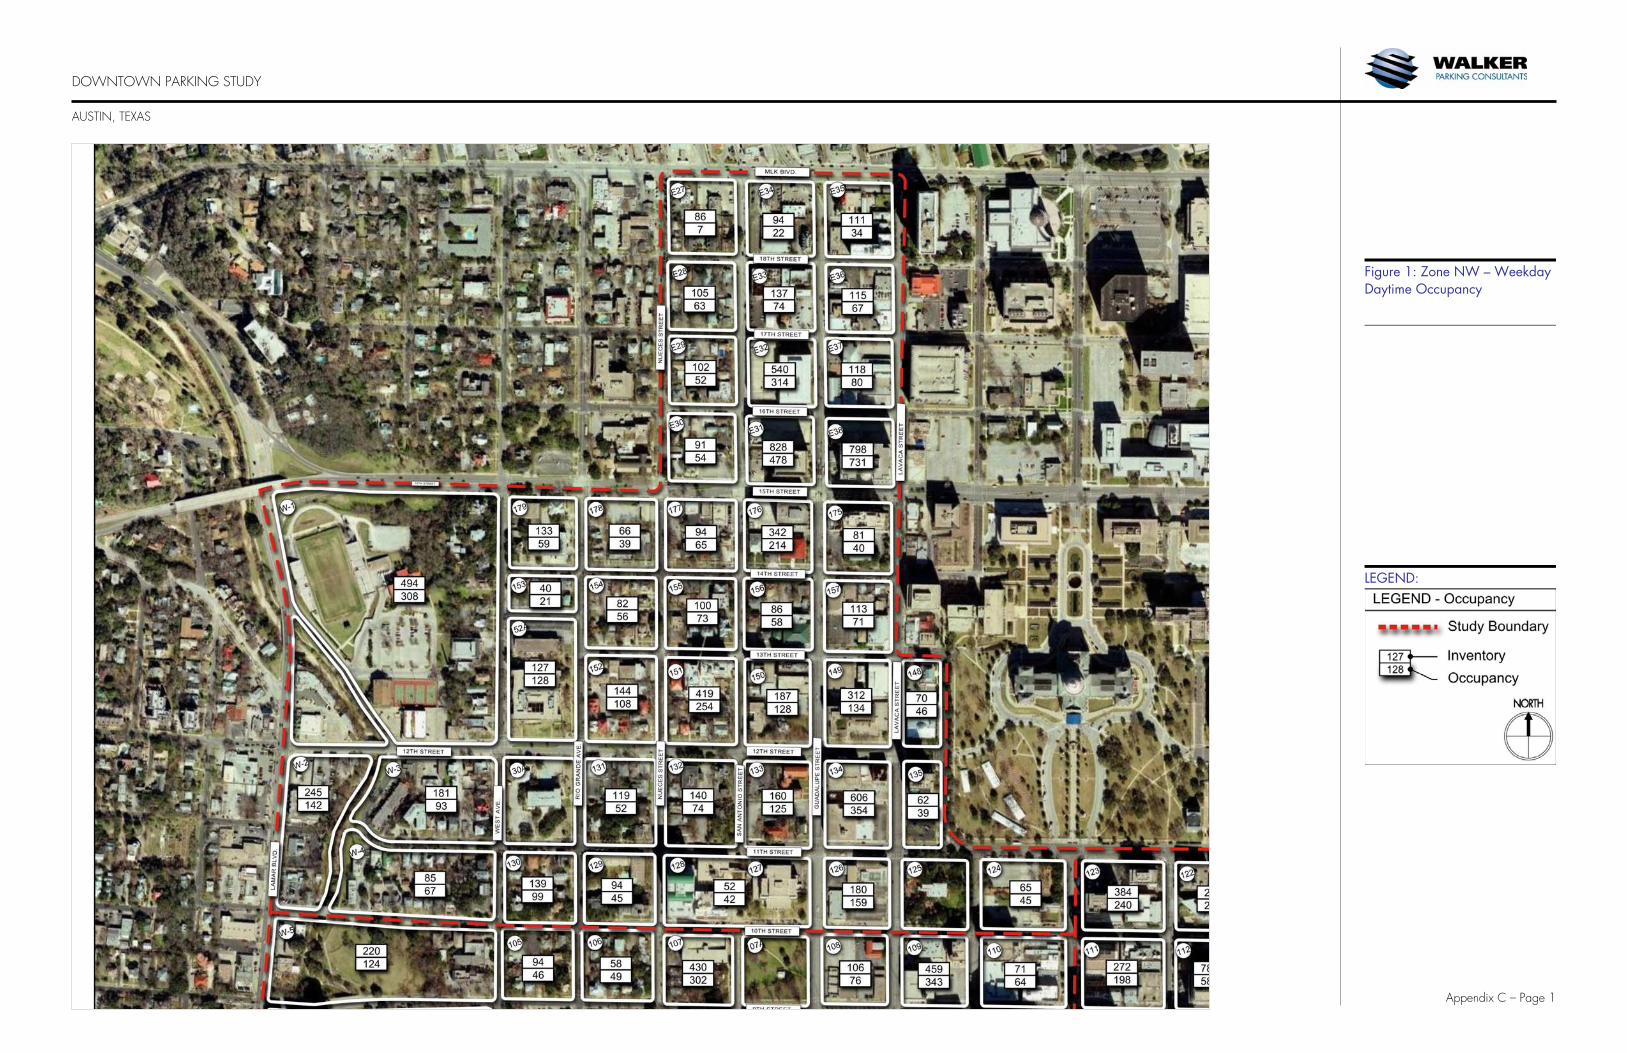
DOWNTOWN PARKING STUDY AUSTIN, TEXAS
Appendix C – Page 1
Figure 1: Zone NW – Weekday Daytime Occupancy
LEGEND:
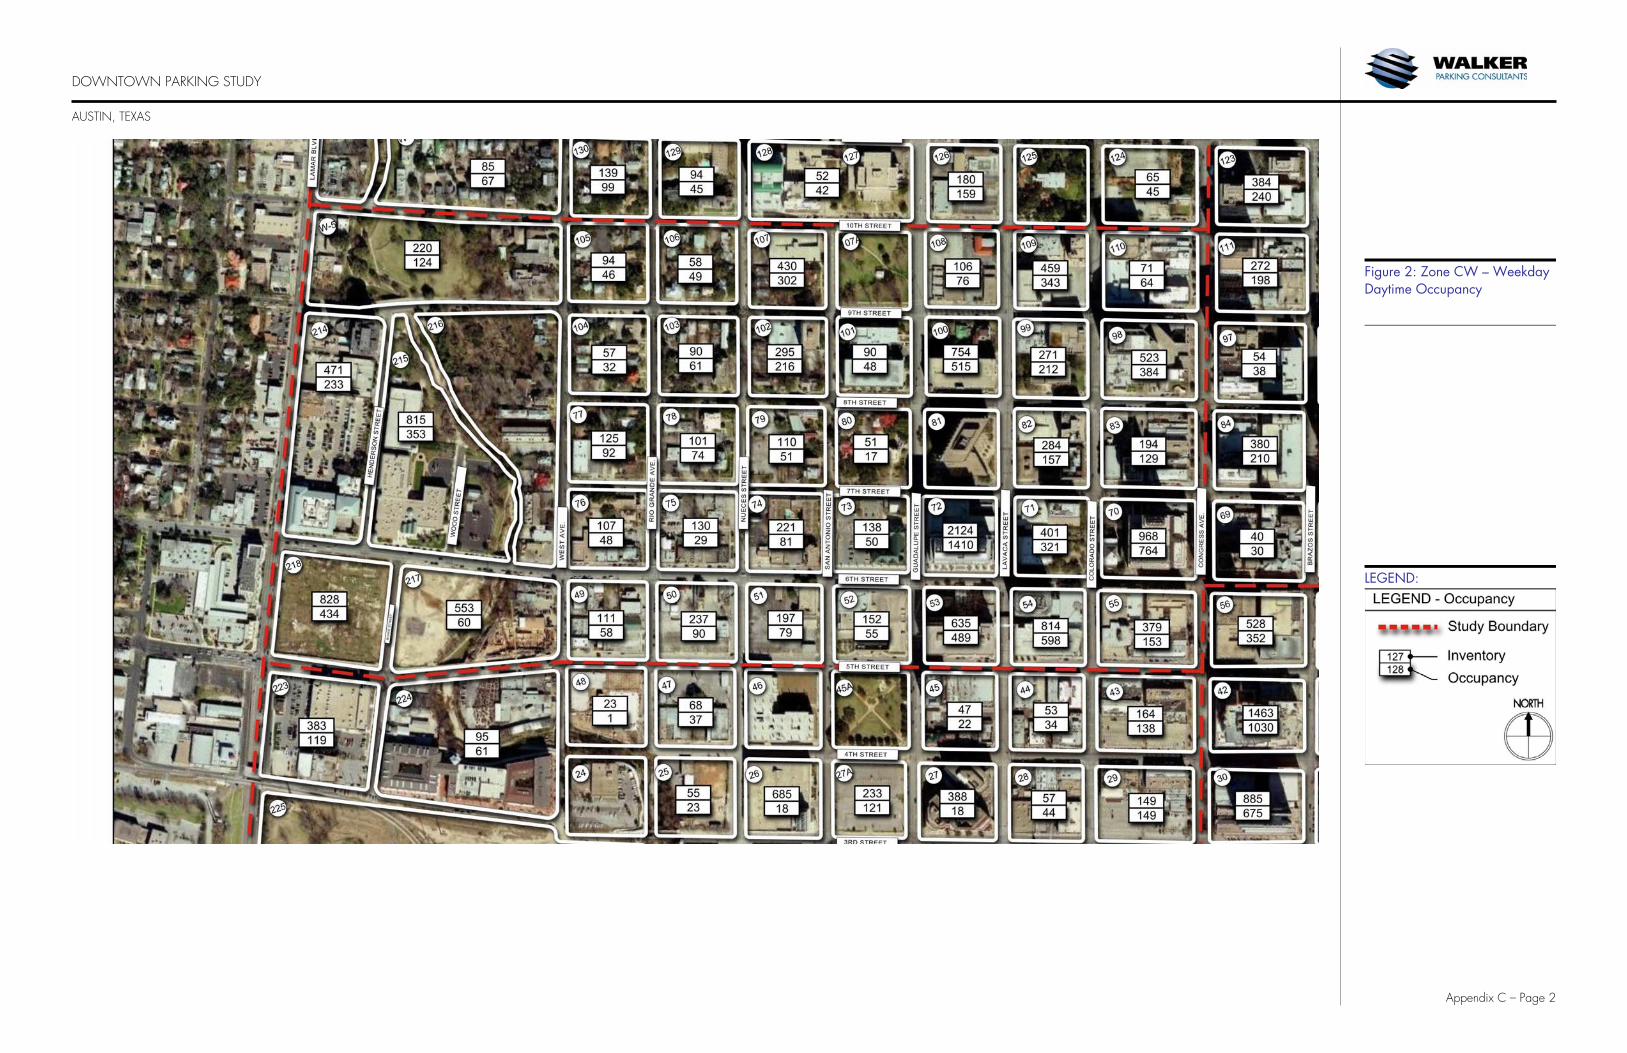
DOWNTOWN PARKING STUDY AUSTIN, TEXAS
Appendix C – Page 2
Figure 2: Zone CW – Weekday Daytime Occupancy
LEGEND:
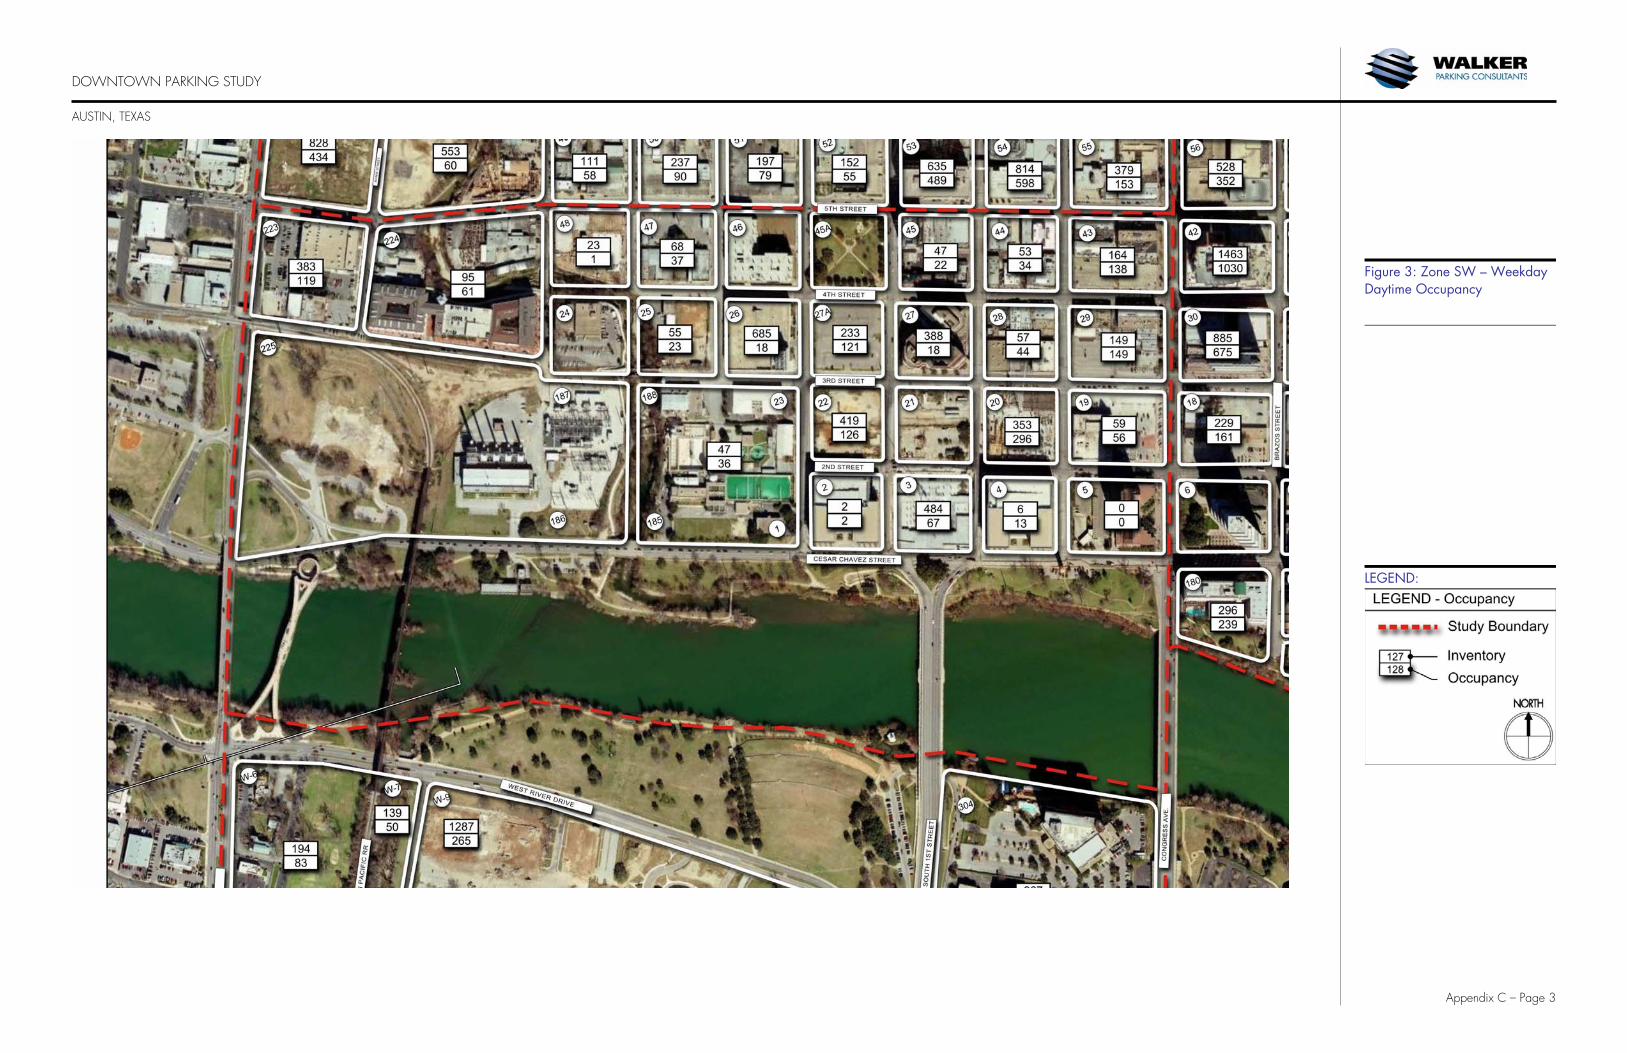
DOWNTOWN PARKING STUDY AUSTIN, TEXAS
Appendix C – Page 3
Figure 3: Zone SW – Weekday Daytime Occupancy
LEGEND:

DOWNTOWN PARKING STUDY AUSTIN, TEXAS
Appendix C – Page 4
Figure 4: Zone NE – Weekday Daytime Occupancy
LEGEND:
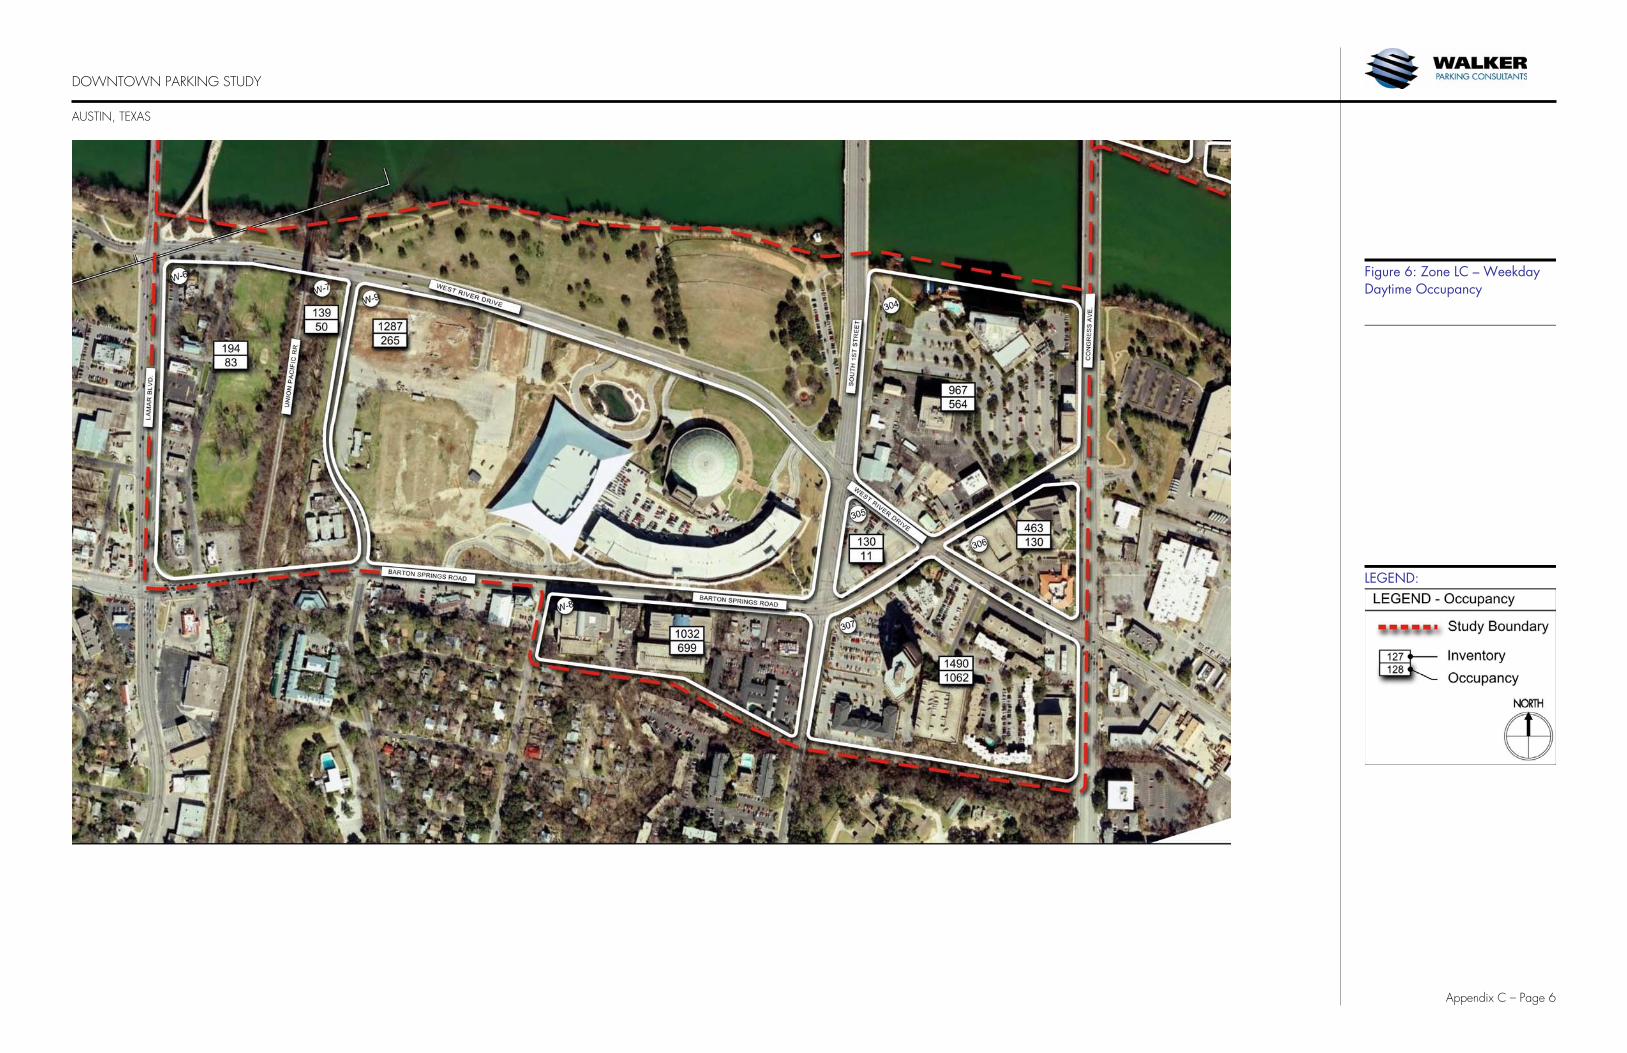
DOWNTOWN PARKING STUDY AUSTIN, TEXAS
Appendix C – Page 6
Figure 6: Zone LC – Weekday Daytime Occupancy
LEGEND:
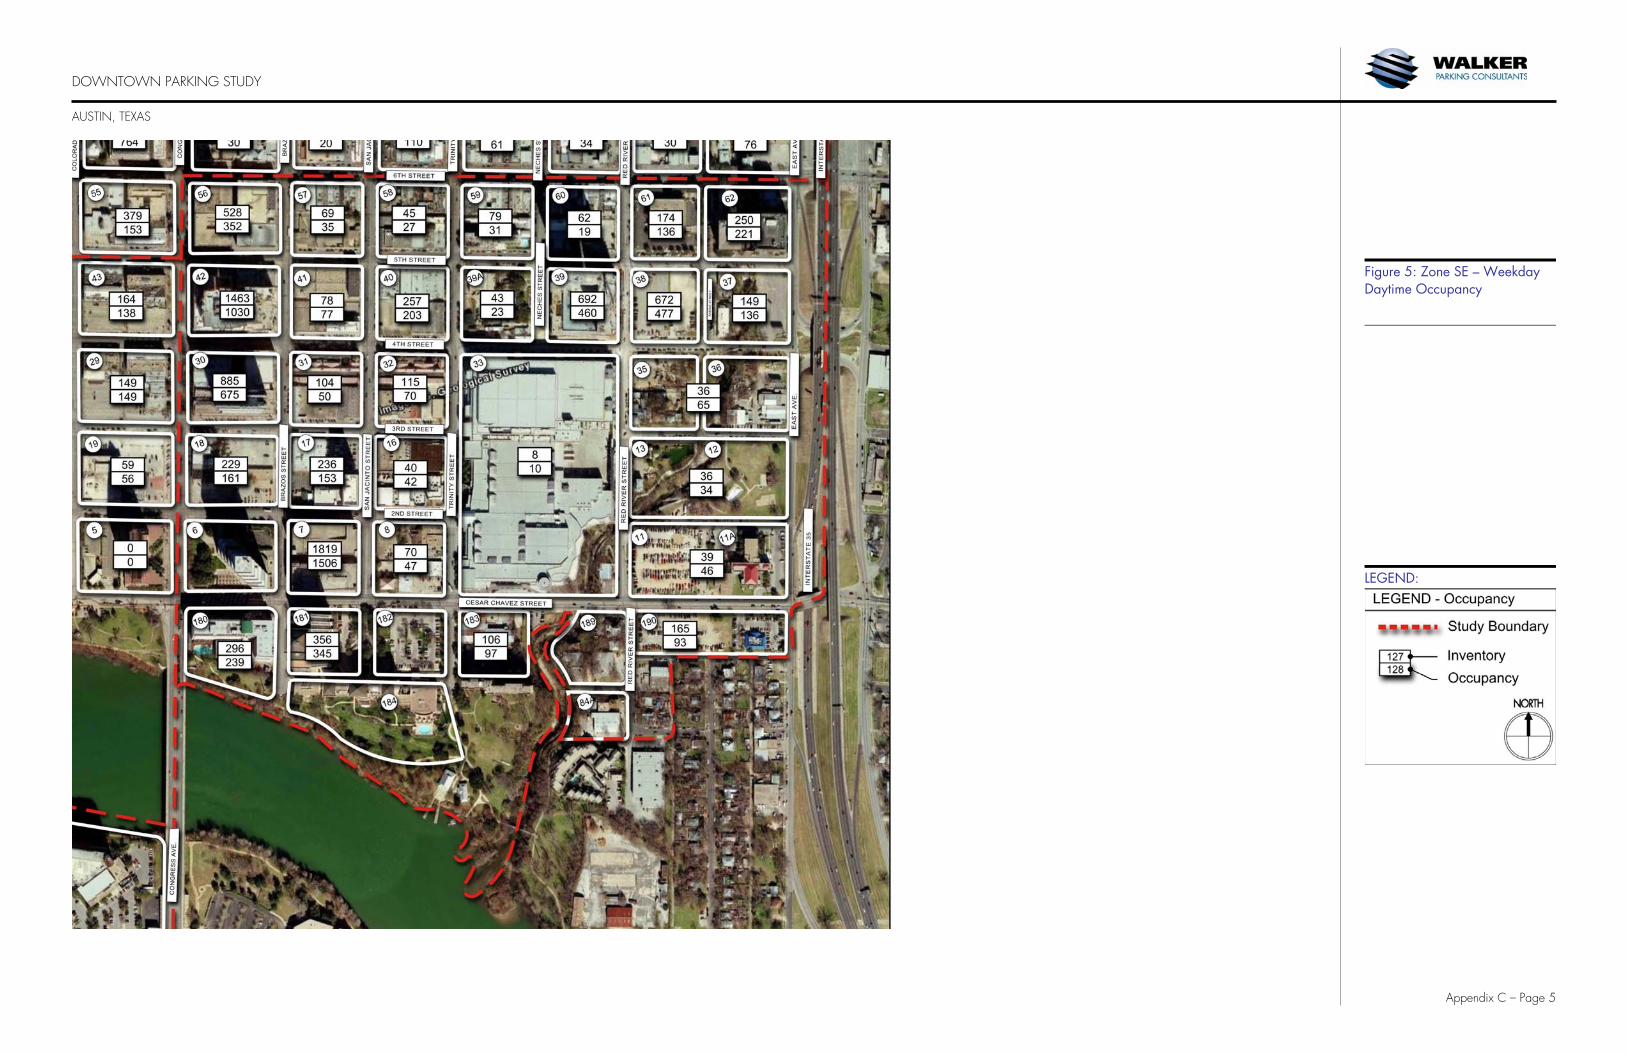
DOWNTOWN PARKING STUDY AUSTIN, TEXAS
Appendix C – Page 5
Figure 5: Zone SE – Weekday Daytime Occupancy
LEGEND: