U.S. BUREAU OF LABOR STATISTICS Spotlight on Statistics
Page 1
JANUARY 2017
STEM Occupations: Past, Present, And FutureStella Fayer, Alan Lacey, and Audrey Watson
Not that long ago, if you were planning a trip to another country, you would probably go to the library to do some research, pick up a foreign phrasebook, and go to the travel agent to book your flight and a hotel. But now, all you have to do is reach for a smart phone. We made just a short leap in time, but an enormous leap in technological advances. Today, it would be difficult to imagine our daily lives without smart phones, applications (“apps”), online shopping, and many other conveniences made possible by the men and women working in science, technology, engineering, and mathematics (STEM) occupations. This Spotlight on Statistics uses data from Occupational Employment Statistics and Employment Projections to take a closer look at STEM occupations.
U.S. BUREAU OF LABOR STATISTICS Spotlight on Statistics
Page 2
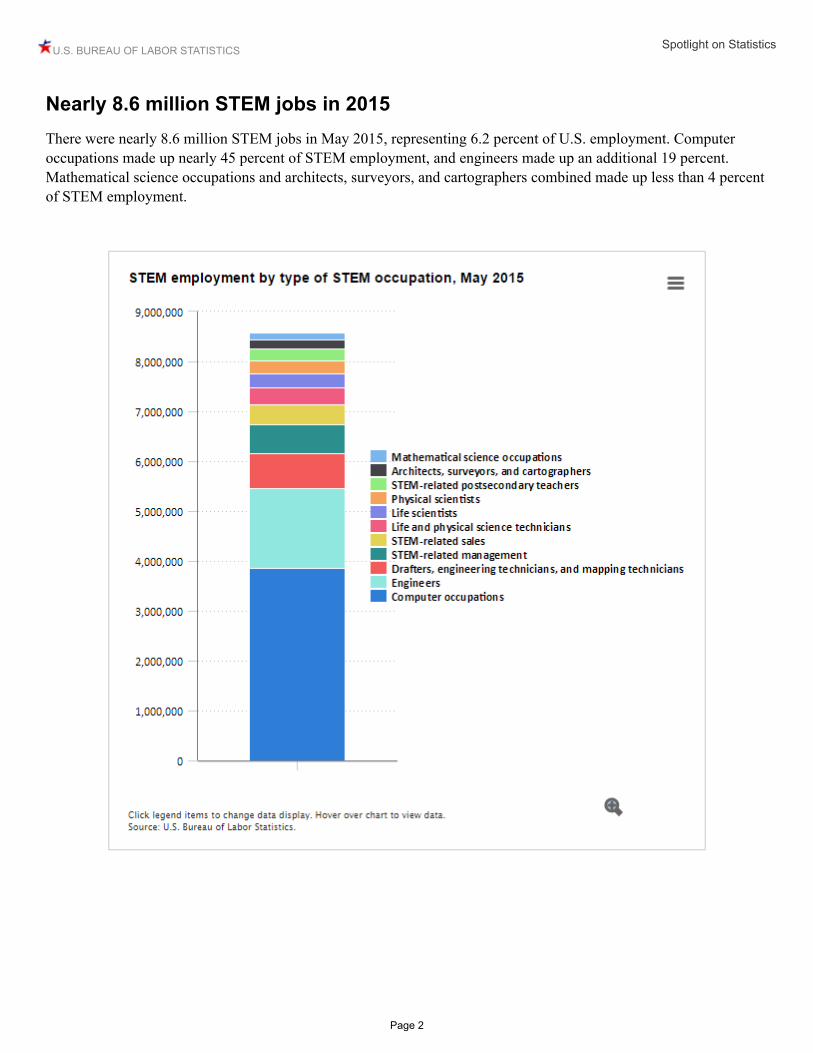
Nearly 8.6 million STEM jobs in 2015There were nearly 8.6 million STEM jobs in May 2015, representing 6.2 percent of U.S. employment. Computer occupations made up nearly 45 percent of STEM employment, and engineers made up an additional 19 percent. Mathematical science occupations and architects, surveyors, and cartographers combined made up less than 4 percent of STEM employment.
U.S. BUREAU OF LABOR STATISTICS Spotlight on Statistics
Page 3
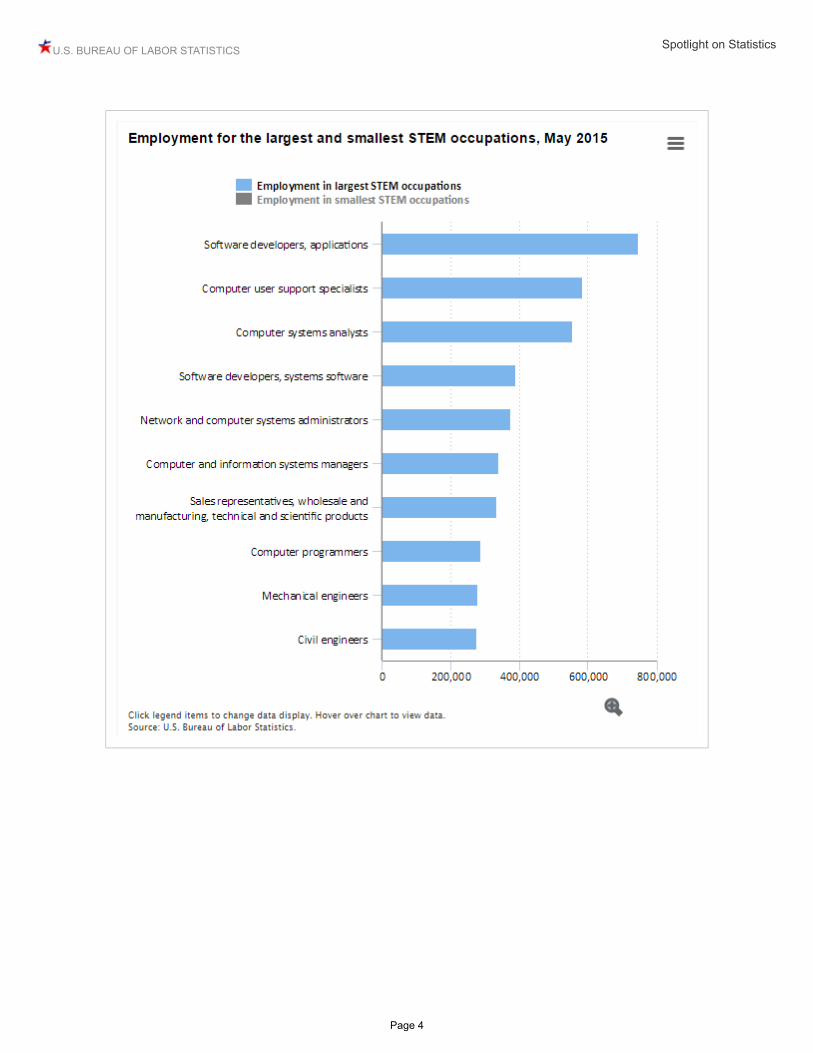
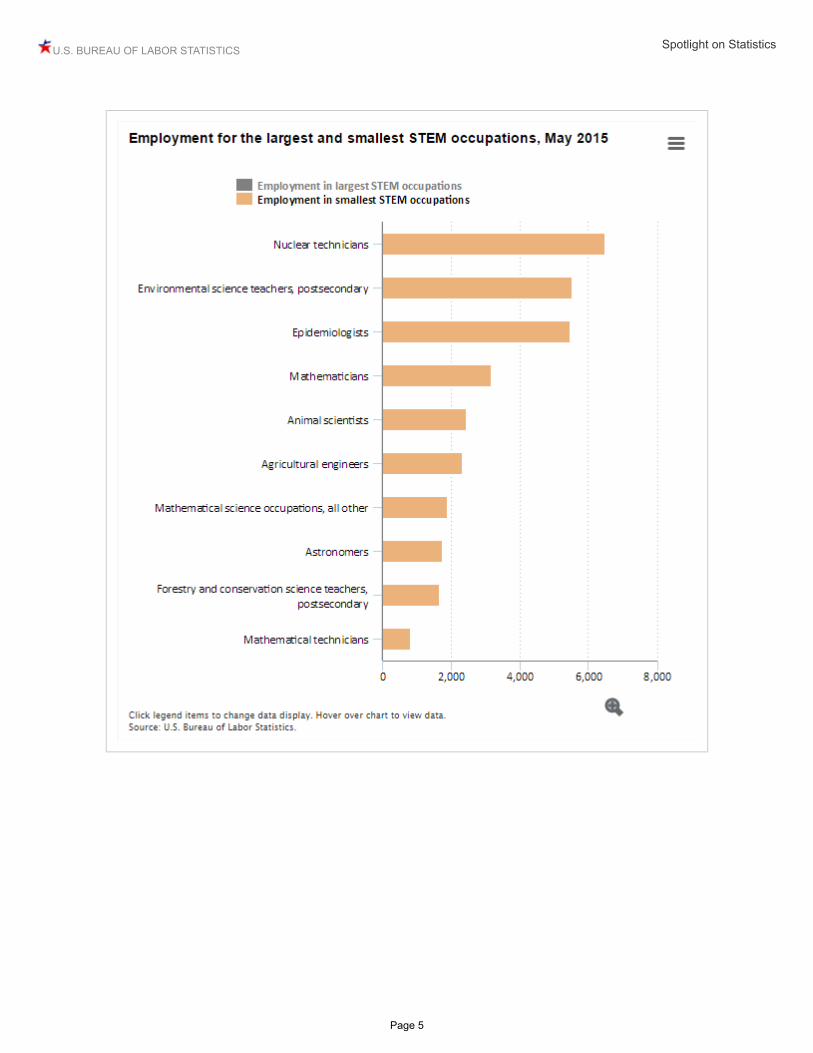
Seven out of the ten largest STEM occupations were computer relatedMost of the largest STEM occupations were related to computers and information systems. With employment of nearly 750,000, applications software developers was the largest STEM occupation. Computer user support specialists and computer systems analysts each accounted for over a half a million jobs.Wholesale and manufacturing sales representatives of technical and scientific products (334,010) was the largest STEM occupation not related to computers. Mechanical engineers and civil engineers, also non-computer-related STEM occupations, each accounted for over a quarter of a million jobs.But not all STEM occupations were large. Some were among the smallest occupations in the country, including mathematical technicians, with only 820 jobs. Astronomers, postsecondary teachers of forestry and conservation science, and mathematical science occupations, all other, each had employment of less than 2,000.
U.S. BUREAU OF LABOR STATISTICS Spotlight on Statistics
Page 4
U.S. BUREAU OF LABOR STATISTICS Spotlight on Statistics
Page 5
U.S. BUREAU OF LABOR STATISTICS Spotlight on Statistics
Page 6
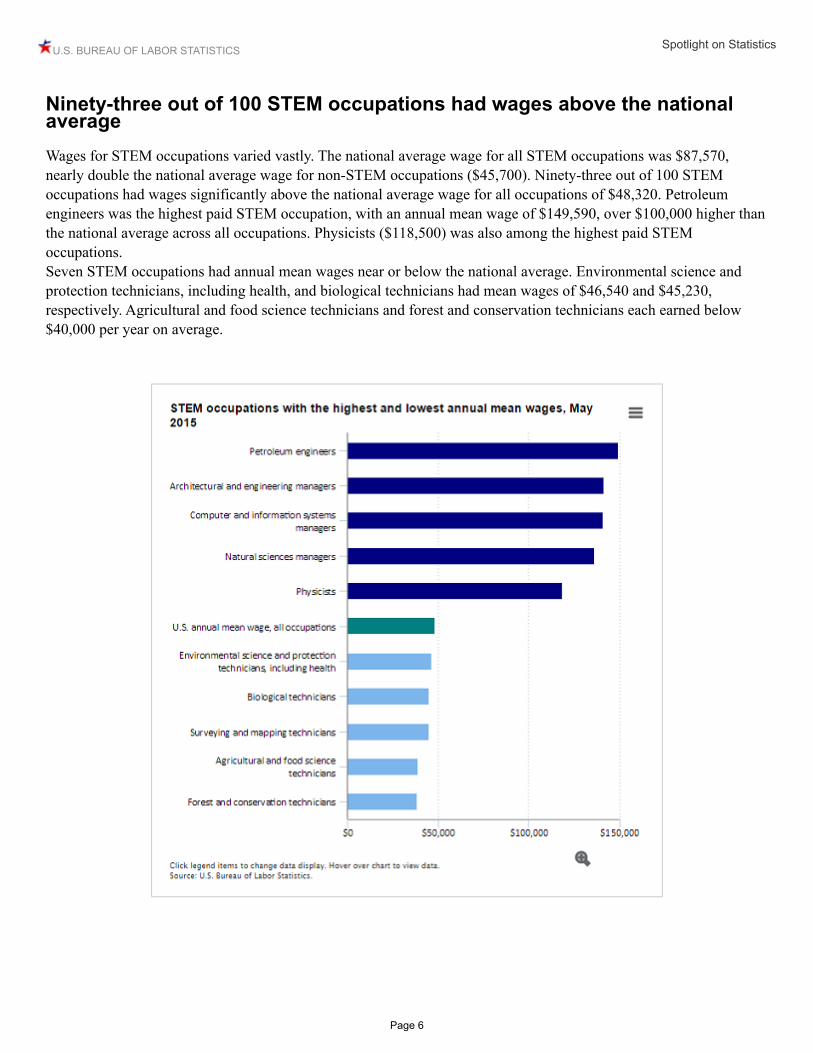
Ninety-three out of 100 STEM occupations had wages above the national averageWages for STEM occupations varied vastly. The national average wage for all STEM occupations was $87,570, nearly double the national average wage for non-STEM occupations ($45,700). Ninety-three out of 100 STEM occupations had wages significantly above the national average wage for all occupations of $48,320. Petroleum engineers was the highest paid STEM occupation, with an annual mean wage of $149,590, over $100,000 higher than the national average across all occupations. Physicists ($118,500) was also among the highest paid STEM occupations. Seven STEM occupations had annual mean wages near or below the national average. Environmental science and protection technicians, including health, and biological technicians had mean wages of $46,540 and $45,230, respectively. Agricultural and food science technicians and forest and conservation technicians each earned below $40,000 per year on average.

U.S. BUREAU OF LABOR STATISTICS Spotlight on Statistics
Page 7
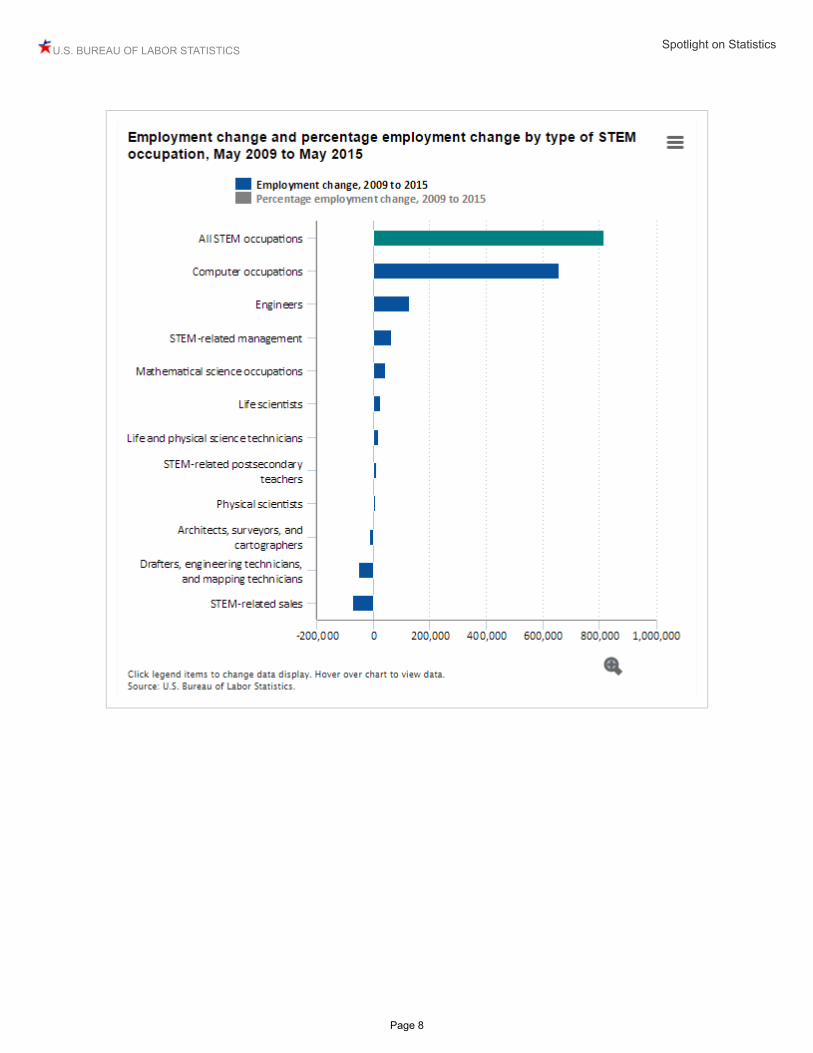
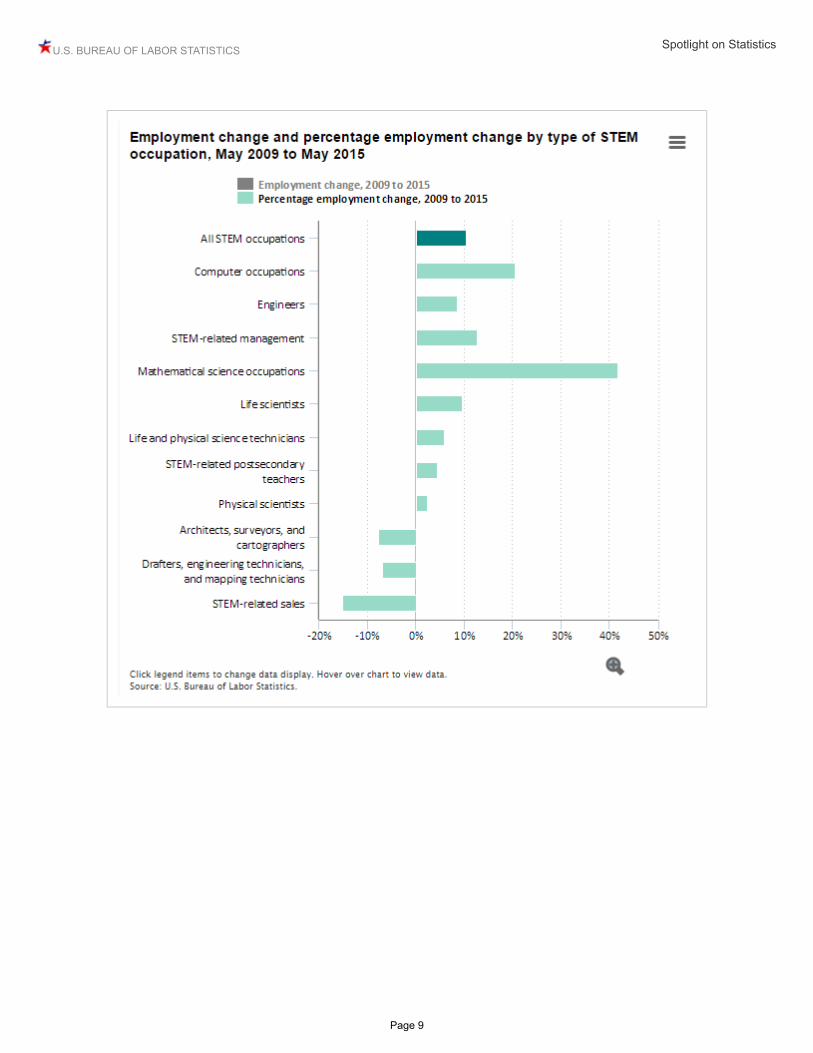
STEM occupations had above-average growthEmployment in STEM occupations grew by 10.5 percent, or 817,260 jobs, between May 2009 and May 2015, compared with 5.2 percent net growth in non-STEM occupations. Computer occupations and engineers were among the types of STEM occupations with the highest job gains. Employment in computer occupations was nearly 3.2 million in May 2009 and nearly 3.9 million in May 2015. Employment of engineers was nearly 1.5 million in May 2009, compared with over 1.6 million in May 2015. Some STEM occupations lost jobs. In 2009, there were nearly 478,000 jobs in STEM-related sales occupations, compared with approximately 406,000 in 2015.
U.S. BUREAU OF LABOR STATISTICS Spotlight on Statistics
Page 8
U.S. BUREAU OF LABOR STATISTICS Spotlight on Statistics
Page 9
U.S. BUREAU OF LABOR STATISTICS Spotlight on Statistics
Page 10
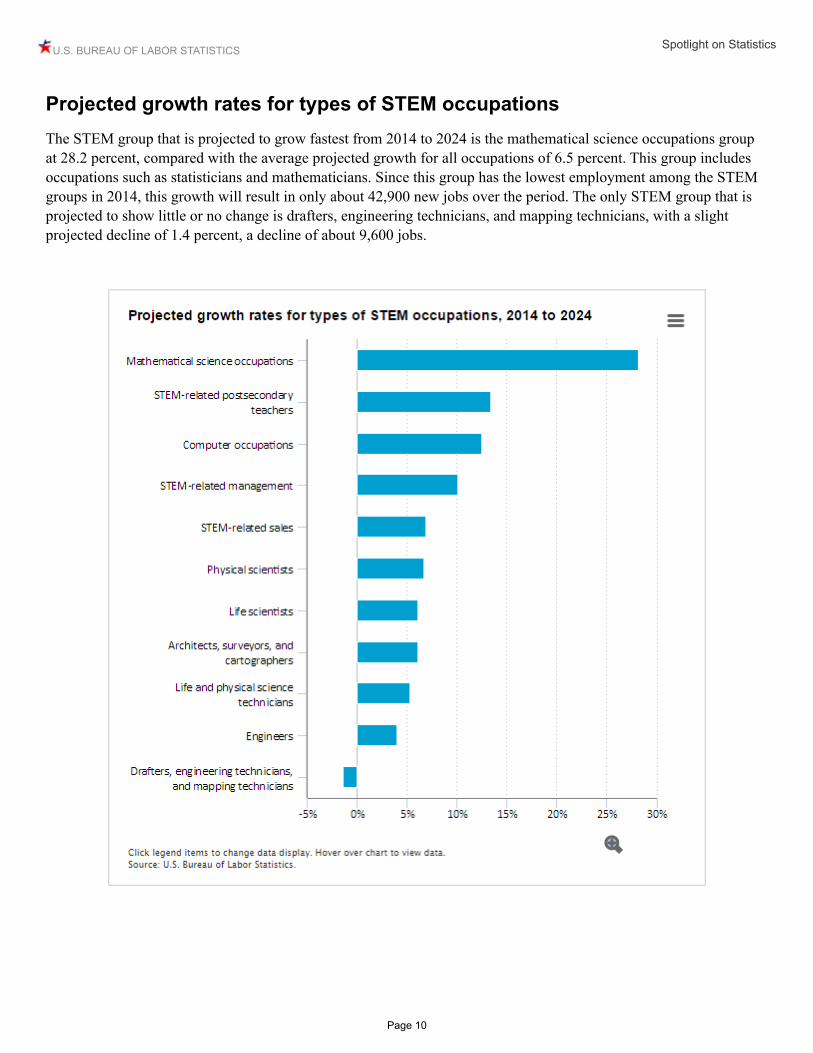
Projected growth rates for types of STEM occupationsThe STEM group that is projected to grow fastest from 2014 to 2024 is the mathematical science occupations group at 28.2 percent, compared with the average projected growth for all occupations of 6.5 percent. This group includes occupations such as statisticians and mathematicians. Since this group has the lowest employment among the STEM groups in 2014, this growth will result in only about 42,900 new jobs over the period. The only STEM group that is projected to show little or no change is drafters, engineering technicians, and mapping technicians, with a slight projected decline of 1.4 percent, a decline of about 9,600 jobs.
U.S. BUREAU OF LABOR STATISTICS Spotlight on Statistics
Page 11
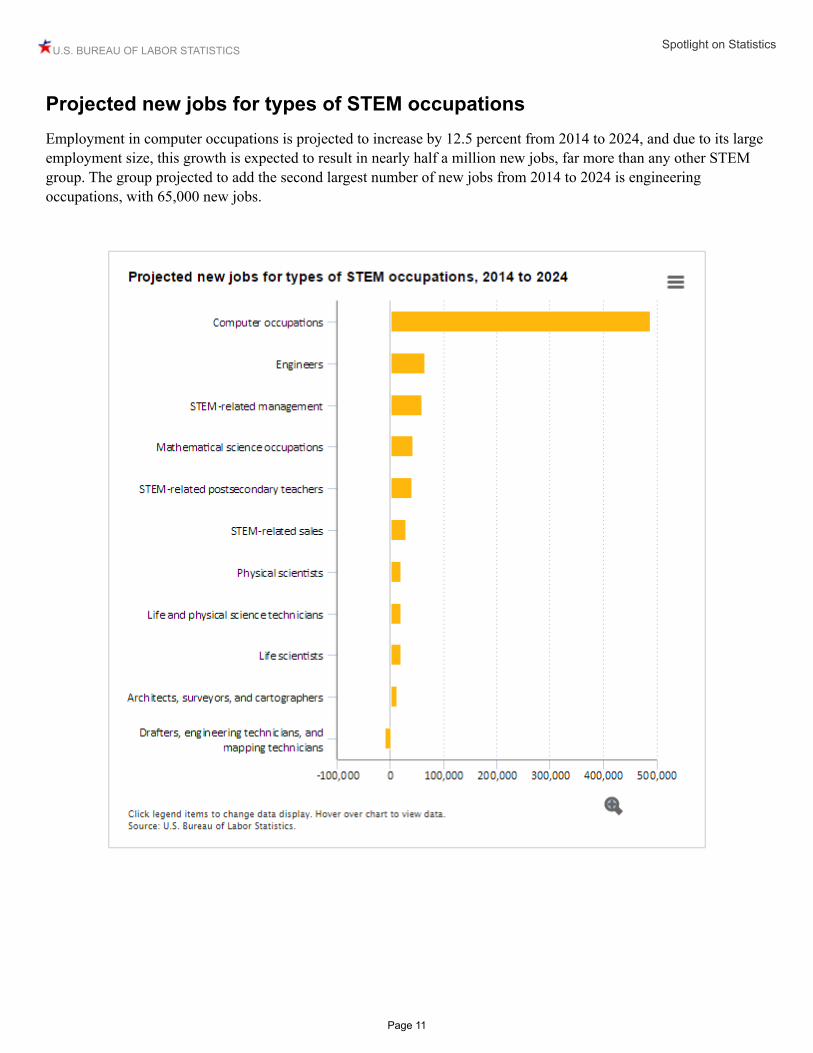
Projected new jobs for types of STEM occupationsEmployment in computer occupations is projected to increase by 12.5 percent from 2014 to 2024, and due to its large employment size, this growth is expected to result in nearly half a million new jobs, far more than any other STEM group. The group projected to add the second largest number of new jobs from 2014 to 2024 is engineering occupations, with 65,000 new jobs.
U.S. BUREAU OF LABOR STATISTICS Spotlight on Statistics
Page 12
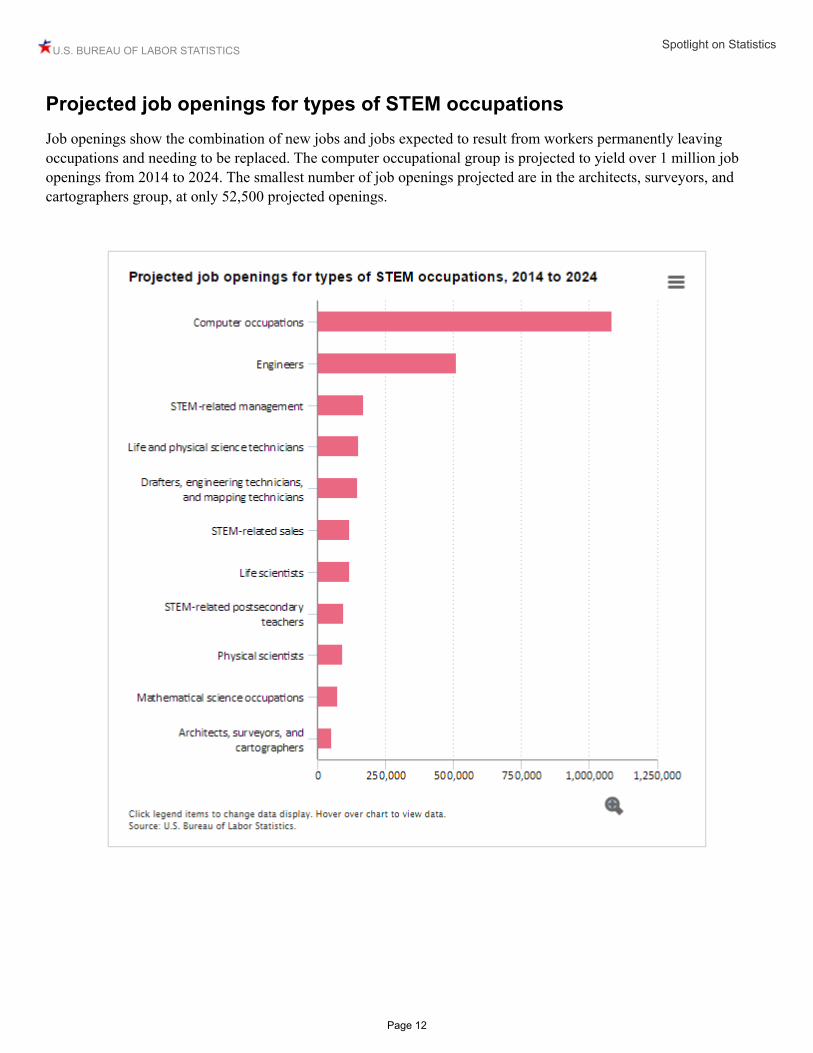
Projected job openings for types of STEM occupationsJob openings show the combination of new jobs and jobs expected to result from workers permanently leaving occupations and needing to be replaced. The computer occupational group is projected to yield over 1 million job openings from 2014 to 2024. The smallest number of job openings projected are in the architects, surveyors, and cartographers group, at only 52,500 projected openings.
U.S. BUREAU OF LABOR STATISTICS Spotlight on Statistics
Page 13
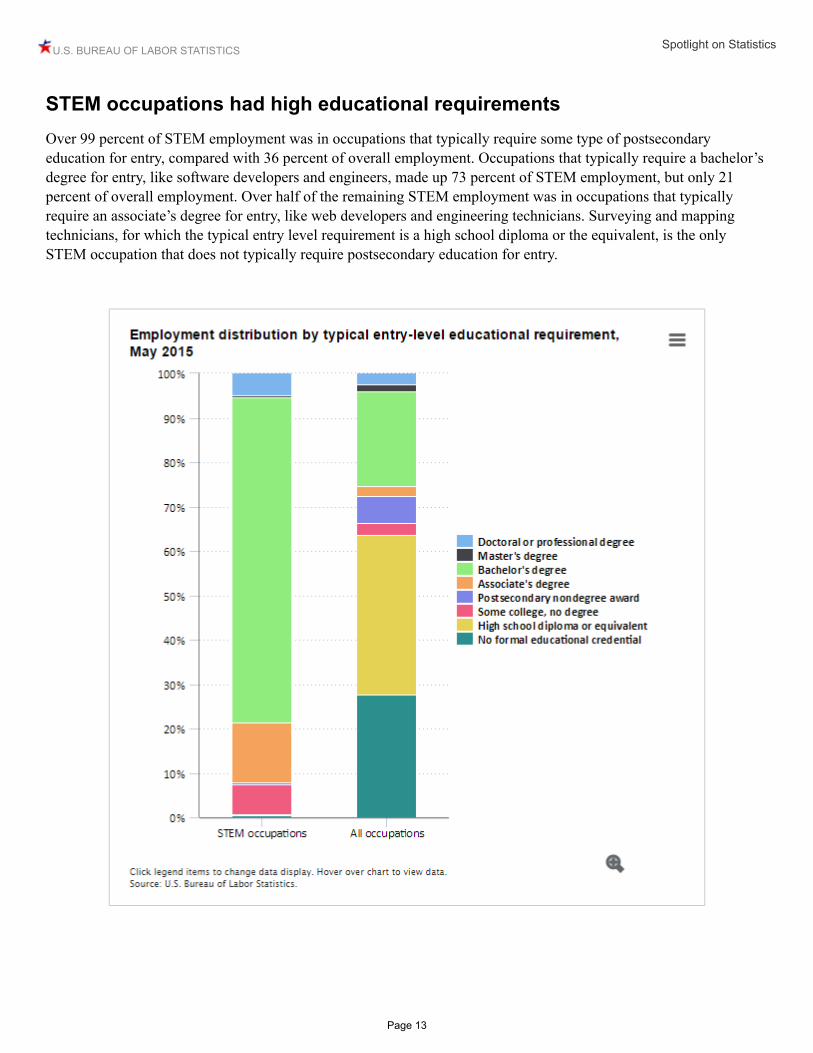
STEM occupations had high educational requirementsOver 99 percent of STEM employment was in occupations that typically require some type of postsecondary education for entry, compared with 36 percent of overall employment. Occupations that typically require a bachelor’s degree for entry, like software developers and engineers, made up 73 percent of STEM employment, but only 21 percent of overall employment. Over half of the remaining STEM employment was in occupations that typically require an associate’s degree for entry, like web developers and engineering technicians. Surveying and mapping technicians, for which the typical entry level requirement is a high school diploma or the equivalent, is the only STEM occupation that does not typically require postsecondary education for entry.
U.S. BUREAU OF LABOR STATISTICS Spotlight on Statistics
Page 14
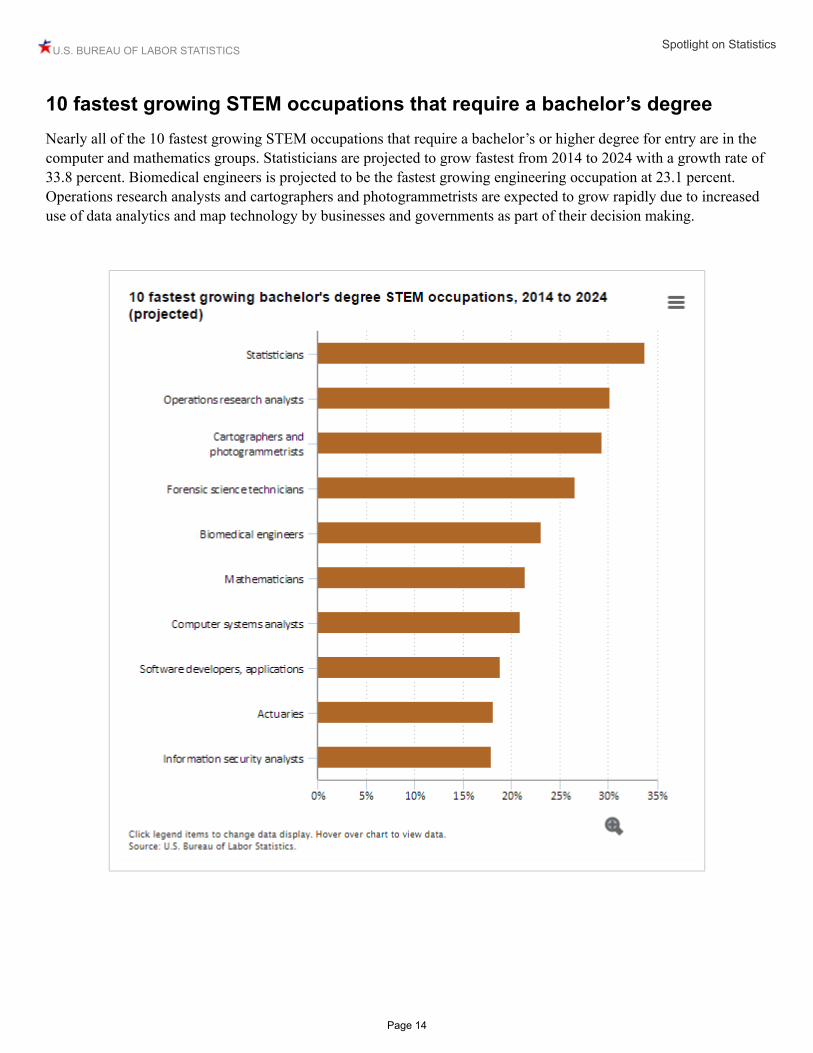
10 fastest growing STEM occupations that require a bachelor’s degreeNearly all of the 10 fastest growing STEM occupations that require a bachelor’s or higher degree for entry are in the computer and mathematics groups. Statisticians are projected to grow fastest from 2014 to 2024 with a growth rate of 33.8 percent. Biomedical engineers is projected to be the fastest growing engineering occupation at 23.1 percent. Operations research analysts and cartographers and photogrammetrists are expected to grow rapidly due to increased use of data analytics and map technology by businesses and governments as part of their decision making.
U.S. BUREAU OF LABOR STATISTICS Spotlight on Statistics
Page 15
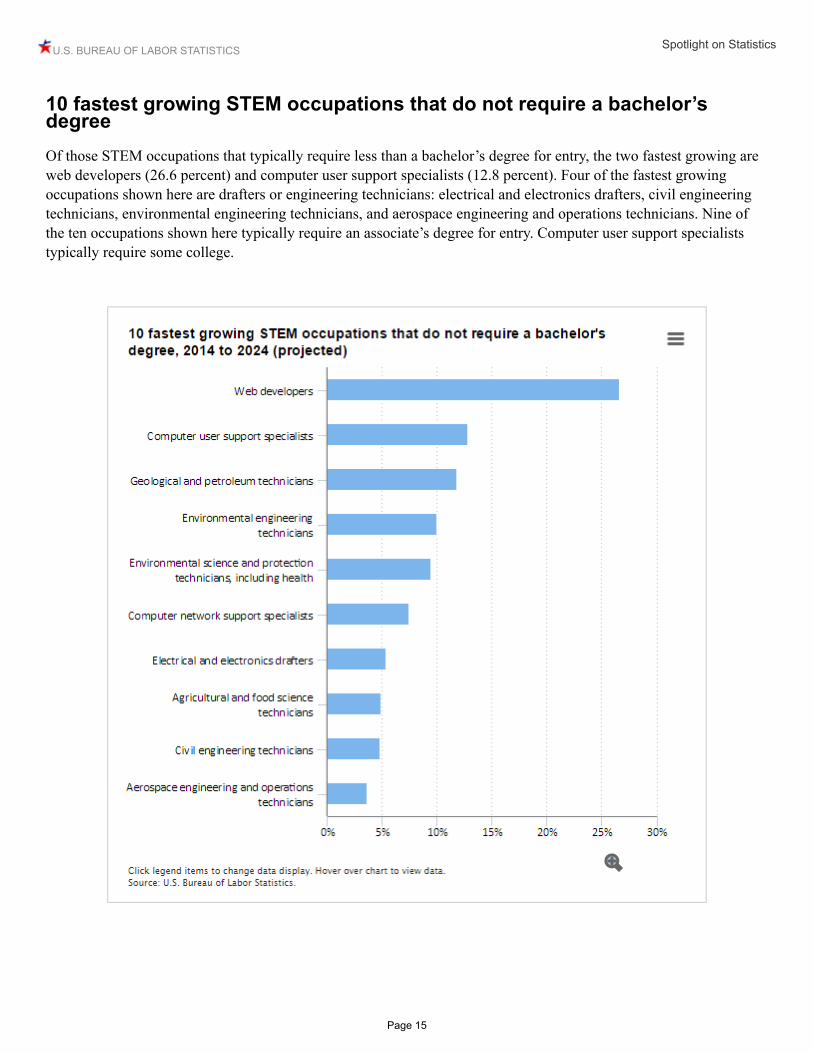
10 fastest growing STEM occupations that do not require a bachelor’s degreeOf those STEM occupations that typically require less than a bachelor’s degree for entry, the two fastest growing are web developers (26.6 percent) and computer user support specialists (12.8 percent). Four of the fastest growing occupations shown here are drafters or engineering technicians: electrical and electronics drafters, civil engineering technicians, environmental engineering technicians, and aerospace engineering and operations technicians. Nine of the ten occupations shown here typically require an associate’s degree for entry. Computer user support specialists typically require some college.
U.S. BUREAU OF LABOR STATISTICS Spotlight on Statistics
Page 16
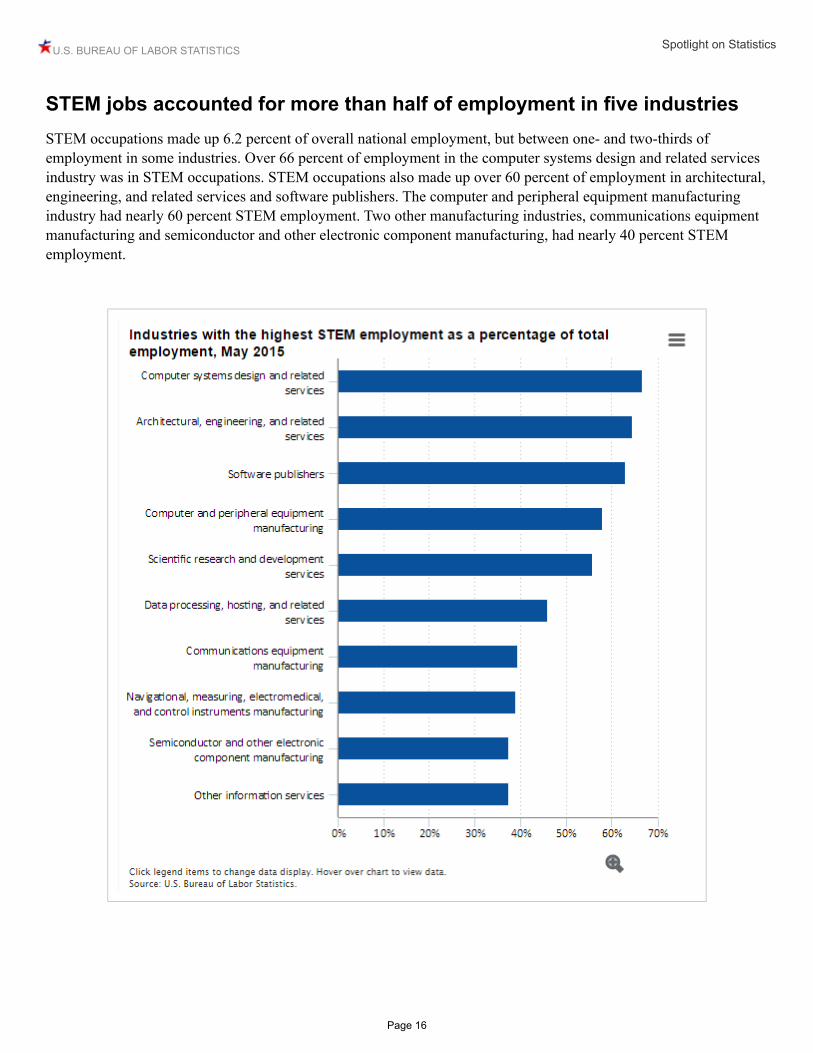
STEM jobs accounted for more than half of employment in five industriesSTEM occupations made up 6.2 percent of overall national employment, but between one- and two-thirds of employment in some industries. Over 66 percent of employment in the computer systems design and related services industry was in STEM occupations. STEM occupations also made up over 60 percent of employment in architectural, engineering, and related services and software publishers. The computer and peripheral equipment manufacturing industry had nearly 60 percent STEM employment. Two other manufacturing industries, communications equipment manufacturing and semiconductor and other electronic component manufacturing, had nearly 40 percent STEM employment.
U.S. BUREAU OF LABOR STATISTICS Spotlight on Statistics
Page 17
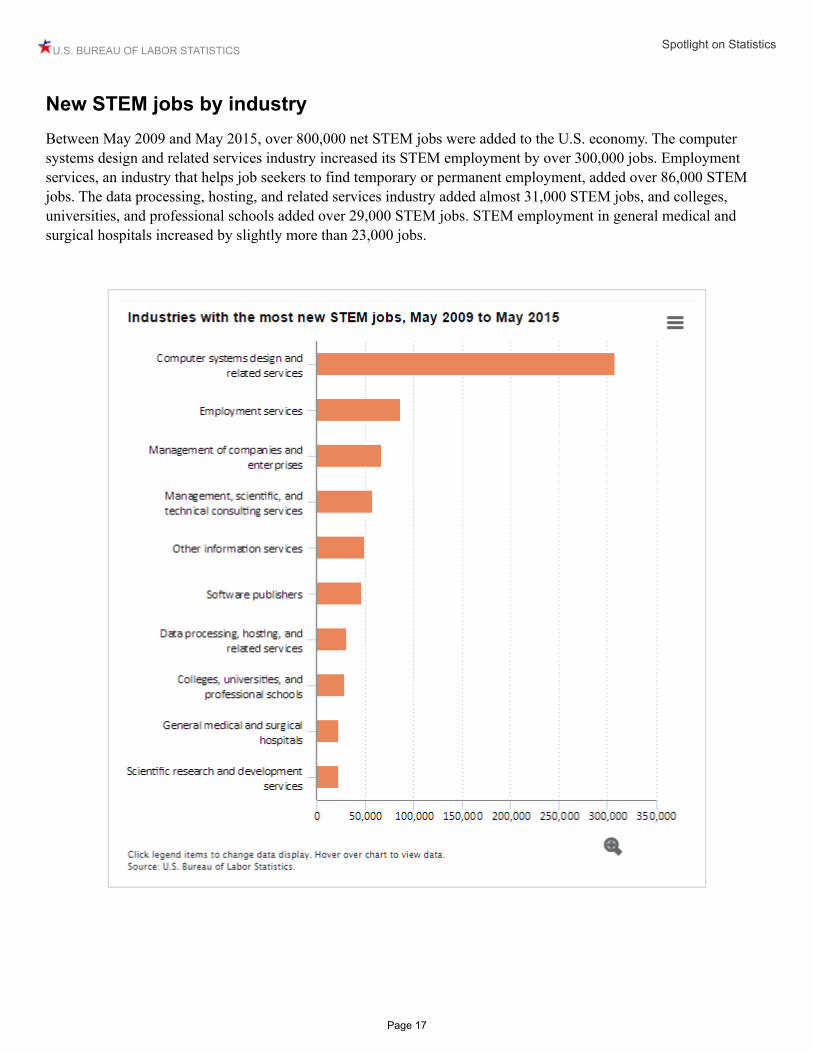
New STEM jobs by industryBetween May 2009 and May 2015, over 800,000 net STEM jobs were added to the U.S. economy. The computer systems design and related services industry increased its STEM employment by over 300,000 jobs. Employment services, an industry that helps job seekers to find temporary or permanent employment, added over 86,000 STEM jobs. The data processing, hosting, and related services industry added almost 31,000 STEM jobs, and colleges, universities, and professional schools added over 29,000 STEM jobs. STEM employment in general medical and surgical hospitals increased by slightly more than 23,000 jobs.
U.S. BUREAU OF LABOR STATISTICS Spotlight on Statistics
Page 18
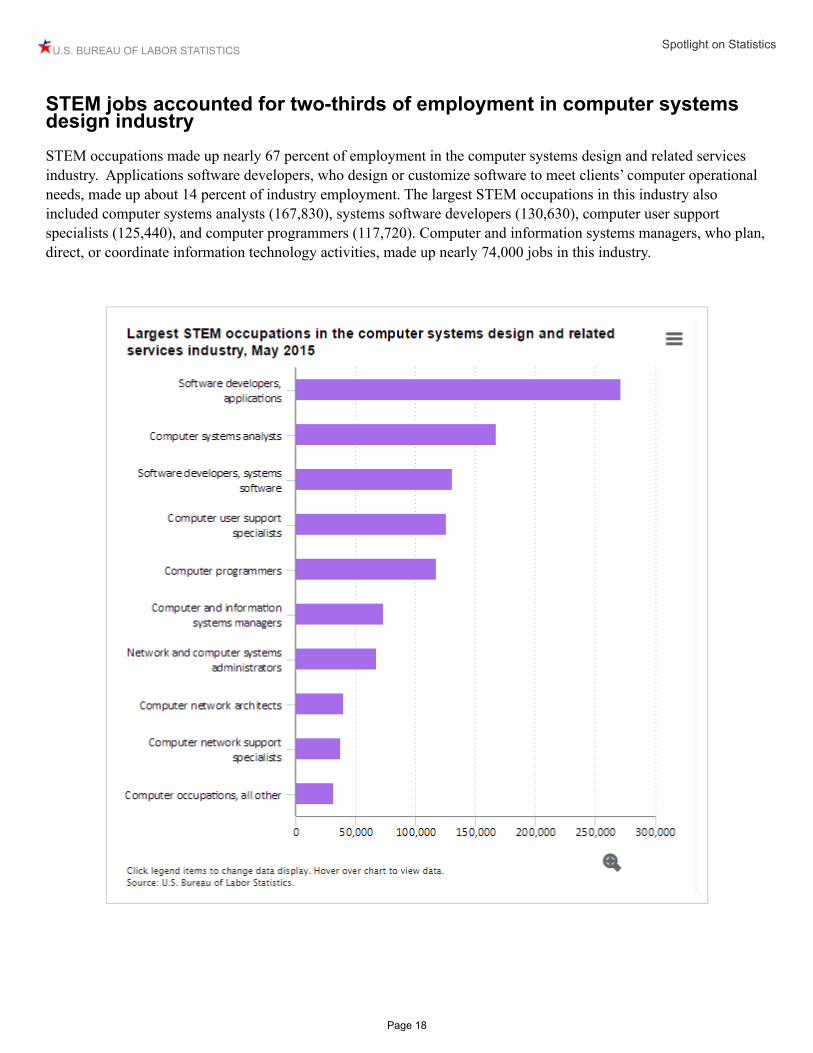
STEM jobs accounted for two-thirds of employment in computer systems design industrySTEM occupations made up nearly 67 percent of employment in the computer systems design and related services industry. Applications software developers, who design or customize software to meet clients’ computer operational needs, made up about 14 percent of industry employment. The largest STEM occupations in this industry also included computer systems analysts (167,830), systems software developers (130,630), computer user support specialists (125,440), and computer programmers (117,720). Computer and information systems managers, who plan, direct, or coordinate information technology activities, made up nearly 74,000 jobs in this industry.
U.S. BUREAU OF LABOR STATISTICS Spotlight on Statistics
Page 19
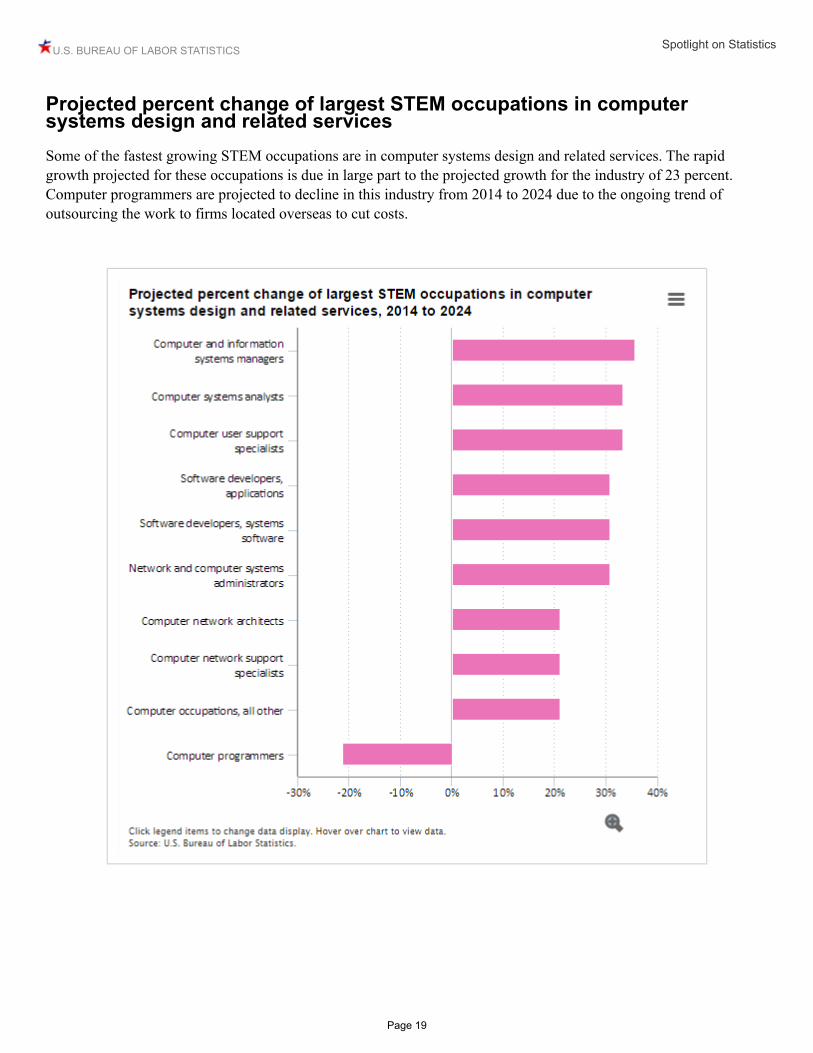
Projected percent change of largest STEM occupations in computer systems design and related servicesSome of the fastest growing STEM occupations are in computer systems design and related services. The rapid growth projected for these occupations is due in large part to the projected growth for the industry of 23 percent. Computer programmers are projected to decline in this industry from 2014 to 2024 due to the ongoing trend of outsourcing the work to firms located overseas to cut costs.
U.S. BUREAU OF LABOR STATISTICS Spotlight on Statistics
Page 20
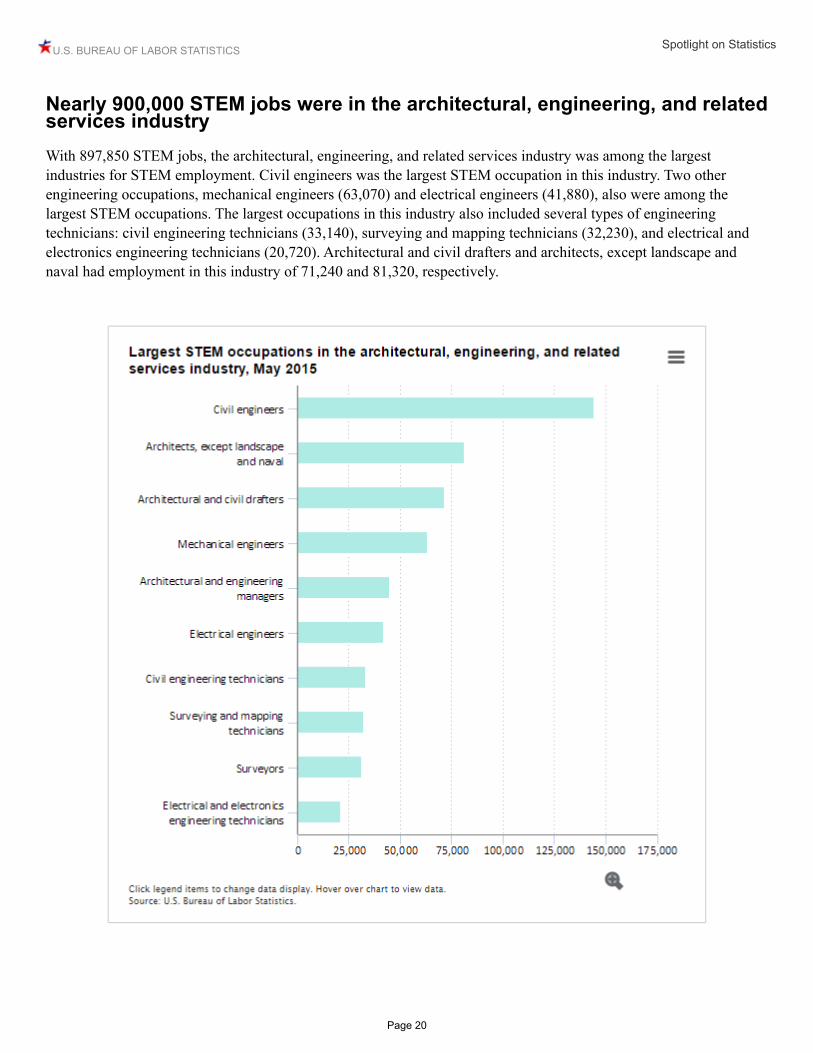
Nearly 900,000 STEM jobs were in the architectural, engineering, and related services industryWith 897,850 STEM jobs, the architectural, engineering, and related services industry was among the largest industries for STEM employment. Civil engineers was the largest STEM occupation in this industry. Two other engineering occupations, mechanical engineers (63,070) and electrical engineers (41,880), also were among the largest STEM occupations. The largest occupations in this industry also included several types of engineering technicians: civil engineering technicians (33,140), surveying and mapping technicians (32,230), and electrical and electronics engineering technicians (20,720). Architectural and civil drafters and architects, except landscape and naval had employment in this industry of 71,240 and 81,320, respectively.
U.S. BUREAU OF LABOR STATISTICS Spotlight on Statistics
Page 21
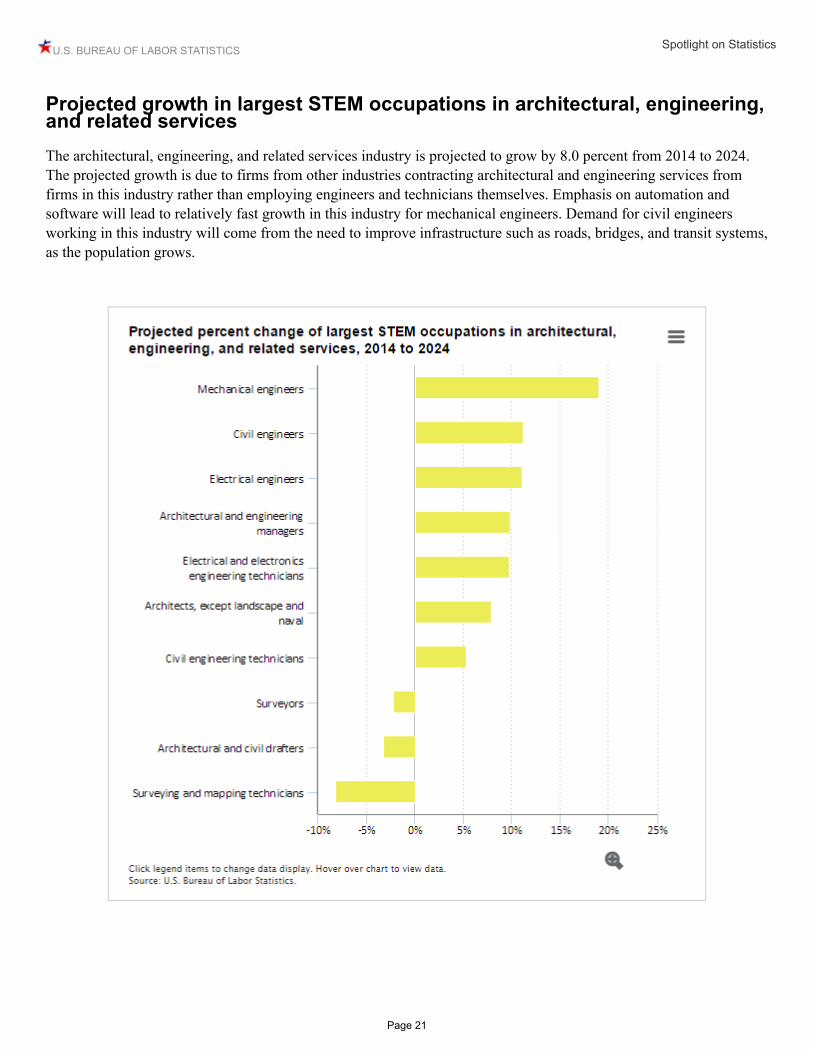
Projected growth in largest STEM occupations in architectural, engineering, and related servicesThe architectural, engineering, and related services industry is projected to grow by 8.0 percent from 2014 to 2024. The projected growth is due to firms from other industries contracting architectural and engineering services from firms in this industry rather than employing engineers and technicians themselves. Emphasis on automation and software will lead to relatively fast growth in this industry for mechanical engineers. Demand for civil engineers working in this industry will come from the need to improve infrastructure such as roads, bridges, and transit systems, as the population grows.
U.S. BUREAU OF LABOR STATISTICS Spotlight on Statistics
Page 22
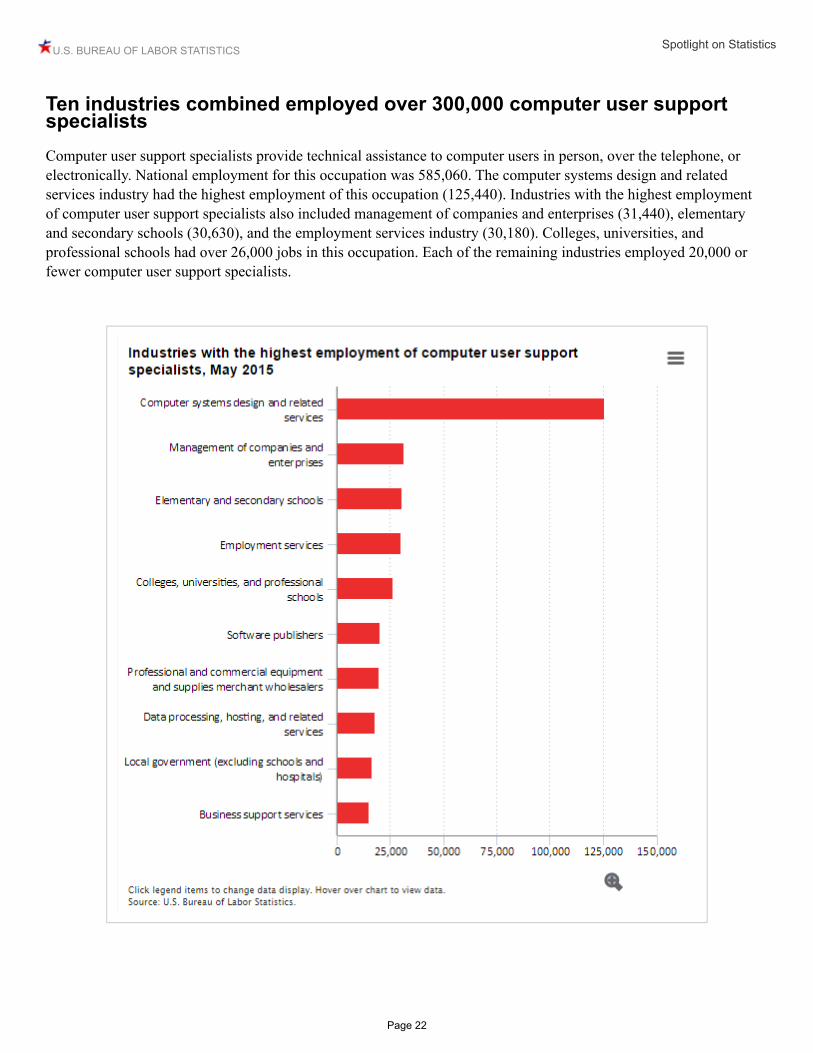
Ten industries combined employed over 300,000 computer user support specialistsComputer user support specialists provide technical assistance to computer users in person, over the telephone, or electronically. National employment for this occupation was 585,060. The computer systems design and related services industry had the highest employment of this occupation (125,440). Industries with the highest employment of computer user support specialists also included management of companies and enterprises (31,440), elementary and secondary schools (30,630), and the employment services industry (30,180). Colleges, universities, and professional schools had over 26,000 jobs in this occupation. Each of the remaining industries employed 20,000 or fewer computer user support specialists.
U.S. BUREAU OF LABOR STATISTICS Spotlight on Statistics
Page 23
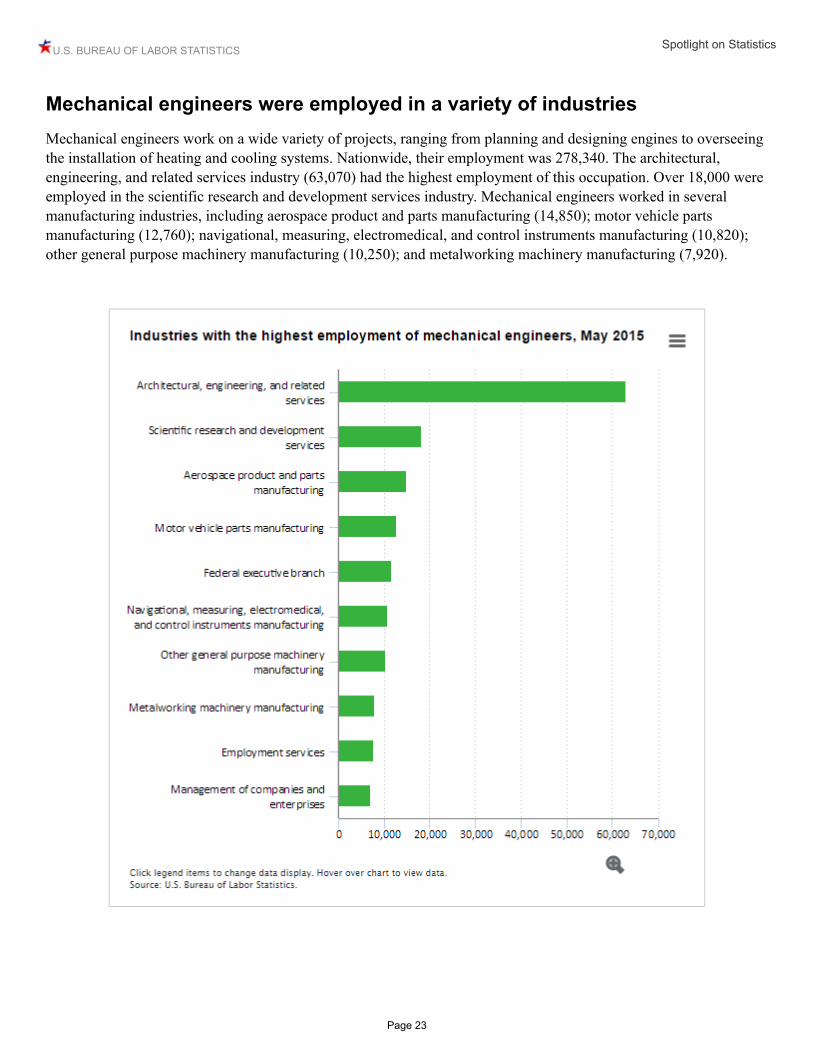
Mechanical engineers were employed in a variety of industriesMechanical engineers work on a wide variety of projects, ranging from planning and designing engines to overseeing the installation of heating and cooling systems. Nationwide, their employment was 278,340. The architectural, engineering, and related services industry (63,070) had the highest employment of this occupation. Over 18,000 were employed in the scientific research and development services industry. Mechanical engineers worked in several manufacturing industries, including aerospace product and parts manufacturing (14,850); motor vehicle parts manufacturing (12,760); navigational, measuring, electromedical, and control instruments manufacturing (10,820); other general purpose machinery manufacturing (10,250); and metalworking machinery manufacturing (7,920).
U.S. BUREAU OF LABOR STATISTICS Spotlight on Statistics
Page 24
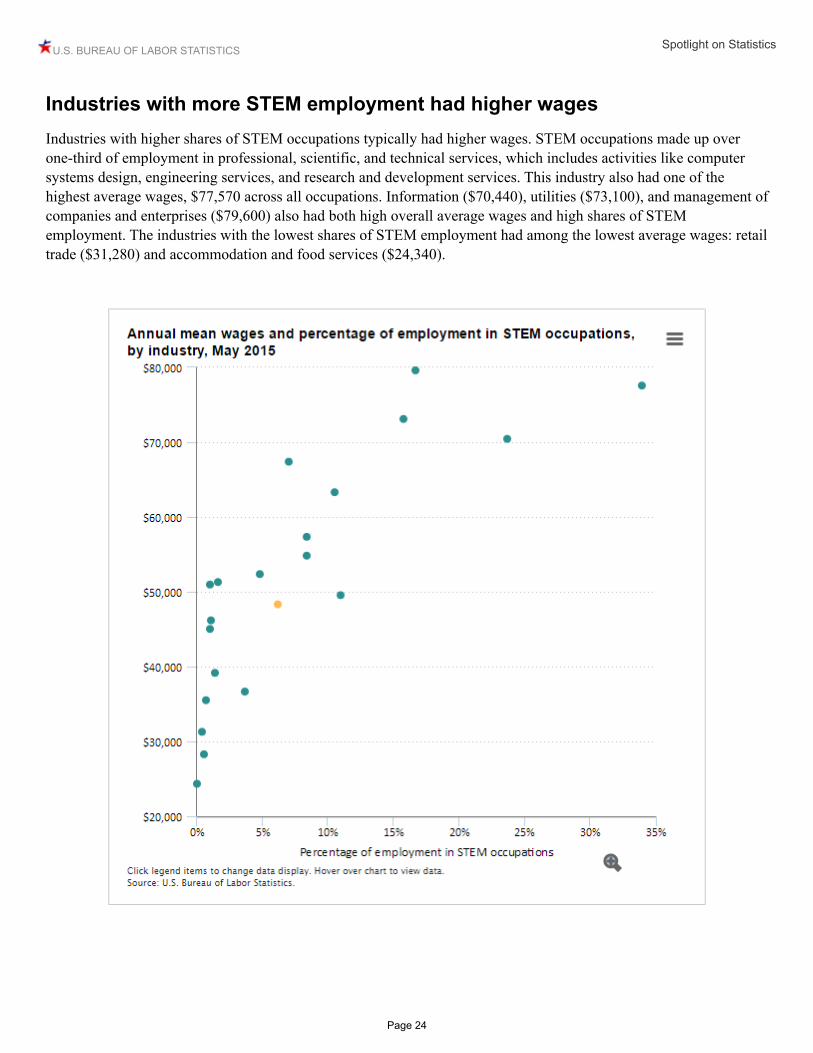
Industries with more STEM employment had higher wagesIndustries with higher shares of STEM occupations typically had higher wages. STEM occupations made up over one-third of employment in professional, scientific, and technical services, which includes activities like computer systems design, engineering services, and research and development services. This industry also had one of the highest average wages, $77,570 across all occupations. Information ($70,440), utilities ($73,100), and management of companies and enterprises ($79,600) also had both high overall average wages and high shares of STEM employment. The industries with the lowest shares of STEM employment had among the lowest average wages: retail trade ($31,280) and accommodation and food services ($24,340).
U.S. BUREAU OF LABOR STATISTICS Spotlight on Statistics
Page 25
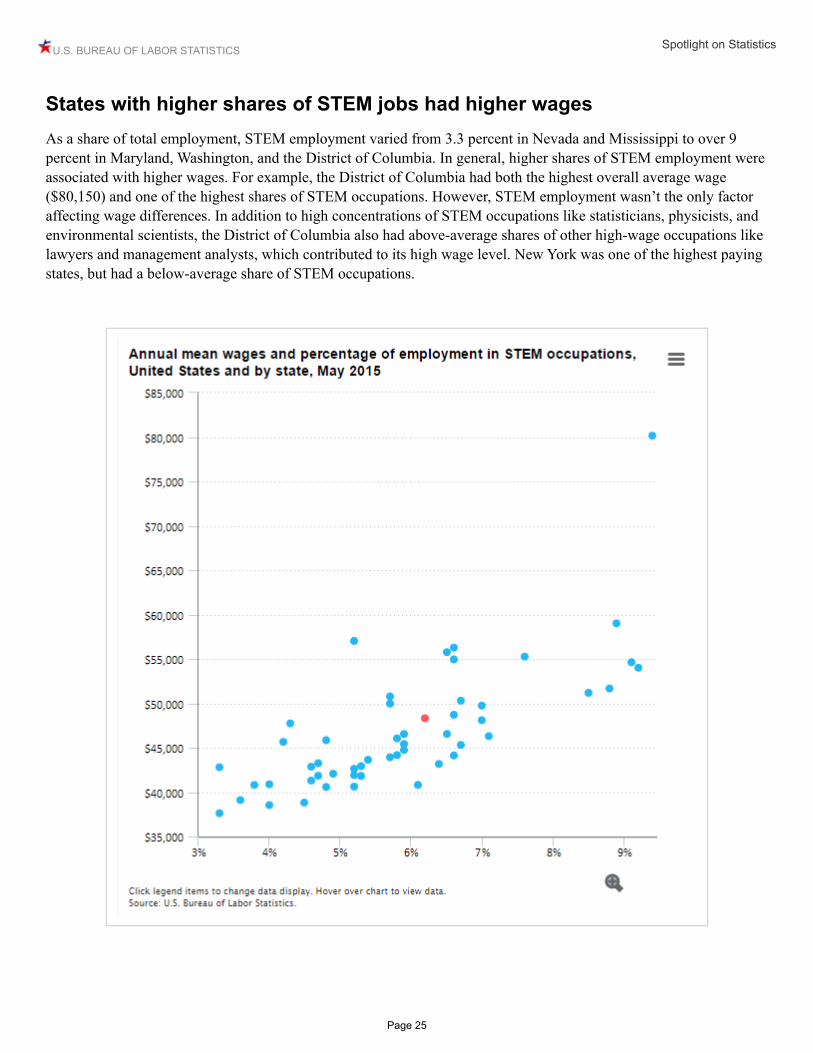
States with higher shares of STEM jobs had higher wagesAs a share of total employment, STEM employment varied from 3.3 percent in Nevada and Mississippi to over 9 percent in Maryland, Washington, and the District of Columbia. In general, higher shares of STEM employment were associated with higher wages. For example, the District of Columbia had both the highest overall average wage ($80,150) and one of the highest shares of STEM occupations. However, STEM employment wasn’t the only factor affecting wage differences. In addition to high concentrations of STEM occupations like statisticians, physicists, and environmental scientists, the District of Columbia also had above-average shares of other high-wage occupations like lawyers and management analysts, which contributed to its high wage level. New York was one of the highest paying states, but had a below-average share of STEM occupations.

U.S. BUREAU OF LABOR STATISTICS Spotlight on Statistics
Page 26
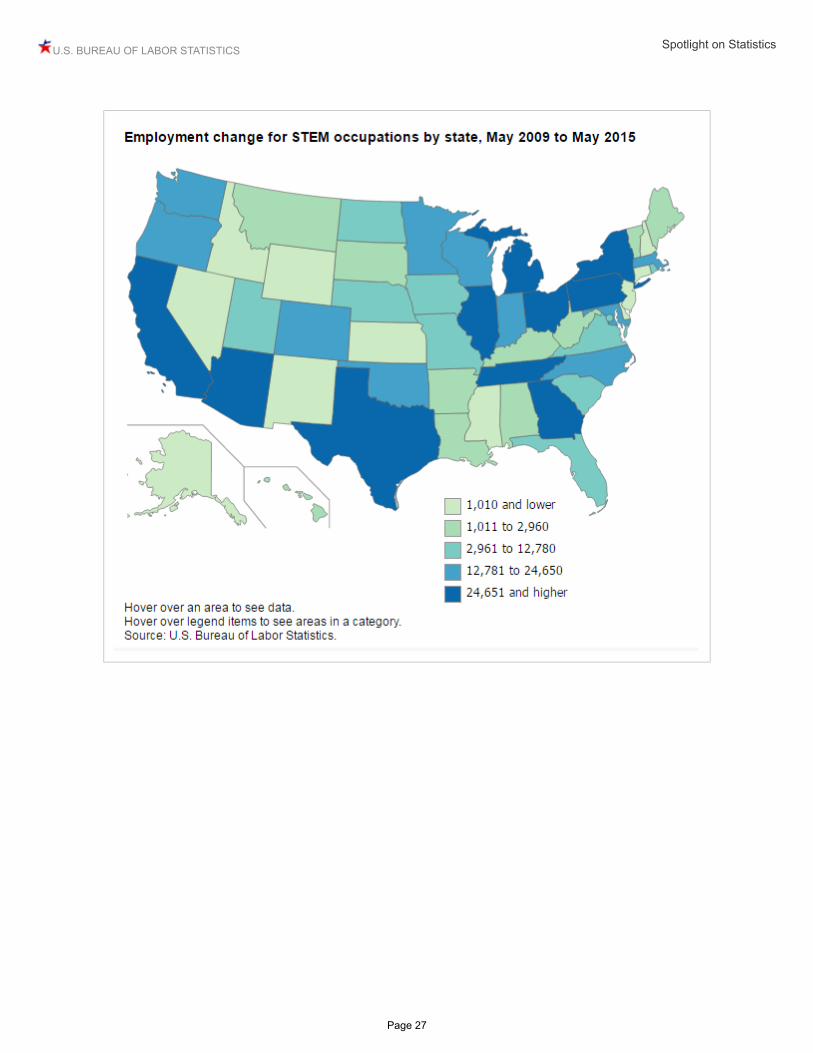
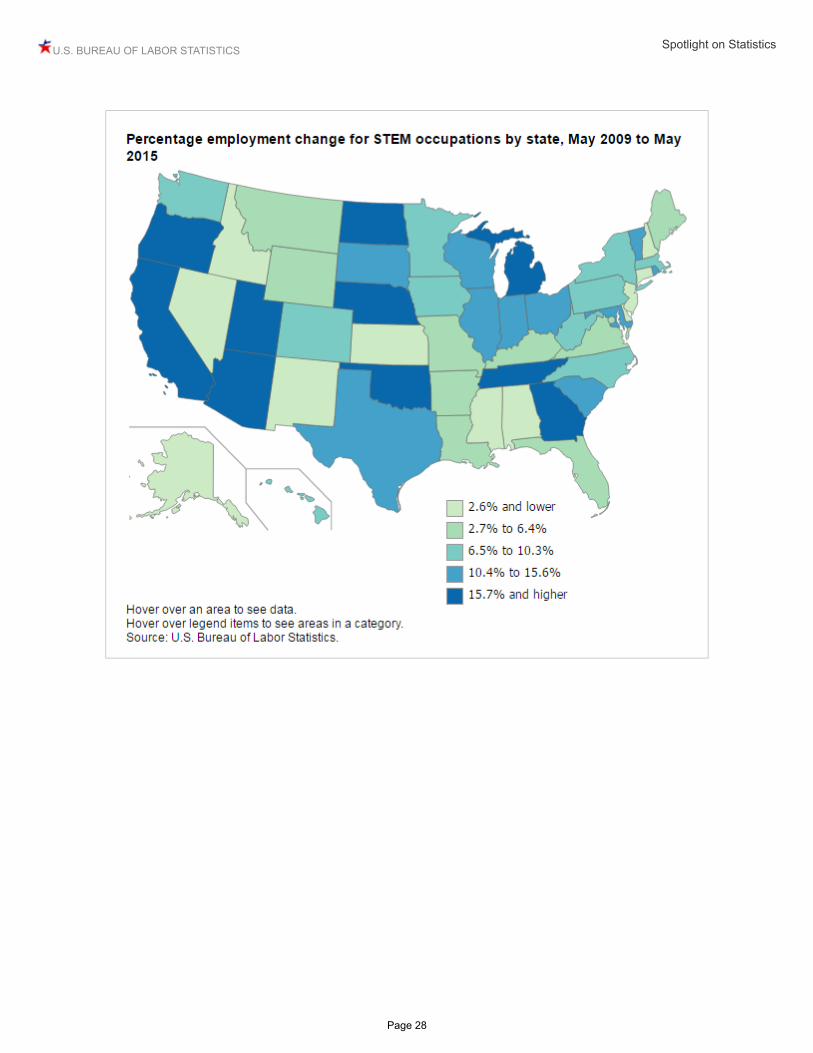
California added nearly 161,000 STEM jobs since 2009Between May 2009 and May 2015, states that added the largest numbers of STEM jobs included California (160,950), Texas (102,190), New York (42,980), and Michigan (41,100). Several states had STEM employment growth of more than 20 percent, compared with national STEM employment growth of 10.5 percent. These states included North Dakota (26 percent), Tennessee (25 percent), and Oklahoma (24 percent).
U.S. BUREAU OF LABOR STATISTICS Spotlight on Statistics
Page 27
U.S. BUREAU OF LABOR STATISTICS Spotlight on Statistics
Page 28
U.S. BUREAU OF LABOR STATISTICS Spotlight on Statistics
Page 29
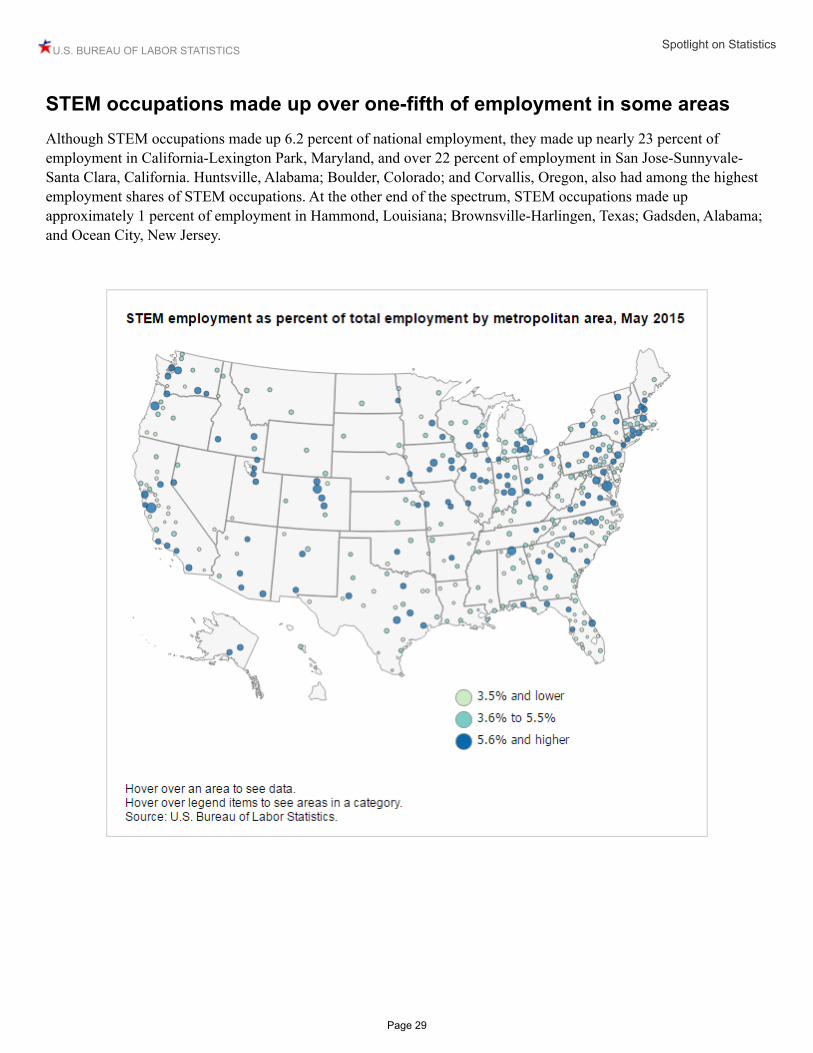
STEM occupations made up over one-fifth of employment in some areasAlthough STEM occupations made up 6.2 percent of national employment, they made up nearly 23 percent of employment in California-Lexington Park, Maryland, and over 22 percent of employment in San Jose-Sunnyvale-Santa Clara, California. Huntsville, Alabama; Boulder, Colorado; and Corvallis, Oregon, also had among the highest employment shares of STEM occupations. At the other end of the spectrum, STEM occupations made up approximately 1 percent of employment in Hammond, Louisiana; Brownsville-Harlingen, Texas; Gadsden, Alabama; and Ocean City, New Jersey.
U.S. BUREAU OF LABOR STATISTICS Spotlight on Statistics
Page 30
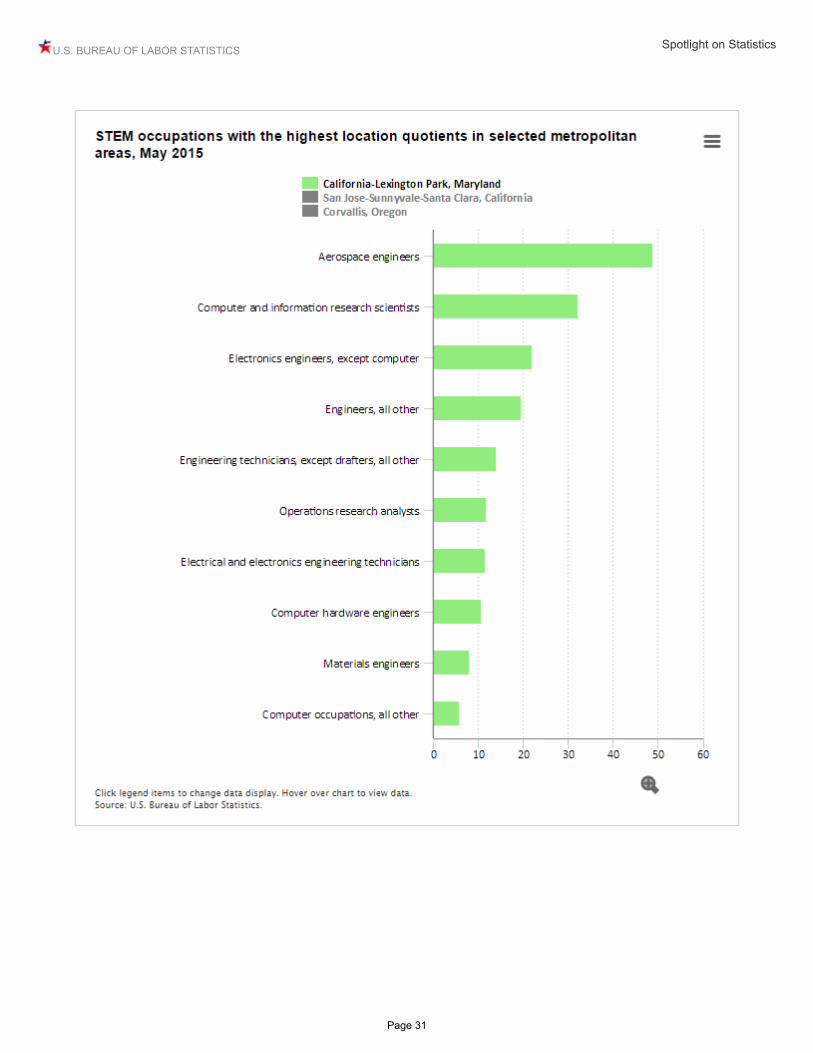
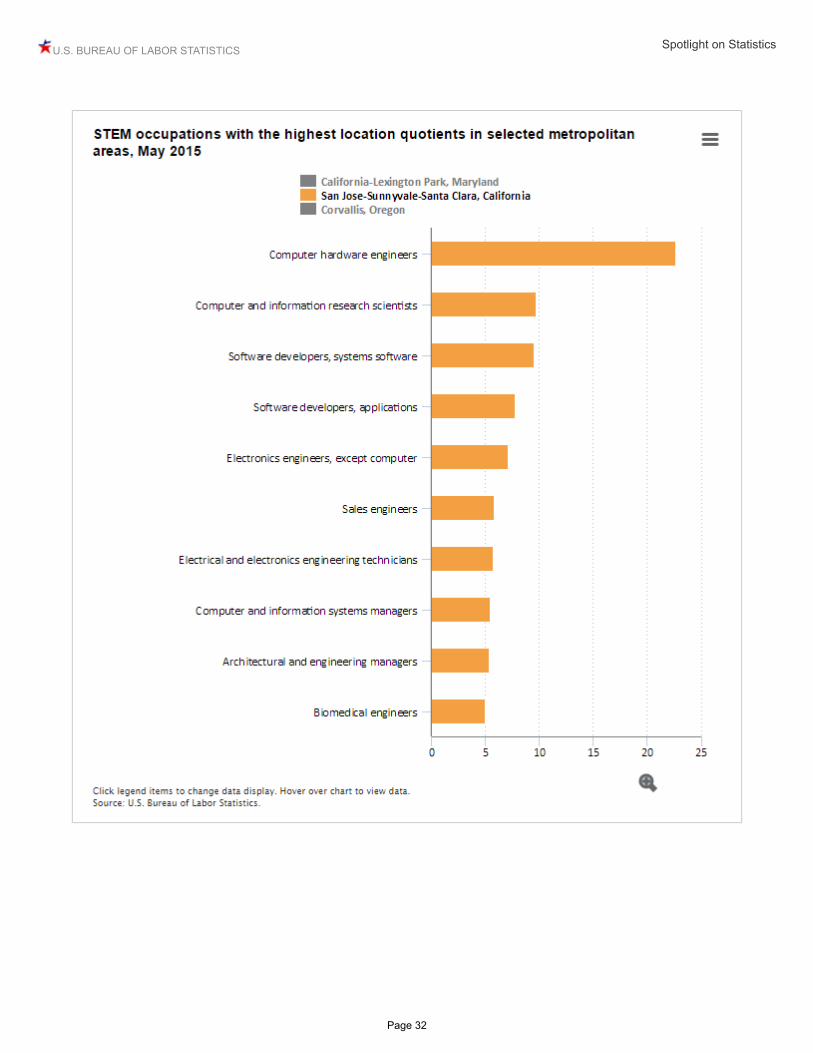
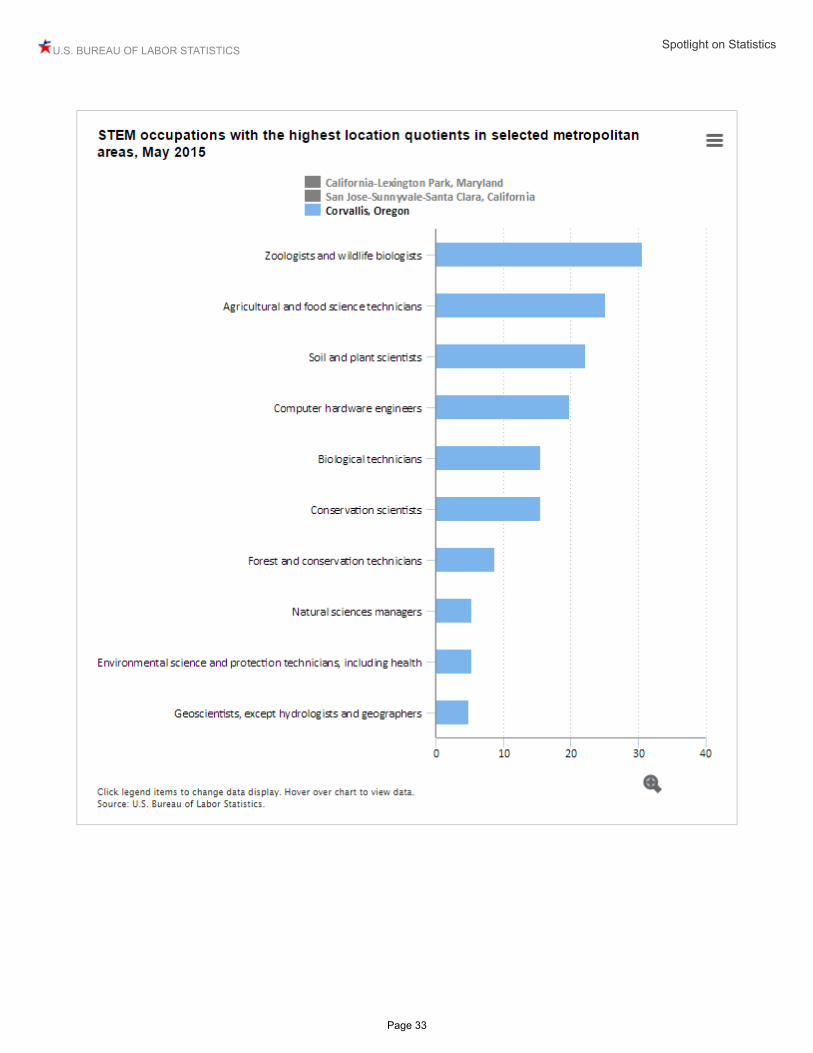
STEM employment patterns differed by areaAmong metropolitan areas with high shares of STEM employment, the specific STEM occupations that were prevalent differed. As a share of total employment, California-Lexington Park, Maryland, had nearly 49 times as many aerospace engineers as the United States as a whole, as well as high concentrations of several other types of engineers and engineering technicians. San Jose-Sunnyvale-Santa Clara, California, had high concentrations of occupations related to computers and information technology, such as computer hardware engineers, computer and information research scientists, and software developers. Corvallis, Oregon, had high shares of occupations related to conservation, wildlife, and agriculture, including zoologists and wildlife biologists, agricultural and food science technicians, and soil and plant scientists.
U.S. BUREAU OF LABOR STATISTICS Spotlight on Statistics
Page 31
U.S. BUREAU OF LABOR STATISTICS Spotlight on Statistics
Page 32
U.S. BUREAU OF LABOR STATISTICS Spotlight on Statistics
Page 33
U.S. BUREAU OF LABOR STATISTICS Spotlight on Statistics
Page 34
For more informationStella Fayer and Audrey Watson are economists in the Division of Occupational Employment Statistics, U.S. Bureau of Labor Statistics. Email: [email protected] and [email protected]. Alan Lacey is an economist in the Division of Occupational Employment Projections, U.S. Bureau of Labor Statistics. Email: [email protected].
This Spotlight on Statistics presents May 2015 estimates from the Occupational Employment Statistics (OES) survey and 2014-2024 employment projections from the Employment Projections (EP) program.
Occupational Employment Statistics estimates are published annually and measure occupational employment and wage rates for over 800 occupations for the nation, states, and nearly 600 metropolitan and nonmetropolitan areas; and for more than 460 industry classifications at the national level. The survey covers wage and salary workers in nonfarm establishments and does not include the self-employed and owners, partners, and proprietors of unincorporated businesses. More information about the OES survey is available at www.bls.gov/oes/oes_ques.htm and in the technical documentation at www.bls.gov/oes/oes_doc.htm. Publicly available data are at www.bls.gov/oes/.
The Employment Projections (EP) program develops industry and occupation employment projections at the national level for over 800 occupations and over 300 industries. The projections are released every two years and are 10-year projections. EP also develops the Occupational Outlook Handbook (OOH), the federal government’s principal career guidance publication. The OOH includes information about job duties, education and training, and career outlook for hundreds of occupations. More information about EP and detailed projections data are available at www.bls.gov/emp. The OOH is available online at www.bls.gov/ooh.
This Spotlight uses one of many possible definitions of STEM occupations. "STEM" is defined in this Spotlight to consist of 100 occupations, including computer and mathematical, architecture and engineering, and life and physical science occupations, as well as managerial and postsecondary teaching occupations related to these functional areas and sales occupations requiring scientific or technical knowledge at the postsecondary level. A list of occupations included in the STEM definition used for this Spotlight is available at www.bls.gov/oes/stem_list.xlsx. Guidance on alternative definitions can be found at www.bls.gov/soc/home.htm#crosswalks. The STEM data used in this Spotlight are available as a downloadable XLSX spreadsheet at www.bls.gov/oes/additional.htm.
Although this Spotlight presents selected 2009-2015 employment comparisons using the Occupational Employment Statistics data, OES data are not designed for making comparisons through time, and such comparisons should be interpreted with caution. More information on OES data and time series analysis is available in frequently asked question F.1 at www.bls.gov/oes/oes_ques.htm#other.
Data on employment by the typical education level needed to enter an occupation are based on education and training categories from the BLS Employment Projections program. For detailed definitions of these education and training categories, see www.bls.gov/emp/ep_nem_definitions.htm#education. Education and training levels assigned to each occupation are available at www.bls.gov/emp/ep_table_112.htm.
Location quotients are the ratio of an occupation’s employment share in a state or area to its national share. For example, an occupation that makes up 6 percent of state employment and 2 percent of national employment would have a location quotient in that state of 6/2 = 3. A location quotient greater than 1 means the occupation has a higher share of state or area employment than the national average.
More information on STEM occupations is also available in the following articles and publications:

U.S. BUREAU OF LABOR STATISTICS Spotlight on Statistics
Page 35
• May 2014 STEM featured charts• An overview of employment and wages in science, technology, engineering, and math (STEM) groups, Beyond the Numbers, April 2014• Science, technology, engineering, and mathematics (STEM) occupations: a visual essay, Monthly Labor Review, May 2011• STEM 101: Intro to tomorrow’s jobs, Career Outlook, March 2014• Occupational Outlook Handbook (OOH)
Recommended