STUDENT SUCCESS AND ACHIEVEMENT
Lawson State Community College measures student success and achievement with respect to its mission.
Lawson State Community College is a comprehensive, diverse, public, two-year, multi-campus college,
which seeks to provide accessible quality educational opportunities, promote economic growth and
enhance the quality of life for people in its service area. The College is dedicated to providing affordable
and accessible lifelong learning opportunities through varied instructional modes in order to prepare
students for employment or career advancement, enable students to transfer to senior colleges and
universities, and provide customized training for business and industry.
To this end, the college documents successful student achievement in relation to its mission by
monitoring measures such as course completion rates, state licensing examinations, and job placement
rates. The college employs an array of methods to analyze its success in relation to its stated mission. The
institution has established internal benchmarks and benchmarks itself against peer institutions.
The following goals exist for student success and achievement:
1. To achieve a 70% successful course completion rate annually.
2. To have a fall-to-fall retention rate of a minimum of 42%.
3. To have a transfer rate of a minimum of 55%.
4. To maintain a licensure rate of a minimum of 80%.
5. To have a job placement rate annually, no less than 10% below or at the state target level.
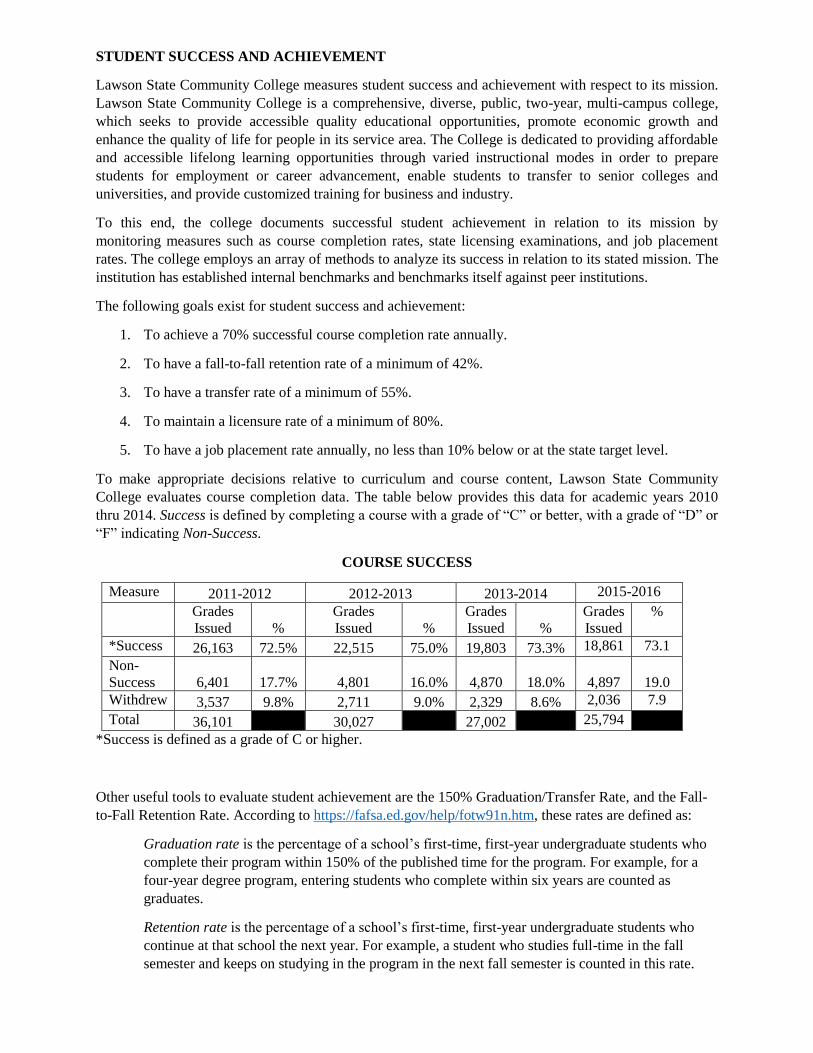
To make appropriate decisions relative to curriculum and course content, Lawson State Community
College evaluates course completion data. The table below provides this data for academic years 2010
thru 2014. Success is defined by completing a course with a grade of “C” or better, with a grade of “D” or
“F” indicating Non-Success.
COURSE SUCCESS
Measure 2011-2012 2012-2013 2013-2014 2015-2016
Grades
Issued %
Grades
Issued %
Grades
Issued %
Grades
Issued
%
*Success 26,163 72.5% 22,515 75.0% 19,803 73.3% 18,861 73.1
Non-
Success 6,401 17.7% 4,801 16.0% 4,870 18.0%
4,897
19.0
Withdrew 3,537 9.8% 2,711 9.0% 2,329 8.6% 2,036 7.9
Total 36,101
30,027
27,002
25,794
*Success is defined as a grade of C or higher.
Other useful tools to evaluate student achievement are the 150% Graduation/Transfer Rate, and the Fall-
to-Fall Retention Rate. According to https://fafsa.ed.gov/help/fotw91n.htm, these rates are defined as:
Graduation rate is the percentage of a school’s first-time, first-year undergraduate students who
complete their program within 150% of the published time for the program. For example, for a
four-year degree program, entering students who complete within six years are counted as
graduates.
Retention rate is the percentage of a school’s first-time, first-year undergraduate students who
continue at that school the next year. For example, a student who studies full-time in the fall
semester and keeps on studying in the program in the next fall semester is counted in this rate.
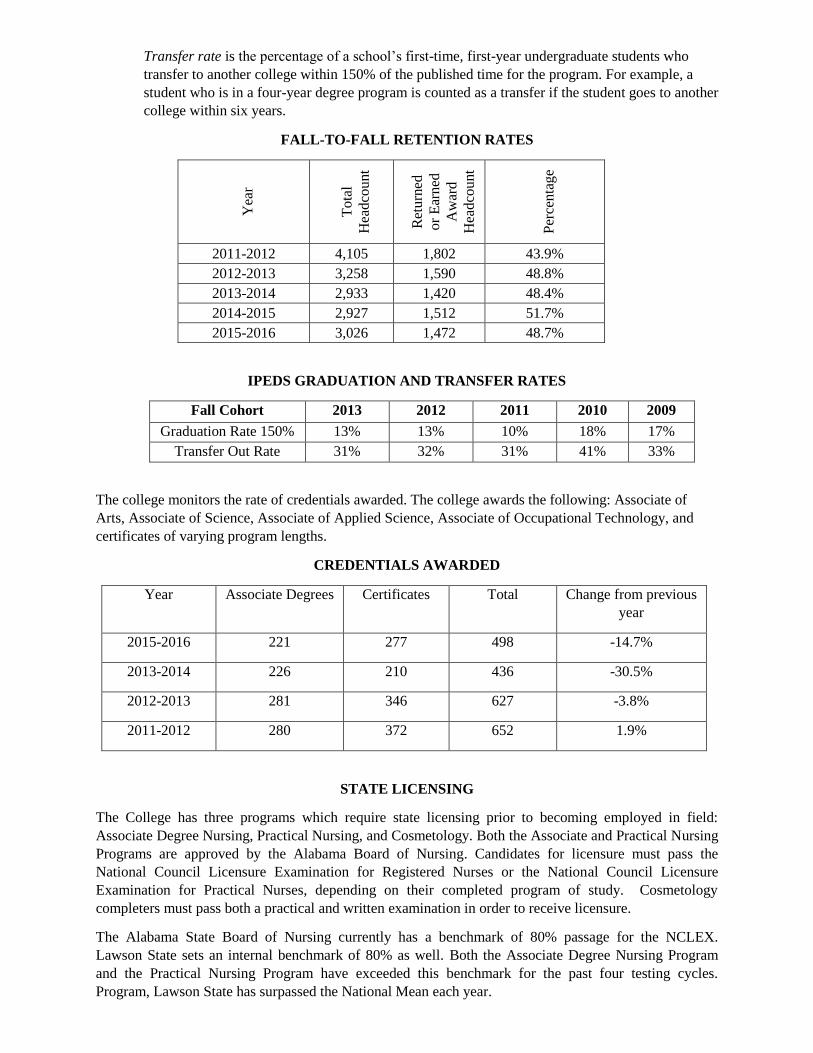
Transfer rate is the percentage of a school’s first-time, first-year undergraduate students who
transfer to another college within 150% of the published time for the program. For example, a
student who is in a four-year degree program is counted as a transfer if the student goes to another
college within six years.
FALL-TO-FALL RETENTION RATES
Yea
r
To
tal
Hea
dco
unt
Ret
urn
ed
or
Ear
ned
Aw
ard
Hea
dco
unt
Per
cen
tag
e
2011-2012 4,105 1,802 43.9%
2012-2013 3,258 1,590 48.8%
2013-2014 2,933 1,420 48.4%
2014-2015 2,927 1,512 51.7%
2015-2016 3,026 1,472 48.7%
IPEDS GRADUATION AND TRANSFER RATES
Fall Cohort 2013 2012 2011 2010 2009
Graduation Rate 150% 13% 13% 10% 18% 17%
Transfer Out Rate 31% 32% 31% 41% 33%
The college monitors the rate of credentials awarded. The college awards the following: Associate of
Arts, Associate of Science, Associate of Applied Science, Associate of Occupational Technology, and
certificates of varying program lengths.
CREDENTIALS AWARDED
Year Associate Degrees Certificates Total Change from previous
year
2015-2016 221 277 498 -14.7%
2013-2014 226 210 436 -30.5%
2012-2013 281 346 627 -3.8%
2011-2012 280 372 652 1.9%
STATE LICENSING
The College has three programs which require state licensing prior to becoming employed in field:
Associate Degree Nursing, Practical Nursing, and Cosmetology. Both the Associate and Practical Nursing
Programs are approved by the Alabama Board of Nursing. Candidates for licensure must pass the
National Council Licensure Examination for Registered Nurses or the National Council Licensure
Examination for Practical Nurses, depending on their completed program of study. Cosmetology
completers must pass both a practical and written examination in order to receive licensure.
The Alabama State Board of Nursing currently has a benchmark of 80% passage for the NCLEX.
Lawson State sets an internal benchmark of 80% as well. Both the Associate Degree Nursing Program
and the Practical Nursing Program have exceeded this benchmark for the past four testing cycles.
Program, Lawson State has surpassed the National Mean each year.
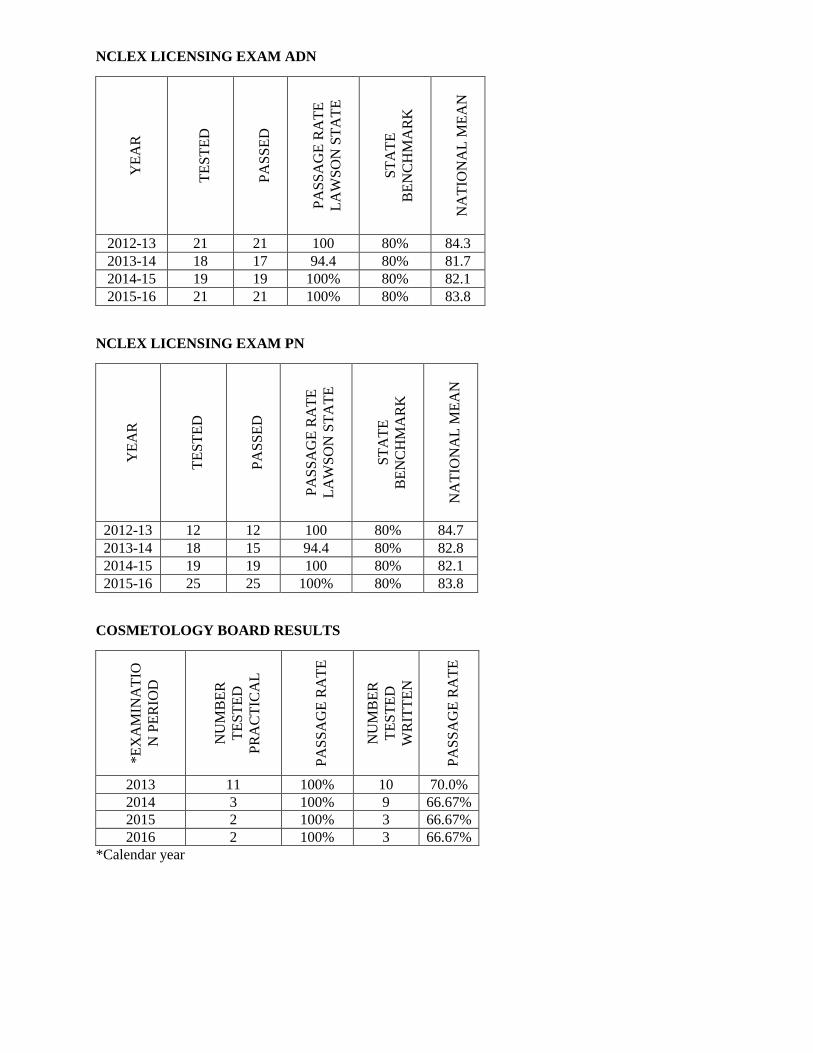
NCLEX LICENSING EXAM ADN
YE
AR
TE
ST
ED
PA
SS
ED
PA
SS
AG
E R
AT
E
LA
WS
ON
ST
AT
E
ST
AT
E
BE
NC
HM
AR
K
NA
TIO
NA
L M
EA
N
2012-13 21 21 100 80% 84.3
2013-14 18 17 94.4 80% 81.7
2014-15 19 19 100% 80% 82.1
2015-16 21 21 100% 80% 83.8
NCLEX LICENSING EXAM PN
YE
AR
TE
ST
ED
PA
SS
ED
PA
SS
AG
E R
AT
E
LA
WS
ON
ST
AT
E
ST
AT
E
BE
NC
HM
AR
K
NA
TIO
NA
L M
EA
N
2012-13 12 12 100 80% 84.7
2013-14 18 15 94.4 80% 82.8
2014-15 19 19 100 80% 82.1
2015-16 25 25 100% 80% 83.8
COSMETOLOGY BOARD RESULTS
*E
XA
MIN
AT
IO
N P
ER
IOD
NU
MB
ER
TE
ST
ED
PR
AC
TIC
AL
PA
SS
AG
E R
AT
E
NU
MB
ER
TE
ST
ED
WR
ITT
EN
PA
SS
AG
E R
AT
E
2013 11 100% 10 70.0%
2014 3 100% 9 66.67%
2015 2 100% 3 66.67%
2016 2 100% 3 66.67%
*Calendar year
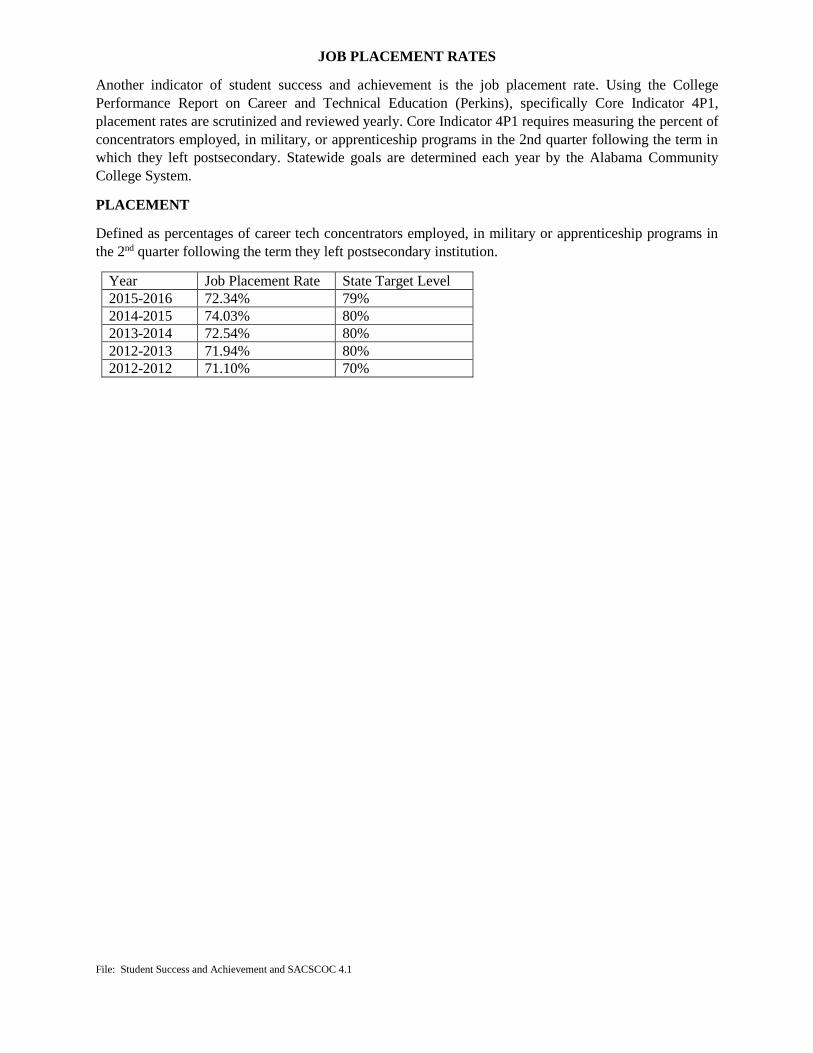
JOB PLACEMENT RATES
Another indicator of student success and achievement is the job placement rate. Using the College
Performance Report on Career and Technical Education (Perkins), specifically Core Indicator 4P1,
placement rates are scrutinized and reviewed yearly. Core Indicator 4P1 requires measuring the percent of
concentrators employed, in military, or apprenticeship programs in the 2nd quarter following the term in
which they left postsecondary. Statewide goals are determined each year by the Alabama Community
College System.
PLACEMENT
Defined as percentages of career tech concentrators employed, in military or apprenticeship programs in
the 2nd quarter following the term they left postsecondary institution.
Year Job Placement Rate State Target Level
2015-2016 72.34% 79%
2014-2015 74.03% 80%
2013-2014 72.54% 80%
2012-2013 71.94% 80%
2012-2012 71.10% 70%
File: Student Success and Achievement and SACSCOC 4.1
Recommended