Written by Rob Winkel Arno van den Bos amp Ulf Weddige June ndash 2015
Study on energy efficiency technologies for ships
CLIMAB3ETU20140023r
Title of the document
LEGAL NOTICE
This document has been prepared for the European Commission however it reflects the views only of the authors and the Commission cannot be held responsible for any use which may be made of the information contained therein
More information on the European Union is available on the Internet (httpwwweuropaeu)
Luxembourg Publications Office of the European Union 2015
ISBN 978-92-79-48424-7 doi 102834880780 ML-01-15-439-EN-N copy European Union 2015 Reproduction is authorised provided the source is acknowledged
Europe Direct is a service to help you find answers
to your questions about the European Union
Freephone number ()
00 800 6 7 8 9 10 11
() The information given is free as are most calls (though some operators phone boxes or hotels may charge you)
Energy Efficiency Technologies for Ships
Inventory and technology transfer
Final Report
ECOFYS Netherlands BV | Kanaalweg 15G | 3526 KL Utrecht| T +31 (0)30 662-3300 | F +31 (0)30 662-3301 | E infoecofyscom | I wwwecofyscom
Chamber of Commerce 30161191
Energy Efficiency Technologies for Ships Inventory and technology transfer
Final Report
By Rob Winkel Arno van den Bos amp Ulf Weddige
Date June 5th 2015
Project number TRANL15371
Reviewer David de Jager
copy Ecofys 2015 by order of European Commission
Disclaimer
ldquoThe information and views set out in this study are those of the author(s) and do not
necessarily reflect the official opinion of the Commission The Commission does not
guarantee the accuracy of the data included in this study Neither the Commission nor
any person acting on the Commissionrsquos behalf may be held responsible for the use which
may be made of the information contained thereinrdquo
ECOFYS Netherlands BV | Kanaalweg 15G | 3526 KL Utrecht| T +31 (0)30 662-3300 | F +31 (0)30 662-3301 | E infoecofyscom | I wwwecofyscom
Chamber of Commerce 30161191
Abstract
At global level the International Maritime Organization adopted several measures which are aimed at improving the energy efficiency of shipping This report identifies the most important barriers which prevent the effective implementation of the measures and provides a list of possible measures to overcome these barriers
One of the major barriers to the effective implementation of the measures is the heavy reliance it places on Flag States for inspection of vessels and enforcement of provisions Some of these Flag States are not signatories to all MARPOL Annexes which also hampers the implementation of the measures Flag States where most merchant ships are registered are commonly developing nations Flag States have less resources to properly carry out vessel inspections Consideration should be given to transfer knowledge to these states in order to further stimulate the adoption of energy efficiency technologies
This reports provides a list of fourteen energy efficiency measures that both provide a large energy efficiency improvement and can be implemented in many ships in order to identify which measures should be included in the capacity building Furthermore this report provides cost estimations for several capacity building options like workshops trainings and an online platform
ECOFYS Netherlands BV | Kanaalweg 15G | 3526 KL Utrecht| T +31 (0)30 662-3300 | F +31 (0)30 662-3301 | E infoecofyscom | I wwwecofyscom
Chamber of Commerce 30161191
Executive Summary
In July 2011 the International Maritime Organization (IMO) adopted two energy efficiency measures
which entered into force in 2013 the Energy Efficiency Design Index (EEDI) for new ships and the Ship
Energy Efficiency Managements Plan (SEEMP) for all ships Nevertheless the IMO recognises the need
for further action to reduce emissions from international shipping in view of the continued expected
growth of the world economy and associated transport demand
One of the major barriers to the effective implementation of the EEDI and the SEEMP is the heavy
reliance it places on Flag States for inspection of vessels and enforcement of provisions Some of these
Flag States are not signatories to all MARPOL Annexes which also hampers the implementation of the
measures Flag States where most merchant ships are registered are commonly developing nations
Such Flag States often have less resources to properly carry out vessel inspections Consideration
should be given to transfer knowledge to these states in order to further stimulate the adoption of
energy efficiency technologies The most important technologies regarding efficiency improvement are
summarised in the table below
Table Energy Efficiency Measures for ships
Main category Measure Efficiency at average circumstances
Ease of installation Payback time Investment
Hull Bow optimisation
10 all ship types short (lt3 years)
Medium
Main Engines Wind power 20 only special ship types long (gt15 years)
High
Propellers and Rudders Ducted propeller 10 all ship types except ferry and cruises
medium (4-15 years)
Medium
Propellers and Rudders Contra-rotating propellers
13 only special ship types long (gt15 years)
High
Propellers and Rudders Wheels 10 all ship types except ferry and cruises
short (lt3 years)
Medium
Control Systems Waste heat recovery
8 new build only medium (4-15 years)
Medium
Propellers and Rudders Rudder bulb 4 all ship types except ferry and cruises
medium (4-15 years)
Low
Propellers and Rudders Post swirl fins 4 all ship types except ferry and cruises
short (lt3 years)
Low
Hull Hull coating 5 all ship types short (lt3 years)
Low
Hull Air lubrication 9 new build only medium (4-15 years)
Medium
Propellers and Rudders Twisted rudder 3 all ship types except ferry and cruises
medium (4-15 years)
Low
Main Engines Main engine de-rating
3 all ship types except ferry and cruises
medium (4-15 years)
Low
Auxiliary engines Common rail upgrade
- all ship types medium (4-15 years)
Very Low
Main Engines Common rail upgrade
03 all ship types medium (4-15 years)
Very low
ECOFYS Netherlands BV | Kanaalweg 15G | 3526 KL Utrecht| T +31 (0)30 662-3300 | F +31 (0)30 662-3301 | E infoecofyscom | I wwwecofyscom
Chamber of Commerce 30161191
From this research it is clear that conventional technology is available to achieve high efficiency gains
It is possible to save 35 of fuel with only a few improvements that require an upfront investment
that can be earned back within 15 years High investments like contra rotating propellers and wind
power (experimental technology) bring the highest savings (13 ndash 20) The medium investments are
in-between (5-10) and the low investments only bring relatively small energy efficiency
improvements (lt5)
When the ship owner has too few opportunities to share investment with charterers this leads to a split
incentive a ship owner may invest the up-front capital to put in energy-efficient technology but not
receive the benefits This is typically a problem for investments with a high payback time ie the wind
power and contra rotating propellers
Several ways to overcome the knowledge transfer barriers were presented that can be categorised as
follows
Workshops and trainings
o Capacity building workshops for administrations
o Regional workshops
Technical training
o Training in calculating and verifying the EEDI
o Development of model courses
Online platform
o Inventory of energy-efficiency technologies
o Creation of a website with all relevant information for the target audience
o Improved access to information and information sharing
o Provide verified information on real-world energy efficiency improvements via a
monitoring programme
This report provides cost estimations for each of these capacity building options The most expensive
being a capacity building project that would take all aspects into account similar to GloBallast which
assists developing countries and their maritime industries in implementing international regulations on
ballast water management and preventing risks arising from the transfer of harmful aquatic organisms
The total budget for GloBallast for the 2008-2012 period was US$23 million
ECOFYS Netherlands BV | Kanaalweg 15G | 3526 KL Utrecht| T +31 (0)30 662-3300 | F +31 (0)30 662-3301 | E infoecofyscom | I wwwecofyscom
Chamber of Commerce 30161191
Reacutesumeacute
En Juillet 2011 lOrganisation Maritime Internationale (OMI) a adopteacute deux mesures defficaciteacute
eacutenergeacutetique qui sont entreacutees en vigueur en 2013 lrsquoIndice de Conception drsquoEfficaciteacute Energeacutetique
(EEDI en anglais) pour les navires neufs et le Plan de Gestion dEfficaciteacute Eacutenergeacutetique (SEEMP en
anglais) pour tous les navires Neacuteanmoins lOMI reconnaicirct la neacutecessiteacute de nouvelles mesures pour
reacuteduire les eacutemissions du transport maritime international compte tenu de la croissance continue de
leacuteconomie mondiale et de la demande de transport correspondante
Lun des principaux obstacles agrave la mise en œuvre des mesures EEDI et du SEEMP est lieacutee au fait que
linspection des navires et lapplication des dispositions sont de la responsabiliteacute des Eacutetats de pavillon
Certains de ces Eacutetats de pavillon ne sont pas signataires de toutes les annexes de la convention
MARPOL ce qui entrave eacutegalement la mise en œuvre des mesures Les Eacutetats de pavillon ougrave la plupart
des navires de commerce sont immatriculeacutes sont souvent des pays en deacuteveloppement Ils ont
souvent moins de ressources pour mener agrave bien les inspections de navires Il faudrait envisager de
transfeacuterer des connaissances agrave ces Eacutetats afin de stimuler davantage ladoption des technologies
defficaciteacute eacutenergeacutetique Les technologies les plus importantes concernant lameacutelioration de lefficaciteacute
sont reacutesumeacutees dans le tableau ci-dessous
Cateacutegorie principale Mesure Rendement en circonstances normales
Faciliteacute drsquoinstallation Retour sur investissement
Investissement
Coque Optimisation de la proue
10 Tous types de navires court (lt3 ans)
Moyen
Moteurs principaux Energie eacuteolienne 20 Uniquement certains types de navires
long (gt15 ans)
Eacuteleveacute
Heacutelices et Gouvernails Tuyegravere Kort 10 Tous types sauf ferry et paquebots
moyen (4-15 ans)
Moyen
Heacutelices et Gouvernails Heacutelice contrarotative
13 Uniquement navires speacuteciaux
long (gt15 ans)
Eacuteleveacute
Heacutelices et Gouvernails Roues agrave Aubes 10 Tous types sauf ferry et paquebots
court (lt3 ans)
Moyen
Systegravemes de controcircle Reacutecupeacuteration de chaleur
8 Uniquement navires neufs
moyen (4-15 ans)
Moyen
Heacutelices et Gouvernails Ampoule de gouvernail
4 Tous types sauf ferry et croisiegravere
moyen (4-15 ans)
Bas
Heacutelices et Gouvernails Ailettes de turbulence
4 Tous types sauf ferry et paquebots
court (lt3 ans)
Bas
Coque Revecirctement de coque
5 Tous types de navires court (lt3 ans)
Bas
Coque Injection drsquoair sous la coque
9 Uniquement navires neufs
moyen (4-15 ans)
Moyen
Heacutelices et Gouvernails Gouvernail tordu 3 Tous types sauf ferry et paquebots
moyen (4-15 ans)
Bas
Moteurs principaux Ralentissement du moteur (de-rating)
3 Tous types sauf ferry et paquebots
moyen (4-15 ans)
Bas
Moteur auxiliaire Modernisation du common rail
- Tous types de navires moyen (4-15 ans)
Tregraves Bas
Moteurs principaux Modernisation du common rail
03 Tous types de navires moyen (4-15 ans)
Tregraves Bas
ECOFYS Netherlands BV | Kanaalweg 15G | 3526 KL Utrecht| T +31 (0)30 662-3300 | F +31 (0)30 662-3301 | E infoecofyscom | I wwwecofyscom
Chamber of Commerce 30161191
Cette recherche montre clairement que des technologies conventionnelles sont disponibles pour
reacutealiser des gains eacuteleveacutes defficaciteacute La mise en œuvre des mesures dont lrsquoinvestissement se
rentabilise en moins de 15 ans permet deacutejagrave deacuteconomiser 35 de carburant Des investissements
eacuteleveacutes comme les heacutelices contrarotatives et leacutenergie eacuteolienne (technologies expeacuterimentales)
permettraient des eacuteconomies drsquoeacutenergies les plus eacuteleveacutees (13-20) Les investissements de taille
moyenne rapportent des eacuteconomies de 5-10 et les investissements les plus faibles apportent
relativement peu drsquoeacuteconomies (lt5)
Lorsque les proprieacutetaires de navires nrsquoont pas la possibiliteacute de partager les investissements avec les
affreacuteteurs cela megravene agrave une discordance des inteacuterecircts un armateur peut investir le capital pour des
technologies deacuteconomie deacutenergie mais nen recevra pas les beacuteneacutefices Ceci est un problegraveme typique
pour les investissements avec un temps de reacutecupeacuteration eacuteleveacute agrave savoir leacutenergie eacuteolienne et les
heacutelices contra rotatives
Plusieurs faccedilons de surmonter les obstacles de transfert de connaissances sont preacutesenteacutees qui
peuvent ecirctre classeacutees de la forme suivante
Ateliers et formations
o Ateliers de renforcement de capaciteacute pour administrations nationales
o Ateliers reacutegionaux
Formations techniques
o Formations dans le calcul et veacuterification de lrsquoEEDI
o Deacuteveloppement de cours standardiseacutes
Plateforme en ligne
o Inventaire de technologies drsquoefficaciteacute eacutenergeacutetique
o Creacuteation de site internet avec informations pertinentes pour le public cible
o Ameacutelioration de lrsquoaccegraves aux informations et partage de connaissances
o Apport drsquoinformations veacuterifieacutees sur les eacuteconomies veacuteritablement reacutealiseacutees agrave travers un
programme de monitoring
Ce rapport fournit des estimations de coucircts pour chacune de ces options de renforcement de
capaciteacutes La plus coucircteuse serait un projet de renforcement des capaciteacutes qui prendrait en compte
tous les aspects semblable au projet GloBallast qui aide les pays en deacuteveloppement et leurs
industries maritimes avec la mise en œuvre des regraveglements internationaux sur la gestion des eaux de
ballast et la preacutevention des risques de transfert dorganismes aquatiques nuisibles Le budget total
pour GloBallast pour la peacuteriode 2008-2012 eacutetait de $ US 23 millions
ECOFYS Netherlands BV | Kanaalweg 15G | 3526 KL Utrecht| T +31 (0)30 662-3300 | F +31 (0)30 662-3301 | E infoecofyscom | I wwwecofyscom
Chamber of Commerce 30161191
Table of contents
1 Introduction 1
2 Relevant Stakeholders 2
Global Shipbuilding Nations 3
Flag States and their role in the implementation of MARPOL 3
Surveys 4
Punishments for failure to comply 5
Role of Port States 6
Cooperation between Port and Flag States 6
Ship owners and charterers 6
Conclusions 7
3 Energy Efficiency Measures for Ships 9
Hull and superstructure 2
Bow optimisation 2
Hull coating 3
Air lubrication 3
Engines 4
Main engine de-rating 5
Common-rail upgrade (common-rail fuel injection) 5
Auxiliary engines and systems 6
Wind power 6
Control Systems Waste heat recovery 7
Propellers and Rudders 8
Ducted propeller (Kort Nozzle) 8
Contra-rotating propellers (CRP) 9
Post swirl devises 10
Barriers to the transfer and uptake of energy efficiency technologies for ships and
possible measures to overcome them 15
Awareness Raising 17
Technology Concerns 19
Institutional Concerns 19
Commercial 21
Cost estimates 21
Workshops and training 21
Technical training 22
Online platform for inventory of energy efficiency technologies 22
Capacity building project 22
ECOFYS Netherlands BV | Kanaalweg 15G | 3526 KL Utrecht| T +31 (0)30 662-3300 | F +31 (0)30 662-3301 | E infoecofyscom | I wwwecofyscom
Chamber of Commerce 30161191
Conclusions 24
References 26
Appendix I - World fleet registered trading vessels 30
Appendix II - Most important shipbuilding countries 31
China 31
South Korea 32
Japan 32
The Philippines 32
Europe 33
Turkey 34
TRANL15371 1
1 Introduction
The negotiations within the International Maritime Organization (IMO) on enhancing the energy
efficiency of and reducing the greenhouse gas emissions from international shipping are a top-priority
for the European Commission in view of the European Unions preference for a global measure to
address greenhouse gas emissions from shipping
In July 2011 the IMO adopted two energy efficiency measures which entered into force in 2013 the
Energy Efficiency Design Index (EEDI) for new ships and the Ship Energy Efficiency Managements Plan
(SEEMP) for all ships1 Nevertheless the IMO recognises the need for further action to reduce emissions
from international shipping in view of the continued expected growth of the world economy and
associated transport demand Consequently the IMO began working on further measures to increase
the energy efficiency of international shipping including the development of a global data collection
system as a first step in April 2014
At the time of the adoption of the EEDI and the SEEMP it was agreed to complement them with a
Resolution on the promotion of technical cooperation and transfer of technology relating to the
improvement of energy efficiency of ships The Resolution was intended to provide a framework for the
promotion and facilitation of capacity building technical cooperation and technology transfer to
support in particular in developing countries the implementation of the EEDI and the SEEMP The
Resolution was adopted in 2013 and an expert group tasked to ensure the Resolutions effective
implementation was established in April 2014
The EU is actively contributing to the work of the IMO Ad Hoc Expert Working Group on Facilitation of
Transfer of Technology for Ships (AHEWG-TT) to ensure effective implementation of the Resolution and
incidentally advance the related IMO negotiations on further measures to increase the energy efficiency
of international shipping
The goal of this project is to contribute to the work of the AHEWG-TT and to further stimulate the
effective implementation of the International Maritime Organization (IMO) Resolution on the promotion
of technical cooperation and transfer of technology2
To achieve this goal this study provides a short overview of relevant stakeholders and existing
technologies which could improve the energy efficiency of ships Furthermore barriers to transfer and
uptake of energy efficient technologies are categorised and analysed and possible measures to
overcome these barriers are being proposed
1 Amendments to MARPOL Annex VI (prevention of air pollution from ships) 2 httpwwwimoorgOurWorkEnvironmentPollutionPreventionAirPollutionPagesTechnical-Co-operationaspx
TRANL15371 2
2 Relevant Stakeholders
The IMO resolution on the promotion of technical cooperation and transfer of technology (regulation
23) is intended to support states which request technical assistance Three main categories of
stakeholders were identified that can be considered of relevance
(1) Shipbuilding nations where the ships are produced
(2) Flag States (where the ships are registered) and Port States who are allowed to inspect foreign
ships compliance to international regulations
(3) Ship owners and ship charterers who are responsible for the design and use of the ships
TRANL15371 3
Global Shipbuilding Nations
Shipbuilding nations typically provide incentives for the shipbuilding industry in their country Therefore
they play a role in the transfer of technologies to their industry
In 2012 some 3655 ships were built worldwide The largest share of the tonnage was built in China
South Korea and Japan (Figure 1)
Figure 1 Ship building in 1000 gross tons Source (Statista 2015) quoting IHS and Shipbuilders Association of
Japan
The worldrsquos leading shipyards include South Korearsquos Hyundai Heavy Industries Japanrsquos Mitsubishi
Heavy Industries and Chinarsquos Shanghai Waigaoqiao (Statista 2015) China South Korea and Japan
together are responsible for building about 90 of the ships in gross tons
Flag States and their role in the implementation of MARPOL
Flag States have the responsibility for enforcing the rules set out under MARPOL Every Flag State has
the duty to ensure that its vessels fully comply with the applicable articles of MARPOL3
3 MARPOL Regulation 6
TRANL15371 4
At the end of 2013 about one-fifth of merchant vessels were registered in Flag State Panama 12 in
Flag State Liberia and 8 in the Flag State Marshall Islands (Figure 2 and (UK DfT 2014)) Therefore
already 40 of the world fleet are registered in these three Flag States
Figure 2 World fleet registered trading vessels of 100 gross tons and over 2009-2013 Source UK DfT 2014
Under MARPOL these parties (Flag States) can enforce ship-owners and operators obligations in three
main ways
- by surveyinspection of vessels to ensure that they meet minimum requirements4
- by monitoring vessel compliance with oil discharge requirements5 (not relevant for energy
efficiency) and
- by implementing punishments for failure to comply with requirements6
Surveys
MARPOL Annex VI contains a set of requirements for survey and issuance of International Air
Pollution Prevention Certificate (IAPP) and regulations regarding
Ozone depleting substances from refrigerating plants and firefighting equipment
Nitrogen Oxides (NOx) from diesel engines
Sulphur Oxides (SOx) from diesel engines
4 MARPOL article 5 5 MARPOL Annex I Chapter 4 Regulation 31 6 MARPOL article 4
TRANL15371 5
Volatile Organic Compound Emissions from cargo tanks of oil tankers
Shipboard Incineration
Fuel oil quality
Flag States must conduct an initial survey before a new ship is put into service and before the IAPP is
issued for the first time a renewal survey at intervals specified by the Administration but not exceeding
five years an intermediate survey within three months before or after the second anniversary date or
within three months before or after the third anniversary date of the certificate an annual survey within
three months before or after each anniversary date of the certificate and after prescribed repairs an
additional survey7
For the EEDI and the SEEMP a new certificate the International Energy Efficiency Certificate (IEEC)
was established and must be kept available on board for inspectionssurveys The IEEC Certificate will
be issued for new build ships upon the initial survey before the ship is put into service and for existing
ships of 400 gross tonnage and above The IEE Certificate will be issued once for each ship and is valid
throughout the lifetime of the ship (except flag change major conversion or ship going out of service)
There are no follow-up surveys on the IEEC Certificate
The IMO has created guidelines for surveys that Flag States should follow The energy efficiency related
one is
2014 Guidelines on survey and certification of the Energy Efficiency Design Index (EEDI)
(resolution MEPC254(67))
A Flag State cannot allow a vessel that does not pass inspection to sail until it complies with MARPOL8
An International Energy Efficiency Certificate in accordance with the provisions of regulation 54 to
any ship of 400 gross tonnage and above is needed before that ship may engage in voyages to ports
or offshore terminals under the jurisdiction of other Parties
Punishments for failure to comply
In case of failure to comply the authority carrying out the inspection may detain the ship Article 7 of
MARPOL ensures that unduly delay or detain will be avoided where possible or compensated
A Flag State is obliged to investigate an incident upon receipt of notification or evidence that one of its
vessels has breached MARPOL If the investigations reveal that a breach has occurred the Flag State
has further obligations to initiate legal proceedings against the vessel and report back to the reporting
state on actions taken9
7 MARPOL Annex VI Chapter 2 Regulation 5 8 MARPOL Annex VI Chapter 2 Regulation 6 9 MARPOL article 6
TRANL15371 6
Also other parties are allowed to inspect vessels under MARPOL Article 6 when violations are detected
or for regular inspections A Party may also inspect a ship to which the present Convention applies
when it enters the ports or off-shore terminals under its jurisdiction if a request for an investigation is
received from any Party together with sufficient evidence that the ship has discharged harmful
substances or effluents containing such substances in any place
Role of Port States
Under ldquoPort State Controlrdquo arrangements Port States also have the authority to conduct vessel surveys
on ships which visit their ports and to detain those ships that fall below MARPOL requirements In
relation to MARPOL Annex VI chapter 4 any port state inspection shall be limited to verifying when
appropriate that there is a valid International Energy Efficiency Certificate on board10
Cooperation between Port and Flag States
Under MARPOL parties are required to co-operate in detecting vessel violations and are required to
use all practical measures to detect and monitor violations If a State has evidence of a violation they
are obligated to forward this evidence to the vesselrsquos Flag State
All ships flagged under countries that are signatories to MARPOL are subject to its requirements
regardless of where they sail and member nations are responsible for vessels registered under their
respective nationalities
When incidents occur outside the countrys jurisdiction or jurisdiction cannot be determined the
country refers cases to Flag States in accordance with MARPOL Some States are not happy with the
lack of response from Flag States United States experience of Flag States not responding has led to
new policy which would take direct enforcement action against vessels for MARPOL V violations
occurring between 3 and 200 nautical miles from the United States rather than referring such violations
to the flag states (Dillingham 2000)
Ship owners and charterers
A ship owner is the owner of a commercial ship A ship owner is someone who equips and exploits a
ship usually for delivering cargo at a certain freight rate The ship owner determines the specifications
of the ship and its energy efficiency measures but the benefits of low fuel consumption are not always
theirs when the ship is chartered to someone else
Depending on the type of ship and the type of charter normally a standard contract form called a
charter party is used to record the exact rate duration and terms agreed between the ship owner and
the charterer
10 MARPOL Annex VI Regulation 10
TRANL15371 7
A charterer may be a party without a cargo who takes a vessel on charter for a specified period from
the owner and then trades the ship to carry cargoes at a profit above the hire rate In some cases a
charterer may own cargo and employ a shipbroker to find a ship to deliver the cargo for a certain price
Two main types of charter can be distinguished time charter and voyage charter In a voyage charter
the owner is still responsible for the port fuel and crew costs In a time charter the charterer selects
the ports and directs the vessel where to go The charterer pays for all fuel the vessel consumes port
charges commissions and a daily hire to the owner of the vessel
When there are too few opportunities to share investment with charterers this leads to a split incentive
a ship owner may invest the up-front capital to put in energy-efficient technology but doesnrsquot then
recoup the costs from fuel savings as they charter their ships out as this goes to the charterers This
problem is particularly apparent for short-term time charters11
Conclusions
Regarding energy efficiency the work of the AHEWG-TT12 has shown that the main shipbuilding nations
all have access to the necessary technologies provided there is demand for them It has also been
noted that there is no need for transfers of intellectual property rights13
One of the major barriers to the effective implementation of the EEDI and the SEEMP is the heavy
reliance it places on Flag States for inspection of vessels and enforcement of provisions During the
1970rsquos ships were being reflagged from high tax and high regulation countries such as the United
States and the United Kingdom to countries offering Flags of Convenience (lsquoFOCrsquo) Under FOCs ship-
owners pay less tax to the relevant Flag State and are able to evade the majority of the environmental
and construction standards set out under MARPOL (Leddy 2012) The main reason for that is that
several Flag States are not signatories to all MARPOL Annexes (eg as of 20142015 the Bahamian
Bolivian Cambodian North Korean Georgian Honduran Lebanese and Sri Lankan flags of
convenience had not ratified all MARPOL treaty annexes III-VI14 15)
Many FOCs are developing nations that do not have the resources to enforce investigate or prosecute
breaches by their flagged vessels (Aqorau 2000) As of 2014 55 of merchant ships are flagged by
FOC and 40 of ships are flagged by FOCdeveloping countries MARPOL only provides guidelines for
Flag States to follow when surveying vessels under regulation 6 but none of these guidelines are
mandatory Conversely Port States which are developed are better equipped to bear the cost of
inspection investigation enforcement and prosecution costs However in relation to EEDI and the
11 httpssi2040orgwhat-we-dowork-streamsfinance 12 MEPC 6831 Progress report of the Ad Hoc Expert Working Group on Facilitation of Transfer of Technology for Ships 13 Submission of the United States on Task 3 of the Ad Hoc Expert Working Group on Facilitation of Transfer of Technology for Ships Jan
2015 14 wwwics-shippingorgdocsflag-state-performance-table 15 httpwwwimoorgAboutConventionsStatusOfConventionsPagesDefaultaspx status of conventions
TRANL15371 8
SEEMP port state control is limited to verifying when appropriate that there is a valid International
Energy Efficiency Certificate on board
We therefore conclude that there needs to be a focus on enabling Flag States and Port States that lack
the resourcescapacity to enforce the EEDI and the SEEMP in order to further stimulate the adoption
of energy efficiency technologies Also attention should be paid to overcoming the barrier of split
incentives ie where the benefits of energy efficiency measures are not transferred from the charterer
to the investor (owner)
TRANL15371 9
3 Energy Efficiency Measures for Ships
In order to understand the important energy efficiency measures that can help improve energy
efficiency from shipping it is interesting to see the split between new-built ships and existing fleet In
2012 some 3655 merchant ships were delivered worldwide about 6 of the worldrsquos merchant fleet
of about 60000 The average age of the merchant fleet is 19 years Therefore measures for both new
ships and retrofits for old ships are important for improving the energy efficiency in the next decades
If only the new ships would be targeted only 50 of the fleet would be more efficient in the next
decades while there are many retrofit measures available The total fleet can be broken down to about
4000 passenger ships just under 14000 tankers and about 37000 dry cargo ships including about
5000 container ships (Statista 2015)
In order to identify the most interesting energy efficiency measures for ships we used the information
from several reports to develop a long-list Many measures improve the efficiency in the order of up to
5 Here we would like to focus on measures that result in high savings that can be applied to many
ship types and preferably also to existing ships The resulting short-list is presented in the next table
We used the main categories identified by AHEWG-TT for structuring the measures
The main categories defined by AHEWG-TT are
1 Hull
2 Main Engine
3 Auxiliary engines
4 Propellers and rudders and
5 Control systems
Since the auxiliary engines typically consume only a fraction of the energy that goes to the main
engines their energy efficiency measure results do not show in the short-list below The measures are
worked out in more detail in the paragraphs below The main engine and auxiliary engine improvements
are covered in the same paragraph
The common rail upgrade is a simple measure that can be easily applied to all ships even when the
ship is not in the dry-dock The details are available in the paragraph about engines
From the list it is clear that conventional technology is available to achieve high efficiency gains If the
maximum gain per category is added up (for all but ferry and cruise) this would mean a total efficiency
improvement of 35 even without taking two experimental technologies with potentially high efficiency
gains into account (wind power and air lubrication) Note that some technologies are not applicable to
all ships
In order to find possible financial barriers the investments are rated from ldquovery lowrdquo to ldquohighrdquo relatively
to the size of the ships The same measure on a larger ship is obviously more expensive
TRANL15371 1
Table 1 Inventoryranking of energy efficiency measures
Main category
Measure Estimated efficiency (range)
Efficiency at average circumstances
Ease of installation
Payback time
Investment Implementation References
Hull Bow optimisation
25-20 10 all ship types
short (lt3 years)
Medium conventional technology
(IMO 2009 IMO 2011 Crist 2009 Hochkirch und Bertram not dated)
Main Engines
Wind power 5-44 20 only special ship types
long (gt15 years)
High experimental technology
(IMO 2011 IMO 2009 Crist 2009 ICCT 2011 Brannigan et al 2009 Allenstroumlm 2013)
Propellers and Rudders
Ducted propeller
1-20 10
all ship types except ferry and cruises
medium (4-15 years)
Medium conventional technology
(IMO 2011 IMO 2009 Crist 2009 ICCT 2011)
Propellers and Rudders
Contra-rotating propellers
6-20 13 only special ship types
long (gt15 years)
High conventional technology
(IMO 2011 IMO 2009 Crist 2009 WAumlRTSILAuml 2009 Shuto 2010)
Propellers and Rudders
Wheels 10 10
all ship types except ferry and cruises
short (lt3 years)
Medium conventional technology
(IMO 2009 Schneekluth und Bertram 1998 Brannigan et al 2009)
Control Systems
Waste heat recovery
6-10 8 new build only
medium (4-15 years)
Medium conventional technology
(IMO 2011 IMO 2009 Crist 2009 WAumlRTSILAuml 2007 ICCT 2011)
Propellers and Rudders
Rudder bulb 2-5 4
all ship types except ferry and cruises
medium (4-15 years)
Low conventional technology
(IMO 2011 IMO 2009 Nielsen et al not dated Crist 2009 ICCT 2011)
Propellers and Rudders
Post swirl fins
2-5 4
all ship types except ferry and cruises
short (lt3 years)
Low conventional technology
(IMO 2009 MOL 2011 Hansen Dinham-
Peren und Nojiri 2011 Nielsen et al not
dated)
Hull Hull coating 1-9 5 all ship types
short (lt3 years)
Low conventional technology
(IMO 2011 IMO 2009 ICCT 2011 Voorham 2013 Crist 2009)
Hull Air lubrication
5-15 9 new build only
medium (4-15 years)
Medium experimental technology
(IMO 2011 IMO 2009 Crist 2009 DK Group 2015 CNSS 2015 ICCT 2011)
Propellers and Rudders
Twisted rudder
2-4 3
all ship types except ferry and cruises
medium (4-15 years)
Low conventional technology
(IMO 2009 Schulze 2007 Nakashima 2015 Becker Marine System 2015 Nielsen et al not dated Hollenbach und Friesch not dated Rolls-Royce 2014)
Main Engines
Main engine de-rating
2-4 3
all ship types except ferry and cruises
medium (4-15 years)
Low conventional technology
(IMO 2011 IMO 2009 Crist 2009 Wettstein und Brown 2008 DNV GL 2015)
Auxiliary engines
Common rail upgrade
- - all ship types
medium (4-15 years)
Very Low conventional technology
(DNV GL 2015) (ICCT 2011) (IMO 2009)
Main Engines
Common rail upgrade
01-05-
03 all ship types
medium (4-15 years)
Very low conventional technology
(IMO 2009 Pakarinen 2007 ICCT 2011 Crist 2009)
TRANL15371 2
Hull and superstructure
In general the optimisation of hull and superstructure focuses on minimising the resistance by reducing
the wave resistance and friction between water and hull It is important to recognise which type of
vessel is to be optimised The reduced frictional resistance increases energy performance of the vessel
particularly at low speeds Operability and performances of the ship must be considered in detail The
improvements measures are generally applied at new-built ships but also applicable to retrofitting
Bow optimisation
The different bow optimisations can improve the water flow around the hull and reduce the wave-added
resistance for large vessels with high block coefficient operating within commercial speed ranges The
average energy reduction potential ranges from 25-20 on average 10 (Crist 2009 IMO 2011
Voorham 2013)
Figure 3 Left The green line characterises the ordinary bow wave of the hull The blue line characterises the wave
formed by the bulb The red line is the sum of these two The altitude of the bow wave is noticeably reduced which
reduces the hull drag associated with the bow wave This improves fuel economy and increases range (Selenetrawlers
2015) Right Ordinary bulbous bow leadge bow and ax-bow shape (JSEA 2006)
The below-the-waterline extension of the bulbous bow (Figure 3) modifies the way the water flows
around the hull reducing drag and thus increasing speed range fuel efficiency and stability An altered
design is the ax-bow (Figure 3) The narrow designed bow slashes through the water in order to reduce
slamming and reduces the size of bow generated wave The propeller can act more efficient due to the
absence of slamming The ax-bow allows the ship to steer well to maintain speed and the engine to
save fuel (Crist 2009 IMO 2009) If the bulbous bow is modified during a regular docking period the
investment is estimated to have short payback of about 1-3 years It is most promising for container
vessels (DNV GL 2015 Hochkirch und Bertram not dated)
Barriers The bow optimisation (as retrofit) needs to be done in the dry dock Dry-docking is not
regularly happening for existing ships because it means that the ship cannot operate and economic
losses are suspected Another obstacle might arise due to restricted access to the original contractual
hull plans since shipyards are not always keen to provide detailed plans on their vessels to prevent
TRANL15371 3
imitation (Hochkirch und Bertram not dated DNV GL 2015) A major obstacle is the split incentive
between ship owner and operator Ship owners are responsible for investing in these technologies and
ship operators are those who pay for the fuel consumption and benefit from such technologies (ICCT
2011)
Technical maturity The technique is available on the market and is effective Only conventional
material is needed and redesign can be done in a few weeks16
Applicability Applicable to all ship types but most efficient for ships with a high block coefficient like
tankers and bulk carriers since the reduction of the wave-added resistance is most impacting (IMO
2009)
Hull coating
Hull coatings (Figure 4) can lower frictional resistance and limit fouling by aquatic organisms It can
save between 1-9 fuel consumption on average 5 (ICCT 2011 Voorham 2013 Crist 2009)
Figure 4 Example of hull coating (ECOSPEED 2015)
One way of lowering the frictional resistance is to improve the smoothness of a hull by means of
coatings that reduce fouling The costs are lifetime cost reduction and have to be recur every five years
to be able to gain the fuel benefit
Barriers A new application is typically necessary during each dry-docking The self-polishing coating
must be renewed after a 3-5 years period (IMO 2009) A major obstacle is the divided interest between
ship owner and operator Ship owners are in charge for investing in these technologies and ship
operators are those who pay for the fuel consumption and profit from such technologies (ICCT 2011)
Technical maturity Coating techniques are available on the market and roughly 5 of newly painted
ships are painted with one of the advanced coating systems presently available (IMO 2011 ICCT 2011)
The payback time is short (ICCT 2011) or 0-2 years according to others17
Applicability The technology is applicable to all vessels
Air lubrication
The air lubrication technique creates a layer of bubbles underneath an already streamlined hull in order
to further reduce friction An automation system regulates the compressorsblowers depending on
16 httpwwwship-efficiencyorgonTEAMpdf14-Ship20efficiency20seminar20-20CMA20CGM-
20HydrOcean20120CMA20pdf 17 httpswwwdnvglcommaritimeenergy-efficiencyefficiency-finderhtml
TRANL15371 4
speed The blower keeps holes filled with air and required pressure A thin layer of bubbles trailing
behind of each cavity merge into single large ldquoair layerrdquo for the whole flat bottom part of the hull and
reduces the friction (Figure 5) Depending on the ship type the estimate fuel efficiency ranges between
5-15 (on average 9) where tankers and bulkers can reduce more (10-15 on average 125) in
comparison to container vessels (5-9 on average 7) (IMO 2009 DK Group 2015 CNSS 2015 ICCT
2011 Voorham 2013)18
Figure 5 Schematic view of air lubrication (DK Group 2015)
Barriers Large capital investment requirements with split incentive The vessel owners are
accountable for investing in these technologies whereas vessel operators recompense for the fuel
consumption and benefit from such technologies (ICCT 2011)
Technical maturity The technology is available on the market but still in a pilot phase Sea trials
have been performed with small demonstration ships There are no vessels operating commercially
that currently use this technique Specifications about the payback time vary from short to medium
(Silberschmidt 2014 Skinner 2009)
Applicability The original technology would be likely be applied to new-built ships with at least a
partly flat bottom and a minimum length of 225 metres since the compressor may have technical
problems maintaining air cavities for deep draft ships (IMO 2011 CNSS 2015) Air lubrication can be
used for retrofitting as well (CNSS 2015)
Engines
Speed reductions on existing vessels provide opportunities for engine optimisation on low power
(321) Similar measures as de-rating for the main engines that could be implemented are cylinder
cut-out and new torsional vibration calculation (IMO 2009)
18 It has to be noted that the extra fuel use caused by the system itself should also be taken into account
TRANL15371 5
Another propulsion supportive measure with a high potential measure is wind power This is also
explained in more detail below In order to also provide a measure with a lower improvement potential
per ship but simple and applicable to all ships we describe the common rail system for fuel injection
Main engine de-rating
Slow steaming vessels are known as one of the most effective energy saving measure The potential
comes mainly from the operational behaviour side From the technical side the specific fuel oil
consumption will decline when a ship is no longer operated at its design speed
The design speed can be reduced by de-rating the main engine (IMO 2011 IMO 2009) Reduction of
power combined with injection timing advanced to restore peak combustion pressure can achieve a
certain gain in shaft efficiency Fuel efficiency can be improved by 2-4 when de-rating is performed
for loads lower than the maximum design load (Wettstein und Brown 2008 Crist 2009) on average
3 energy efficiency potential (Crist 2009) Operational costs would be lower mainly due to fuel
savings (DNV GL 2015 Crist 2009 Wettstein und Brown 2008)
Barriers A slower vessel will have lower incomes as it is not capable to perform as much transport
load per unit of time as a faster vessel De-rating the engine is usually done when it is clear that the
ship will become a slower steaming ship There is a split incentive between vessel owners who are
responsible for investing in these technologies and vessel operators who are those who compensate
for the fuel consumption and benefit from such technologies (ICCT 2011)
Technical maturity This technique has been proven as successful particularly on older engines
which are normally built with a low compression ratio and thereby have a significant potential to
improve their efficiency (IMO 2009) De-rating measures have a low to medium payback time (Crist
2009 DNV GL 2015)
Applicability The technologies are available on the market It is applicable to all vessels (DNV GL
2015)
Common-rail upgrade (common-rail fuel injection)
Engines with common-rail fuel injection handle low-load working modes much better (IMO 2009) A
common-rail fuel injection is technique of injecting fuel into an engine cylinder under total control and
thereby achieving optimal combustion Common-rail allows the start and duration of injection
independent of the position of the pistons in that way permitting an operationally optimised injection
per stroke In a normal diesel engine fuel is injected at a static rate by a pump and common practice
is to optimise this pump to run at an optimal setting for the ideal injection time (Pakarinen 2007) The
energy efficiency potential is estimated between 01-05 on average 03 (ICCT 2011 IMO 2009)
Barriers Additional electronics can also introduce possibilities for failures However recent
advancements have increased the systems popularity19 There is a split incentive between vessel
19 httpwwwmarineinsightcommarinean-overview-of-common-rail-system-in-marine-engines
TRANL15371 6
owners who are responsible for investing in these technologies and vessel operators who are those
who compensate for the fuel consumption and benefit from such technologies (ICCT 2011)
Technical maturity This measure is available on the market (ICCT 2011) Payback time is short to
medium with an average of 5 years (IMO 2009 Crist 2009)
Applicability This measure is applicable to new and retrofit vessels It is applicable for tanker- bulk-
container- and Roro-ships (Crist 2009)
Auxiliary engines and systems
Based on our own estimation auxiliary engines improvement are not bringing gt2-4 energy savings
because auxiliary engines consume much less fuel than the main engine Similar measures as de-rating
for the main engines and common rail upgrade could be implemented for the auxiliary engine
Other options for improving auxiliary systems are speed control of pumps and fans control strategies
of cooling water systems room ventilation redesign of piping and instruments advanced computation
of airgas temperature distribution with reduced storage ventilation and with optimised ventilation
systems (DNV GL 2015)
Barriers There is a split incentive between vessel owners who are responsible for investing in these
technologies and vessel operators who are those who compensate for the fuel consumption and benefit
from such technologies (ICCT 2011)
Technical maturity This measure is available on the market (ICCT 2011) It is easy to apply and
uncomplicated in maintenance (DNV GL 2015) Payback time is short (DNV GL 2015)
Applicability This measure is applicable to all new and retrofit types of ships (DNV GL 2015)
Wind power
Wind power measures are available that can develop enough thrust to provide at least some supportive
propulsion Wind power can be utilised in various ways in shipping like traditional sails solid wing sails
Flettner-rotor and kits (see Figure 6) The techniques are currently used as supplementary power
(Brannigan et al 2009)
Figure 6 from left to right Kite (Cargill 2011) Flettner rotor (MIWB 2015) and solid sails (Wind Chellenger Project
HP 2015)
Solid wing sails are structured similar to aircraft wings which offer more thrust with less drag than
conventional sails Flettner rotors produce thrust from a rotating object in wind using the so-called
TRANL15371 7
Magnus effect The techniques have different characteristics with regards to how the thrust that is
produced relates to other factors such as wind strength wind angle wind stability and ship speed
(IMO 2009)
Towing kites vary from other concepts of wind power by having a small footprint during installation and
therefore being quite feasible to retrofit (Allenstroumlm 2013) Studies conducted at the Technical
University of Berlin indicated that the potential for sail energy has different prospective in the different
regions in the world Best scenarios exist in North Atlantic and North Pacific regions the South Pacific
seems a bit less potential The studies have shown that under normal circumstances the typical savings
using wind power may be 5 at 15 knots and up to 20 at 10 knots This study also revealed that
with optimal weather routing in the North Atlantic and given the best vessel with best sail type savings
can reach 15 percent at 15 knots and 44 at 10 knots (IMO 2009 Crist 2009) Nevertheless the
above figures should be considered indicative since practical experiences are limited Sail- and kite-
assisted power does seem to be a potential opportunity saving energy in the medium- and long-term
picture for shipping (IMO 2009) Christ estimates and average energy saving potential around 20
(2009)
Barriers There is a split incentive between vessel owners who are responsible for investing in these
technologies and vessel operators who are those who compensate for the fuel consumption and benefit
from such technologies (ICCT 2011) Although this technology can bring high energy savings the
investment is so high that there is not a short payback time
For solid wing sails complications could result in a need for masts to run down to the keel which can
be a bigger issue for retrofitting Additionally the presence of the mast and rigging could have significant
impacts on cargo handling (IMO 2009) Downside of the kite systems include the complex launch
recovery and control systems that are needed (IMO 2009)
Technical maturity This is still considered as experimental technology The technical barriers
identified above need to be tackled for this measure to be applied widely in the future Payback time is
estimated to be medium to long term (Allenstroumlm 2013 Crist 2009)
Applicability Wind power technologies are available and a number of cargo ships have been equipped
with wind engines to reduce demands from diesel engines (ICCT 2011) Kites can be used on ships
with a minimum length of 30m and works most energy efficient on ships with a typical speed not faster
than 16 knots Preferably tankers (crude oil product chemical LPG LNG other) and bulk carriers are
being considered as potential users due to this speed restriction (IMO 2011)
Control Systems Waste heat recovery
Waste heat recovery (WHR) technology can pass exhaust gases from a vessels engines through a heat
exchanger to generate steam for a turbine-driven generator The heat energy from the exhaust gas is
taken and transformed into electrical energy to reduce direct engine-fuel consumption for the
propulsion system or reduce auxiliary engine needs (ICCT 2011) Energy saving potential is estimated
between 6-10 on average 8 (Crist 2009 ICCT 2011)
TRANL15371 8
Figure 7 Efficiency of waste heat recover systems Sankey diagramme Even with high 50 efficiency of modern low-
speed engines there is still 50 of fuel input energy not being put to productive use The possibilities are illustrated
by this comparison of Sankey diagrammes for Waumlrtsilauml 12RT-flex96C engines without heat recovery (left) and with
high-efficiency waste heat recovery plant (right) showing in this case 114 gain in overall efficiency with WHR
(waste heat recovery) (WAumlRTSILAuml 2007)
Barriers Large capital investment requirements (around $5-6 million for a large container ship20) and
split incentive between ship owners and ship operators (ICCT 2011)
Technical maturity The technology is available on the market and has medium to long payback time
(WAumlRTSILAuml 2007 Crist 2009)
Applicability A WHR system is applied to vessels with a high production of waste heat and a high
intake of electricity WHR can be employed on ships with main engine average performance is higher
than 20000 kW and auxiliary engine average performance higher than 1000 kW This size
requirements limit the number of ships using this technology (IMO 2011) Generally it is applicable to
all ships types new and retrofit (Crist 2009)
Propellers and Rudders
Numerous devices have been designed for improving the energy consumption of vessels by recovering
as much as possible of this rotational energy in the flow from the propeller or to provide some pre-or
post-rotation of the in flow into and after the propeller to ensure best efficiency The most important
of these will be discussed in the following paragraphs (IMO 2009)
Ducted propeller (Kort Nozzle)
The accelerating ducted propeller consists of a screw propeller surrounded by a non-rotating duct
(nozzle) (Figure 8) Compared to the conventional propeller of the same diameter and thrust this
20 httpgcaptaincompower-exhaust-gas-paybacks-waste
TRANL15371 9
arrangement allows an increase inflow to the propeller improving the operating conditions around the
propeller and the ideal efficiency
Figure 8 Right photos of this Norwegian trawler (SetSail 2009)
The duct creates additional thrust load The potential for energy savings on relevant vessels range
between 1ndash20 (Crist 2009 IMO 2011 Barringhaus und Olds 1999 IMO 2009) whereupon 10 is a
good average value (IMO 2009 Crist 2009) The improvement of the combination of propeller and duct
overweigh negative effect of the increase water resistance caused by the duct
Barriers Since the duct has an optimal operational speed it does not work efficient at all speeds For
instance as drag increases with increasing speed eventually this will become larger than the added
thrust Therefore at high speeds ducts are typically not used (IMO 2009) The split incentive is a barrier
between ship owners (investor) and ship operators (gainer) as explained earlier (ICCT 2011)
Technical maturity Several standard designs are available on the market (IMO 2011) with a medium
payback time (IMO 2011)
Applicability Ducted propellers suits for vessels operating at high propeller loadings such as tankers
bulk carriers especially tugs and some offshore service ships The duct leads to increased friction but
at higher propeller loadings this is more than rewarded for by the positive effect of the combination of
propeller and duct (IMO 2009)
Contra-rotating propellers (CRP)
A rotating propeller induces a rotating motion in its backwash Normally this rotation energy of the
propeller gets lost The contra-rotating propeller is used in order to recover part of this energy (Figure
9) In a contra-rotating configuration two propellers are facing each other rotating in the opposite
direction with the aft propeller recuperating the turning energy in the wake from the forward propeller
(IMO 2011) To avoid complications with cavitation the aft propeller usually has a smaller diameter
than the front propeller Contra-rotating propeller arrangements involve a short shaft line and for that
reason primarily suitable for vessels with single-screw
TRANL15371 10
Figure 9 Left conventional propeller Right contra-rotating propeller The working principle is simple and effective
the power is split in a forward and aft propeller which through the different direction of rotation cancel out the
rotational energy losses behind the propeller (WAumlRTSILAuml 2009)
Potential savings of such measures are assessed to be in the order of 6ndash20 of the power consumption
with an average of 13 although higher figures may be presented by industry for specific cases Two
different full-scale measurements reported gains of 15 and 16 (IMO 2009 Crist 2009)
Barriers The mechanical installation of contra-rotating shafts is complicated and requires more
maintenance (IMO 2011) The split incentive between ship owners (investor) and ship operators
(gainer) is a barrier as explained above Although this technology can bring high energy savings the
investment is so high that there is not a short payback time
Technical maturity The technique is available on the market but problems with gearboxes for
contra-rotating propellers have been reported as well as operational problems with mounting (IMO
2009 IMO 2011) Payback time is reported as short (WAumlRTSILAuml 2009) but also as medium-long with
about ~15-20 years (Shuto 2010)
Applicability The technology is particularly beneficial for rather heavily loaded propellers as for
example very fast cargo vessels like Ro-Ro ships or for container ships (IMO 2011 Crist 2009) Contra-
rotating propellers need a short shaft line and hence mainly suited to single-screw ships (IMO 2011)
Contra-rotating propellers can be implemented as retrofit but it is more likely implemented in new
built ships due to the complicated mechanical installation (Crist 2009)
Post swirl devises
A number of different techniques belong to the post swirl category Several of them contain
modifications to the rudder or propeller (IMO 2009) Depending on vessel type and operational field
various power saving measures can be mounted to optimise water velocity distribution to the propeller
and to minimise slipstream losses due to swirl in the outflow of a propeller The most important among
these measures may be additional thrusting fins at the rudder twisted rudder (Figure 12) rudder-
bulb-systems with fins (Figure 13) and fins on the propeller fairwater also called post swirl fins or
boss cap fins (Figure 10)
Generally post swirl measures reported 1-8 energy efficiency (test models) Even 8-9 energy
efficiency from full-scale measurements for additional thrusting fins at the rudder Payback time is
estimated to be short to medium post swirl devices (DNV GL 2015 Crist 2009 ICCT 2011) Some of
CRP FOR BETTER PROPULSION EFFICIENCY
CONVENTIONAL PROPULSION
TRANL15371 11
the post swirl measure can be combined A good overview is given in Nielsen et al (Combined Kappel
propeller and rudder bulb system for improved propulsion efficiency not dated)
3431 Post swirl fins
The post swirl fins (Figure 10) can recover energy loss of propeller hub vortex in the propeller backward
flow and can lead to 3-5 energy saving on average 4 operating at the same speed (MOL 2011
Barringhaus und Olds 1999 Hansen Dinham-Peren und Nojiri 2011 ICCT 2011)
Figure 10 Example the post swirl fins or propeller boss cap fins (gcaptain 2012)
Barriers It is simple and straightforward measure requiring only the removal of the propeller boss
caps and replacement with the post swirl fins (no hull modification is needed) (Hansen Dinham-Peren
und Nojiri 2011 MOL 2011) However there is a split incentive between ship owners (investor) and
ship operators (gainer) as explained above
Technical maturity The technique is available on the market In 2013 post swirl fins were applied
to over 2500 ships worldwide (MOL 2011) Further advantages of the post swirl fins are reduction in
propeller torque reduced vibration in the stern and less underwater noise and reduced rudder erosion
(MOL 2011) A payback time of 6 months was estimated for 4 efficiency improvement at $600tonne
oil price (Hansen Dinham-Peren und Nojiri 2011) The investment is considered to be low21
Applicability The technique is effective for all screw propellers irrespective of the type or hull form
of the ship Has been tested on large-scale container vessels (MOL 2011 Hansen Dinham-Peren und
Nojiri 2011)
3432 Free rotating wheels
A vane wheel (Grim wheel) is a freely spinning propeller mounted behind the main smaller propeller
(see Figure 11 for example of use on retrofit Queen Elisabeth II in 1986) The vane wheel has a bigger
diameter than the main propeller and increases the propeller diameter The small propeller drives the
freely revolving vane wheel fitted on the wake The inner part of the vane wheel acts as a turbine and
the outer part as an ldquoadditionalrdquo propeller
21 httpgcaptaincompropeller-technology-ship-efficient
TRANL15371 12
Figure 11 Example for a grim vane wheel (Boat design 2007)
This leads to a substantial recovery of the rotational energy The energy saving potential is reported to
be 10 (Brannigan et al 2009) It is stated that the important benefit of the vane wheel is that a
smaller impulsion propeller can be installed which consumes less energy The vane wheel gives a
suitable energy improvement for cargo ships (IMO 2009 Schneekluth und Bertram 1998) and has short
payback time It is also stated that if there is room for a vane wheel in the aft there is also space for
an impulsion propeller of larger diameter leading about the same energy saving potential as the
combination of a small impulsion propeller and a vane wheel (IMO 2009)
Barriers A barrier is the split incentive between vessel owners who are responsible for investing in
these technologies and vessel operators who are those who compensate for the fuel consumption and
benefit from such technologies
Technical maturity Limited application Vane wheels are subjected to strong fluctuations in loading
Problems with the strength of the blades have been encountered frequently (for example the vane
wheels on the Queen Elisabeth II were short lived and not used after22)The payback time is estimated
to be short
Applicability The technique is effective for all screw propellers irrespective of the type or hull form
of the ship both for new and existing ships (Chen Reed und Kim 1989) Recommended for all ship
types except ferry and cruises because of their problem with strong fluctuations in loading as
mentioned above23 (IMO 2009)
3433 Twisted rudder
Rudders can play a significant role of extra frictional resistance Rudders are located in the backwash
of a propeller and rotational energy will act on the rudder Because of these effects the rudder gives
prospects of efficiency gains (Schulze 2007)
22 httpwwwroblightbodycomlinersqe-21987_Refitindexhtm 23 httpwwwroblightbodycomlinersqe-21987_Refitindexhtm
TRANL15371 13
Figure 12 Schematic capture of twisted rudder (Nakashima 2015)
Twisted leading edge technology provides multiple benefits for high-speed vessels compared to
conventional rudder designs Conventional rudders are located behind the propeller with the rudder
profile arranged symmetrically about the vertical rudder centre plane This arrangement does not
consider the fact that the propeller induces a strong rotational flow that strikes on the rudder blade
This consequences in areas of low force on the blade that induce cavitation and associated erosion
problems (Becker Marine System 2015 Schulze 2007)
The twisted rudder is horizontally twisted on the lower and upper side of the segment that is an
extension of the propeller shaft (Figure 12) This decreases cavitation rudder and improves
manoeuvrability of the vessel (Schulze 2007) Twisted rudder types lead to energy efficiency
improvements by approximately 2-4 on average 3 for large-size high-speed vessels (Hollenbach
und Friesch not dated Nakashima 2015)
Barriers Work needs to be done in the dry dock this is not regularly happening for existing ships
(Hochkirch und Bertram not dated) There is a split incentive between vessel owners who are
responsible for investing in these technologies and vessel operators who are those who compensate
for the fuel consumption and benefit from such technologies (ICCT 2011)
Technical maturity This rudder type is a commercially used technology and easy to apply if the ship
is in the dry dock (ICCT 2011)The payback time is estimated to be short to medium (Rolls-Royce 2014
Crist 2009)
Applicability Twisted rudder can used by container vessels reefers Ro-Pax ferries cruise ships and
naval vessels In South Korea this type of rudder is recognised as a standard rudder for large-size
high-speed container carriers (Nakashima 2015)
TRANL15371 14
3434 Rudder bulb
Figure 13 Example for a rudder bulb Kawasaki RBS-F rudder bulb systems with fins (Kawasaki 2015)
The rudder bulb brings smooth inflows from the propeller and can reduce the drag of the rudder The
rudder fins produce thrusts in the rotational flows generated by the propeller (Figure 13) Rudder bulb
measure can improve energy efficiency by 2-5 (Nielsen et al not dated Becker Marine System not
dated) on average 4 (Crist 2009)
Barriers The work needs to be done in the dry dock this is not regularly happening for existing ships
There is a split incentive between vessel owners who are responsible for investing in these technologies
and vessel operators who are those who compensate for the fuel consumption and benefit from such
technologies (ICCT 2011)
Technical maturity The technology is a commercially used technology and easy to apply while the
ship is in the dry dock (Kawasaki 2015) Payback time is estimated to be medium (Crist 2009)
Applicability For new and retrofit tanker- bulk- container- and Roro-ships with a propeller and
rudder (Crist 2009)
TRANL15371 15
Barriers to the transfer and uptake of energy
efficiency technologies for ships and possible
measures to overcome them
Although there are ways to reduce emissions (Chapter 3) and also drivers working towards the
implementation of such measures there are significant barriers to acting on cost-effective opportunities
in the maritime industry This is often referred to as barriers to energy or the energy efficiency gap
(Michele Acciaro 2013) (Sepideh Jafarzadeh 2014) (OECD 2014) Some barriers are shared with other
industries while others are unique to the maritime industry Furthermore many of these barriers are
not specific to the EEDI and the SEEMP but apply to any rule under MARPOL These barriers can exist
on both the supply and the demand side For example there could be barriers to the development and
implementation of measures that reduce CO2 emissions from ships and barriers to the expression of
demand for these measures (ECORYS 2012) Studies have however shown that there are relatively
few barriers related to the development of new technologies or access to related intellectual property
rights by the main shipbuilding nations and that the supply of measures exceeds the demand (ECORYS
2012) Existing studies on barriers to energy efficiency thus focus on what prevents the uptake of
available measures
This section presents an overview of the main barriers to the transfer and uptake of energy efficiency
technologies in the shipping industry and discusses potential ways of overcoming them
Preliminary assessments of technology transfer and financial needs by both workshop participants and
the IMO Ad Hoc Expert Working Group on Facilitation of Transfer of Technology for Ships (AHEWG-TT)
have suggested that the type of assistance needed by Port State and Flag State administrations will be
of a different nature than that required by shipbuilders and owners Our assessment above has shown
that the shipbuilding industry is expected to need less assistance than Port States and Flag States
In the next table we list a summary of the main barriers and the stakeholders concerned in the main
categories as identified by AHEWG-TT as well as the possible measures that could help overcome these
barriers The possible measures to overcome the barriers are further detailed in the sections below
Related costs are estimated in a separate section in order to minimise overlap
TRANL15371 16
Table 2 Summary of main barriers relevant stakeholders and possible measures to overcome them
Barrier Stakeholders Measures forward
Lack of awareness
(administrative and industry)
a MARPOL in general MARPOL Annex
VI EEDI and SEEMP in particular
b Available energy efficiency
technologies
Flag and Port
States
Ship owners
Capacity building
- Workshops
- Trainings
Model course for training
Inventory
Platform for information access and
sharing
Agreements between industry and
administrations
Technology concerns
a Lack of or limited technology supply
chain in some states
b Lack of technology base for RampD in
some states
c Lack of trust (in ability to reduce
emissions in ability to reduce
operational costs in compatibility
with other measures)
Ship owners
Investors
Increase cooperation in ship design
and building
Increased interaction between
industry and educationalRampD
institutes
Establish platform to share
expertiseexperience
Provide special investment or
guarantee funds
Institutional concerns
a Increased administrative burden
1Revision and amendment of existing legislation
2Implement Port and Flag State obligations
b Limited technical capacity in state institutions to implement
c Lack of financial resources for additional compliance and enforcement activities by maritime administrations
Flag States
Port States
Promote increased cooperation and
communication between
administrationswithin regional
administrations
Regional information workshops for
Port and Flag States
Establish platform to share regulatory
experience
Development aid
Commercial
a Increased costs for ship owners to
take up energy efficient technologies
b Lack of motivation of owners to take
up energy efficient technologies (split
incentive)
Ship owners
Financiers
Special EE funds
Smart contracts
TRANL15371 17
Awareness Raising
Barriers Lack of Awareness
The need to create awareness among Flag States Port States and ship owners of the requirements of
Annex VI in general and Chapter 4 in particular was highlighted by participants of the workshop and
emphasised by the AHEWG-TT The level of awareness in the various regions and even in the countries
within the regions differed considerably The AHEWG-TT further suggests it would be beneficial to
undertake an initial evaluation of knowledge needs (gap analysis) in order to ensure workshops and
other awareness-raising activities are appropriately tailored24
Furthermore ship-owners are not always aware of the energy efficiency technologies available on the
market or which operational measures can be implemented to save fuel Ship owners can be companies
people and investment funds Especially private equity groups tend to focus more on short term looking
for quick profit while traditional ship owners tend to hold the ship for at least 20 years25
Measures forward
Though Flag States and Port States should already have implemented measures to ensure that Energy
Efficiency Design Index (EEDI) and Ship Energy Efficiency Management Plan (SEEMP) requirements are
complied with both public administrations and industry representatives could benefit from additional
trainingcapacity building and platforms to share experiencesreceive information with regards the
practicalities of these regulations and available energy efficiency technologies The needs for each
group can be determined through a gap-analysis which we recommend to be carried out by an
independent consultant in cooperation with the flag and port states Once the specific needs for each
group have been determined they can be addressed through the following awareness raising
measures
Capacity Building (workshops trainings)
Workshopstrainings could be organised where formal training is combined with open discussions where
experiences could be shared just within one stakeholder group or between educational institutes
auditors operational managers of ships shipbuilders and authorities Such trainingsworkshops could
focus on just one or all aspects relating to the applicable rules available energy efficiency measures or
assessment methods of technologies (eg training in calculating and verifying EEDI and SEEMP
including development of tools to calculate EEDI and SEEMP) Trainingsworkshops can be local or
regional Sending people physically to regional workshops is generally more conductive to networking
and experience sharing but less adapted to the local situation and more costly
To reduce the costs of training and ensure a certain level of training the IMO or other qualified
international partners (eg WMU) could develop model courses for training In order to better
understand the rules and regulations in detail people use the help of trainers to better understand the
elements that are important for them and to gain experience in doing calculations and other required
24 Ad Hoc Expert Working Group on Facilitation of Transfer of Technology for Ships 2nd Meeting 25 httpwwwftcomcmss0dadcb240-3d97-11e3-b754-00144feab7dehtmlaxzz3aqC3tmNu
TRANL15371 18
activities by the regulations Trainers have to develop their courses and earn back their investments
via trainings Since the trainers are doing this simultaneous it would be more efficient if there would
be a model course available that can easily be tailored to the audience This would reduce the costs for
the development of trainings and would also ensure that the trainers provide the same level of depth
in their trainings Since the IMO is responsible for the rules and regulations it would be the logical
responsible for the efficient implementation and therefore could take the initiative for developing model
courses
Information Sharing
Inventory of energy-efficiency technologies (for example the IMO-GEF-UNDP project) Many
studies and overviews on the internet are available The quality and the scope is often
different
Improved access to information and information sharing with international recognised
organisations including relevant survey and certification training One example of
establishing information sharing between governments is the work of the OECD Council
Working Party on Shipbuilding (WP6)26 which organises regular workshops aimed at
facilitating the exchange of information on policy and industry developments
Note that many of these measures overlap with the measures required to overcome institutional
barriers as laid out in section 43
Agreements between industry and administrations could be envisaged to overcome the
barriers
In order to enhance the sharing of expertise for both administrations and industry technology transfer
and technology cooperation agreements could be formulated in order to strengthen the cooperation
As identified before the technology transfer to the ship building industry is not a mayor barrier so the
agreements should help the administrations to become more aware of the possibilities to further
promote the implementation of MARPOL Annex VI
Typical agreements between industry and administrations could be in the form of initiatives like the
Sustainable Shipping Initiative (SSI) SSI members have developed a vision for a sustainable shipping
industry in 2040 They commit to working towards this in all their own operations andor activities that
involve shipping and in all their dealings with and support for the shipping industry to make their vision
a global reality by 2040 SSI members of over 19 companies represent ship owners and charterers
shipbuilders engineers and service providers banking insurance and classification societies The SSI
explored for instance how to overcome barriers to the uptake of new technologies and techniques which
improve the operational efficiency of ships potentially delivering energy efficiency savings of 10 or
more and payback periods of less than 5 years They also produce case studies to show good examples
and also develop tools By involving administrations in these kind of initiatives (even free of charge)
they could be actively supported with knowledge about sustainable shipping
26 httpwwwoecdorgstiindworkshopongreengrowthinshipbuildinghtm
TRANL15371 19
Technology Concerns
Barriers Technology Concerns
One of key barriers to the implementation of energy efficient technologies (new and retrofit) relates to
the lack of or limited technology supply chain Furthermore the lack of a technology base for RampD in
some states is a barrier Also the existence of concerns relating to the ability of available energy
efficiency measures to reduce emissions and operational costs and their compatibility with other
measures of energy efficient technologies is a barrier This is typically the problem in very isolated ship
yards
Measures forward
Very successful shipyards (Japan and Korea) have already since many years a large number of
licencing technology transfer and similar agreements and continuously exchange information with
competitors in and outside their countries For instance US shipyards have adopted this methodology
since the 1980s (office of technology assessment 1983)
Further technology sharing could be stimulated through educationalRampD institutes locally regionally
or globally in ship design and building The technology will be transferred to the ship builders once the
students start working there or through cooperation between industry and university In order to
facilitate this we recommend the establishment of partnerships to share expertiseexperience
Typically individuals who know both worlds are the driving force behind successful partnerships (AISBL
2012) These partnerships are built around a shared long term research vision Many partners could
contribute (eg financially) in order to establish the responsible management and research programme
The target of the platform could be for example to provide verified information on real-world energy
efficiency improvements via a monitoring programme
For example in order to stimulate the deployment of energy efficient trucks the Dutch government
provides a website to share audited knowledge and data on about 15 energy efficiency technologies27
Additionally climate financing could be leveraged to reduce the investment risk in unproven
technologies For example IMO Member States could create a demonstration fund that can function as
a guarantee for investments in new and immature technologies28 Similarly investment guarantees
can be provided by funds in the same way governments provide export credits to their companies If
the technology does not deliver the expected fuel-savings the fund can cover the difference and hence
reduce investment uncertainty The main objective being to reduce investment risk
Institutional Concerns
Barriers
27 httpwwwtruckvandetoekomstnl 28 An example of a specific EE fund is httpwwweeefeueligible-investmentshtml
TRANL15371 20
For Flag and Port States complying with new regulations of IMO and EEDI and SEEMP particularly
represent and increased administrative burden It requires revisions and amendments of existing
legislation that need to be implemented at Port and Flag State functions There is currently limited
technical capacity in state institutions to implement these changes especially in developing countries
with a relatively low number of ships under their flag
The lack of financial resources is also a barrier for additional compliance and enforcement activities by
maritime administrations This is particularly an issue for least developed countries and small
developing island states Implementation costs are relatively higher for small Flag States because of
limited abilitycapacity to implement new technical regulations Note that this issue is not specific to
the EEDI and the SEEMP but to most regulatory measures (maritime or other)
Measures forward
Measures to assist states in implementing (existing and new) legislation include
Promote an increased cooperation and communication between administrationswithin
regional administrations of Port and Flag States similarly to what has been suggested in
sections 41 (Awareness raising through capacity building activities such as workshops) and
42 (Establish platform to share regulatory expertiseexperience) Platforms could be
managed by IMO in conjunction with industry and development funds in order to share the
costs as this has been done before for GloBallast for example In that case the IMO is in the
lead (executing agency) but the platform is supporting the collaboration with many
stakeholdersfunding partners The goal of the programme is to assist developing countries
eg via e-learning courses
In addition deterrents need to be put in place to discourage Flag States from performing
substandard inspections A system for detecting sub-standard inspections should be
implemented whereby mandatory Port State Control inspections are carried out in close
proximity to mandatory Flag State inspections (ie the Flag State inspection is carried out
prior to the ship leaving port and the Port State inspection is carried out upon arrival at port)
The two inspections should be carried out under a uniform mandatory checklist The IMO
should monitor inspections and investigate where discrepancies between inspections close in
proximity are detected If a Flag or Port State is found to have failed to meet the requisite
inspection standards penalties in the form of substantial fines should follow
In order to overcome the financial barriers financial assistance to states could help with
capacity building and implementation Financial resources are not only needed in the
implementation of the new regulations (training of government experts) but governments of
Flag States also need to be involved continuously in the ongoing discussion around
developments new EEDI targets for 2020 and beyond which requires continuous availability
of experts to represent the interests of the state (Metselaar 2015) Financial aid can therefore
be supplied in the following forms
Increased financial support for compliance and enforcement activities by maritime
administrations
Financial support could be provided to Flag States so that they have the resources to
properly carry out vessel inspections Consideration should be given to the introduction of
TRANL15371 21
an International Fund Convention set up for this purpose and contributed to by Port
States andor their major oil and other cargo exporters and importers
Commercial
Barriers
Private parties such as ship owners and investors are not always commercially incentivised to make
investments in energy efficiency measures This can be due to the split incentives between owner (who
should make the investment) and charterer (who reaps the cost savings) of a ship (see paragraph 25)
Furthermore access to finance can be problematic for smaller players who operate in niche markets
Measures
Bottlenecks in financing private investments and new financing mechanisms could be addressed during
regional or international workshops that include traditional and new financiers that could finance
investments in energy efficiency technologies
One solution that has been brought forward to address the problem of split incentives is the use of
lsquosmart contractsrsquo (Michele Acciaro 2013) The idea is to change charter contracts in a way that risks
and benefits are shared among charterers and ship owners In such contracts speed choice is more
flexible and the chartering cost of vessels is closer to fuel cost as such ship owners get motivated to
invest in energy-efficient technologies and charterers get stimulated to run vessels in an energy
conserving manner
With respect to the shipbuilding industry the following could facilitate the transfer of technology as
well
Financial assistance to shipyards to be provided at the national level or through other
arrangements
Foreign direct investment in software and hardware as an innovative way to support industry
in implementing the requirements
One type of incentive that governments can provide to enhance industry performance and technology
adoption is a competition for top performers Governments could contribute to a fund from which
money is distributed to the top 10 of best performers in a particular year
Cost estimates
Workshops and training
Capacity building workshops for administrations are estimated at euro 1000 per attendee for an
online workshop (1-2 days) Costs for the organisation of such workshops would include expert fees
and administrative costs These costs could be lower if the course material is already developed
(model workshops) Eg 2 attendees per Flag State for the ten most important Flag States
TRANL15371 22
(covering 74 of total fleet tonnage) comes down to euro 20000 or less in case the courseware is
already existent
A situation that is more conductive to networking and experience sharing is to send people physically
to regional workshops The costs of such workshops including participants travel and hotels for 50
participants would be between euro20000 - euro100000 per workshop based on our international
experience with organising workshops in the field of renewable energy and energy efficiency Costs
could be lower depending on the amount of preparation required cost of location (could be sponsored
by participating states)
Technical training
Trainings already exist for calculating and verifying EEDI including development of tools to calculate
EEDI For example MARIN offers 32h courses over 5 days in the Netherlands for euro 5000 per attendee
(excluding travel and accommodation)29 Lloyds offers similar trainings for similar costs30
Model courses for training may need to be updated depending on identified needs Ecofys estimates
the update of eg an existing EEDI model courses to cost in the order of euro 50000
Online platform for inventory of energy efficiency technologies
Inventories of energy-efficiency technologies already exist (for example in reports like (IMO 2009) and
on websites of for instance DNV-GL the efficiency finder31) but they could be further developed since
the websites are either not independent or incomplete
In order to facilitate information exchange a web-based platform could be established The role of the
platform would be for example to provide verified information on real-world energy efficiency
improvements via a monitoring programme For example in order to stimulate the deployment of
energy efficient trucks the Dutch government provides a website to share audited knowledge and data
on about 15 energy efficiency technologies32 The costs of such a website and corresponding
programme are estimated to be around euro 2 million for a 4 year period Furthermore a platform can be
used to inspire others by showing best practices and can be used for sharing of information regarding
network opportunities like conferences and seminars
Capacity building project
Currently the IMO-GEF-UNDP GloBallast project is a capacity building project it assists developing
countries and their maritime industries in implementing international regulations on ballast water
29 httpwwwmarinnlwebEventsCoursesSpecialist-Course-on-Ship-propulsion-model-tests-and-SpeedPower-trials-for-EEDI-Verifiers-
2731-October-2014htm 30 httpwwwlloydslistcomllsectorship-operationsarticle422262ece 31 httpswwwdnvglcommaritimeenergy-efficiencyefficiency-finderhtml 32 httpwwwtruckvandetoekomstnl
TRANL15371 23
management and preventing risks arising from the transfer of harmful aquatic organisms And has
several aspects that could also be used for knowledge transfer of energy efficiency measures
web-site
e-learning course
databasesdirectories
library collections
newsletter
Regional Task Force (RTFs) to support development and adoption of a regional approach
Develop and implement communication education awareness raising and outreach
programme
Develop introductory and more specialised training packages
Develop model legislations
The total budget for the 2008-2012 period was US$23 million out of which US$564 million represents
a GEF grant the rest being mostly in-kind contributions from the participating countries regional co-
ordinating organisations (RCO) and strategic partners including the private sector
Improved access to information and information sharing with international recognised organisations
including relevant survey and certification training would further promote the different technologies
TRANL15371 24
Conclusions
This study provides an overview of existing technologies which could drastically improve the energy
efficiency of ships Furthermore barriers to transfer and uptake of energy efficient technologies are
analysed and categorised and implications of these barriers are listed in order to facilitate the uptake
of energy efficiency technologies for ships
From this research it is clear that conventional technology is available that can cost-effectively (with a
payback time of less than 15 years) achieve high efficiency gains If the maximum gains per category
are added up (for all but ferry and cruise) this would mean a total efficiency improvement of 35
Even without taking two experimental technologies with potentially high efficiency gains into account
(wind power and air lubrication)
High investments like wind power and contra rotating propellers bring the highest savings (13 ndash 20)
The medium investments are in-between (5-10) and the low investments only bring relatively small
energy efficiency improvements (lt5)
When the ship owner has too few opportunities to share investment with charterers this leads to a split
incentive a ship owner may invest the up-front capital to put in energy-efficient technology but not
receive the benefits This is typically a problem for investments with a high payback time ie the wind
power and contra rotating propellers
The main barriers are related to the transfer of technology to Flag States Flag States are generally
third world and developing nations that often do not have the resources to enforce investigate or
prosecute breaches by their flagged vessels
Several ways to overcome the knowledge transfer barriers were presented that can be categorised as
follows
Workshops and trainings
o Capacity building workshops for administrations
o Regional workshops
Technical training
o Training in calculating and verifying the EEDI
o Development of model courses
Online platform
o Inventory of energy-efficiency technologies
o Creation of a website with all relevant information for the target audience
o Improved access to information and information sharing
o Provide verified information on real-world energy efficiency improvements via a
monitoring programme
TRANL15371 25
The most expensive of the capacity building actions is the capacity building project which takes all
aspects above into account If a project would be developed for knowledge transfer regarding energy
efficiency measures similar to GloBallast which assists developing countries and their maritime
industries in implementing international regulations on ballast water management and preventing risks
arising from the transfer of harmful aquatic organisms the total budget needed would be in the order
of US$23 million for a period of 5 years
TRANL15371 26
References
JFE Group 2013 ldquoJapan Marine Unitedrdquo JFE Group Overview JFE Group AISBL 2012 Making Industry-University partnerships work lessons from succesful collaborations
report Belgium AISBL
Allenstroumlm Bjoumlrn 2013 ldquoWind propulsionrdquo SSPA Sweden AB Gothenburg EffShip March
Aqorau T 2000 Illegal Unreported and Unregulated Fishing Considerations for Developing
Countries paper Honiara Solomon Islands South Pacific Forum Fisheries Agency
BALance 2014 Competitive position and future opportunities of the Euroean Marine Supplies
industry BALance Technology Consulting
Barringhaus David and Robert Olds 1999 OLDS ENGINEERING Maximizing Propulsion Efficiency
Marine Division Accessed Februrar 2015
httpwwwoldscomaumarinemaximizing_propulsion_efficiency
Becker Marine System not dated Becker Bulb Rudders httpwwwbecker-marine-
systemscom05_downloadszzpdfproduct_pdfBecker_Bulb_Rudderspdf Becker Marine
System
mdash 2015 Twisted Full Spade Rudder Accessed Feb 2015 httpbecker-marine-
systemscom03_productsproducts_twisted_full_spadehtml
Bloomberg 2014 China Loses Shipbuilding Crown to South Korea Chart of the Day 9th December
httpwwwbusinessweekcomnews2014-12-09china-loses-shipbuilding-crown-to-south-
korea-chart-of-the-day
Bluebird-Electric 2014 Sipbuilding post World War Two httpwwwbluebird-
electricnetship_boat_design_buildingshipbuilders_ship_repairers_associationhtm
Boat design 2007 Accessed Feb 2015
httpwwwboatdesignnetforumsattachmentspropulsion16743d1193341389-new-
propulsion-sytems-ships-grim-prop-1jpg
Brannigan Paschos Eyers and Wood 2009 Report on International avialtion and Mritime Emissions
in a Copenhagen (post 2012) Agreement Oxfordshire AEA Group
Chen Benjamin Arthur Reed and Ki-Han Kim 1989 A Vane-Wheel Propulsor for a Research and
Development Report Newport David Taylor Research Center
CNSS 2015 Clean North Sea Shipping - Clean Shipping Technology Accessed Februar 2015
httpcleantechcnssnoghg-technologiestechnical-measuresmeasures-related-to-the-hull
Crist Philippe 2009 Greenhouse gas emissions reduction potential from international shipping
Working paper OECD
Daily Times 2015 Nigeria Turkey seek collaboration on ships shipyards 5th January
httpwwwdailytimescomngarticlenigeria-turkey-seek-collaboration-ships-shipyards
Dillingham Gerald L 2000 Progress Made to Reduce Marine Pollution by Cruise Ships but Important
Issues Remain GAO report Washington United States General Accounting Office
DK Group 2015 Silverstream technologies January Accessed January 2015 httpdkgroupeu
DNV 2014 Encouraging Construction and Operation of Green Ships OECD
httpwwwoecdorgstiindC-WP6(2013)12-FINAL-ENGpdf
TRANL15371 27
DNV GL 2015 EFFICIENCY FINDER Accessed Feb 2015 httpwwwdnvglcommaritimeenhance-
performanceefficiency-finderaspx
Ecorys 2012 ldquoGreen growth opportunities in the EU shipbuilding sectorrdquo
ECOSPEED 2015 EUROPEAN MARINE amp MACHINERY AGENCIES LTD Accessed February 2015
httpwwweuropeanmarinecoukECOSPEEDhtm
gcaptain 2012 gcaptain - Propeller Technology to Make Your Ship More Efficient - Accessed Feb
2015 httpgcaptaincompropeller-technology-ship-efficient
Hansen Dinham-Peren and Nojiri 2011 Model and Full Scale Evaluation of a lsquoPropeller Boss Cap
FinsrsquoDevice Fitted to an Aframax Tanker Second International Symposium on Marine
Propulsors smprsquo11 Hamburg Germany June 2011
Hellenic Shipping News 2014 Korean ships sell at fuel-saving premium 22nd December
httpwwwhellenicshippingnewscomkorean-ships-sell-at-fuel-saving-premium
Hindawi 2015 Hindawi Puplishing Cooperation Accessed February 2015
httpwwwhindawicomjournalsijrm2012474785fig4
Hochkirch Karsten and Volker Bertram not dated ldquoSlow Steaming Bulbous Bow Optimization for a
Large Containershiprdquo Accessed Februar 2015 http2021148960resourcepdf5096pdf
Hollenbach Uwe and Juumlrgen Friesch not dated Efficient hull forms ndash What can be gained
Conference ship-efficiency Hamburg 2013 Hamburg HSVA Hamburgische Schiffbau-
Versuchsanstalt GmbH HamburgGermany
ICCT 2011 Reduce Greenhouse Gas Emissions from Ships - Cost Effectiveness of Available options -
white paper Washington DC International Council on Clean transportation (ICCT)
IMO 2011 REDUCTION OF GHG EMISSIONS FROM SHIPS Marginal Abatement Costs and Cost
Effectiveness of Energy-Efficiency Measures Submitted by the Institute of Marine Engineering
Science and Technology (IMarEST) MEPC 62INF7 International Maritime Organisation
IMO 2009 Second IMO GHG Study 2009 London International Maritime Organisation
JSEA 2006 ldquoImproved propulsive performance - Universal applies new energy-saving type Leadge
Bowrdquo Japan Ship Exports Association (JSEA) httpwwwjseaorjpVariableJSea318pdf
Kawasaki 2015 Energy-saving Technology Accessed Feb 2015
httpswwwkhicojpenglishshiptechconservationindexhtml
Leddy Fiona Jayne 2012 ldquoA critical legal analysis of International Shipping in Australian Waters and
the risk of ship-based oil pollutionrdquo Queensland Environmental Practice Reporter vol 17
Marinelog 2014 China white lists 51 shipyards 4 September
httpwwwmarinelogcomindexphpoption=com_k2ampview=itemampid=7667china-white-
lists-51-shipyardsampItemid=231
Metselaar Kees interview by Arno van den Bos 2015 Policy officer at directorate maritime affairs of
ministry of Intrastructure and Environment (February)
Michele Acciaro Peter Nyegaard Hoffmann Magnus Strandmyr Eide 2013 ldquoThe Energy Efficiency
Gap in the Maritime Transportrdquo Journal of Shipping and Ocean Engineering 1-9
MIWB 2015 Maritiem Instituut Willem Barentsz Accessed Feb 2015
httpsmijnmiwbnlnieuwsbriefindexphpdo=showampid_artikel=116
MOL 2011 Energy-Saving Propeller Boss Cap Fins System Reaches Major Milestone - Orders
Received for 2000 Vessels Accessed Feb 2015
httpwwwmolcojpenpr20111145html
TRANL15371 28
Motorship 2014 Gas fuelled ships into the future 31 10 httpwwwmotorshipcomnews101ships-
and-shipyardsgas-fuelled-ships-into-the-future
Nakashima 2015 Nakashima propeller CO LTD Accessed Feb 2015
httpwwwnakashimacojpengproductrudderhtml
Nielsen Shin Lundgren and Faghani not dated Combined Kappel propeller and rudder bulb system
for improved propulsion efficiency Frederikshavn MAN Diesel amp Turbo
OECD 2014 The OECD Council Working Party on Shipbuilding
httpwwwoecdorgindustryindshipbuildinghtm
OECD 2011 ldquoThe Shipbuilding Industry in Turkeyrdquo
office of technology assessment 1983 An Assessment of Maritime Technology and Trade report
Washington DC US Congress
Pakarinen Risto 2007 ldquoNothing common about common railrdquo Twentyfour7 (Twentyfour7) 64-65
Ports amp Ships 2015 Ports and Ships Accessed February 2015
httpportscozanewsarticle_2007_10_17_4038html
Rolls-Royce 2014 Propulsors - Moving your business in the right direction httpwwwrolls-
roycecom~mediaFilesRRolls-Roycedocumentscustomersmarinepropulsion-2014-
tcm92-8664pdf Aalesund Rolls-Royce Commercial Marine httpwwwrolls-
roycecom~mediaFilesRRolls-Roycedocumentscustomersmarinepromaspdf
Schneekluth H and V Bertram 1998 Ship Design for Efficiency and Economy Oxford
Butterworth-Heinemann
Schulze Reinhard 2007 Twisted Rudder - Extreme Design 14 SVA-Forum bdquo Ruder in Theorie und
Praxisldquo Potsdam 7 November 2007 Potsdam Schiffbau-Versuchsanstalt Potsdam GmbH
Selenetrawlers 2015 Selenetrawlers Accessed February 2015
httpwwwselenetrawlerscomcompanydesign-notes
Sepideh Jafarzadeh Ingrid Bouwer Utne 2014 ldquoA framework to bridge the energy efficiency gap in
shippinrdquo Energy 603-612
SetSail 2009 SetSail Accessed February 2015 httpwwwsetsailcomprop-nozzle-comments-by-
an-expert
Shuto Hideki 2010 Super Eco Inland Vessels httpwwwccr-
zkrorgtempwrshp120411Presentations2_04_HShuto_enpdf IHI Marine United Inc
Silberschmidt Noah 2014 ldquoGenerating efficiencies from thin airrdquo SMM Green shipping | Efficiency
httpwwwsilverstream-techcomwp-contentuploads201404HANSA-241112pdf
httpwwwsilverstream-techcomwp-contentuploads201404HANSA-241112pdf
Skinner Ian 2009 EU Tranport GHG Routes to 2050 Technical options for maritime and inland
shipping httpwwweutransportghg2050eucmsassetsTechnical-options-maritime-inland-
waterpdf Brussel European Commission
Statista 2015 ldquoLargest shipbuilding nations in 2013 based on completions in gross tonnagerdquo
httpwwwstatistacomstatistics263895shipbuilding-nations-worldwide-by-cgt
UK DfT 2014 ldquoDfT Port Statistics - World fleet registered trading vessels of 100 gross tons and over
gross tonnage on selected registers 1999-2013rdquo
httpswwwgovukgovernmentcollectionsmaritime-and-shipping-statisticsdata-tables-
associated-with-this-series
TRANL15371 29
Voorham 2013 Assessment of sustainable investment in shipping Master Thesis
Report SDPO13029m Delft 27 th November 2013 Delft Delft University of Technology
WAumlRTSILAuml 2009 ldquoEnergy Evironment Economyrdquo Helsinki Finland WAumlRTSILAuml
mdash 2007 ldquoWaste heat recoveryrdquo Waumlrtsilauml Corporation
Wettstein and Brown 2008 Derating a solution for high fuel savings and lower emissions
Winterthur Waumlrtsilauml Switzerland Ltd
Wind Chellenger Project HP 2015 Wind Chellenger Project HP Accessed Feb 2015 httpwindku-
tokyoacjpindex_enhtml
TRANL15371 30
Appendix I - World fleet registered trading vessels
Table 3 World fleet registered trading vessels of 100 gross tons and over 2009-2013 Source UK DfT 2014
Flag Country 2009 2010 2011 2012 2013
(World Total) 8448 9130 9831 10343 10725
Panama 1886 1979 2084 2158 2172
(European Union) 1900 1979 2074 2051 2106
Liberia 908 1037 1167 1238 1241
Marshall Islands 475 590 711 811 900
Hong Kong 449 553 678 785 854
Singapore 398 434 512 592 677
Malta 348 380 438 450 496
Bahamas 452 469 481 483 485
Greece 388 407 411 411 415
China 282 327 356 388 411
United Kingdom (inc IOM and CI) 258 273 294 300 288
Cyprus 201 205 207 197 203
Japan 138 156 167 178 192
Italy 150 169 181 180 176
Norway 152 145 143 144 145
Germany 152 155 153 137 123
Denmark 107 115 113 113 122
Korea South 120 124 116 111 112
Indonesia 69 82 91 101 111
Bermuda 94 100 106 109 105
Antigua amp Barbuda 100 107 111 106 100
United States of America 107 108 102 99 97
India 83 83 89 85 82
Netherlands 76 61 67 66 69
Turkey 54 58 62 64 59
Malaysia 69 72 71 62 57
France 63 63 64 56 53
Russia 47 49 49 51 52
Philippines 50 51 50 43 43
Cayman Islands 27 29 32 32 31
Taiwan 25 26 27 30 31
Iran 09 08 05 21 31
Thailand 25 26 22 26 29
Sweden 39 35 33 28 27
St Vincent amp the Grenadines 47 42 37 28 24
Canada 24 24 25 24 23
Spain 22 25 26 25 23
Kuwait 23 19 24 24 22
Brazil 20 20 19 19 20
Cambodia 18 17 13 13 12
TRANL15371 31
Appendix II - Most important shipbuilding
countries
China
China is an emerging shipbuilder that overtook South Korea during the 2008-2010 global financial crisis
as they won new orders for medium and small-sized container ships (Bloomberg 2014 Bluebird-Electric
2014)
Figure 14 delivery of vessels from Chinese and South Korean shipyards in million compensated gross tons a measure
of building time and human resources used per ton Source (Bloomberg 2014)
China has more than 1600 shipyards Analysts have predicted that about one third of them will fold
as the industry struggles with overcapacity Last year China laid out a three year plan for industry
restructuring that urged yards to concentrate on building higher quality vessels and local governments
to halt approvals for new projects (Bluebird-Electric 2014)
After two decades of a loan-fuelled boom Chinarsquos shipbuilding industry has become saddled with debt
and overcapacity prompting some private firms to seek financial assistance from the state In
September the government issued a list of 51 shipbuilders it deemed worthy of public support
(Marinelog 2014)
TRANL15371 32
New additions to the white list include subsidiaries of the China State Shipbuilding Corporation (CSSC)
and the China Shipbuilding Industry Corporation (CSIC) and the AVIC Weihai Shipyard owned by the
Aviation Industry Corporation of China (AVIC) (Marinelog 2014)
South Korea
By the end of 2014 it seemed South Korea has overtaken China again as the worlds largest
shipbuilding country with a global market share of about 30(see Figure 14) (Bloomberg 2014)
(Bluebird-Electric 2014) South Korea leads in the production of large vessels such as cruise liners
super tankers LNG carriers drill ships and large container ships
South Koreas shipyards are highly efficient with the worlds largest shipyard in Ulsan operated by
Hyundai Heavy Industries slipping a newly built $80 million vessel into the water every four working
days South Koreas big three shipbuilders Hyundai Heavy Industries Samsung Heavy Industries
and Daewoo Shipbuilding amp Marine Engineering dominate global shipbuilding with STX Shipbuilding
Hyundai Samho Heavy Industries Hanjin Heavy Industries and Sungdong Shipbuilding amp Marine
Engineering also ranking among the top ten shipbuilders in the world In 2007 STX Shipbuilding further
strengthened South Koreas leading position in the industry by acquiring Aker Yards the largest
shipbuilding group in Europe (The former Aker Yards was renamed STX Europe in 2008) In the first
half of 2011 South Korean shipbuilders won new orders to build 25 LNG carriers out of the total 29
orders placed worldwide during the period
To maintain their market position Korean yards also focus more and more on greening opportunities
The Korean government introduced a GHG emission reducing program in 2008 The program is aiming
at reducing GHG emissions throughout all economic sectors including the shipping and shipbuilding
industry Also the Japanese Shipbuilding Association (SAJ) is looking into the possibilities to reduce
GHG emissions so that the shipbuilding industry becomes greener and more competitive (Ecorys
2012)
Japan
Japan had been the dominant ship building country from the 1960s through to the end of 1990s but
gradually lost its competitive advantage to the emerging industry in South Korea which had the
advantages of much cheaper wages strong government backing and a cheaper currency South Korean
production overtook Japans in 2003 and Japanese market share has since fallen sharply
The Philippines
The Philippines has placed fourth among shipbuilding nations around the world producing more than
six million deadweight tonnes of ships built in 2012 The country is anchored by South Korean Hanjin
and Japans Tsuneishi shipbuilders The country has shipyards in Subic and Cebu
TRANL15371 33
Europe
For several decades European shipyards have been facing strong global competition from especially
Asian enterprises (Japanese yards in the 1950s and 60s Koreans from the 1970s and 80s and Chinese
since the 1990s) In Europe this has led to an almost complete exit from the mass production segments
of tankers bulkers and containerships Response of the EU industry has been to focus on the higher
value more complex ship types such as ferries and passenger ships non-cargo vessels and general
cargo ships In addition only limited numbers of vessels of the same type are being built (in contrast
with bulk vessels which are mass produced) Europe has a 77 percent market share in building
passenger vessels (including both cruise ships as well as ferries) and a 17 percent share in the
construction of non-cargo vessels (Ecorys 2012) These segments make up a relatively small share of
the world orderbook (in CGT) However in value they represent a much higher share due to their
relatively sophisticated characteristics The position of the European shipbuilding industry in the
manufacturing of specialised innovative vessels is still strong At the same time European equipment
manufacturers have acquired a leading role in quality products especially in complex high value
equipment components
Figure 15 World orderbook and CESA orderbook by ship type in 2010 (CGT x 1000) (Source Ecorys 2012)
Regarding the marine equipment sector the European industry is renowned for propulsion cargo
handling communication automation environmental and security systems This equipment is not only
destined for complex European-built ships but also exported to Asian yards whether or not requested
by their clients (Ecorys 2012)
Compared to the ship construction sector the marine equipment segment is highly heterogeneous and
consists of companies that are often also active in other business areas (ie automotive or aircraft
industry) A study by (BALance 2014) found that the European marine equipment industryrsquos
TRANL15371 34
competitiveness lies in a strong market position and technological leadership at least for globally active
European marine supply companies who build their position on a strong infrastructure and co-operative
partners skill of their employees and close relationship with their customer base Conversely identified
weaknesses are the cost level in Europe and the heterogeneous structure of the industry with many
SMEs which hinder in some cases attempts to follow the markets by globalisation strategies
Turkey
Shipbuilding in Turkey has evolved from an old traditional activity in Anatolia to an internationally
recognised industry especially since the early 1990s The industry has modern shipyards that can build
ships yachts mega-yachts and sailing boats as well as carrying out extensive repair and conversion
works Turkeyrsquos shipyards are mainly located in the Marmara Region namely Tuzla Yalova and İzmit
which have developed into dynamic shipbuilding centres Also in recent years the emerging Black Sea
and Mediterranean Regions have increasingly attracted shipyard investments
In the last decade in parallel with developments in the global market Turkish shipbuilding experienced
a several-fold increase in its shipbuilding and export capacity including a significant product
diversification According to order books this resulted in Turkey being regularly placed in the top ten
countries on the basis of its deadweight (dwt) production and in the top five countries by the number
of ships
In recent years Turkey has increasingly tapped into niche markets which in turn has led to a growing
participation by Turkish shipyards in the international trade in new ships In parallel there has also
been strong growth in the marine equipment manufacturing sector which could increasingly also tap
the export market These developments reflect in part the strategic location of the yards the
experienced workforce the quality of production and Turkeyrsquos significant role as a political cultural and
economic bridge between Europe and Central Asian and Middle Eastern economies (OECD 2011)
ECOFYS Netherlands BV | Kanaalweg 15G | 3526 KL Utrecht| T +31 (0)30 662-3300 | F +31 (0)30 662-3301 | E infoecofyscom | I wwwecofyscom
ECOFYS Netherlands BV
Kanaalweg 15G
3526 KL Utrecht
T +31 (0) 30 662-3300
F +31 (0) 30 662-3301
E infoecofyscom
I wwwecofyscom
HOW TO OBTAIN EU PUBLICATIONS
Free publications
bull one copy
via EU Bookshop (httpbookshopeuropaeu)
bull more than one copy or postersmaps
from the European Unionrsquos representations (httpeceuropaeurepresent_enhtm)
from the delegations in non-EU countries
(httpeeaseuropaeudelegationsindex_enhtm)
by contacting the Europe Direct service (httpeuropaeueuropedirectindex_enhtm)
or calling 00 800 6 7 8 9 10 11 (freephone number from anywhere in the EU) () () The information given is free as are most calls (though some operators phone boxes or hotels may charge you)
Priced publications
bull via EU Bookshop (httpbookshopeuropaeu)
Priced subscriptions
bull via one of the sales agents of the Publications Office of the European Union
(httppublicationseuropaeuothersagentsindex_enhtm)
doi 102834880780
ML-0
1-1
5-4
39-E
N-N
[Ca
talo
gu
e n
um
be
r]
ECOFYS Netherlands BV | Kanaalweg 15G | 3526 KL Utrecht| T +31 (0)30 662-3300 | F +31 (0)30 662-3301 | E infoecofyscom | I wwwecofyscom
Chamber of Commerce 30161191
Abstract
At global level the International Maritime Organization adopted several measures which are aimed at improving the energy efficiency of shipping This report identifies the most important barriers which prevent the effective implementation of the measures and provides a list of possible measures to overcome these barriers
One of the major barriers to the effective implementation of the measures is the heavy reliance it places on Flag States for inspection of vessels and enforcement of provisions Some of these Flag States are not signatories to all MARPOL Annexes which also hampers the implementation of the measures Flag States where most merchant ships are registered are commonly developing nations Flag States have less resources to properly carry out vessel inspections Consideration should be given to transfer knowledge to these states in order to further stimulate the adoption of energy efficiency technologies
This reports provides a list of fourteen energy efficiency measures that both provide a large energy efficiency improvement and can be implemented in many ships in order to identify which measures should be included in the capacity building Furthermore this report provides cost estimations for several capacity building options like workshops trainings and an online platform
ECOFYS Netherlands BV | Kanaalweg 15G | 3526 KL Utrecht| T +31 (0)30 662-3300 | F +31 (0)30 662-3301 | E infoecofyscom | I wwwecofyscom
Chamber of Commerce 30161191
Executive Summary
In July 2011 the International Maritime Organization (IMO) adopted two energy efficiency measures
which entered into force in 2013 the Energy Efficiency Design Index (EEDI) for new ships and the Ship
Energy Efficiency Managements Plan (SEEMP) for all ships Nevertheless the IMO recognises the need
for further action to reduce emissions from international shipping in view of the continued expected
growth of the world economy and associated transport demand
One of the major barriers to the effective implementation of the EEDI and the SEEMP is the heavy
reliance it places on Flag States for inspection of vessels and enforcement of provisions Some of these
Flag States are not signatories to all MARPOL Annexes which also hampers the implementation of the
measures Flag States where most merchant ships are registered are commonly developing nations
Such Flag States often have less resources to properly carry out vessel inspections Consideration
should be given to transfer knowledge to these states in order to further stimulate the adoption of
energy efficiency technologies The most important technologies regarding efficiency improvement are
summarised in the table below
Table Energy Efficiency Measures for ships
Main category Measure Efficiency at average circumstances
Ease of installation Payback time Investment
Hull Bow optimisation
10 all ship types short (lt3 years)
Medium
Main Engines Wind power 20 only special ship types long (gt15 years)
High
Propellers and Rudders Ducted propeller 10 all ship types except ferry and cruises
medium (4-15 years)
Medium
Propellers and Rudders Contra-rotating propellers
13 only special ship types long (gt15 years)
High
Propellers and Rudders Wheels 10 all ship types except ferry and cruises
short (lt3 years)
Medium
Control Systems Waste heat recovery
8 new build only medium (4-15 years)
Medium
Propellers and Rudders Rudder bulb 4 all ship types except ferry and cruises
medium (4-15 years)
Low
Propellers and Rudders Post swirl fins 4 all ship types except ferry and cruises
short (lt3 years)
Low
Hull Hull coating 5 all ship types short (lt3 years)
Low
Hull Air lubrication 9 new build only medium (4-15 years)
Medium
Propellers and Rudders Twisted rudder 3 all ship types except ferry and cruises
medium (4-15 years)
Low
Main Engines Main engine de-rating
3 all ship types except ferry and cruises
medium (4-15 years)
Low
Auxiliary engines Common rail upgrade
- all ship types medium (4-15 years)
Very Low
Main Engines Common rail upgrade
03 all ship types medium (4-15 years)
Very low
ECOFYS Netherlands BV | Kanaalweg 15G | 3526 KL Utrecht| T +31 (0)30 662-3300 | F +31 (0)30 662-3301 | E infoecofyscom | I wwwecofyscom
Chamber of Commerce 30161191
From this research it is clear that conventional technology is available to achieve high efficiency gains
It is possible to save 35 of fuel with only a few improvements that require an upfront investment
that can be earned back within 15 years High investments like contra rotating propellers and wind
power (experimental technology) bring the highest savings (13 ndash 20) The medium investments are
in-between (5-10) and the low investments only bring relatively small energy efficiency
improvements (lt5)
When the ship owner has too few opportunities to share investment with charterers this leads to a split
incentive a ship owner may invest the up-front capital to put in energy-efficient technology but not
receive the benefits This is typically a problem for investments with a high payback time ie the wind
power and contra rotating propellers
Several ways to overcome the knowledge transfer barriers were presented that can be categorised as
follows
Workshops and trainings
o Capacity building workshops for administrations
o Regional workshops
Technical training
o Training in calculating and verifying the EEDI
o Development of model courses
Online platform
o Inventory of energy-efficiency technologies
o Creation of a website with all relevant information for the target audience
o Improved access to information and information sharing
o Provide verified information on real-world energy efficiency improvements via a
monitoring programme
This report provides cost estimations for each of these capacity building options The most expensive
being a capacity building project that would take all aspects into account similar to GloBallast which
assists developing countries and their maritime industries in implementing international regulations on
ballast water management and preventing risks arising from the transfer of harmful aquatic organisms
The total budget for GloBallast for the 2008-2012 period was US$23 million
ECOFYS Netherlands BV | Kanaalweg 15G | 3526 KL Utrecht| T +31 (0)30 662-3300 | F +31 (0)30 662-3301 | E infoecofyscom | I wwwecofyscom
Chamber of Commerce 30161191
Reacutesumeacute
En Juillet 2011 lOrganisation Maritime Internationale (OMI) a adopteacute deux mesures defficaciteacute
eacutenergeacutetique qui sont entreacutees en vigueur en 2013 lrsquoIndice de Conception drsquoEfficaciteacute Energeacutetique
(EEDI en anglais) pour les navires neufs et le Plan de Gestion dEfficaciteacute Eacutenergeacutetique (SEEMP en
anglais) pour tous les navires Neacuteanmoins lOMI reconnaicirct la neacutecessiteacute de nouvelles mesures pour
reacuteduire les eacutemissions du transport maritime international compte tenu de la croissance continue de
leacuteconomie mondiale et de la demande de transport correspondante
Lun des principaux obstacles agrave la mise en œuvre des mesures EEDI et du SEEMP est lieacutee au fait que
linspection des navires et lapplication des dispositions sont de la responsabiliteacute des Eacutetats de pavillon
Certains de ces Eacutetats de pavillon ne sont pas signataires de toutes les annexes de la convention
MARPOL ce qui entrave eacutegalement la mise en œuvre des mesures Les Eacutetats de pavillon ougrave la plupart
des navires de commerce sont immatriculeacutes sont souvent des pays en deacuteveloppement Ils ont
souvent moins de ressources pour mener agrave bien les inspections de navires Il faudrait envisager de
transfeacuterer des connaissances agrave ces Eacutetats afin de stimuler davantage ladoption des technologies
defficaciteacute eacutenergeacutetique Les technologies les plus importantes concernant lameacutelioration de lefficaciteacute
sont reacutesumeacutees dans le tableau ci-dessous
Cateacutegorie principale Mesure Rendement en circonstances normales
Faciliteacute drsquoinstallation Retour sur investissement
Investissement
Coque Optimisation de la proue
10 Tous types de navires court (lt3 ans)
Moyen
Moteurs principaux Energie eacuteolienne 20 Uniquement certains types de navires
long (gt15 ans)
Eacuteleveacute
Heacutelices et Gouvernails Tuyegravere Kort 10 Tous types sauf ferry et paquebots
moyen (4-15 ans)
Moyen
Heacutelices et Gouvernails Heacutelice contrarotative
13 Uniquement navires speacuteciaux
long (gt15 ans)
Eacuteleveacute
Heacutelices et Gouvernails Roues agrave Aubes 10 Tous types sauf ferry et paquebots
court (lt3 ans)
Moyen
Systegravemes de controcircle Reacutecupeacuteration de chaleur
8 Uniquement navires neufs
moyen (4-15 ans)
Moyen
Heacutelices et Gouvernails Ampoule de gouvernail
4 Tous types sauf ferry et croisiegravere
moyen (4-15 ans)
Bas
Heacutelices et Gouvernails Ailettes de turbulence
4 Tous types sauf ferry et paquebots
court (lt3 ans)
Bas
Coque Revecirctement de coque
5 Tous types de navires court (lt3 ans)
Bas
Coque Injection drsquoair sous la coque
9 Uniquement navires neufs
moyen (4-15 ans)
Moyen
Heacutelices et Gouvernails Gouvernail tordu 3 Tous types sauf ferry et paquebots
moyen (4-15 ans)
Bas
Moteurs principaux Ralentissement du moteur (de-rating)
3 Tous types sauf ferry et paquebots
moyen (4-15 ans)
Bas
Moteur auxiliaire Modernisation du common rail
- Tous types de navires moyen (4-15 ans)
Tregraves Bas
Moteurs principaux Modernisation du common rail
03 Tous types de navires moyen (4-15 ans)
Tregraves Bas
ECOFYS Netherlands BV | Kanaalweg 15G | 3526 KL Utrecht| T +31 (0)30 662-3300 | F +31 (0)30 662-3301 | E infoecofyscom | I wwwecofyscom
Chamber of Commerce 30161191
Cette recherche montre clairement que des technologies conventionnelles sont disponibles pour
reacutealiser des gains eacuteleveacutes defficaciteacute La mise en œuvre des mesures dont lrsquoinvestissement se
rentabilise en moins de 15 ans permet deacutejagrave deacuteconomiser 35 de carburant Des investissements
eacuteleveacutes comme les heacutelices contrarotatives et leacutenergie eacuteolienne (technologies expeacuterimentales)
permettraient des eacuteconomies drsquoeacutenergies les plus eacuteleveacutees (13-20) Les investissements de taille
moyenne rapportent des eacuteconomies de 5-10 et les investissements les plus faibles apportent
relativement peu drsquoeacuteconomies (lt5)
Lorsque les proprieacutetaires de navires nrsquoont pas la possibiliteacute de partager les investissements avec les
affreacuteteurs cela megravene agrave une discordance des inteacuterecircts un armateur peut investir le capital pour des
technologies deacuteconomie deacutenergie mais nen recevra pas les beacuteneacutefices Ceci est un problegraveme typique
pour les investissements avec un temps de reacutecupeacuteration eacuteleveacute agrave savoir leacutenergie eacuteolienne et les
heacutelices contra rotatives
Plusieurs faccedilons de surmonter les obstacles de transfert de connaissances sont preacutesenteacutees qui
peuvent ecirctre classeacutees de la forme suivante
Ateliers et formations
o Ateliers de renforcement de capaciteacute pour administrations nationales
o Ateliers reacutegionaux
Formations techniques
o Formations dans le calcul et veacuterification de lrsquoEEDI
o Deacuteveloppement de cours standardiseacutes
Plateforme en ligne
o Inventaire de technologies drsquoefficaciteacute eacutenergeacutetique
o Creacuteation de site internet avec informations pertinentes pour le public cible
o Ameacutelioration de lrsquoaccegraves aux informations et partage de connaissances
o Apport drsquoinformations veacuterifieacutees sur les eacuteconomies veacuteritablement reacutealiseacutees agrave travers un
programme de monitoring
Ce rapport fournit des estimations de coucircts pour chacune de ces options de renforcement de
capaciteacutes La plus coucircteuse serait un projet de renforcement des capaciteacutes qui prendrait en compte
tous les aspects semblable au projet GloBallast qui aide les pays en deacuteveloppement et leurs
industries maritimes avec la mise en œuvre des regraveglements internationaux sur la gestion des eaux de
ballast et la preacutevention des risques de transfert dorganismes aquatiques nuisibles Le budget total
pour GloBallast pour la peacuteriode 2008-2012 eacutetait de $ US 23 millions
ECOFYS Netherlands BV | Kanaalweg 15G | 3526 KL Utrecht| T +31 (0)30 662-3300 | F +31 (0)30 662-3301 | E infoecofyscom | I wwwecofyscom
Chamber of Commerce 30161191
Table of contents
1 Introduction 1
2 Relevant Stakeholders 2
Global Shipbuilding Nations 3
Flag States and their role in the implementation of MARPOL 3
Surveys 4
Punishments for failure to comply 5
Role of Port States 6
Cooperation between Port and Flag States 6
Ship owners and charterers 6
Conclusions 7
3 Energy Efficiency Measures for Ships 9
Hull and superstructure 2
Bow optimisation 2
Hull coating 3
Air lubrication 3
Engines 4
Main engine de-rating 5
Common-rail upgrade (common-rail fuel injection) 5
Auxiliary engines and systems 6
Wind power 6
Control Systems Waste heat recovery 7
Propellers and Rudders 8
Ducted propeller (Kort Nozzle) 8
Contra-rotating propellers (CRP) 9
Post swirl devises 10
Barriers to the transfer and uptake of energy efficiency technologies for ships and
possible measures to overcome them 15
Awareness Raising 17
Technology Concerns 19
Institutional Concerns 19
Commercial 21
Cost estimates 21
Workshops and training 21
Technical training 22
Online platform for inventory of energy efficiency technologies 22
Capacity building project 22
ECOFYS Netherlands BV | Kanaalweg 15G | 3526 KL Utrecht| T +31 (0)30 662-3300 | F +31 (0)30 662-3301 | E infoecofyscom | I wwwecofyscom
Chamber of Commerce 30161191
Conclusions 24
References 26
Appendix I - World fleet registered trading vessels 30
Appendix II - Most important shipbuilding countries 31
China 31
South Korea 32
Japan 32
The Philippines 32
Europe 33
Turkey 34
TRANL15371 1
1 Introduction
The negotiations within the International Maritime Organization (IMO) on enhancing the energy
efficiency of and reducing the greenhouse gas emissions from international shipping are a top-priority
for the European Commission in view of the European Unions preference for a global measure to
address greenhouse gas emissions from shipping
In July 2011 the IMO adopted two energy efficiency measures which entered into force in 2013 the
Energy Efficiency Design Index (EEDI) for new ships and the Ship Energy Efficiency Managements Plan
(SEEMP) for all ships1 Nevertheless the IMO recognises the need for further action to reduce emissions
from international shipping in view of the continued expected growth of the world economy and
associated transport demand Consequently the IMO began working on further measures to increase
the energy efficiency of international shipping including the development of a global data collection
system as a first step in April 2014
At the time of the adoption of the EEDI and the SEEMP it was agreed to complement them with a
Resolution on the promotion of technical cooperation and transfer of technology relating to the
improvement of energy efficiency of ships The Resolution was intended to provide a framework for the
promotion and facilitation of capacity building technical cooperation and technology transfer to
support in particular in developing countries the implementation of the EEDI and the SEEMP The
Resolution was adopted in 2013 and an expert group tasked to ensure the Resolutions effective
implementation was established in April 2014
The EU is actively contributing to the work of the IMO Ad Hoc Expert Working Group on Facilitation of
Transfer of Technology for Ships (AHEWG-TT) to ensure effective implementation of the Resolution and
incidentally advance the related IMO negotiations on further measures to increase the energy efficiency
of international shipping
The goal of this project is to contribute to the work of the AHEWG-TT and to further stimulate the
effective implementation of the International Maritime Organization (IMO) Resolution on the promotion
of technical cooperation and transfer of technology2
To achieve this goal this study provides a short overview of relevant stakeholders and existing
technologies which could improve the energy efficiency of ships Furthermore barriers to transfer and
uptake of energy efficient technologies are categorised and analysed and possible measures to
overcome these barriers are being proposed
1 Amendments to MARPOL Annex VI (prevention of air pollution from ships) 2 httpwwwimoorgOurWorkEnvironmentPollutionPreventionAirPollutionPagesTechnical-Co-operationaspx
TRANL15371 2
2 Relevant Stakeholders
The IMO resolution on the promotion of technical cooperation and transfer of technology (regulation
23) is intended to support states which request technical assistance Three main categories of
stakeholders were identified that can be considered of relevance
(1) Shipbuilding nations where the ships are produced
(2) Flag States (where the ships are registered) and Port States who are allowed to inspect foreign
ships compliance to international regulations
(3) Ship owners and ship charterers who are responsible for the design and use of the ships
TRANL15371 3
Global Shipbuilding Nations
Shipbuilding nations typically provide incentives for the shipbuilding industry in their country Therefore
they play a role in the transfer of technologies to their industry
In 2012 some 3655 ships were built worldwide The largest share of the tonnage was built in China
South Korea and Japan (Figure 1)
Figure 1 Ship building in 1000 gross tons Source (Statista 2015) quoting IHS and Shipbuilders Association of
Japan
The worldrsquos leading shipyards include South Korearsquos Hyundai Heavy Industries Japanrsquos Mitsubishi
Heavy Industries and Chinarsquos Shanghai Waigaoqiao (Statista 2015) China South Korea and Japan
together are responsible for building about 90 of the ships in gross tons
Flag States and their role in the implementation of MARPOL
Flag States have the responsibility for enforcing the rules set out under MARPOL Every Flag State has
the duty to ensure that its vessels fully comply with the applicable articles of MARPOL3
3 MARPOL Regulation 6
TRANL15371 4
At the end of 2013 about one-fifth of merchant vessels were registered in Flag State Panama 12 in
Flag State Liberia and 8 in the Flag State Marshall Islands (Figure 2 and (UK DfT 2014)) Therefore
already 40 of the world fleet are registered in these three Flag States
Figure 2 World fleet registered trading vessels of 100 gross tons and over 2009-2013 Source UK DfT 2014
Under MARPOL these parties (Flag States) can enforce ship-owners and operators obligations in three
main ways
- by surveyinspection of vessels to ensure that they meet minimum requirements4
- by monitoring vessel compliance with oil discharge requirements5 (not relevant for energy
efficiency) and
- by implementing punishments for failure to comply with requirements6
Surveys
MARPOL Annex VI contains a set of requirements for survey and issuance of International Air
Pollution Prevention Certificate (IAPP) and regulations regarding
Ozone depleting substances from refrigerating plants and firefighting equipment
Nitrogen Oxides (NOx) from diesel engines
Sulphur Oxides (SOx) from diesel engines
4 MARPOL article 5 5 MARPOL Annex I Chapter 4 Regulation 31 6 MARPOL article 4
TRANL15371 5
Volatile Organic Compound Emissions from cargo tanks of oil tankers
Shipboard Incineration
Fuel oil quality
Flag States must conduct an initial survey before a new ship is put into service and before the IAPP is
issued for the first time a renewal survey at intervals specified by the Administration but not exceeding
five years an intermediate survey within three months before or after the second anniversary date or
within three months before or after the third anniversary date of the certificate an annual survey within
three months before or after each anniversary date of the certificate and after prescribed repairs an
additional survey7
For the EEDI and the SEEMP a new certificate the International Energy Efficiency Certificate (IEEC)
was established and must be kept available on board for inspectionssurveys The IEEC Certificate will
be issued for new build ships upon the initial survey before the ship is put into service and for existing
ships of 400 gross tonnage and above The IEE Certificate will be issued once for each ship and is valid
throughout the lifetime of the ship (except flag change major conversion or ship going out of service)
There are no follow-up surveys on the IEEC Certificate
The IMO has created guidelines for surveys that Flag States should follow The energy efficiency related
one is
2014 Guidelines on survey and certification of the Energy Efficiency Design Index (EEDI)
(resolution MEPC254(67))
A Flag State cannot allow a vessel that does not pass inspection to sail until it complies with MARPOL8
An International Energy Efficiency Certificate in accordance with the provisions of regulation 54 to
any ship of 400 gross tonnage and above is needed before that ship may engage in voyages to ports
or offshore terminals under the jurisdiction of other Parties
Punishments for failure to comply
In case of failure to comply the authority carrying out the inspection may detain the ship Article 7 of
MARPOL ensures that unduly delay or detain will be avoided where possible or compensated
A Flag State is obliged to investigate an incident upon receipt of notification or evidence that one of its
vessels has breached MARPOL If the investigations reveal that a breach has occurred the Flag State
has further obligations to initiate legal proceedings against the vessel and report back to the reporting
state on actions taken9
7 MARPOL Annex VI Chapter 2 Regulation 5 8 MARPOL Annex VI Chapter 2 Regulation 6 9 MARPOL article 6
TRANL15371 6
Also other parties are allowed to inspect vessels under MARPOL Article 6 when violations are detected
or for regular inspections A Party may also inspect a ship to which the present Convention applies
when it enters the ports or off-shore terminals under its jurisdiction if a request for an investigation is
received from any Party together with sufficient evidence that the ship has discharged harmful
substances or effluents containing such substances in any place
Role of Port States
Under ldquoPort State Controlrdquo arrangements Port States also have the authority to conduct vessel surveys
on ships which visit their ports and to detain those ships that fall below MARPOL requirements In
relation to MARPOL Annex VI chapter 4 any port state inspection shall be limited to verifying when
appropriate that there is a valid International Energy Efficiency Certificate on board10
Cooperation between Port and Flag States
Under MARPOL parties are required to co-operate in detecting vessel violations and are required to
use all practical measures to detect and monitor violations If a State has evidence of a violation they
are obligated to forward this evidence to the vesselrsquos Flag State
All ships flagged under countries that are signatories to MARPOL are subject to its requirements
regardless of where they sail and member nations are responsible for vessels registered under their
respective nationalities
When incidents occur outside the countrys jurisdiction or jurisdiction cannot be determined the
country refers cases to Flag States in accordance with MARPOL Some States are not happy with the
lack of response from Flag States United States experience of Flag States not responding has led to
new policy which would take direct enforcement action against vessels for MARPOL V violations
occurring between 3 and 200 nautical miles from the United States rather than referring such violations
to the flag states (Dillingham 2000)
Ship owners and charterers
A ship owner is the owner of a commercial ship A ship owner is someone who equips and exploits a
ship usually for delivering cargo at a certain freight rate The ship owner determines the specifications
of the ship and its energy efficiency measures but the benefits of low fuel consumption are not always
theirs when the ship is chartered to someone else
Depending on the type of ship and the type of charter normally a standard contract form called a
charter party is used to record the exact rate duration and terms agreed between the ship owner and
the charterer
10 MARPOL Annex VI Regulation 10
TRANL15371 7
A charterer may be a party without a cargo who takes a vessel on charter for a specified period from
the owner and then trades the ship to carry cargoes at a profit above the hire rate In some cases a
charterer may own cargo and employ a shipbroker to find a ship to deliver the cargo for a certain price
Two main types of charter can be distinguished time charter and voyage charter In a voyage charter
the owner is still responsible for the port fuel and crew costs In a time charter the charterer selects
the ports and directs the vessel where to go The charterer pays for all fuel the vessel consumes port
charges commissions and a daily hire to the owner of the vessel
When there are too few opportunities to share investment with charterers this leads to a split incentive
a ship owner may invest the up-front capital to put in energy-efficient technology but doesnrsquot then
recoup the costs from fuel savings as they charter their ships out as this goes to the charterers This
problem is particularly apparent for short-term time charters11
Conclusions
Regarding energy efficiency the work of the AHEWG-TT12 has shown that the main shipbuilding nations
all have access to the necessary technologies provided there is demand for them It has also been
noted that there is no need for transfers of intellectual property rights13
One of the major barriers to the effective implementation of the EEDI and the SEEMP is the heavy
reliance it places on Flag States for inspection of vessels and enforcement of provisions During the
1970rsquos ships were being reflagged from high tax and high regulation countries such as the United
States and the United Kingdom to countries offering Flags of Convenience (lsquoFOCrsquo) Under FOCs ship-
owners pay less tax to the relevant Flag State and are able to evade the majority of the environmental
and construction standards set out under MARPOL (Leddy 2012) The main reason for that is that
several Flag States are not signatories to all MARPOL Annexes (eg as of 20142015 the Bahamian
Bolivian Cambodian North Korean Georgian Honduran Lebanese and Sri Lankan flags of
convenience had not ratified all MARPOL treaty annexes III-VI14 15)
Many FOCs are developing nations that do not have the resources to enforce investigate or prosecute
breaches by their flagged vessels (Aqorau 2000) As of 2014 55 of merchant ships are flagged by
FOC and 40 of ships are flagged by FOCdeveloping countries MARPOL only provides guidelines for
Flag States to follow when surveying vessels under regulation 6 but none of these guidelines are
mandatory Conversely Port States which are developed are better equipped to bear the cost of
inspection investigation enforcement and prosecution costs However in relation to EEDI and the
11 httpssi2040orgwhat-we-dowork-streamsfinance 12 MEPC 6831 Progress report of the Ad Hoc Expert Working Group on Facilitation of Transfer of Technology for Ships 13 Submission of the United States on Task 3 of the Ad Hoc Expert Working Group on Facilitation of Transfer of Technology for Ships Jan
2015 14 wwwics-shippingorgdocsflag-state-performance-table 15 httpwwwimoorgAboutConventionsStatusOfConventionsPagesDefaultaspx status of conventions
TRANL15371 8
SEEMP port state control is limited to verifying when appropriate that there is a valid International
Energy Efficiency Certificate on board
We therefore conclude that there needs to be a focus on enabling Flag States and Port States that lack
the resourcescapacity to enforce the EEDI and the SEEMP in order to further stimulate the adoption
of energy efficiency technologies Also attention should be paid to overcoming the barrier of split
incentives ie where the benefits of energy efficiency measures are not transferred from the charterer
to the investor (owner)
TRANL15371 9
3 Energy Efficiency Measures for Ships
In order to understand the important energy efficiency measures that can help improve energy
efficiency from shipping it is interesting to see the split between new-built ships and existing fleet In
2012 some 3655 merchant ships were delivered worldwide about 6 of the worldrsquos merchant fleet
of about 60000 The average age of the merchant fleet is 19 years Therefore measures for both new
ships and retrofits for old ships are important for improving the energy efficiency in the next decades
If only the new ships would be targeted only 50 of the fleet would be more efficient in the next
decades while there are many retrofit measures available The total fleet can be broken down to about
4000 passenger ships just under 14000 tankers and about 37000 dry cargo ships including about
5000 container ships (Statista 2015)
In order to identify the most interesting energy efficiency measures for ships we used the information
from several reports to develop a long-list Many measures improve the efficiency in the order of up to
5 Here we would like to focus on measures that result in high savings that can be applied to many
ship types and preferably also to existing ships The resulting short-list is presented in the next table
We used the main categories identified by AHEWG-TT for structuring the measures
The main categories defined by AHEWG-TT are
1 Hull
2 Main Engine
3 Auxiliary engines
4 Propellers and rudders and
5 Control systems
Since the auxiliary engines typically consume only a fraction of the energy that goes to the main
engines their energy efficiency measure results do not show in the short-list below The measures are
worked out in more detail in the paragraphs below The main engine and auxiliary engine improvements
are covered in the same paragraph
The common rail upgrade is a simple measure that can be easily applied to all ships even when the
ship is not in the dry-dock The details are available in the paragraph about engines
From the list it is clear that conventional technology is available to achieve high efficiency gains If the
maximum gain per category is added up (for all but ferry and cruise) this would mean a total efficiency
improvement of 35 even without taking two experimental technologies with potentially high efficiency
gains into account (wind power and air lubrication) Note that some technologies are not applicable to
all ships
In order to find possible financial barriers the investments are rated from ldquovery lowrdquo to ldquohighrdquo relatively
to the size of the ships The same measure on a larger ship is obviously more expensive
TRANL15371 1
Table 1 Inventoryranking of energy efficiency measures
Main category
Measure Estimated efficiency (range)
Efficiency at average circumstances
Ease of installation
Payback time
Investment Implementation References
Hull Bow optimisation
25-20 10 all ship types
short (lt3 years)
Medium conventional technology
(IMO 2009 IMO 2011 Crist 2009 Hochkirch und Bertram not dated)
Main Engines
Wind power 5-44 20 only special ship types
long (gt15 years)
High experimental technology
(IMO 2011 IMO 2009 Crist 2009 ICCT 2011 Brannigan et al 2009 Allenstroumlm 2013)
Propellers and Rudders
Ducted propeller
1-20 10
all ship types except ferry and cruises
medium (4-15 years)
Medium conventional technology
(IMO 2011 IMO 2009 Crist 2009 ICCT 2011)
Propellers and Rudders
Contra-rotating propellers
6-20 13 only special ship types
long (gt15 years)
High conventional technology
(IMO 2011 IMO 2009 Crist 2009 WAumlRTSILAuml 2009 Shuto 2010)
Propellers and Rudders
Wheels 10 10
all ship types except ferry and cruises
short (lt3 years)
Medium conventional technology
(IMO 2009 Schneekluth und Bertram 1998 Brannigan et al 2009)
Control Systems
Waste heat recovery
6-10 8 new build only
medium (4-15 years)
Medium conventional technology
(IMO 2011 IMO 2009 Crist 2009 WAumlRTSILAuml 2007 ICCT 2011)
Propellers and Rudders
Rudder bulb 2-5 4
all ship types except ferry and cruises
medium (4-15 years)
Low conventional technology
(IMO 2011 IMO 2009 Nielsen et al not dated Crist 2009 ICCT 2011)
Propellers and Rudders
Post swirl fins
2-5 4
all ship types except ferry and cruises
short (lt3 years)
Low conventional technology
(IMO 2009 MOL 2011 Hansen Dinham-
Peren und Nojiri 2011 Nielsen et al not
dated)
Hull Hull coating 1-9 5 all ship types
short (lt3 years)
Low conventional technology
(IMO 2011 IMO 2009 ICCT 2011 Voorham 2013 Crist 2009)
Hull Air lubrication
5-15 9 new build only
medium (4-15 years)
Medium experimental technology
(IMO 2011 IMO 2009 Crist 2009 DK Group 2015 CNSS 2015 ICCT 2011)
Propellers and Rudders
Twisted rudder
2-4 3
all ship types except ferry and cruises
medium (4-15 years)
Low conventional technology
(IMO 2009 Schulze 2007 Nakashima 2015 Becker Marine System 2015 Nielsen et al not dated Hollenbach und Friesch not dated Rolls-Royce 2014)
Main Engines
Main engine de-rating
2-4 3
all ship types except ferry and cruises
medium (4-15 years)
Low conventional technology
(IMO 2011 IMO 2009 Crist 2009 Wettstein und Brown 2008 DNV GL 2015)
Auxiliary engines
Common rail upgrade
- - all ship types
medium (4-15 years)
Very Low conventional technology
(DNV GL 2015) (ICCT 2011) (IMO 2009)
Main Engines
Common rail upgrade
01-05-
03 all ship types
medium (4-15 years)
Very low conventional technology
(IMO 2009 Pakarinen 2007 ICCT 2011 Crist 2009)
TRANL15371 2
Hull and superstructure
In general the optimisation of hull and superstructure focuses on minimising the resistance by reducing
the wave resistance and friction between water and hull It is important to recognise which type of
vessel is to be optimised The reduced frictional resistance increases energy performance of the vessel
particularly at low speeds Operability and performances of the ship must be considered in detail The
improvements measures are generally applied at new-built ships but also applicable to retrofitting
Bow optimisation
The different bow optimisations can improve the water flow around the hull and reduce the wave-added
resistance for large vessels with high block coefficient operating within commercial speed ranges The
average energy reduction potential ranges from 25-20 on average 10 (Crist 2009 IMO 2011
Voorham 2013)
Figure 3 Left The green line characterises the ordinary bow wave of the hull The blue line characterises the wave
formed by the bulb The red line is the sum of these two The altitude of the bow wave is noticeably reduced which
reduces the hull drag associated with the bow wave This improves fuel economy and increases range (Selenetrawlers
2015) Right Ordinary bulbous bow leadge bow and ax-bow shape (JSEA 2006)
The below-the-waterline extension of the bulbous bow (Figure 3) modifies the way the water flows
around the hull reducing drag and thus increasing speed range fuel efficiency and stability An altered
design is the ax-bow (Figure 3) The narrow designed bow slashes through the water in order to reduce
slamming and reduces the size of bow generated wave The propeller can act more efficient due to the
absence of slamming The ax-bow allows the ship to steer well to maintain speed and the engine to
save fuel (Crist 2009 IMO 2009) If the bulbous bow is modified during a regular docking period the
investment is estimated to have short payback of about 1-3 years It is most promising for container
vessels (DNV GL 2015 Hochkirch und Bertram not dated)
Barriers The bow optimisation (as retrofit) needs to be done in the dry dock Dry-docking is not
regularly happening for existing ships because it means that the ship cannot operate and economic
losses are suspected Another obstacle might arise due to restricted access to the original contractual
hull plans since shipyards are not always keen to provide detailed plans on their vessels to prevent
TRANL15371 3
imitation (Hochkirch und Bertram not dated DNV GL 2015) A major obstacle is the split incentive
between ship owner and operator Ship owners are responsible for investing in these technologies and
ship operators are those who pay for the fuel consumption and benefit from such technologies (ICCT
2011)
Technical maturity The technique is available on the market and is effective Only conventional
material is needed and redesign can be done in a few weeks16
Applicability Applicable to all ship types but most efficient for ships with a high block coefficient like
tankers and bulk carriers since the reduction of the wave-added resistance is most impacting (IMO
2009)
Hull coating
Hull coatings (Figure 4) can lower frictional resistance and limit fouling by aquatic organisms It can
save between 1-9 fuel consumption on average 5 (ICCT 2011 Voorham 2013 Crist 2009)
Figure 4 Example of hull coating (ECOSPEED 2015)
One way of lowering the frictional resistance is to improve the smoothness of a hull by means of
coatings that reduce fouling The costs are lifetime cost reduction and have to be recur every five years
to be able to gain the fuel benefit
Barriers A new application is typically necessary during each dry-docking The self-polishing coating
must be renewed after a 3-5 years period (IMO 2009) A major obstacle is the divided interest between
ship owner and operator Ship owners are in charge for investing in these technologies and ship
operators are those who pay for the fuel consumption and profit from such technologies (ICCT 2011)
Technical maturity Coating techniques are available on the market and roughly 5 of newly painted
ships are painted with one of the advanced coating systems presently available (IMO 2011 ICCT 2011)
The payback time is short (ICCT 2011) or 0-2 years according to others17
Applicability The technology is applicable to all vessels
Air lubrication
The air lubrication technique creates a layer of bubbles underneath an already streamlined hull in order
to further reduce friction An automation system regulates the compressorsblowers depending on
16 httpwwwship-efficiencyorgonTEAMpdf14-Ship20efficiency20seminar20-20CMA20CGM-
20HydrOcean20120CMA20pdf 17 httpswwwdnvglcommaritimeenergy-efficiencyefficiency-finderhtml
TRANL15371 4
speed The blower keeps holes filled with air and required pressure A thin layer of bubbles trailing
behind of each cavity merge into single large ldquoair layerrdquo for the whole flat bottom part of the hull and
reduces the friction (Figure 5) Depending on the ship type the estimate fuel efficiency ranges between
5-15 (on average 9) where tankers and bulkers can reduce more (10-15 on average 125) in
comparison to container vessels (5-9 on average 7) (IMO 2009 DK Group 2015 CNSS 2015 ICCT
2011 Voorham 2013)18
Figure 5 Schematic view of air lubrication (DK Group 2015)
Barriers Large capital investment requirements with split incentive The vessel owners are
accountable for investing in these technologies whereas vessel operators recompense for the fuel
consumption and benefit from such technologies (ICCT 2011)
Technical maturity The technology is available on the market but still in a pilot phase Sea trials
have been performed with small demonstration ships There are no vessels operating commercially
that currently use this technique Specifications about the payback time vary from short to medium
(Silberschmidt 2014 Skinner 2009)
Applicability The original technology would be likely be applied to new-built ships with at least a
partly flat bottom and a minimum length of 225 metres since the compressor may have technical
problems maintaining air cavities for deep draft ships (IMO 2011 CNSS 2015) Air lubrication can be
used for retrofitting as well (CNSS 2015)
Engines
Speed reductions on existing vessels provide opportunities for engine optimisation on low power
(321) Similar measures as de-rating for the main engines that could be implemented are cylinder
cut-out and new torsional vibration calculation (IMO 2009)
18 It has to be noted that the extra fuel use caused by the system itself should also be taken into account
TRANL15371 5
Another propulsion supportive measure with a high potential measure is wind power This is also
explained in more detail below In order to also provide a measure with a lower improvement potential
per ship but simple and applicable to all ships we describe the common rail system for fuel injection
Main engine de-rating
Slow steaming vessels are known as one of the most effective energy saving measure The potential
comes mainly from the operational behaviour side From the technical side the specific fuel oil
consumption will decline when a ship is no longer operated at its design speed
The design speed can be reduced by de-rating the main engine (IMO 2011 IMO 2009) Reduction of
power combined with injection timing advanced to restore peak combustion pressure can achieve a
certain gain in shaft efficiency Fuel efficiency can be improved by 2-4 when de-rating is performed
for loads lower than the maximum design load (Wettstein und Brown 2008 Crist 2009) on average
3 energy efficiency potential (Crist 2009) Operational costs would be lower mainly due to fuel
savings (DNV GL 2015 Crist 2009 Wettstein und Brown 2008)
Barriers A slower vessel will have lower incomes as it is not capable to perform as much transport
load per unit of time as a faster vessel De-rating the engine is usually done when it is clear that the
ship will become a slower steaming ship There is a split incentive between vessel owners who are
responsible for investing in these technologies and vessel operators who are those who compensate
for the fuel consumption and benefit from such technologies (ICCT 2011)
Technical maturity This technique has been proven as successful particularly on older engines
which are normally built with a low compression ratio and thereby have a significant potential to
improve their efficiency (IMO 2009) De-rating measures have a low to medium payback time (Crist
2009 DNV GL 2015)
Applicability The technologies are available on the market It is applicable to all vessels (DNV GL
2015)
Common-rail upgrade (common-rail fuel injection)
Engines with common-rail fuel injection handle low-load working modes much better (IMO 2009) A
common-rail fuel injection is technique of injecting fuel into an engine cylinder under total control and
thereby achieving optimal combustion Common-rail allows the start and duration of injection
independent of the position of the pistons in that way permitting an operationally optimised injection
per stroke In a normal diesel engine fuel is injected at a static rate by a pump and common practice
is to optimise this pump to run at an optimal setting for the ideal injection time (Pakarinen 2007) The
energy efficiency potential is estimated between 01-05 on average 03 (ICCT 2011 IMO 2009)
Barriers Additional electronics can also introduce possibilities for failures However recent
advancements have increased the systems popularity19 There is a split incentive between vessel
19 httpwwwmarineinsightcommarinean-overview-of-common-rail-system-in-marine-engines
TRANL15371 6
owners who are responsible for investing in these technologies and vessel operators who are those
who compensate for the fuel consumption and benefit from such technologies (ICCT 2011)
Technical maturity This measure is available on the market (ICCT 2011) Payback time is short to
medium with an average of 5 years (IMO 2009 Crist 2009)
Applicability This measure is applicable to new and retrofit vessels It is applicable for tanker- bulk-
container- and Roro-ships (Crist 2009)
Auxiliary engines and systems
Based on our own estimation auxiliary engines improvement are not bringing gt2-4 energy savings
because auxiliary engines consume much less fuel than the main engine Similar measures as de-rating
for the main engines and common rail upgrade could be implemented for the auxiliary engine
Other options for improving auxiliary systems are speed control of pumps and fans control strategies
of cooling water systems room ventilation redesign of piping and instruments advanced computation
of airgas temperature distribution with reduced storage ventilation and with optimised ventilation
systems (DNV GL 2015)
Barriers There is a split incentive between vessel owners who are responsible for investing in these
technologies and vessel operators who are those who compensate for the fuel consumption and benefit
from such technologies (ICCT 2011)
Technical maturity This measure is available on the market (ICCT 2011) It is easy to apply and
uncomplicated in maintenance (DNV GL 2015) Payback time is short (DNV GL 2015)
Applicability This measure is applicable to all new and retrofit types of ships (DNV GL 2015)
Wind power
Wind power measures are available that can develop enough thrust to provide at least some supportive
propulsion Wind power can be utilised in various ways in shipping like traditional sails solid wing sails
Flettner-rotor and kits (see Figure 6) The techniques are currently used as supplementary power
(Brannigan et al 2009)
Figure 6 from left to right Kite (Cargill 2011) Flettner rotor (MIWB 2015) and solid sails (Wind Chellenger Project
HP 2015)
Solid wing sails are structured similar to aircraft wings which offer more thrust with less drag than
conventional sails Flettner rotors produce thrust from a rotating object in wind using the so-called
TRANL15371 7
Magnus effect The techniques have different characteristics with regards to how the thrust that is
produced relates to other factors such as wind strength wind angle wind stability and ship speed
(IMO 2009)
Towing kites vary from other concepts of wind power by having a small footprint during installation and
therefore being quite feasible to retrofit (Allenstroumlm 2013) Studies conducted at the Technical
University of Berlin indicated that the potential for sail energy has different prospective in the different
regions in the world Best scenarios exist in North Atlantic and North Pacific regions the South Pacific
seems a bit less potential The studies have shown that under normal circumstances the typical savings
using wind power may be 5 at 15 knots and up to 20 at 10 knots This study also revealed that
with optimal weather routing in the North Atlantic and given the best vessel with best sail type savings
can reach 15 percent at 15 knots and 44 at 10 knots (IMO 2009 Crist 2009) Nevertheless the
above figures should be considered indicative since practical experiences are limited Sail- and kite-
assisted power does seem to be a potential opportunity saving energy in the medium- and long-term
picture for shipping (IMO 2009) Christ estimates and average energy saving potential around 20
(2009)
Barriers There is a split incentive between vessel owners who are responsible for investing in these
technologies and vessel operators who are those who compensate for the fuel consumption and benefit
from such technologies (ICCT 2011) Although this technology can bring high energy savings the
investment is so high that there is not a short payback time
For solid wing sails complications could result in a need for masts to run down to the keel which can
be a bigger issue for retrofitting Additionally the presence of the mast and rigging could have significant
impacts on cargo handling (IMO 2009) Downside of the kite systems include the complex launch
recovery and control systems that are needed (IMO 2009)
Technical maturity This is still considered as experimental technology The technical barriers
identified above need to be tackled for this measure to be applied widely in the future Payback time is
estimated to be medium to long term (Allenstroumlm 2013 Crist 2009)
Applicability Wind power technologies are available and a number of cargo ships have been equipped
with wind engines to reduce demands from diesel engines (ICCT 2011) Kites can be used on ships
with a minimum length of 30m and works most energy efficient on ships with a typical speed not faster
than 16 knots Preferably tankers (crude oil product chemical LPG LNG other) and bulk carriers are
being considered as potential users due to this speed restriction (IMO 2011)
Control Systems Waste heat recovery
Waste heat recovery (WHR) technology can pass exhaust gases from a vessels engines through a heat
exchanger to generate steam for a turbine-driven generator The heat energy from the exhaust gas is
taken and transformed into electrical energy to reduce direct engine-fuel consumption for the
propulsion system or reduce auxiliary engine needs (ICCT 2011) Energy saving potential is estimated
between 6-10 on average 8 (Crist 2009 ICCT 2011)
TRANL15371 8
Figure 7 Efficiency of waste heat recover systems Sankey diagramme Even with high 50 efficiency of modern low-
speed engines there is still 50 of fuel input energy not being put to productive use The possibilities are illustrated
by this comparison of Sankey diagrammes for Waumlrtsilauml 12RT-flex96C engines without heat recovery (left) and with
high-efficiency waste heat recovery plant (right) showing in this case 114 gain in overall efficiency with WHR
(waste heat recovery) (WAumlRTSILAuml 2007)
Barriers Large capital investment requirements (around $5-6 million for a large container ship20) and
split incentive between ship owners and ship operators (ICCT 2011)
Technical maturity The technology is available on the market and has medium to long payback time
(WAumlRTSILAuml 2007 Crist 2009)
Applicability A WHR system is applied to vessels with a high production of waste heat and a high
intake of electricity WHR can be employed on ships with main engine average performance is higher
than 20000 kW and auxiliary engine average performance higher than 1000 kW This size
requirements limit the number of ships using this technology (IMO 2011) Generally it is applicable to
all ships types new and retrofit (Crist 2009)
Propellers and Rudders
Numerous devices have been designed for improving the energy consumption of vessels by recovering
as much as possible of this rotational energy in the flow from the propeller or to provide some pre-or
post-rotation of the in flow into and after the propeller to ensure best efficiency The most important
of these will be discussed in the following paragraphs (IMO 2009)
Ducted propeller (Kort Nozzle)
The accelerating ducted propeller consists of a screw propeller surrounded by a non-rotating duct
(nozzle) (Figure 8) Compared to the conventional propeller of the same diameter and thrust this
20 httpgcaptaincompower-exhaust-gas-paybacks-waste
TRANL15371 9
arrangement allows an increase inflow to the propeller improving the operating conditions around the
propeller and the ideal efficiency
Figure 8 Right photos of this Norwegian trawler (SetSail 2009)
The duct creates additional thrust load The potential for energy savings on relevant vessels range
between 1ndash20 (Crist 2009 IMO 2011 Barringhaus und Olds 1999 IMO 2009) whereupon 10 is a
good average value (IMO 2009 Crist 2009) The improvement of the combination of propeller and duct
overweigh negative effect of the increase water resistance caused by the duct
Barriers Since the duct has an optimal operational speed it does not work efficient at all speeds For
instance as drag increases with increasing speed eventually this will become larger than the added
thrust Therefore at high speeds ducts are typically not used (IMO 2009) The split incentive is a barrier
between ship owners (investor) and ship operators (gainer) as explained earlier (ICCT 2011)
Technical maturity Several standard designs are available on the market (IMO 2011) with a medium
payback time (IMO 2011)
Applicability Ducted propellers suits for vessels operating at high propeller loadings such as tankers
bulk carriers especially tugs and some offshore service ships The duct leads to increased friction but
at higher propeller loadings this is more than rewarded for by the positive effect of the combination of
propeller and duct (IMO 2009)
Contra-rotating propellers (CRP)
A rotating propeller induces a rotating motion in its backwash Normally this rotation energy of the
propeller gets lost The contra-rotating propeller is used in order to recover part of this energy (Figure
9) In a contra-rotating configuration two propellers are facing each other rotating in the opposite
direction with the aft propeller recuperating the turning energy in the wake from the forward propeller
(IMO 2011) To avoid complications with cavitation the aft propeller usually has a smaller diameter
than the front propeller Contra-rotating propeller arrangements involve a short shaft line and for that
reason primarily suitable for vessels with single-screw
TRANL15371 10
Figure 9 Left conventional propeller Right contra-rotating propeller The working principle is simple and effective
the power is split in a forward and aft propeller which through the different direction of rotation cancel out the
rotational energy losses behind the propeller (WAumlRTSILAuml 2009)
Potential savings of such measures are assessed to be in the order of 6ndash20 of the power consumption
with an average of 13 although higher figures may be presented by industry for specific cases Two
different full-scale measurements reported gains of 15 and 16 (IMO 2009 Crist 2009)
Barriers The mechanical installation of contra-rotating shafts is complicated and requires more
maintenance (IMO 2011) The split incentive between ship owners (investor) and ship operators
(gainer) is a barrier as explained above Although this technology can bring high energy savings the
investment is so high that there is not a short payback time
Technical maturity The technique is available on the market but problems with gearboxes for
contra-rotating propellers have been reported as well as operational problems with mounting (IMO
2009 IMO 2011) Payback time is reported as short (WAumlRTSILAuml 2009) but also as medium-long with
about ~15-20 years (Shuto 2010)
Applicability The technology is particularly beneficial for rather heavily loaded propellers as for
example very fast cargo vessels like Ro-Ro ships or for container ships (IMO 2011 Crist 2009) Contra-
rotating propellers need a short shaft line and hence mainly suited to single-screw ships (IMO 2011)
Contra-rotating propellers can be implemented as retrofit but it is more likely implemented in new
built ships due to the complicated mechanical installation (Crist 2009)
Post swirl devises
A number of different techniques belong to the post swirl category Several of them contain
modifications to the rudder or propeller (IMO 2009) Depending on vessel type and operational field
various power saving measures can be mounted to optimise water velocity distribution to the propeller
and to minimise slipstream losses due to swirl in the outflow of a propeller The most important among
these measures may be additional thrusting fins at the rudder twisted rudder (Figure 12) rudder-
bulb-systems with fins (Figure 13) and fins on the propeller fairwater also called post swirl fins or
boss cap fins (Figure 10)
Generally post swirl measures reported 1-8 energy efficiency (test models) Even 8-9 energy
efficiency from full-scale measurements for additional thrusting fins at the rudder Payback time is
estimated to be short to medium post swirl devices (DNV GL 2015 Crist 2009 ICCT 2011) Some of
CRP FOR BETTER PROPULSION EFFICIENCY
CONVENTIONAL PROPULSION
TRANL15371 11
the post swirl measure can be combined A good overview is given in Nielsen et al (Combined Kappel
propeller and rudder bulb system for improved propulsion efficiency not dated)
3431 Post swirl fins
The post swirl fins (Figure 10) can recover energy loss of propeller hub vortex in the propeller backward
flow and can lead to 3-5 energy saving on average 4 operating at the same speed (MOL 2011
Barringhaus und Olds 1999 Hansen Dinham-Peren und Nojiri 2011 ICCT 2011)
Figure 10 Example the post swirl fins or propeller boss cap fins (gcaptain 2012)
Barriers It is simple and straightforward measure requiring only the removal of the propeller boss
caps and replacement with the post swirl fins (no hull modification is needed) (Hansen Dinham-Peren
und Nojiri 2011 MOL 2011) However there is a split incentive between ship owners (investor) and
ship operators (gainer) as explained above
Technical maturity The technique is available on the market In 2013 post swirl fins were applied
to over 2500 ships worldwide (MOL 2011) Further advantages of the post swirl fins are reduction in
propeller torque reduced vibration in the stern and less underwater noise and reduced rudder erosion
(MOL 2011) A payback time of 6 months was estimated for 4 efficiency improvement at $600tonne
oil price (Hansen Dinham-Peren und Nojiri 2011) The investment is considered to be low21
Applicability The technique is effective for all screw propellers irrespective of the type or hull form
of the ship Has been tested on large-scale container vessels (MOL 2011 Hansen Dinham-Peren und
Nojiri 2011)
3432 Free rotating wheels
A vane wheel (Grim wheel) is a freely spinning propeller mounted behind the main smaller propeller
(see Figure 11 for example of use on retrofit Queen Elisabeth II in 1986) The vane wheel has a bigger
diameter than the main propeller and increases the propeller diameter The small propeller drives the
freely revolving vane wheel fitted on the wake The inner part of the vane wheel acts as a turbine and
the outer part as an ldquoadditionalrdquo propeller
21 httpgcaptaincompropeller-technology-ship-efficient
TRANL15371 12
Figure 11 Example for a grim vane wheel (Boat design 2007)
This leads to a substantial recovery of the rotational energy The energy saving potential is reported to
be 10 (Brannigan et al 2009) It is stated that the important benefit of the vane wheel is that a
smaller impulsion propeller can be installed which consumes less energy The vane wheel gives a
suitable energy improvement for cargo ships (IMO 2009 Schneekluth und Bertram 1998) and has short
payback time It is also stated that if there is room for a vane wheel in the aft there is also space for
an impulsion propeller of larger diameter leading about the same energy saving potential as the
combination of a small impulsion propeller and a vane wheel (IMO 2009)
Barriers A barrier is the split incentive between vessel owners who are responsible for investing in
these technologies and vessel operators who are those who compensate for the fuel consumption and
benefit from such technologies
Technical maturity Limited application Vane wheels are subjected to strong fluctuations in loading
Problems with the strength of the blades have been encountered frequently (for example the vane
wheels on the Queen Elisabeth II were short lived and not used after22)The payback time is estimated
to be short
Applicability The technique is effective for all screw propellers irrespective of the type or hull form
of the ship both for new and existing ships (Chen Reed und Kim 1989) Recommended for all ship
types except ferry and cruises because of their problem with strong fluctuations in loading as
mentioned above23 (IMO 2009)
3433 Twisted rudder
Rudders can play a significant role of extra frictional resistance Rudders are located in the backwash
of a propeller and rotational energy will act on the rudder Because of these effects the rudder gives
prospects of efficiency gains (Schulze 2007)
22 httpwwwroblightbodycomlinersqe-21987_Refitindexhtm 23 httpwwwroblightbodycomlinersqe-21987_Refitindexhtm
TRANL15371 13
Figure 12 Schematic capture of twisted rudder (Nakashima 2015)
Twisted leading edge technology provides multiple benefits for high-speed vessels compared to
conventional rudder designs Conventional rudders are located behind the propeller with the rudder
profile arranged symmetrically about the vertical rudder centre plane This arrangement does not
consider the fact that the propeller induces a strong rotational flow that strikes on the rudder blade
This consequences in areas of low force on the blade that induce cavitation and associated erosion
problems (Becker Marine System 2015 Schulze 2007)
The twisted rudder is horizontally twisted on the lower and upper side of the segment that is an
extension of the propeller shaft (Figure 12) This decreases cavitation rudder and improves
manoeuvrability of the vessel (Schulze 2007) Twisted rudder types lead to energy efficiency
improvements by approximately 2-4 on average 3 for large-size high-speed vessels (Hollenbach
und Friesch not dated Nakashima 2015)
Barriers Work needs to be done in the dry dock this is not regularly happening for existing ships
(Hochkirch und Bertram not dated) There is a split incentive between vessel owners who are
responsible for investing in these technologies and vessel operators who are those who compensate
for the fuel consumption and benefit from such technologies (ICCT 2011)
Technical maturity This rudder type is a commercially used technology and easy to apply if the ship
is in the dry dock (ICCT 2011)The payback time is estimated to be short to medium (Rolls-Royce 2014
Crist 2009)
Applicability Twisted rudder can used by container vessels reefers Ro-Pax ferries cruise ships and
naval vessels In South Korea this type of rudder is recognised as a standard rudder for large-size
high-speed container carriers (Nakashima 2015)
TRANL15371 14
3434 Rudder bulb
Figure 13 Example for a rudder bulb Kawasaki RBS-F rudder bulb systems with fins (Kawasaki 2015)
The rudder bulb brings smooth inflows from the propeller and can reduce the drag of the rudder The
rudder fins produce thrusts in the rotational flows generated by the propeller (Figure 13) Rudder bulb
measure can improve energy efficiency by 2-5 (Nielsen et al not dated Becker Marine System not
dated) on average 4 (Crist 2009)
Barriers The work needs to be done in the dry dock this is not regularly happening for existing ships
There is a split incentive between vessel owners who are responsible for investing in these technologies
and vessel operators who are those who compensate for the fuel consumption and benefit from such
technologies (ICCT 2011)
Technical maturity The technology is a commercially used technology and easy to apply while the
ship is in the dry dock (Kawasaki 2015) Payback time is estimated to be medium (Crist 2009)
Applicability For new and retrofit tanker- bulk- container- and Roro-ships with a propeller and
rudder (Crist 2009)
TRANL15371 15
Barriers to the transfer and uptake of energy
efficiency technologies for ships and possible
measures to overcome them
Although there are ways to reduce emissions (Chapter 3) and also drivers working towards the
implementation of such measures there are significant barriers to acting on cost-effective opportunities
in the maritime industry This is often referred to as barriers to energy or the energy efficiency gap
(Michele Acciaro 2013) (Sepideh Jafarzadeh 2014) (OECD 2014) Some barriers are shared with other
industries while others are unique to the maritime industry Furthermore many of these barriers are
not specific to the EEDI and the SEEMP but apply to any rule under MARPOL These barriers can exist
on both the supply and the demand side For example there could be barriers to the development and
implementation of measures that reduce CO2 emissions from ships and barriers to the expression of
demand for these measures (ECORYS 2012) Studies have however shown that there are relatively
few barriers related to the development of new technologies or access to related intellectual property
rights by the main shipbuilding nations and that the supply of measures exceeds the demand (ECORYS
2012) Existing studies on barriers to energy efficiency thus focus on what prevents the uptake of
available measures
This section presents an overview of the main barriers to the transfer and uptake of energy efficiency
technologies in the shipping industry and discusses potential ways of overcoming them
Preliminary assessments of technology transfer and financial needs by both workshop participants and
the IMO Ad Hoc Expert Working Group on Facilitation of Transfer of Technology for Ships (AHEWG-TT)
have suggested that the type of assistance needed by Port State and Flag State administrations will be
of a different nature than that required by shipbuilders and owners Our assessment above has shown
that the shipbuilding industry is expected to need less assistance than Port States and Flag States
In the next table we list a summary of the main barriers and the stakeholders concerned in the main
categories as identified by AHEWG-TT as well as the possible measures that could help overcome these
barriers The possible measures to overcome the barriers are further detailed in the sections below
Related costs are estimated in a separate section in order to minimise overlap
TRANL15371 16
Table 2 Summary of main barriers relevant stakeholders and possible measures to overcome them
Barrier Stakeholders Measures forward
Lack of awareness
(administrative and industry)
a MARPOL in general MARPOL Annex
VI EEDI and SEEMP in particular
b Available energy efficiency
technologies
Flag and Port
States
Ship owners
Capacity building
- Workshops
- Trainings
Model course for training
Inventory
Platform for information access and
sharing
Agreements between industry and
administrations
Technology concerns
a Lack of or limited technology supply
chain in some states
b Lack of technology base for RampD in
some states
c Lack of trust (in ability to reduce
emissions in ability to reduce
operational costs in compatibility
with other measures)
Ship owners
Investors
Increase cooperation in ship design
and building
Increased interaction between
industry and educationalRampD
institutes
Establish platform to share
expertiseexperience
Provide special investment or
guarantee funds
Institutional concerns
a Increased administrative burden
1Revision and amendment of existing legislation
2Implement Port and Flag State obligations
b Limited technical capacity in state institutions to implement
c Lack of financial resources for additional compliance and enforcement activities by maritime administrations
Flag States
Port States
Promote increased cooperation and
communication between
administrationswithin regional
administrations
Regional information workshops for
Port and Flag States
Establish platform to share regulatory
experience
Development aid
Commercial
a Increased costs for ship owners to
take up energy efficient technologies
b Lack of motivation of owners to take
up energy efficient technologies (split
incentive)
Ship owners
Financiers
Special EE funds
Smart contracts
TRANL15371 17
Awareness Raising
Barriers Lack of Awareness
The need to create awareness among Flag States Port States and ship owners of the requirements of
Annex VI in general and Chapter 4 in particular was highlighted by participants of the workshop and
emphasised by the AHEWG-TT The level of awareness in the various regions and even in the countries
within the regions differed considerably The AHEWG-TT further suggests it would be beneficial to
undertake an initial evaluation of knowledge needs (gap analysis) in order to ensure workshops and
other awareness-raising activities are appropriately tailored24
Furthermore ship-owners are not always aware of the energy efficiency technologies available on the
market or which operational measures can be implemented to save fuel Ship owners can be companies
people and investment funds Especially private equity groups tend to focus more on short term looking
for quick profit while traditional ship owners tend to hold the ship for at least 20 years25
Measures forward
Though Flag States and Port States should already have implemented measures to ensure that Energy
Efficiency Design Index (EEDI) and Ship Energy Efficiency Management Plan (SEEMP) requirements are
complied with both public administrations and industry representatives could benefit from additional
trainingcapacity building and platforms to share experiencesreceive information with regards the
practicalities of these regulations and available energy efficiency technologies The needs for each
group can be determined through a gap-analysis which we recommend to be carried out by an
independent consultant in cooperation with the flag and port states Once the specific needs for each
group have been determined they can be addressed through the following awareness raising
measures
Capacity Building (workshops trainings)
Workshopstrainings could be organised where formal training is combined with open discussions where
experiences could be shared just within one stakeholder group or between educational institutes
auditors operational managers of ships shipbuilders and authorities Such trainingsworkshops could
focus on just one or all aspects relating to the applicable rules available energy efficiency measures or
assessment methods of technologies (eg training in calculating and verifying EEDI and SEEMP
including development of tools to calculate EEDI and SEEMP) Trainingsworkshops can be local or
regional Sending people physically to regional workshops is generally more conductive to networking
and experience sharing but less adapted to the local situation and more costly
To reduce the costs of training and ensure a certain level of training the IMO or other qualified
international partners (eg WMU) could develop model courses for training In order to better
understand the rules and regulations in detail people use the help of trainers to better understand the
elements that are important for them and to gain experience in doing calculations and other required
24 Ad Hoc Expert Working Group on Facilitation of Transfer of Technology for Ships 2nd Meeting 25 httpwwwftcomcmss0dadcb240-3d97-11e3-b754-00144feab7dehtmlaxzz3aqC3tmNu
TRANL15371 18
activities by the regulations Trainers have to develop their courses and earn back their investments
via trainings Since the trainers are doing this simultaneous it would be more efficient if there would
be a model course available that can easily be tailored to the audience This would reduce the costs for
the development of trainings and would also ensure that the trainers provide the same level of depth
in their trainings Since the IMO is responsible for the rules and regulations it would be the logical
responsible for the efficient implementation and therefore could take the initiative for developing model
courses
Information Sharing
Inventory of energy-efficiency technologies (for example the IMO-GEF-UNDP project) Many
studies and overviews on the internet are available The quality and the scope is often
different
Improved access to information and information sharing with international recognised
organisations including relevant survey and certification training One example of
establishing information sharing between governments is the work of the OECD Council
Working Party on Shipbuilding (WP6)26 which organises regular workshops aimed at
facilitating the exchange of information on policy and industry developments
Note that many of these measures overlap with the measures required to overcome institutional
barriers as laid out in section 43
Agreements between industry and administrations could be envisaged to overcome the
barriers
In order to enhance the sharing of expertise for both administrations and industry technology transfer
and technology cooperation agreements could be formulated in order to strengthen the cooperation
As identified before the technology transfer to the ship building industry is not a mayor barrier so the
agreements should help the administrations to become more aware of the possibilities to further
promote the implementation of MARPOL Annex VI
Typical agreements between industry and administrations could be in the form of initiatives like the
Sustainable Shipping Initiative (SSI) SSI members have developed a vision for a sustainable shipping
industry in 2040 They commit to working towards this in all their own operations andor activities that
involve shipping and in all their dealings with and support for the shipping industry to make their vision
a global reality by 2040 SSI members of over 19 companies represent ship owners and charterers
shipbuilders engineers and service providers banking insurance and classification societies The SSI
explored for instance how to overcome barriers to the uptake of new technologies and techniques which
improve the operational efficiency of ships potentially delivering energy efficiency savings of 10 or
more and payback periods of less than 5 years They also produce case studies to show good examples
and also develop tools By involving administrations in these kind of initiatives (even free of charge)
they could be actively supported with knowledge about sustainable shipping
26 httpwwwoecdorgstiindworkshopongreengrowthinshipbuildinghtm
TRANL15371 19
Technology Concerns
Barriers Technology Concerns
One of key barriers to the implementation of energy efficient technologies (new and retrofit) relates to
the lack of or limited technology supply chain Furthermore the lack of a technology base for RampD in
some states is a barrier Also the existence of concerns relating to the ability of available energy
efficiency measures to reduce emissions and operational costs and their compatibility with other
measures of energy efficient technologies is a barrier This is typically the problem in very isolated ship
yards
Measures forward
Very successful shipyards (Japan and Korea) have already since many years a large number of
licencing technology transfer and similar agreements and continuously exchange information with
competitors in and outside their countries For instance US shipyards have adopted this methodology
since the 1980s (office of technology assessment 1983)
Further technology sharing could be stimulated through educationalRampD institutes locally regionally
or globally in ship design and building The technology will be transferred to the ship builders once the
students start working there or through cooperation between industry and university In order to
facilitate this we recommend the establishment of partnerships to share expertiseexperience
Typically individuals who know both worlds are the driving force behind successful partnerships (AISBL
2012) These partnerships are built around a shared long term research vision Many partners could
contribute (eg financially) in order to establish the responsible management and research programme
The target of the platform could be for example to provide verified information on real-world energy
efficiency improvements via a monitoring programme
For example in order to stimulate the deployment of energy efficient trucks the Dutch government
provides a website to share audited knowledge and data on about 15 energy efficiency technologies27
Additionally climate financing could be leveraged to reduce the investment risk in unproven
technologies For example IMO Member States could create a demonstration fund that can function as
a guarantee for investments in new and immature technologies28 Similarly investment guarantees
can be provided by funds in the same way governments provide export credits to their companies If
the technology does not deliver the expected fuel-savings the fund can cover the difference and hence
reduce investment uncertainty The main objective being to reduce investment risk
Institutional Concerns
Barriers
27 httpwwwtruckvandetoekomstnl 28 An example of a specific EE fund is httpwwweeefeueligible-investmentshtml
TRANL15371 20
For Flag and Port States complying with new regulations of IMO and EEDI and SEEMP particularly
represent and increased administrative burden It requires revisions and amendments of existing
legislation that need to be implemented at Port and Flag State functions There is currently limited
technical capacity in state institutions to implement these changes especially in developing countries
with a relatively low number of ships under their flag
The lack of financial resources is also a barrier for additional compliance and enforcement activities by
maritime administrations This is particularly an issue for least developed countries and small
developing island states Implementation costs are relatively higher for small Flag States because of
limited abilitycapacity to implement new technical regulations Note that this issue is not specific to
the EEDI and the SEEMP but to most regulatory measures (maritime or other)
Measures forward
Measures to assist states in implementing (existing and new) legislation include
Promote an increased cooperation and communication between administrationswithin
regional administrations of Port and Flag States similarly to what has been suggested in
sections 41 (Awareness raising through capacity building activities such as workshops) and
42 (Establish platform to share regulatory expertiseexperience) Platforms could be
managed by IMO in conjunction with industry and development funds in order to share the
costs as this has been done before for GloBallast for example In that case the IMO is in the
lead (executing agency) but the platform is supporting the collaboration with many
stakeholdersfunding partners The goal of the programme is to assist developing countries
eg via e-learning courses
In addition deterrents need to be put in place to discourage Flag States from performing
substandard inspections A system for detecting sub-standard inspections should be
implemented whereby mandatory Port State Control inspections are carried out in close
proximity to mandatory Flag State inspections (ie the Flag State inspection is carried out
prior to the ship leaving port and the Port State inspection is carried out upon arrival at port)
The two inspections should be carried out under a uniform mandatory checklist The IMO
should monitor inspections and investigate where discrepancies between inspections close in
proximity are detected If a Flag or Port State is found to have failed to meet the requisite
inspection standards penalties in the form of substantial fines should follow
In order to overcome the financial barriers financial assistance to states could help with
capacity building and implementation Financial resources are not only needed in the
implementation of the new regulations (training of government experts) but governments of
Flag States also need to be involved continuously in the ongoing discussion around
developments new EEDI targets for 2020 and beyond which requires continuous availability
of experts to represent the interests of the state (Metselaar 2015) Financial aid can therefore
be supplied in the following forms
Increased financial support for compliance and enforcement activities by maritime
administrations
Financial support could be provided to Flag States so that they have the resources to
properly carry out vessel inspections Consideration should be given to the introduction of
TRANL15371 21
an International Fund Convention set up for this purpose and contributed to by Port
States andor their major oil and other cargo exporters and importers
Commercial
Barriers
Private parties such as ship owners and investors are not always commercially incentivised to make
investments in energy efficiency measures This can be due to the split incentives between owner (who
should make the investment) and charterer (who reaps the cost savings) of a ship (see paragraph 25)
Furthermore access to finance can be problematic for smaller players who operate in niche markets
Measures
Bottlenecks in financing private investments and new financing mechanisms could be addressed during
regional or international workshops that include traditional and new financiers that could finance
investments in energy efficiency technologies
One solution that has been brought forward to address the problem of split incentives is the use of
lsquosmart contractsrsquo (Michele Acciaro 2013) The idea is to change charter contracts in a way that risks
and benefits are shared among charterers and ship owners In such contracts speed choice is more
flexible and the chartering cost of vessels is closer to fuel cost as such ship owners get motivated to
invest in energy-efficient technologies and charterers get stimulated to run vessels in an energy
conserving manner
With respect to the shipbuilding industry the following could facilitate the transfer of technology as
well
Financial assistance to shipyards to be provided at the national level or through other
arrangements
Foreign direct investment in software and hardware as an innovative way to support industry
in implementing the requirements
One type of incentive that governments can provide to enhance industry performance and technology
adoption is a competition for top performers Governments could contribute to a fund from which
money is distributed to the top 10 of best performers in a particular year
Cost estimates
Workshops and training
Capacity building workshops for administrations are estimated at euro 1000 per attendee for an
online workshop (1-2 days) Costs for the organisation of such workshops would include expert fees
and administrative costs These costs could be lower if the course material is already developed
(model workshops) Eg 2 attendees per Flag State for the ten most important Flag States
TRANL15371 22
(covering 74 of total fleet tonnage) comes down to euro 20000 or less in case the courseware is
already existent
A situation that is more conductive to networking and experience sharing is to send people physically
to regional workshops The costs of such workshops including participants travel and hotels for 50
participants would be between euro20000 - euro100000 per workshop based on our international
experience with organising workshops in the field of renewable energy and energy efficiency Costs
could be lower depending on the amount of preparation required cost of location (could be sponsored
by participating states)
Technical training
Trainings already exist for calculating and verifying EEDI including development of tools to calculate
EEDI For example MARIN offers 32h courses over 5 days in the Netherlands for euro 5000 per attendee
(excluding travel and accommodation)29 Lloyds offers similar trainings for similar costs30
Model courses for training may need to be updated depending on identified needs Ecofys estimates
the update of eg an existing EEDI model courses to cost in the order of euro 50000
Online platform for inventory of energy efficiency technologies
Inventories of energy-efficiency technologies already exist (for example in reports like (IMO 2009) and
on websites of for instance DNV-GL the efficiency finder31) but they could be further developed since
the websites are either not independent or incomplete
In order to facilitate information exchange a web-based platform could be established The role of the
platform would be for example to provide verified information on real-world energy efficiency
improvements via a monitoring programme For example in order to stimulate the deployment of
energy efficient trucks the Dutch government provides a website to share audited knowledge and data
on about 15 energy efficiency technologies32 The costs of such a website and corresponding
programme are estimated to be around euro 2 million for a 4 year period Furthermore a platform can be
used to inspire others by showing best practices and can be used for sharing of information regarding
network opportunities like conferences and seminars
Capacity building project
Currently the IMO-GEF-UNDP GloBallast project is a capacity building project it assists developing
countries and their maritime industries in implementing international regulations on ballast water
29 httpwwwmarinnlwebEventsCoursesSpecialist-Course-on-Ship-propulsion-model-tests-and-SpeedPower-trials-for-EEDI-Verifiers-
2731-October-2014htm 30 httpwwwlloydslistcomllsectorship-operationsarticle422262ece 31 httpswwwdnvglcommaritimeenergy-efficiencyefficiency-finderhtml 32 httpwwwtruckvandetoekomstnl
TRANL15371 23
management and preventing risks arising from the transfer of harmful aquatic organisms And has
several aspects that could also be used for knowledge transfer of energy efficiency measures
web-site
e-learning course
databasesdirectories
library collections
newsletter
Regional Task Force (RTFs) to support development and adoption of a regional approach
Develop and implement communication education awareness raising and outreach
programme
Develop introductory and more specialised training packages
Develop model legislations
The total budget for the 2008-2012 period was US$23 million out of which US$564 million represents
a GEF grant the rest being mostly in-kind contributions from the participating countries regional co-
ordinating organisations (RCO) and strategic partners including the private sector
Improved access to information and information sharing with international recognised organisations
including relevant survey and certification training would further promote the different technologies
TRANL15371 24
Conclusions
This study provides an overview of existing technologies which could drastically improve the energy
efficiency of ships Furthermore barriers to transfer and uptake of energy efficient technologies are
analysed and categorised and implications of these barriers are listed in order to facilitate the uptake
of energy efficiency technologies for ships
From this research it is clear that conventional technology is available that can cost-effectively (with a
payback time of less than 15 years) achieve high efficiency gains If the maximum gains per category
are added up (for all but ferry and cruise) this would mean a total efficiency improvement of 35
Even without taking two experimental technologies with potentially high efficiency gains into account
(wind power and air lubrication)
High investments like wind power and contra rotating propellers bring the highest savings (13 ndash 20)
The medium investments are in-between (5-10) and the low investments only bring relatively small
energy efficiency improvements (lt5)
When the ship owner has too few opportunities to share investment with charterers this leads to a split
incentive a ship owner may invest the up-front capital to put in energy-efficient technology but not
receive the benefits This is typically a problem for investments with a high payback time ie the wind
power and contra rotating propellers
The main barriers are related to the transfer of technology to Flag States Flag States are generally
third world and developing nations that often do not have the resources to enforce investigate or
prosecute breaches by their flagged vessels
Several ways to overcome the knowledge transfer barriers were presented that can be categorised as
follows
Workshops and trainings
o Capacity building workshops for administrations
o Regional workshops
Technical training
o Training in calculating and verifying the EEDI
o Development of model courses
Online platform
o Inventory of energy-efficiency technologies
o Creation of a website with all relevant information for the target audience
o Improved access to information and information sharing
o Provide verified information on real-world energy efficiency improvements via a
monitoring programme
TRANL15371 25
The most expensive of the capacity building actions is the capacity building project which takes all
aspects above into account If a project would be developed for knowledge transfer regarding energy
efficiency measures similar to GloBallast which assists developing countries and their maritime
industries in implementing international regulations on ballast water management and preventing risks
arising from the transfer of harmful aquatic organisms the total budget needed would be in the order
of US$23 million for a period of 5 years
TRANL15371 26
References
JFE Group 2013 ldquoJapan Marine Unitedrdquo JFE Group Overview JFE Group AISBL 2012 Making Industry-University partnerships work lessons from succesful collaborations
report Belgium AISBL
Allenstroumlm Bjoumlrn 2013 ldquoWind propulsionrdquo SSPA Sweden AB Gothenburg EffShip March
Aqorau T 2000 Illegal Unreported and Unregulated Fishing Considerations for Developing
Countries paper Honiara Solomon Islands South Pacific Forum Fisheries Agency
BALance 2014 Competitive position and future opportunities of the Euroean Marine Supplies
industry BALance Technology Consulting
Barringhaus David and Robert Olds 1999 OLDS ENGINEERING Maximizing Propulsion Efficiency
Marine Division Accessed Februrar 2015
httpwwwoldscomaumarinemaximizing_propulsion_efficiency
Becker Marine System not dated Becker Bulb Rudders httpwwwbecker-marine-
systemscom05_downloadszzpdfproduct_pdfBecker_Bulb_Rudderspdf Becker Marine
System
mdash 2015 Twisted Full Spade Rudder Accessed Feb 2015 httpbecker-marine-
systemscom03_productsproducts_twisted_full_spadehtml
Bloomberg 2014 China Loses Shipbuilding Crown to South Korea Chart of the Day 9th December
httpwwwbusinessweekcomnews2014-12-09china-loses-shipbuilding-crown-to-south-
korea-chart-of-the-day
Bluebird-Electric 2014 Sipbuilding post World War Two httpwwwbluebird-
electricnetship_boat_design_buildingshipbuilders_ship_repairers_associationhtm
Boat design 2007 Accessed Feb 2015
httpwwwboatdesignnetforumsattachmentspropulsion16743d1193341389-new-
propulsion-sytems-ships-grim-prop-1jpg
Brannigan Paschos Eyers and Wood 2009 Report on International avialtion and Mritime Emissions
in a Copenhagen (post 2012) Agreement Oxfordshire AEA Group
Chen Benjamin Arthur Reed and Ki-Han Kim 1989 A Vane-Wheel Propulsor for a Research and
Development Report Newport David Taylor Research Center
CNSS 2015 Clean North Sea Shipping - Clean Shipping Technology Accessed Februar 2015
httpcleantechcnssnoghg-technologiestechnical-measuresmeasures-related-to-the-hull
Crist Philippe 2009 Greenhouse gas emissions reduction potential from international shipping
Working paper OECD
Daily Times 2015 Nigeria Turkey seek collaboration on ships shipyards 5th January
httpwwwdailytimescomngarticlenigeria-turkey-seek-collaboration-ships-shipyards
Dillingham Gerald L 2000 Progress Made to Reduce Marine Pollution by Cruise Ships but Important
Issues Remain GAO report Washington United States General Accounting Office
DK Group 2015 Silverstream technologies January Accessed January 2015 httpdkgroupeu
DNV 2014 Encouraging Construction and Operation of Green Ships OECD
httpwwwoecdorgstiindC-WP6(2013)12-FINAL-ENGpdf
TRANL15371 27
DNV GL 2015 EFFICIENCY FINDER Accessed Feb 2015 httpwwwdnvglcommaritimeenhance-
performanceefficiency-finderaspx
Ecorys 2012 ldquoGreen growth opportunities in the EU shipbuilding sectorrdquo
ECOSPEED 2015 EUROPEAN MARINE amp MACHINERY AGENCIES LTD Accessed February 2015
httpwwweuropeanmarinecoukECOSPEEDhtm
gcaptain 2012 gcaptain - Propeller Technology to Make Your Ship More Efficient - Accessed Feb
2015 httpgcaptaincompropeller-technology-ship-efficient
Hansen Dinham-Peren and Nojiri 2011 Model and Full Scale Evaluation of a lsquoPropeller Boss Cap
FinsrsquoDevice Fitted to an Aframax Tanker Second International Symposium on Marine
Propulsors smprsquo11 Hamburg Germany June 2011
Hellenic Shipping News 2014 Korean ships sell at fuel-saving premium 22nd December
httpwwwhellenicshippingnewscomkorean-ships-sell-at-fuel-saving-premium
Hindawi 2015 Hindawi Puplishing Cooperation Accessed February 2015
httpwwwhindawicomjournalsijrm2012474785fig4
Hochkirch Karsten and Volker Bertram not dated ldquoSlow Steaming Bulbous Bow Optimization for a
Large Containershiprdquo Accessed Februar 2015 http2021148960resourcepdf5096pdf
Hollenbach Uwe and Juumlrgen Friesch not dated Efficient hull forms ndash What can be gained
Conference ship-efficiency Hamburg 2013 Hamburg HSVA Hamburgische Schiffbau-
Versuchsanstalt GmbH HamburgGermany
ICCT 2011 Reduce Greenhouse Gas Emissions from Ships - Cost Effectiveness of Available options -
white paper Washington DC International Council on Clean transportation (ICCT)
IMO 2011 REDUCTION OF GHG EMISSIONS FROM SHIPS Marginal Abatement Costs and Cost
Effectiveness of Energy-Efficiency Measures Submitted by the Institute of Marine Engineering
Science and Technology (IMarEST) MEPC 62INF7 International Maritime Organisation
IMO 2009 Second IMO GHG Study 2009 London International Maritime Organisation
JSEA 2006 ldquoImproved propulsive performance - Universal applies new energy-saving type Leadge
Bowrdquo Japan Ship Exports Association (JSEA) httpwwwjseaorjpVariableJSea318pdf
Kawasaki 2015 Energy-saving Technology Accessed Feb 2015
httpswwwkhicojpenglishshiptechconservationindexhtml
Leddy Fiona Jayne 2012 ldquoA critical legal analysis of International Shipping in Australian Waters and
the risk of ship-based oil pollutionrdquo Queensland Environmental Practice Reporter vol 17
Marinelog 2014 China white lists 51 shipyards 4 September
httpwwwmarinelogcomindexphpoption=com_k2ampview=itemampid=7667china-white-
lists-51-shipyardsampItemid=231
Metselaar Kees interview by Arno van den Bos 2015 Policy officer at directorate maritime affairs of
ministry of Intrastructure and Environment (February)
Michele Acciaro Peter Nyegaard Hoffmann Magnus Strandmyr Eide 2013 ldquoThe Energy Efficiency
Gap in the Maritime Transportrdquo Journal of Shipping and Ocean Engineering 1-9
MIWB 2015 Maritiem Instituut Willem Barentsz Accessed Feb 2015
httpsmijnmiwbnlnieuwsbriefindexphpdo=showampid_artikel=116
MOL 2011 Energy-Saving Propeller Boss Cap Fins System Reaches Major Milestone - Orders
Received for 2000 Vessels Accessed Feb 2015
httpwwwmolcojpenpr20111145html
TRANL15371 28
Motorship 2014 Gas fuelled ships into the future 31 10 httpwwwmotorshipcomnews101ships-
and-shipyardsgas-fuelled-ships-into-the-future
Nakashima 2015 Nakashima propeller CO LTD Accessed Feb 2015
httpwwwnakashimacojpengproductrudderhtml
Nielsen Shin Lundgren and Faghani not dated Combined Kappel propeller and rudder bulb system
for improved propulsion efficiency Frederikshavn MAN Diesel amp Turbo
OECD 2014 The OECD Council Working Party on Shipbuilding
httpwwwoecdorgindustryindshipbuildinghtm
OECD 2011 ldquoThe Shipbuilding Industry in Turkeyrdquo
office of technology assessment 1983 An Assessment of Maritime Technology and Trade report
Washington DC US Congress
Pakarinen Risto 2007 ldquoNothing common about common railrdquo Twentyfour7 (Twentyfour7) 64-65
Ports amp Ships 2015 Ports and Ships Accessed February 2015
httpportscozanewsarticle_2007_10_17_4038html
Rolls-Royce 2014 Propulsors - Moving your business in the right direction httpwwwrolls-
roycecom~mediaFilesRRolls-Roycedocumentscustomersmarinepropulsion-2014-
tcm92-8664pdf Aalesund Rolls-Royce Commercial Marine httpwwwrolls-
roycecom~mediaFilesRRolls-Roycedocumentscustomersmarinepromaspdf
Schneekluth H and V Bertram 1998 Ship Design for Efficiency and Economy Oxford
Butterworth-Heinemann
Schulze Reinhard 2007 Twisted Rudder - Extreme Design 14 SVA-Forum bdquo Ruder in Theorie und
Praxisldquo Potsdam 7 November 2007 Potsdam Schiffbau-Versuchsanstalt Potsdam GmbH
Selenetrawlers 2015 Selenetrawlers Accessed February 2015
httpwwwselenetrawlerscomcompanydesign-notes
Sepideh Jafarzadeh Ingrid Bouwer Utne 2014 ldquoA framework to bridge the energy efficiency gap in
shippinrdquo Energy 603-612
SetSail 2009 SetSail Accessed February 2015 httpwwwsetsailcomprop-nozzle-comments-by-
an-expert
Shuto Hideki 2010 Super Eco Inland Vessels httpwwwccr-
zkrorgtempwrshp120411Presentations2_04_HShuto_enpdf IHI Marine United Inc
Silberschmidt Noah 2014 ldquoGenerating efficiencies from thin airrdquo SMM Green shipping | Efficiency
httpwwwsilverstream-techcomwp-contentuploads201404HANSA-241112pdf
httpwwwsilverstream-techcomwp-contentuploads201404HANSA-241112pdf
Skinner Ian 2009 EU Tranport GHG Routes to 2050 Technical options for maritime and inland
shipping httpwwweutransportghg2050eucmsassetsTechnical-options-maritime-inland-
waterpdf Brussel European Commission
Statista 2015 ldquoLargest shipbuilding nations in 2013 based on completions in gross tonnagerdquo
httpwwwstatistacomstatistics263895shipbuilding-nations-worldwide-by-cgt
UK DfT 2014 ldquoDfT Port Statistics - World fleet registered trading vessels of 100 gross tons and over
gross tonnage on selected registers 1999-2013rdquo
httpswwwgovukgovernmentcollectionsmaritime-and-shipping-statisticsdata-tables-
associated-with-this-series
TRANL15371 29
Voorham 2013 Assessment of sustainable investment in shipping Master Thesis
Report SDPO13029m Delft 27 th November 2013 Delft Delft University of Technology
WAumlRTSILAuml 2009 ldquoEnergy Evironment Economyrdquo Helsinki Finland WAumlRTSILAuml
mdash 2007 ldquoWaste heat recoveryrdquo Waumlrtsilauml Corporation
Wettstein and Brown 2008 Derating a solution for high fuel savings and lower emissions
Winterthur Waumlrtsilauml Switzerland Ltd
Wind Chellenger Project HP 2015 Wind Chellenger Project HP Accessed Feb 2015 httpwindku-
tokyoacjpindex_enhtml
TRANL15371 30
Appendix I - World fleet registered trading vessels
Table 3 World fleet registered trading vessels of 100 gross tons and over 2009-2013 Source UK DfT 2014
Flag Country 2009 2010 2011 2012 2013
(World Total) 8448 9130 9831 10343 10725
Panama 1886 1979 2084 2158 2172
(European Union) 1900 1979 2074 2051 2106
Liberia 908 1037 1167 1238 1241
Marshall Islands 475 590 711 811 900
Hong Kong 449 553 678 785 854
Singapore 398 434 512 592 677
Malta 348 380 438 450 496
Bahamas 452 469 481 483 485
Greece 388 407 411 411 415
China 282 327 356 388 411
United Kingdom (inc IOM and CI) 258 273 294 300 288
Cyprus 201 205 207 197 203
Japan 138 156 167 178 192
Italy 150 169 181 180 176
Norway 152 145 143 144 145
Germany 152 155 153 137 123
Denmark 107 115 113 113 122
Korea South 120 124 116 111 112
Indonesia 69 82 91 101 111
Bermuda 94 100 106 109 105
Antigua amp Barbuda 100 107 111 106 100
United States of America 107 108 102 99 97
India 83 83 89 85 82
Netherlands 76 61 67 66 69
Turkey 54 58 62 64 59
Malaysia 69 72 71 62 57
France 63 63 64 56 53
Russia 47 49 49 51 52
Philippines 50 51 50 43 43
Cayman Islands 27 29 32 32 31
Taiwan 25 26 27 30 31
Iran 09 08 05 21 31
Thailand 25 26 22 26 29
Sweden 39 35 33 28 27
St Vincent amp the Grenadines 47 42 37 28 24
Canada 24 24 25 24 23
Spain 22 25 26 25 23
Kuwait 23 19 24 24 22
Brazil 20 20 19 19 20
Cambodia 18 17 13 13 12
TRANL15371 31
Appendix II - Most important shipbuilding
countries
China
China is an emerging shipbuilder that overtook South Korea during the 2008-2010 global financial crisis
as they won new orders for medium and small-sized container ships (Bloomberg 2014 Bluebird-Electric
2014)
Figure 14 delivery of vessels from Chinese and South Korean shipyards in million compensated gross tons a measure
of building time and human resources used per ton Source (Bloomberg 2014)
China has more than 1600 shipyards Analysts have predicted that about one third of them will fold
as the industry struggles with overcapacity Last year China laid out a three year plan for industry
restructuring that urged yards to concentrate on building higher quality vessels and local governments
to halt approvals for new projects (Bluebird-Electric 2014)
After two decades of a loan-fuelled boom Chinarsquos shipbuilding industry has become saddled with debt
and overcapacity prompting some private firms to seek financial assistance from the state In
September the government issued a list of 51 shipbuilders it deemed worthy of public support
(Marinelog 2014)
TRANL15371 32
New additions to the white list include subsidiaries of the China State Shipbuilding Corporation (CSSC)
and the China Shipbuilding Industry Corporation (CSIC) and the AVIC Weihai Shipyard owned by the
Aviation Industry Corporation of China (AVIC) (Marinelog 2014)
South Korea
By the end of 2014 it seemed South Korea has overtaken China again as the worlds largest
shipbuilding country with a global market share of about 30(see Figure 14) (Bloomberg 2014)
(Bluebird-Electric 2014) South Korea leads in the production of large vessels such as cruise liners
super tankers LNG carriers drill ships and large container ships
South Koreas shipyards are highly efficient with the worlds largest shipyard in Ulsan operated by
Hyundai Heavy Industries slipping a newly built $80 million vessel into the water every four working
days South Koreas big three shipbuilders Hyundai Heavy Industries Samsung Heavy Industries
and Daewoo Shipbuilding amp Marine Engineering dominate global shipbuilding with STX Shipbuilding
Hyundai Samho Heavy Industries Hanjin Heavy Industries and Sungdong Shipbuilding amp Marine
Engineering also ranking among the top ten shipbuilders in the world In 2007 STX Shipbuilding further
strengthened South Koreas leading position in the industry by acquiring Aker Yards the largest
shipbuilding group in Europe (The former Aker Yards was renamed STX Europe in 2008) In the first
half of 2011 South Korean shipbuilders won new orders to build 25 LNG carriers out of the total 29
orders placed worldwide during the period
To maintain their market position Korean yards also focus more and more on greening opportunities
The Korean government introduced a GHG emission reducing program in 2008 The program is aiming
at reducing GHG emissions throughout all economic sectors including the shipping and shipbuilding
industry Also the Japanese Shipbuilding Association (SAJ) is looking into the possibilities to reduce
GHG emissions so that the shipbuilding industry becomes greener and more competitive (Ecorys
2012)
Japan
Japan had been the dominant ship building country from the 1960s through to the end of 1990s but
gradually lost its competitive advantage to the emerging industry in South Korea which had the
advantages of much cheaper wages strong government backing and a cheaper currency South Korean
production overtook Japans in 2003 and Japanese market share has since fallen sharply
The Philippines
The Philippines has placed fourth among shipbuilding nations around the world producing more than
six million deadweight tonnes of ships built in 2012 The country is anchored by South Korean Hanjin
and Japans Tsuneishi shipbuilders The country has shipyards in Subic and Cebu
TRANL15371 33
Europe
For several decades European shipyards have been facing strong global competition from especially
Asian enterprises (Japanese yards in the 1950s and 60s Koreans from the 1970s and 80s and Chinese
since the 1990s) In Europe this has led to an almost complete exit from the mass production segments
of tankers bulkers and containerships Response of the EU industry has been to focus on the higher
value more complex ship types such as ferries and passenger ships non-cargo vessels and general
cargo ships In addition only limited numbers of vessels of the same type are being built (in contrast
with bulk vessels which are mass produced) Europe has a 77 percent market share in building
passenger vessels (including both cruise ships as well as ferries) and a 17 percent share in the
construction of non-cargo vessels (Ecorys 2012) These segments make up a relatively small share of
the world orderbook (in CGT) However in value they represent a much higher share due to their
relatively sophisticated characteristics The position of the European shipbuilding industry in the
manufacturing of specialised innovative vessels is still strong At the same time European equipment
manufacturers have acquired a leading role in quality products especially in complex high value
equipment components
Figure 15 World orderbook and CESA orderbook by ship type in 2010 (CGT x 1000) (Source Ecorys 2012)
Regarding the marine equipment sector the European industry is renowned for propulsion cargo
handling communication automation environmental and security systems This equipment is not only
destined for complex European-built ships but also exported to Asian yards whether or not requested
by their clients (Ecorys 2012)
Compared to the ship construction sector the marine equipment segment is highly heterogeneous and
consists of companies that are often also active in other business areas (ie automotive or aircraft
industry) A study by (BALance 2014) found that the European marine equipment industryrsquos
TRANL15371 34
competitiveness lies in a strong market position and technological leadership at least for globally active
European marine supply companies who build their position on a strong infrastructure and co-operative
partners skill of their employees and close relationship with their customer base Conversely identified
weaknesses are the cost level in Europe and the heterogeneous structure of the industry with many
SMEs which hinder in some cases attempts to follow the markets by globalisation strategies
Turkey
Shipbuilding in Turkey has evolved from an old traditional activity in Anatolia to an internationally
recognised industry especially since the early 1990s The industry has modern shipyards that can build
ships yachts mega-yachts and sailing boats as well as carrying out extensive repair and conversion
works Turkeyrsquos shipyards are mainly located in the Marmara Region namely Tuzla Yalova and İzmit
which have developed into dynamic shipbuilding centres Also in recent years the emerging Black Sea
and Mediterranean Regions have increasingly attracted shipyard investments
In the last decade in parallel with developments in the global market Turkish shipbuilding experienced
a several-fold increase in its shipbuilding and export capacity including a significant product
diversification According to order books this resulted in Turkey being regularly placed in the top ten
countries on the basis of its deadweight (dwt) production and in the top five countries by the number
of ships
In recent years Turkey has increasingly tapped into niche markets which in turn has led to a growing
participation by Turkish shipyards in the international trade in new ships In parallel there has also
been strong growth in the marine equipment manufacturing sector which could increasingly also tap
the export market These developments reflect in part the strategic location of the yards the
experienced workforce the quality of production and Turkeyrsquos significant role as a political cultural and
economic bridge between Europe and Central Asian and Middle Eastern economies (OECD 2011)
ECOFYS Netherlands BV | Kanaalweg 15G | 3526 KL Utrecht| T +31 (0)30 662-3300 | F +31 (0)30 662-3301 | E infoecofyscom | I wwwecofyscom
ECOFYS Netherlands BV
Kanaalweg 15G
3526 KL Utrecht
T +31 (0) 30 662-3300
F +31 (0) 30 662-3301
E infoecofyscom
I wwwecofyscom
HOW TO OBTAIN EU PUBLICATIONS
Free publications
bull one copy
via EU Bookshop (httpbookshopeuropaeu)
bull more than one copy or postersmaps
from the European Unionrsquos representations (httpeceuropaeurepresent_enhtm)
from the delegations in non-EU countries
(httpeeaseuropaeudelegationsindex_enhtm)
by contacting the Europe Direct service (httpeuropaeueuropedirectindex_enhtm)
or calling 00 800 6 7 8 9 10 11 (freephone number from anywhere in the EU) () () The information given is free as are most calls (though some operators phone boxes or hotels may charge you)
Priced publications
bull via EU Bookshop (httpbookshopeuropaeu)
Priced subscriptions
bull via one of the sales agents of the Publications Office of the European Union
(httppublicationseuropaeuothersagentsindex_enhtm)
doi 102834880780
ML-0
1-1
5-4
39-E
N-N
[Ca
talo
gu
e n
um
be
r]
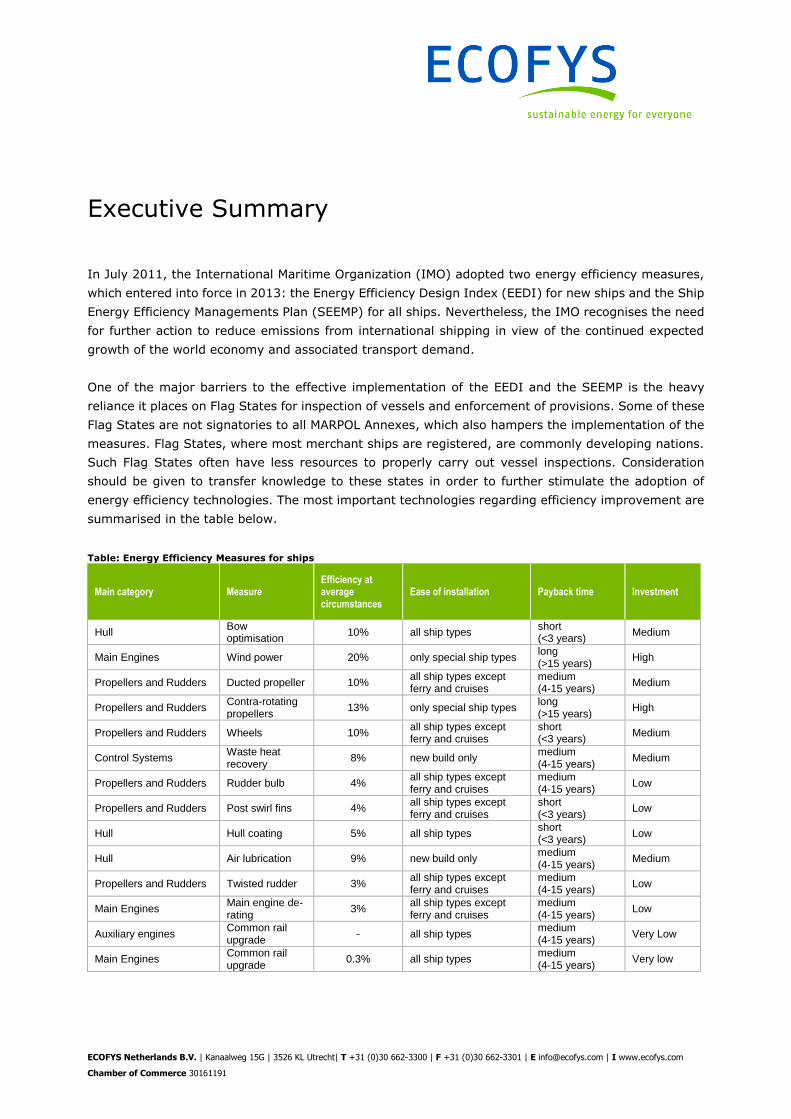
ECOFYS Netherlands BV | Kanaalweg 15G | 3526 KL Utrecht| T +31 (0)30 662-3300 | F +31 (0)30 662-3301 | E infoecofyscom | I wwwecofyscom
Chamber of Commerce 30161191
Executive Summary
In July 2011 the International Maritime Organization (IMO) adopted two energy efficiency measures
which entered into force in 2013 the Energy Efficiency Design Index (EEDI) for new ships and the Ship
Energy Efficiency Managements Plan (SEEMP) for all ships Nevertheless the IMO recognises the need
for further action to reduce emissions from international shipping in view of the continued expected
growth of the world economy and associated transport demand
One of the major barriers to the effective implementation of the EEDI and the SEEMP is the heavy
reliance it places on Flag States for inspection of vessels and enforcement of provisions Some of these
Flag States are not signatories to all MARPOL Annexes which also hampers the implementation of the
measures Flag States where most merchant ships are registered are commonly developing nations
Such Flag States often have less resources to properly carry out vessel inspections Consideration
should be given to transfer knowledge to these states in order to further stimulate the adoption of
energy efficiency technologies The most important technologies regarding efficiency improvement are
summarised in the table below
Table Energy Efficiency Measures for ships
Main category Measure Efficiency at average circumstances
Ease of installation Payback time Investment
Hull Bow optimisation
10 all ship types short (lt3 years)
Medium
Main Engines Wind power 20 only special ship types long (gt15 years)
High
Propellers and Rudders Ducted propeller 10 all ship types except ferry and cruises
medium (4-15 years)
Medium
Propellers and Rudders Contra-rotating propellers
13 only special ship types long (gt15 years)
High
Propellers and Rudders Wheels 10 all ship types except ferry and cruises
short (lt3 years)
Medium
Control Systems Waste heat recovery
8 new build only medium (4-15 years)
Medium
Propellers and Rudders Rudder bulb 4 all ship types except ferry and cruises
medium (4-15 years)
Low
Propellers and Rudders Post swirl fins 4 all ship types except ferry and cruises
short (lt3 years)
Low
Hull Hull coating 5 all ship types short (lt3 years)
Low
Hull Air lubrication 9 new build only medium (4-15 years)
Medium
Propellers and Rudders Twisted rudder 3 all ship types except ferry and cruises
medium (4-15 years)
Low
Main Engines Main engine de-rating
3 all ship types except ferry and cruises
medium (4-15 years)
Low
Auxiliary engines Common rail upgrade
- all ship types medium (4-15 years)
Very Low
Main Engines Common rail upgrade
03 all ship types medium (4-15 years)
Very low
ECOFYS Netherlands BV | Kanaalweg 15G | 3526 KL Utrecht| T +31 (0)30 662-3300 | F +31 (0)30 662-3301 | E infoecofyscom | I wwwecofyscom
Chamber of Commerce 30161191
From this research it is clear that conventional technology is available to achieve high efficiency gains
It is possible to save 35 of fuel with only a few improvements that require an upfront investment
that can be earned back within 15 years High investments like contra rotating propellers and wind
power (experimental technology) bring the highest savings (13 ndash 20) The medium investments are
in-between (5-10) and the low investments only bring relatively small energy efficiency
improvements (lt5)
When the ship owner has too few opportunities to share investment with charterers this leads to a split
incentive a ship owner may invest the up-front capital to put in energy-efficient technology but not
receive the benefits This is typically a problem for investments with a high payback time ie the wind
power and contra rotating propellers
Several ways to overcome the knowledge transfer barriers were presented that can be categorised as
follows
Workshops and trainings
o Capacity building workshops for administrations
o Regional workshops
Technical training
o Training in calculating and verifying the EEDI
o Development of model courses
Online platform
o Inventory of energy-efficiency technologies
o Creation of a website with all relevant information for the target audience
o Improved access to information and information sharing
o Provide verified information on real-world energy efficiency improvements via a
monitoring programme
This report provides cost estimations for each of these capacity building options The most expensive
being a capacity building project that would take all aspects into account similar to GloBallast which
assists developing countries and their maritime industries in implementing international regulations on
ballast water management and preventing risks arising from the transfer of harmful aquatic organisms
The total budget for GloBallast for the 2008-2012 period was US$23 million
ECOFYS Netherlands BV | Kanaalweg 15G | 3526 KL Utrecht| T +31 (0)30 662-3300 | F +31 (0)30 662-3301 | E infoecofyscom | I wwwecofyscom
Chamber of Commerce 30161191
Reacutesumeacute
En Juillet 2011 lOrganisation Maritime Internationale (OMI) a adopteacute deux mesures defficaciteacute
eacutenergeacutetique qui sont entreacutees en vigueur en 2013 lrsquoIndice de Conception drsquoEfficaciteacute Energeacutetique
(EEDI en anglais) pour les navires neufs et le Plan de Gestion dEfficaciteacute Eacutenergeacutetique (SEEMP en
anglais) pour tous les navires Neacuteanmoins lOMI reconnaicirct la neacutecessiteacute de nouvelles mesures pour
reacuteduire les eacutemissions du transport maritime international compte tenu de la croissance continue de
leacuteconomie mondiale et de la demande de transport correspondante
Lun des principaux obstacles agrave la mise en œuvre des mesures EEDI et du SEEMP est lieacutee au fait que
linspection des navires et lapplication des dispositions sont de la responsabiliteacute des Eacutetats de pavillon
Certains de ces Eacutetats de pavillon ne sont pas signataires de toutes les annexes de la convention
MARPOL ce qui entrave eacutegalement la mise en œuvre des mesures Les Eacutetats de pavillon ougrave la plupart
des navires de commerce sont immatriculeacutes sont souvent des pays en deacuteveloppement Ils ont
souvent moins de ressources pour mener agrave bien les inspections de navires Il faudrait envisager de
transfeacuterer des connaissances agrave ces Eacutetats afin de stimuler davantage ladoption des technologies
defficaciteacute eacutenergeacutetique Les technologies les plus importantes concernant lameacutelioration de lefficaciteacute
sont reacutesumeacutees dans le tableau ci-dessous
Cateacutegorie principale Mesure Rendement en circonstances normales
Faciliteacute drsquoinstallation Retour sur investissement
Investissement
Coque Optimisation de la proue
10 Tous types de navires court (lt3 ans)
Moyen
Moteurs principaux Energie eacuteolienne 20 Uniquement certains types de navires
long (gt15 ans)
Eacuteleveacute
Heacutelices et Gouvernails Tuyegravere Kort 10 Tous types sauf ferry et paquebots
moyen (4-15 ans)
Moyen
Heacutelices et Gouvernails Heacutelice contrarotative
13 Uniquement navires speacuteciaux
long (gt15 ans)
Eacuteleveacute
Heacutelices et Gouvernails Roues agrave Aubes 10 Tous types sauf ferry et paquebots
court (lt3 ans)
Moyen
Systegravemes de controcircle Reacutecupeacuteration de chaleur
8 Uniquement navires neufs
moyen (4-15 ans)
Moyen
Heacutelices et Gouvernails Ampoule de gouvernail
4 Tous types sauf ferry et croisiegravere
moyen (4-15 ans)
Bas
Heacutelices et Gouvernails Ailettes de turbulence
4 Tous types sauf ferry et paquebots
court (lt3 ans)
Bas
Coque Revecirctement de coque
5 Tous types de navires court (lt3 ans)
Bas
Coque Injection drsquoair sous la coque
9 Uniquement navires neufs
moyen (4-15 ans)
Moyen
Heacutelices et Gouvernails Gouvernail tordu 3 Tous types sauf ferry et paquebots
moyen (4-15 ans)
Bas
Moteurs principaux Ralentissement du moteur (de-rating)
3 Tous types sauf ferry et paquebots
moyen (4-15 ans)
Bas
Moteur auxiliaire Modernisation du common rail
- Tous types de navires moyen (4-15 ans)
Tregraves Bas
Moteurs principaux Modernisation du common rail
03 Tous types de navires moyen (4-15 ans)
Tregraves Bas
ECOFYS Netherlands BV | Kanaalweg 15G | 3526 KL Utrecht| T +31 (0)30 662-3300 | F +31 (0)30 662-3301 | E infoecofyscom | I wwwecofyscom
Chamber of Commerce 30161191
Cette recherche montre clairement que des technologies conventionnelles sont disponibles pour
reacutealiser des gains eacuteleveacutes defficaciteacute La mise en œuvre des mesures dont lrsquoinvestissement se
rentabilise en moins de 15 ans permet deacutejagrave deacuteconomiser 35 de carburant Des investissements
eacuteleveacutes comme les heacutelices contrarotatives et leacutenergie eacuteolienne (technologies expeacuterimentales)
permettraient des eacuteconomies drsquoeacutenergies les plus eacuteleveacutees (13-20) Les investissements de taille
moyenne rapportent des eacuteconomies de 5-10 et les investissements les plus faibles apportent
relativement peu drsquoeacuteconomies (lt5)
Lorsque les proprieacutetaires de navires nrsquoont pas la possibiliteacute de partager les investissements avec les
affreacuteteurs cela megravene agrave une discordance des inteacuterecircts un armateur peut investir le capital pour des
technologies deacuteconomie deacutenergie mais nen recevra pas les beacuteneacutefices Ceci est un problegraveme typique
pour les investissements avec un temps de reacutecupeacuteration eacuteleveacute agrave savoir leacutenergie eacuteolienne et les
heacutelices contra rotatives
Plusieurs faccedilons de surmonter les obstacles de transfert de connaissances sont preacutesenteacutees qui
peuvent ecirctre classeacutees de la forme suivante
Ateliers et formations
o Ateliers de renforcement de capaciteacute pour administrations nationales
o Ateliers reacutegionaux
Formations techniques
o Formations dans le calcul et veacuterification de lrsquoEEDI
o Deacuteveloppement de cours standardiseacutes
Plateforme en ligne
o Inventaire de technologies drsquoefficaciteacute eacutenergeacutetique
o Creacuteation de site internet avec informations pertinentes pour le public cible
o Ameacutelioration de lrsquoaccegraves aux informations et partage de connaissances
o Apport drsquoinformations veacuterifieacutees sur les eacuteconomies veacuteritablement reacutealiseacutees agrave travers un
programme de monitoring
Ce rapport fournit des estimations de coucircts pour chacune de ces options de renforcement de
capaciteacutes La plus coucircteuse serait un projet de renforcement des capaciteacutes qui prendrait en compte
tous les aspects semblable au projet GloBallast qui aide les pays en deacuteveloppement et leurs
industries maritimes avec la mise en œuvre des regraveglements internationaux sur la gestion des eaux de
ballast et la preacutevention des risques de transfert dorganismes aquatiques nuisibles Le budget total
pour GloBallast pour la peacuteriode 2008-2012 eacutetait de $ US 23 millions
ECOFYS Netherlands BV | Kanaalweg 15G | 3526 KL Utrecht| T +31 (0)30 662-3300 | F +31 (0)30 662-3301 | E infoecofyscom | I wwwecofyscom
Chamber of Commerce 30161191
Table of contents
1 Introduction 1
2 Relevant Stakeholders 2
Global Shipbuilding Nations 3
Flag States and their role in the implementation of MARPOL 3
Surveys 4
Punishments for failure to comply 5
Role of Port States 6
Cooperation between Port and Flag States 6
Ship owners and charterers 6
Conclusions 7
3 Energy Efficiency Measures for Ships 9
Hull and superstructure 2
Bow optimisation 2
Hull coating 3
Air lubrication 3
Engines 4
Main engine de-rating 5
Common-rail upgrade (common-rail fuel injection) 5
Auxiliary engines and systems 6
Wind power 6
Control Systems Waste heat recovery 7
Propellers and Rudders 8
Ducted propeller (Kort Nozzle) 8
Contra-rotating propellers (CRP) 9
Post swirl devises 10
Barriers to the transfer and uptake of energy efficiency technologies for ships and
possible measures to overcome them 15
Awareness Raising 17
Technology Concerns 19
Institutional Concerns 19
Commercial 21
Cost estimates 21
Workshops and training 21
Technical training 22
Online platform for inventory of energy efficiency technologies 22
Capacity building project 22
ECOFYS Netherlands BV | Kanaalweg 15G | 3526 KL Utrecht| T +31 (0)30 662-3300 | F +31 (0)30 662-3301 | E infoecofyscom | I wwwecofyscom
Chamber of Commerce 30161191
Conclusions 24
References 26
Appendix I - World fleet registered trading vessels 30
Appendix II - Most important shipbuilding countries 31
China 31
South Korea 32
Japan 32
The Philippines 32
Europe 33
Turkey 34
TRANL15371 1
1 Introduction
The negotiations within the International Maritime Organization (IMO) on enhancing the energy
efficiency of and reducing the greenhouse gas emissions from international shipping are a top-priority
for the European Commission in view of the European Unions preference for a global measure to
address greenhouse gas emissions from shipping
In July 2011 the IMO adopted two energy efficiency measures which entered into force in 2013 the
Energy Efficiency Design Index (EEDI) for new ships and the Ship Energy Efficiency Managements Plan
(SEEMP) for all ships1 Nevertheless the IMO recognises the need for further action to reduce emissions
from international shipping in view of the continued expected growth of the world economy and
associated transport demand Consequently the IMO began working on further measures to increase
the energy efficiency of international shipping including the development of a global data collection
system as a first step in April 2014
At the time of the adoption of the EEDI and the SEEMP it was agreed to complement them with a
Resolution on the promotion of technical cooperation and transfer of technology relating to the
improvement of energy efficiency of ships The Resolution was intended to provide a framework for the
promotion and facilitation of capacity building technical cooperation and technology transfer to
support in particular in developing countries the implementation of the EEDI and the SEEMP The
Resolution was adopted in 2013 and an expert group tasked to ensure the Resolutions effective
implementation was established in April 2014
The EU is actively contributing to the work of the IMO Ad Hoc Expert Working Group on Facilitation of
Transfer of Technology for Ships (AHEWG-TT) to ensure effective implementation of the Resolution and
incidentally advance the related IMO negotiations on further measures to increase the energy efficiency
of international shipping
The goal of this project is to contribute to the work of the AHEWG-TT and to further stimulate the
effective implementation of the International Maritime Organization (IMO) Resolution on the promotion
of technical cooperation and transfer of technology2
To achieve this goal this study provides a short overview of relevant stakeholders and existing
technologies which could improve the energy efficiency of ships Furthermore barriers to transfer and
uptake of energy efficient technologies are categorised and analysed and possible measures to
overcome these barriers are being proposed
1 Amendments to MARPOL Annex VI (prevention of air pollution from ships) 2 httpwwwimoorgOurWorkEnvironmentPollutionPreventionAirPollutionPagesTechnical-Co-operationaspx
TRANL15371 2
2 Relevant Stakeholders
The IMO resolution on the promotion of technical cooperation and transfer of technology (regulation
23) is intended to support states which request technical assistance Three main categories of
stakeholders were identified that can be considered of relevance
(1) Shipbuilding nations where the ships are produced
(2) Flag States (where the ships are registered) and Port States who are allowed to inspect foreign
ships compliance to international regulations
(3) Ship owners and ship charterers who are responsible for the design and use of the ships
TRANL15371 3
Global Shipbuilding Nations
Shipbuilding nations typically provide incentives for the shipbuilding industry in their country Therefore
they play a role in the transfer of technologies to their industry
In 2012 some 3655 ships were built worldwide The largest share of the tonnage was built in China
South Korea and Japan (Figure 1)
Figure 1 Ship building in 1000 gross tons Source (Statista 2015) quoting IHS and Shipbuilders Association of
Japan
The worldrsquos leading shipyards include South Korearsquos Hyundai Heavy Industries Japanrsquos Mitsubishi
Heavy Industries and Chinarsquos Shanghai Waigaoqiao (Statista 2015) China South Korea and Japan
together are responsible for building about 90 of the ships in gross tons
Flag States and their role in the implementation of MARPOL
Flag States have the responsibility for enforcing the rules set out under MARPOL Every Flag State has
the duty to ensure that its vessels fully comply with the applicable articles of MARPOL3
3 MARPOL Regulation 6
TRANL15371 4
At the end of 2013 about one-fifth of merchant vessels were registered in Flag State Panama 12 in
Flag State Liberia and 8 in the Flag State Marshall Islands (Figure 2 and (UK DfT 2014)) Therefore
already 40 of the world fleet are registered in these three Flag States
Figure 2 World fleet registered trading vessels of 100 gross tons and over 2009-2013 Source UK DfT 2014
Under MARPOL these parties (Flag States) can enforce ship-owners and operators obligations in three
main ways
- by surveyinspection of vessels to ensure that they meet minimum requirements4
- by monitoring vessel compliance with oil discharge requirements5 (not relevant for energy
efficiency) and
- by implementing punishments for failure to comply with requirements6
Surveys
MARPOL Annex VI contains a set of requirements for survey and issuance of International Air
Pollution Prevention Certificate (IAPP) and regulations regarding
Ozone depleting substances from refrigerating plants and firefighting equipment
Nitrogen Oxides (NOx) from diesel engines
Sulphur Oxides (SOx) from diesel engines
4 MARPOL article 5 5 MARPOL Annex I Chapter 4 Regulation 31 6 MARPOL article 4
TRANL15371 5
Volatile Organic Compound Emissions from cargo tanks of oil tankers
Shipboard Incineration
Fuel oil quality
Flag States must conduct an initial survey before a new ship is put into service and before the IAPP is
issued for the first time a renewal survey at intervals specified by the Administration but not exceeding
five years an intermediate survey within three months before or after the second anniversary date or
within three months before or after the third anniversary date of the certificate an annual survey within
three months before or after each anniversary date of the certificate and after prescribed repairs an
additional survey7
For the EEDI and the SEEMP a new certificate the International Energy Efficiency Certificate (IEEC)
was established and must be kept available on board for inspectionssurveys The IEEC Certificate will
be issued for new build ships upon the initial survey before the ship is put into service and for existing
ships of 400 gross tonnage and above The IEE Certificate will be issued once for each ship and is valid
throughout the lifetime of the ship (except flag change major conversion or ship going out of service)
There are no follow-up surveys on the IEEC Certificate
The IMO has created guidelines for surveys that Flag States should follow The energy efficiency related
one is
2014 Guidelines on survey and certification of the Energy Efficiency Design Index (EEDI)
(resolution MEPC254(67))
A Flag State cannot allow a vessel that does not pass inspection to sail until it complies with MARPOL8
An International Energy Efficiency Certificate in accordance with the provisions of regulation 54 to
any ship of 400 gross tonnage and above is needed before that ship may engage in voyages to ports
or offshore terminals under the jurisdiction of other Parties
Punishments for failure to comply
In case of failure to comply the authority carrying out the inspection may detain the ship Article 7 of
MARPOL ensures that unduly delay or detain will be avoided where possible or compensated
A Flag State is obliged to investigate an incident upon receipt of notification or evidence that one of its
vessels has breached MARPOL If the investigations reveal that a breach has occurred the Flag State
has further obligations to initiate legal proceedings against the vessel and report back to the reporting
state on actions taken9
7 MARPOL Annex VI Chapter 2 Regulation 5 8 MARPOL Annex VI Chapter 2 Regulation 6 9 MARPOL article 6
TRANL15371 6
Also other parties are allowed to inspect vessels under MARPOL Article 6 when violations are detected
or for regular inspections A Party may also inspect a ship to which the present Convention applies
when it enters the ports or off-shore terminals under its jurisdiction if a request for an investigation is
received from any Party together with sufficient evidence that the ship has discharged harmful
substances or effluents containing such substances in any place
Role of Port States
Under ldquoPort State Controlrdquo arrangements Port States also have the authority to conduct vessel surveys
on ships which visit their ports and to detain those ships that fall below MARPOL requirements In
relation to MARPOL Annex VI chapter 4 any port state inspection shall be limited to verifying when
appropriate that there is a valid International Energy Efficiency Certificate on board10
Cooperation between Port and Flag States
Under MARPOL parties are required to co-operate in detecting vessel violations and are required to
use all practical measures to detect and monitor violations If a State has evidence of a violation they
are obligated to forward this evidence to the vesselrsquos Flag State
All ships flagged under countries that are signatories to MARPOL are subject to its requirements
regardless of where they sail and member nations are responsible for vessels registered under their
respective nationalities
When incidents occur outside the countrys jurisdiction or jurisdiction cannot be determined the
country refers cases to Flag States in accordance with MARPOL Some States are not happy with the
lack of response from Flag States United States experience of Flag States not responding has led to
new policy which would take direct enforcement action against vessels for MARPOL V violations
occurring between 3 and 200 nautical miles from the United States rather than referring such violations
to the flag states (Dillingham 2000)
Ship owners and charterers
A ship owner is the owner of a commercial ship A ship owner is someone who equips and exploits a
ship usually for delivering cargo at a certain freight rate The ship owner determines the specifications
of the ship and its energy efficiency measures but the benefits of low fuel consumption are not always
theirs when the ship is chartered to someone else
Depending on the type of ship and the type of charter normally a standard contract form called a
charter party is used to record the exact rate duration and terms agreed between the ship owner and
the charterer
10 MARPOL Annex VI Regulation 10
TRANL15371 7
A charterer may be a party without a cargo who takes a vessel on charter for a specified period from
the owner and then trades the ship to carry cargoes at a profit above the hire rate In some cases a
charterer may own cargo and employ a shipbroker to find a ship to deliver the cargo for a certain price
Two main types of charter can be distinguished time charter and voyage charter In a voyage charter
the owner is still responsible for the port fuel and crew costs In a time charter the charterer selects
the ports and directs the vessel where to go The charterer pays for all fuel the vessel consumes port
charges commissions and a daily hire to the owner of the vessel
When there are too few opportunities to share investment with charterers this leads to a split incentive
a ship owner may invest the up-front capital to put in energy-efficient technology but doesnrsquot then
recoup the costs from fuel savings as they charter their ships out as this goes to the charterers This
problem is particularly apparent for short-term time charters11
Conclusions
Regarding energy efficiency the work of the AHEWG-TT12 has shown that the main shipbuilding nations
all have access to the necessary technologies provided there is demand for them It has also been
noted that there is no need for transfers of intellectual property rights13
One of the major barriers to the effective implementation of the EEDI and the SEEMP is the heavy
reliance it places on Flag States for inspection of vessels and enforcement of provisions During the
1970rsquos ships were being reflagged from high tax and high regulation countries such as the United
States and the United Kingdom to countries offering Flags of Convenience (lsquoFOCrsquo) Under FOCs ship-
owners pay less tax to the relevant Flag State and are able to evade the majority of the environmental
and construction standards set out under MARPOL (Leddy 2012) The main reason for that is that
several Flag States are not signatories to all MARPOL Annexes (eg as of 20142015 the Bahamian
Bolivian Cambodian North Korean Georgian Honduran Lebanese and Sri Lankan flags of
convenience had not ratified all MARPOL treaty annexes III-VI14 15)
Many FOCs are developing nations that do not have the resources to enforce investigate or prosecute
breaches by their flagged vessels (Aqorau 2000) As of 2014 55 of merchant ships are flagged by
FOC and 40 of ships are flagged by FOCdeveloping countries MARPOL only provides guidelines for
Flag States to follow when surveying vessels under regulation 6 but none of these guidelines are
mandatory Conversely Port States which are developed are better equipped to bear the cost of
inspection investigation enforcement and prosecution costs However in relation to EEDI and the
11 httpssi2040orgwhat-we-dowork-streamsfinance 12 MEPC 6831 Progress report of the Ad Hoc Expert Working Group on Facilitation of Transfer of Technology for Ships 13 Submission of the United States on Task 3 of the Ad Hoc Expert Working Group on Facilitation of Transfer of Technology for Ships Jan
2015 14 wwwics-shippingorgdocsflag-state-performance-table 15 httpwwwimoorgAboutConventionsStatusOfConventionsPagesDefaultaspx status of conventions
TRANL15371 8
SEEMP port state control is limited to verifying when appropriate that there is a valid International
Energy Efficiency Certificate on board
We therefore conclude that there needs to be a focus on enabling Flag States and Port States that lack
the resourcescapacity to enforce the EEDI and the SEEMP in order to further stimulate the adoption
of energy efficiency technologies Also attention should be paid to overcoming the barrier of split
incentives ie where the benefits of energy efficiency measures are not transferred from the charterer
to the investor (owner)
TRANL15371 9
3 Energy Efficiency Measures for Ships
In order to understand the important energy efficiency measures that can help improve energy
efficiency from shipping it is interesting to see the split between new-built ships and existing fleet In
2012 some 3655 merchant ships were delivered worldwide about 6 of the worldrsquos merchant fleet
of about 60000 The average age of the merchant fleet is 19 years Therefore measures for both new
ships and retrofits for old ships are important for improving the energy efficiency in the next decades
If only the new ships would be targeted only 50 of the fleet would be more efficient in the next
decades while there are many retrofit measures available The total fleet can be broken down to about
4000 passenger ships just under 14000 tankers and about 37000 dry cargo ships including about
5000 container ships (Statista 2015)
In order to identify the most interesting energy efficiency measures for ships we used the information
from several reports to develop a long-list Many measures improve the efficiency in the order of up to
5 Here we would like to focus on measures that result in high savings that can be applied to many
ship types and preferably also to existing ships The resulting short-list is presented in the next table
We used the main categories identified by AHEWG-TT for structuring the measures
The main categories defined by AHEWG-TT are
1 Hull
2 Main Engine
3 Auxiliary engines
4 Propellers and rudders and
5 Control systems
Since the auxiliary engines typically consume only a fraction of the energy that goes to the main
engines their energy efficiency measure results do not show in the short-list below The measures are
worked out in more detail in the paragraphs below The main engine and auxiliary engine improvements
are covered in the same paragraph
The common rail upgrade is a simple measure that can be easily applied to all ships even when the
ship is not in the dry-dock The details are available in the paragraph about engines
From the list it is clear that conventional technology is available to achieve high efficiency gains If the
maximum gain per category is added up (for all but ferry and cruise) this would mean a total efficiency
improvement of 35 even without taking two experimental technologies with potentially high efficiency
gains into account (wind power and air lubrication) Note that some technologies are not applicable to
all ships
In order to find possible financial barriers the investments are rated from ldquovery lowrdquo to ldquohighrdquo relatively
to the size of the ships The same measure on a larger ship is obviously more expensive
TRANL15371 1
Table 1 Inventoryranking of energy efficiency measures
Main category
Measure Estimated efficiency (range)
Efficiency at average circumstances
Ease of installation
Payback time
Investment Implementation References
Hull Bow optimisation
25-20 10 all ship types
short (lt3 years)
Medium conventional technology
(IMO 2009 IMO 2011 Crist 2009 Hochkirch und Bertram not dated)
Main Engines
Wind power 5-44 20 only special ship types
long (gt15 years)
High experimental technology
(IMO 2011 IMO 2009 Crist 2009 ICCT 2011 Brannigan et al 2009 Allenstroumlm 2013)
Propellers and Rudders
Ducted propeller
1-20 10
all ship types except ferry and cruises
medium (4-15 years)
Medium conventional technology
(IMO 2011 IMO 2009 Crist 2009 ICCT 2011)
Propellers and Rudders
Contra-rotating propellers
6-20 13 only special ship types
long (gt15 years)
High conventional technology
(IMO 2011 IMO 2009 Crist 2009 WAumlRTSILAuml 2009 Shuto 2010)
Propellers and Rudders
Wheels 10 10
all ship types except ferry and cruises
short (lt3 years)
Medium conventional technology
(IMO 2009 Schneekluth und Bertram 1998 Brannigan et al 2009)
Control Systems
Waste heat recovery
6-10 8 new build only
medium (4-15 years)
Medium conventional technology
(IMO 2011 IMO 2009 Crist 2009 WAumlRTSILAuml 2007 ICCT 2011)
Propellers and Rudders
Rudder bulb 2-5 4
all ship types except ferry and cruises
medium (4-15 years)
Low conventional technology
(IMO 2011 IMO 2009 Nielsen et al not dated Crist 2009 ICCT 2011)
Propellers and Rudders
Post swirl fins
2-5 4
all ship types except ferry and cruises
short (lt3 years)
Low conventional technology
(IMO 2009 MOL 2011 Hansen Dinham-
Peren und Nojiri 2011 Nielsen et al not
dated)
Hull Hull coating 1-9 5 all ship types
short (lt3 years)
Low conventional technology
(IMO 2011 IMO 2009 ICCT 2011 Voorham 2013 Crist 2009)
Hull Air lubrication
5-15 9 new build only
medium (4-15 years)
Medium experimental technology
(IMO 2011 IMO 2009 Crist 2009 DK Group 2015 CNSS 2015 ICCT 2011)
Propellers and Rudders
Twisted rudder
2-4 3
all ship types except ferry and cruises
medium (4-15 years)
Low conventional technology
(IMO 2009 Schulze 2007 Nakashima 2015 Becker Marine System 2015 Nielsen et al not dated Hollenbach und Friesch not dated Rolls-Royce 2014)
Main Engines
Main engine de-rating
2-4 3
all ship types except ferry and cruises
medium (4-15 years)
Low conventional technology
(IMO 2011 IMO 2009 Crist 2009 Wettstein und Brown 2008 DNV GL 2015)
Auxiliary engines
Common rail upgrade
- - all ship types
medium (4-15 years)
Very Low conventional technology
(DNV GL 2015) (ICCT 2011) (IMO 2009)
Main Engines
Common rail upgrade
01-05-
03 all ship types
medium (4-15 years)
Very low conventional technology
(IMO 2009 Pakarinen 2007 ICCT 2011 Crist 2009)
TRANL15371 2
Hull and superstructure
In general the optimisation of hull and superstructure focuses on minimising the resistance by reducing
the wave resistance and friction between water and hull It is important to recognise which type of
vessel is to be optimised The reduced frictional resistance increases energy performance of the vessel
particularly at low speeds Operability and performances of the ship must be considered in detail The
improvements measures are generally applied at new-built ships but also applicable to retrofitting
Bow optimisation
The different bow optimisations can improve the water flow around the hull and reduce the wave-added
resistance for large vessels with high block coefficient operating within commercial speed ranges The
average energy reduction potential ranges from 25-20 on average 10 (Crist 2009 IMO 2011
Voorham 2013)
Figure 3 Left The green line characterises the ordinary bow wave of the hull The blue line characterises the wave
formed by the bulb The red line is the sum of these two The altitude of the bow wave is noticeably reduced which
reduces the hull drag associated with the bow wave This improves fuel economy and increases range (Selenetrawlers
2015) Right Ordinary bulbous bow leadge bow and ax-bow shape (JSEA 2006)
The below-the-waterline extension of the bulbous bow (Figure 3) modifies the way the water flows
around the hull reducing drag and thus increasing speed range fuel efficiency and stability An altered
design is the ax-bow (Figure 3) The narrow designed bow slashes through the water in order to reduce
slamming and reduces the size of bow generated wave The propeller can act more efficient due to the
absence of slamming The ax-bow allows the ship to steer well to maintain speed and the engine to
save fuel (Crist 2009 IMO 2009) If the bulbous bow is modified during a regular docking period the
investment is estimated to have short payback of about 1-3 years It is most promising for container
vessels (DNV GL 2015 Hochkirch und Bertram not dated)
Barriers The bow optimisation (as retrofit) needs to be done in the dry dock Dry-docking is not
regularly happening for existing ships because it means that the ship cannot operate and economic
losses are suspected Another obstacle might arise due to restricted access to the original contractual
hull plans since shipyards are not always keen to provide detailed plans on their vessels to prevent
TRANL15371 3
imitation (Hochkirch und Bertram not dated DNV GL 2015) A major obstacle is the split incentive
between ship owner and operator Ship owners are responsible for investing in these technologies and
ship operators are those who pay for the fuel consumption and benefit from such technologies (ICCT
2011)
Technical maturity The technique is available on the market and is effective Only conventional
material is needed and redesign can be done in a few weeks16
Applicability Applicable to all ship types but most efficient for ships with a high block coefficient like
tankers and bulk carriers since the reduction of the wave-added resistance is most impacting (IMO
2009)
Hull coating
Hull coatings (Figure 4) can lower frictional resistance and limit fouling by aquatic organisms It can
save between 1-9 fuel consumption on average 5 (ICCT 2011 Voorham 2013 Crist 2009)
Figure 4 Example of hull coating (ECOSPEED 2015)
One way of lowering the frictional resistance is to improve the smoothness of a hull by means of
coatings that reduce fouling The costs are lifetime cost reduction and have to be recur every five years
to be able to gain the fuel benefit
Barriers A new application is typically necessary during each dry-docking The self-polishing coating
must be renewed after a 3-5 years period (IMO 2009) A major obstacle is the divided interest between
ship owner and operator Ship owners are in charge for investing in these technologies and ship
operators are those who pay for the fuel consumption and profit from such technologies (ICCT 2011)
Technical maturity Coating techniques are available on the market and roughly 5 of newly painted
ships are painted with one of the advanced coating systems presently available (IMO 2011 ICCT 2011)
The payback time is short (ICCT 2011) or 0-2 years according to others17
Applicability The technology is applicable to all vessels
Air lubrication
The air lubrication technique creates a layer of bubbles underneath an already streamlined hull in order
to further reduce friction An automation system regulates the compressorsblowers depending on
16 httpwwwship-efficiencyorgonTEAMpdf14-Ship20efficiency20seminar20-20CMA20CGM-
20HydrOcean20120CMA20pdf 17 httpswwwdnvglcommaritimeenergy-efficiencyefficiency-finderhtml
TRANL15371 4
speed The blower keeps holes filled with air and required pressure A thin layer of bubbles trailing
behind of each cavity merge into single large ldquoair layerrdquo for the whole flat bottom part of the hull and
reduces the friction (Figure 5) Depending on the ship type the estimate fuel efficiency ranges between
5-15 (on average 9) where tankers and bulkers can reduce more (10-15 on average 125) in
comparison to container vessels (5-9 on average 7) (IMO 2009 DK Group 2015 CNSS 2015 ICCT
2011 Voorham 2013)18
Figure 5 Schematic view of air lubrication (DK Group 2015)
Barriers Large capital investment requirements with split incentive The vessel owners are
accountable for investing in these technologies whereas vessel operators recompense for the fuel
consumption and benefit from such technologies (ICCT 2011)
Technical maturity The technology is available on the market but still in a pilot phase Sea trials
have been performed with small demonstration ships There are no vessels operating commercially
that currently use this technique Specifications about the payback time vary from short to medium
(Silberschmidt 2014 Skinner 2009)
Applicability The original technology would be likely be applied to new-built ships with at least a
partly flat bottom and a minimum length of 225 metres since the compressor may have technical
problems maintaining air cavities for deep draft ships (IMO 2011 CNSS 2015) Air lubrication can be
used for retrofitting as well (CNSS 2015)
Engines
Speed reductions on existing vessels provide opportunities for engine optimisation on low power
(321) Similar measures as de-rating for the main engines that could be implemented are cylinder
cut-out and new torsional vibration calculation (IMO 2009)
18 It has to be noted that the extra fuel use caused by the system itself should also be taken into account
TRANL15371 5
Another propulsion supportive measure with a high potential measure is wind power This is also
explained in more detail below In order to also provide a measure with a lower improvement potential
per ship but simple and applicable to all ships we describe the common rail system for fuel injection
Main engine de-rating
Slow steaming vessels are known as one of the most effective energy saving measure The potential
comes mainly from the operational behaviour side From the technical side the specific fuel oil
consumption will decline when a ship is no longer operated at its design speed
The design speed can be reduced by de-rating the main engine (IMO 2011 IMO 2009) Reduction of
power combined with injection timing advanced to restore peak combustion pressure can achieve a
certain gain in shaft efficiency Fuel efficiency can be improved by 2-4 when de-rating is performed
for loads lower than the maximum design load (Wettstein und Brown 2008 Crist 2009) on average
3 energy efficiency potential (Crist 2009) Operational costs would be lower mainly due to fuel
savings (DNV GL 2015 Crist 2009 Wettstein und Brown 2008)
Barriers A slower vessel will have lower incomes as it is not capable to perform as much transport
load per unit of time as a faster vessel De-rating the engine is usually done when it is clear that the
ship will become a slower steaming ship There is a split incentive between vessel owners who are
responsible for investing in these technologies and vessel operators who are those who compensate
for the fuel consumption and benefit from such technologies (ICCT 2011)
Technical maturity This technique has been proven as successful particularly on older engines
which are normally built with a low compression ratio and thereby have a significant potential to
improve their efficiency (IMO 2009) De-rating measures have a low to medium payback time (Crist
2009 DNV GL 2015)
Applicability The technologies are available on the market It is applicable to all vessels (DNV GL
2015)
Common-rail upgrade (common-rail fuel injection)
Engines with common-rail fuel injection handle low-load working modes much better (IMO 2009) A
common-rail fuel injection is technique of injecting fuel into an engine cylinder under total control and
thereby achieving optimal combustion Common-rail allows the start and duration of injection
independent of the position of the pistons in that way permitting an operationally optimised injection
per stroke In a normal diesel engine fuel is injected at a static rate by a pump and common practice
is to optimise this pump to run at an optimal setting for the ideal injection time (Pakarinen 2007) The
energy efficiency potential is estimated between 01-05 on average 03 (ICCT 2011 IMO 2009)
Barriers Additional electronics can also introduce possibilities for failures However recent
advancements have increased the systems popularity19 There is a split incentive between vessel
19 httpwwwmarineinsightcommarinean-overview-of-common-rail-system-in-marine-engines
TRANL15371 6
owners who are responsible for investing in these technologies and vessel operators who are those
who compensate for the fuel consumption and benefit from such technologies (ICCT 2011)
Technical maturity This measure is available on the market (ICCT 2011) Payback time is short to
medium with an average of 5 years (IMO 2009 Crist 2009)
Applicability This measure is applicable to new and retrofit vessels It is applicable for tanker- bulk-
container- and Roro-ships (Crist 2009)
Auxiliary engines and systems
Based on our own estimation auxiliary engines improvement are not bringing gt2-4 energy savings
because auxiliary engines consume much less fuel than the main engine Similar measures as de-rating
for the main engines and common rail upgrade could be implemented for the auxiliary engine
Other options for improving auxiliary systems are speed control of pumps and fans control strategies
of cooling water systems room ventilation redesign of piping and instruments advanced computation
of airgas temperature distribution with reduced storage ventilation and with optimised ventilation
systems (DNV GL 2015)
Barriers There is a split incentive between vessel owners who are responsible for investing in these
technologies and vessel operators who are those who compensate for the fuel consumption and benefit
from such technologies (ICCT 2011)
Technical maturity This measure is available on the market (ICCT 2011) It is easy to apply and
uncomplicated in maintenance (DNV GL 2015) Payback time is short (DNV GL 2015)
Applicability This measure is applicable to all new and retrofit types of ships (DNV GL 2015)
Wind power
Wind power measures are available that can develop enough thrust to provide at least some supportive
propulsion Wind power can be utilised in various ways in shipping like traditional sails solid wing sails
Flettner-rotor and kits (see Figure 6) The techniques are currently used as supplementary power
(Brannigan et al 2009)
Figure 6 from left to right Kite (Cargill 2011) Flettner rotor (MIWB 2015) and solid sails (Wind Chellenger Project
HP 2015)
Solid wing sails are structured similar to aircraft wings which offer more thrust with less drag than
conventional sails Flettner rotors produce thrust from a rotating object in wind using the so-called
TRANL15371 7
Magnus effect The techniques have different characteristics with regards to how the thrust that is
produced relates to other factors such as wind strength wind angle wind stability and ship speed
(IMO 2009)
Towing kites vary from other concepts of wind power by having a small footprint during installation and
therefore being quite feasible to retrofit (Allenstroumlm 2013) Studies conducted at the Technical
University of Berlin indicated that the potential for sail energy has different prospective in the different
regions in the world Best scenarios exist in North Atlantic and North Pacific regions the South Pacific
seems a bit less potential The studies have shown that under normal circumstances the typical savings
using wind power may be 5 at 15 knots and up to 20 at 10 knots This study also revealed that
with optimal weather routing in the North Atlantic and given the best vessel with best sail type savings
can reach 15 percent at 15 knots and 44 at 10 knots (IMO 2009 Crist 2009) Nevertheless the
above figures should be considered indicative since practical experiences are limited Sail- and kite-
assisted power does seem to be a potential opportunity saving energy in the medium- and long-term
picture for shipping (IMO 2009) Christ estimates and average energy saving potential around 20
(2009)
Barriers There is a split incentive between vessel owners who are responsible for investing in these
technologies and vessel operators who are those who compensate for the fuel consumption and benefit
from such technologies (ICCT 2011) Although this technology can bring high energy savings the
investment is so high that there is not a short payback time
For solid wing sails complications could result in a need for masts to run down to the keel which can
be a bigger issue for retrofitting Additionally the presence of the mast and rigging could have significant
impacts on cargo handling (IMO 2009) Downside of the kite systems include the complex launch
recovery and control systems that are needed (IMO 2009)
Technical maturity This is still considered as experimental technology The technical barriers
identified above need to be tackled for this measure to be applied widely in the future Payback time is
estimated to be medium to long term (Allenstroumlm 2013 Crist 2009)
Applicability Wind power technologies are available and a number of cargo ships have been equipped
with wind engines to reduce demands from diesel engines (ICCT 2011) Kites can be used on ships
with a minimum length of 30m and works most energy efficient on ships with a typical speed not faster
than 16 knots Preferably tankers (crude oil product chemical LPG LNG other) and bulk carriers are
being considered as potential users due to this speed restriction (IMO 2011)
Control Systems Waste heat recovery
Waste heat recovery (WHR) technology can pass exhaust gases from a vessels engines through a heat
exchanger to generate steam for a turbine-driven generator The heat energy from the exhaust gas is
taken and transformed into electrical energy to reduce direct engine-fuel consumption for the
propulsion system or reduce auxiliary engine needs (ICCT 2011) Energy saving potential is estimated
between 6-10 on average 8 (Crist 2009 ICCT 2011)
TRANL15371 8
Figure 7 Efficiency of waste heat recover systems Sankey diagramme Even with high 50 efficiency of modern low-
speed engines there is still 50 of fuel input energy not being put to productive use The possibilities are illustrated
by this comparison of Sankey diagrammes for Waumlrtsilauml 12RT-flex96C engines without heat recovery (left) and with
high-efficiency waste heat recovery plant (right) showing in this case 114 gain in overall efficiency with WHR
(waste heat recovery) (WAumlRTSILAuml 2007)
Barriers Large capital investment requirements (around $5-6 million for a large container ship20) and
split incentive between ship owners and ship operators (ICCT 2011)
Technical maturity The technology is available on the market and has medium to long payback time
(WAumlRTSILAuml 2007 Crist 2009)
Applicability A WHR system is applied to vessels with a high production of waste heat and a high
intake of electricity WHR can be employed on ships with main engine average performance is higher
than 20000 kW and auxiliary engine average performance higher than 1000 kW This size
requirements limit the number of ships using this technology (IMO 2011) Generally it is applicable to
all ships types new and retrofit (Crist 2009)
Propellers and Rudders
Numerous devices have been designed for improving the energy consumption of vessels by recovering
as much as possible of this rotational energy in the flow from the propeller or to provide some pre-or
post-rotation of the in flow into and after the propeller to ensure best efficiency The most important
of these will be discussed in the following paragraphs (IMO 2009)
Ducted propeller (Kort Nozzle)
The accelerating ducted propeller consists of a screw propeller surrounded by a non-rotating duct
(nozzle) (Figure 8) Compared to the conventional propeller of the same diameter and thrust this
20 httpgcaptaincompower-exhaust-gas-paybacks-waste
TRANL15371 9
arrangement allows an increase inflow to the propeller improving the operating conditions around the
propeller and the ideal efficiency
Figure 8 Right photos of this Norwegian trawler (SetSail 2009)
The duct creates additional thrust load The potential for energy savings on relevant vessels range
between 1ndash20 (Crist 2009 IMO 2011 Barringhaus und Olds 1999 IMO 2009) whereupon 10 is a
good average value (IMO 2009 Crist 2009) The improvement of the combination of propeller and duct
overweigh negative effect of the increase water resistance caused by the duct
Barriers Since the duct has an optimal operational speed it does not work efficient at all speeds For
instance as drag increases with increasing speed eventually this will become larger than the added
thrust Therefore at high speeds ducts are typically not used (IMO 2009) The split incentive is a barrier
between ship owners (investor) and ship operators (gainer) as explained earlier (ICCT 2011)
Technical maturity Several standard designs are available on the market (IMO 2011) with a medium
payback time (IMO 2011)
Applicability Ducted propellers suits for vessels operating at high propeller loadings such as tankers
bulk carriers especially tugs and some offshore service ships The duct leads to increased friction but
at higher propeller loadings this is more than rewarded for by the positive effect of the combination of
propeller and duct (IMO 2009)
Contra-rotating propellers (CRP)
A rotating propeller induces a rotating motion in its backwash Normally this rotation energy of the
propeller gets lost The contra-rotating propeller is used in order to recover part of this energy (Figure
9) In a contra-rotating configuration two propellers are facing each other rotating in the opposite
direction with the aft propeller recuperating the turning energy in the wake from the forward propeller
(IMO 2011) To avoid complications with cavitation the aft propeller usually has a smaller diameter
than the front propeller Contra-rotating propeller arrangements involve a short shaft line and for that
reason primarily suitable for vessels with single-screw
TRANL15371 10
Figure 9 Left conventional propeller Right contra-rotating propeller The working principle is simple and effective
the power is split in a forward and aft propeller which through the different direction of rotation cancel out the
rotational energy losses behind the propeller (WAumlRTSILAuml 2009)
Potential savings of such measures are assessed to be in the order of 6ndash20 of the power consumption
with an average of 13 although higher figures may be presented by industry for specific cases Two
different full-scale measurements reported gains of 15 and 16 (IMO 2009 Crist 2009)
Barriers The mechanical installation of contra-rotating shafts is complicated and requires more
maintenance (IMO 2011) The split incentive between ship owners (investor) and ship operators
(gainer) is a barrier as explained above Although this technology can bring high energy savings the
investment is so high that there is not a short payback time
Technical maturity The technique is available on the market but problems with gearboxes for
contra-rotating propellers have been reported as well as operational problems with mounting (IMO
2009 IMO 2011) Payback time is reported as short (WAumlRTSILAuml 2009) but also as medium-long with
about ~15-20 years (Shuto 2010)
Applicability The technology is particularly beneficial for rather heavily loaded propellers as for
example very fast cargo vessels like Ro-Ro ships or for container ships (IMO 2011 Crist 2009) Contra-
rotating propellers need a short shaft line and hence mainly suited to single-screw ships (IMO 2011)
Contra-rotating propellers can be implemented as retrofit but it is more likely implemented in new
built ships due to the complicated mechanical installation (Crist 2009)
Post swirl devises
A number of different techniques belong to the post swirl category Several of them contain
modifications to the rudder or propeller (IMO 2009) Depending on vessel type and operational field
various power saving measures can be mounted to optimise water velocity distribution to the propeller
and to minimise slipstream losses due to swirl in the outflow of a propeller The most important among
these measures may be additional thrusting fins at the rudder twisted rudder (Figure 12) rudder-
bulb-systems with fins (Figure 13) and fins on the propeller fairwater also called post swirl fins or
boss cap fins (Figure 10)
Generally post swirl measures reported 1-8 energy efficiency (test models) Even 8-9 energy
efficiency from full-scale measurements for additional thrusting fins at the rudder Payback time is
estimated to be short to medium post swirl devices (DNV GL 2015 Crist 2009 ICCT 2011) Some of
CRP FOR BETTER PROPULSION EFFICIENCY
CONVENTIONAL PROPULSION
TRANL15371 11
the post swirl measure can be combined A good overview is given in Nielsen et al (Combined Kappel
propeller and rudder bulb system for improved propulsion efficiency not dated)
3431 Post swirl fins
The post swirl fins (Figure 10) can recover energy loss of propeller hub vortex in the propeller backward
flow and can lead to 3-5 energy saving on average 4 operating at the same speed (MOL 2011
Barringhaus und Olds 1999 Hansen Dinham-Peren und Nojiri 2011 ICCT 2011)
Figure 10 Example the post swirl fins or propeller boss cap fins (gcaptain 2012)
Barriers It is simple and straightforward measure requiring only the removal of the propeller boss
caps and replacement with the post swirl fins (no hull modification is needed) (Hansen Dinham-Peren
und Nojiri 2011 MOL 2011) However there is a split incentive between ship owners (investor) and
ship operators (gainer) as explained above
Technical maturity The technique is available on the market In 2013 post swirl fins were applied
to over 2500 ships worldwide (MOL 2011) Further advantages of the post swirl fins are reduction in
propeller torque reduced vibration in the stern and less underwater noise and reduced rudder erosion
(MOL 2011) A payback time of 6 months was estimated for 4 efficiency improvement at $600tonne
oil price (Hansen Dinham-Peren und Nojiri 2011) The investment is considered to be low21
Applicability The technique is effective for all screw propellers irrespective of the type or hull form
of the ship Has been tested on large-scale container vessels (MOL 2011 Hansen Dinham-Peren und
Nojiri 2011)
3432 Free rotating wheels
A vane wheel (Grim wheel) is a freely spinning propeller mounted behind the main smaller propeller
(see Figure 11 for example of use on retrofit Queen Elisabeth II in 1986) The vane wheel has a bigger
diameter than the main propeller and increases the propeller diameter The small propeller drives the
freely revolving vane wheel fitted on the wake The inner part of the vane wheel acts as a turbine and
the outer part as an ldquoadditionalrdquo propeller
21 httpgcaptaincompropeller-technology-ship-efficient
TRANL15371 12
Figure 11 Example for a grim vane wheel (Boat design 2007)
This leads to a substantial recovery of the rotational energy The energy saving potential is reported to
be 10 (Brannigan et al 2009) It is stated that the important benefit of the vane wheel is that a
smaller impulsion propeller can be installed which consumes less energy The vane wheel gives a
suitable energy improvement for cargo ships (IMO 2009 Schneekluth und Bertram 1998) and has short
payback time It is also stated that if there is room for a vane wheel in the aft there is also space for
an impulsion propeller of larger diameter leading about the same energy saving potential as the
combination of a small impulsion propeller and a vane wheel (IMO 2009)
Barriers A barrier is the split incentive between vessel owners who are responsible for investing in
these technologies and vessel operators who are those who compensate for the fuel consumption and
benefit from such technologies
Technical maturity Limited application Vane wheels are subjected to strong fluctuations in loading
Problems with the strength of the blades have been encountered frequently (for example the vane
wheels on the Queen Elisabeth II were short lived and not used after22)The payback time is estimated
to be short
Applicability The technique is effective for all screw propellers irrespective of the type or hull form
of the ship both for new and existing ships (Chen Reed und Kim 1989) Recommended for all ship
types except ferry and cruises because of their problem with strong fluctuations in loading as
mentioned above23 (IMO 2009)
3433 Twisted rudder
Rudders can play a significant role of extra frictional resistance Rudders are located in the backwash
of a propeller and rotational energy will act on the rudder Because of these effects the rudder gives
prospects of efficiency gains (Schulze 2007)
22 httpwwwroblightbodycomlinersqe-21987_Refitindexhtm 23 httpwwwroblightbodycomlinersqe-21987_Refitindexhtm
TRANL15371 13
Figure 12 Schematic capture of twisted rudder (Nakashima 2015)
Twisted leading edge technology provides multiple benefits for high-speed vessels compared to
conventional rudder designs Conventional rudders are located behind the propeller with the rudder
profile arranged symmetrically about the vertical rudder centre plane This arrangement does not
consider the fact that the propeller induces a strong rotational flow that strikes on the rudder blade
This consequences in areas of low force on the blade that induce cavitation and associated erosion
problems (Becker Marine System 2015 Schulze 2007)
The twisted rudder is horizontally twisted on the lower and upper side of the segment that is an
extension of the propeller shaft (Figure 12) This decreases cavitation rudder and improves
manoeuvrability of the vessel (Schulze 2007) Twisted rudder types lead to energy efficiency
improvements by approximately 2-4 on average 3 for large-size high-speed vessels (Hollenbach
und Friesch not dated Nakashima 2015)
Barriers Work needs to be done in the dry dock this is not regularly happening for existing ships
(Hochkirch und Bertram not dated) There is a split incentive between vessel owners who are
responsible for investing in these technologies and vessel operators who are those who compensate
for the fuel consumption and benefit from such technologies (ICCT 2011)
Technical maturity This rudder type is a commercially used technology and easy to apply if the ship
is in the dry dock (ICCT 2011)The payback time is estimated to be short to medium (Rolls-Royce 2014
Crist 2009)
Applicability Twisted rudder can used by container vessels reefers Ro-Pax ferries cruise ships and
naval vessels In South Korea this type of rudder is recognised as a standard rudder for large-size
high-speed container carriers (Nakashima 2015)
TRANL15371 14
3434 Rudder bulb
Figure 13 Example for a rudder bulb Kawasaki RBS-F rudder bulb systems with fins (Kawasaki 2015)
The rudder bulb brings smooth inflows from the propeller and can reduce the drag of the rudder The
rudder fins produce thrusts in the rotational flows generated by the propeller (Figure 13) Rudder bulb
measure can improve energy efficiency by 2-5 (Nielsen et al not dated Becker Marine System not
dated) on average 4 (Crist 2009)
Barriers The work needs to be done in the dry dock this is not regularly happening for existing ships
There is a split incentive between vessel owners who are responsible for investing in these technologies
and vessel operators who are those who compensate for the fuel consumption and benefit from such
technologies (ICCT 2011)
Technical maturity The technology is a commercially used technology and easy to apply while the
ship is in the dry dock (Kawasaki 2015) Payback time is estimated to be medium (Crist 2009)
Applicability For new and retrofit tanker- bulk- container- and Roro-ships with a propeller and
rudder (Crist 2009)
TRANL15371 15
Barriers to the transfer and uptake of energy
efficiency technologies for ships and possible
measures to overcome them
Although there are ways to reduce emissions (Chapter 3) and also drivers working towards the
implementation of such measures there are significant barriers to acting on cost-effective opportunities
in the maritime industry This is often referred to as barriers to energy or the energy efficiency gap
(Michele Acciaro 2013) (Sepideh Jafarzadeh 2014) (OECD 2014) Some barriers are shared with other
industries while others are unique to the maritime industry Furthermore many of these barriers are
not specific to the EEDI and the SEEMP but apply to any rule under MARPOL These barriers can exist
on both the supply and the demand side For example there could be barriers to the development and
implementation of measures that reduce CO2 emissions from ships and barriers to the expression of
demand for these measures (ECORYS 2012) Studies have however shown that there are relatively
few barriers related to the development of new technologies or access to related intellectual property
rights by the main shipbuilding nations and that the supply of measures exceeds the demand (ECORYS
2012) Existing studies on barriers to energy efficiency thus focus on what prevents the uptake of
available measures
This section presents an overview of the main barriers to the transfer and uptake of energy efficiency
technologies in the shipping industry and discusses potential ways of overcoming them
Preliminary assessments of technology transfer and financial needs by both workshop participants and
the IMO Ad Hoc Expert Working Group on Facilitation of Transfer of Technology for Ships (AHEWG-TT)
have suggested that the type of assistance needed by Port State and Flag State administrations will be
of a different nature than that required by shipbuilders and owners Our assessment above has shown
that the shipbuilding industry is expected to need less assistance than Port States and Flag States
In the next table we list a summary of the main barriers and the stakeholders concerned in the main
categories as identified by AHEWG-TT as well as the possible measures that could help overcome these
barriers The possible measures to overcome the barriers are further detailed in the sections below
Related costs are estimated in a separate section in order to minimise overlap
TRANL15371 16
Table 2 Summary of main barriers relevant stakeholders and possible measures to overcome them
Barrier Stakeholders Measures forward
Lack of awareness
(administrative and industry)
a MARPOL in general MARPOL Annex
VI EEDI and SEEMP in particular
b Available energy efficiency
technologies
Flag and Port
States
Ship owners
Capacity building
- Workshops
- Trainings
Model course for training
Inventory
Platform for information access and
sharing
Agreements between industry and
administrations
Technology concerns
a Lack of or limited technology supply
chain in some states
b Lack of technology base for RampD in
some states
c Lack of trust (in ability to reduce
emissions in ability to reduce
operational costs in compatibility
with other measures)
Ship owners
Investors
Increase cooperation in ship design
and building
Increased interaction between
industry and educationalRampD
institutes
Establish platform to share
expertiseexperience
Provide special investment or
guarantee funds
Institutional concerns
a Increased administrative burden
1Revision and amendment of existing legislation
2Implement Port and Flag State obligations
b Limited technical capacity in state institutions to implement
c Lack of financial resources for additional compliance and enforcement activities by maritime administrations
Flag States
Port States
Promote increased cooperation and
communication between
administrationswithin regional
administrations
Regional information workshops for
Port and Flag States
Establish platform to share regulatory
experience
Development aid
Commercial
a Increased costs for ship owners to
take up energy efficient technologies
b Lack of motivation of owners to take
up energy efficient technologies (split
incentive)
Ship owners
Financiers
Special EE funds
Smart contracts
TRANL15371 17
Awareness Raising
Barriers Lack of Awareness
The need to create awareness among Flag States Port States and ship owners of the requirements of
Annex VI in general and Chapter 4 in particular was highlighted by participants of the workshop and
emphasised by the AHEWG-TT The level of awareness in the various regions and even in the countries
within the regions differed considerably The AHEWG-TT further suggests it would be beneficial to
undertake an initial evaluation of knowledge needs (gap analysis) in order to ensure workshops and
other awareness-raising activities are appropriately tailored24
Furthermore ship-owners are not always aware of the energy efficiency technologies available on the
market or which operational measures can be implemented to save fuel Ship owners can be companies
people and investment funds Especially private equity groups tend to focus more on short term looking
for quick profit while traditional ship owners tend to hold the ship for at least 20 years25
Measures forward
Though Flag States and Port States should already have implemented measures to ensure that Energy
Efficiency Design Index (EEDI) and Ship Energy Efficiency Management Plan (SEEMP) requirements are
complied with both public administrations and industry representatives could benefit from additional
trainingcapacity building and platforms to share experiencesreceive information with regards the
practicalities of these regulations and available energy efficiency technologies The needs for each
group can be determined through a gap-analysis which we recommend to be carried out by an
independent consultant in cooperation with the flag and port states Once the specific needs for each
group have been determined they can be addressed through the following awareness raising
measures
Capacity Building (workshops trainings)
Workshopstrainings could be organised where formal training is combined with open discussions where
experiences could be shared just within one stakeholder group or between educational institutes
auditors operational managers of ships shipbuilders and authorities Such trainingsworkshops could
focus on just one or all aspects relating to the applicable rules available energy efficiency measures or
assessment methods of technologies (eg training in calculating and verifying EEDI and SEEMP
including development of tools to calculate EEDI and SEEMP) Trainingsworkshops can be local or
regional Sending people physically to regional workshops is generally more conductive to networking
and experience sharing but less adapted to the local situation and more costly
To reduce the costs of training and ensure a certain level of training the IMO or other qualified
international partners (eg WMU) could develop model courses for training In order to better
understand the rules and regulations in detail people use the help of trainers to better understand the
elements that are important for them and to gain experience in doing calculations and other required
24 Ad Hoc Expert Working Group on Facilitation of Transfer of Technology for Ships 2nd Meeting 25 httpwwwftcomcmss0dadcb240-3d97-11e3-b754-00144feab7dehtmlaxzz3aqC3tmNu
TRANL15371 18
activities by the regulations Trainers have to develop their courses and earn back their investments
via trainings Since the trainers are doing this simultaneous it would be more efficient if there would
be a model course available that can easily be tailored to the audience This would reduce the costs for
the development of trainings and would also ensure that the trainers provide the same level of depth
in their trainings Since the IMO is responsible for the rules and regulations it would be the logical
responsible for the efficient implementation and therefore could take the initiative for developing model
courses
Information Sharing
Inventory of energy-efficiency technologies (for example the IMO-GEF-UNDP project) Many
studies and overviews on the internet are available The quality and the scope is often
different
Improved access to information and information sharing with international recognised
organisations including relevant survey and certification training One example of
establishing information sharing between governments is the work of the OECD Council
Working Party on Shipbuilding (WP6)26 which organises regular workshops aimed at
facilitating the exchange of information on policy and industry developments
Note that many of these measures overlap with the measures required to overcome institutional
barriers as laid out in section 43
Agreements between industry and administrations could be envisaged to overcome the
barriers
In order to enhance the sharing of expertise for both administrations and industry technology transfer
and technology cooperation agreements could be formulated in order to strengthen the cooperation
As identified before the technology transfer to the ship building industry is not a mayor barrier so the
agreements should help the administrations to become more aware of the possibilities to further
promote the implementation of MARPOL Annex VI
Typical agreements between industry and administrations could be in the form of initiatives like the
Sustainable Shipping Initiative (SSI) SSI members have developed a vision for a sustainable shipping
industry in 2040 They commit to working towards this in all their own operations andor activities that
involve shipping and in all their dealings with and support for the shipping industry to make their vision
a global reality by 2040 SSI members of over 19 companies represent ship owners and charterers
shipbuilders engineers and service providers banking insurance and classification societies The SSI
explored for instance how to overcome barriers to the uptake of new technologies and techniques which
improve the operational efficiency of ships potentially delivering energy efficiency savings of 10 or
more and payback periods of less than 5 years They also produce case studies to show good examples
and also develop tools By involving administrations in these kind of initiatives (even free of charge)
they could be actively supported with knowledge about sustainable shipping
26 httpwwwoecdorgstiindworkshopongreengrowthinshipbuildinghtm
TRANL15371 19
Technology Concerns
Barriers Technology Concerns
One of key barriers to the implementation of energy efficient technologies (new and retrofit) relates to
the lack of or limited technology supply chain Furthermore the lack of a technology base for RampD in
some states is a barrier Also the existence of concerns relating to the ability of available energy
efficiency measures to reduce emissions and operational costs and their compatibility with other
measures of energy efficient technologies is a barrier This is typically the problem in very isolated ship
yards
Measures forward
Very successful shipyards (Japan and Korea) have already since many years a large number of
licencing technology transfer and similar agreements and continuously exchange information with
competitors in and outside their countries For instance US shipyards have adopted this methodology
since the 1980s (office of technology assessment 1983)
Further technology sharing could be stimulated through educationalRampD institutes locally regionally
or globally in ship design and building The technology will be transferred to the ship builders once the
students start working there or through cooperation between industry and university In order to
facilitate this we recommend the establishment of partnerships to share expertiseexperience
Typically individuals who know both worlds are the driving force behind successful partnerships (AISBL
2012) These partnerships are built around a shared long term research vision Many partners could
contribute (eg financially) in order to establish the responsible management and research programme
The target of the platform could be for example to provide verified information on real-world energy
efficiency improvements via a monitoring programme
For example in order to stimulate the deployment of energy efficient trucks the Dutch government
provides a website to share audited knowledge and data on about 15 energy efficiency technologies27
Additionally climate financing could be leveraged to reduce the investment risk in unproven
technologies For example IMO Member States could create a demonstration fund that can function as
a guarantee for investments in new and immature technologies28 Similarly investment guarantees
can be provided by funds in the same way governments provide export credits to their companies If
the technology does not deliver the expected fuel-savings the fund can cover the difference and hence
reduce investment uncertainty The main objective being to reduce investment risk
Institutional Concerns
Barriers
27 httpwwwtruckvandetoekomstnl 28 An example of a specific EE fund is httpwwweeefeueligible-investmentshtml
TRANL15371 20
For Flag and Port States complying with new regulations of IMO and EEDI and SEEMP particularly
represent and increased administrative burden It requires revisions and amendments of existing
legislation that need to be implemented at Port and Flag State functions There is currently limited
technical capacity in state institutions to implement these changes especially in developing countries
with a relatively low number of ships under their flag
The lack of financial resources is also a barrier for additional compliance and enforcement activities by
maritime administrations This is particularly an issue for least developed countries and small
developing island states Implementation costs are relatively higher for small Flag States because of
limited abilitycapacity to implement new technical regulations Note that this issue is not specific to
the EEDI and the SEEMP but to most regulatory measures (maritime or other)
Measures forward
Measures to assist states in implementing (existing and new) legislation include
Promote an increased cooperation and communication between administrationswithin
regional administrations of Port and Flag States similarly to what has been suggested in
sections 41 (Awareness raising through capacity building activities such as workshops) and
42 (Establish platform to share regulatory expertiseexperience) Platforms could be
managed by IMO in conjunction with industry and development funds in order to share the
costs as this has been done before for GloBallast for example In that case the IMO is in the
lead (executing agency) but the platform is supporting the collaboration with many
stakeholdersfunding partners The goal of the programme is to assist developing countries
eg via e-learning courses
In addition deterrents need to be put in place to discourage Flag States from performing
substandard inspections A system for detecting sub-standard inspections should be
implemented whereby mandatory Port State Control inspections are carried out in close
proximity to mandatory Flag State inspections (ie the Flag State inspection is carried out
prior to the ship leaving port and the Port State inspection is carried out upon arrival at port)
The two inspections should be carried out under a uniform mandatory checklist The IMO
should monitor inspections and investigate where discrepancies between inspections close in
proximity are detected If a Flag or Port State is found to have failed to meet the requisite
inspection standards penalties in the form of substantial fines should follow
In order to overcome the financial barriers financial assistance to states could help with
capacity building and implementation Financial resources are not only needed in the
implementation of the new regulations (training of government experts) but governments of
Flag States also need to be involved continuously in the ongoing discussion around
developments new EEDI targets for 2020 and beyond which requires continuous availability
of experts to represent the interests of the state (Metselaar 2015) Financial aid can therefore
be supplied in the following forms
Increased financial support for compliance and enforcement activities by maritime
administrations
Financial support could be provided to Flag States so that they have the resources to
properly carry out vessel inspections Consideration should be given to the introduction of
TRANL15371 21
an International Fund Convention set up for this purpose and contributed to by Port
States andor their major oil and other cargo exporters and importers
Commercial
Barriers
Private parties such as ship owners and investors are not always commercially incentivised to make
investments in energy efficiency measures This can be due to the split incentives between owner (who
should make the investment) and charterer (who reaps the cost savings) of a ship (see paragraph 25)
Furthermore access to finance can be problematic for smaller players who operate in niche markets
Measures
Bottlenecks in financing private investments and new financing mechanisms could be addressed during
regional or international workshops that include traditional and new financiers that could finance
investments in energy efficiency technologies
One solution that has been brought forward to address the problem of split incentives is the use of
lsquosmart contractsrsquo (Michele Acciaro 2013) The idea is to change charter contracts in a way that risks
and benefits are shared among charterers and ship owners In such contracts speed choice is more
flexible and the chartering cost of vessels is closer to fuel cost as such ship owners get motivated to
invest in energy-efficient technologies and charterers get stimulated to run vessels in an energy
conserving manner
With respect to the shipbuilding industry the following could facilitate the transfer of technology as
well
Financial assistance to shipyards to be provided at the national level or through other
arrangements
Foreign direct investment in software and hardware as an innovative way to support industry
in implementing the requirements
One type of incentive that governments can provide to enhance industry performance and technology
adoption is a competition for top performers Governments could contribute to a fund from which
money is distributed to the top 10 of best performers in a particular year
Cost estimates
Workshops and training
Capacity building workshops for administrations are estimated at euro 1000 per attendee for an
online workshop (1-2 days) Costs for the organisation of such workshops would include expert fees
and administrative costs These costs could be lower if the course material is already developed
(model workshops) Eg 2 attendees per Flag State for the ten most important Flag States
TRANL15371 22
(covering 74 of total fleet tonnage) comes down to euro 20000 or less in case the courseware is
already existent
A situation that is more conductive to networking and experience sharing is to send people physically
to regional workshops The costs of such workshops including participants travel and hotels for 50
participants would be between euro20000 - euro100000 per workshop based on our international
experience with organising workshops in the field of renewable energy and energy efficiency Costs
could be lower depending on the amount of preparation required cost of location (could be sponsored
by participating states)
Technical training
Trainings already exist for calculating and verifying EEDI including development of tools to calculate
EEDI For example MARIN offers 32h courses over 5 days in the Netherlands for euro 5000 per attendee
(excluding travel and accommodation)29 Lloyds offers similar trainings for similar costs30
Model courses for training may need to be updated depending on identified needs Ecofys estimates
the update of eg an existing EEDI model courses to cost in the order of euro 50000
Online platform for inventory of energy efficiency technologies
Inventories of energy-efficiency technologies already exist (for example in reports like (IMO 2009) and
on websites of for instance DNV-GL the efficiency finder31) but they could be further developed since
the websites are either not independent or incomplete
In order to facilitate information exchange a web-based platform could be established The role of the
platform would be for example to provide verified information on real-world energy efficiency
improvements via a monitoring programme For example in order to stimulate the deployment of
energy efficient trucks the Dutch government provides a website to share audited knowledge and data
on about 15 energy efficiency technologies32 The costs of such a website and corresponding
programme are estimated to be around euro 2 million for a 4 year period Furthermore a platform can be
used to inspire others by showing best practices and can be used for sharing of information regarding
network opportunities like conferences and seminars
Capacity building project
Currently the IMO-GEF-UNDP GloBallast project is a capacity building project it assists developing
countries and their maritime industries in implementing international regulations on ballast water
29 httpwwwmarinnlwebEventsCoursesSpecialist-Course-on-Ship-propulsion-model-tests-and-SpeedPower-trials-for-EEDI-Verifiers-
2731-October-2014htm 30 httpwwwlloydslistcomllsectorship-operationsarticle422262ece 31 httpswwwdnvglcommaritimeenergy-efficiencyefficiency-finderhtml 32 httpwwwtruckvandetoekomstnl
TRANL15371 23
management and preventing risks arising from the transfer of harmful aquatic organisms And has
several aspects that could also be used for knowledge transfer of energy efficiency measures
web-site
e-learning course
databasesdirectories
library collections
newsletter
Regional Task Force (RTFs) to support development and adoption of a regional approach
Develop and implement communication education awareness raising and outreach
programme
Develop introductory and more specialised training packages
Develop model legislations
The total budget for the 2008-2012 period was US$23 million out of which US$564 million represents
a GEF grant the rest being mostly in-kind contributions from the participating countries regional co-
ordinating organisations (RCO) and strategic partners including the private sector
Improved access to information and information sharing with international recognised organisations
including relevant survey and certification training would further promote the different technologies
TRANL15371 24
Conclusions
This study provides an overview of existing technologies which could drastically improve the energy
efficiency of ships Furthermore barriers to transfer and uptake of energy efficient technologies are
analysed and categorised and implications of these barriers are listed in order to facilitate the uptake
of energy efficiency technologies for ships
From this research it is clear that conventional technology is available that can cost-effectively (with a
payback time of less than 15 years) achieve high efficiency gains If the maximum gains per category
are added up (for all but ferry and cruise) this would mean a total efficiency improvement of 35
Even without taking two experimental technologies with potentially high efficiency gains into account
(wind power and air lubrication)
High investments like wind power and contra rotating propellers bring the highest savings (13 ndash 20)
The medium investments are in-between (5-10) and the low investments only bring relatively small
energy efficiency improvements (lt5)
When the ship owner has too few opportunities to share investment with charterers this leads to a split
incentive a ship owner may invest the up-front capital to put in energy-efficient technology but not
receive the benefits This is typically a problem for investments with a high payback time ie the wind
power and contra rotating propellers
The main barriers are related to the transfer of technology to Flag States Flag States are generally
third world and developing nations that often do not have the resources to enforce investigate or
prosecute breaches by their flagged vessels
Several ways to overcome the knowledge transfer barriers were presented that can be categorised as
follows
Workshops and trainings
o Capacity building workshops for administrations
o Regional workshops
Technical training
o Training in calculating and verifying the EEDI
o Development of model courses
Online platform
o Inventory of energy-efficiency technologies
o Creation of a website with all relevant information for the target audience
o Improved access to information and information sharing
o Provide verified information on real-world energy efficiency improvements via a
monitoring programme
TRANL15371 25
The most expensive of the capacity building actions is the capacity building project which takes all
aspects above into account If a project would be developed for knowledge transfer regarding energy
efficiency measures similar to GloBallast which assists developing countries and their maritime
industries in implementing international regulations on ballast water management and preventing risks
arising from the transfer of harmful aquatic organisms the total budget needed would be in the order
of US$23 million for a period of 5 years
TRANL15371 26
References
JFE Group 2013 ldquoJapan Marine Unitedrdquo JFE Group Overview JFE Group AISBL 2012 Making Industry-University partnerships work lessons from succesful collaborations
report Belgium AISBL
Allenstroumlm Bjoumlrn 2013 ldquoWind propulsionrdquo SSPA Sweden AB Gothenburg EffShip March
Aqorau T 2000 Illegal Unreported and Unregulated Fishing Considerations for Developing
Countries paper Honiara Solomon Islands South Pacific Forum Fisheries Agency
BALance 2014 Competitive position and future opportunities of the Euroean Marine Supplies
industry BALance Technology Consulting
Barringhaus David and Robert Olds 1999 OLDS ENGINEERING Maximizing Propulsion Efficiency
Marine Division Accessed Februrar 2015
httpwwwoldscomaumarinemaximizing_propulsion_efficiency
Becker Marine System not dated Becker Bulb Rudders httpwwwbecker-marine-
systemscom05_downloadszzpdfproduct_pdfBecker_Bulb_Rudderspdf Becker Marine
System
mdash 2015 Twisted Full Spade Rudder Accessed Feb 2015 httpbecker-marine-
systemscom03_productsproducts_twisted_full_spadehtml
Bloomberg 2014 China Loses Shipbuilding Crown to South Korea Chart of the Day 9th December
httpwwwbusinessweekcomnews2014-12-09china-loses-shipbuilding-crown-to-south-
korea-chart-of-the-day
Bluebird-Electric 2014 Sipbuilding post World War Two httpwwwbluebird-
electricnetship_boat_design_buildingshipbuilders_ship_repairers_associationhtm
Boat design 2007 Accessed Feb 2015
httpwwwboatdesignnetforumsattachmentspropulsion16743d1193341389-new-
propulsion-sytems-ships-grim-prop-1jpg
Brannigan Paschos Eyers and Wood 2009 Report on International avialtion and Mritime Emissions
in a Copenhagen (post 2012) Agreement Oxfordshire AEA Group
Chen Benjamin Arthur Reed and Ki-Han Kim 1989 A Vane-Wheel Propulsor for a Research and
Development Report Newport David Taylor Research Center
CNSS 2015 Clean North Sea Shipping - Clean Shipping Technology Accessed Februar 2015
httpcleantechcnssnoghg-technologiestechnical-measuresmeasures-related-to-the-hull
Crist Philippe 2009 Greenhouse gas emissions reduction potential from international shipping
Working paper OECD
Daily Times 2015 Nigeria Turkey seek collaboration on ships shipyards 5th January
httpwwwdailytimescomngarticlenigeria-turkey-seek-collaboration-ships-shipyards
Dillingham Gerald L 2000 Progress Made to Reduce Marine Pollution by Cruise Ships but Important
Issues Remain GAO report Washington United States General Accounting Office
DK Group 2015 Silverstream technologies January Accessed January 2015 httpdkgroupeu
DNV 2014 Encouraging Construction and Operation of Green Ships OECD
httpwwwoecdorgstiindC-WP6(2013)12-FINAL-ENGpdf
TRANL15371 27
DNV GL 2015 EFFICIENCY FINDER Accessed Feb 2015 httpwwwdnvglcommaritimeenhance-
performanceefficiency-finderaspx
Ecorys 2012 ldquoGreen growth opportunities in the EU shipbuilding sectorrdquo
ECOSPEED 2015 EUROPEAN MARINE amp MACHINERY AGENCIES LTD Accessed February 2015
httpwwweuropeanmarinecoukECOSPEEDhtm
gcaptain 2012 gcaptain - Propeller Technology to Make Your Ship More Efficient - Accessed Feb
2015 httpgcaptaincompropeller-technology-ship-efficient
Hansen Dinham-Peren and Nojiri 2011 Model and Full Scale Evaluation of a lsquoPropeller Boss Cap
FinsrsquoDevice Fitted to an Aframax Tanker Second International Symposium on Marine
Propulsors smprsquo11 Hamburg Germany June 2011
Hellenic Shipping News 2014 Korean ships sell at fuel-saving premium 22nd December
httpwwwhellenicshippingnewscomkorean-ships-sell-at-fuel-saving-premium
Hindawi 2015 Hindawi Puplishing Cooperation Accessed February 2015
httpwwwhindawicomjournalsijrm2012474785fig4
Hochkirch Karsten and Volker Bertram not dated ldquoSlow Steaming Bulbous Bow Optimization for a
Large Containershiprdquo Accessed Februar 2015 http2021148960resourcepdf5096pdf
Hollenbach Uwe and Juumlrgen Friesch not dated Efficient hull forms ndash What can be gained
Conference ship-efficiency Hamburg 2013 Hamburg HSVA Hamburgische Schiffbau-
Versuchsanstalt GmbH HamburgGermany
ICCT 2011 Reduce Greenhouse Gas Emissions from Ships - Cost Effectiveness of Available options -
white paper Washington DC International Council on Clean transportation (ICCT)
IMO 2011 REDUCTION OF GHG EMISSIONS FROM SHIPS Marginal Abatement Costs and Cost
Effectiveness of Energy-Efficiency Measures Submitted by the Institute of Marine Engineering
Science and Technology (IMarEST) MEPC 62INF7 International Maritime Organisation
IMO 2009 Second IMO GHG Study 2009 London International Maritime Organisation
JSEA 2006 ldquoImproved propulsive performance - Universal applies new energy-saving type Leadge
Bowrdquo Japan Ship Exports Association (JSEA) httpwwwjseaorjpVariableJSea318pdf
Kawasaki 2015 Energy-saving Technology Accessed Feb 2015
httpswwwkhicojpenglishshiptechconservationindexhtml
Leddy Fiona Jayne 2012 ldquoA critical legal analysis of International Shipping in Australian Waters and
the risk of ship-based oil pollutionrdquo Queensland Environmental Practice Reporter vol 17
Marinelog 2014 China white lists 51 shipyards 4 September
httpwwwmarinelogcomindexphpoption=com_k2ampview=itemampid=7667china-white-
lists-51-shipyardsampItemid=231
Metselaar Kees interview by Arno van den Bos 2015 Policy officer at directorate maritime affairs of
ministry of Intrastructure and Environment (February)
Michele Acciaro Peter Nyegaard Hoffmann Magnus Strandmyr Eide 2013 ldquoThe Energy Efficiency
Gap in the Maritime Transportrdquo Journal of Shipping and Ocean Engineering 1-9
MIWB 2015 Maritiem Instituut Willem Barentsz Accessed Feb 2015
httpsmijnmiwbnlnieuwsbriefindexphpdo=showampid_artikel=116
MOL 2011 Energy-Saving Propeller Boss Cap Fins System Reaches Major Milestone - Orders
Received for 2000 Vessels Accessed Feb 2015
httpwwwmolcojpenpr20111145html
TRANL15371 28
Motorship 2014 Gas fuelled ships into the future 31 10 httpwwwmotorshipcomnews101ships-
and-shipyardsgas-fuelled-ships-into-the-future
Nakashima 2015 Nakashima propeller CO LTD Accessed Feb 2015
httpwwwnakashimacojpengproductrudderhtml
Nielsen Shin Lundgren and Faghani not dated Combined Kappel propeller and rudder bulb system
for improved propulsion efficiency Frederikshavn MAN Diesel amp Turbo
OECD 2014 The OECD Council Working Party on Shipbuilding
httpwwwoecdorgindustryindshipbuildinghtm
OECD 2011 ldquoThe Shipbuilding Industry in Turkeyrdquo
office of technology assessment 1983 An Assessment of Maritime Technology and Trade report
Washington DC US Congress
Pakarinen Risto 2007 ldquoNothing common about common railrdquo Twentyfour7 (Twentyfour7) 64-65
Ports amp Ships 2015 Ports and Ships Accessed February 2015
httpportscozanewsarticle_2007_10_17_4038html
Rolls-Royce 2014 Propulsors - Moving your business in the right direction httpwwwrolls-
roycecom~mediaFilesRRolls-Roycedocumentscustomersmarinepropulsion-2014-
tcm92-8664pdf Aalesund Rolls-Royce Commercial Marine httpwwwrolls-
roycecom~mediaFilesRRolls-Roycedocumentscustomersmarinepromaspdf
Schneekluth H and V Bertram 1998 Ship Design for Efficiency and Economy Oxford
Butterworth-Heinemann
Schulze Reinhard 2007 Twisted Rudder - Extreme Design 14 SVA-Forum bdquo Ruder in Theorie und
Praxisldquo Potsdam 7 November 2007 Potsdam Schiffbau-Versuchsanstalt Potsdam GmbH
Selenetrawlers 2015 Selenetrawlers Accessed February 2015
httpwwwselenetrawlerscomcompanydesign-notes
Sepideh Jafarzadeh Ingrid Bouwer Utne 2014 ldquoA framework to bridge the energy efficiency gap in
shippinrdquo Energy 603-612
SetSail 2009 SetSail Accessed February 2015 httpwwwsetsailcomprop-nozzle-comments-by-
an-expert
Shuto Hideki 2010 Super Eco Inland Vessels httpwwwccr-
zkrorgtempwrshp120411Presentations2_04_HShuto_enpdf IHI Marine United Inc
Silberschmidt Noah 2014 ldquoGenerating efficiencies from thin airrdquo SMM Green shipping | Efficiency
httpwwwsilverstream-techcomwp-contentuploads201404HANSA-241112pdf
httpwwwsilverstream-techcomwp-contentuploads201404HANSA-241112pdf
Skinner Ian 2009 EU Tranport GHG Routes to 2050 Technical options for maritime and inland
shipping httpwwweutransportghg2050eucmsassetsTechnical-options-maritime-inland-
waterpdf Brussel European Commission
Statista 2015 ldquoLargest shipbuilding nations in 2013 based on completions in gross tonnagerdquo
httpwwwstatistacomstatistics263895shipbuilding-nations-worldwide-by-cgt
UK DfT 2014 ldquoDfT Port Statistics - World fleet registered trading vessels of 100 gross tons and over
gross tonnage on selected registers 1999-2013rdquo
httpswwwgovukgovernmentcollectionsmaritime-and-shipping-statisticsdata-tables-
associated-with-this-series
TRANL15371 29
Voorham 2013 Assessment of sustainable investment in shipping Master Thesis
Report SDPO13029m Delft 27 th November 2013 Delft Delft University of Technology
WAumlRTSILAuml 2009 ldquoEnergy Evironment Economyrdquo Helsinki Finland WAumlRTSILAuml
mdash 2007 ldquoWaste heat recoveryrdquo Waumlrtsilauml Corporation
Wettstein and Brown 2008 Derating a solution for high fuel savings and lower emissions
Winterthur Waumlrtsilauml Switzerland Ltd
Wind Chellenger Project HP 2015 Wind Chellenger Project HP Accessed Feb 2015 httpwindku-
tokyoacjpindex_enhtml
TRANL15371 30
Appendix I - World fleet registered trading vessels
Table 3 World fleet registered trading vessels of 100 gross tons and over 2009-2013 Source UK DfT 2014
Flag Country 2009 2010 2011 2012 2013
(World Total) 8448 9130 9831 10343 10725
Panama 1886 1979 2084 2158 2172
(European Union) 1900 1979 2074 2051 2106
Liberia 908 1037 1167 1238 1241
Marshall Islands 475 590 711 811 900
Hong Kong 449 553 678 785 854
Singapore 398 434 512 592 677
Malta 348 380 438 450 496
Bahamas 452 469 481 483 485
Greece 388 407 411 411 415
China 282 327 356 388 411
United Kingdom (inc IOM and CI) 258 273 294 300 288
Cyprus 201 205 207 197 203
Japan 138 156 167 178 192
Italy 150 169 181 180 176
Norway 152 145 143 144 145
Germany 152 155 153 137 123
Denmark 107 115 113 113 122
Korea South 120 124 116 111 112
Indonesia 69 82 91 101 111
Bermuda 94 100 106 109 105
Antigua amp Barbuda 100 107 111 106 100
United States of America 107 108 102 99 97
India 83 83 89 85 82
Netherlands 76 61 67 66 69
Turkey 54 58 62 64 59
Malaysia 69 72 71 62 57
France 63 63 64 56 53
Russia 47 49 49 51 52
Philippines 50 51 50 43 43
Cayman Islands 27 29 32 32 31
Taiwan 25 26 27 30 31
Iran 09 08 05 21 31
Thailand 25 26 22 26 29
Sweden 39 35 33 28 27
St Vincent amp the Grenadines 47 42 37 28 24
Canada 24 24 25 24 23
Spain 22 25 26 25 23
Kuwait 23 19 24 24 22
Brazil 20 20 19 19 20
Cambodia 18 17 13 13 12
TRANL15371 31
Appendix II - Most important shipbuilding
countries
China
China is an emerging shipbuilder that overtook South Korea during the 2008-2010 global financial crisis
as they won new orders for medium and small-sized container ships (Bloomberg 2014 Bluebird-Electric
2014)
Figure 14 delivery of vessels from Chinese and South Korean shipyards in million compensated gross tons a measure
of building time and human resources used per ton Source (Bloomberg 2014)
China has more than 1600 shipyards Analysts have predicted that about one third of them will fold
as the industry struggles with overcapacity Last year China laid out a three year plan for industry
restructuring that urged yards to concentrate on building higher quality vessels and local governments
to halt approvals for new projects (Bluebird-Electric 2014)
After two decades of a loan-fuelled boom Chinarsquos shipbuilding industry has become saddled with debt
and overcapacity prompting some private firms to seek financial assistance from the state In
September the government issued a list of 51 shipbuilders it deemed worthy of public support
(Marinelog 2014)
TRANL15371 32
New additions to the white list include subsidiaries of the China State Shipbuilding Corporation (CSSC)
and the China Shipbuilding Industry Corporation (CSIC) and the AVIC Weihai Shipyard owned by the
Aviation Industry Corporation of China (AVIC) (Marinelog 2014)
South Korea
By the end of 2014 it seemed South Korea has overtaken China again as the worlds largest
shipbuilding country with a global market share of about 30(see Figure 14) (Bloomberg 2014)
(Bluebird-Electric 2014) South Korea leads in the production of large vessels such as cruise liners
super tankers LNG carriers drill ships and large container ships
South Koreas shipyards are highly efficient with the worlds largest shipyard in Ulsan operated by
Hyundai Heavy Industries slipping a newly built $80 million vessel into the water every four working
days South Koreas big three shipbuilders Hyundai Heavy Industries Samsung Heavy Industries
and Daewoo Shipbuilding amp Marine Engineering dominate global shipbuilding with STX Shipbuilding
Hyundai Samho Heavy Industries Hanjin Heavy Industries and Sungdong Shipbuilding amp Marine
Engineering also ranking among the top ten shipbuilders in the world In 2007 STX Shipbuilding further
strengthened South Koreas leading position in the industry by acquiring Aker Yards the largest
shipbuilding group in Europe (The former Aker Yards was renamed STX Europe in 2008) In the first
half of 2011 South Korean shipbuilders won new orders to build 25 LNG carriers out of the total 29
orders placed worldwide during the period
To maintain their market position Korean yards also focus more and more on greening opportunities
The Korean government introduced a GHG emission reducing program in 2008 The program is aiming
at reducing GHG emissions throughout all economic sectors including the shipping and shipbuilding
industry Also the Japanese Shipbuilding Association (SAJ) is looking into the possibilities to reduce
GHG emissions so that the shipbuilding industry becomes greener and more competitive (Ecorys
2012)
Japan
Japan had been the dominant ship building country from the 1960s through to the end of 1990s but
gradually lost its competitive advantage to the emerging industry in South Korea which had the
advantages of much cheaper wages strong government backing and a cheaper currency South Korean
production overtook Japans in 2003 and Japanese market share has since fallen sharply
The Philippines
The Philippines has placed fourth among shipbuilding nations around the world producing more than
six million deadweight tonnes of ships built in 2012 The country is anchored by South Korean Hanjin
and Japans Tsuneishi shipbuilders The country has shipyards in Subic and Cebu
TRANL15371 33
Europe
For several decades European shipyards have been facing strong global competition from especially
Asian enterprises (Japanese yards in the 1950s and 60s Koreans from the 1970s and 80s and Chinese
since the 1990s) In Europe this has led to an almost complete exit from the mass production segments
of tankers bulkers and containerships Response of the EU industry has been to focus on the higher
value more complex ship types such as ferries and passenger ships non-cargo vessels and general
cargo ships In addition only limited numbers of vessels of the same type are being built (in contrast
with bulk vessels which are mass produced) Europe has a 77 percent market share in building
passenger vessels (including both cruise ships as well as ferries) and a 17 percent share in the
construction of non-cargo vessels (Ecorys 2012) These segments make up a relatively small share of
the world orderbook (in CGT) However in value they represent a much higher share due to their
relatively sophisticated characteristics The position of the European shipbuilding industry in the
manufacturing of specialised innovative vessels is still strong At the same time European equipment
manufacturers have acquired a leading role in quality products especially in complex high value
equipment components
Figure 15 World orderbook and CESA orderbook by ship type in 2010 (CGT x 1000) (Source Ecorys 2012)
Regarding the marine equipment sector the European industry is renowned for propulsion cargo
handling communication automation environmental and security systems This equipment is not only
destined for complex European-built ships but also exported to Asian yards whether or not requested
by their clients (Ecorys 2012)
Compared to the ship construction sector the marine equipment segment is highly heterogeneous and
consists of companies that are often also active in other business areas (ie automotive or aircraft
industry) A study by (BALance 2014) found that the European marine equipment industryrsquos
TRANL15371 34
competitiveness lies in a strong market position and technological leadership at least for globally active
European marine supply companies who build their position on a strong infrastructure and co-operative
partners skill of their employees and close relationship with their customer base Conversely identified
weaknesses are the cost level in Europe and the heterogeneous structure of the industry with many
SMEs which hinder in some cases attempts to follow the markets by globalisation strategies
Turkey
Shipbuilding in Turkey has evolved from an old traditional activity in Anatolia to an internationally
recognised industry especially since the early 1990s The industry has modern shipyards that can build
ships yachts mega-yachts and sailing boats as well as carrying out extensive repair and conversion
works Turkeyrsquos shipyards are mainly located in the Marmara Region namely Tuzla Yalova and İzmit
which have developed into dynamic shipbuilding centres Also in recent years the emerging Black Sea
and Mediterranean Regions have increasingly attracted shipyard investments
In the last decade in parallel with developments in the global market Turkish shipbuilding experienced
a several-fold increase in its shipbuilding and export capacity including a significant product
diversification According to order books this resulted in Turkey being regularly placed in the top ten
countries on the basis of its deadweight (dwt) production and in the top five countries by the number
of ships
In recent years Turkey has increasingly tapped into niche markets which in turn has led to a growing
participation by Turkish shipyards in the international trade in new ships In parallel there has also
been strong growth in the marine equipment manufacturing sector which could increasingly also tap
the export market These developments reflect in part the strategic location of the yards the
experienced workforce the quality of production and Turkeyrsquos significant role as a political cultural and
economic bridge between Europe and Central Asian and Middle Eastern economies (OECD 2011)
ECOFYS Netherlands BV | Kanaalweg 15G | 3526 KL Utrecht| T +31 (0)30 662-3300 | F +31 (0)30 662-3301 | E infoecofyscom | I wwwecofyscom
ECOFYS Netherlands BV
Kanaalweg 15G
3526 KL Utrecht
T +31 (0) 30 662-3300
F +31 (0) 30 662-3301
E infoecofyscom
I wwwecofyscom
HOW TO OBTAIN EU PUBLICATIONS
Free publications
bull one copy
via EU Bookshop (httpbookshopeuropaeu)
bull more than one copy or postersmaps
from the European Unionrsquos representations (httpeceuropaeurepresent_enhtm)
from the delegations in non-EU countries
(httpeeaseuropaeudelegationsindex_enhtm)
by contacting the Europe Direct service (httpeuropaeueuropedirectindex_enhtm)
or calling 00 800 6 7 8 9 10 11 (freephone number from anywhere in the EU) () () The information given is free as are most calls (though some operators phone boxes or hotels may charge you)
Priced publications
bull via EU Bookshop (httpbookshopeuropaeu)
Priced subscriptions
bull via one of the sales agents of the Publications Office of the European Union
(httppublicationseuropaeuothersagentsindex_enhtm)
doi 102834880780
ML-0
1-1
5-4
39-E
N-N
[Ca
talo
gu
e n
um
be
r]
ECOFYS Netherlands BV | Kanaalweg 15G | 3526 KL Utrecht| T +31 (0)30 662-3300 | F +31 (0)30 662-3301 | E infoecofyscom | I wwwecofyscom
Chamber of Commerce 30161191
From this research it is clear that conventional technology is available to achieve high efficiency gains
It is possible to save 35 of fuel with only a few improvements that require an upfront investment
that can be earned back within 15 years High investments like contra rotating propellers and wind
power (experimental technology) bring the highest savings (13 ndash 20) The medium investments are
in-between (5-10) and the low investments only bring relatively small energy efficiency
improvements (lt5)
When the ship owner has too few opportunities to share investment with charterers this leads to a split
incentive a ship owner may invest the up-front capital to put in energy-efficient technology but not
receive the benefits This is typically a problem for investments with a high payback time ie the wind
power and contra rotating propellers
Several ways to overcome the knowledge transfer barriers were presented that can be categorised as
follows
Workshops and trainings
o Capacity building workshops for administrations
o Regional workshops
Technical training
o Training in calculating and verifying the EEDI
o Development of model courses
Online platform
o Inventory of energy-efficiency technologies
o Creation of a website with all relevant information for the target audience
o Improved access to information and information sharing
o Provide verified information on real-world energy efficiency improvements via a
monitoring programme
This report provides cost estimations for each of these capacity building options The most expensive
being a capacity building project that would take all aspects into account similar to GloBallast which
assists developing countries and their maritime industries in implementing international regulations on
ballast water management and preventing risks arising from the transfer of harmful aquatic organisms
The total budget for GloBallast for the 2008-2012 period was US$23 million
ECOFYS Netherlands BV | Kanaalweg 15G | 3526 KL Utrecht| T +31 (0)30 662-3300 | F +31 (0)30 662-3301 | E infoecofyscom | I wwwecofyscom
Chamber of Commerce 30161191
Reacutesumeacute
En Juillet 2011 lOrganisation Maritime Internationale (OMI) a adopteacute deux mesures defficaciteacute
eacutenergeacutetique qui sont entreacutees en vigueur en 2013 lrsquoIndice de Conception drsquoEfficaciteacute Energeacutetique
(EEDI en anglais) pour les navires neufs et le Plan de Gestion dEfficaciteacute Eacutenergeacutetique (SEEMP en
anglais) pour tous les navires Neacuteanmoins lOMI reconnaicirct la neacutecessiteacute de nouvelles mesures pour
reacuteduire les eacutemissions du transport maritime international compte tenu de la croissance continue de
leacuteconomie mondiale et de la demande de transport correspondante
Lun des principaux obstacles agrave la mise en œuvre des mesures EEDI et du SEEMP est lieacutee au fait que
linspection des navires et lapplication des dispositions sont de la responsabiliteacute des Eacutetats de pavillon
Certains de ces Eacutetats de pavillon ne sont pas signataires de toutes les annexes de la convention
MARPOL ce qui entrave eacutegalement la mise en œuvre des mesures Les Eacutetats de pavillon ougrave la plupart
des navires de commerce sont immatriculeacutes sont souvent des pays en deacuteveloppement Ils ont
souvent moins de ressources pour mener agrave bien les inspections de navires Il faudrait envisager de
transfeacuterer des connaissances agrave ces Eacutetats afin de stimuler davantage ladoption des technologies
defficaciteacute eacutenergeacutetique Les technologies les plus importantes concernant lameacutelioration de lefficaciteacute
sont reacutesumeacutees dans le tableau ci-dessous
Cateacutegorie principale Mesure Rendement en circonstances normales
Faciliteacute drsquoinstallation Retour sur investissement
Investissement
Coque Optimisation de la proue
10 Tous types de navires court (lt3 ans)
Moyen
Moteurs principaux Energie eacuteolienne 20 Uniquement certains types de navires
long (gt15 ans)
Eacuteleveacute
Heacutelices et Gouvernails Tuyegravere Kort 10 Tous types sauf ferry et paquebots
moyen (4-15 ans)
Moyen
Heacutelices et Gouvernails Heacutelice contrarotative
13 Uniquement navires speacuteciaux
long (gt15 ans)
Eacuteleveacute
Heacutelices et Gouvernails Roues agrave Aubes 10 Tous types sauf ferry et paquebots
court (lt3 ans)
Moyen
Systegravemes de controcircle Reacutecupeacuteration de chaleur
8 Uniquement navires neufs
moyen (4-15 ans)
Moyen
Heacutelices et Gouvernails Ampoule de gouvernail
4 Tous types sauf ferry et croisiegravere
moyen (4-15 ans)
Bas
Heacutelices et Gouvernails Ailettes de turbulence
4 Tous types sauf ferry et paquebots
court (lt3 ans)
Bas
Coque Revecirctement de coque
5 Tous types de navires court (lt3 ans)
Bas
Coque Injection drsquoair sous la coque
9 Uniquement navires neufs
moyen (4-15 ans)
Moyen
Heacutelices et Gouvernails Gouvernail tordu 3 Tous types sauf ferry et paquebots
moyen (4-15 ans)
Bas
Moteurs principaux Ralentissement du moteur (de-rating)
3 Tous types sauf ferry et paquebots
moyen (4-15 ans)
Bas
Moteur auxiliaire Modernisation du common rail
- Tous types de navires moyen (4-15 ans)
Tregraves Bas
Moteurs principaux Modernisation du common rail
03 Tous types de navires moyen (4-15 ans)
Tregraves Bas
ECOFYS Netherlands BV | Kanaalweg 15G | 3526 KL Utrecht| T +31 (0)30 662-3300 | F +31 (0)30 662-3301 | E infoecofyscom | I wwwecofyscom
Chamber of Commerce 30161191
Cette recherche montre clairement que des technologies conventionnelles sont disponibles pour
reacutealiser des gains eacuteleveacutes defficaciteacute La mise en œuvre des mesures dont lrsquoinvestissement se
rentabilise en moins de 15 ans permet deacutejagrave deacuteconomiser 35 de carburant Des investissements
eacuteleveacutes comme les heacutelices contrarotatives et leacutenergie eacuteolienne (technologies expeacuterimentales)
permettraient des eacuteconomies drsquoeacutenergies les plus eacuteleveacutees (13-20) Les investissements de taille
moyenne rapportent des eacuteconomies de 5-10 et les investissements les plus faibles apportent
relativement peu drsquoeacuteconomies (lt5)
Lorsque les proprieacutetaires de navires nrsquoont pas la possibiliteacute de partager les investissements avec les
affreacuteteurs cela megravene agrave une discordance des inteacuterecircts un armateur peut investir le capital pour des
technologies deacuteconomie deacutenergie mais nen recevra pas les beacuteneacutefices Ceci est un problegraveme typique
pour les investissements avec un temps de reacutecupeacuteration eacuteleveacute agrave savoir leacutenergie eacuteolienne et les
heacutelices contra rotatives
Plusieurs faccedilons de surmonter les obstacles de transfert de connaissances sont preacutesenteacutees qui
peuvent ecirctre classeacutees de la forme suivante
Ateliers et formations
o Ateliers de renforcement de capaciteacute pour administrations nationales
o Ateliers reacutegionaux
Formations techniques
o Formations dans le calcul et veacuterification de lrsquoEEDI
o Deacuteveloppement de cours standardiseacutes
Plateforme en ligne
o Inventaire de technologies drsquoefficaciteacute eacutenergeacutetique
o Creacuteation de site internet avec informations pertinentes pour le public cible
o Ameacutelioration de lrsquoaccegraves aux informations et partage de connaissances
o Apport drsquoinformations veacuterifieacutees sur les eacuteconomies veacuteritablement reacutealiseacutees agrave travers un
programme de monitoring
Ce rapport fournit des estimations de coucircts pour chacune de ces options de renforcement de
capaciteacutes La plus coucircteuse serait un projet de renforcement des capaciteacutes qui prendrait en compte
tous les aspects semblable au projet GloBallast qui aide les pays en deacuteveloppement et leurs
industries maritimes avec la mise en œuvre des regraveglements internationaux sur la gestion des eaux de
ballast et la preacutevention des risques de transfert dorganismes aquatiques nuisibles Le budget total
pour GloBallast pour la peacuteriode 2008-2012 eacutetait de $ US 23 millions
ECOFYS Netherlands BV | Kanaalweg 15G | 3526 KL Utrecht| T +31 (0)30 662-3300 | F +31 (0)30 662-3301 | E infoecofyscom | I wwwecofyscom
Chamber of Commerce 30161191
Table of contents
1 Introduction 1
2 Relevant Stakeholders 2
Global Shipbuilding Nations 3
Flag States and their role in the implementation of MARPOL 3
Surveys 4
Punishments for failure to comply 5
Role of Port States 6
Cooperation between Port and Flag States 6
Ship owners and charterers 6
Conclusions 7
3 Energy Efficiency Measures for Ships 9
Hull and superstructure 2
Bow optimisation 2
Hull coating 3
Air lubrication 3
Engines 4
Main engine de-rating 5
Common-rail upgrade (common-rail fuel injection) 5
Auxiliary engines and systems 6
Wind power 6
Control Systems Waste heat recovery 7
Propellers and Rudders 8
Ducted propeller (Kort Nozzle) 8
Contra-rotating propellers (CRP) 9
Post swirl devises 10
Barriers to the transfer and uptake of energy efficiency technologies for ships and
possible measures to overcome them 15
Awareness Raising 17
Technology Concerns 19
Institutional Concerns 19
Commercial 21
Cost estimates 21
Workshops and training 21
Technical training 22
Online platform for inventory of energy efficiency technologies 22
Capacity building project 22
ECOFYS Netherlands BV | Kanaalweg 15G | 3526 KL Utrecht| T +31 (0)30 662-3300 | F +31 (0)30 662-3301 | E infoecofyscom | I wwwecofyscom
Chamber of Commerce 30161191
Conclusions 24
References 26
Appendix I - World fleet registered trading vessels 30
Appendix II - Most important shipbuilding countries 31
China 31
South Korea 32
Japan 32
The Philippines 32
Europe 33
Turkey 34
TRANL15371 1
1 Introduction
The negotiations within the International Maritime Organization (IMO) on enhancing the energy
efficiency of and reducing the greenhouse gas emissions from international shipping are a top-priority
for the European Commission in view of the European Unions preference for a global measure to
address greenhouse gas emissions from shipping
In July 2011 the IMO adopted two energy efficiency measures which entered into force in 2013 the
Energy Efficiency Design Index (EEDI) for new ships and the Ship Energy Efficiency Managements Plan
(SEEMP) for all ships1 Nevertheless the IMO recognises the need for further action to reduce emissions
from international shipping in view of the continued expected growth of the world economy and
associated transport demand Consequently the IMO began working on further measures to increase
the energy efficiency of international shipping including the development of a global data collection
system as a first step in April 2014
At the time of the adoption of the EEDI and the SEEMP it was agreed to complement them with a
Resolution on the promotion of technical cooperation and transfer of technology relating to the
improvement of energy efficiency of ships The Resolution was intended to provide a framework for the
promotion and facilitation of capacity building technical cooperation and technology transfer to
support in particular in developing countries the implementation of the EEDI and the SEEMP The
Resolution was adopted in 2013 and an expert group tasked to ensure the Resolutions effective
implementation was established in April 2014
The EU is actively contributing to the work of the IMO Ad Hoc Expert Working Group on Facilitation of
Transfer of Technology for Ships (AHEWG-TT) to ensure effective implementation of the Resolution and
incidentally advance the related IMO negotiations on further measures to increase the energy efficiency
of international shipping
The goal of this project is to contribute to the work of the AHEWG-TT and to further stimulate the
effective implementation of the International Maritime Organization (IMO) Resolution on the promotion
of technical cooperation and transfer of technology2
To achieve this goal this study provides a short overview of relevant stakeholders and existing
technologies which could improve the energy efficiency of ships Furthermore barriers to transfer and
uptake of energy efficient technologies are categorised and analysed and possible measures to
overcome these barriers are being proposed
1 Amendments to MARPOL Annex VI (prevention of air pollution from ships) 2 httpwwwimoorgOurWorkEnvironmentPollutionPreventionAirPollutionPagesTechnical-Co-operationaspx
TRANL15371 2
2 Relevant Stakeholders
The IMO resolution on the promotion of technical cooperation and transfer of technology (regulation
23) is intended to support states which request technical assistance Three main categories of
stakeholders were identified that can be considered of relevance
(1) Shipbuilding nations where the ships are produced
(2) Flag States (where the ships are registered) and Port States who are allowed to inspect foreign
ships compliance to international regulations
(3) Ship owners and ship charterers who are responsible for the design and use of the ships
TRANL15371 3
Global Shipbuilding Nations
Shipbuilding nations typically provide incentives for the shipbuilding industry in their country Therefore
they play a role in the transfer of technologies to their industry
In 2012 some 3655 ships were built worldwide The largest share of the tonnage was built in China
South Korea and Japan (Figure 1)
Figure 1 Ship building in 1000 gross tons Source (Statista 2015) quoting IHS and Shipbuilders Association of
Japan
The worldrsquos leading shipyards include South Korearsquos Hyundai Heavy Industries Japanrsquos Mitsubishi
Heavy Industries and Chinarsquos Shanghai Waigaoqiao (Statista 2015) China South Korea and Japan
together are responsible for building about 90 of the ships in gross tons
Flag States and their role in the implementation of MARPOL
Flag States have the responsibility for enforcing the rules set out under MARPOL Every Flag State has
the duty to ensure that its vessels fully comply with the applicable articles of MARPOL3
3 MARPOL Regulation 6
TRANL15371 4
At the end of 2013 about one-fifth of merchant vessels were registered in Flag State Panama 12 in
Flag State Liberia and 8 in the Flag State Marshall Islands (Figure 2 and (UK DfT 2014)) Therefore
already 40 of the world fleet are registered in these three Flag States
Figure 2 World fleet registered trading vessels of 100 gross tons and over 2009-2013 Source UK DfT 2014
Under MARPOL these parties (Flag States) can enforce ship-owners and operators obligations in three
main ways
- by surveyinspection of vessels to ensure that they meet minimum requirements4
- by monitoring vessel compliance with oil discharge requirements5 (not relevant for energy
efficiency) and
- by implementing punishments for failure to comply with requirements6
Surveys
MARPOL Annex VI contains a set of requirements for survey and issuance of International Air
Pollution Prevention Certificate (IAPP) and regulations regarding
Ozone depleting substances from refrigerating plants and firefighting equipment
Nitrogen Oxides (NOx) from diesel engines
Sulphur Oxides (SOx) from diesel engines
4 MARPOL article 5 5 MARPOL Annex I Chapter 4 Regulation 31 6 MARPOL article 4
TRANL15371 5
Volatile Organic Compound Emissions from cargo tanks of oil tankers
Shipboard Incineration
Fuel oil quality
Flag States must conduct an initial survey before a new ship is put into service and before the IAPP is
issued for the first time a renewal survey at intervals specified by the Administration but not exceeding
five years an intermediate survey within three months before or after the second anniversary date or
within three months before or after the third anniversary date of the certificate an annual survey within
three months before or after each anniversary date of the certificate and after prescribed repairs an
additional survey7
For the EEDI and the SEEMP a new certificate the International Energy Efficiency Certificate (IEEC)
was established and must be kept available on board for inspectionssurveys The IEEC Certificate will
be issued for new build ships upon the initial survey before the ship is put into service and for existing
ships of 400 gross tonnage and above The IEE Certificate will be issued once for each ship and is valid
throughout the lifetime of the ship (except flag change major conversion or ship going out of service)
There are no follow-up surveys on the IEEC Certificate
The IMO has created guidelines for surveys that Flag States should follow The energy efficiency related
one is
2014 Guidelines on survey and certification of the Energy Efficiency Design Index (EEDI)
(resolution MEPC254(67))
A Flag State cannot allow a vessel that does not pass inspection to sail until it complies with MARPOL8
An International Energy Efficiency Certificate in accordance with the provisions of regulation 54 to
any ship of 400 gross tonnage and above is needed before that ship may engage in voyages to ports
or offshore terminals under the jurisdiction of other Parties
Punishments for failure to comply
In case of failure to comply the authority carrying out the inspection may detain the ship Article 7 of
MARPOL ensures that unduly delay or detain will be avoided where possible or compensated
A Flag State is obliged to investigate an incident upon receipt of notification or evidence that one of its
vessels has breached MARPOL If the investigations reveal that a breach has occurred the Flag State
has further obligations to initiate legal proceedings against the vessel and report back to the reporting
state on actions taken9
7 MARPOL Annex VI Chapter 2 Regulation 5 8 MARPOL Annex VI Chapter 2 Regulation 6 9 MARPOL article 6
TRANL15371 6
Also other parties are allowed to inspect vessels under MARPOL Article 6 when violations are detected
or for regular inspections A Party may also inspect a ship to which the present Convention applies
when it enters the ports or off-shore terminals under its jurisdiction if a request for an investigation is
received from any Party together with sufficient evidence that the ship has discharged harmful
substances or effluents containing such substances in any place
Role of Port States
Under ldquoPort State Controlrdquo arrangements Port States also have the authority to conduct vessel surveys
on ships which visit their ports and to detain those ships that fall below MARPOL requirements In
relation to MARPOL Annex VI chapter 4 any port state inspection shall be limited to verifying when
appropriate that there is a valid International Energy Efficiency Certificate on board10
Cooperation between Port and Flag States
Under MARPOL parties are required to co-operate in detecting vessel violations and are required to
use all practical measures to detect and monitor violations If a State has evidence of a violation they
are obligated to forward this evidence to the vesselrsquos Flag State
All ships flagged under countries that are signatories to MARPOL are subject to its requirements
regardless of where they sail and member nations are responsible for vessels registered under their
respective nationalities
When incidents occur outside the countrys jurisdiction or jurisdiction cannot be determined the
country refers cases to Flag States in accordance with MARPOL Some States are not happy with the
lack of response from Flag States United States experience of Flag States not responding has led to
new policy which would take direct enforcement action against vessels for MARPOL V violations
occurring between 3 and 200 nautical miles from the United States rather than referring such violations
to the flag states (Dillingham 2000)
Ship owners and charterers
A ship owner is the owner of a commercial ship A ship owner is someone who equips and exploits a
ship usually for delivering cargo at a certain freight rate The ship owner determines the specifications
of the ship and its energy efficiency measures but the benefits of low fuel consumption are not always
theirs when the ship is chartered to someone else
Depending on the type of ship and the type of charter normally a standard contract form called a
charter party is used to record the exact rate duration and terms agreed between the ship owner and
the charterer
10 MARPOL Annex VI Regulation 10
TRANL15371 7
A charterer may be a party without a cargo who takes a vessel on charter for a specified period from
the owner and then trades the ship to carry cargoes at a profit above the hire rate In some cases a
charterer may own cargo and employ a shipbroker to find a ship to deliver the cargo for a certain price
Two main types of charter can be distinguished time charter and voyage charter In a voyage charter
the owner is still responsible for the port fuel and crew costs In a time charter the charterer selects
the ports and directs the vessel where to go The charterer pays for all fuel the vessel consumes port
charges commissions and a daily hire to the owner of the vessel
When there are too few opportunities to share investment with charterers this leads to a split incentive
a ship owner may invest the up-front capital to put in energy-efficient technology but doesnrsquot then
recoup the costs from fuel savings as they charter their ships out as this goes to the charterers This
problem is particularly apparent for short-term time charters11
Conclusions
Regarding energy efficiency the work of the AHEWG-TT12 has shown that the main shipbuilding nations
all have access to the necessary technologies provided there is demand for them It has also been
noted that there is no need for transfers of intellectual property rights13
One of the major barriers to the effective implementation of the EEDI and the SEEMP is the heavy
reliance it places on Flag States for inspection of vessels and enforcement of provisions During the
1970rsquos ships were being reflagged from high tax and high regulation countries such as the United
States and the United Kingdom to countries offering Flags of Convenience (lsquoFOCrsquo) Under FOCs ship-
owners pay less tax to the relevant Flag State and are able to evade the majority of the environmental
and construction standards set out under MARPOL (Leddy 2012) The main reason for that is that
several Flag States are not signatories to all MARPOL Annexes (eg as of 20142015 the Bahamian
Bolivian Cambodian North Korean Georgian Honduran Lebanese and Sri Lankan flags of
convenience had not ratified all MARPOL treaty annexes III-VI14 15)
Many FOCs are developing nations that do not have the resources to enforce investigate or prosecute
breaches by their flagged vessels (Aqorau 2000) As of 2014 55 of merchant ships are flagged by
FOC and 40 of ships are flagged by FOCdeveloping countries MARPOL only provides guidelines for
Flag States to follow when surveying vessels under regulation 6 but none of these guidelines are
mandatory Conversely Port States which are developed are better equipped to bear the cost of
inspection investigation enforcement and prosecution costs However in relation to EEDI and the
11 httpssi2040orgwhat-we-dowork-streamsfinance 12 MEPC 6831 Progress report of the Ad Hoc Expert Working Group on Facilitation of Transfer of Technology for Ships 13 Submission of the United States on Task 3 of the Ad Hoc Expert Working Group on Facilitation of Transfer of Technology for Ships Jan
2015 14 wwwics-shippingorgdocsflag-state-performance-table 15 httpwwwimoorgAboutConventionsStatusOfConventionsPagesDefaultaspx status of conventions
TRANL15371 8
SEEMP port state control is limited to verifying when appropriate that there is a valid International
Energy Efficiency Certificate on board
We therefore conclude that there needs to be a focus on enabling Flag States and Port States that lack
the resourcescapacity to enforce the EEDI and the SEEMP in order to further stimulate the adoption
of energy efficiency technologies Also attention should be paid to overcoming the barrier of split
incentives ie where the benefits of energy efficiency measures are not transferred from the charterer
to the investor (owner)
TRANL15371 9
3 Energy Efficiency Measures for Ships
In order to understand the important energy efficiency measures that can help improve energy
efficiency from shipping it is interesting to see the split between new-built ships and existing fleet In
2012 some 3655 merchant ships were delivered worldwide about 6 of the worldrsquos merchant fleet
of about 60000 The average age of the merchant fleet is 19 years Therefore measures for both new
ships and retrofits for old ships are important for improving the energy efficiency in the next decades
If only the new ships would be targeted only 50 of the fleet would be more efficient in the next
decades while there are many retrofit measures available The total fleet can be broken down to about
4000 passenger ships just under 14000 tankers and about 37000 dry cargo ships including about
5000 container ships (Statista 2015)
In order to identify the most interesting energy efficiency measures for ships we used the information
from several reports to develop a long-list Many measures improve the efficiency in the order of up to
5 Here we would like to focus on measures that result in high savings that can be applied to many
ship types and preferably also to existing ships The resulting short-list is presented in the next table
We used the main categories identified by AHEWG-TT for structuring the measures
The main categories defined by AHEWG-TT are
1 Hull
2 Main Engine
3 Auxiliary engines
4 Propellers and rudders and
5 Control systems
Since the auxiliary engines typically consume only a fraction of the energy that goes to the main
engines their energy efficiency measure results do not show in the short-list below The measures are
worked out in more detail in the paragraphs below The main engine and auxiliary engine improvements
are covered in the same paragraph
The common rail upgrade is a simple measure that can be easily applied to all ships even when the
ship is not in the dry-dock The details are available in the paragraph about engines
From the list it is clear that conventional technology is available to achieve high efficiency gains If the
maximum gain per category is added up (for all but ferry and cruise) this would mean a total efficiency
improvement of 35 even without taking two experimental technologies with potentially high efficiency
gains into account (wind power and air lubrication) Note that some technologies are not applicable to
all ships
In order to find possible financial barriers the investments are rated from ldquovery lowrdquo to ldquohighrdquo relatively
to the size of the ships The same measure on a larger ship is obviously more expensive
TRANL15371 1
Table 1 Inventoryranking of energy efficiency measures
Main category
Measure Estimated efficiency (range)
Efficiency at average circumstances
Ease of installation
Payback time
Investment Implementation References
Hull Bow optimisation
25-20 10 all ship types
short (lt3 years)
Medium conventional technology
(IMO 2009 IMO 2011 Crist 2009 Hochkirch und Bertram not dated)
Main Engines
Wind power 5-44 20 only special ship types
long (gt15 years)
High experimental technology
(IMO 2011 IMO 2009 Crist 2009 ICCT 2011 Brannigan et al 2009 Allenstroumlm 2013)
Propellers and Rudders
Ducted propeller
1-20 10
all ship types except ferry and cruises
medium (4-15 years)
Medium conventional technology
(IMO 2011 IMO 2009 Crist 2009 ICCT 2011)
Propellers and Rudders
Contra-rotating propellers
6-20 13 only special ship types
long (gt15 years)
High conventional technology
(IMO 2011 IMO 2009 Crist 2009 WAumlRTSILAuml 2009 Shuto 2010)
Propellers and Rudders
Wheels 10 10
all ship types except ferry and cruises
short (lt3 years)
Medium conventional technology
(IMO 2009 Schneekluth und Bertram 1998 Brannigan et al 2009)
Control Systems
Waste heat recovery
6-10 8 new build only
medium (4-15 years)
Medium conventional technology
(IMO 2011 IMO 2009 Crist 2009 WAumlRTSILAuml 2007 ICCT 2011)
Propellers and Rudders
Rudder bulb 2-5 4
all ship types except ferry and cruises
medium (4-15 years)
Low conventional technology
(IMO 2011 IMO 2009 Nielsen et al not dated Crist 2009 ICCT 2011)
Propellers and Rudders
Post swirl fins
2-5 4
all ship types except ferry and cruises
short (lt3 years)
Low conventional technology
(IMO 2009 MOL 2011 Hansen Dinham-
Peren und Nojiri 2011 Nielsen et al not
dated)
Hull Hull coating 1-9 5 all ship types
short (lt3 years)
Low conventional technology
(IMO 2011 IMO 2009 ICCT 2011 Voorham 2013 Crist 2009)
Hull Air lubrication
5-15 9 new build only
medium (4-15 years)
Medium experimental technology
(IMO 2011 IMO 2009 Crist 2009 DK Group 2015 CNSS 2015 ICCT 2011)
Propellers and Rudders
Twisted rudder
2-4 3
all ship types except ferry and cruises
medium (4-15 years)
Low conventional technology
(IMO 2009 Schulze 2007 Nakashima 2015 Becker Marine System 2015 Nielsen et al not dated Hollenbach und Friesch not dated Rolls-Royce 2014)
Main Engines
Main engine de-rating
2-4 3
all ship types except ferry and cruises
medium (4-15 years)
Low conventional technology
(IMO 2011 IMO 2009 Crist 2009 Wettstein und Brown 2008 DNV GL 2015)
Auxiliary engines
Common rail upgrade
- - all ship types
medium (4-15 years)
Very Low conventional technology
(DNV GL 2015) (ICCT 2011) (IMO 2009)
Main Engines
Common rail upgrade
01-05-
03 all ship types
medium (4-15 years)
Very low conventional technology
(IMO 2009 Pakarinen 2007 ICCT 2011 Crist 2009)
TRANL15371 2
Hull and superstructure
In general the optimisation of hull and superstructure focuses on minimising the resistance by reducing
the wave resistance and friction between water and hull It is important to recognise which type of
vessel is to be optimised The reduced frictional resistance increases energy performance of the vessel
particularly at low speeds Operability and performances of the ship must be considered in detail The
improvements measures are generally applied at new-built ships but also applicable to retrofitting
Bow optimisation
The different bow optimisations can improve the water flow around the hull and reduce the wave-added
resistance for large vessels with high block coefficient operating within commercial speed ranges The
average energy reduction potential ranges from 25-20 on average 10 (Crist 2009 IMO 2011
Voorham 2013)
Figure 3 Left The green line characterises the ordinary bow wave of the hull The blue line characterises the wave
formed by the bulb The red line is the sum of these two The altitude of the bow wave is noticeably reduced which
reduces the hull drag associated with the bow wave This improves fuel economy and increases range (Selenetrawlers
2015) Right Ordinary bulbous bow leadge bow and ax-bow shape (JSEA 2006)
The below-the-waterline extension of the bulbous bow (Figure 3) modifies the way the water flows
around the hull reducing drag and thus increasing speed range fuel efficiency and stability An altered
design is the ax-bow (Figure 3) The narrow designed bow slashes through the water in order to reduce
slamming and reduces the size of bow generated wave The propeller can act more efficient due to the
absence of slamming The ax-bow allows the ship to steer well to maintain speed and the engine to
save fuel (Crist 2009 IMO 2009) If the bulbous bow is modified during a regular docking period the
investment is estimated to have short payback of about 1-3 years It is most promising for container
vessels (DNV GL 2015 Hochkirch und Bertram not dated)
Barriers The bow optimisation (as retrofit) needs to be done in the dry dock Dry-docking is not
regularly happening for existing ships because it means that the ship cannot operate and economic
losses are suspected Another obstacle might arise due to restricted access to the original contractual
hull plans since shipyards are not always keen to provide detailed plans on their vessels to prevent
TRANL15371 3
imitation (Hochkirch und Bertram not dated DNV GL 2015) A major obstacle is the split incentive
between ship owner and operator Ship owners are responsible for investing in these technologies and
ship operators are those who pay for the fuel consumption and benefit from such technologies (ICCT
2011)
Technical maturity The technique is available on the market and is effective Only conventional
material is needed and redesign can be done in a few weeks16
Applicability Applicable to all ship types but most efficient for ships with a high block coefficient like
tankers and bulk carriers since the reduction of the wave-added resistance is most impacting (IMO
2009)
Hull coating
Hull coatings (Figure 4) can lower frictional resistance and limit fouling by aquatic organisms It can
save between 1-9 fuel consumption on average 5 (ICCT 2011 Voorham 2013 Crist 2009)
Figure 4 Example of hull coating (ECOSPEED 2015)
One way of lowering the frictional resistance is to improve the smoothness of a hull by means of
coatings that reduce fouling The costs are lifetime cost reduction and have to be recur every five years
to be able to gain the fuel benefit
Barriers A new application is typically necessary during each dry-docking The self-polishing coating
must be renewed after a 3-5 years period (IMO 2009) A major obstacle is the divided interest between
ship owner and operator Ship owners are in charge for investing in these technologies and ship
operators are those who pay for the fuel consumption and profit from such technologies (ICCT 2011)
Technical maturity Coating techniques are available on the market and roughly 5 of newly painted
ships are painted with one of the advanced coating systems presently available (IMO 2011 ICCT 2011)
The payback time is short (ICCT 2011) or 0-2 years according to others17
Applicability The technology is applicable to all vessels
Air lubrication
The air lubrication technique creates a layer of bubbles underneath an already streamlined hull in order
to further reduce friction An automation system regulates the compressorsblowers depending on
16 httpwwwship-efficiencyorgonTEAMpdf14-Ship20efficiency20seminar20-20CMA20CGM-
20HydrOcean20120CMA20pdf 17 httpswwwdnvglcommaritimeenergy-efficiencyefficiency-finderhtml
TRANL15371 4
speed The blower keeps holes filled with air and required pressure A thin layer of bubbles trailing
behind of each cavity merge into single large ldquoair layerrdquo for the whole flat bottom part of the hull and
reduces the friction (Figure 5) Depending on the ship type the estimate fuel efficiency ranges between
5-15 (on average 9) where tankers and bulkers can reduce more (10-15 on average 125) in
comparison to container vessels (5-9 on average 7) (IMO 2009 DK Group 2015 CNSS 2015 ICCT
2011 Voorham 2013)18
Figure 5 Schematic view of air lubrication (DK Group 2015)
Barriers Large capital investment requirements with split incentive The vessel owners are
accountable for investing in these technologies whereas vessel operators recompense for the fuel
consumption and benefit from such technologies (ICCT 2011)
Technical maturity The technology is available on the market but still in a pilot phase Sea trials
have been performed with small demonstration ships There are no vessels operating commercially
that currently use this technique Specifications about the payback time vary from short to medium
(Silberschmidt 2014 Skinner 2009)
Applicability The original technology would be likely be applied to new-built ships with at least a
partly flat bottom and a minimum length of 225 metres since the compressor may have technical
problems maintaining air cavities for deep draft ships (IMO 2011 CNSS 2015) Air lubrication can be
used for retrofitting as well (CNSS 2015)
Engines
Speed reductions on existing vessels provide opportunities for engine optimisation on low power
(321) Similar measures as de-rating for the main engines that could be implemented are cylinder
cut-out and new torsional vibration calculation (IMO 2009)
18 It has to be noted that the extra fuel use caused by the system itself should also be taken into account
TRANL15371 5
Another propulsion supportive measure with a high potential measure is wind power This is also
explained in more detail below In order to also provide a measure with a lower improvement potential
per ship but simple and applicable to all ships we describe the common rail system for fuel injection
Main engine de-rating
Slow steaming vessels are known as one of the most effective energy saving measure The potential
comes mainly from the operational behaviour side From the technical side the specific fuel oil
consumption will decline when a ship is no longer operated at its design speed
The design speed can be reduced by de-rating the main engine (IMO 2011 IMO 2009) Reduction of
power combined with injection timing advanced to restore peak combustion pressure can achieve a
certain gain in shaft efficiency Fuel efficiency can be improved by 2-4 when de-rating is performed
for loads lower than the maximum design load (Wettstein und Brown 2008 Crist 2009) on average
3 energy efficiency potential (Crist 2009) Operational costs would be lower mainly due to fuel
savings (DNV GL 2015 Crist 2009 Wettstein und Brown 2008)
Barriers A slower vessel will have lower incomes as it is not capable to perform as much transport
load per unit of time as a faster vessel De-rating the engine is usually done when it is clear that the
ship will become a slower steaming ship There is a split incentive between vessel owners who are
responsible for investing in these technologies and vessel operators who are those who compensate
for the fuel consumption and benefit from such technologies (ICCT 2011)
Technical maturity This technique has been proven as successful particularly on older engines
which are normally built with a low compression ratio and thereby have a significant potential to
improve their efficiency (IMO 2009) De-rating measures have a low to medium payback time (Crist
2009 DNV GL 2015)
Applicability The technologies are available on the market It is applicable to all vessels (DNV GL
2015)
Common-rail upgrade (common-rail fuel injection)
Engines with common-rail fuel injection handle low-load working modes much better (IMO 2009) A
common-rail fuel injection is technique of injecting fuel into an engine cylinder under total control and
thereby achieving optimal combustion Common-rail allows the start and duration of injection
independent of the position of the pistons in that way permitting an operationally optimised injection
per stroke In a normal diesel engine fuel is injected at a static rate by a pump and common practice
is to optimise this pump to run at an optimal setting for the ideal injection time (Pakarinen 2007) The
energy efficiency potential is estimated between 01-05 on average 03 (ICCT 2011 IMO 2009)
Barriers Additional electronics can also introduce possibilities for failures However recent
advancements have increased the systems popularity19 There is a split incentive between vessel
19 httpwwwmarineinsightcommarinean-overview-of-common-rail-system-in-marine-engines
TRANL15371 6
owners who are responsible for investing in these technologies and vessel operators who are those
who compensate for the fuel consumption and benefit from such technologies (ICCT 2011)
Technical maturity This measure is available on the market (ICCT 2011) Payback time is short to
medium with an average of 5 years (IMO 2009 Crist 2009)
Applicability This measure is applicable to new and retrofit vessels It is applicable for tanker- bulk-
container- and Roro-ships (Crist 2009)
Auxiliary engines and systems
Based on our own estimation auxiliary engines improvement are not bringing gt2-4 energy savings
because auxiliary engines consume much less fuel than the main engine Similar measures as de-rating
for the main engines and common rail upgrade could be implemented for the auxiliary engine
Other options for improving auxiliary systems are speed control of pumps and fans control strategies
of cooling water systems room ventilation redesign of piping and instruments advanced computation
of airgas temperature distribution with reduced storage ventilation and with optimised ventilation
systems (DNV GL 2015)
Barriers There is a split incentive between vessel owners who are responsible for investing in these
technologies and vessel operators who are those who compensate for the fuel consumption and benefit
from such technologies (ICCT 2011)
Technical maturity This measure is available on the market (ICCT 2011) It is easy to apply and
uncomplicated in maintenance (DNV GL 2015) Payback time is short (DNV GL 2015)
Applicability This measure is applicable to all new and retrofit types of ships (DNV GL 2015)
Wind power
Wind power measures are available that can develop enough thrust to provide at least some supportive
propulsion Wind power can be utilised in various ways in shipping like traditional sails solid wing sails
Flettner-rotor and kits (see Figure 6) The techniques are currently used as supplementary power
(Brannigan et al 2009)
Figure 6 from left to right Kite (Cargill 2011) Flettner rotor (MIWB 2015) and solid sails (Wind Chellenger Project
HP 2015)
Solid wing sails are structured similar to aircraft wings which offer more thrust with less drag than
conventional sails Flettner rotors produce thrust from a rotating object in wind using the so-called
TRANL15371 7
Magnus effect The techniques have different characteristics with regards to how the thrust that is
produced relates to other factors such as wind strength wind angle wind stability and ship speed
(IMO 2009)
Towing kites vary from other concepts of wind power by having a small footprint during installation and
therefore being quite feasible to retrofit (Allenstroumlm 2013) Studies conducted at the Technical
University of Berlin indicated that the potential for sail energy has different prospective in the different
regions in the world Best scenarios exist in North Atlantic and North Pacific regions the South Pacific
seems a bit less potential The studies have shown that under normal circumstances the typical savings
using wind power may be 5 at 15 knots and up to 20 at 10 knots This study also revealed that
with optimal weather routing in the North Atlantic and given the best vessel with best sail type savings
can reach 15 percent at 15 knots and 44 at 10 knots (IMO 2009 Crist 2009) Nevertheless the
above figures should be considered indicative since practical experiences are limited Sail- and kite-
assisted power does seem to be a potential opportunity saving energy in the medium- and long-term
picture for shipping (IMO 2009) Christ estimates and average energy saving potential around 20
(2009)
Barriers There is a split incentive between vessel owners who are responsible for investing in these
technologies and vessel operators who are those who compensate for the fuel consumption and benefit
from such technologies (ICCT 2011) Although this technology can bring high energy savings the
investment is so high that there is not a short payback time
For solid wing sails complications could result in a need for masts to run down to the keel which can
be a bigger issue for retrofitting Additionally the presence of the mast and rigging could have significant
impacts on cargo handling (IMO 2009) Downside of the kite systems include the complex launch
recovery and control systems that are needed (IMO 2009)
Technical maturity This is still considered as experimental technology The technical barriers
identified above need to be tackled for this measure to be applied widely in the future Payback time is
estimated to be medium to long term (Allenstroumlm 2013 Crist 2009)
Applicability Wind power technologies are available and a number of cargo ships have been equipped
with wind engines to reduce demands from diesel engines (ICCT 2011) Kites can be used on ships
with a minimum length of 30m and works most energy efficient on ships with a typical speed not faster
than 16 knots Preferably tankers (crude oil product chemical LPG LNG other) and bulk carriers are
being considered as potential users due to this speed restriction (IMO 2011)
Control Systems Waste heat recovery
Waste heat recovery (WHR) technology can pass exhaust gases from a vessels engines through a heat
exchanger to generate steam for a turbine-driven generator The heat energy from the exhaust gas is
taken and transformed into electrical energy to reduce direct engine-fuel consumption for the
propulsion system or reduce auxiliary engine needs (ICCT 2011) Energy saving potential is estimated
between 6-10 on average 8 (Crist 2009 ICCT 2011)
TRANL15371 8
Figure 7 Efficiency of waste heat recover systems Sankey diagramme Even with high 50 efficiency of modern low-
speed engines there is still 50 of fuel input energy not being put to productive use The possibilities are illustrated
by this comparison of Sankey diagrammes for Waumlrtsilauml 12RT-flex96C engines without heat recovery (left) and with
high-efficiency waste heat recovery plant (right) showing in this case 114 gain in overall efficiency with WHR
(waste heat recovery) (WAumlRTSILAuml 2007)
Barriers Large capital investment requirements (around $5-6 million for a large container ship20) and
split incentive between ship owners and ship operators (ICCT 2011)
Technical maturity The technology is available on the market and has medium to long payback time
(WAumlRTSILAuml 2007 Crist 2009)
Applicability A WHR system is applied to vessels with a high production of waste heat and a high
intake of electricity WHR can be employed on ships with main engine average performance is higher
than 20000 kW and auxiliary engine average performance higher than 1000 kW This size
requirements limit the number of ships using this technology (IMO 2011) Generally it is applicable to
all ships types new and retrofit (Crist 2009)
Propellers and Rudders
Numerous devices have been designed for improving the energy consumption of vessels by recovering
as much as possible of this rotational energy in the flow from the propeller or to provide some pre-or
post-rotation of the in flow into and after the propeller to ensure best efficiency The most important
of these will be discussed in the following paragraphs (IMO 2009)
Ducted propeller (Kort Nozzle)
The accelerating ducted propeller consists of a screw propeller surrounded by a non-rotating duct
(nozzle) (Figure 8) Compared to the conventional propeller of the same diameter and thrust this
20 httpgcaptaincompower-exhaust-gas-paybacks-waste
TRANL15371 9
arrangement allows an increase inflow to the propeller improving the operating conditions around the
propeller and the ideal efficiency
Figure 8 Right photos of this Norwegian trawler (SetSail 2009)
The duct creates additional thrust load The potential for energy savings on relevant vessels range
between 1ndash20 (Crist 2009 IMO 2011 Barringhaus und Olds 1999 IMO 2009) whereupon 10 is a
good average value (IMO 2009 Crist 2009) The improvement of the combination of propeller and duct
overweigh negative effect of the increase water resistance caused by the duct
Barriers Since the duct has an optimal operational speed it does not work efficient at all speeds For
instance as drag increases with increasing speed eventually this will become larger than the added
thrust Therefore at high speeds ducts are typically not used (IMO 2009) The split incentive is a barrier
between ship owners (investor) and ship operators (gainer) as explained earlier (ICCT 2011)
Technical maturity Several standard designs are available on the market (IMO 2011) with a medium
payback time (IMO 2011)
Applicability Ducted propellers suits for vessels operating at high propeller loadings such as tankers
bulk carriers especially tugs and some offshore service ships The duct leads to increased friction but
at higher propeller loadings this is more than rewarded for by the positive effect of the combination of
propeller and duct (IMO 2009)
Contra-rotating propellers (CRP)
A rotating propeller induces a rotating motion in its backwash Normally this rotation energy of the
propeller gets lost The contra-rotating propeller is used in order to recover part of this energy (Figure
9) In a contra-rotating configuration two propellers are facing each other rotating in the opposite
direction with the aft propeller recuperating the turning energy in the wake from the forward propeller
(IMO 2011) To avoid complications with cavitation the aft propeller usually has a smaller diameter
than the front propeller Contra-rotating propeller arrangements involve a short shaft line and for that
reason primarily suitable for vessels with single-screw
TRANL15371 10
Figure 9 Left conventional propeller Right contra-rotating propeller The working principle is simple and effective
the power is split in a forward and aft propeller which through the different direction of rotation cancel out the
rotational energy losses behind the propeller (WAumlRTSILAuml 2009)
Potential savings of such measures are assessed to be in the order of 6ndash20 of the power consumption
with an average of 13 although higher figures may be presented by industry for specific cases Two
different full-scale measurements reported gains of 15 and 16 (IMO 2009 Crist 2009)
Barriers The mechanical installation of contra-rotating shafts is complicated and requires more
maintenance (IMO 2011) The split incentive between ship owners (investor) and ship operators
(gainer) is a barrier as explained above Although this technology can bring high energy savings the
investment is so high that there is not a short payback time
Technical maturity The technique is available on the market but problems with gearboxes for
contra-rotating propellers have been reported as well as operational problems with mounting (IMO
2009 IMO 2011) Payback time is reported as short (WAumlRTSILAuml 2009) but also as medium-long with
about ~15-20 years (Shuto 2010)
Applicability The technology is particularly beneficial for rather heavily loaded propellers as for
example very fast cargo vessels like Ro-Ro ships or for container ships (IMO 2011 Crist 2009) Contra-
rotating propellers need a short shaft line and hence mainly suited to single-screw ships (IMO 2011)
Contra-rotating propellers can be implemented as retrofit but it is more likely implemented in new
built ships due to the complicated mechanical installation (Crist 2009)
Post swirl devises
A number of different techniques belong to the post swirl category Several of them contain
modifications to the rudder or propeller (IMO 2009) Depending on vessel type and operational field
various power saving measures can be mounted to optimise water velocity distribution to the propeller
and to minimise slipstream losses due to swirl in the outflow of a propeller The most important among
these measures may be additional thrusting fins at the rudder twisted rudder (Figure 12) rudder-
bulb-systems with fins (Figure 13) and fins on the propeller fairwater also called post swirl fins or
boss cap fins (Figure 10)
Generally post swirl measures reported 1-8 energy efficiency (test models) Even 8-9 energy
efficiency from full-scale measurements for additional thrusting fins at the rudder Payback time is
estimated to be short to medium post swirl devices (DNV GL 2015 Crist 2009 ICCT 2011) Some of
CRP FOR BETTER PROPULSION EFFICIENCY
CONVENTIONAL PROPULSION
TRANL15371 11
the post swirl measure can be combined A good overview is given in Nielsen et al (Combined Kappel
propeller and rudder bulb system for improved propulsion efficiency not dated)
3431 Post swirl fins
The post swirl fins (Figure 10) can recover energy loss of propeller hub vortex in the propeller backward
flow and can lead to 3-5 energy saving on average 4 operating at the same speed (MOL 2011
Barringhaus und Olds 1999 Hansen Dinham-Peren und Nojiri 2011 ICCT 2011)
Figure 10 Example the post swirl fins or propeller boss cap fins (gcaptain 2012)
Barriers It is simple and straightforward measure requiring only the removal of the propeller boss
caps and replacement with the post swirl fins (no hull modification is needed) (Hansen Dinham-Peren
und Nojiri 2011 MOL 2011) However there is a split incentive between ship owners (investor) and
ship operators (gainer) as explained above
Technical maturity The technique is available on the market In 2013 post swirl fins were applied
to over 2500 ships worldwide (MOL 2011) Further advantages of the post swirl fins are reduction in
propeller torque reduced vibration in the stern and less underwater noise and reduced rudder erosion
(MOL 2011) A payback time of 6 months was estimated for 4 efficiency improvement at $600tonne
oil price (Hansen Dinham-Peren und Nojiri 2011) The investment is considered to be low21
Applicability The technique is effective for all screw propellers irrespective of the type or hull form
of the ship Has been tested on large-scale container vessels (MOL 2011 Hansen Dinham-Peren und
Nojiri 2011)
3432 Free rotating wheels
A vane wheel (Grim wheel) is a freely spinning propeller mounted behind the main smaller propeller
(see Figure 11 for example of use on retrofit Queen Elisabeth II in 1986) The vane wheel has a bigger
diameter than the main propeller and increases the propeller diameter The small propeller drives the
freely revolving vane wheel fitted on the wake The inner part of the vane wheel acts as a turbine and
the outer part as an ldquoadditionalrdquo propeller
21 httpgcaptaincompropeller-technology-ship-efficient
TRANL15371 12
Figure 11 Example for a grim vane wheel (Boat design 2007)
This leads to a substantial recovery of the rotational energy The energy saving potential is reported to
be 10 (Brannigan et al 2009) It is stated that the important benefit of the vane wheel is that a
smaller impulsion propeller can be installed which consumes less energy The vane wheel gives a
suitable energy improvement for cargo ships (IMO 2009 Schneekluth und Bertram 1998) and has short
payback time It is also stated that if there is room for a vane wheel in the aft there is also space for
an impulsion propeller of larger diameter leading about the same energy saving potential as the
combination of a small impulsion propeller and a vane wheel (IMO 2009)
Barriers A barrier is the split incentive between vessel owners who are responsible for investing in
these technologies and vessel operators who are those who compensate for the fuel consumption and
benefit from such technologies
Technical maturity Limited application Vane wheels are subjected to strong fluctuations in loading
Problems with the strength of the blades have been encountered frequently (for example the vane
wheels on the Queen Elisabeth II were short lived and not used after22)The payback time is estimated
to be short
Applicability The technique is effective for all screw propellers irrespective of the type or hull form
of the ship both for new and existing ships (Chen Reed und Kim 1989) Recommended for all ship
types except ferry and cruises because of their problem with strong fluctuations in loading as
mentioned above23 (IMO 2009)
3433 Twisted rudder
Rudders can play a significant role of extra frictional resistance Rudders are located in the backwash
of a propeller and rotational energy will act on the rudder Because of these effects the rudder gives
prospects of efficiency gains (Schulze 2007)
22 httpwwwroblightbodycomlinersqe-21987_Refitindexhtm 23 httpwwwroblightbodycomlinersqe-21987_Refitindexhtm
TRANL15371 13
Figure 12 Schematic capture of twisted rudder (Nakashima 2015)
Twisted leading edge technology provides multiple benefits for high-speed vessels compared to
conventional rudder designs Conventional rudders are located behind the propeller with the rudder
profile arranged symmetrically about the vertical rudder centre plane This arrangement does not
consider the fact that the propeller induces a strong rotational flow that strikes on the rudder blade
This consequences in areas of low force on the blade that induce cavitation and associated erosion
problems (Becker Marine System 2015 Schulze 2007)
The twisted rudder is horizontally twisted on the lower and upper side of the segment that is an
extension of the propeller shaft (Figure 12) This decreases cavitation rudder and improves
manoeuvrability of the vessel (Schulze 2007) Twisted rudder types lead to energy efficiency
improvements by approximately 2-4 on average 3 for large-size high-speed vessels (Hollenbach
und Friesch not dated Nakashima 2015)
Barriers Work needs to be done in the dry dock this is not regularly happening for existing ships
(Hochkirch und Bertram not dated) There is a split incentive between vessel owners who are
responsible for investing in these technologies and vessel operators who are those who compensate
for the fuel consumption and benefit from such technologies (ICCT 2011)
Technical maturity This rudder type is a commercially used technology and easy to apply if the ship
is in the dry dock (ICCT 2011)The payback time is estimated to be short to medium (Rolls-Royce 2014
Crist 2009)
Applicability Twisted rudder can used by container vessels reefers Ro-Pax ferries cruise ships and
naval vessels In South Korea this type of rudder is recognised as a standard rudder for large-size
high-speed container carriers (Nakashima 2015)
TRANL15371 14
3434 Rudder bulb
Figure 13 Example for a rudder bulb Kawasaki RBS-F rudder bulb systems with fins (Kawasaki 2015)
The rudder bulb brings smooth inflows from the propeller and can reduce the drag of the rudder The
rudder fins produce thrusts in the rotational flows generated by the propeller (Figure 13) Rudder bulb
measure can improve energy efficiency by 2-5 (Nielsen et al not dated Becker Marine System not
dated) on average 4 (Crist 2009)
Barriers The work needs to be done in the dry dock this is not regularly happening for existing ships
There is a split incentive between vessel owners who are responsible for investing in these technologies
and vessel operators who are those who compensate for the fuel consumption and benefit from such
technologies (ICCT 2011)
Technical maturity The technology is a commercially used technology and easy to apply while the
ship is in the dry dock (Kawasaki 2015) Payback time is estimated to be medium (Crist 2009)
Applicability For new and retrofit tanker- bulk- container- and Roro-ships with a propeller and
rudder (Crist 2009)
TRANL15371 15
Barriers to the transfer and uptake of energy
efficiency technologies for ships and possible
measures to overcome them
Although there are ways to reduce emissions (Chapter 3) and also drivers working towards the
implementation of such measures there are significant barriers to acting on cost-effective opportunities
in the maritime industry This is often referred to as barriers to energy or the energy efficiency gap
(Michele Acciaro 2013) (Sepideh Jafarzadeh 2014) (OECD 2014) Some barriers are shared with other
industries while others are unique to the maritime industry Furthermore many of these barriers are
not specific to the EEDI and the SEEMP but apply to any rule under MARPOL These barriers can exist
on both the supply and the demand side For example there could be barriers to the development and
implementation of measures that reduce CO2 emissions from ships and barriers to the expression of
demand for these measures (ECORYS 2012) Studies have however shown that there are relatively
few barriers related to the development of new technologies or access to related intellectual property
rights by the main shipbuilding nations and that the supply of measures exceeds the demand (ECORYS
2012) Existing studies on barriers to energy efficiency thus focus on what prevents the uptake of
available measures
This section presents an overview of the main barriers to the transfer and uptake of energy efficiency
technologies in the shipping industry and discusses potential ways of overcoming them
Preliminary assessments of technology transfer and financial needs by both workshop participants and
the IMO Ad Hoc Expert Working Group on Facilitation of Transfer of Technology for Ships (AHEWG-TT)
have suggested that the type of assistance needed by Port State and Flag State administrations will be
of a different nature than that required by shipbuilders and owners Our assessment above has shown
that the shipbuilding industry is expected to need less assistance than Port States and Flag States
In the next table we list a summary of the main barriers and the stakeholders concerned in the main
categories as identified by AHEWG-TT as well as the possible measures that could help overcome these
barriers The possible measures to overcome the barriers are further detailed in the sections below
Related costs are estimated in a separate section in order to minimise overlap
TRANL15371 16
Table 2 Summary of main barriers relevant stakeholders and possible measures to overcome them
Barrier Stakeholders Measures forward
Lack of awareness
(administrative and industry)
a MARPOL in general MARPOL Annex
VI EEDI and SEEMP in particular
b Available energy efficiency
technologies
Flag and Port
States
Ship owners
Capacity building
- Workshops
- Trainings
Model course for training
Inventory
Platform for information access and
sharing
Agreements between industry and
administrations
Technology concerns
a Lack of or limited technology supply
chain in some states
b Lack of technology base for RampD in
some states
c Lack of trust (in ability to reduce
emissions in ability to reduce
operational costs in compatibility
with other measures)
Ship owners
Investors
Increase cooperation in ship design
and building
Increased interaction between
industry and educationalRampD
institutes
Establish platform to share
expertiseexperience
Provide special investment or
guarantee funds
Institutional concerns
a Increased administrative burden
1Revision and amendment of existing legislation
2Implement Port and Flag State obligations
b Limited technical capacity in state institutions to implement
c Lack of financial resources for additional compliance and enforcement activities by maritime administrations
Flag States
Port States
Promote increased cooperation and
communication between
administrationswithin regional
administrations
Regional information workshops for
Port and Flag States
Establish platform to share regulatory
experience
Development aid
Commercial
a Increased costs for ship owners to
take up energy efficient technologies
b Lack of motivation of owners to take
up energy efficient technologies (split
incentive)
Ship owners
Financiers
Special EE funds
Smart contracts
TRANL15371 17
Awareness Raising
Barriers Lack of Awareness
The need to create awareness among Flag States Port States and ship owners of the requirements of
Annex VI in general and Chapter 4 in particular was highlighted by participants of the workshop and
emphasised by the AHEWG-TT The level of awareness in the various regions and even in the countries
within the regions differed considerably The AHEWG-TT further suggests it would be beneficial to
undertake an initial evaluation of knowledge needs (gap analysis) in order to ensure workshops and
other awareness-raising activities are appropriately tailored24
Furthermore ship-owners are not always aware of the energy efficiency technologies available on the
market or which operational measures can be implemented to save fuel Ship owners can be companies
people and investment funds Especially private equity groups tend to focus more on short term looking
for quick profit while traditional ship owners tend to hold the ship for at least 20 years25
Measures forward
Though Flag States and Port States should already have implemented measures to ensure that Energy
Efficiency Design Index (EEDI) and Ship Energy Efficiency Management Plan (SEEMP) requirements are
complied with both public administrations and industry representatives could benefit from additional
trainingcapacity building and platforms to share experiencesreceive information with regards the
practicalities of these regulations and available energy efficiency technologies The needs for each
group can be determined through a gap-analysis which we recommend to be carried out by an
independent consultant in cooperation with the flag and port states Once the specific needs for each
group have been determined they can be addressed through the following awareness raising
measures
Capacity Building (workshops trainings)
Workshopstrainings could be organised where formal training is combined with open discussions where
experiences could be shared just within one stakeholder group or between educational institutes
auditors operational managers of ships shipbuilders and authorities Such trainingsworkshops could
focus on just one or all aspects relating to the applicable rules available energy efficiency measures or
assessment methods of technologies (eg training in calculating and verifying EEDI and SEEMP
including development of tools to calculate EEDI and SEEMP) Trainingsworkshops can be local or
regional Sending people physically to regional workshops is generally more conductive to networking
and experience sharing but less adapted to the local situation and more costly
To reduce the costs of training and ensure a certain level of training the IMO or other qualified
international partners (eg WMU) could develop model courses for training In order to better
understand the rules and regulations in detail people use the help of trainers to better understand the
elements that are important for them and to gain experience in doing calculations and other required
24 Ad Hoc Expert Working Group on Facilitation of Transfer of Technology for Ships 2nd Meeting 25 httpwwwftcomcmss0dadcb240-3d97-11e3-b754-00144feab7dehtmlaxzz3aqC3tmNu
TRANL15371 18
activities by the regulations Trainers have to develop their courses and earn back their investments
via trainings Since the trainers are doing this simultaneous it would be more efficient if there would
be a model course available that can easily be tailored to the audience This would reduce the costs for
the development of trainings and would also ensure that the trainers provide the same level of depth
in their trainings Since the IMO is responsible for the rules and regulations it would be the logical
responsible for the efficient implementation and therefore could take the initiative for developing model
courses
Information Sharing
Inventory of energy-efficiency technologies (for example the IMO-GEF-UNDP project) Many
studies and overviews on the internet are available The quality and the scope is often
different
Improved access to information and information sharing with international recognised
organisations including relevant survey and certification training One example of
establishing information sharing between governments is the work of the OECD Council
Working Party on Shipbuilding (WP6)26 which organises regular workshops aimed at
facilitating the exchange of information on policy and industry developments
Note that many of these measures overlap with the measures required to overcome institutional
barriers as laid out in section 43
Agreements between industry and administrations could be envisaged to overcome the
barriers
In order to enhance the sharing of expertise for both administrations and industry technology transfer
and technology cooperation agreements could be formulated in order to strengthen the cooperation
As identified before the technology transfer to the ship building industry is not a mayor barrier so the
agreements should help the administrations to become more aware of the possibilities to further
promote the implementation of MARPOL Annex VI
Typical agreements between industry and administrations could be in the form of initiatives like the
Sustainable Shipping Initiative (SSI) SSI members have developed a vision for a sustainable shipping
industry in 2040 They commit to working towards this in all their own operations andor activities that
involve shipping and in all their dealings with and support for the shipping industry to make their vision
a global reality by 2040 SSI members of over 19 companies represent ship owners and charterers
shipbuilders engineers and service providers banking insurance and classification societies The SSI
explored for instance how to overcome barriers to the uptake of new technologies and techniques which
improve the operational efficiency of ships potentially delivering energy efficiency savings of 10 or
more and payback periods of less than 5 years They also produce case studies to show good examples
and also develop tools By involving administrations in these kind of initiatives (even free of charge)
they could be actively supported with knowledge about sustainable shipping
26 httpwwwoecdorgstiindworkshopongreengrowthinshipbuildinghtm
TRANL15371 19
Technology Concerns
Barriers Technology Concerns
One of key barriers to the implementation of energy efficient technologies (new and retrofit) relates to
the lack of or limited technology supply chain Furthermore the lack of a technology base for RampD in
some states is a barrier Also the existence of concerns relating to the ability of available energy
efficiency measures to reduce emissions and operational costs and their compatibility with other
measures of energy efficient technologies is a barrier This is typically the problem in very isolated ship
yards
Measures forward
Very successful shipyards (Japan and Korea) have already since many years a large number of
licencing technology transfer and similar agreements and continuously exchange information with
competitors in and outside their countries For instance US shipyards have adopted this methodology
since the 1980s (office of technology assessment 1983)
Further technology sharing could be stimulated through educationalRampD institutes locally regionally
or globally in ship design and building The technology will be transferred to the ship builders once the
students start working there or through cooperation between industry and university In order to
facilitate this we recommend the establishment of partnerships to share expertiseexperience
Typically individuals who know both worlds are the driving force behind successful partnerships (AISBL
2012) These partnerships are built around a shared long term research vision Many partners could
contribute (eg financially) in order to establish the responsible management and research programme
The target of the platform could be for example to provide verified information on real-world energy
efficiency improvements via a monitoring programme
For example in order to stimulate the deployment of energy efficient trucks the Dutch government
provides a website to share audited knowledge and data on about 15 energy efficiency technologies27
Additionally climate financing could be leveraged to reduce the investment risk in unproven
technologies For example IMO Member States could create a demonstration fund that can function as
a guarantee for investments in new and immature technologies28 Similarly investment guarantees
can be provided by funds in the same way governments provide export credits to their companies If
the technology does not deliver the expected fuel-savings the fund can cover the difference and hence
reduce investment uncertainty The main objective being to reduce investment risk
Institutional Concerns
Barriers
27 httpwwwtruckvandetoekomstnl 28 An example of a specific EE fund is httpwwweeefeueligible-investmentshtml
TRANL15371 20
For Flag and Port States complying with new regulations of IMO and EEDI and SEEMP particularly
represent and increased administrative burden It requires revisions and amendments of existing
legislation that need to be implemented at Port and Flag State functions There is currently limited
technical capacity in state institutions to implement these changes especially in developing countries
with a relatively low number of ships under their flag
The lack of financial resources is also a barrier for additional compliance and enforcement activities by
maritime administrations This is particularly an issue for least developed countries and small
developing island states Implementation costs are relatively higher for small Flag States because of
limited abilitycapacity to implement new technical regulations Note that this issue is not specific to
the EEDI and the SEEMP but to most regulatory measures (maritime or other)
Measures forward
Measures to assist states in implementing (existing and new) legislation include
Promote an increased cooperation and communication between administrationswithin
regional administrations of Port and Flag States similarly to what has been suggested in
sections 41 (Awareness raising through capacity building activities such as workshops) and
42 (Establish platform to share regulatory expertiseexperience) Platforms could be
managed by IMO in conjunction with industry and development funds in order to share the
costs as this has been done before for GloBallast for example In that case the IMO is in the
lead (executing agency) but the platform is supporting the collaboration with many
stakeholdersfunding partners The goal of the programme is to assist developing countries
eg via e-learning courses
In addition deterrents need to be put in place to discourage Flag States from performing
substandard inspections A system for detecting sub-standard inspections should be
implemented whereby mandatory Port State Control inspections are carried out in close
proximity to mandatory Flag State inspections (ie the Flag State inspection is carried out
prior to the ship leaving port and the Port State inspection is carried out upon arrival at port)
The two inspections should be carried out under a uniform mandatory checklist The IMO
should monitor inspections and investigate where discrepancies between inspections close in
proximity are detected If a Flag or Port State is found to have failed to meet the requisite
inspection standards penalties in the form of substantial fines should follow
In order to overcome the financial barriers financial assistance to states could help with
capacity building and implementation Financial resources are not only needed in the
implementation of the new regulations (training of government experts) but governments of
Flag States also need to be involved continuously in the ongoing discussion around
developments new EEDI targets for 2020 and beyond which requires continuous availability
of experts to represent the interests of the state (Metselaar 2015) Financial aid can therefore
be supplied in the following forms
Increased financial support for compliance and enforcement activities by maritime
administrations
Financial support could be provided to Flag States so that they have the resources to
properly carry out vessel inspections Consideration should be given to the introduction of
TRANL15371 21
an International Fund Convention set up for this purpose and contributed to by Port
States andor their major oil and other cargo exporters and importers
Commercial
Barriers
Private parties such as ship owners and investors are not always commercially incentivised to make
investments in energy efficiency measures This can be due to the split incentives between owner (who
should make the investment) and charterer (who reaps the cost savings) of a ship (see paragraph 25)
Furthermore access to finance can be problematic for smaller players who operate in niche markets
Measures
Bottlenecks in financing private investments and new financing mechanisms could be addressed during
regional or international workshops that include traditional and new financiers that could finance
investments in energy efficiency technologies
One solution that has been brought forward to address the problem of split incentives is the use of
lsquosmart contractsrsquo (Michele Acciaro 2013) The idea is to change charter contracts in a way that risks
and benefits are shared among charterers and ship owners In such contracts speed choice is more
flexible and the chartering cost of vessels is closer to fuel cost as such ship owners get motivated to
invest in energy-efficient technologies and charterers get stimulated to run vessels in an energy
conserving manner
With respect to the shipbuilding industry the following could facilitate the transfer of technology as
well
Financial assistance to shipyards to be provided at the national level or through other
arrangements
Foreign direct investment in software and hardware as an innovative way to support industry
in implementing the requirements
One type of incentive that governments can provide to enhance industry performance and technology
adoption is a competition for top performers Governments could contribute to a fund from which
money is distributed to the top 10 of best performers in a particular year
Cost estimates
Workshops and training
Capacity building workshops for administrations are estimated at euro 1000 per attendee for an
online workshop (1-2 days) Costs for the organisation of such workshops would include expert fees
and administrative costs These costs could be lower if the course material is already developed
(model workshops) Eg 2 attendees per Flag State for the ten most important Flag States
TRANL15371 22
(covering 74 of total fleet tonnage) comes down to euro 20000 or less in case the courseware is
already existent
A situation that is more conductive to networking and experience sharing is to send people physically
to regional workshops The costs of such workshops including participants travel and hotels for 50
participants would be between euro20000 - euro100000 per workshop based on our international
experience with organising workshops in the field of renewable energy and energy efficiency Costs
could be lower depending on the amount of preparation required cost of location (could be sponsored
by participating states)
Technical training
Trainings already exist for calculating and verifying EEDI including development of tools to calculate
EEDI For example MARIN offers 32h courses over 5 days in the Netherlands for euro 5000 per attendee
(excluding travel and accommodation)29 Lloyds offers similar trainings for similar costs30
Model courses for training may need to be updated depending on identified needs Ecofys estimates
the update of eg an existing EEDI model courses to cost in the order of euro 50000
Online platform for inventory of energy efficiency technologies
Inventories of energy-efficiency technologies already exist (for example in reports like (IMO 2009) and
on websites of for instance DNV-GL the efficiency finder31) but they could be further developed since
the websites are either not independent or incomplete
In order to facilitate information exchange a web-based platform could be established The role of the
platform would be for example to provide verified information on real-world energy efficiency
improvements via a monitoring programme For example in order to stimulate the deployment of
energy efficient trucks the Dutch government provides a website to share audited knowledge and data
on about 15 energy efficiency technologies32 The costs of such a website and corresponding
programme are estimated to be around euro 2 million for a 4 year period Furthermore a platform can be
used to inspire others by showing best practices and can be used for sharing of information regarding
network opportunities like conferences and seminars
Capacity building project
Currently the IMO-GEF-UNDP GloBallast project is a capacity building project it assists developing
countries and their maritime industries in implementing international regulations on ballast water
29 httpwwwmarinnlwebEventsCoursesSpecialist-Course-on-Ship-propulsion-model-tests-and-SpeedPower-trials-for-EEDI-Verifiers-
2731-October-2014htm 30 httpwwwlloydslistcomllsectorship-operationsarticle422262ece 31 httpswwwdnvglcommaritimeenergy-efficiencyefficiency-finderhtml 32 httpwwwtruckvandetoekomstnl
TRANL15371 23
management and preventing risks arising from the transfer of harmful aquatic organisms And has
several aspects that could also be used for knowledge transfer of energy efficiency measures
web-site
e-learning course
databasesdirectories
library collections
newsletter
Regional Task Force (RTFs) to support development and adoption of a regional approach
Develop and implement communication education awareness raising and outreach
programme
Develop introductory and more specialised training packages
Develop model legislations
The total budget for the 2008-2012 period was US$23 million out of which US$564 million represents
a GEF grant the rest being mostly in-kind contributions from the participating countries regional co-
ordinating organisations (RCO) and strategic partners including the private sector
Improved access to information and information sharing with international recognised organisations
including relevant survey and certification training would further promote the different technologies
TRANL15371 24
Conclusions
This study provides an overview of existing technologies which could drastically improve the energy
efficiency of ships Furthermore barriers to transfer and uptake of energy efficient technologies are
analysed and categorised and implications of these barriers are listed in order to facilitate the uptake
of energy efficiency technologies for ships
From this research it is clear that conventional technology is available that can cost-effectively (with a
payback time of less than 15 years) achieve high efficiency gains If the maximum gains per category
are added up (for all but ferry and cruise) this would mean a total efficiency improvement of 35
Even without taking two experimental technologies with potentially high efficiency gains into account
(wind power and air lubrication)
High investments like wind power and contra rotating propellers bring the highest savings (13 ndash 20)
The medium investments are in-between (5-10) and the low investments only bring relatively small
energy efficiency improvements (lt5)
When the ship owner has too few opportunities to share investment with charterers this leads to a split
incentive a ship owner may invest the up-front capital to put in energy-efficient technology but not
receive the benefits This is typically a problem for investments with a high payback time ie the wind
power and contra rotating propellers
The main barriers are related to the transfer of technology to Flag States Flag States are generally
third world and developing nations that often do not have the resources to enforce investigate or
prosecute breaches by their flagged vessels
Several ways to overcome the knowledge transfer barriers were presented that can be categorised as
follows
Workshops and trainings
o Capacity building workshops for administrations
o Regional workshops
Technical training
o Training in calculating and verifying the EEDI
o Development of model courses
Online platform
o Inventory of energy-efficiency technologies
o Creation of a website with all relevant information for the target audience
o Improved access to information and information sharing
o Provide verified information on real-world energy efficiency improvements via a
monitoring programme
TRANL15371 25
The most expensive of the capacity building actions is the capacity building project which takes all
aspects above into account If a project would be developed for knowledge transfer regarding energy
efficiency measures similar to GloBallast which assists developing countries and their maritime
industries in implementing international regulations on ballast water management and preventing risks
arising from the transfer of harmful aquatic organisms the total budget needed would be in the order
of US$23 million for a period of 5 years
TRANL15371 26
References
JFE Group 2013 ldquoJapan Marine Unitedrdquo JFE Group Overview JFE Group AISBL 2012 Making Industry-University partnerships work lessons from succesful collaborations
report Belgium AISBL
Allenstroumlm Bjoumlrn 2013 ldquoWind propulsionrdquo SSPA Sweden AB Gothenburg EffShip March
Aqorau T 2000 Illegal Unreported and Unregulated Fishing Considerations for Developing
Countries paper Honiara Solomon Islands South Pacific Forum Fisheries Agency
BALance 2014 Competitive position and future opportunities of the Euroean Marine Supplies
industry BALance Technology Consulting
Barringhaus David and Robert Olds 1999 OLDS ENGINEERING Maximizing Propulsion Efficiency
Marine Division Accessed Februrar 2015
httpwwwoldscomaumarinemaximizing_propulsion_efficiency
Becker Marine System not dated Becker Bulb Rudders httpwwwbecker-marine-
systemscom05_downloadszzpdfproduct_pdfBecker_Bulb_Rudderspdf Becker Marine
System
mdash 2015 Twisted Full Spade Rudder Accessed Feb 2015 httpbecker-marine-
systemscom03_productsproducts_twisted_full_spadehtml
Bloomberg 2014 China Loses Shipbuilding Crown to South Korea Chart of the Day 9th December
httpwwwbusinessweekcomnews2014-12-09china-loses-shipbuilding-crown-to-south-
korea-chart-of-the-day
Bluebird-Electric 2014 Sipbuilding post World War Two httpwwwbluebird-
electricnetship_boat_design_buildingshipbuilders_ship_repairers_associationhtm
Boat design 2007 Accessed Feb 2015
httpwwwboatdesignnetforumsattachmentspropulsion16743d1193341389-new-
propulsion-sytems-ships-grim-prop-1jpg
Brannigan Paschos Eyers and Wood 2009 Report on International avialtion and Mritime Emissions
in a Copenhagen (post 2012) Agreement Oxfordshire AEA Group
Chen Benjamin Arthur Reed and Ki-Han Kim 1989 A Vane-Wheel Propulsor for a Research and
Development Report Newport David Taylor Research Center
CNSS 2015 Clean North Sea Shipping - Clean Shipping Technology Accessed Februar 2015
httpcleantechcnssnoghg-technologiestechnical-measuresmeasures-related-to-the-hull
Crist Philippe 2009 Greenhouse gas emissions reduction potential from international shipping
Working paper OECD
Daily Times 2015 Nigeria Turkey seek collaboration on ships shipyards 5th January
httpwwwdailytimescomngarticlenigeria-turkey-seek-collaboration-ships-shipyards
Dillingham Gerald L 2000 Progress Made to Reduce Marine Pollution by Cruise Ships but Important
Issues Remain GAO report Washington United States General Accounting Office
DK Group 2015 Silverstream technologies January Accessed January 2015 httpdkgroupeu
DNV 2014 Encouraging Construction and Operation of Green Ships OECD
httpwwwoecdorgstiindC-WP6(2013)12-FINAL-ENGpdf
TRANL15371 27
DNV GL 2015 EFFICIENCY FINDER Accessed Feb 2015 httpwwwdnvglcommaritimeenhance-
performanceefficiency-finderaspx
Ecorys 2012 ldquoGreen growth opportunities in the EU shipbuilding sectorrdquo
ECOSPEED 2015 EUROPEAN MARINE amp MACHINERY AGENCIES LTD Accessed February 2015
httpwwweuropeanmarinecoukECOSPEEDhtm
gcaptain 2012 gcaptain - Propeller Technology to Make Your Ship More Efficient - Accessed Feb
2015 httpgcaptaincompropeller-technology-ship-efficient
Hansen Dinham-Peren and Nojiri 2011 Model and Full Scale Evaluation of a lsquoPropeller Boss Cap
FinsrsquoDevice Fitted to an Aframax Tanker Second International Symposium on Marine
Propulsors smprsquo11 Hamburg Germany June 2011
Hellenic Shipping News 2014 Korean ships sell at fuel-saving premium 22nd December
httpwwwhellenicshippingnewscomkorean-ships-sell-at-fuel-saving-premium
Hindawi 2015 Hindawi Puplishing Cooperation Accessed February 2015
httpwwwhindawicomjournalsijrm2012474785fig4
Hochkirch Karsten and Volker Bertram not dated ldquoSlow Steaming Bulbous Bow Optimization for a
Large Containershiprdquo Accessed Februar 2015 http2021148960resourcepdf5096pdf
Hollenbach Uwe and Juumlrgen Friesch not dated Efficient hull forms ndash What can be gained
Conference ship-efficiency Hamburg 2013 Hamburg HSVA Hamburgische Schiffbau-
Versuchsanstalt GmbH HamburgGermany
ICCT 2011 Reduce Greenhouse Gas Emissions from Ships - Cost Effectiveness of Available options -
white paper Washington DC International Council on Clean transportation (ICCT)
IMO 2011 REDUCTION OF GHG EMISSIONS FROM SHIPS Marginal Abatement Costs and Cost
Effectiveness of Energy-Efficiency Measures Submitted by the Institute of Marine Engineering
Science and Technology (IMarEST) MEPC 62INF7 International Maritime Organisation
IMO 2009 Second IMO GHG Study 2009 London International Maritime Organisation
JSEA 2006 ldquoImproved propulsive performance - Universal applies new energy-saving type Leadge
Bowrdquo Japan Ship Exports Association (JSEA) httpwwwjseaorjpVariableJSea318pdf
Kawasaki 2015 Energy-saving Technology Accessed Feb 2015
httpswwwkhicojpenglishshiptechconservationindexhtml
Leddy Fiona Jayne 2012 ldquoA critical legal analysis of International Shipping in Australian Waters and
the risk of ship-based oil pollutionrdquo Queensland Environmental Practice Reporter vol 17
Marinelog 2014 China white lists 51 shipyards 4 September
httpwwwmarinelogcomindexphpoption=com_k2ampview=itemampid=7667china-white-
lists-51-shipyardsampItemid=231
Metselaar Kees interview by Arno van den Bos 2015 Policy officer at directorate maritime affairs of
ministry of Intrastructure and Environment (February)
Michele Acciaro Peter Nyegaard Hoffmann Magnus Strandmyr Eide 2013 ldquoThe Energy Efficiency
Gap in the Maritime Transportrdquo Journal of Shipping and Ocean Engineering 1-9
MIWB 2015 Maritiem Instituut Willem Barentsz Accessed Feb 2015
httpsmijnmiwbnlnieuwsbriefindexphpdo=showampid_artikel=116
MOL 2011 Energy-Saving Propeller Boss Cap Fins System Reaches Major Milestone - Orders
Received for 2000 Vessels Accessed Feb 2015
httpwwwmolcojpenpr20111145html
TRANL15371 28
Motorship 2014 Gas fuelled ships into the future 31 10 httpwwwmotorshipcomnews101ships-
and-shipyardsgas-fuelled-ships-into-the-future
Nakashima 2015 Nakashima propeller CO LTD Accessed Feb 2015
httpwwwnakashimacojpengproductrudderhtml
Nielsen Shin Lundgren and Faghani not dated Combined Kappel propeller and rudder bulb system
for improved propulsion efficiency Frederikshavn MAN Diesel amp Turbo
OECD 2014 The OECD Council Working Party on Shipbuilding
httpwwwoecdorgindustryindshipbuildinghtm
OECD 2011 ldquoThe Shipbuilding Industry in Turkeyrdquo
office of technology assessment 1983 An Assessment of Maritime Technology and Trade report
Washington DC US Congress
Pakarinen Risto 2007 ldquoNothing common about common railrdquo Twentyfour7 (Twentyfour7) 64-65
Ports amp Ships 2015 Ports and Ships Accessed February 2015
httpportscozanewsarticle_2007_10_17_4038html
Rolls-Royce 2014 Propulsors - Moving your business in the right direction httpwwwrolls-
roycecom~mediaFilesRRolls-Roycedocumentscustomersmarinepropulsion-2014-
tcm92-8664pdf Aalesund Rolls-Royce Commercial Marine httpwwwrolls-
roycecom~mediaFilesRRolls-Roycedocumentscustomersmarinepromaspdf
Schneekluth H and V Bertram 1998 Ship Design for Efficiency and Economy Oxford
Butterworth-Heinemann
Schulze Reinhard 2007 Twisted Rudder - Extreme Design 14 SVA-Forum bdquo Ruder in Theorie und
Praxisldquo Potsdam 7 November 2007 Potsdam Schiffbau-Versuchsanstalt Potsdam GmbH
Selenetrawlers 2015 Selenetrawlers Accessed February 2015
httpwwwselenetrawlerscomcompanydesign-notes
Sepideh Jafarzadeh Ingrid Bouwer Utne 2014 ldquoA framework to bridge the energy efficiency gap in
shippinrdquo Energy 603-612
SetSail 2009 SetSail Accessed February 2015 httpwwwsetsailcomprop-nozzle-comments-by-
an-expert
Shuto Hideki 2010 Super Eco Inland Vessels httpwwwccr-
zkrorgtempwrshp120411Presentations2_04_HShuto_enpdf IHI Marine United Inc
Silberschmidt Noah 2014 ldquoGenerating efficiencies from thin airrdquo SMM Green shipping | Efficiency
httpwwwsilverstream-techcomwp-contentuploads201404HANSA-241112pdf
httpwwwsilverstream-techcomwp-contentuploads201404HANSA-241112pdf
Skinner Ian 2009 EU Tranport GHG Routes to 2050 Technical options for maritime and inland
shipping httpwwweutransportghg2050eucmsassetsTechnical-options-maritime-inland-
waterpdf Brussel European Commission
Statista 2015 ldquoLargest shipbuilding nations in 2013 based on completions in gross tonnagerdquo
httpwwwstatistacomstatistics263895shipbuilding-nations-worldwide-by-cgt
UK DfT 2014 ldquoDfT Port Statistics - World fleet registered trading vessels of 100 gross tons and over
gross tonnage on selected registers 1999-2013rdquo
httpswwwgovukgovernmentcollectionsmaritime-and-shipping-statisticsdata-tables-
associated-with-this-series
TRANL15371 29
Voorham 2013 Assessment of sustainable investment in shipping Master Thesis
Report SDPO13029m Delft 27 th November 2013 Delft Delft University of Technology
WAumlRTSILAuml 2009 ldquoEnergy Evironment Economyrdquo Helsinki Finland WAumlRTSILAuml
mdash 2007 ldquoWaste heat recoveryrdquo Waumlrtsilauml Corporation
Wettstein and Brown 2008 Derating a solution for high fuel savings and lower emissions
Winterthur Waumlrtsilauml Switzerland Ltd
Wind Chellenger Project HP 2015 Wind Chellenger Project HP Accessed Feb 2015 httpwindku-
tokyoacjpindex_enhtml
TRANL15371 30
Appendix I - World fleet registered trading vessels
Table 3 World fleet registered trading vessels of 100 gross tons and over 2009-2013 Source UK DfT 2014
Flag Country 2009 2010 2011 2012 2013
(World Total) 8448 9130 9831 10343 10725
Panama 1886 1979 2084 2158 2172
(European Union) 1900 1979 2074 2051 2106
Liberia 908 1037 1167 1238 1241
Marshall Islands 475 590 711 811 900
Hong Kong 449 553 678 785 854
Singapore 398 434 512 592 677
Malta 348 380 438 450 496
Bahamas 452 469 481 483 485
Greece 388 407 411 411 415
China 282 327 356 388 411
United Kingdom (inc IOM and CI) 258 273 294 300 288
Cyprus 201 205 207 197 203
Japan 138 156 167 178 192
Italy 150 169 181 180 176
Norway 152 145 143 144 145
Germany 152 155 153 137 123
Denmark 107 115 113 113 122
Korea South 120 124 116 111 112
Indonesia 69 82 91 101 111
Bermuda 94 100 106 109 105
Antigua amp Barbuda 100 107 111 106 100
United States of America 107 108 102 99 97
India 83 83 89 85 82
Netherlands 76 61 67 66 69
Turkey 54 58 62 64 59
Malaysia 69 72 71 62 57
France 63 63 64 56 53
Russia 47 49 49 51 52
Philippines 50 51 50 43 43
Cayman Islands 27 29 32 32 31
Taiwan 25 26 27 30 31
Iran 09 08 05 21 31
Thailand 25 26 22 26 29
Sweden 39 35 33 28 27
St Vincent amp the Grenadines 47 42 37 28 24
Canada 24 24 25 24 23
Spain 22 25 26 25 23
Kuwait 23 19 24 24 22
Brazil 20 20 19 19 20
Cambodia 18 17 13 13 12
TRANL15371 31
Appendix II - Most important shipbuilding
countries
China
China is an emerging shipbuilder that overtook South Korea during the 2008-2010 global financial crisis
as they won new orders for medium and small-sized container ships (Bloomberg 2014 Bluebird-Electric
2014)
Figure 14 delivery of vessels from Chinese and South Korean shipyards in million compensated gross tons a measure
of building time and human resources used per ton Source (Bloomberg 2014)
China has more than 1600 shipyards Analysts have predicted that about one third of them will fold
as the industry struggles with overcapacity Last year China laid out a three year plan for industry
restructuring that urged yards to concentrate on building higher quality vessels and local governments
to halt approvals for new projects (Bluebird-Electric 2014)
After two decades of a loan-fuelled boom Chinarsquos shipbuilding industry has become saddled with debt
and overcapacity prompting some private firms to seek financial assistance from the state In
September the government issued a list of 51 shipbuilders it deemed worthy of public support
(Marinelog 2014)
TRANL15371 32
New additions to the white list include subsidiaries of the China State Shipbuilding Corporation (CSSC)
and the China Shipbuilding Industry Corporation (CSIC) and the AVIC Weihai Shipyard owned by the
Aviation Industry Corporation of China (AVIC) (Marinelog 2014)
South Korea
By the end of 2014 it seemed South Korea has overtaken China again as the worlds largest
shipbuilding country with a global market share of about 30(see Figure 14) (Bloomberg 2014)
(Bluebird-Electric 2014) South Korea leads in the production of large vessels such as cruise liners
super tankers LNG carriers drill ships and large container ships
South Koreas shipyards are highly efficient with the worlds largest shipyard in Ulsan operated by
Hyundai Heavy Industries slipping a newly built $80 million vessel into the water every four working
days South Koreas big three shipbuilders Hyundai Heavy Industries Samsung Heavy Industries
and Daewoo Shipbuilding amp Marine Engineering dominate global shipbuilding with STX Shipbuilding
Hyundai Samho Heavy Industries Hanjin Heavy Industries and Sungdong Shipbuilding amp Marine
Engineering also ranking among the top ten shipbuilders in the world In 2007 STX Shipbuilding further
strengthened South Koreas leading position in the industry by acquiring Aker Yards the largest
shipbuilding group in Europe (The former Aker Yards was renamed STX Europe in 2008) In the first
half of 2011 South Korean shipbuilders won new orders to build 25 LNG carriers out of the total 29
orders placed worldwide during the period
To maintain their market position Korean yards also focus more and more on greening opportunities
The Korean government introduced a GHG emission reducing program in 2008 The program is aiming
at reducing GHG emissions throughout all economic sectors including the shipping and shipbuilding
industry Also the Japanese Shipbuilding Association (SAJ) is looking into the possibilities to reduce
GHG emissions so that the shipbuilding industry becomes greener and more competitive (Ecorys
2012)
Japan
Japan had been the dominant ship building country from the 1960s through to the end of 1990s but
gradually lost its competitive advantage to the emerging industry in South Korea which had the
advantages of much cheaper wages strong government backing and a cheaper currency South Korean
production overtook Japans in 2003 and Japanese market share has since fallen sharply
The Philippines
The Philippines has placed fourth among shipbuilding nations around the world producing more than
six million deadweight tonnes of ships built in 2012 The country is anchored by South Korean Hanjin
and Japans Tsuneishi shipbuilders The country has shipyards in Subic and Cebu
TRANL15371 33
Europe
For several decades European shipyards have been facing strong global competition from especially
Asian enterprises (Japanese yards in the 1950s and 60s Koreans from the 1970s and 80s and Chinese
since the 1990s) In Europe this has led to an almost complete exit from the mass production segments
of tankers bulkers and containerships Response of the EU industry has been to focus on the higher
value more complex ship types such as ferries and passenger ships non-cargo vessels and general
cargo ships In addition only limited numbers of vessels of the same type are being built (in contrast
with bulk vessels which are mass produced) Europe has a 77 percent market share in building
passenger vessels (including both cruise ships as well as ferries) and a 17 percent share in the
construction of non-cargo vessels (Ecorys 2012) These segments make up a relatively small share of
the world orderbook (in CGT) However in value they represent a much higher share due to their
relatively sophisticated characteristics The position of the European shipbuilding industry in the
manufacturing of specialised innovative vessels is still strong At the same time European equipment
manufacturers have acquired a leading role in quality products especially in complex high value
equipment components
Figure 15 World orderbook and CESA orderbook by ship type in 2010 (CGT x 1000) (Source Ecorys 2012)
Regarding the marine equipment sector the European industry is renowned for propulsion cargo
handling communication automation environmental and security systems This equipment is not only
destined for complex European-built ships but also exported to Asian yards whether or not requested
by their clients (Ecorys 2012)
Compared to the ship construction sector the marine equipment segment is highly heterogeneous and
consists of companies that are often also active in other business areas (ie automotive or aircraft
industry) A study by (BALance 2014) found that the European marine equipment industryrsquos
TRANL15371 34
competitiveness lies in a strong market position and technological leadership at least for globally active
European marine supply companies who build their position on a strong infrastructure and co-operative
partners skill of their employees and close relationship with their customer base Conversely identified
weaknesses are the cost level in Europe and the heterogeneous structure of the industry with many
SMEs which hinder in some cases attempts to follow the markets by globalisation strategies
Turkey
Shipbuilding in Turkey has evolved from an old traditional activity in Anatolia to an internationally
recognised industry especially since the early 1990s The industry has modern shipyards that can build
ships yachts mega-yachts and sailing boats as well as carrying out extensive repair and conversion
works Turkeyrsquos shipyards are mainly located in the Marmara Region namely Tuzla Yalova and İzmit
which have developed into dynamic shipbuilding centres Also in recent years the emerging Black Sea
and Mediterranean Regions have increasingly attracted shipyard investments
In the last decade in parallel with developments in the global market Turkish shipbuilding experienced
a several-fold increase in its shipbuilding and export capacity including a significant product
diversification According to order books this resulted in Turkey being regularly placed in the top ten
countries on the basis of its deadweight (dwt) production and in the top five countries by the number
of ships
In recent years Turkey has increasingly tapped into niche markets which in turn has led to a growing
participation by Turkish shipyards in the international trade in new ships In parallel there has also
been strong growth in the marine equipment manufacturing sector which could increasingly also tap
the export market These developments reflect in part the strategic location of the yards the
experienced workforce the quality of production and Turkeyrsquos significant role as a political cultural and
economic bridge between Europe and Central Asian and Middle Eastern economies (OECD 2011)
ECOFYS Netherlands BV | Kanaalweg 15G | 3526 KL Utrecht| T +31 (0)30 662-3300 | F +31 (0)30 662-3301 | E infoecofyscom | I wwwecofyscom
ECOFYS Netherlands BV
Kanaalweg 15G
3526 KL Utrecht
T +31 (0) 30 662-3300
F +31 (0) 30 662-3301
E infoecofyscom
I wwwecofyscom
HOW TO OBTAIN EU PUBLICATIONS
Free publications
bull one copy
via EU Bookshop (httpbookshopeuropaeu)
bull more than one copy or postersmaps
from the European Unionrsquos representations (httpeceuropaeurepresent_enhtm)
from the delegations in non-EU countries
(httpeeaseuropaeudelegationsindex_enhtm)
by contacting the Europe Direct service (httpeuropaeueuropedirectindex_enhtm)
or calling 00 800 6 7 8 9 10 11 (freephone number from anywhere in the EU) () () The information given is free as are most calls (though some operators phone boxes or hotels may charge you)
Priced publications
bull via EU Bookshop (httpbookshopeuropaeu)
Priced subscriptions
bull via one of the sales agents of the Publications Office of the European Union
(httppublicationseuropaeuothersagentsindex_enhtm)
doi 102834880780
ML-0
1-1
5-4
39-E
N-N
[Ca
talo
gu
e n
um
be
r]
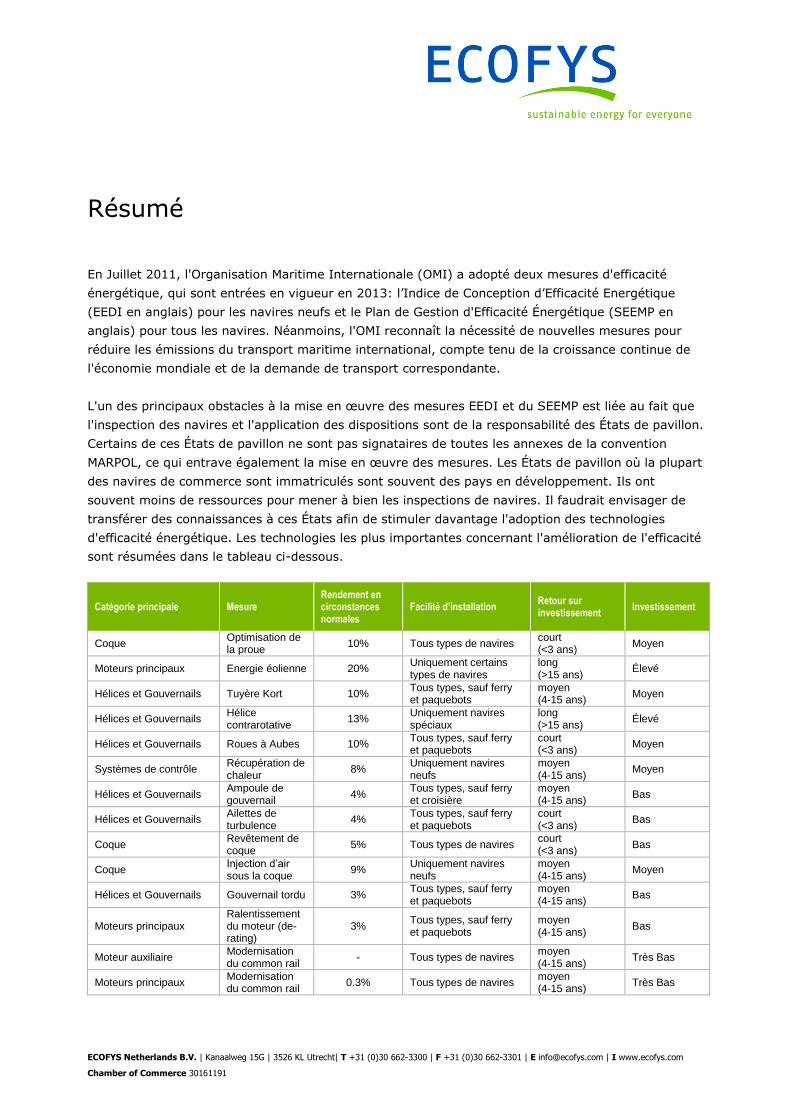
ECOFYS Netherlands BV | Kanaalweg 15G | 3526 KL Utrecht| T +31 (0)30 662-3300 | F +31 (0)30 662-3301 | E infoecofyscom | I wwwecofyscom
Chamber of Commerce 30161191
Reacutesumeacute
En Juillet 2011 lOrganisation Maritime Internationale (OMI) a adopteacute deux mesures defficaciteacute
eacutenergeacutetique qui sont entreacutees en vigueur en 2013 lrsquoIndice de Conception drsquoEfficaciteacute Energeacutetique
(EEDI en anglais) pour les navires neufs et le Plan de Gestion dEfficaciteacute Eacutenergeacutetique (SEEMP en
anglais) pour tous les navires Neacuteanmoins lOMI reconnaicirct la neacutecessiteacute de nouvelles mesures pour
reacuteduire les eacutemissions du transport maritime international compte tenu de la croissance continue de
leacuteconomie mondiale et de la demande de transport correspondante
Lun des principaux obstacles agrave la mise en œuvre des mesures EEDI et du SEEMP est lieacutee au fait que
linspection des navires et lapplication des dispositions sont de la responsabiliteacute des Eacutetats de pavillon
Certains de ces Eacutetats de pavillon ne sont pas signataires de toutes les annexes de la convention
MARPOL ce qui entrave eacutegalement la mise en œuvre des mesures Les Eacutetats de pavillon ougrave la plupart
des navires de commerce sont immatriculeacutes sont souvent des pays en deacuteveloppement Ils ont
souvent moins de ressources pour mener agrave bien les inspections de navires Il faudrait envisager de
transfeacuterer des connaissances agrave ces Eacutetats afin de stimuler davantage ladoption des technologies
defficaciteacute eacutenergeacutetique Les technologies les plus importantes concernant lameacutelioration de lefficaciteacute
sont reacutesumeacutees dans le tableau ci-dessous
Cateacutegorie principale Mesure Rendement en circonstances normales
Faciliteacute drsquoinstallation Retour sur investissement
Investissement
Coque Optimisation de la proue
10 Tous types de navires court (lt3 ans)
Moyen
Moteurs principaux Energie eacuteolienne 20 Uniquement certains types de navires
long (gt15 ans)
Eacuteleveacute
Heacutelices et Gouvernails Tuyegravere Kort 10 Tous types sauf ferry et paquebots
moyen (4-15 ans)
Moyen
Heacutelices et Gouvernails Heacutelice contrarotative
13 Uniquement navires speacuteciaux
long (gt15 ans)
Eacuteleveacute
Heacutelices et Gouvernails Roues agrave Aubes 10 Tous types sauf ferry et paquebots
court (lt3 ans)
Moyen
Systegravemes de controcircle Reacutecupeacuteration de chaleur
8 Uniquement navires neufs
moyen (4-15 ans)
Moyen
Heacutelices et Gouvernails Ampoule de gouvernail
4 Tous types sauf ferry et croisiegravere
moyen (4-15 ans)
Bas
Heacutelices et Gouvernails Ailettes de turbulence
4 Tous types sauf ferry et paquebots
court (lt3 ans)
Bas
Coque Revecirctement de coque
5 Tous types de navires court (lt3 ans)
Bas
Coque Injection drsquoair sous la coque
9 Uniquement navires neufs
moyen (4-15 ans)
Moyen
Heacutelices et Gouvernails Gouvernail tordu 3 Tous types sauf ferry et paquebots
moyen (4-15 ans)
Bas
Moteurs principaux Ralentissement du moteur (de-rating)
3 Tous types sauf ferry et paquebots
moyen (4-15 ans)
Bas
Moteur auxiliaire Modernisation du common rail
- Tous types de navires moyen (4-15 ans)
Tregraves Bas
Moteurs principaux Modernisation du common rail
03 Tous types de navires moyen (4-15 ans)
Tregraves Bas
ECOFYS Netherlands BV | Kanaalweg 15G | 3526 KL Utrecht| T +31 (0)30 662-3300 | F +31 (0)30 662-3301 | E infoecofyscom | I wwwecofyscom
Chamber of Commerce 30161191
Cette recherche montre clairement que des technologies conventionnelles sont disponibles pour
reacutealiser des gains eacuteleveacutes defficaciteacute La mise en œuvre des mesures dont lrsquoinvestissement se
rentabilise en moins de 15 ans permet deacutejagrave deacuteconomiser 35 de carburant Des investissements
eacuteleveacutes comme les heacutelices contrarotatives et leacutenergie eacuteolienne (technologies expeacuterimentales)
permettraient des eacuteconomies drsquoeacutenergies les plus eacuteleveacutees (13-20) Les investissements de taille
moyenne rapportent des eacuteconomies de 5-10 et les investissements les plus faibles apportent
relativement peu drsquoeacuteconomies (lt5)
Lorsque les proprieacutetaires de navires nrsquoont pas la possibiliteacute de partager les investissements avec les
affreacuteteurs cela megravene agrave une discordance des inteacuterecircts un armateur peut investir le capital pour des
technologies deacuteconomie deacutenergie mais nen recevra pas les beacuteneacutefices Ceci est un problegraveme typique
pour les investissements avec un temps de reacutecupeacuteration eacuteleveacute agrave savoir leacutenergie eacuteolienne et les
heacutelices contra rotatives
Plusieurs faccedilons de surmonter les obstacles de transfert de connaissances sont preacutesenteacutees qui
peuvent ecirctre classeacutees de la forme suivante
Ateliers et formations
o Ateliers de renforcement de capaciteacute pour administrations nationales
o Ateliers reacutegionaux
Formations techniques
o Formations dans le calcul et veacuterification de lrsquoEEDI
o Deacuteveloppement de cours standardiseacutes
Plateforme en ligne
o Inventaire de technologies drsquoefficaciteacute eacutenergeacutetique
o Creacuteation de site internet avec informations pertinentes pour le public cible
o Ameacutelioration de lrsquoaccegraves aux informations et partage de connaissances
o Apport drsquoinformations veacuterifieacutees sur les eacuteconomies veacuteritablement reacutealiseacutees agrave travers un
programme de monitoring
Ce rapport fournit des estimations de coucircts pour chacune de ces options de renforcement de
capaciteacutes La plus coucircteuse serait un projet de renforcement des capaciteacutes qui prendrait en compte
tous les aspects semblable au projet GloBallast qui aide les pays en deacuteveloppement et leurs
industries maritimes avec la mise en œuvre des regraveglements internationaux sur la gestion des eaux de
ballast et la preacutevention des risques de transfert dorganismes aquatiques nuisibles Le budget total
pour GloBallast pour la peacuteriode 2008-2012 eacutetait de $ US 23 millions
ECOFYS Netherlands BV | Kanaalweg 15G | 3526 KL Utrecht| T +31 (0)30 662-3300 | F +31 (0)30 662-3301 | E infoecofyscom | I wwwecofyscom
Chamber of Commerce 30161191
Table of contents
1 Introduction 1
2 Relevant Stakeholders 2
Global Shipbuilding Nations 3
Flag States and their role in the implementation of MARPOL 3
Surveys 4
Punishments for failure to comply 5
Role of Port States 6
Cooperation between Port and Flag States 6
Ship owners and charterers 6
Conclusions 7
3 Energy Efficiency Measures for Ships 9
Hull and superstructure 2
Bow optimisation 2
Hull coating 3
Air lubrication 3
Engines 4
Main engine de-rating 5
Common-rail upgrade (common-rail fuel injection) 5
Auxiliary engines and systems 6
Wind power 6
Control Systems Waste heat recovery 7
Propellers and Rudders 8
Ducted propeller (Kort Nozzle) 8
Contra-rotating propellers (CRP) 9
Post swirl devises 10
Barriers to the transfer and uptake of energy efficiency technologies for ships and
possible measures to overcome them 15
Awareness Raising 17
Technology Concerns 19
Institutional Concerns 19
Commercial 21
Cost estimates 21
Workshops and training 21
Technical training 22
Online platform for inventory of energy efficiency technologies 22
Capacity building project 22
ECOFYS Netherlands BV | Kanaalweg 15G | 3526 KL Utrecht| T +31 (0)30 662-3300 | F +31 (0)30 662-3301 | E infoecofyscom | I wwwecofyscom
Chamber of Commerce 30161191
Conclusions 24
References 26
Appendix I - World fleet registered trading vessels 30
Appendix II - Most important shipbuilding countries 31
China 31
South Korea 32
Japan 32
The Philippines 32
Europe 33
Turkey 34
TRANL15371 1
1 Introduction
The negotiations within the International Maritime Organization (IMO) on enhancing the energy
efficiency of and reducing the greenhouse gas emissions from international shipping are a top-priority
for the European Commission in view of the European Unions preference for a global measure to
address greenhouse gas emissions from shipping
In July 2011 the IMO adopted two energy efficiency measures which entered into force in 2013 the
Energy Efficiency Design Index (EEDI) for new ships and the Ship Energy Efficiency Managements Plan
(SEEMP) for all ships1 Nevertheless the IMO recognises the need for further action to reduce emissions
from international shipping in view of the continued expected growth of the world economy and
associated transport demand Consequently the IMO began working on further measures to increase
the energy efficiency of international shipping including the development of a global data collection
system as a first step in April 2014
At the time of the adoption of the EEDI and the SEEMP it was agreed to complement them with a
Resolution on the promotion of technical cooperation and transfer of technology relating to the
improvement of energy efficiency of ships The Resolution was intended to provide a framework for the
promotion and facilitation of capacity building technical cooperation and technology transfer to
support in particular in developing countries the implementation of the EEDI and the SEEMP The
Resolution was adopted in 2013 and an expert group tasked to ensure the Resolutions effective
implementation was established in April 2014
The EU is actively contributing to the work of the IMO Ad Hoc Expert Working Group on Facilitation of
Transfer of Technology for Ships (AHEWG-TT) to ensure effective implementation of the Resolution and
incidentally advance the related IMO negotiations on further measures to increase the energy efficiency
of international shipping
The goal of this project is to contribute to the work of the AHEWG-TT and to further stimulate the
effective implementation of the International Maritime Organization (IMO) Resolution on the promotion
of technical cooperation and transfer of technology2
To achieve this goal this study provides a short overview of relevant stakeholders and existing
technologies which could improve the energy efficiency of ships Furthermore barriers to transfer and
uptake of energy efficient technologies are categorised and analysed and possible measures to
overcome these barriers are being proposed
1 Amendments to MARPOL Annex VI (prevention of air pollution from ships) 2 httpwwwimoorgOurWorkEnvironmentPollutionPreventionAirPollutionPagesTechnical-Co-operationaspx
TRANL15371 2
2 Relevant Stakeholders
The IMO resolution on the promotion of technical cooperation and transfer of technology (regulation
23) is intended to support states which request technical assistance Three main categories of
stakeholders were identified that can be considered of relevance
(1) Shipbuilding nations where the ships are produced
(2) Flag States (where the ships are registered) and Port States who are allowed to inspect foreign
ships compliance to international regulations
(3) Ship owners and ship charterers who are responsible for the design and use of the ships
TRANL15371 3
Global Shipbuilding Nations
Shipbuilding nations typically provide incentives for the shipbuilding industry in their country Therefore
they play a role in the transfer of technologies to their industry
In 2012 some 3655 ships were built worldwide The largest share of the tonnage was built in China
South Korea and Japan (Figure 1)
Figure 1 Ship building in 1000 gross tons Source (Statista 2015) quoting IHS and Shipbuilders Association of
Japan
The worldrsquos leading shipyards include South Korearsquos Hyundai Heavy Industries Japanrsquos Mitsubishi
Heavy Industries and Chinarsquos Shanghai Waigaoqiao (Statista 2015) China South Korea and Japan
together are responsible for building about 90 of the ships in gross tons
Flag States and their role in the implementation of MARPOL
Flag States have the responsibility for enforcing the rules set out under MARPOL Every Flag State has
the duty to ensure that its vessels fully comply with the applicable articles of MARPOL3
3 MARPOL Regulation 6
TRANL15371 4
At the end of 2013 about one-fifth of merchant vessels were registered in Flag State Panama 12 in
Flag State Liberia and 8 in the Flag State Marshall Islands (Figure 2 and (UK DfT 2014)) Therefore
already 40 of the world fleet are registered in these three Flag States
Figure 2 World fleet registered trading vessels of 100 gross tons and over 2009-2013 Source UK DfT 2014
Under MARPOL these parties (Flag States) can enforce ship-owners and operators obligations in three
main ways
- by surveyinspection of vessels to ensure that they meet minimum requirements4
- by monitoring vessel compliance with oil discharge requirements5 (not relevant for energy
efficiency) and
- by implementing punishments for failure to comply with requirements6
Surveys
MARPOL Annex VI contains a set of requirements for survey and issuance of International Air
Pollution Prevention Certificate (IAPP) and regulations regarding
Ozone depleting substances from refrigerating plants and firefighting equipment
Nitrogen Oxides (NOx) from diesel engines
Sulphur Oxides (SOx) from diesel engines
4 MARPOL article 5 5 MARPOL Annex I Chapter 4 Regulation 31 6 MARPOL article 4
TRANL15371 5
Volatile Organic Compound Emissions from cargo tanks of oil tankers
Shipboard Incineration
Fuel oil quality
Flag States must conduct an initial survey before a new ship is put into service and before the IAPP is
issued for the first time a renewal survey at intervals specified by the Administration but not exceeding
five years an intermediate survey within three months before or after the second anniversary date or
within three months before or after the third anniversary date of the certificate an annual survey within
three months before or after each anniversary date of the certificate and after prescribed repairs an
additional survey7
For the EEDI and the SEEMP a new certificate the International Energy Efficiency Certificate (IEEC)
was established and must be kept available on board for inspectionssurveys The IEEC Certificate will
be issued for new build ships upon the initial survey before the ship is put into service and for existing
ships of 400 gross tonnage and above The IEE Certificate will be issued once for each ship and is valid
throughout the lifetime of the ship (except flag change major conversion or ship going out of service)
There are no follow-up surveys on the IEEC Certificate
The IMO has created guidelines for surveys that Flag States should follow The energy efficiency related
one is
2014 Guidelines on survey and certification of the Energy Efficiency Design Index (EEDI)
(resolution MEPC254(67))
A Flag State cannot allow a vessel that does not pass inspection to sail until it complies with MARPOL8
An International Energy Efficiency Certificate in accordance with the provisions of regulation 54 to
any ship of 400 gross tonnage and above is needed before that ship may engage in voyages to ports
or offshore terminals under the jurisdiction of other Parties
Punishments for failure to comply
In case of failure to comply the authority carrying out the inspection may detain the ship Article 7 of
MARPOL ensures that unduly delay or detain will be avoided where possible or compensated
A Flag State is obliged to investigate an incident upon receipt of notification or evidence that one of its
vessels has breached MARPOL If the investigations reveal that a breach has occurred the Flag State
has further obligations to initiate legal proceedings against the vessel and report back to the reporting
state on actions taken9
7 MARPOL Annex VI Chapter 2 Regulation 5 8 MARPOL Annex VI Chapter 2 Regulation 6 9 MARPOL article 6
TRANL15371 6
Also other parties are allowed to inspect vessels under MARPOL Article 6 when violations are detected
or for regular inspections A Party may also inspect a ship to which the present Convention applies
when it enters the ports or off-shore terminals under its jurisdiction if a request for an investigation is
received from any Party together with sufficient evidence that the ship has discharged harmful
substances or effluents containing such substances in any place
Role of Port States
Under ldquoPort State Controlrdquo arrangements Port States also have the authority to conduct vessel surveys
on ships which visit their ports and to detain those ships that fall below MARPOL requirements In
relation to MARPOL Annex VI chapter 4 any port state inspection shall be limited to verifying when
appropriate that there is a valid International Energy Efficiency Certificate on board10
Cooperation between Port and Flag States
Under MARPOL parties are required to co-operate in detecting vessel violations and are required to
use all practical measures to detect and monitor violations If a State has evidence of a violation they
are obligated to forward this evidence to the vesselrsquos Flag State
All ships flagged under countries that are signatories to MARPOL are subject to its requirements
regardless of where they sail and member nations are responsible for vessels registered under their
respective nationalities
When incidents occur outside the countrys jurisdiction or jurisdiction cannot be determined the
country refers cases to Flag States in accordance with MARPOL Some States are not happy with the
lack of response from Flag States United States experience of Flag States not responding has led to
new policy which would take direct enforcement action against vessels for MARPOL V violations
occurring between 3 and 200 nautical miles from the United States rather than referring such violations
to the flag states (Dillingham 2000)
Ship owners and charterers
A ship owner is the owner of a commercial ship A ship owner is someone who equips and exploits a
ship usually for delivering cargo at a certain freight rate The ship owner determines the specifications
of the ship and its energy efficiency measures but the benefits of low fuel consumption are not always
theirs when the ship is chartered to someone else
Depending on the type of ship and the type of charter normally a standard contract form called a
charter party is used to record the exact rate duration and terms agreed between the ship owner and
the charterer
10 MARPOL Annex VI Regulation 10
TRANL15371 7
A charterer may be a party without a cargo who takes a vessel on charter for a specified period from
the owner and then trades the ship to carry cargoes at a profit above the hire rate In some cases a
charterer may own cargo and employ a shipbroker to find a ship to deliver the cargo for a certain price
Two main types of charter can be distinguished time charter and voyage charter In a voyage charter
the owner is still responsible for the port fuel and crew costs In a time charter the charterer selects
the ports and directs the vessel where to go The charterer pays for all fuel the vessel consumes port
charges commissions and a daily hire to the owner of the vessel
When there are too few opportunities to share investment with charterers this leads to a split incentive
a ship owner may invest the up-front capital to put in energy-efficient technology but doesnrsquot then
recoup the costs from fuel savings as they charter their ships out as this goes to the charterers This
problem is particularly apparent for short-term time charters11
Conclusions
Regarding energy efficiency the work of the AHEWG-TT12 has shown that the main shipbuilding nations
all have access to the necessary technologies provided there is demand for them It has also been
noted that there is no need for transfers of intellectual property rights13
One of the major barriers to the effective implementation of the EEDI and the SEEMP is the heavy
reliance it places on Flag States for inspection of vessels and enforcement of provisions During the
1970rsquos ships were being reflagged from high tax and high regulation countries such as the United
States and the United Kingdom to countries offering Flags of Convenience (lsquoFOCrsquo) Under FOCs ship-
owners pay less tax to the relevant Flag State and are able to evade the majority of the environmental
and construction standards set out under MARPOL (Leddy 2012) The main reason for that is that
several Flag States are not signatories to all MARPOL Annexes (eg as of 20142015 the Bahamian
Bolivian Cambodian North Korean Georgian Honduran Lebanese and Sri Lankan flags of
convenience had not ratified all MARPOL treaty annexes III-VI14 15)
Many FOCs are developing nations that do not have the resources to enforce investigate or prosecute
breaches by their flagged vessels (Aqorau 2000) As of 2014 55 of merchant ships are flagged by
FOC and 40 of ships are flagged by FOCdeveloping countries MARPOL only provides guidelines for
Flag States to follow when surveying vessels under regulation 6 but none of these guidelines are
mandatory Conversely Port States which are developed are better equipped to bear the cost of
inspection investigation enforcement and prosecution costs However in relation to EEDI and the
11 httpssi2040orgwhat-we-dowork-streamsfinance 12 MEPC 6831 Progress report of the Ad Hoc Expert Working Group on Facilitation of Transfer of Technology for Ships 13 Submission of the United States on Task 3 of the Ad Hoc Expert Working Group on Facilitation of Transfer of Technology for Ships Jan
2015 14 wwwics-shippingorgdocsflag-state-performance-table 15 httpwwwimoorgAboutConventionsStatusOfConventionsPagesDefaultaspx status of conventions
TRANL15371 8
SEEMP port state control is limited to verifying when appropriate that there is a valid International
Energy Efficiency Certificate on board
We therefore conclude that there needs to be a focus on enabling Flag States and Port States that lack
the resourcescapacity to enforce the EEDI and the SEEMP in order to further stimulate the adoption
of energy efficiency technologies Also attention should be paid to overcoming the barrier of split
incentives ie where the benefits of energy efficiency measures are not transferred from the charterer
to the investor (owner)
TRANL15371 9
3 Energy Efficiency Measures for Ships
In order to understand the important energy efficiency measures that can help improve energy
efficiency from shipping it is interesting to see the split between new-built ships and existing fleet In
2012 some 3655 merchant ships were delivered worldwide about 6 of the worldrsquos merchant fleet
of about 60000 The average age of the merchant fleet is 19 years Therefore measures for both new
ships and retrofits for old ships are important for improving the energy efficiency in the next decades
If only the new ships would be targeted only 50 of the fleet would be more efficient in the next
decades while there are many retrofit measures available The total fleet can be broken down to about
4000 passenger ships just under 14000 tankers and about 37000 dry cargo ships including about
5000 container ships (Statista 2015)
In order to identify the most interesting energy efficiency measures for ships we used the information
from several reports to develop a long-list Many measures improve the efficiency in the order of up to
5 Here we would like to focus on measures that result in high savings that can be applied to many
ship types and preferably also to existing ships The resulting short-list is presented in the next table
We used the main categories identified by AHEWG-TT for structuring the measures
The main categories defined by AHEWG-TT are
1 Hull
2 Main Engine
3 Auxiliary engines
4 Propellers and rudders and
5 Control systems
Since the auxiliary engines typically consume only a fraction of the energy that goes to the main
engines their energy efficiency measure results do not show in the short-list below The measures are
worked out in more detail in the paragraphs below The main engine and auxiliary engine improvements
are covered in the same paragraph
The common rail upgrade is a simple measure that can be easily applied to all ships even when the
ship is not in the dry-dock The details are available in the paragraph about engines
From the list it is clear that conventional technology is available to achieve high efficiency gains If the
maximum gain per category is added up (for all but ferry and cruise) this would mean a total efficiency
improvement of 35 even without taking two experimental technologies with potentially high efficiency
gains into account (wind power and air lubrication) Note that some technologies are not applicable to
all ships
In order to find possible financial barriers the investments are rated from ldquovery lowrdquo to ldquohighrdquo relatively
to the size of the ships The same measure on a larger ship is obviously more expensive
TRANL15371 1
Table 1 Inventoryranking of energy efficiency measures
Main category
Measure Estimated efficiency (range)
Efficiency at average circumstances
Ease of installation
Payback time
Investment Implementation References
Hull Bow optimisation
25-20 10 all ship types
short (lt3 years)
Medium conventional technology
(IMO 2009 IMO 2011 Crist 2009 Hochkirch und Bertram not dated)
Main Engines
Wind power 5-44 20 only special ship types
long (gt15 years)
High experimental technology
(IMO 2011 IMO 2009 Crist 2009 ICCT 2011 Brannigan et al 2009 Allenstroumlm 2013)
Propellers and Rudders
Ducted propeller
1-20 10
all ship types except ferry and cruises
medium (4-15 years)
Medium conventional technology
(IMO 2011 IMO 2009 Crist 2009 ICCT 2011)
Propellers and Rudders
Contra-rotating propellers
6-20 13 only special ship types
long (gt15 years)
High conventional technology
(IMO 2011 IMO 2009 Crist 2009 WAumlRTSILAuml 2009 Shuto 2010)
Propellers and Rudders
Wheels 10 10
all ship types except ferry and cruises
short (lt3 years)
Medium conventional technology
(IMO 2009 Schneekluth und Bertram 1998 Brannigan et al 2009)
Control Systems
Waste heat recovery
6-10 8 new build only
medium (4-15 years)
Medium conventional technology
(IMO 2011 IMO 2009 Crist 2009 WAumlRTSILAuml 2007 ICCT 2011)
Propellers and Rudders
Rudder bulb 2-5 4
all ship types except ferry and cruises
medium (4-15 years)
Low conventional technology
(IMO 2011 IMO 2009 Nielsen et al not dated Crist 2009 ICCT 2011)
Propellers and Rudders
Post swirl fins
2-5 4
all ship types except ferry and cruises
short (lt3 years)
Low conventional technology
(IMO 2009 MOL 2011 Hansen Dinham-
Peren und Nojiri 2011 Nielsen et al not
dated)
Hull Hull coating 1-9 5 all ship types
short (lt3 years)
Low conventional technology
(IMO 2011 IMO 2009 ICCT 2011 Voorham 2013 Crist 2009)
Hull Air lubrication
5-15 9 new build only
medium (4-15 years)
Medium experimental technology
(IMO 2011 IMO 2009 Crist 2009 DK Group 2015 CNSS 2015 ICCT 2011)
Propellers and Rudders
Twisted rudder
2-4 3
all ship types except ferry and cruises
medium (4-15 years)
Low conventional technology
(IMO 2009 Schulze 2007 Nakashima 2015 Becker Marine System 2015 Nielsen et al not dated Hollenbach und Friesch not dated Rolls-Royce 2014)
Main Engines
Main engine de-rating
2-4 3
all ship types except ferry and cruises
medium (4-15 years)
Low conventional technology
(IMO 2011 IMO 2009 Crist 2009 Wettstein und Brown 2008 DNV GL 2015)
Auxiliary engines
Common rail upgrade
- - all ship types
medium (4-15 years)
Very Low conventional technology
(DNV GL 2015) (ICCT 2011) (IMO 2009)
Main Engines
Common rail upgrade
01-05-
03 all ship types
medium (4-15 years)
Very low conventional technology
(IMO 2009 Pakarinen 2007 ICCT 2011 Crist 2009)
TRANL15371 2
Hull and superstructure
In general the optimisation of hull and superstructure focuses on minimising the resistance by reducing
the wave resistance and friction between water and hull It is important to recognise which type of
vessel is to be optimised The reduced frictional resistance increases energy performance of the vessel
particularly at low speeds Operability and performances of the ship must be considered in detail The
improvements measures are generally applied at new-built ships but also applicable to retrofitting
Bow optimisation
The different bow optimisations can improve the water flow around the hull and reduce the wave-added
resistance for large vessels with high block coefficient operating within commercial speed ranges The
average energy reduction potential ranges from 25-20 on average 10 (Crist 2009 IMO 2011
Voorham 2013)
Figure 3 Left The green line characterises the ordinary bow wave of the hull The blue line characterises the wave
formed by the bulb The red line is the sum of these two The altitude of the bow wave is noticeably reduced which
reduces the hull drag associated with the bow wave This improves fuel economy and increases range (Selenetrawlers
2015) Right Ordinary bulbous bow leadge bow and ax-bow shape (JSEA 2006)
The below-the-waterline extension of the bulbous bow (Figure 3) modifies the way the water flows
around the hull reducing drag and thus increasing speed range fuel efficiency and stability An altered
design is the ax-bow (Figure 3) The narrow designed bow slashes through the water in order to reduce
slamming and reduces the size of bow generated wave The propeller can act more efficient due to the
absence of slamming The ax-bow allows the ship to steer well to maintain speed and the engine to
save fuel (Crist 2009 IMO 2009) If the bulbous bow is modified during a regular docking period the
investment is estimated to have short payback of about 1-3 years It is most promising for container
vessels (DNV GL 2015 Hochkirch und Bertram not dated)
Barriers The bow optimisation (as retrofit) needs to be done in the dry dock Dry-docking is not
regularly happening for existing ships because it means that the ship cannot operate and economic
losses are suspected Another obstacle might arise due to restricted access to the original contractual
hull plans since shipyards are not always keen to provide detailed plans on their vessels to prevent
TRANL15371 3
imitation (Hochkirch und Bertram not dated DNV GL 2015) A major obstacle is the split incentive
between ship owner and operator Ship owners are responsible for investing in these technologies and
ship operators are those who pay for the fuel consumption and benefit from such technologies (ICCT
2011)
Technical maturity The technique is available on the market and is effective Only conventional
material is needed and redesign can be done in a few weeks16
Applicability Applicable to all ship types but most efficient for ships with a high block coefficient like
tankers and bulk carriers since the reduction of the wave-added resistance is most impacting (IMO
2009)
Hull coating
Hull coatings (Figure 4) can lower frictional resistance and limit fouling by aquatic organisms It can
save between 1-9 fuel consumption on average 5 (ICCT 2011 Voorham 2013 Crist 2009)
Figure 4 Example of hull coating (ECOSPEED 2015)
One way of lowering the frictional resistance is to improve the smoothness of a hull by means of
coatings that reduce fouling The costs are lifetime cost reduction and have to be recur every five years
to be able to gain the fuel benefit
Barriers A new application is typically necessary during each dry-docking The self-polishing coating
must be renewed after a 3-5 years period (IMO 2009) A major obstacle is the divided interest between
ship owner and operator Ship owners are in charge for investing in these technologies and ship
operators are those who pay for the fuel consumption and profit from such technologies (ICCT 2011)
Technical maturity Coating techniques are available on the market and roughly 5 of newly painted
ships are painted with one of the advanced coating systems presently available (IMO 2011 ICCT 2011)
The payback time is short (ICCT 2011) or 0-2 years according to others17
Applicability The technology is applicable to all vessels
Air lubrication
The air lubrication technique creates a layer of bubbles underneath an already streamlined hull in order
to further reduce friction An automation system regulates the compressorsblowers depending on
16 httpwwwship-efficiencyorgonTEAMpdf14-Ship20efficiency20seminar20-20CMA20CGM-
20HydrOcean20120CMA20pdf 17 httpswwwdnvglcommaritimeenergy-efficiencyefficiency-finderhtml
TRANL15371 4
speed The blower keeps holes filled with air and required pressure A thin layer of bubbles trailing
behind of each cavity merge into single large ldquoair layerrdquo for the whole flat bottom part of the hull and
reduces the friction (Figure 5) Depending on the ship type the estimate fuel efficiency ranges between
5-15 (on average 9) where tankers and bulkers can reduce more (10-15 on average 125) in
comparison to container vessels (5-9 on average 7) (IMO 2009 DK Group 2015 CNSS 2015 ICCT
2011 Voorham 2013)18
Figure 5 Schematic view of air lubrication (DK Group 2015)
Barriers Large capital investment requirements with split incentive The vessel owners are
accountable for investing in these technologies whereas vessel operators recompense for the fuel
consumption and benefit from such technologies (ICCT 2011)
Technical maturity The technology is available on the market but still in a pilot phase Sea trials
have been performed with small demonstration ships There are no vessels operating commercially
that currently use this technique Specifications about the payback time vary from short to medium
(Silberschmidt 2014 Skinner 2009)
Applicability The original technology would be likely be applied to new-built ships with at least a
partly flat bottom and a minimum length of 225 metres since the compressor may have technical
problems maintaining air cavities for deep draft ships (IMO 2011 CNSS 2015) Air lubrication can be
used for retrofitting as well (CNSS 2015)
Engines
Speed reductions on existing vessels provide opportunities for engine optimisation on low power
(321) Similar measures as de-rating for the main engines that could be implemented are cylinder
cut-out and new torsional vibration calculation (IMO 2009)
18 It has to be noted that the extra fuel use caused by the system itself should also be taken into account
TRANL15371 5
Another propulsion supportive measure with a high potential measure is wind power This is also
explained in more detail below In order to also provide a measure with a lower improvement potential
per ship but simple and applicable to all ships we describe the common rail system for fuel injection
Main engine de-rating
Slow steaming vessels are known as one of the most effective energy saving measure The potential
comes mainly from the operational behaviour side From the technical side the specific fuel oil
consumption will decline when a ship is no longer operated at its design speed
The design speed can be reduced by de-rating the main engine (IMO 2011 IMO 2009) Reduction of
power combined with injection timing advanced to restore peak combustion pressure can achieve a
certain gain in shaft efficiency Fuel efficiency can be improved by 2-4 when de-rating is performed
for loads lower than the maximum design load (Wettstein und Brown 2008 Crist 2009) on average
3 energy efficiency potential (Crist 2009) Operational costs would be lower mainly due to fuel
savings (DNV GL 2015 Crist 2009 Wettstein und Brown 2008)
Barriers A slower vessel will have lower incomes as it is not capable to perform as much transport
load per unit of time as a faster vessel De-rating the engine is usually done when it is clear that the
ship will become a slower steaming ship There is a split incentive between vessel owners who are
responsible for investing in these technologies and vessel operators who are those who compensate
for the fuel consumption and benefit from such technologies (ICCT 2011)
Technical maturity This technique has been proven as successful particularly on older engines
which are normally built with a low compression ratio and thereby have a significant potential to
improve their efficiency (IMO 2009) De-rating measures have a low to medium payback time (Crist
2009 DNV GL 2015)
Applicability The technologies are available on the market It is applicable to all vessels (DNV GL
2015)
Common-rail upgrade (common-rail fuel injection)
Engines with common-rail fuel injection handle low-load working modes much better (IMO 2009) A
common-rail fuel injection is technique of injecting fuel into an engine cylinder under total control and
thereby achieving optimal combustion Common-rail allows the start and duration of injection
independent of the position of the pistons in that way permitting an operationally optimised injection
per stroke In a normal diesel engine fuel is injected at a static rate by a pump and common practice
is to optimise this pump to run at an optimal setting for the ideal injection time (Pakarinen 2007) The
energy efficiency potential is estimated between 01-05 on average 03 (ICCT 2011 IMO 2009)
Barriers Additional electronics can also introduce possibilities for failures However recent
advancements have increased the systems popularity19 There is a split incentive between vessel
19 httpwwwmarineinsightcommarinean-overview-of-common-rail-system-in-marine-engines
TRANL15371 6
owners who are responsible for investing in these technologies and vessel operators who are those
who compensate for the fuel consumption and benefit from such technologies (ICCT 2011)
Technical maturity This measure is available on the market (ICCT 2011) Payback time is short to
medium with an average of 5 years (IMO 2009 Crist 2009)
Applicability This measure is applicable to new and retrofit vessels It is applicable for tanker- bulk-
container- and Roro-ships (Crist 2009)
Auxiliary engines and systems
Based on our own estimation auxiliary engines improvement are not bringing gt2-4 energy savings
because auxiliary engines consume much less fuel than the main engine Similar measures as de-rating
for the main engines and common rail upgrade could be implemented for the auxiliary engine
Other options for improving auxiliary systems are speed control of pumps and fans control strategies
of cooling water systems room ventilation redesign of piping and instruments advanced computation
of airgas temperature distribution with reduced storage ventilation and with optimised ventilation
systems (DNV GL 2015)
Barriers There is a split incentive between vessel owners who are responsible for investing in these
technologies and vessel operators who are those who compensate for the fuel consumption and benefit
from such technologies (ICCT 2011)
Technical maturity This measure is available on the market (ICCT 2011) It is easy to apply and
uncomplicated in maintenance (DNV GL 2015) Payback time is short (DNV GL 2015)
Applicability This measure is applicable to all new and retrofit types of ships (DNV GL 2015)
Wind power
Wind power measures are available that can develop enough thrust to provide at least some supportive
propulsion Wind power can be utilised in various ways in shipping like traditional sails solid wing sails
Flettner-rotor and kits (see Figure 6) The techniques are currently used as supplementary power
(Brannigan et al 2009)
Figure 6 from left to right Kite (Cargill 2011) Flettner rotor (MIWB 2015) and solid sails (Wind Chellenger Project
HP 2015)
Solid wing sails are structured similar to aircraft wings which offer more thrust with less drag than
conventional sails Flettner rotors produce thrust from a rotating object in wind using the so-called
TRANL15371 7
Magnus effect The techniques have different characteristics with regards to how the thrust that is
produced relates to other factors such as wind strength wind angle wind stability and ship speed
(IMO 2009)
Towing kites vary from other concepts of wind power by having a small footprint during installation and
therefore being quite feasible to retrofit (Allenstroumlm 2013) Studies conducted at the Technical
University of Berlin indicated that the potential for sail energy has different prospective in the different
regions in the world Best scenarios exist in North Atlantic and North Pacific regions the South Pacific
seems a bit less potential The studies have shown that under normal circumstances the typical savings
using wind power may be 5 at 15 knots and up to 20 at 10 knots This study also revealed that
with optimal weather routing in the North Atlantic and given the best vessel with best sail type savings
can reach 15 percent at 15 knots and 44 at 10 knots (IMO 2009 Crist 2009) Nevertheless the
above figures should be considered indicative since practical experiences are limited Sail- and kite-
assisted power does seem to be a potential opportunity saving energy in the medium- and long-term
picture for shipping (IMO 2009) Christ estimates and average energy saving potential around 20
(2009)
Barriers There is a split incentive between vessel owners who are responsible for investing in these
technologies and vessel operators who are those who compensate for the fuel consumption and benefit
from such technologies (ICCT 2011) Although this technology can bring high energy savings the
investment is so high that there is not a short payback time
For solid wing sails complications could result in a need for masts to run down to the keel which can
be a bigger issue for retrofitting Additionally the presence of the mast and rigging could have significant
impacts on cargo handling (IMO 2009) Downside of the kite systems include the complex launch
recovery and control systems that are needed (IMO 2009)
Technical maturity This is still considered as experimental technology The technical barriers
identified above need to be tackled for this measure to be applied widely in the future Payback time is
estimated to be medium to long term (Allenstroumlm 2013 Crist 2009)
Applicability Wind power technologies are available and a number of cargo ships have been equipped
with wind engines to reduce demands from diesel engines (ICCT 2011) Kites can be used on ships
with a minimum length of 30m and works most energy efficient on ships with a typical speed not faster
than 16 knots Preferably tankers (crude oil product chemical LPG LNG other) and bulk carriers are
being considered as potential users due to this speed restriction (IMO 2011)
Control Systems Waste heat recovery
Waste heat recovery (WHR) technology can pass exhaust gases from a vessels engines through a heat
exchanger to generate steam for a turbine-driven generator The heat energy from the exhaust gas is
taken and transformed into electrical energy to reduce direct engine-fuel consumption for the
propulsion system or reduce auxiliary engine needs (ICCT 2011) Energy saving potential is estimated
between 6-10 on average 8 (Crist 2009 ICCT 2011)
TRANL15371 8
Figure 7 Efficiency of waste heat recover systems Sankey diagramme Even with high 50 efficiency of modern low-
speed engines there is still 50 of fuel input energy not being put to productive use The possibilities are illustrated
by this comparison of Sankey diagrammes for Waumlrtsilauml 12RT-flex96C engines without heat recovery (left) and with
high-efficiency waste heat recovery plant (right) showing in this case 114 gain in overall efficiency with WHR
(waste heat recovery) (WAumlRTSILAuml 2007)
Barriers Large capital investment requirements (around $5-6 million for a large container ship20) and
split incentive between ship owners and ship operators (ICCT 2011)
Technical maturity The technology is available on the market and has medium to long payback time
(WAumlRTSILAuml 2007 Crist 2009)
Applicability A WHR system is applied to vessels with a high production of waste heat and a high
intake of electricity WHR can be employed on ships with main engine average performance is higher
than 20000 kW and auxiliary engine average performance higher than 1000 kW This size
requirements limit the number of ships using this technology (IMO 2011) Generally it is applicable to
all ships types new and retrofit (Crist 2009)
Propellers and Rudders
Numerous devices have been designed for improving the energy consumption of vessels by recovering
as much as possible of this rotational energy in the flow from the propeller or to provide some pre-or
post-rotation of the in flow into and after the propeller to ensure best efficiency The most important
of these will be discussed in the following paragraphs (IMO 2009)
Ducted propeller (Kort Nozzle)
The accelerating ducted propeller consists of a screw propeller surrounded by a non-rotating duct
(nozzle) (Figure 8) Compared to the conventional propeller of the same diameter and thrust this
20 httpgcaptaincompower-exhaust-gas-paybacks-waste
TRANL15371 9
arrangement allows an increase inflow to the propeller improving the operating conditions around the
propeller and the ideal efficiency
Figure 8 Right photos of this Norwegian trawler (SetSail 2009)
The duct creates additional thrust load The potential for energy savings on relevant vessels range
between 1ndash20 (Crist 2009 IMO 2011 Barringhaus und Olds 1999 IMO 2009) whereupon 10 is a
good average value (IMO 2009 Crist 2009) The improvement of the combination of propeller and duct
overweigh negative effect of the increase water resistance caused by the duct
Barriers Since the duct has an optimal operational speed it does not work efficient at all speeds For
instance as drag increases with increasing speed eventually this will become larger than the added
thrust Therefore at high speeds ducts are typically not used (IMO 2009) The split incentive is a barrier
between ship owners (investor) and ship operators (gainer) as explained earlier (ICCT 2011)
Technical maturity Several standard designs are available on the market (IMO 2011) with a medium
payback time (IMO 2011)
Applicability Ducted propellers suits for vessels operating at high propeller loadings such as tankers
bulk carriers especially tugs and some offshore service ships The duct leads to increased friction but
at higher propeller loadings this is more than rewarded for by the positive effect of the combination of
propeller and duct (IMO 2009)
Contra-rotating propellers (CRP)
A rotating propeller induces a rotating motion in its backwash Normally this rotation energy of the
propeller gets lost The contra-rotating propeller is used in order to recover part of this energy (Figure
9) In a contra-rotating configuration two propellers are facing each other rotating in the opposite
direction with the aft propeller recuperating the turning energy in the wake from the forward propeller
(IMO 2011) To avoid complications with cavitation the aft propeller usually has a smaller diameter
than the front propeller Contra-rotating propeller arrangements involve a short shaft line and for that
reason primarily suitable for vessels with single-screw
TRANL15371 10
Figure 9 Left conventional propeller Right contra-rotating propeller The working principle is simple and effective
the power is split in a forward and aft propeller which through the different direction of rotation cancel out the
rotational energy losses behind the propeller (WAumlRTSILAuml 2009)
Potential savings of such measures are assessed to be in the order of 6ndash20 of the power consumption
with an average of 13 although higher figures may be presented by industry for specific cases Two
different full-scale measurements reported gains of 15 and 16 (IMO 2009 Crist 2009)
Barriers The mechanical installation of contra-rotating shafts is complicated and requires more
maintenance (IMO 2011) The split incentive between ship owners (investor) and ship operators
(gainer) is a barrier as explained above Although this technology can bring high energy savings the
investment is so high that there is not a short payback time
Technical maturity The technique is available on the market but problems with gearboxes for
contra-rotating propellers have been reported as well as operational problems with mounting (IMO
2009 IMO 2011) Payback time is reported as short (WAumlRTSILAuml 2009) but also as medium-long with
about ~15-20 years (Shuto 2010)
Applicability The technology is particularly beneficial for rather heavily loaded propellers as for
example very fast cargo vessels like Ro-Ro ships or for container ships (IMO 2011 Crist 2009) Contra-
rotating propellers need a short shaft line and hence mainly suited to single-screw ships (IMO 2011)
Contra-rotating propellers can be implemented as retrofit but it is more likely implemented in new
built ships due to the complicated mechanical installation (Crist 2009)
Post swirl devises
A number of different techniques belong to the post swirl category Several of them contain
modifications to the rudder or propeller (IMO 2009) Depending on vessel type and operational field
various power saving measures can be mounted to optimise water velocity distribution to the propeller
and to minimise slipstream losses due to swirl in the outflow of a propeller The most important among
these measures may be additional thrusting fins at the rudder twisted rudder (Figure 12) rudder-
bulb-systems with fins (Figure 13) and fins on the propeller fairwater also called post swirl fins or
boss cap fins (Figure 10)
Generally post swirl measures reported 1-8 energy efficiency (test models) Even 8-9 energy
efficiency from full-scale measurements for additional thrusting fins at the rudder Payback time is
estimated to be short to medium post swirl devices (DNV GL 2015 Crist 2009 ICCT 2011) Some of
CRP FOR BETTER PROPULSION EFFICIENCY
CONVENTIONAL PROPULSION
TRANL15371 11
the post swirl measure can be combined A good overview is given in Nielsen et al (Combined Kappel
propeller and rudder bulb system for improved propulsion efficiency not dated)
3431 Post swirl fins
The post swirl fins (Figure 10) can recover energy loss of propeller hub vortex in the propeller backward
flow and can lead to 3-5 energy saving on average 4 operating at the same speed (MOL 2011
Barringhaus und Olds 1999 Hansen Dinham-Peren und Nojiri 2011 ICCT 2011)
Figure 10 Example the post swirl fins or propeller boss cap fins (gcaptain 2012)
Barriers It is simple and straightforward measure requiring only the removal of the propeller boss
caps and replacement with the post swirl fins (no hull modification is needed) (Hansen Dinham-Peren
und Nojiri 2011 MOL 2011) However there is a split incentive between ship owners (investor) and
ship operators (gainer) as explained above
Technical maturity The technique is available on the market In 2013 post swirl fins were applied
to over 2500 ships worldwide (MOL 2011) Further advantages of the post swirl fins are reduction in
propeller torque reduced vibration in the stern and less underwater noise and reduced rudder erosion
(MOL 2011) A payback time of 6 months was estimated for 4 efficiency improvement at $600tonne
oil price (Hansen Dinham-Peren und Nojiri 2011) The investment is considered to be low21
Applicability The technique is effective for all screw propellers irrespective of the type or hull form
of the ship Has been tested on large-scale container vessels (MOL 2011 Hansen Dinham-Peren und
Nojiri 2011)
3432 Free rotating wheels
A vane wheel (Grim wheel) is a freely spinning propeller mounted behind the main smaller propeller
(see Figure 11 for example of use on retrofit Queen Elisabeth II in 1986) The vane wheel has a bigger
diameter than the main propeller and increases the propeller diameter The small propeller drives the
freely revolving vane wheel fitted on the wake The inner part of the vane wheel acts as a turbine and
the outer part as an ldquoadditionalrdquo propeller
21 httpgcaptaincompropeller-technology-ship-efficient
TRANL15371 12
Figure 11 Example for a grim vane wheel (Boat design 2007)
This leads to a substantial recovery of the rotational energy The energy saving potential is reported to
be 10 (Brannigan et al 2009) It is stated that the important benefit of the vane wheel is that a
smaller impulsion propeller can be installed which consumes less energy The vane wheel gives a
suitable energy improvement for cargo ships (IMO 2009 Schneekluth und Bertram 1998) and has short
payback time It is also stated that if there is room for a vane wheel in the aft there is also space for
an impulsion propeller of larger diameter leading about the same energy saving potential as the
combination of a small impulsion propeller and a vane wheel (IMO 2009)
Barriers A barrier is the split incentive between vessel owners who are responsible for investing in
these technologies and vessel operators who are those who compensate for the fuel consumption and
benefit from such technologies
Technical maturity Limited application Vane wheels are subjected to strong fluctuations in loading
Problems with the strength of the blades have been encountered frequently (for example the vane
wheels on the Queen Elisabeth II were short lived and not used after22)The payback time is estimated
to be short
Applicability The technique is effective for all screw propellers irrespective of the type or hull form
of the ship both for new and existing ships (Chen Reed und Kim 1989) Recommended for all ship
types except ferry and cruises because of their problem with strong fluctuations in loading as
mentioned above23 (IMO 2009)
3433 Twisted rudder
Rudders can play a significant role of extra frictional resistance Rudders are located in the backwash
of a propeller and rotational energy will act on the rudder Because of these effects the rudder gives
prospects of efficiency gains (Schulze 2007)
22 httpwwwroblightbodycomlinersqe-21987_Refitindexhtm 23 httpwwwroblightbodycomlinersqe-21987_Refitindexhtm
TRANL15371 13
Figure 12 Schematic capture of twisted rudder (Nakashima 2015)
Twisted leading edge technology provides multiple benefits for high-speed vessels compared to
conventional rudder designs Conventional rudders are located behind the propeller with the rudder
profile arranged symmetrically about the vertical rudder centre plane This arrangement does not
consider the fact that the propeller induces a strong rotational flow that strikes on the rudder blade
This consequences in areas of low force on the blade that induce cavitation and associated erosion
problems (Becker Marine System 2015 Schulze 2007)
The twisted rudder is horizontally twisted on the lower and upper side of the segment that is an
extension of the propeller shaft (Figure 12) This decreases cavitation rudder and improves
manoeuvrability of the vessel (Schulze 2007) Twisted rudder types lead to energy efficiency
improvements by approximately 2-4 on average 3 for large-size high-speed vessels (Hollenbach
und Friesch not dated Nakashima 2015)
Barriers Work needs to be done in the dry dock this is not regularly happening for existing ships
(Hochkirch und Bertram not dated) There is a split incentive between vessel owners who are
responsible for investing in these technologies and vessel operators who are those who compensate
for the fuel consumption and benefit from such technologies (ICCT 2011)
Technical maturity This rudder type is a commercially used technology and easy to apply if the ship
is in the dry dock (ICCT 2011)The payback time is estimated to be short to medium (Rolls-Royce 2014
Crist 2009)
Applicability Twisted rudder can used by container vessels reefers Ro-Pax ferries cruise ships and
naval vessels In South Korea this type of rudder is recognised as a standard rudder for large-size
high-speed container carriers (Nakashima 2015)
TRANL15371 14
3434 Rudder bulb
Figure 13 Example for a rudder bulb Kawasaki RBS-F rudder bulb systems with fins (Kawasaki 2015)
The rudder bulb brings smooth inflows from the propeller and can reduce the drag of the rudder The
rudder fins produce thrusts in the rotational flows generated by the propeller (Figure 13) Rudder bulb
measure can improve energy efficiency by 2-5 (Nielsen et al not dated Becker Marine System not
dated) on average 4 (Crist 2009)
Barriers The work needs to be done in the dry dock this is not regularly happening for existing ships
There is a split incentive between vessel owners who are responsible for investing in these technologies
and vessel operators who are those who compensate for the fuel consumption and benefit from such
technologies (ICCT 2011)
Technical maturity The technology is a commercially used technology and easy to apply while the
ship is in the dry dock (Kawasaki 2015) Payback time is estimated to be medium (Crist 2009)
Applicability For new and retrofit tanker- bulk- container- and Roro-ships with a propeller and
rudder (Crist 2009)
TRANL15371 15
Barriers to the transfer and uptake of energy
efficiency technologies for ships and possible
measures to overcome them
Although there are ways to reduce emissions (Chapter 3) and also drivers working towards the
implementation of such measures there are significant barriers to acting on cost-effective opportunities
in the maritime industry This is often referred to as barriers to energy or the energy efficiency gap
(Michele Acciaro 2013) (Sepideh Jafarzadeh 2014) (OECD 2014) Some barriers are shared with other
industries while others are unique to the maritime industry Furthermore many of these barriers are
not specific to the EEDI and the SEEMP but apply to any rule under MARPOL These barriers can exist
on both the supply and the demand side For example there could be barriers to the development and
implementation of measures that reduce CO2 emissions from ships and barriers to the expression of
demand for these measures (ECORYS 2012) Studies have however shown that there are relatively
few barriers related to the development of new technologies or access to related intellectual property
rights by the main shipbuilding nations and that the supply of measures exceeds the demand (ECORYS
2012) Existing studies on barriers to energy efficiency thus focus on what prevents the uptake of
available measures
This section presents an overview of the main barriers to the transfer and uptake of energy efficiency
technologies in the shipping industry and discusses potential ways of overcoming them
Preliminary assessments of technology transfer and financial needs by both workshop participants and
the IMO Ad Hoc Expert Working Group on Facilitation of Transfer of Technology for Ships (AHEWG-TT)
have suggested that the type of assistance needed by Port State and Flag State administrations will be
of a different nature than that required by shipbuilders and owners Our assessment above has shown
that the shipbuilding industry is expected to need less assistance than Port States and Flag States
In the next table we list a summary of the main barriers and the stakeholders concerned in the main
categories as identified by AHEWG-TT as well as the possible measures that could help overcome these
barriers The possible measures to overcome the barriers are further detailed in the sections below
Related costs are estimated in a separate section in order to minimise overlap
TRANL15371 16
Table 2 Summary of main barriers relevant stakeholders and possible measures to overcome them
Barrier Stakeholders Measures forward
Lack of awareness
(administrative and industry)
a MARPOL in general MARPOL Annex
VI EEDI and SEEMP in particular
b Available energy efficiency
technologies
Flag and Port
States
Ship owners
Capacity building
- Workshops
- Trainings
Model course for training
Inventory
Platform for information access and
sharing
Agreements between industry and
administrations
Technology concerns
a Lack of or limited technology supply
chain in some states
b Lack of technology base for RampD in
some states
c Lack of trust (in ability to reduce
emissions in ability to reduce
operational costs in compatibility
with other measures)
Ship owners
Investors
Increase cooperation in ship design
and building
Increased interaction between
industry and educationalRampD
institutes
Establish platform to share
expertiseexperience
Provide special investment or
guarantee funds
Institutional concerns
a Increased administrative burden
1Revision and amendment of existing legislation
2Implement Port and Flag State obligations
b Limited technical capacity in state institutions to implement
c Lack of financial resources for additional compliance and enforcement activities by maritime administrations
Flag States
Port States
Promote increased cooperation and
communication between
administrationswithin regional
administrations
Regional information workshops for
Port and Flag States
Establish platform to share regulatory
experience
Development aid
Commercial
a Increased costs for ship owners to
take up energy efficient technologies
b Lack of motivation of owners to take
up energy efficient technologies (split
incentive)
Ship owners
Financiers
Special EE funds
Smart contracts
TRANL15371 17
Awareness Raising
Barriers Lack of Awareness
The need to create awareness among Flag States Port States and ship owners of the requirements of
Annex VI in general and Chapter 4 in particular was highlighted by participants of the workshop and
emphasised by the AHEWG-TT The level of awareness in the various regions and even in the countries
within the regions differed considerably The AHEWG-TT further suggests it would be beneficial to
undertake an initial evaluation of knowledge needs (gap analysis) in order to ensure workshops and
other awareness-raising activities are appropriately tailored24
Furthermore ship-owners are not always aware of the energy efficiency technologies available on the
market or which operational measures can be implemented to save fuel Ship owners can be companies
people and investment funds Especially private equity groups tend to focus more on short term looking
for quick profit while traditional ship owners tend to hold the ship for at least 20 years25
Measures forward
Though Flag States and Port States should already have implemented measures to ensure that Energy
Efficiency Design Index (EEDI) and Ship Energy Efficiency Management Plan (SEEMP) requirements are
complied with both public administrations and industry representatives could benefit from additional
trainingcapacity building and platforms to share experiencesreceive information with regards the
practicalities of these regulations and available energy efficiency technologies The needs for each
group can be determined through a gap-analysis which we recommend to be carried out by an
independent consultant in cooperation with the flag and port states Once the specific needs for each
group have been determined they can be addressed through the following awareness raising
measures
Capacity Building (workshops trainings)
Workshopstrainings could be organised where formal training is combined with open discussions where
experiences could be shared just within one stakeholder group or between educational institutes
auditors operational managers of ships shipbuilders and authorities Such trainingsworkshops could
focus on just one or all aspects relating to the applicable rules available energy efficiency measures or
assessment methods of technologies (eg training in calculating and verifying EEDI and SEEMP
including development of tools to calculate EEDI and SEEMP) Trainingsworkshops can be local or
regional Sending people physically to regional workshops is generally more conductive to networking
and experience sharing but less adapted to the local situation and more costly
To reduce the costs of training and ensure a certain level of training the IMO or other qualified
international partners (eg WMU) could develop model courses for training In order to better
understand the rules and regulations in detail people use the help of trainers to better understand the
elements that are important for them and to gain experience in doing calculations and other required
24 Ad Hoc Expert Working Group on Facilitation of Transfer of Technology for Ships 2nd Meeting 25 httpwwwftcomcmss0dadcb240-3d97-11e3-b754-00144feab7dehtmlaxzz3aqC3tmNu
TRANL15371 18
activities by the regulations Trainers have to develop their courses and earn back their investments
via trainings Since the trainers are doing this simultaneous it would be more efficient if there would
be a model course available that can easily be tailored to the audience This would reduce the costs for
the development of trainings and would also ensure that the trainers provide the same level of depth
in their trainings Since the IMO is responsible for the rules and regulations it would be the logical
responsible for the efficient implementation and therefore could take the initiative for developing model
courses
Information Sharing
Inventory of energy-efficiency technologies (for example the IMO-GEF-UNDP project) Many
studies and overviews on the internet are available The quality and the scope is often
different
Improved access to information and information sharing with international recognised
organisations including relevant survey and certification training One example of
establishing information sharing between governments is the work of the OECD Council
Working Party on Shipbuilding (WP6)26 which organises regular workshops aimed at
facilitating the exchange of information on policy and industry developments
Note that many of these measures overlap with the measures required to overcome institutional
barriers as laid out in section 43
Agreements between industry and administrations could be envisaged to overcome the
barriers
In order to enhance the sharing of expertise for both administrations and industry technology transfer
and technology cooperation agreements could be formulated in order to strengthen the cooperation
As identified before the technology transfer to the ship building industry is not a mayor barrier so the
agreements should help the administrations to become more aware of the possibilities to further
promote the implementation of MARPOL Annex VI
Typical agreements between industry and administrations could be in the form of initiatives like the
Sustainable Shipping Initiative (SSI) SSI members have developed a vision for a sustainable shipping
industry in 2040 They commit to working towards this in all their own operations andor activities that
involve shipping and in all their dealings with and support for the shipping industry to make their vision
a global reality by 2040 SSI members of over 19 companies represent ship owners and charterers
shipbuilders engineers and service providers banking insurance and classification societies The SSI
explored for instance how to overcome barriers to the uptake of new technologies and techniques which
improve the operational efficiency of ships potentially delivering energy efficiency savings of 10 or
more and payback periods of less than 5 years They also produce case studies to show good examples
and also develop tools By involving administrations in these kind of initiatives (even free of charge)
they could be actively supported with knowledge about sustainable shipping
26 httpwwwoecdorgstiindworkshopongreengrowthinshipbuildinghtm
TRANL15371 19
Technology Concerns
Barriers Technology Concerns
One of key barriers to the implementation of energy efficient technologies (new and retrofit) relates to
the lack of or limited technology supply chain Furthermore the lack of a technology base for RampD in
some states is a barrier Also the existence of concerns relating to the ability of available energy
efficiency measures to reduce emissions and operational costs and their compatibility with other
measures of energy efficient technologies is a barrier This is typically the problem in very isolated ship
yards
Measures forward
Very successful shipyards (Japan and Korea) have already since many years a large number of
licencing technology transfer and similar agreements and continuously exchange information with
competitors in and outside their countries For instance US shipyards have adopted this methodology
since the 1980s (office of technology assessment 1983)
Further technology sharing could be stimulated through educationalRampD institutes locally regionally
or globally in ship design and building The technology will be transferred to the ship builders once the
students start working there or through cooperation between industry and university In order to
facilitate this we recommend the establishment of partnerships to share expertiseexperience
Typically individuals who know both worlds are the driving force behind successful partnerships (AISBL
2012) These partnerships are built around a shared long term research vision Many partners could
contribute (eg financially) in order to establish the responsible management and research programme
The target of the platform could be for example to provide verified information on real-world energy
efficiency improvements via a monitoring programme
For example in order to stimulate the deployment of energy efficient trucks the Dutch government
provides a website to share audited knowledge and data on about 15 energy efficiency technologies27
Additionally climate financing could be leveraged to reduce the investment risk in unproven
technologies For example IMO Member States could create a demonstration fund that can function as
a guarantee for investments in new and immature technologies28 Similarly investment guarantees
can be provided by funds in the same way governments provide export credits to their companies If
the technology does not deliver the expected fuel-savings the fund can cover the difference and hence
reduce investment uncertainty The main objective being to reduce investment risk
Institutional Concerns
Barriers
27 httpwwwtruckvandetoekomstnl 28 An example of a specific EE fund is httpwwweeefeueligible-investmentshtml
TRANL15371 20
For Flag and Port States complying with new regulations of IMO and EEDI and SEEMP particularly
represent and increased administrative burden It requires revisions and amendments of existing
legislation that need to be implemented at Port and Flag State functions There is currently limited
technical capacity in state institutions to implement these changes especially in developing countries
with a relatively low number of ships under their flag
The lack of financial resources is also a barrier for additional compliance and enforcement activities by
maritime administrations This is particularly an issue for least developed countries and small
developing island states Implementation costs are relatively higher for small Flag States because of
limited abilitycapacity to implement new technical regulations Note that this issue is not specific to
the EEDI and the SEEMP but to most regulatory measures (maritime or other)
Measures forward
Measures to assist states in implementing (existing and new) legislation include
Promote an increased cooperation and communication between administrationswithin
regional administrations of Port and Flag States similarly to what has been suggested in
sections 41 (Awareness raising through capacity building activities such as workshops) and
42 (Establish platform to share regulatory expertiseexperience) Platforms could be
managed by IMO in conjunction with industry and development funds in order to share the
costs as this has been done before for GloBallast for example In that case the IMO is in the
lead (executing agency) but the platform is supporting the collaboration with many
stakeholdersfunding partners The goal of the programme is to assist developing countries
eg via e-learning courses
In addition deterrents need to be put in place to discourage Flag States from performing
substandard inspections A system for detecting sub-standard inspections should be
implemented whereby mandatory Port State Control inspections are carried out in close
proximity to mandatory Flag State inspections (ie the Flag State inspection is carried out
prior to the ship leaving port and the Port State inspection is carried out upon arrival at port)
The two inspections should be carried out under a uniform mandatory checklist The IMO
should monitor inspections and investigate where discrepancies between inspections close in
proximity are detected If a Flag or Port State is found to have failed to meet the requisite
inspection standards penalties in the form of substantial fines should follow
In order to overcome the financial barriers financial assistance to states could help with
capacity building and implementation Financial resources are not only needed in the
implementation of the new regulations (training of government experts) but governments of
Flag States also need to be involved continuously in the ongoing discussion around
developments new EEDI targets for 2020 and beyond which requires continuous availability
of experts to represent the interests of the state (Metselaar 2015) Financial aid can therefore
be supplied in the following forms
Increased financial support for compliance and enforcement activities by maritime
administrations
Financial support could be provided to Flag States so that they have the resources to
properly carry out vessel inspections Consideration should be given to the introduction of
TRANL15371 21
an International Fund Convention set up for this purpose and contributed to by Port
States andor their major oil and other cargo exporters and importers
Commercial
Barriers
Private parties such as ship owners and investors are not always commercially incentivised to make
investments in energy efficiency measures This can be due to the split incentives between owner (who
should make the investment) and charterer (who reaps the cost savings) of a ship (see paragraph 25)
Furthermore access to finance can be problematic for smaller players who operate in niche markets
Measures
Bottlenecks in financing private investments and new financing mechanisms could be addressed during
regional or international workshops that include traditional and new financiers that could finance
investments in energy efficiency technologies
One solution that has been brought forward to address the problem of split incentives is the use of
lsquosmart contractsrsquo (Michele Acciaro 2013) The idea is to change charter contracts in a way that risks
and benefits are shared among charterers and ship owners In such contracts speed choice is more
flexible and the chartering cost of vessels is closer to fuel cost as such ship owners get motivated to
invest in energy-efficient technologies and charterers get stimulated to run vessels in an energy
conserving manner
With respect to the shipbuilding industry the following could facilitate the transfer of technology as
well
Financial assistance to shipyards to be provided at the national level or through other
arrangements
Foreign direct investment in software and hardware as an innovative way to support industry
in implementing the requirements
One type of incentive that governments can provide to enhance industry performance and technology
adoption is a competition for top performers Governments could contribute to a fund from which
money is distributed to the top 10 of best performers in a particular year
Cost estimates
Workshops and training
Capacity building workshops for administrations are estimated at euro 1000 per attendee for an
online workshop (1-2 days) Costs for the organisation of such workshops would include expert fees
and administrative costs These costs could be lower if the course material is already developed
(model workshops) Eg 2 attendees per Flag State for the ten most important Flag States
TRANL15371 22
(covering 74 of total fleet tonnage) comes down to euro 20000 or less in case the courseware is
already existent
A situation that is more conductive to networking and experience sharing is to send people physically
to regional workshops The costs of such workshops including participants travel and hotels for 50
participants would be between euro20000 - euro100000 per workshop based on our international
experience with organising workshops in the field of renewable energy and energy efficiency Costs
could be lower depending on the amount of preparation required cost of location (could be sponsored
by participating states)
Technical training
Trainings already exist for calculating and verifying EEDI including development of tools to calculate
EEDI For example MARIN offers 32h courses over 5 days in the Netherlands for euro 5000 per attendee
(excluding travel and accommodation)29 Lloyds offers similar trainings for similar costs30
Model courses for training may need to be updated depending on identified needs Ecofys estimates
the update of eg an existing EEDI model courses to cost in the order of euro 50000
Online platform for inventory of energy efficiency technologies
Inventories of energy-efficiency technologies already exist (for example in reports like (IMO 2009) and
on websites of for instance DNV-GL the efficiency finder31) but they could be further developed since
the websites are either not independent or incomplete
In order to facilitate information exchange a web-based platform could be established The role of the
platform would be for example to provide verified information on real-world energy efficiency
improvements via a monitoring programme For example in order to stimulate the deployment of
energy efficient trucks the Dutch government provides a website to share audited knowledge and data
on about 15 energy efficiency technologies32 The costs of such a website and corresponding
programme are estimated to be around euro 2 million for a 4 year period Furthermore a platform can be
used to inspire others by showing best practices and can be used for sharing of information regarding
network opportunities like conferences and seminars
Capacity building project
Currently the IMO-GEF-UNDP GloBallast project is a capacity building project it assists developing
countries and their maritime industries in implementing international regulations on ballast water
29 httpwwwmarinnlwebEventsCoursesSpecialist-Course-on-Ship-propulsion-model-tests-and-SpeedPower-trials-for-EEDI-Verifiers-
2731-October-2014htm 30 httpwwwlloydslistcomllsectorship-operationsarticle422262ece 31 httpswwwdnvglcommaritimeenergy-efficiencyefficiency-finderhtml 32 httpwwwtruckvandetoekomstnl
TRANL15371 23
management and preventing risks arising from the transfer of harmful aquatic organisms And has
several aspects that could also be used for knowledge transfer of energy efficiency measures
web-site
e-learning course
databasesdirectories
library collections
newsletter
Regional Task Force (RTFs) to support development and adoption of a regional approach
Develop and implement communication education awareness raising and outreach
programme
Develop introductory and more specialised training packages
Develop model legislations
The total budget for the 2008-2012 period was US$23 million out of which US$564 million represents
a GEF grant the rest being mostly in-kind contributions from the participating countries regional co-
ordinating organisations (RCO) and strategic partners including the private sector
Improved access to information and information sharing with international recognised organisations
including relevant survey and certification training would further promote the different technologies
TRANL15371 24
Conclusions
This study provides an overview of existing technologies which could drastically improve the energy
efficiency of ships Furthermore barriers to transfer and uptake of energy efficient technologies are
analysed and categorised and implications of these barriers are listed in order to facilitate the uptake
of energy efficiency technologies for ships
From this research it is clear that conventional technology is available that can cost-effectively (with a
payback time of less than 15 years) achieve high efficiency gains If the maximum gains per category
are added up (for all but ferry and cruise) this would mean a total efficiency improvement of 35
Even without taking two experimental technologies with potentially high efficiency gains into account
(wind power and air lubrication)
High investments like wind power and contra rotating propellers bring the highest savings (13 ndash 20)
The medium investments are in-between (5-10) and the low investments only bring relatively small
energy efficiency improvements (lt5)
When the ship owner has too few opportunities to share investment with charterers this leads to a split
incentive a ship owner may invest the up-front capital to put in energy-efficient technology but not
receive the benefits This is typically a problem for investments with a high payback time ie the wind
power and contra rotating propellers
The main barriers are related to the transfer of technology to Flag States Flag States are generally
third world and developing nations that often do not have the resources to enforce investigate or
prosecute breaches by their flagged vessels
Several ways to overcome the knowledge transfer barriers were presented that can be categorised as
follows
Workshops and trainings
o Capacity building workshops for administrations
o Regional workshops
Technical training
o Training in calculating and verifying the EEDI
o Development of model courses
Online platform
o Inventory of energy-efficiency technologies
o Creation of a website with all relevant information for the target audience
o Improved access to information and information sharing
o Provide verified information on real-world energy efficiency improvements via a
monitoring programme
TRANL15371 25
The most expensive of the capacity building actions is the capacity building project which takes all
aspects above into account If a project would be developed for knowledge transfer regarding energy
efficiency measures similar to GloBallast which assists developing countries and their maritime
industries in implementing international regulations on ballast water management and preventing risks
arising from the transfer of harmful aquatic organisms the total budget needed would be in the order
of US$23 million for a period of 5 years
TRANL15371 26
References
JFE Group 2013 ldquoJapan Marine Unitedrdquo JFE Group Overview JFE Group AISBL 2012 Making Industry-University partnerships work lessons from succesful collaborations
report Belgium AISBL
Allenstroumlm Bjoumlrn 2013 ldquoWind propulsionrdquo SSPA Sweden AB Gothenburg EffShip March
Aqorau T 2000 Illegal Unreported and Unregulated Fishing Considerations for Developing
Countries paper Honiara Solomon Islands South Pacific Forum Fisheries Agency
BALance 2014 Competitive position and future opportunities of the Euroean Marine Supplies
industry BALance Technology Consulting
Barringhaus David and Robert Olds 1999 OLDS ENGINEERING Maximizing Propulsion Efficiency
Marine Division Accessed Februrar 2015
httpwwwoldscomaumarinemaximizing_propulsion_efficiency
Becker Marine System not dated Becker Bulb Rudders httpwwwbecker-marine-
systemscom05_downloadszzpdfproduct_pdfBecker_Bulb_Rudderspdf Becker Marine
System
mdash 2015 Twisted Full Spade Rudder Accessed Feb 2015 httpbecker-marine-
systemscom03_productsproducts_twisted_full_spadehtml
Bloomberg 2014 China Loses Shipbuilding Crown to South Korea Chart of the Day 9th December
httpwwwbusinessweekcomnews2014-12-09china-loses-shipbuilding-crown-to-south-
korea-chart-of-the-day
Bluebird-Electric 2014 Sipbuilding post World War Two httpwwwbluebird-
electricnetship_boat_design_buildingshipbuilders_ship_repairers_associationhtm
Boat design 2007 Accessed Feb 2015
httpwwwboatdesignnetforumsattachmentspropulsion16743d1193341389-new-
propulsion-sytems-ships-grim-prop-1jpg
Brannigan Paschos Eyers and Wood 2009 Report on International avialtion and Mritime Emissions
in a Copenhagen (post 2012) Agreement Oxfordshire AEA Group
Chen Benjamin Arthur Reed and Ki-Han Kim 1989 A Vane-Wheel Propulsor for a Research and
Development Report Newport David Taylor Research Center
CNSS 2015 Clean North Sea Shipping - Clean Shipping Technology Accessed Februar 2015
httpcleantechcnssnoghg-technologiestechnical-measuresmeasures-related-to-the-hull
Crist Philippe 2009 Greenhouse gas emissions reduction potential from international shipping
Working paper OECD
Daily Times 2015 Nigeria Turkey seek collaboration on ships shipyards 5th January
httpwwwdailytimescomngarticlenigeria-turkey-seek-collaboration-ships-shipyards
Dillingham Gerald L 2000 Progress Made to Reduce Marine Pollution by Cruise Ships but Important
Issues Remain GAO report Washington United States General Accounting Office
DK Group 2015 Silverstream technologies January Accessed January 2015 httpdkgroupeu
DNV 2014 Encouraging Construction and Operation of Green Ships OECD
httpwwwoecdorgstiindC-WP6(2013)12-FINAL-ENGpdf
TRANL15371 27
DNV GL 2015 EFFICIENCY FINDER Accessed Feb 2015 httpwwwdnvglcommaritimeenhance-
performanceefficiency-finderaspx
Ecorys 2012 ldquoGreen growth opportunities in the EU shipbuilding sectorrdquo
ECOSPEED 2015 EUROPEAN MARINE amp MACHINERY AGENCIES LTD Accessed February 2015
httpwwweuropeanmarinecoukECOSPEEDhtm
gcaptain 2012 gcaptain - Propeller Technology to Make Your Ship More Efficient - Accessed Feb
2015 httpgcaptaincompropeller-technology-ship-efficient
Hansen Dinham-Peren and Nojiri 2011 Model and Full Scale Evaluation of a lsquoPropeller Boss Cap
FinsrsquoDevice Fitted to an Aframax Tanker Second International Symposium on Marine
Propulsors smprsquo11 Hamburg Germany June 2011
Hellenic Shipping News 2014 Korean ships sell at fuel-saving premium 22nd December
httpwwwhellenicshippingnewscomkorean-ships-sell-at-fuel-saving-premium
Hindawi 2015 Hindawi Puplishing Cooperation Accessed February 2015
httpwwwhindawicomjournalsijrm2012474785fig4
Hochkirch Karsten and Volker Bertram not dated ldquoSlow Steaming Bulbous Bow Optimization for a
Large Containershiprdquo Accessed Februar 2015 http2021148960resourcepdf5096pdf
Hollenbach Uwe and Juumlrgen Friesch not dated Efficient hull forms ndash What can be gained
Conference ship-efficiency Hamburg 2013 Hamburg HSVA Hamburgische Schiffbau-
Versuchsanstalt GmbH HamburgGermany
ICCT 2011 Reduce Greenhouse Gas Emissions from Ships - Cost Effectiveness of Available options -
white paper Washington DC International Council on Clean transportation (ICCT)
IMO 2011 REDUCTION OF GHG EMISSIONS FROM SHIPS Marginal Abatement Costs and Cost
Effectiveness of Energy-Efficiency Measures Submitted by the Institute of Marine Engineering
Science and Technology (IMarEST) MEPC 62INF7 International Maritime Organisation
IMO 2009 Second IMO GHG Study 2009 London International Maritime Organisation
JSEA 2006 ldquoImproved propulsive performance - Universal applies new energy-saving type Leadge
Bowrdquo Japan Ship Exports Association (JSEA) httpwwwjseaorjpVariableJSea318pdf
Kawasaki 2015 Energy-saving Technology Accessed Feb 2015
httpswwwkhicojpenglishshiptechconservationindexhtml
Leddy Fiona Jayne 2012 ldquoA critical legal analysis of International Shipping in Australian Waters and
the risk of ship-based oil pollutionrdquo Queensland Environmental Practice Reporter vol 17
Marinelog 2014 China white lists 51 shipyards 4 September
httpwwwmarinelogcomindexphpoption=com_k2ampview=itemampid=7667china-white-
lists-51-shipyardsampItemid=231
Metselaar Kees interview by Arno van den Bos 2015 Policy officer at directorate maritime affairs of
ministry of Intrastructure and Environment (February)
Michele Acciaro Peter Nyegaard Hoffmann Magnus Strandmyr Eide 2013 ldquoThe Energy Efficiency
Gap in the Maritime Transportrdquo Journal of Shipping and Ocean Engineering 1-9
MIWB 2015 Maritiem Instituut Willem Barentsz Accessed Feb 2015
httpsmijnmiwbnlnieuwsbriefindexphpdo=showampid_artikel=116
MOL 2011 Energy-Saving Propeller Boss Cap Fins System Reaches Major Milestone - Orders
Received for 2000 Vessels Accessed Feb 2015
httpwwwmolcojpenpr20111145html
TRANL15371 28
Motorship 2014 Gas fuelled ships into the future 31 10 httpwwwmotorshipcomnews101ships-
and-shipyardsgas-fuelled-ships-into-the-future
Nakashima 2015 Nakashima propeller CO LTD Accessed Feb 2015
httpwwwnakashimacojpengproductrudderhtml
Nielsen Shin Lundgren and Faghani not dated Combined Kappel propeller and rudder bulb system
for improved propulsion efficiency Frederikshavn MAN Diesel amp Turbo
OECD 2014 The OECD Council Working Party on Shipbuilding
httpwwwoecdorgindustryindshipbuildinghtm
OECD 2011 ldquoThe Shipbuilding Industry in Turkeyrdquo
office of technology assessment 1983 An Assessment of Maritime Technology and Trade report
Washington DC US Congress
Pakarinen Risto 2007 ldquoNothing common about common railrdquo Twentyfour7 (Twentyfour7) 64-65
Ports amp Ships 2015 Ports and Ships Accessed February 2015
httpportscozanewsarticle_2007_10_17_4038html
Rolls-Royce 2014 Propulsors - Moving your business in the right direction httpwwwrolls-
roycecom~mediaFilesRRolls-Roycedocumentscustomersmarinepropulsion-2014-
tcm92-8664pdf Aalesund Rolls-Royce Commercial Marine httpwwwrolls-
roycecom~mediaFilesRRolls-Roycedocumentscustomersmarinepromaspdf
Schneekluth H and V Bertram 1998 Ship Design for Efficiency and Economy Oxford
Butterworth-Heinemann
Schulze Reinhard 2007 Twisted Rudder - Extreme Design 14 SVA-Forum bdquo Ruder in Theorie und
Praxisldquo Potsdam 7 November 2007 Potsdam Schiffbau-Versuchsanstalt Potsdam GmbH
Selenetrawlers 2015 Selenetrawlers Accessed February 2015
httpwwwselenetrawlerscomcompanydesign-notes
Sepideh Jafarzadeh Ingrid Bouwer Utne 2014 ldquoA framework to bridge the energy efficiency gap in
shippinrdquo Energy 603-612
SetSail 2009 SetSail Accessed February 2015 httpwwwsetsailcomprop-nozzle-comments-by-
an-expert
Shuto Hideki 2010 Super Eco Inland Vessels httpwwwccr-
zkrorgtempwrshp120411Presentations2_04_HShuto_enpdf IHI Marine United Inc
Silberschmidt Noah 2014 ldquoGenerating efficiencies from thin airrdquo SMM Green shipping | Efficiency
httpwwwsilverstream-techcomwp-contentuploads201404HANSA-241112pdf
httpwwwsilverstream-techcomwp-contentuploads201404HANSA-241112pdf
Skinner Ian 2009 EU Tranport GHG Routes to 2050 Technical options for maritime and inland
shipping httpwwweutransportghg2050eucmsassetsTechnical-options-maritime-inland-
waterpdf Brussel European Commission
Statista 2015 ldquoLargest shipbuilding nations in 2013 based on completions in gross tonnagerdquo
httpwwwstatistacomstatistics263895shipbuilding-nations-worldwide-by-cgt
UK DfT 2014 ldquoDfT Port Statistics - World fleet registered trading vessels of 100 gross tons and over
gross tonnage on selected registers 1999-2013rdquo
httpswwwgovukgovernmentcollectionsmaritime-and-shipping-statisticsdata-tables-
associated-with-this-series
TRANL15371 29
Voorham 2013 Assessment of sustainable investment in shipping Master Thesis
Report SDPO13029m Delft 27 th November 2013 Delft Delft University of Technology
WAumlRTSILAuml 2009 ldquoEnergy Evironment Economyrdquo Helsinki Finland WAumlRTSILAuml
mdash 2007 ldquoWaste heat recoveryrdquo Waumlrtsilauml Corporation
Wettstein and Brown 2008 Derating a solution for high fuel savings and lower emissions
Winterthur Waumlrtsilauml Switzerland Ltd
Wind Chellenger Project HP 2015 Wind Chellenger Project HP Accessed Feb 2015 httpwindku-
tokyoacjpindex_enhtml
TRANL15371 30
Appendix I - World fleet registered trading vessels
Table 3 World fleet registered trading vessels of 100 gross tons and over 2009-2013 Source UK DfT 2014
Flag Country 2009 2010 2011 2012 2013
(World Total) 8448 9130 9831 10343 10725
Panama 1886 1979 2084 2158 2172
(European Union) 1900 1979 2074 2051 2106
Liberia 908 1037 1167 1238 1241
Marshall Islands 475 590 711 811 900
Hong Kong 449 553 678 785 854
Singapore 398 434 512 592 677
Malta 348 380 438 450 496
Bahamas 452 469 481 483 485
Greece 388 407 411 411 415
China 282 327 356 388 411
United Kingdom (inc IOM and CI) 258 273 294 300 288
Cyprus 201 205 207 197 203
Japan 138 156 167 178 192
Italy 150 169 181 180 176
Norway 152 145 143 144 145
Germany 152 155 153 137 123
Denmark 107 115 113 113 122
Korea South 120 124 116 111 112
Indonesia 69 82 91 101 111
Bermuda 94 100 106 109 105
Antigua amp Barbuda 100 107 111 106 100
United States of America 107 108 102 99 97
India 83 83 89 85 82
Netherlands 76 61 67 66 69
Turkey 54 58 62 64 59
Malaysia 69 72 71 62 57
France 63 63 64 56 53
Russia 47 49 49 51 52
Philippines 50 51 50 43 43
Cayman Islands 27 29 32 32 31
Taiwan 25 26 27 30 31
Iran 09 08 05 21 31
Thailand 25 26 22 26 29
Sweden 39 35 33 28 27
St Vincent amp the Grenadines 47 42 37 28 24
Canada 24 24 25 24 23
Spain 22 25 26 25 23
Kuwait 23 19 24 24 22
Brazil 20 20 19 19 20
Cambodia 18 17 13 13 12
TRANL15371 31
Appendix II - Most important shipbuilding
countries
China
China is an emerging shipbuilder that overtook South Korea during the 2008-2010 global financial crisis
as they won new orders for medium and small-sized container ships (Bloomberg 2014 Bluebird-Electric
2014)
Figure 14 delivery of vessels from Chinese and South Korean shipyards in million compensated gross tons a measure
of building time and human resources used per ton Source (Bloomberg 2014)
China has more than 1600 shipyards Analysts have predicted that about one third of them will fold
as the industry struggles with overcapacity Last year China laid out a three year plan for industry
restructuring that urged yards to concentrate on building higher quality vessels and local governments
to halt approvals for new projects (Bluebird-Electric 2014)
After two decades of a loan-fuelled boom Chinarsquos shipbuilding industry has become saddled with debt
and overcapacity prompting some private firms to seek financial assistance from the state In
September the government issued a list of 51 shipbuilders it deemed worthy of public support
(Marinelog 2014)
TRANL15371 32
New additions to the white list include subsidiaries of the China State Shipbuilding Corporation (CSSC)
and the China Shipbuilding Industry Corporation (CSIC) and the AVIC Weihai Shipyard owned by the
Aviation Industry Corporation of China (AVIC) (Marinelog 2014)
South Korea
By the end of 2014 it seemed South Korea has overtaken China again as the worlds largest
shipbuilding country with a global market share of about 30(see Figure 14) (Bloomberg 2014)
(Bluebird-Electric 2014) South Korea leads in the production of large vessels such as cruise liners
super tankers LNG carriers drill ships and large container ships
South Koreas shipyards are highly efficient with the worlds largest shipyard in Ulsan operated by
Hyundai Heavy Industries slipping a newly built $80 million vessel into the water every four working
days South Koreas big three shipbuilders Hyundai Heavy Industries Samsung Heavy Industries
and Daewoo Shipbuilding amp Marine Engineering dominate global shipbuilding with STX Shipbuilding
Hyundai Samho Heavy Industries Hanjin Heavy Industries and Sungdong Shipbuilding amp Marine
Engineering also ranking among the top ten shipbuilders in the world In 2007 STX Shipbuilding further
strengthened South Koreas leading position in the industry by acquiring Aker Yards the largest
shipbuilding group in Europe (The former Aker Yards was renamed STX Europe in 2008) In the first
half of 2011 South Korean shipbuilders won new orders to build 25 LNG carriers out of the total 29
orders placed worldwide during the period
To maintain their market position Korean yards also focus more and more on greening opportunities
The Korean government introduced a GHG emission reducing program in 2008 The program is aiming
at reducing GHG emissions throughout all economic sectors including the shipping and shipbuilding
industry Also the Japanese Shipbuilding Association (SAJ) is looking into the possibilities to reduce
GHG emissions so that the shipbuilding industry becomes greener and more competitive (Ecorys
2012)
Japan
Japan had been the dominant ship building country from the 1960s through to the end of 1990s but
gradually lost its competitive advantage to the emerging industry in South Korea which had the
advantages of much cheaper wages strong government backing and a cheaper currency South Korean
production overtook Japans in 2003 and Japanese market share has since fallen sharply
The Philippines
The Philippines has placed fourth among shipbuilding nations around the world producing more than
six million deadweight tonnes of ships built in 2012 The country is anchored by South Korean Hanjin
and Japans Tsuneishi shipbuilders The country has shipyards in Subic and Cebu
TRANL15371 33
Europe
For several decades European shipyards have been facing strong global competition from especially
Asian enterprises (Japanese yards in the 1950s and 60s Koreans from the 1970s and 80s and Chinese
since the 1990s) In Europe this has led to an almost complete exit from the mass production segments
of tankers bulkers and containerships Response of the EU industry has been to focus on the higher
value more complex ship types such as ferries and passenger ships non-cargo vessels and general
cargo ships In addition only limited numbers of vessels of the same type are being built (in contrast
with bulk vessels which are mass produced) Europe has a 77 percent market share in building
passenger vessels (including both cruise ships as well as ferries) and a 17 percent share in the
construction of non-cargo vessels (Ecorys 2012) These segments make up a relatively small share of
the world orderbook (in CGT) However in value they represent a much higher share due to their
relatively sophisticated characteristics The position of the European shipbuilding industry in the
manufacturing of specialised innovative vessels is still strong At the same time European equipment
manufacturers have acquired a leading role in quality products especially in complex high value
equipment components
Figure 15 World orderbook and CESA orderbook by ship type in 2010 (CGT x 1000) (Source Ecorys 2012)
Regarding the marine equipment sector the European industry is renowned for propulsion cargo
handling communication automation environmental and security systems This equipment is not only
destined for complex European-built ships but also exported to Asian yards whether or not requested
by their clients (Ecorys 2012)
Compared to the ship construction sector the marine equipment segment is highly heterogeneous and
consists of companies that are often also active in other business areas (ie automotive or aircraft
industry) A study by (BALance 2014) found that the European marine equipment industryrsquos
TRANL15371 34
competitiveness lies in a strong market position and technological leadership at least for globally active
European marine supply companies who build their position on a strong infrastructure and co-operative
partners skill of their employees and close relationship with their customer base Conversely identified
weaknesses are the cost level in Europe and the heterogeneous structure of the industry with many
SMEs which hinder in some cases attempts to follow the markets by globalisation strategies
Turkey
Shipbuilding in Turkey has evolved from an old traditional activity in Anatolia to an internationally
recognised industry especially since the early 1990s The industry has modern shipyards that can build
ships yachts mega-yachts and sailing boats as well as carrying out extensive repair and conversion
works Turkeyrsquos shipyards are mainly located in the Marmara Region namely Tuzla Yalova and İzmit
which have developed into dynamic shipbuilding centres Also in recent years the emerging Black Sea
and Mediterranean Regions have increasingly attracted shipyard investments
In the last decade in parallel with developments in the global market Turkish shipbuilding experienced
a several-fold increase in its shipbuilding and export capacity including a significant product
diversification According to order books this resulted in Turkey being regularly placed in the top ten
countries on the basis of its deadweight (dwt) production and in the top five countries by the number
of ships
In recent years Turkey has increasingly tapped into niche markets which in turn has led to a growing
participation by Turkish shipyards in the international trade in new ships In parallel there has also
been strong growth in the marine equipment manufacturing sector which could increasingly also tap
the export market These developments reflect in part the strategic location of the yards the
experienced workforce the quality of production and Turkeyrsquos significant role as a political cultural and
economic bridge between Europe and Central Asian and Middle Eastern economies (OECD 2011)
ECOFYS Netherlands BV | Kanaalweg 15G | 3526 KL Utrecht| T +31 (0)30 662-3300 | F +31 (0)30 662-3301 | E infoecofyscom | I wwwecofyscom
ECOFYS Netherlands BV
Kanaalweg 15G
3526 KL Utrecht
T +31 (0) 30 662-3300
F +31 (0) 30 662-3301
E infoecofyscom
I wwwecofyscom
HOW TO OBTAIN EU PUBLICATIONS
Free publications
bull one copy
via EU Bookshop (httpbookshopeuropaeu)
bull more than one copy or postersmaps
from the European Unionrsquos representations (httpeceuropaeurepresent_enhtm)
from the delegations in non-EU countries
(httpeeaseuropaeudelegationsindex_enhtm)
by contacting the Europe Direct service (httpeuropaeueuropedirectindex_enhtm)
or calling 00 800 6 7 8 9 10 11 (freephone number from anywhere in the EU) () () The information given is free as are most calls (though some operators phone boxes or hotels may charge you)
Priced publications
bull via EU Bookshop (httpbookshopeuropaeu)
Priced subscriptions
bull via one of the sales agents of the Publications Office of the European Union
(httppublicationseuropaeuothersagentsindex_enhtm)
doi 102834880780
ML-0
1-1
5-4
39-E
N-N
[Ca
talo
gu
e n
um
be
r]
ECOFYS Netherlands BV | Kanaalweg 15G | 3526 KL Utrecht| T +31 (0)30 662-3300 | F +31 (0)30 662-3301 | E infoecofyscom | I wwwecofyscom
Chamber of Commerce 30161191
Conclusions 24
References 26
Appendix I - World fleet registered trading vessels 30
Appendix II - Most important shipbuilding countries 31
China 31
South Korea 32
Japan 32
The Philippines 32
Europe 33
Turkey 34
TRANL15371 1
1 Introduction
The negotiations within the International Maritime Organization (IMO) on enhancing the energy
efficiency of and reducing the greenhouse gas emissions from international shipping are a top-priority
for the European Commission in view of the European Unions preference for a global measure to
address greenhouse gas emissions from shipping
In July 2011 the IMO adopted two energy efficiency measures which entered into force in 2013 the
Energy Efficiency Design Index (EEDI) for new ships and the Ship Energy Efficiency Managements Plan
(SEEMP) for all ships1 Nevertheless the IMO recognises the need for further action to reduce emissions
from international shipping in view of the continued expected growth of the world economy and
associated transport demand Consequently the IMO began working on further measures to increase
the energy efficiency of international shipping including the development of a global data collection
system as a first step in April 2014
At the time of the adoption of the EEDI and the SEEMP it was agreed to complement them with a
Resolution on the promotion of technical cooperation and transfer of technology relating to the
improvement of energy efficiency of ships The Resolution was intended to provide a framework for the
promotion and facilitation of capacity building technical cooperation and technology transfer to
support in particular in developing countries the implementation of the EEDI and the SEEMP The
Resolution was adopted in 2013 and an expert group tasked to ensure the Resolutions effective
implementation was established in April 2014
The EU is actively contributing to the work of the IMO Ad Hoc Expert Working Group on Facilitation of
Transfer of Technology for Ships (AHEWG-TT) to ensure effective implementation of the Resolution and
incidentally advance the related IMO negotiations on further measures to increase the energy efficiency
of international shipping
The goal of this project is to contribute to the work of the AHEWG-TT and to further stimulate the
effective implementation of the International Maritime Organization (IMO) Resolution on the promotion
of technical cooperation and transfer of technology2
To achieve this goal this study provides a short overview of relevant stakeholders and existing
technologies which could improve the energy efficiency of ships Furthermore barriers to transfer and
uptake of energy efficient technologies are categorised and analysed and possible measures to
overcome these barriers are being proposed
1 Amendments to MARPOL Annex VI (prevention of air pollution from ships) 2 httpwwwimoorgOurWorkEnvironmentPollutionPreventionAirPollutionPagesTechnical-Co-operationaspx
TRANL15371 2
2 Relevant Stakeholders
The IMO resolution on the promotion of technical cooperation and transfer of technology (regulation
23) is intended to support states which request technical assistance Three main categories of
stakeholders were identified that can be considered of relevance
(1) Shipbuilding nations where the ships are produced
(2) Flag States (where the ships are registered) and Port States who are allowed to inspect foreign
ships compliance to international regulations
(3) Ship owners and ship charterers who are responsible for the design and use of the ships
TRANL15371 3
Global Shipbuilding Nations
Shipbuilding nations typically provide incentives for the shipbuilding industry in their country Therefore
they play a role in the transfer of technologies to their industry
In 2012 some 3655 ships were built worldwide The largest share of the tonnage was built in China
South Korea and Japan (Figure 1)
Figure 1 Ship building in 1000 gross tons Source (Statista 2015) quoting IHS and Shipbuilders Association of
Japan
The worldrsquos leading shipyards include South Korearsquos Hyundai Heavy Industries Japanrsquos Mitsubishi
Heavy Industries and Chinarsquos Shanghai Waigaoqiao (Statista 2015) China South Korea and Japan
together are responsible for building about 90 of the ships in gross tons
Flag States and their role in the implementation of MARPOL
Flag States have the responsibility for enforcing the rules set out under MARPOL Every Flag State has
the duty to ensure that its vessels fully comply with the applicable articles of MARPOL3
3 MARPOL Regulation 6
TRANL15371 4
At the end of 2013 about one-fifth of merchant vessels were registered in Flag State Panama 12 in
Flag State Liberia and 8 in the Flag State Marshall Islands (Figure 2 and (UK DfT 2014)) Therefore
already 40 of the world fleet are registered in these three Flag States
Figure 2 World fleet registered trading vessels of 100 gross tons and over 2009-2013 Source UK DfT 2014
Under MARPOL these parties (Flag States) can enforce ship-owners and operators obligations in three
main ways
- by surveyinspection of vessels to ensure that they meet minimum requirements4
- by monitoring vessel compliance with oil discharge requirements5 (not relevant for energy
efficiency) and
- by implementing punishments for failure to comply with requirements6
Surveys
MARPOL Annex VI contains a set of requirements for survey and issuance of International Air
Pollution Prevention Certificate (IAPP) and regulations regarding
Ozone depleting substances from refrigerating plants and firefighting equipment
Nitrogen Oxides (NOx) from diesel engines
Sulphur Oxides (SOx) from diesel engines
4 MARPOL article 5 5 MARPOL Annex I Chapter 4 Regulation 31 6 MARPOL article 4
TRANL15371 5
Volatile Organic Compound Emissions from cargo tanks of oil tankers
Shipboard Incineration
Fuel oil quality
Flag States must conduct an initial survey before a new ship is put into service and before the IAPP is
issued for the first time a renewal survey at intervals specified by the Administration but not exceeding
five years an intermediate survey within three months before or after the second anniversary date or
within three months before or after the third anniversary date of the certificate an annual survey within
three months before or after each anniversary date of the certificate and after prescribed repairs an
additional survey7
For the EEDI and the SEEMP a new certificate the International Energy Efficiency Certificate (IEEC)
was established and must be kept available on board for inspectionssurveys The IEEC Certificate will
be issued for new build ships upon the initial survey before the ship is put into service and for existing
ships of 400 gross tonnage and above The IEE Certificate will be issued once for each ship and is valid
throughout the lifetime of the ship (except flag change major conversion or ship going out of service)
There are no follow-up surveys on the IEEC Certificate
The IMO has created guidelines for surveys that Flag States should follow The energy efficiency related
one is
2014 Guidelines on survey and certification of the Energy Efficiency Design Index (EEDI)
(resolution MEPC254(67))
A Flag State cannot allow a vessel that does not pass inspection to sail until it complies with MARPOL8
An International Energy Efficiency Certificate in accordance with the provisions of regulation 54 to
any ship of 400 gross tonnage and above is needed before that ship may engage in voyages to ports
or offshore terminals under the jurisdiction of other Parties
Punishments for failure to comply
In case of failure to comply the authority carrying out the inspection may detain the ship Article 7 of
MARPOL ensures that unduly delay or detain will be avoided where possible or compensated
A Flag State is obliged to investigate an incident upon receipt of notification or evidence that one of its
vessels has breached MARPOL If the investigations reveal that a breach has occurred the Flag State
has further obligations to initiate legal proceedings against the vessel and report back to the reporting
state on actions taken9
7 MARPOL Annex VI Chapter 2 Regulation 5 8 MARPOL Annex VI Chapter 2 Regulation 6 9 MARPOL article 6
TRANL15371 6
Also other parties are allowed to inspect vessels under MARPOL Article 6 when violations are detected
or for regular inspections A Party may also inspect a ship to which the present Convention applies
when it enters the ports or off-shore terminals under its jurisdiction if a request for an investigation is
received from any Party together with sufficient evidence that the ship has discharged harmful
substances or effluents containing such substances in any place
Role of Port States
Under ldquoPort State Controlrdquo arrangements Port States also have the authority to conduct vessel surveys
on ships which visit their ports and to detain those ships that fall below MARPOL requirements In
relation to MARPOL Annex VI chapter 4 any port state inspection shall be limited to verifying when
appropriate that there is a valid International Energy Efficiency Certificate on board10
Cooperation between Port and Flag States
Under MARPOL parties are required to co-operate in detecting vessel violations and are required to
use all practical measures to detect and monitor violations If a State has evidence of a violation they
are obligated to forward this evidence to the vesselrsquos Flag State
All ships flagged under countries that are signatories to MARPOL are subject to its requirements
regardless of where they sail and member nations are responsible for vessels registered under their
respective nationalities
When incidents occur outside the countrys jurisdiction or jurisdiction cannot be determined the
country refers cases to Flag States in accordance with MARPOL Some States are not happy with the
lack of response from Flag States United States experience of Flag States not responding has led to
new policy which would take direct enforcement action against vessels for MARPOL V violations
occurring between 3 and 200 nautical miles from the United States rather than referring such violations
to the flag states (Dillingham 2000)
Ship owners and charterers
A ship owner is the owner of a commercial ship A ship owner is someone who equips and exploits a
ship usually for delivering cargo at a certain freight rate The ship owner determines the specifications
of the ship and its energy efficiency measures but the benefits of low fuel consumption are not always
theirs when the ship is chartered to someone else
Depending on the type of ship and the type of charter normally a standard contract form called a
charter party is used to record the exact rate duration and terms agreed between the ship owner and
the charterer
10 MARPOL Annex VI Regulation 10
TRANL15371 7
A charterer may be a party without a cargo who takes a vessel on charter for a specified period from
the owner and then trades the ship to carry cargoes at a profit above the hire rate In some cases a
charterer may own cargo and employ a shipbroker to find a ship to deliver the cargo for a certain price
Two main types of charter can be distinguished time charter and voyage charter In a voyage charter
the owner is still responsible for the port fuel and crew costs In a time charter the charterer selects
the ports and directs the vessel where to go The charterer pays for all fuel the vessel consumes port
charges commissions and a daily hire to the owner of the vessel
When there are too few opportunities to share investment with charterers this leads to a split incentive
a ship owner may invest the up-front capital to put in energy-efficient technology but doesnrsquot then
recoup the costs from fuel savings as they charter their ships out as this goes to the charterers This
problem is particularly apparent for short-term time charters11
Conclusions
Regarding energy efficiency the work of the AHEWG-TT12 has shown that the main shipbuilding nations
all have access to the necessary technologies provided there is demand for them It has also been
noted that there is no need for transfers of intellectual property rights13
One of the major barriers to the effective implementation of the EEDI and the SEEMP is the heavy
reliance it places on Flag States for inspection of vessels and enforcement of provisions During the
1970rsquos ships were being reflagged from high tax and high regulation countries such as the United
States and the United Kingdom to countries offering Flags of Convenience (lsquoFOCrsquo) Under FOCs ship-
owners pay less tax to the relevant Flag State and are able to evade the majority of the environmental
and construction standards set out under MARPOL (Leddy 2012) The main reason for that is that
several Flag States are not signatories to all MARPOL Annexes (eg as of 20142015 the Bahamian
Bolivian Cambodian North Korean Georgian Honduran Lebanese and Sri Lankan flags of
convenience had not ratified all MARPOL treaty annexes III-VI14 15)
Many FOCs are developing nations that do not have the resources to enforce investigate or prosecute
breaches by their flagged vessels (Aqorau 2000) As of 2014 55 of merchant ships are flagged by
FOC and 40 of ships are flagged by FOCdeveloping countries MARPOL only provides guidelines for
Flag States to follow when surveying vessels under regulation 6 but none of these guidelines are
mandatory Conversely Port States which are developed are better equipped to bear the cost of
inspection investigation enforcement and prosecution costs However in relation to EEDI and the
11 httpssi2040orgwhat-we-dowork-streamsfinance 12 MEPC 6831 Progress report of the Ad Hoc Expert Working Group on Facilitation of Transfer of Technology for Ships 13 Submission of the United States on Task 3 of the Ad Hoc Expert Working Group on Facilitation of Transfer of Technology for Ships Jan
2015 14 wwwics-shippingorgdocsflag-state-performance-table 15 httpwwwimoorgAboutConventionsStatusOfConventionsPagesDefaultaspx status of conventions
TRANL15371 8
SEEMP port state control is limited to verifying when appropriate that there is a valid International
Energy Efficiency Certificate on board
We therefore conclude that there needs to be a focus on enabling Flag States and Port States that lack
the resourcescapacity to enforce the EEDI and the SEEMP in order to further stimulate the adoption
of energy efficiency technologies Also attention should be paid to overcoming the barrier of split
incentives ie where the benefits of energy efficiency measures are not transferred from the charterer
to the investor (owner)
TRANL15371 9
3 Energy Efficiency Measures for Ships
In order to understand the important energy efficiency measures that can help improve energy
efficiency from shipping it is interesting to see the split between new-built ships and existing fleet In
2012 some 3655 merchant ships were delivered worldwide about 6 of the worldrsquos merchant fleet
of about 60000 The average age of the merchant fleet is 19 years Therefore measures for both new
ships and retrofits for old ships are important for improving the energy efficiency in the next decades
If only the new ships would be targeted only 50 of the fleet would be more efficient in the next
decades while there are many retrofit measures available The total fleet can be broken down to about
4000 passenger ships just under 14000 tankers and about 37000 dry cargo ships including about
5000 container ships (Statista 2015)
In order to identify the most interesting energy efficiency measures for ships we used the information
from several reports to develop a long-list Many measures improve the efficiency in the order of up to
5 Here we would like to focus on measures that result in high savings that can be applied to many
ship types and preferably also to existing ships The resulting short-list is presented in the next table
We used the main categories identified by AHEWG-TT for structuring the measures
The main categories defined by AHEWG-TT are
1 Hull
2 Main Engine
3 Auxiliary engines
4 Propellers and rudders and
5 Control systems
Since the auxiliary engines typically consume only a fraction of the energy that goes to the main
engines their energy efficiency measure results do not show in the short-list below The measures are
worked out in more detail in the paragraphs below The main engine and auxiliary engine improvements
are covered in the same paragraph
The common rail upgrade is a simple measure that can be easily applied to all ships even when the
ship is not in the dry-dock The details are available in the paragraph about engines
From the list it is clear that conventional technology is available to achieve high efficiency gains If the
maximum gain per category is added up (for all but ferry and cruise) this would mean a total efficiency
improvement of 35 even without taking two experimental technologies with potentially high efficiency
gains into account (wind power and air lubrication) Note that some technologies are not applicable to
all ships
In order to find possible financial barriers the investments are rated from ldquovery lowrdquo to ldquohighrdquo relatively
to the size of the ships The same measure on a larger ship is obviously more expensive
TRANL15371 1
Table 1 Inventoryranking of energy efficiency measures
Main category
Measure Estimated efficiency (range)
Efficiency at average circumstances
Ease of installation
Payback time
Investment Implementation References
Hull Bow optimisation
25-20 10 all ship types
short (lt3 years)
Medium conventional technology
(IMO 2009 IMO 2011 Crist 2009 Hochkirch und Bertram not dated)
Main Engines
Wind power 5-44 20 only special ship types
long (gt15 years)
High experimental technology
(IMO 2011 IMO 2009 Crist 2009 ICCT 2011 Brannigan et al 2009 Allenstroumlm 2013)
Propellers and Rudders
Ducted propeller
1-20 10
all ship types except ferry and cruises
medium (4-15 years)
Medium conventional technology
(IMO 2011 IMO 2009 Crist 2009 ICCT 2011)
Propellers and Rudders
Contra-rotating propellers
6-20 13 only special ship types
long (gt15 years)
High conventional technology
(IMO 2011 IMO 2009 Crist 2009 WAumlRTSILAuml 2009 Shuto 2010)
Propellers and Rudders
Wheels 10 10
all ship types except ferry and cruises
short (lt3 years)
Medium conventional technology
(IMO 2009 Schneekluth und Bertram 1998 Brannigan et al 2009)
Control Systems
Waste heat recovery
6-10 8 new build only
medium (4-15 years)
Medium conventional technology
(IMO 2011 IMO 2009 Crist 2009 WAumlRTSILAuml 2007 ICCT 2011)
Propellers and Rudders
Rudder bulb 2-5 4
all ship types except ferry and cruises
medium (4-15 years)
Low conventional technology
(IMO 2011 IMO 2009 Nielsen et al not dated Crist 2009 ICCT 2011)
Propellers and Rudders
Post swirl fins
2-5 4
all ship types except ferry and cruises
short (lt3 years)
Low conventional technology
(IMO 2009 MOL 2011 Hansen Dinham-
Peren und Nojiri 2011 Nielsen et al not
dated)
Hull Hull coating 1-9 5 all ship types
short (lt3 years)
Low conventional technology
(IMO 2011 IMO 2009 ICCT 2011 Voorham 2013 Crist 2009)
Hull Air lubrication
5-15 9 new build only
medium (4-15 years)
Medium experimental technology
(IMO 2011 IMO 2009 Crist 2009 DK Group 2015 CNSS 2015 ICCT 2011)
Propellers and Rudders
Twisted rudder
2-4 3
all ship types except ferry and cruises
medium (4-15 years)
Low conventional technology
(IMO 2009 Schulze 2007 Nakashima 2015 Becker Marine System 2015 Nielsen et al not dated Hollenbach und Friesch not dated Rolls-Royce 2014)
Main Engines
Main engine de-rating
2-4 3
all ship types except ferry and cruises
medium (4-15 years)
Low conventional technology
(IMO 2011 IMO 2009 Crist 2009 Wettstein und Brown 2008 DNV GL 2015)
Auxiliary engines
Common rail upgrade
- - all ship types
medium (4-15 years)
Very Low conventional technology
(DNV GL 2015) (ICCT 2011) (IMO 2009)
Main Engines
Common rail upgrade
01-05-
03 all ship types
medium (4-15 years)
Very low conventional technology
(IMO 2009 Pakarinen 2007 ICCT 2011 Crist 2009)
TRANL15371 2
Hull and superstructure
In general the optimisation of hull and superstructure focuses on minimising the resistance by reducing
the wave resistance and friction between water and hull It is important to recognise which type of
vessel is to be optimised The reduced frictional resistance increases energy performance of the vessel
particularly at low speeds Operability and performances of the ship must be considered in detail The
improvements measures are generally applied at new-built ships but also applicable to retrofitting
Bow optimisation
The different bow optimisations can improve the water flow around the hull and reduce the wave-added
resistance for large vessels with high block coefficient operating within commercial speed ranges The
average energy reduction potential ranges from 25-20 on average 10 (Crist 2009 IMO 2011
Voorham 2013)
Figure 3 Left The green line characterises the ordinary bow wave of the hull The blue line characterises the wave
formed by the bulb The red line is the sum of these two The altitude of the bow wave is noticeably reduced which
reduces the hull drag associated with the bow wave This improves fuel economy and increases range (Selenetrawlers
2015) Right Ordinary bulbous bow leadge bow and ax-bow shape (JSEA 2006)
The below-the-waterline extension of the bulbous bow (Figure 3) modifies the way the water flows
around the hull reducing drag and thus increasing speed range fuel efficiency and stability An altered
design is the ax-bow (Figure 3) The narrow designed bow slashes through the water in order to reduce
slamming and reduces the size of bow generated wave The propeller can act more efficient due to the
absence of slamming The ax-bow allows the ship to steer well to maintain speed and the engine to
save fuel (Crist 2009 IMO 2009) If the bulbous bow is modified during a regular docking period the
investment is estimated to have short payback of about 1-3 years It is most promising for container
vessels (DNV GL 2015 Hochkirch und Bertram not dated)
Barriers The bow optimisation (as retrofit) needs to be done in the dry dock Dry-docking is not
regularly happening for existing ships because it means that the ship cannot operate and economic
losses are suspected Another obstacle might arise due to restricted access to the original contractual
hull plans since shipyards are not always keen to provide detailed plans on their vessels to prevent
TRANL15371 3
imitation (Hochkirch und Bertram not dated DNV GL 2015) A major obstacle is the split incentive
between ship owner and operator Ship owners are responsible for investing in these technologies and
ship operators are those who pay for the fuel consumption and benefit from such technologies (ICCT
2011)
Technical maturity The technique is available on the market and is effective Only conventional
material is needed and redesign can be done in a few weeks16
Applicability Applicable to all ship types but most efficient for ships with a high block coefficient like
tankers and bulk carriers since the reduction of the wave-added resistance is most impacting (IMO
2009)
Hull coating
Hull coatings (Figure 4) can lower frictional resistance and limit fouling by aquatic organisms It can
save between 1-9 fuel consumption on average 5 (ICCT 2011 Voorham 2013 Crist 2009)
Figure 4 Example of hull coating (ECOSPEED 2015)
One way of lowering the frictional resistance is to improve the smoothness of a hull by means of
coatings that reduce fouling The costs are lifetime cost reduction and have to be recur every five years
to be able to gain the fuel benefit
Barriers A new application is typically necessary during each dry-docking The self-polishing coating
must be renewed after a 3-5 years period (IMO 2009) A major obstacle is the divided interest between
ship owner and operator Ship owners are in charge for investing in these technologies and ship
operators are those who pay for the fuel consumption and profit from such technologies (ICCT 2011)
Technical maturity Coating techniques are available on the market and roughly 5 of newly painted
ships are painted with one of the advanced coating systems presently available (IMO 2011 ICCT 2011)
The payback time is short (ICCT 2011) or 0-2 years according to others17
Applicability The technology is applicable to all vessels
Air lubrication
The air lubrication technique creates a layer of bubbles underneath an already streamlined hull in order
to further reduce friction An automation system regulates the compressorsblowers depending on
16 httpwwwship-efficiencyorgonTEAMpdf14-Ship20efficiency20seminar20-20CMA20CGM-
20HydrOcean20120CMA20pdf 17 httpswwwdnvglcommaritimeenergy-efficiencyefficiency-finderhtml
TRANL15371 4
speed The blower keeps holes filled with air and required pressure A thin layer of bubbles trailing
behind of each cavity merge into single large ldquoair layerrdquo for the whole flat bottom part of the hull and
reduces the friction (Figure 5) Depending on the ship type the estimate fuel efficiency ranges between
5-15 (on average 9) where tankers and bulkers can reduce more (10-15 on average 125) in
comparison to container vessels (5-9 on average 7) (IMO 2009 DK Group 2015 CNSS 2015 ICCT
2011 Voorham 2013)18
Figure 5 Schematic view of air lubrication (DK Group 2015)
Barriers Large capital investment requirements with split incentive The vessel owners are
accountable for investing in these technologies whereas vessel operators recompense for the fuel
consumption and benefit from such technologies (ICCT 2011)
Technical maturity The technology is available on the market but still in a pilot phase Sea trials
have been performed with small demonstration ships There are no vessels operating commercially
that currently use this technique Specifications about the payback time vary from short to medium
(Silberschmidt 2014 Skinner 2009)
Applicability The original technology would be likely be applied to new-built ships with at least a
partly flat bottom and a minimum length of 225 metres since the compressor may have technical
problems maintaining air cavities for deep draft ships (IMO 2011 CNSS 2015) Air lubrication can be
used for retrofitting as well (CNSS 2015)
Engines
Speed reductions on existing vessels provide opportunities for engine optimisation on low power
(321) Similar measures as de-rating for the main engines that could be implemented are cylinder
cut-out and new torsional vibration calculation (IMO 2009)
18 It has to be noted that the extra fuel use caused by the system itself should also be taken into account
TRANL15371 5
Another propulsion supportive measure with a high potential measure is wind power This is also
explained in more detail below In order to also provide a measure with a lower improvement potential
per ship but simple and applicable to all ships we describe the common rail system for fuel injection
Main engine de-rating
Slow steaming vessels are known as one of the most effective energy saving measure The potential
comes mainly from the operational behaviour side From the technical side the specific fuel oil
consumption will decline when a ship is no longer operated at its design speed
The design speed can be reduced by de-rating the main engine (IMO 2011 IMO 2009) Reduction of
power combined with injection timing advanced to restore peak combustion pressure can achieve a
certain gain in shaft efficiency Fuel efficiency can be improved by 2-4 when de-rating is performed
for loads lower than the maximum design load (Wettstein und Brown 2008 Crist 2009) on average
3 energy efficiency potential (Crist 2009) Operational costs would be lower mainly due to fuel
savings (DNV GL 2015 Crist 2009 Wettstein und Brown 2008)
Barriers A slower vessel will have lower incomes as it is not capable to perform as much transport
load per unit of time as a faster vessel De-rating the engine is usually done when it is clear that the
ship will become a slower steaming ship There is a split incentive between vessel owners who are
responsible for investing in these technologies and vessel operators who are those who compensate
for the fuel consumption and benefit from such technologies (ICCT 2011)
Technical maturity This technique has been proven as successful particularly on older engines
which are normally built with a low compression ratio and thereby have a significant potential to
improve their efficiency (IMO 2009) De-rating measures have a low to medium payback time (Crist
2009 DNV GL 2015)
Applicability The technologies are available on the market It is applicable to all vessels (DNV GL
2015)
Common-rail upgrade (common-rail fuel injection)
Engines with common-rail fuel injection handle low-load working modes much better (IMO 2009) A
common-rail fuel injection is technique of injecting fuel into an engine cylinder under total control and
thereby achieving optimal combustion Common-rail allows the start and duration of injection
independent of the position of the pistons in that way permitting an operationally optimised injection
per stroke In a normal diesel engine fuel is injected at a static rate by a pump and common practice
is to optimise this pump to run at an optimal setting for the ideal injection time (Pakarinen 2007) The
energy efficiency potential is estimated between 01-05 on average 03 (ICCT 2011 IMO 2009)
Barriers Additional electronics can also introduce possibilities for failures However recent
advancements have increased the systems popularity19 There is a split incentive between vessel
19 httpwwwmarineinsightcommarinean-overview-of-common-rail-system-in-marine-engines
TRANL15371 6
owners who are responsible for investing in these technologies and vessel operators who are those
who compensate for the fuel consumption and benefit from such technologies (ICCT 2011)
Technical maturity This measure is available on the market (ICCT 2011) Payback time is short to
medium with an average of 5 years (IMO 2009 Crist 2009)
Applicability This measure is applicable to new and retrofit vessels It is applicable for tanker- bulk-
container- and Roro-ships (Crist 2009)
Auxiliary engines and systems
Based on our own estimation auxiliary engines improvement are not bringing gt2-4 energy savings
because auxiliary engines consume much less fuel than the main engine Similar measures as de-rating
for the main engines and common rail upgrade could be implemented for the auxiliary engine
Other options for improving auxiliary systems are speed control of pumps and fans control strategies
of cooling water systems room ventilation redesign of piping and instruments advanced computation
of airgas temperature distribution with reduced storage ventilation and with optimised ventilation
systems (DNV GL 2015)
Barriers There is a split incentive between vessel owners who are responsible for investing in these
technologies and vessel operators who are those who compensate for the fuel consumption and benefit
from such technologies (ICCT 2011)
Technical maturity This measure is available on the market (ICCT 2011) It is easy to apply and
uncomplicated in maintenance (DNV GL 2015) Payback time is short (DNV GL 2015)
Applicability This measure is applicable to all new and retrofit types of ships (DNV GL 2015)
Wind power
Wind power measures are available that can develop enough thrust to provide at least some supportive
propulsion Wind power can be utilised in various ways in shipping like traditional sails solid wing sails
Flettner-rotor and kits (see Figure 6) The techniques are currently used as supplementary power
(Brannigan et al 2009)
Figure 6 from left to right Kite (Cargill 2011) Flettner rotor (MIWB 2015) and solid sails (Wind Chellenger Project
HP 2015)
Solid wing sails are structured similar to aircraft wings which offer more thrust with less drag than
conventional sails Flettner rotors produce thrust from a rotating object in wind using the so-called
TRANL15371 7
Magnus effect The techniques have different characteristics with regards to how the thrust that is
produced relates to other factors such as wind strength wind angle wind stability and ship speed
(IMO 2009)
Towing kites vary from other concepts of wind power by having a small footprint during installation and
therefore being quite feasible to retrofit (Allenstroumlm 2013) Studies conducted at the Technical
University of Berlin indicated that the potential for sail energy has different prospective in the different
regions in the world Best scenarios exist in North Atlantic and North Pacific regions the South Pacific
seems a bit less potential The studies have shown that under normal circumstances the typical savings
using wind power may be 5 at 15 knots and up to 20 at 10 knots This study also revealed that
with optimal weather routing in the North Atlantic and given the best vessel with best sail type savings
can reach 15 percent at 15 knots and 44 at 10 knots (IMO 2009 Crist 2009) Nevertheless the
above figures should be considered indicative since practical experiences are limited Sail- and kite-
assisted power does seem to be a potential opportunity saving energy in the medium- and long-term
picture for shipping (IMO 2009) Christ estimates and average energy saving potential around 20
(2009)
Barriers There is a split incentive between vessel owners who are responsible for investing in these
technologies and vessel operators who are those who compensate for the fuel consumption and benefit
from such technologies (ICCT 2011) Although this technology can bring high energy savings the
investment is so high that there is not a short payback time
For solid wing sails complications could result in a need for masts to run down to the keel which can
be a bigger issue for retrofitting Additionally the presence of the mast and rigging could have significant
impacts on cargo handling (IMO 2009) Downside of the kite systems include the complex launch
recovery and control systems that are needed (IMO 2009)
Technical maturity This is still considered as experimental technology The technical barriers
identified above need to be tackled for this measure to be applied widely in the future Payback time is
estimated to be medium to long term (Allenstroumlm 2013 Crist 2009)
Applicability Wind power technologies are available and a number of cargo ships have been equipped
with wind engines to reduce demands from diesel engines (ICCT 2011) Kites can be used on ships
with a minimum length of 30m and works most energy efficient on ships with a typical speed not faster
than 16 knots Preferably tankers (crude oil product chemical LPG LNG other) and bulk carriers are
being considered as potential users due to this speed restriction (IMO 2011)
Control Systems Waste heat recovery
Waste heat recovery (WHR) technology can pass exhaust gases from a vessels engines through a heat
exchanger to generate steam for a turbine-driven generator The heat energy from the exhaust gas is
taken and transformed into electrical energy to reduce direct engine-fuel consumption for the
propulsion system or reduce auxiliary engine needs (ICCT 2011) Energy saving potential is estimated
between 6-10 on average 8 (Crist 2009 ICCT 2011)
TRANL15371 8
Figure 7 Efficiency of waste heat recover systems Sankey diagramme Even with high 50 efficiency of modern low-
speed engines there is still 50 of fuel input energy not being put to productive use The possibilities are illustrated
by this comparison of Sankey diagrammes for Waumlrtsilauml 12RT-flex96C engines without heat recovery (left) and with
high-efficiency waste heat recovery plant (right) showing in this case 114 gain in overall efficiency with WHR
(waste heat recovery) (WAumlRTSILAuml 2007)
Barriers Large capital investment requirements (around $5-6 million for a large container ship20) and
split incentive between ship owners and ship operators (ICCT 2011)
Technical maturity The technology is available on the market and has medium to long payback time
(WAumlRTSILAuml 2007 Crist 2009)
Applicability A WHR system is applied to vessels with a high production of waste heat and a high
intake of electricity WHR can be employed on ships with main engine average performance is higher
than 20000 kW and auxiliary engine average performance higher than 1000 kW This size
requirements limit the number of ships using this technology (IMO 2011) Generally it is applicable to
all ships types new and retrofit (Crist 2009)
Propellers and Rudders
Numerous devices have been designed for improving the energy consumption of vessels by recovering
as much as possible of this rotational energy in the flow from the propeller or to provide some pre-or
post-rotation of the in flow into and after the propeller to ensure best efficiency The most important
of these will be discussed in the following paragraphs (IMO 2009)
Ducted propeller (Kort Nozzle)
The accelerating ducted propeller consists of a screw propeller surrounded by a non-rotating duct
(nozzle) (Figure 8) Compared to the conventional propeller of the same diameter and thrust this
20 httpgcaptaincompower-exhaust-gas-paybacks-waste
TRANL15371 9
arrangement allows an increase inflow to the propeller improving the operating conditions around the
propeller and the ideal efficiency
Figure 8 Right photos of this Norwegian trawler (SetSail 2009)
The duct creates additional thrust load The potential for energy savings on relevant vessels range
between 1ndash20 (Crist 2009 IMO 2011 Barringhaus und Olds 1999 IMO 2009) whereupon 10 is a
good average value (IMO 2009 Crist 2009) The improvement of the combination of propeller and duct
overweigh negative effect of the increase water resistance caused by the duct
Barriers Since the duct has an optimal operational speed it does not work efficient at all speeds For
instance as drag increases with increasing speed eventually this will become larger than the added
thrust Therefore at high speeds ducts are typically not used (IMO 2009) The split incentive is a barrier
between ship owners (investor) and ship operators (gainer) as explained earlier (ICCT 2011)
Technical maturity Several standard designs are available on the market (IMO 2011) with a medium
payback time (IMO 2011)
Applicability Ducted propellers suits for vessels operating at high propeller loadings such as tankers
bulk carriers especially tugs and some offshore service ships The duct leads to increased friction but
at higher propeller loadings this is more than rewarded for by the positive effect of the combination of
propeller and duct (IMO 2009)
Contra-rotating propellers (CRP)
A rotating propeller induces a rotating motion in its backwash Normally this rotation energy of the
propeller gets lost The contra-rotating propeller is used in order to recover part of this energy (Figure
9) In a contra-rotating configuration two propellers are facing each other rotating in the opposite
direction with the aft propeller recuperating the turning energy in the wake from the forward propeller
(IMO 2011) To avoid complications with cavitation the aft propeller usually has a smaller diameter
than the front propeller Contra-rotating propeller arrangements involve a short shaft line and for that
reason primarily suitable for vessels with single-screw
TRANL15371 10
Figure 9 Left conventional propeller Right contra-rotating propeller The working principle is simple and effective
the power is split in a forward and aft propeller which through the different direction of rotation cancel out the
rotational energy losses behind the propeller (WAumlRTSILAuml 2009)
Potential savings of such measures are assessed to be in the order of 6ndash20 of the power consumption
with an average of 13 although higher figures may be presented by industry for specific cases Two
different full-scale measurements reported gains of 15 and 16 (IMO 2009 Crist 2009)
Barriers The mechanical installation of contra-rotating shafts is complicated and requires more
maintenance (IMO 2011) The split incentive between ship owners (investor) and ship operators
(gainer) is a barrier as explained above Although this technology can bring high energy savings the
investment is so high that there is not a short payback time
Technical maturity The technique is available on the market but problems with gearboxes for
contra-rotating propellers have been reported as well as operational problems with mounting (IMO
2009 IMO 2011) Payback time is reported as short (WAumlRTSILAuml 2009) but also as medium-long with
about ~15-20 years (Shuto 2010)
Applicability The technology is particularly beneficial for rather heavily loaded propellers as for
example very fast cargo vessels like Ro-Ro ships or for container ships (IMO 2011 Crist 2009) Contra-
rotating propellers need a short shaft line and hence mainly suited to single-screw ships (IMO 2011)
Contra-rotating propellers can be implemented as retrofit but it is more likely implemented in new
built ships due to the complicated mechanical installation (Crist 2009)
Post swirl devises
A number of different techniques belong to the post swirl category Several of them contain
modifications to the rudder or propeller (IMO 2009) Depending on vessel type and operational field
various power saving measures can be mounted to optimise water velocity distribution to the propeller
and to minimise slipstream losses due to swirl in the outflow of a propeller The most important among
these measures may be additional thrusting fins at the rudder twisted rudder (Figure 12) rudder-
bulb-systems with fins (Figure 13) and fins on the propeller fairwater also called post swirl fins or
boss cap fins (Figure 10)
Generally post swirl measures reported 1-8 energy efficiency (test models) Even 8-9 energy
efficiency from full-scale measurements for additional thrusting fins at the rudder Payback time is
estimated to be short to medium post swirl devices (DNV GL 2015 Crist 2009 ICCT 2011) Some of
CRP FOR BETTER PROPULSION EFFICIENCY
CONVENTIONAL PROPULSION
TRANL15371 11
the post swirl measure can be combined A good overview is given in Nielsen et al (Combined Kappel
propeller and rudder bulb system for improved propulsion efficiency not dated)
3431 Post swirl fins
The post swirl fins (Figure 10) can recover energy loss of propeller hub vortex in the propeller backward
flow and can lead to 3-5 energy saving on average 4 operating at the same speed (MOL 2011
Barringhaus und Olds 1999 Hansen Dinham-Peren und Nojiri 2011 ICCT 2011)
Figure 10 Example the post swirl fins or propeller boss cap fins (gcaptain 2012)
Barriers It is simple and straightforward measure requiring only the removal of the propeller boss
caps and replacement with the post swirl fins (no hull modification is needed) (Hansen Dinham-Peren
und Nojiri 2011 MOL 2011) However there is a split incentive between ship owners (investor) and
ship operators (gainer) as explained above
Technical maturity The technique is available on the market In 2013 post swirl fins were applied
to over 2500 ships worldwide (MOL 2011) Further advantages of the post swirl fins are reduction in
propeller torque reduced vibration in the stern and less underwater noise and reduced rudder erosion
(MOL 2011) A payback time of 6 months was estimated for 4 efficiency improvement at $600tonne
oil price (Hansen Dinham-Peren und Nojiri 2011) The investment is considered to be low21
Applicability The technique is effective for all screw propellers irrespective of the type or hull form
of the ship Has been tested on large-scale container vessels (MOL 2011 Hansen Dinham-Peren und
Nojiri 2011)
3432 Free rotating wheels
A vane wheel (Grim wheel) is a freely spinning propeller mounted behind the main smaller propeller
(see Figure 11 for example of use on retrofit Queen Elisabeth II in 1986) The vane wheel has a bigger
diameter than the main propeller and increases the propeller diameter The small propeller drives the
freely revolving vane wheel fitted on the wake The inner part of the vane wheel acts as a turbine and
the outer part as an ldquoadditionalrdquo propeller
21 httpgcaptaincompropeller-technology-ship-efficient
TRANL15371 12
Figure 11 Example for a grim vane wheel (Boat design 2007)
This leads to a substantial recovery of the rotational energy The energy saving potential is reported to
be 10 (Brannigan et al 2009) It is stated that the important benefit of the vane wheel is that a
smaller impulsion propeller can be installed which consumes less energy The vane wheel gives a
suitable energy improvement for cargo ships (IMO 2009 Schneekluth und Bertram 1998) and has short
payback time It is also stated that if there is room for a vane wheel in the aft there is also space for
an impulsion propeller of larger diameter leading about the same energy saving potential as the
combination of a small impulsion propeller and a vane wheel (IMO 2009)
Barriers A barrier is the split incentive between vessel owners who are responsible for investing in
these technologies and vessel operators who are those who compensate for the fuel consumption and
benefit from such technologies
Technical maturity Limited application Vane wheels are subjected to strong fluctuations in loading
Problems with the strength of the blades have been encountered frequently (for example the vane
wheels on the Queen Elisabeth II were short lived and not used after22)The payback time is estimated
to be short
Applicability The technique is effective for all screw propellers irrespective of the type or hull form
of the ship both for new and existing ships (Chen Reed und Kim 1989) Recommended for all ship
types except ferry and cruises because of their problem with strong fluctuations in loading as
mentioned above23 (IMO 2009)
3433 Twisted rudder
Rudders can play a significant role of extra frictional resistance Rudders are located in the backwash
of a propeller and rotational energy will act on the rudder Because of these effects the rudder gives
prospects of efficiency gains (Schulze 2007)
22 httpwwwroblightbodycomlinersqe-21987_Refitindexhtm 23 httpwwwroblightbodycomlinersqe-21987_Refitindexhtm
TRANL15371 13
Figure 12 Schematic capture of twisted rudder (Nakashima 2015)
Twisted leading edge technology provides multiple benefits for high-speed vessels compared to
conventional rudder designs Conventional rudders are located behind the propeller with the rudder
profile arranged symmetrically about the vertical rudder centre plane This arrangement does not
consider the fact that the propeller induces a strong rotational flow that strikes on the rudder blade
This consequences in areas of low force on the blade that induce cavitation and associated erosion
problems (Becker Marine System 2015 Schulze 2007)
The twisted rudder is horizontally twisted on the lower and upper side of the segment that is an
extension of the propeller shaft (Figure 12) This decreases cavitation rudder and improves
manoeuvrability of the vessel (Schulze 2007) Twisted rudder types lead to energy efficiency
improvements by approximately 2-4 on average 3 for large-size high-speed vessels (Hollenbach
und Friesch not dated Nakashima 2015)
Barriers Work needs to be done in the dry dock this is not regularly happening for existing ships
(Hochkirch und Bertram not dated) There is a split incentive between vessel owners who are
responsible for investing in these technologies and vessel operators who are those who compensate
for the fuel consumption and benefit from such technologies (ICCT 2011)
Technical maturity This rudder type is a commercially used technology and easy to apply if the ship
is in the dry dock (ICCT 2011)The payback time is estimated to be short to medium (Rolls-Royce 2014
Crist 2009)
Applicability Twisted rudder can used by container vessels reefers Ro-Pax ferries cruise ships and
naval vessels In South Korea this type of rudder is recognised as a standard rudder for large-size
high-speed container carriers (Nakashima 2015)
TRANL15371 14
3434 Rudder bulb
Figure 13 Example for a rudder bulb Kawasaki RBS-F rudder bulb systems with fins (Kawasaki 2015)
The rudder bulb brings smooth inflows from the propeller and can reduce the drag of the rudder The
rudder fins produce thrusts in the rotational flows generated by the propeller (Figure 13) Rudder bulb
measure can improve energy efficiency by 2-5 (Nielsen et al not dated Becker Marine System not
dated) on average 4 (Crist 2009)
Barriers The work needs to be done in the dry dock this is not regularly happening for existing ships
There is a split incentive between vessel owners who are responsible for investing in these technologies
and vessel operators who are those who compensate for the fuel consumption and benefit from such
technologies (ICCT 2011)
Technical maturity The technology is a commercially used technology and easy to apply while the
ship is in the dry dock (Kawasaki 2015) Payback time is estimated to be medium (Crist 2009)
Applicability For new and retrofit tanker- bulk- container- and Roro-ships with a propeller and
rudder (Crist 2009)
TRANL15371 15
Barriers to the transfer and uptake of energy
efficiency technologies for ships and possible
measures to overcome them
Although there are ways to reduce emissions (Chapter 3) and also drivers working towards the
implementation of such measures there are significant barriers to acting on cost-effective opportunities
in the maritime industry This is often referred to as barriers to energy or the energy efficiency gap
(Michele Acciaro 2013) (Sepideh Jafarzadeh 2014) (OECD 2014) Some barriers are shared with other
industries while others are unique to the maritime industry Furthermore many of these barriers are
not specific to the EEDI and the SEEMP but apply to any rule under MARPOL These barriers can exist
on both the supply and the demand side For example there could be barriers to the development and
implementation of measures that reduce CO2 emissions from ships and barriers to the expression of
demand for these measures (ECORYS 2012) Studies have however shown that there are relatively
few barriers related to the development of new technologies or access to related intellectual property
rights by the main shipbuilding nations and that the supply of measures exceeds the demand (ECORYS
2012) Existing studies on barriers to energy efficiency thus focus on what prevents the uptake of
available measures
This section presents an overview of the main barriers to the transfer and uptake of energy efficiency
technologies in the shipping industry and discusses potential ways of overcoming them
Preliminary assessments of technology transfer and financial needs by both workshop participants and
the IMO Ad Hoc Expert Working Group on Facilitation of Transfer of Technology for Ships (AHEWG-TT)
have suggested that the type of assistance needed by Port State and Flag State administrations will be
of a different nature than that required by shipbuilders and owners Our assessment above has shown
that the shipbuilding industry is expected to need less assistance than Port States and Flag States
In the next table we list a summary of the main barriers and the stakeholders concerned in the main
categories as identified by AHEWG-TT as well as the possible measures that could help overcome these
barriers The possible measures to overcome the barriers are further detailed in the sections below
Related costs are estimated in a separate section in order to minimise overlap
TRANL15371 16
Table 2 Summary of main barriers relevant stakeholders and possible measures to overcome them
Barrier Stakeholders Measures forward
Lack of awareness
(administrative and industry)
a MARPOL in general MARPOL Annex
VI EEDI and SEEMP in particular
b Available energy efficiency
technologies
Flag and Port
States
Ship owners
Capacity building
- Workshops
- Trainings
Model course for training
Inventory
Platform for information access and
sharing
Agreements between industry and
administrations
Technology concerns
a Lack of or limited technology supply
chain in some states
b Lack of technology base for RampD in
some states
c Lack of trust (in ability to reduce
emissions in ability to reduce
operational costs in compatibility
with other measures)
Ship owners
Investors
Increase cooperation in ship design
and building
Increased interaction between
industry and educationalRampD
institutes
Establish platform to share
expertiseexperience
Provide special investment or
guarantee funds
Institutional concerns
a Increased administrative burden
1Revision and amendment of existing legislation
2Implement Port and Flag State obligations
b Limited technical capacity in state institutions to implement
c Lack of financial resources for additional compliance and enforcement activities by maritime administrations
Flag States
Port States
Promote increased cooperation and
communication between
administrationswithin regional
administrations
Regional information workshops for
Port and Flag States
Establish platform to share regulatory
experience
Development aid
Commercial
a Increased costs for ship owners to
take up energy efficient technologies
b Lack of motivation of owners to take
up energy efficient technologies (split
incentive)
Ship owners
Financiers
Special EE funds
Smart contracts
TRANL15371 17
Awareness Raising
Barriers Lack of Awareness
The need to create awareness among Flag States Port States and ship owners of the requirements of
Annex VI in general and Chapter 4 in particular was highlighted by participants of the workshop and
emphasised by the AHEWG-TT The level of awareness in the various regions and even in the countries
within the regions differed considerably The AHEWG-TT further suggests it would be beneficial to
undertake an initial evaluation of knowledge needs (gap analysis) in order to ensure workshops and
other awareness-raising activities are appropriately tailored24
Furthermore ship-owners are not always aware of the energy efficiency technologies available on the
market or which operational measures can be implemented to save fuel Ship owners can be companies
people and investment funds Especially private equity groups tend to focus more on short term looking
for quick profit while traditional ship owners tend to hold the ship for at least 20 years25
Measures forward
Though Flag States and Port States should already have implemented measures to ensure that Energy
Efficiency Design Index (EEDI) and Ship Energy Efficiency Management Plan (SEEMP) requirements are
complied with both public administrations and industry representatives could benefit from additional
trainingcapacity building and platforms to share experiencesreceive information with regards the
practicalities of these regulations and available energy efficiency technologies The needs for each
group can be determined through a gap-analysis which we recommend to be carried out by an
independent consultant in cooperation with the flag and port states Once the specific needs for each
group have been determined they can be addressed through the following awareness raising
measures
Capacity Building (workshops trainings)
Workshopstrainings could be organised where formal training is combined with open discussions where
experiences could be shared just within one stakeholder group or between educational institutes
auditors operational managers of ships shipbuilders and authorities Such trainingsworkshops could
focus on just one or all aspects relating to the applicable rules available energy efficiency measures or
assessment methods of technologies (eg training in calculating and verifying EEDI and SEEMP
including development of tools to calculate EEDI and SEEMP) Trainingsworkshops can be local or
regional Sending people physically to regional workshops is generally more conductive to networking
and experience sharing but less adapted to the local situation and more costly
To reduce the costs of training and ensure a certain level of training the IMO or other qualified
international partners (eg WMU) could develop model courses for training In order to better
understand the rules and regulations in detail people use the help of trainers to better understand the
elements that are important for them and to gain experience in doing calculations and other required
24 Ad Hoc Expert Working Group on Facilitation of Transfer of Technology for Ships 2nd Meeting 25 httpwwwftcomcmss0dadcb240-3d97-11e3-b754-00144feab7dehtmlaxzz3aqC3tmNu
TRANL15371 18
activities by the regulations Trainers have to develop their courses and earn back their investments
via trainings Since the trainers are doing this simultaneous it would be more efficient if there would
be a model course available that can easily be tailored to the audience This would reduce the costs for
the development of trainings and would also ensure that the trainers provide the same level of depth
in their trainings Since the IMO is responsible for the rules and regulations it would be the logical
responsible for the efficient implementation and therefore could take the initiative for developing model
courses
Information Sharing
Inventory of energy-efficiency technologies (for example the IMO-GEF-UNDP project) Many
studies and overviews on the internet are available The quality and the scope is often
different
Improved access to information and information sharing with international recognised
organisations including relevant survey and certification training One example of
establishing information sharing between governments is the work of the OECD Council
Working Party on Shipbuilding (WP6)26 which organises regular workshops aimed at
facilitating the exchange of information on policy and industry developments
Note that many of these measures overlap with the measures required to overcome institutional
barriers as laid out in section 43
Agreements between industry and administrations could be envisaged to overcome the
barriers
In order to enhance the sharing of expertise for both administrations and industry technology transfer
and technology cooperation agreements could be formulated in order to strengthen the cooperation
As identified before the technology transfer to the ship building industry is not a mayor barrier so the
agreements should help the administrations to become more aware of the possibilities to further
promote the implementation of MARPOL Annex VI
Typical agreements between industry and administrations could be in the form of initiatives like the
Sustainable Shipping Initiative (SSI) SSI members have developed a vision for a sustainable shipping
industry in 2040 They commit to working towards this in all their own operations andor activities that
involve shipping and in all their dealings with and support for the shipping industry to make their vision
a global reality by 2040 SSI members of over 19 companies represent ship owners and charterers
shipbuilders engineers and service providers banking insurance and classification societies The SSI
explored for instance how to overcome barriers to the uptake of new technologies and techniques which
improve the operational efficiency of ships potentially delivering energy efficiency savings of 10 or
more and payback periods of less than 5 years They also produce case studies to show good examples
and also develop tools By involving administrations in these kind of initiatives (even free of charge)
they could be actively supported with knowledge about sustainable shipping
26 httpwwwoecdorgstiindworkshopongreengrowthinshipbuildinghtm
TRANL15371 19
Technology Concerns
Barriers Technology Concerns
One of key barriers to the implementation of energy efficient technologies (new and retrofit) relates to
the lack of or limited technology supply chain Furthermore the lack of a technology base for RampD in
some states is a barrier Also the existence of concerns relating to the ability of available energy
efficiency measures to reduce emissions and operational costs and their compatibility with other
measures of energy efficient technologies is a barrier This is typically the problem in very isolated ship
yards
Measures forward
Very successful shipyards (Japan and Korea) have already since many years a large number of
licencing technology transfer and similar agreements and continuously exchange information with
competitors in and outside their countries For instance US shipyards have adopted this methodology
since the 1980s (office of technology assessment 1983)
Further technology sharing could be stimulated through educationalRampD institutes locally regionally
or globally in ship design and building The technology will be transferred to the ship builders once the
students start working there or through cooperation between industry and university In order to
facilitate this we recommend the establishment of partnerships to share expertiseexperience
Typically individuals who know both worlds are the driving force behind successful partnerships (AISBL
2012) These partnerships are built around a shared long term research vision Many partners could
contribute (eg financially) in order to establish the responsible management and research programme
The target of the platform could be for example to provide verified information on real-world energy
efficiency improvements via a monitoring programme
For example in order to stimulate the deployment of energy efficient trucks the Dutch government
provides a website to share audited knowledge and data on about 15 energy efficiency technologies27
Additionally climate financing could be leveraged to reduce the investment risk in unproven
technologies For example IMO Member States could create a demonstration fund that can function as
a guarantee for investments in new and immature technologies28 Similarly investment guarantees
can be provided by funds in the same way governments provide export credits to their companies If
the technology does not deliver the expected fuel-savings the fund can cover the difference and hence
reduce investment uncertainty The main objective being to reduce investment risk
Institutional Concerns
Barriers
27 httpwwwtruckvandetoekomstnl 28 An example of a specific EE fund is httpwwweeefeueligible-investmentshtml
TRANL15371 20
For Flag and Port States complying with new regulations of IMO and EEDI and SEEMP particularly
represent and increased administrative burden It requires revisions and amendments of existing
legislation that need to be implemented at Port and Flag State functions There is currently limited
technical capacity in state institutions to implement these changes especially in developing countries
with a relatively low number of ships under their flag
The lack of financial resources is also a barrier for additional compliance and enforcement activities by
maritime administrations This is particularly an issue for least developed countries and small
developing island states Implementation costs are relatively higher for small Flag States because of
limited abilitycapacity to implement new technical regulations Note that this issue is not specific to
the EEDI and the SEEMP but to most regulatory measures (maritime or other)
Measures forward
Measures to assist states in implementing (existing and new) legislation include
Promote an increased cooperation and communication between administrationswithin
regional administrations of Port and Flag States similarly to what has been suggested in
sections 41 (Awareness raising through capacity building activities such as workshops) and
42 (Establish platform to share regulatory expertiseexperience) Platforms could be
managed by IMO in conjunction with industry and development funds in order to share the
costs as this has been done before for GloBallast for example In that case the IMO is in the
lead (executing agency) but the platform is supporting the collaboration with many
stakeholdersfunding partners The goal of the programme is to assist developing countries
eg via e-learning courses
In addition deterrents need to be put in place to discourage Flag States from performing
substandard inspections A system for detecting sub-standard inspections should be
implemented whereby mandatory Port State Control inspections are carried out in close
proximity to mandatory Flag State inspections (ie the Flag State inspection is carried out
prior to the ship leaving port and the Port State inspection is carried out upon arrival at port)
The two inspections should be carried out under a uniform mandatory checklist The IMO
should monitor inspections and investigate where discrepancies between inspections close in
proximity are detected If a Flag or Port State is found to have failed to meet the requisite
inspection standards penalties in the form of substantial fines should follow
In order to overcome the financial barriers financial assistance to states could help with
capacity building and implementation Financial resources are not only needed in the
implementation of the new regulations (training of government experts) but governments of
Flag States also need to be involved continuously in the ongoing discussion around
developments new EEDI targets for 2020 and beyond which requires continuous availability
of experts to represent the interests of the state (Metselaar 2015) Financial aid can therefore
be supplied in the following forms
Increased financial support for compliance and enforcement activities by maritime
administrations
Financial support could be provided to Flag States so that they have the resources to
properly carry out vessel inspections Consideration should be given to the introduction of
TRANL15371 21
an International Fund Convention set up for this purpose and contributed to by Port
States andor their major oil and other cargo exporters and importers
Commercial
Barriers
Private parties such as ship owners and investors are not always commercially incentivised to make
investments in energy efficiency measures This can be due to the split incentives between owner (who
should make the investment) and charterer (who reaps the cost savings) of a ship (see paragraph 25)
Furthermore access to finance can be problematic for smaller players who operate in niche markets
Measures
Bottlenecks in financing private investments and new financing mechanisms could be addressed during
regional or international workshops that include traditional and new financiers that could finance
investments in energy efficiency technologies
One solution that has been brought forward to address the problem of split incentives is the use of
lsquosmart contractsrsquo (Michele Acciaro 2013) The idea is to change charter contracts in a way that risks
and benefits are shared among charterers and ship owners In such contracts speed choice is more
flexible and the chartering cost of vessels is closer to fuel cost as such ship owners get motivated to
invest in energy-efficient technologies and charterers get stimulated to run vessels in an energy
conserving manner
With respect to the shipbuilding industry the following could facilitate the transfer of technology as
well
Financial assistance to shipyards to be provided at the national level or through other
arrangements
Foreign direct investment in software and hardware as an innovative way to support industry
in implementing the requirements
One type of incentive that governments can provide to enhance industry performance and technology
adoption is a competition for top performers Governments could contribute to a fund from which
money is distributed to the top 10 of best performers in a particular year
Cost estimates
Workshops and training
Capacity building workshops for administrations are estimated at euro 1000 per attendee for an
online workshop (1-2 days) Costs for the organisation of such workshops would include expert fees
and administrative costs These costs could be lower if the course material is already developed
(model workshops) Eg 2 attendees per Flag State for the ten most important Flag States
TRANL15371 22
(covering 74 of total fleet tonnage) comes down to euro 20000 or less in case the courseware is
already existent
A situation that is more conductive to networking and experience sharing is to send people physically
to regional workshops The costs of such workshops including participants travel and hotels for 50
participants would be between euro20000 - euro100000 per workshop based on our international
experience with organising workshops in the field of renewable energy and energy efficiency Costs
could be lower depending on the amount of preparation required cost of location (could be sponsored
by participating states)
Technical training
Trainings already exist for calculating and verifying EEDI including development of tools to calculate
EEDI For example MARIN offers 32h courses over 5 days in the Netherlands for euro 5000 per attendee
(excluding travel and accommodation)29 Lloyds offers similar trainings for similar costs30
Model courses for training may need to be updated depending on identified needs Ecofys estimates
the update of eg an existing EEDI model courses to cost in the order of euro 50000
Online platform for inventory of energy efficiency technologies
Inventories of energy-efficiency technologies already exist (for example in reports like (IMO 2009) and
on websites of for instance DNV-GL the efficiency finder31) but they could be further developed since
the websites are either not independent or incomplete
In order to facilitate information exchange a web-based platform could be established The role of the
platform would be for example to provide verified information on real-world energy efficiency
improvements via a monitoring programme For example in order to stimulate the deployment of
energy efficient trucks the Dutch government provides a website to share audited knowledge and data
on about 15 energy efficiency technologies32 The costs of such a website and corresponding
programme are estimated to be around euro 2 million for a 4 year period Furthermore a platform can be
used to inspire others by showing best practices and can be used for sharing of information regarding
network opportunities like conferences and seminars
Capacity building project
Currently the IMO-GEF-UNDP GloBallast project is a capacity building project it assists developing
countries and their maritime industries in implementing international regulations on ballast water
29 httpwwwmarinnlwebEventsCoursesSpecialist-Course-on-Ship-propulsion-model-tests-and-SpeedPower-trials-for-EEDI-Verifiers-
2731-October-2014htm 30 httpwwwlloydslistcomllsectorship-operationsarticle422262ece 31 httpswwwdnvglcommaritimeenergy-efficiencyefficiency-finderhtml 32 httpwwwtruckvandetoekomstnl
TRANL15371 23
management and preventing risks arising from the transfer of harmful aquatic organisms And has
several aspects that could also be used for knowledge transfer of energy efficiency measures
web-site
e-learning course
databasesdirectories
library collections
newsletter
Regional Task Force (RTFs) to support development and adoption of a regional approach
Develop and implement communication education awareness raising and outreach
programme
Develop introductory and more specialised training packages
Develop model legislations
The total budget for the 2008-2012 period was US$23 million out of which US$564 million represents
a GEF grant the rest being mostly in-kind contributions from the participating countries regional co-
ordinating organisations (RCO) and strategic partners including the private sector
Improved access to information and information sharing with international recognised organisations
including relevant survey and certification training would further promote the different technologies
TRANL15371 24
Conclusions
This study provides an overview of existing technologies which could drastically improve the energy
efficiency of ships Furthermore barriers to transfer and uptake of energy efficient technologies are
analysed and categorised and implications of these barriers are listed in order to facilitate the uptake
of energy efficiency technologies for ships
From this research it is clear that conventional technology is available that can cost-effectively (with a
payback time of less than 15 years) achieve high efficiency gains If the maximum gains per category
are added up (for all but ferry and cruise) this would mean a total efficiency improvement of 35
Even without taking two experimental technologies with potentially high efficiency gains into account
(wind power and air lubrication)
High investments like wind power and contra rotating propellers bring the highest savings (13 ndash 20)
The medium investments are in-between (5-10) and the low investments only bring relatively small
energy efficiency improvements (lt5)
When the ship owner has too few opportunities to share investment with charterers this leads to a split
incentive a ship owner may invest the up-front capital to put in energy-efficient technology but not
receive the benefits This is typically a problem for investments with a high payback time ie the wind
power and contra rotating propellers
The main barriers are related to the transfer of technology to Flag States Flag States are generally
third world and developing nations that often do not have the resources to enforce investigate or
prosecute breaches by their flagged vessels
Several ways to overcome the knowledge transfer barriers were presented that can be categorised as
follows
Workshops and trainings
o Capacity building workshops for administrations
o Regional workshops
Technical training
o Training in calculating and verifying the EEDI
o Development of model courses
Online platform
o Inventory of energy-efficiency technologies
o Creation of a website with all relevant information for the target audience
o Improved access to information and information sharing
o Provide verified information on real-world energy efficiency improvements via a
monitoring programme
TRANL15371 25
The most expensive of the capacity building actions is the capacity building project which takes all
aspects above into account If a project would be developed for knowledge transfer regarding energy
efficiency measures similar to GloBallast which assists developing countries and their maritime
industries in implementing international regulations on ballast water management and preventing risks
arising from the transfer of harmful aquatic organisms the total budget needed would be in the order
of US$23 million for a period of 5 years
TRANL15371 26
References
JFE Group 2013 ldquoJapan Marine Unitedrdquo JFE Group Overview JFE Group AISBL 2012 Making Industry-University partnerships work lessons from succesful collaborations
report Belgium AISBL
Allenstroumlm Bjoumlrn 2013 ldquoWind propulsionrdquo SSPA Sweden AB Gothenburg EffShip March
Aqorau T 2000 Illegal Unreported and Unregulated Fishing Considerations for Developing
Countries paper Honiara Solomon Islands South Pacific Forum Fisheries Agency
BALance 2014 Competitive position and future opportunities of the Euroean Marine Supplies
industry BALance Technology Consulting
Barringhaus David and Robert Olds 1999 OLDS ENGINEERING Maximizing Propulsion Efficiency
Marine Division Accessed Februrar 2015
httpwwwoldscomaumarinemaximizing_propulsion_efficiency
Becker Marine System not dated Becker Bulb Rudders httpwwwbecker-marine-
systemscom05_downloadszzpdfproduct_pdfBecker_Bulb_Rudderspdf Becker Marine
System
mdash 2015 Twisted Full Spade Rudder Accessed Feb 2015 httpbecker-marine-
systemscom03_productsproducts_twisted_full_spadehtml
Bloomberg 2014 China Loses Shipbuilding Crown to South Korea Chart of the Day 9th December
httpwwwbusinessweekcomnews2014-12-09china-loses-shipbuilding-crown-to-south-
korea-chart-of-the-day
Bluebird-Electric 2014 Sipbuilding post World War Two httpwwwbluebird-
electricnetship_boat_design_buildingshipbuilders_ship_repairers_associationhtm
Boat design 2007 Accessed Feb 2015
httpwwwboatdesignnetforumsattachmentspropulsion16743d1193341389-new-
propulsion-sytems-ships-grim-prop-1jpg
Brannigan Paschos Eyers and Wood 2009 Report on International avialtion and Mritime Emissions
in a Copenhagen (post 2012) Agreement Oxfordshire AEA Group
Chen Benjamin Arthur Reed and Ki-Han Kim 1989 A Vane-Wheel Propulsor for a Research and
Development Report Newport David Taylor Research Center
CNSS 2015 Clean North Sea Shipping - Clean Shipping Technology Accessed Februar 2015
httpcleantechcnssnoghg-technologiestechnical-measuresmeasures-related-to-the-hull
Crist Philippe 2009 Greenhouse gas emissions reduction potential from international shipping
Working paper OECD
Daily Times 2015 Nigeria Turkey seek collaboration on ships shipyards 5th January
httpwwwdailytimescomngarticlenigeria-turkey-seek-collaboration-ships-shipyards
Dillingham Gerald L 2000 Progress Made to Reduce Marine Pollution by Cruise Ships but Important
Issues Remain GAO report Washington United States General Accounting Office
DK Group 2015 Silverstream technologies January Accessed January 2015 httpdkgroupeu
DNV 2014 Encouraging Construction and Operation of Green Ships OECD
httpwwwoecdorgstiindC-WP6(2013)12-FINAL-ENGpdf
TRANL15371 27
DNV GL 2015 EFFICIENCY FINDER Accessed Feb 2015 httpwwwdnvglcommaritimeenhance-
performanceefficiency-finderaspx
Ecorys 2012 ldquoGreen growth opportunities in the EU shipbuilding sectorrdquo
ECOSPEED 2015 EUROPEAN MARINE amp MACHINERY AGENCIES LTD Accessed February 2015
httpwwweuropeanmarinecoukECOSPEEDhtm
gcaptain 2012 gcaptain - Propeller Technology to Make Your Ship More Efficient - Accessed Feb
2015 httpgcaptaincompropeller-technology-ship-efficient
Hansen Dinham-Peren and Nojiri 2011 Model and Full Scale Evaluation of a lsquoPropeller Boss Cap
FinsrsquoDevice Fitted to an Aframax Tanker Second International Symposium on Marine
Propulsors smprsquo11 Hamburg Germany June 2011
Hellenic Shipping News 2014 Korean ships sell at fuel-saving premium 22nd December
httpwwwhellenicshippingnewscomkorean-ships-sell-at-fuel-saving-premium
Hindawi 2015 Hindawi Puplishing Cooperation Accessed February 2015
httpwwwhindawicomjournalsijrm2012474785fig4
Hochkirch Karsten and Volker Bertram not dated ldquoSlow Steaming Bulbous Bow Optimization for a
Large Containershiprdquo Accessed Februar 2015 http2021148960resourcepdf5096pdf
Hollenbach Uwe and Juumlrgen Friesch not dated Efficient hull forms ndash What can be gained
Conference ship-efficiency Hamburg 2013 Hamburg HSVA Hamburgische Schiffbau-
Versuchsanstalt GmbH HamburgGermany
ICCT 2011 Reduce Greenhouse Gas Emissions from Ships - Cost Effectiveness of Available options -
white paper Washington DC International Council on Clean transportation (ICCT)
IMO 2011 REDUCTION OF GHG EMISSIONS FROM SHIPS Marginal Abatement Costs and Cost
Effectiveness of Energy-Efficiency Measures Submitted by the Institute of Marine Engineering
Science and Technology (IMarEST) MEPC 62INF7 International Maritime Organisation
IMO 2009 Second IMO GHG Study 2009 London International Maritime Organisation
JSEA 2006 ldquoImproved propulsive performance - Universal applies new energy-saving type Leadge
Bowrdquo Japan Ship Exports Association (JSEA) httpwwwjseaorjpVariableJSea318pdf
Kawasaki 2015 Energy-saving Technology Accessed Feb 2015
httpswwwkhicojpenglishshiptechconservationindexhtml
Leddy Fiona Jayne 2012 ldquoA critical legal analysis of International Shipping in Australian Waters and
the risk of ship-based oil pollutionrdquo Queensland Environmental Practice Reporter vol 17
Marinelog 2014 China white lists 51 shipyards 4 September
httpwwwmarinelogcomindexphpoption=com_k2ampview=itemampid=7667china-white-
lists-51-shipyardsampItemid=231
Metselaar Kees interview by Arno van den Bos 2015 Policy officer at directorate maritime affairs of
ministry of Intrastructure and Environment (February)
Michele Acciaro Peter Nyegaard Hoffmann Magnus Strandmyr Eide 2013 ldquoThe Energy Efficiency
Gap in the Maritime Transportrdquo Journal of Shipping and Ocean Engineering 1-9
MIWB 2015 Maritiem Instituut Willem Barentsz Accessed Feb 2015
httpsmijnmiwbnlnieuwsbriefindexphpdo=showampid_artikel=116
MOL 2011 Energy-Saving Propeller Boss Cap Fins System Reaches Major Milestone - Orders
Received for 2000 Vessels Accessed Feb 2015
httpwwwmolcojpenpr20111145html
TRANL15371 28
Motorship 2014 Gas fuelled ships into the future 31 10 httpwwwmotorshipcomnews101ships-
and-shipyardsgas-fuelled-ships-into-the-future
Nakashima 2015 Nakashima propeller CO LTD Accessed Feb 2015
httpwwwnakashimacojpengproductrudderhtml
Nielsen Shin Lundgren and Faghani not dated Combined Kappel propeller and rudder bulb system
for improved propulsion efficiency Frederikshavn MAN Diesel amp Turbo
OECD 2014 The OECD Council Working Party on Shipbuilding
httpwwwoecdorgindustryindshipbuildinghtm
OECD 2011 ldquoThe Shipbuilding Industry in Turkeyrdquo
office of technology assessment 1983 An Assessment of Maritime Technology and Trade report
Washington DC US Congress
Pakarinen Risto 2007 ldquoNothing common about common railrdquo Twentyfour7 (Twentyfour7) 64-65
Ports amp Ships 2015 Ports and Ships Accessed February 2015
httpportscozanewsarticle_2007_10_17_4038html
Rolls-Royce 2014 Propulsors - Moving your business in the right direction httpwwwrolls-
roycecom~mediaFilesRRolls-Roycedocumentscustomersmarinepropulsion-2014-
tcm92-8664pdf Aalesund Rolls-Royce Commercial Marine httpwwwrolls-
roycecom~mediaFilesRRolls-Roycedocumentscustomersmarinepromaspdf
Schneekluth H and V Bertram 1998 Ship Design for Efficiency and Economy Oxford
Butterworth-Heinemann
Schulze Reinhard 2007 Twisted Rudder - Extreme Design 14 SVA-Forum bdquo Ruder in Theorie und
Praxisldquo Potsdam 7 November 2007 Potsdam Schiffbau-Versuchsanstalt Potsdam GmbH
Selenetrawlers 2015 Selenetrawlers Accessed February 2015
httpwwwselenetrawlerscomcompanydesign-notes
Sepideh Jafarzadeh Ingrid Bouwer Utne 2014 ldquoA framework to bridge the energy efficiency gap in
shippinrdquo Energy 603-612
SetSail 2009 SetSail Accessed February 2015 httpwwwsetsailcomprop-nozzle-comments-by-
an-expert
Shuto Hideki 2010 Super Eco Inland Vessels httpwwwccr-
zkrorgtempwrshp120411Presentations2_04_HShuto_enpdf IHI Marine United Inc
Silberschmidt Noah 2014 ldquoGenerating efficiencies from thin airrdquo SMM Green shipping | Efficiency
httpwwwsilverstream-techcomwp-contentuploads201404HANSA-241112pdf
httpwwwsilverstream-techcomwp-contentuploads201404HANSA-241112pdf
Skinner Ian 2009 EU Tranport GHG Routes to 2050 Technical options for maritime and inland
shipping httpwwweutransportghg2050eucmsassetsTechnical-options-maritime-inland-
waterpdf Brussel European Commission
Statista 2015 ldquoLargest shipbuilding nations in 2013 based on completions in gross tonnagerdquo
httpwwwstatistacomstatistics263895shipbuilding-nations-worldwide-by-cgt
UK DfT 2014 ldquoDfT Port Statistics - World fleet registered trading vessels of 100 gross tons and over
gross tonnage on selected registers 1999-2013rdquo
httpswwwgovukgovernmentcollectionsmaritime-and-shipping-statisticsdata-tables-
associated-with-this-series
TRANL15371 29
Voorham 2013 Assessment of sustainable investment in shipping Master Thesis
Report SDPO13029m Delft 27 th November 2013 Delft Delft University of Technology
WAumlRTSILAuml 2009 ldquoEnergy Evironment Economyrdquo Helsinki Finland WAumlRTSILAuml
mdash 2007 ldquoWaste heat recoveryrdquo Waumlrtsilauml Corporation
Wettstein and Brown 2008 Derating a solution for high fuel savings and lower emissions
Winterthur Waumlrtsilauml Switzerland Ltd
Wind Chellenger Project HP 2015 Wind Chellenger Project HP Accessed Feb 2015 httpwindku-
tokyoacjpindex_enhtml
TRANL15371 30
Appendix I - World fleet registered trading vessels
Table 3 World fleet registered trading vessels of 100 gross tons and over 2009-2013 Source UK DfT 2014
Flag Country 2009 2010 2011 2012 2013
(World Total) 8448 9130 9831 10343 10725
Panama 1886 1979 2084 2158 2172
(European Union) 1900 1979 2074 2051 2106
Liberia 908 1037 1167 1238 1241
Marshall Islands 475 590 711 811 900
Hong Kong 449 553 678 785 854
Singapore 398 434 512 592 677
Malta 348 380 438 450 496
Bahamas 452 469 481 483 485
Greece 388 407 411 411 415
China 282 327 356 388 411
United Kingdom (inc IOM and CI) 258 273 294 300 288
Cyprus 201 205 207 197 203
Japan 138 156 167 178 192
Italy 150 169 181 180 176
Norway 152 145 143 144 145
Germany 152 155 153 137 123
Denmark 107 115 113 113 122
Korea South 120 124 116 111 112
Indonesia 69 82 91 101 111
Bermuda 94 100 106 109 105
Antigua amp Barbuda 100 107 111 106 100
United States of America 107 108 102 99 97
India 83 83 89 85 82
Netherlands 76 61 67 66 69
Turkey 54 58 62 64 59
Malaysia 69 72 71 62 57
France 63 63 64 56 53
Russia 47 49 49 51 52
Philippines 50 51 50 43 43
Cayman Islands 27 29 32 32 31
Taiwan 25 26 27 30 31
Iran 09 08 05 21 31
Thailand 25 26 22 26 29
Sweden 39 35 33 28 27
St Vincent amp the Grenadines 47 42 37 28 24
Canada 24 24 25 24 23
Spain 22 25 26 25 23
Kuwait 23 19 24 24 22
Brazil 20 20 19 19 20
Cambodia 18 17 13 13 12
TRANL15371 31
Appendix II - Most important shipbuilding
countries
China
China is an emerging shipbuilder that overtook South Korea during the 2008-2010 global financial crisis
as they won new orders for medium and small-sized container ships (Bloomberg 2014 Bluebird-Electric
2014)
Figure 14 delivery of vessels from Chinese and South Korean shipyards in million compensated gross tons a measure
of building time and human resources used per ton Source (Bloomberg 2014)
China has more than 1600 shipyards Analysts have predicted that about one third of them will fold
as the industry struggles with overcapacity Last year China laid out a three year plan for industry
restructuring that urged yards to concentrate on building higher quality vessels and local governments
to halt approvals for new projects (Bluebird-Electric 2014)
After two decades of a loan-fuelled boom Chinarsquos shipbuilding industry has become saddled with debt
and overcapacity prompting some private firms to seek financial assistance from the state In
September the government issued a list of 51 shipbuilders it deemed worthy of public support
(Marinelog 2014)
TRANL15371 32
New additions to the white list include subsidiaries of the China State Shipbuilding Corporation (CSSC)
and the China Shipbuilding Industry Corporation (CSIC) and the AVIC Weihai Shipyard owned by the
Aviation Industry Corporation of China (AVIC) (Marinelog 2014)
South Korea
By the end of 2014 it seemed South Korea has overtaken China again as the worlds largest
shipbuilding country with a global market share of about 30(see Figure 14) (Bloomberg 2014)
(Bluebird-Electric 2014) South Korea leads in the production of large vessels such as cruise liners
super tankers LNG carriers drill ships and large container ships
South Koreas shipyards are highly efficient with the worlds largest shipyard in Ulsan operated by
Hyundai Heavy Industries slipping a newly built $80 million vessel into the water every four working
days South Koreas big three shipbuilders Hyundai Heavy Industries Samsung Heavy Industries
and Daewoo Shipbuilding amp Marine Engineering dominate global shipbuilding with STX Shipbuilding
Hyundai Samho Heavy Industries Hanjin Heavy Industries and Sungdong Shipbuilding amp Marine
Engineering also ranking among the top ten shipbuilders in the world In 2007 STX Shipbuilding further
strengthened South Koreas leading position in the industry by acquiring Aker Yards the largest
shipbuilding group in Europe (The former Aker Yards was renamed STX Europe in 2008) In the first
half of 2011 South Korean shipbuilders won new orders to build 25 LNG carriers out of the total 29
orders placed worldwide during the period
To maintain their market position Korean yards also focus more and more on greening opportunities
The Korean government introduced a GHG emission reducing program in 2008 The program is aiming
at reducing GHG emissions throughout all economic sectors including the shipping and shipbuilding
industry Also the Japanese Shipbuilding Association (SAJ) is looking into the possibilities to reduce
GHG emissions so that the shipbuilding industry becomes greener and more competitive (Ecorys
2012)
Japan
Japan had been the dominant ship building country from the 1960s through to the end of 1990s but
gradually lost its competitive advantage to the emerging industry in South Korea which had the
advantages of much cheaper wages strong government backing and a cheaper currency South Korean
production overtook Japans in 2003 and Japanese market share has since fallen sharply
The Philippines
The Philippines has placed fourth among shipbuilding nations around the world producing more than
six million deadweight tonnes of ships built in 2012 The country is anchored by South Korean Hanjin
and Japans Tsuneishi shipbuilders The country has shipyards in Subic and Cebu
TRANL15371 33
Europe
For several decades European shipyards have been facing strong global competition from especially
Asian enterprises (Japanese yards in the 1950s and 60s Koreans from the 1970s and 80s and Chinese
since the 1990s) In Europe this has led to an almost complete exit from the mass production segments
of tankers bulkers and containerships Response of the EU industry has been to focus on the higher
value more complex ship types such as ferries and passenger ships non-cargo vessels and general
cargo ships In addition only limited numbers of vessels of the same type are being built (in contrast
with bulk vessels which are mass produced) Europe has a 77 percent market share in building
passenger vessels (including both cruise ships as well as ferries) and a 17 percent share in the
construction of non-cargo vessels (Ecorys 2012) These segments make up a relatively small share of
the world orderbook (in CGT) However in value they represent a much higher share due to their
relatively sophisticated characteristics The position of the European shipbuilding industry in the
manufacturing of specialised innovative vessels is still strong At the same time European equipment
manufacturers have acquired a leading role in quality products especially in complex high value
equipment components
Figure 15 World orderbook and CESA orderbook by ship type in 2010 (CGT x 1000) (Source Ecorys 2012)
Regarding the marine equipment sector the European industry is renowned for propulsion cargo
handling communication automation environmental and security systems This equipment is not only
destined for complex European-built ships but also exported to Asian yards whether or not requested
by their clients (Ecorys 2012)
Compared to the ship construction sector the marine equipment segment is highly heterogeneous and
consists of companies that are often also active in other business areas (ie automotive or aircraft
industry) A study by (BALance 2014) found that the European marine equipment industryrsquos
TRANL15371 34
competitiveness lies in a strong market position and technological leadership at least for globally active
European marine supply companies who build their position on a strong infrastructure and co-operative
partners skill of their employees and close relationship with their customer base Conversely identified
weaknesses are the cost level in Europe and the heterogeneous structure of the industry with many
SMEs which hinder in some cases attempts to follow the markets by globalisation strategies
Turkey
Shipbuilding in Turkey has evolved from an old traditional activity in Anatolia to an internationally
recognised industry especially since the early 1990s The industry has modern shipyards that can build
ships yachts mega-yachts and sailing boats as well as carrying out extensive repair and conversion
works Turkeyrsquos shipyards are mainly located in the Marmara Region namely Tuzla Yalova and İzmit
which have developed into dynamic shipbuilding centres Also in recent years the emerging Black Sea
and Mediterranean Regions have increasingly attracted shipyard investments
In the last decade in parallel with developments in the global market Turkish shipbuilding experienced
a several-fold increase in its shipbuilding and export capacity including a significant product
diversification According to order books this resulted in Turkey being regularly placed in the top ten
countries on the basis of its deadweight (dwt) production and in the top five countries by the number
of ships
In recent years Turkey has increasingly tapped into niche markets which in turn has led to a growing
participation by Turkish shipyards in the international trade in new ships In parallel there has also
been strong growth in the marine equipment manufacturing sector which could increasingly also tap
the export market These developments reflect in part the strategic location of the yards the
experienced workforce the quality of production and Turkeyrsquos significant role as a political cultural and
economic bridge between Europe and Central Asian and Middle Eastern economies (OECD 2011)
ECOFYS Netherlands BV | Kanaalweg 15G | 3526 KL Utrecht| T +31 (0)30 662-3300 | F +31 (0)30 662-3301 | E infoecofyscom | I wwwecofyscom
ECOFYS Netherlands BV
Kanaalweg 15G
3526 KL Utrecht
T +31 (0) 30 662-3300
F +31 (0) 30 662-3301
E infoecofyscom
I wwwecofyscom
HOW TO OBTAIN EU PUBLICATIONS
Free publications
bull one copy
via EU Bookshop (httpbookshopeuropaeu)
bull more than one copy or postersmaps
from the European Unionrsquos representations (httpeceuropaeurepresent_enhtm)
from the delegations in non-EU countries
(httpeeaseuropaeudelegationsindex_enhtm)
by contacting the Europe Direct service (httpeuropaeueuropedirectindex_enhtm)
or calling 00 800 6 7 8 9 10 11 (freephone number from anywhere in the EU) () () The information given is free as are most calls (though some operators phone boxes or hotels may charge you)
Priced publications
bull via EU Bookshop (httpbookshopeuropaeu)
Priced subscriptions
bull via one of the sales agents of the Publications Office of the European Union
(httppublicationseuropaeuothersagentsindex_enhtm)
doi 102834880780
ML-0
1-1
5-4
39-E
N-N
[Ca
talo
gu
e n
um
be
r]
TRANL15371 1
1 Introduction
The negotiations within the International Maritime Organization (IMO) on enhancing the energy
efficiency of and reducing the greenhouse gas emissions from international shipping are a top-priority
for the European Commission in view of the European Unions preference for a global measure to
address greenhouse gas emissions from shipping
In July 2011 the IMO adopted two energy efficiency measures which entered into force in 2013 the
Energy Efficiency Design Index (EEDI) for new ships and the Ship Energy Efficiency Managements Plan
(SEEMP) for all ships1 Nevertheless the IMO recognises the need for further action to reduce emissions
from international shipping in view of the continued expected growth of the world economy and
associated transport demand Consequently the IMO began working on further measures to increase
the energy efficiency of international shipping including the development of a global data collection
system as a first step in April 2014
At the time of the adoption of the EEDI and the SEEMP it was agreed to complement them with a
Resolution on the promotion of technical cooperation and transfer of technology relating to the
improvement of energy efficiency of ships The Resolution was intended to provide a framework for the
promotion and facilitation of capacity building technical cooperation and technology transfer to
support in particular in developing countries the implementation of the EEDI and the SEEMP The
Resolution was adopted in 2013 and an expert group tasked to ensure the Resolutions effective
implementation was established in April 2014
The EU is actively contributing to the work of the IMO Ad Hoc Expert Working Group on Facilitation of
Transfer of Technology for Ships (AHEWG-TT) to ensure effective implementation of the Resolution and
incidentally advance the related IMO negotiations on further measures to increase the energy efficiency
of international shipping
The goal of this project is to contribute to the work of the AHEWG-TT and to further stimulate the
effective implementation of the International Maritime Organization (IMO) Resolution on the promotion
of technical cooperation and transfer of technology2
To achieve this goal this study provides a short overview of relevant stakeholders and existing
technologies which could improve the energy efficiency of ships Furthermore barriers to transfer and
uptake of energy efficient technologies are categorised and analysed and possible measures to
overcome these barriers are being proposed
1 Amendments to MARPOL Annex VI (prevention of air pollution from ships) 2 httpwwwimoorgOurWorkEnvironmentPollutionPreventionAirPollutionPagesTechnical-Co-operationaspx
TRANL15371 2
2 Relevant Stakeholders
The IMO resolution on the promotion of technical cooperation and transfer of technology (regulation
23) is intended to support states which request technical assistance Three main categories of
stakeholders were identified that can be considered of relevance
(1) Shipbuilding nations where the ships are produced
(2) Flag States (where the ships are registered) and Port States who are allowed to inspect foreign
ships compliance to international regulations
(3) Ship owners and ship charterers who are responsible for the design and use of the ships
TRANL15371 3
Global Shipbuilding Nations
Shipbuilding nations typically provide incentives for the shipbuilding industry in their country Therefore
they play a role in the transfer of technologies to their industry
In 2012 some 3655 ships were built worldwide The largest share of the tonnage was built in China
South Korea and Japan (Figure 1)
Figure 1 Ship building in 1000 gross tons Source (Statista 2015) quoting IHS and Shipbuilders Association of
Japan
The worldrsquos leading shipyards include South Korearsquos Hyundai Heavy Industries Japanrsquos Mitsubishi
Heavy Industries and Chinarsquos Shanghai Waigaoqiao (Statista 2015) China South Korea and Japan
together are responsible for building about 90 of the ships in gross tons
Flag States and their role in the implementation of MARPOL
Flag States have the responsibility for enforcing the rules set out under MARPOL Every Flag State has
the duty to ensure that its vessels fully comply with the applicable articles of MARPOL3
3 MARPOL Regulation 6
TRANL15371 4
At the end of 2013 about one-fifth of merchant vessels were registered in Flag State Panama 12 in
Flag State Liberia and 8 in the Flag State Marshall Islands (Figure 2 and (UK DfT 2014)) Therefore
already 40 of the world fleet are registered in these three Flag States
Figure 2 World fleet registered trading vessels of 100 gross tons and over 2009-2013 Source UK DfT 2014
Under MARPOL these parties (Flag States) can enforce ship-owners and operators obligations in three
main ways
- by surveyinspection of vessels to ensure that they meet minimum requirements4
- by monitoring vessel compliance with oil discharge requirements5 (not relevant for energy
efficiency) and
- by implementing punishments for failure to comply with requirements6
Surveys
MARPOL Annex VI contains a set of requirements for survey and issuance of International Air
Pollution Prevention Certificate (IAPP) and regulations regarding
Ozone depleting substances from refrigerating plants and firefighting equipment
Nitrogen Oxides (NOx) from diesel engines
Sulphur Oxides (SOx) from diesel engines
4 MARPOL article 5 5 MARPOL Annex I Chapter 4 Regulation 31 6 MARPOL article 4
TRANL15371 5
Volatile Organic Compound Emissions from cargo tanks of oil tankers
Shipboard Incineration
Fuel oil quality
Flag States must conduct an initial survey before a new ship is put into service and before the IAPP is
issued for the first time a renewal survey at intervals specified by the Administration but not exceeding
five years an intermediate survey within three months before or after the second anniversary date or
within three months before or after the third anniversary date of the certificate an annual survey within
three months before or after each anniversary date of the certificate and after prescribed repairs an
additional survey7
For the EEDI and the SEEMP a new certificate the International Energy Efficiency Certificate (IEEC)
was established and must be kept available on board for inspectionssurveys The IEEC Certificate will
be issued for new build ships upon the initial survey before the ship is put into service and for existing
ships of 400 gross tonnage and above The IEE Certificate will be issued once for each ship and is valid
throughout the lifetime of the ship (except flag change major conversion or ship going out of service)
There are no follow-up surveys on the IEEC Certificate
The IMO has created guidelines for surveys that Flag States should follow The energy efficiency related
one is
2014 Guidelines on survey and certification of the Energy Efficiency Design Index (EEDI)
(resolution MEPC254(67))
A Flag State cannot allow a vessel that does not pass inspection to sail until it complies with MARPOL8
An International Energy Efficiency Certificate in accordance with the provisions of regulation 54 to
any ship of 400 gross tonnage and above is needed before that ship may engage in voyages to ports
or offshore terminals under the jurisdiction of other Parties
Punishments for failure to comply
In case of failure to comply the authority carrying out the inspection may detain the ship Article 7 of
MARPOL ensures that unduly delay or detain will be avoided where possible or compensated
A Flag State is obliged to investigate an incident upon receipt of notification or evidence that one of its
vessels has breached MARPOL If the investigations reveal that a breach has occurred the Flag State
has further obligations to initiate legal proceedings against the vessel and report back to the reporting
state on actions taken9
7 MARPOL Annex VI Chapter 2 Regulation 5 8 MARPOL Annex VI Chapter 2 Regulation 6 9 MARPOL article 6
TRANL15371 6
Also other parties are allowed to inspect vessels under MARPOL Article 6 when violations are detected
or for regular inspections A Party may also inspect a ship to which the present Convention applies
when it enters the ports or off-shore terminals under its jurisdiction if a request for an investigation is
received from any Party together with sufficient evidence that the ship has discharged harmful
substances or effluents containing such substances in any place
Role of Port States
Under ldquoPort State Controlrdquo arrangements Port States also have the authority to conduct vessel surveys
on ships which visit their ports and to detain those ships that fall below MARPOL requirements In
relation to MARPOL Annex VI chapter 4 any port state inspection shall be limited to verifying when
appropriate that there is a valid International Energy Efficiency Certificate on board10
Cooperation between Port and Flag States
Under MARPOL parties are required to co-operate in detecting vessel violations and are required to
use all practical measures to detect and monitor violations If a State has evidence of a violation they
are obligated to forward this evidence to the vesselrsquos Flag State
All ships flagged under countries that are signatories to MARPOL are subject to its requirements
regardless of where they sail and member nations are responsible for vessels registered under their
respective nationalities
When incidents occur outside the countrys jurisdiction or jurisdiction cannot be determined the
country refers cases to Flag States in accordance with MARPOL Some States are not happy with the
lack of response from Flag States United States experience of Flag States not responding has led to
new policy which would take direct enforcement action against vessels for MARPOL V violations
occurring between 3 and 200 nautical miles from the United States rather than referring such violations
to the flag states (Dillingham 2000)
Ship owners and charterers
A ship owner is the owner of a commercial ship A ship owner is someone who equips and exploits a
ship usually for delivering cargo at a certain freight rate The ship owner determines the specifications
of the ship and its energy efficiency measures but the benefits of low fuel consumption are not always
theirs when the ship is chartered to someone else
Depending on the type of ship and the type of charter normally a standard contract form called a
charter party is used to record the exact rate duration and terms agreed between the ship owner and
the charterer
10 MARPOL Annex VI Regulation 10
TRANL15371 7
A charterer may be a party without a cargo who takes a vessel on charter for a specified period from
the owner and then trades the ship to carry cargoes at a profit above the hire rate In some cases a
charterer may own cargo and employ a shipbroker to find a ship to deliver the cargo for a certain price
Two main types of charter can be distinguished time charter and voyage charter In a voyage charter
the owner is still responsible for the port fuel and crew costs In a time charter the charterer selects
the ports and directs the vessel where to go The charterer pays for all fuel the vessel consumes port
charges commissions and a daily hire to the owner of the vessel
When there are too few opportunities to share investment with charterers this leads to a split incentive
a ship owner may invest the up-front capital to put in energy-efficient technology but doesnrsquot then
recoup the costs from fuel savings as they charter their ships out as this goes to the charterers This
problem is particularly apparent for short-term time charters11
Conclusions
Regarding energy efficiency the work of the AHEWG-TT12 has shown that the main shipbuilding nations
all have access to the necessary technologies provided there is demand for them It has also been
noted that there is no need for transfers of intellectual property rights13
One of the major barriers to the effective implementation of the EEDI and the SEEMP is the heavy
reliance it places on Flag States for inspection of vessels and enforcement of provisions During the
1970rsquos ships were being reflagged from high tax and high regulation countries such as the United
States and the United Kingdom to countries offering Flags of Convenience (lsquoFOCrsquo) Under FOCs ship-
owners pay less tax to the relevant Flag State and are able to evade the majority of the environmental
and construction standards set out under MARPOL (Leddy 2012) The main reason for that is that
several Flag States are not signatories to all MARPOL Annexes (eg as of 20142015 the Bahamian
Bolivian Cambodian North Korean Georgian Honduran Lebanese and Sri Lankan flags of
convenience had not ratified all MARPOL treaty annexes III-VI14 15)
Many FOCs are developing nations that do not have the resources to enforce investigate or prosecute
breaches by their flagged vessels (Aqorau 2000) As of 2014 55 of merchant ships are flagged by
FOC and 40 of ships are flagged by FOCdeveloping countries MARPOL only provides guidelines for
Flag States to follow when surveying vessels under regulation 6 but none of these guidelines are
mandatory Conversely Port States which are developed are better equipped to bear the cost of
inspection investigation enforcement and prosecution costs However in relation to EEDI and the
11 httpssi2040orgwhat-we-dowork-streamsfinance 12 MEPC 6831 Progress report of the Ad Hoc Expert Working Group on Facilitation of Transfer of Technology for Ships 13 Submission of the United States on Task 3 of the Ad Hoc Expert Working Group on Facilitation of Transfer of Technology for Ships Jan
2015 14 wwwics-shippingorgdocsflag-state-performance-table 15 httpwwwimoorgAboutConventionsStatusOfConventionsPagesDefaultaspx status of conventions
TRANL15371 8
SEEMP port state control is limited to verifying when appropriate that there is a valid International
Energy Efficiency Certificate on board
We therefore conclude that there needs to be a focus on enabling Flag States and Port States that lack
the resourcescapacity to enforce the EEDI and the SEEMP in order to further stimulate the adoption
of energy efficiency technologies Also attention should be paid to overcoming the barrier of split
incentives ie where the benefits of energy efficiency measures are not transferred from the charterer
to the investor (owner)
TRANL15371 9
3 Energy Efficiency Measures for Ships
In order to understand the important energy efficiency measures that can help improve energy
efficiency from shipping it is interesting to see the split between new-built ships and existing fleet In
2012 some 3655 merchant ships were delivered worldwide about 6 of the worldrsquos merchant fleet
of about 60000 The average age of the merchant fleet is 19 years Therefore measures for both new
ships and retrofits for old ships are important for improving the energy efficiency in the next decades
If only the new ships would be targeted only 50 of the fleet would be more efficient in the next
decades while there are many retrofit measures available The total fleet can be broken down to about
4000 passenger ships just under 14000 tankers and about 37000 dry cargo ships including about
5000 container ships (Statista 2015)
In order to identify the most interesting energy efficiency measures for ships we used the information
from several reports to develop a long-list Many measures improve the efficiency in the order of up to
5 Here we would like to focus on measures that result in high savings that can be applied to many
ship types and preferably also to existing ships The resulting short-list is presented in the next table
We used the main categories identified by AHEWG-TT for structuring the measures
The main categories defined by AHEWG-TT are
1 Hull
2 Main Engine
3 Auxiliary engines
4 Propellers and rudders and
5 Control systems
Since the auxiliary engines typically consume only a fraction of the energy that goes to the main
engines their energy efficiency measure results do not show in the short-list below The measures are
worked out in more detail in the paragraphs below The main engine and auxiliary engine improvements
are covered in the same paragraph
The common rail upgrade is a simple measure that can be easily applied to all ships even when the
ship is not in the dry-dock The details are available in the paragraph about engines
From the list it is clear that conventional technology is available to achieve high efficiency gains If the
maximum gain per category is added up (for all but ferry and cruise) this would mean a total efficiency
improvement of 35 even without taking two experimental technologies with potentially high efficiency
gains into account (wind power and air lubrication) Note that some technologies are not applicable to
all ships
In order to find possible financial barriers the investments are rated from ldquovery lowrdquo to ldquohighrdquo relatively
to the size of the ships The same measure on a larger ship is obviously more expensive
TRANL15371 1
Table 1 Inventoryranking of energy efficiency measures
Main category
Measure Estimated efficiency (range)
Efficiency at average circumstances
Ease of installation
Payback time
Investment Implementation References
Hull Bow optimisation
25-20 10 all ship types
short (lt3 years)
Medium conventional technology
(IMO 2009 IMO 2011 Crist 2009 Hochkirch und Bertram not dated)
Main Engines
Wind power 5-44 20 only special ship types
long (gt15 years)
High experimental technology
(IMO 2011 IMO 2009 Crist 2009 ICCT 2011 Brannigan et al 2009 Allenstroumlm 2013)
Propellers and Rudders
Ducted propeller
1-20 10
all ship types except ferry and cruises
medium (4-15 years)
Medium conventional technology
(IMO 2011 IMO 2009 Crist 2009 ICCT 2011)
Propellers and Rudders
Contra-rotating propellers
6-20 13 only special ship types
long (gt15 years)
High conventional technology
(IMO 2011 IMO 2009 Crist 2009 WAumlRTSILAuml 2009 Shuto 2010)
Propellers and Rudders
Wheels 10 10
all ship types except ferry and cruises
short (lt3 years)
Medium conventional technology
(IMO 2009 Schneekluth und Bertram 1998 Brannigan et al 2009)
Control Systems
Waste heat recovery
6-10 8 new build only
medium (4-15 years)
Medium conventional technology
(IMO 2011 IMO 2009 Crist 2009 WAumlRTSILAuml 2007 ICCT 2011)
Propellers and Rudders
Rudder bulb 2-5 4
all ship types except ferry and cruises
medium (4-15 years)
Low conventional technology
(IMO 2011 IMO 2009 Nielsen et al not dated Crist 2009 ICCT 2011)
Propellers and Rudders
Post swirl fins
2-5 4
all ship types except ferry and cruises
short (lt3 years)
Low conventional technology
(IMO 2009 MOL 2011 Hansen Dinham-
Peren und Nojiri 2011 Nielsen et al not
dated)
Hull Hull coating 1-9 5 all ship types
short (lt3 years)
Low conventional technology
(IMO 2011 IMO 2009 ICCT 2011 Voorham 2013 Crist 2009)
Hull Air lubrication
5-15 9 new build only
medium (4-15 years)
Medium experimental technology
(IMO 2011 IMO 2009 Crist 2009 DK Group 2015 CNSS 2015 ICCT 2011)
Propellers and Rudders
Twisted rudder
2-4 3
all ship types except ferry and cruises
medium (4-15 years)
Low conventional technology
(IMO 2009 Schulze 2007 Nakashima 2015 Becker Marine System 2015 Nielsen et al not dated Hollenbach und Friesch not dated Rolls-Royce 2014)
Main Engines
Main engine de-rating
2-4 3
all ship types except ferry and cruises
medium (4-15 years)
Low conventional technology
(IMO 2011 IMO 2009 Crist 2009 Wettstein und Brown 2008 DNV GL 2015)
Auxiliary engines
Common rail upgrade
- - all ship types
medium (4-15 years)
Very Low conventional technology
(DNV GL 2015) (ICCT 2011) (IMO 2009)
Main Engines
Common rail upgrade
01-05-
03 all ship types
medium (4-15 years)
Very low conventional technology
(IMO 2009 Pakarinen 2007 ICCT 2011 Crist 2009)
TRANL15371 2
Hull and superstructure
In general the optimisation of hull and superstructure focuses on minimising the resistance by reducing
the wave resistance and friction between water and hull It is important to recognise which type of
vessel is to be optimised The reduced frictional resistance increases energy performance of the vessel
particularly at low speeds Operability and performances of the ship must be considered in detail The
improvements measures are generally applied at new-built ships but also applicable to retrofitting
Bow optimisation
The different bow optimisations can improve the water flow around the hull and reduce the wave-added
resistance for large vessels with high block coefficient operating within commercial speed ranges The
average energy reduction potential ranges from 25-20 on average 10 (Crist 2009 IMO 2011
Voorham 2013)
Figure 3 Left The green line characterises the ordinary bow wave of the hull The blue line characterises the wave
formed by the bulb The red line is the sum of these two The altitude of the bow wave is noticeably reduced which
reduces the hull drag associated with the bow wave This improves fuel economy and increases range (Selenetrawlers
2015) Right Ordinary bulbous bow leadge bow and ax-bow shape (JSEA 2006)
The below-the-waterline extension of the bulbous bow (Figure 3) modifies the way the water flows
around the hull reducing drag and thus increasing speed range fuel efficiency and stability An altered
design is the ax-bow (Figure 3) The narrow designed bow slashes through the water in order to reduce
slamming and reduces the size of bow generated wave The propeller can act more efficient due to the
absence of slamming The ax-bow allows the ship to steer well to maintain speed and the engine to
save fuel (Crist 2009 IMO 2009) If the bulbous bow is modified during a regular docking period the
investment is estimated to have short payback of about 1-3 years It is most promising for container
vessels (DNV GL 2015 Hochkirch und Bertram not dated)
Barriers The bow optimisation (as retrofit) needs to be done in the dry dock Dry-docking is not
regularly happening for existing ships because it means that the ship cannot operate and economic
losses are suspected Another obstacle might arise due to restricted access to the original contractual
hull plans since shipyards are not always keen to provide detailed plans on their vessels to prevent
TRANL15371 3
imitation (Hochkirch und Bertram not dated DNV GL 2015) A major obstacle is the split incentive
between ship owner and operator Ship owners are responsible for investing in these technologies and
ship operators are those who pay for the fuel consumption and benefit from such technologies (ICCT
2011)
Technical maturity The technique is available on the market and is effective Only conventional
material is needed and redesign can be done in a few weeks16
Applicability Applicable to all ship types but most efficient for ships with a high block coefficient like
tankers and bulk carriers since the reduction of the wave-added resistance is most impacting (IMO
2009)
Hull coating
Hull coatings (Figure 4) can lower frictional resistance and limit fouling by aquatic organisms It can
save between 1-9 fuel consumption on average 5 (ICCT 2011 Voorham 2013 Crist 2009)
Figure 4 Example of hull coating (ECOSPEED 2015)
One way of lowering the frictional resistance is to improve the smoothness of a hull by means of
coatings that reduce fouling The costs are lifetime cost reduction and have to be recur every five years
to be able to gain the fuel benefit
Barriers A new application is typically necessary during each dry-docking The self-polishing coating
must be renewed after a 3-5 years period (IMO 2009) A major obstacle is the divided interest between
ship owner and operator Ship owners are in charge for investing in these technologies and ship
operators are those who pay for the fuel consumption and profit from such technologies (ICCT 2011)
Technical maturity Coating techniques are available on the market and roughly 5 of newly painted
ships are painted with one of the advanced coating systems presently available (IMO 2011 ICCT 2011)
The payback time is short (ICCT 2011) or 0-2 years according to others17
Applicability The technology is applicable to all vessels
Air lubrication
The air lubrication technique creates a layer of bubbles underneath an already streamlined hull in order
to further reduce friction An automation system regulates the compressorsblowers depending on
16 httpwwwship-efficiencyorgonTEAMpdf14-Ship20efficiency20seminar20-20CMA20CGM-
20HydrOcean20120CMA20pdf 17 httpswwwdnvglcommaritimeenergy-efficiencyefficiency-finderhtml
TRANL15371 4
speed The blower keeps holes filled with air and required pressure A thin layer of bubbles trailing
behind of each cavity merge into single large ldquoair layerrdquo for the whole flat bottom part of the hull and
reduces the friction (Figure 5) Depending on the ship type the estimate fuel efficiency ranges between
5-15 (on average 9) where tankers and bulkers can reduce more (10-15 on average 125) in
comparison to container vessels (5-9 on average 7) (IMO 2009 DK Group 2015 CNSS 2015 ICCT
2011 Voorham 2013)18
Figure 5 Schematic view of air lubrication (DK Group 2015)
Barriers Large capital investment requirements with split incentive The vessel owners are
accountable for investing in these technologies whereas vessel operators recompense for the fuel
consumption and benefit from such technologies (ICCT 2011)
Technical maturity The technology is available on the market but still in a pilot phase Sea trials
have been performed with small demonstration ships There are no vessels operating commercially
that currently use this technique Specifications about the payback time vary from short to medium
(Silberschmidt 2014 Skinner 2009)
Applicability The original technology would be likely be applied to new-built ships with at least a
partly flat bottom and a minimum length of 225 metres since the compressor may have technical
problems maintaining air cavities for deep draft ships (IMO 2011 CNSS 2015) Air lubrication can be
used for retrofitting as well (CNSS 2015)
Engines
Speed reductions on existing vessels provide opportunities for engine optimisation on low power
(321) Similar measures as de-rating for the main engines that could be implemented are cylinder
cut-out and new torsional vibration calculation (IMO 2009)
18 It has to be noted that the extra fuel use caused by the system itself should also be taken into account
TRANL15371 5
Another propulsion supportive measure with a high potential measure is wind power This is also
explained in more detail below In order to also provide a measure with a lower improvement potential
per ship but simple and applicable to all ships we describe the common rail system for fuel injection
Main engine de-rating
Slow steaming vessels are known as one of the most effective energy saving measure The potential
comes mainly from the operational behaviour side From the technical side the specific fuel oil
consumption will decline when a ship is no longer operated at its design speed
The design speed can be reduced by de-rating the main engine (IMO 2011 IMO 2009) Reduction of
power combined with injection timing advanced to restore peak combustion pressure can achieve a
certain gain in shaft efficiency Fuel efficiency can be improved by 2-4 when de-rating is performed
for loads lower than the maximum design load (Wettstein und Brown 2008 Crist 2009) on average
3 energy efficiency potential (Crist 2009) Operational costs would be lower mainly due to fuel
savings (DNV GL 2015 Crist 2009 Wettstein und Brown 2008)
Barriers A slower vessel will have lower incomes as it is not capable to perform as much transport
load per unit of time as a faster vessel De-rating the engine is usually done when it is clear that the
ship will become a slower steaming ship There is a split incentive between vessel owners who are
responsible for investing in these technologies and vessel operators who are those who compensate
for the fuel consumption and benefit from such technologies (ICCT 2011)
Technical maturity This technique has been proven as successful particularly on older engines
which are normally built with a low compression ratio and thereby have a significant potential to
improve their efficiency (IMO 2009) De-rating measures have a low to medium payback time (Crist
2009 DNV GL 2015)
Applicability The technologies are available on the market It is applicable to all vessels (DNV GL
2015)
Common-rail upgrade (common-rail fuel injection)
Engines with common-rail fuel injection handle low-load working modes much better (IMO 2009) A
common-rail fuel injection is technique of injecting fuel into an engine cylinder under total control and
thereby achieving optimal combustion Common-rail allows the start and duration of injection
independent of the position of the pistons in that way permitting an operationally optimised injection
per stroke In a normal diesel engine fuel is injected at a static rate by a pump and common practice
is to optimise this pump to run at an optimal setting for the ideal injection time (Pakarinen 2007) The
energy efficiency potential is estimated between 01-05 on average 03 (ICCT 2011 IMO 2009)
Barriers Additional electronics can also introduce possibilities for failures However recent
advancements have increased the systems popularity19 There is a split incentive between vessel
19 httpwwwmarineinsightcommarinean-overview-of-common-rail-system-in-marine-engines
TRANL15371 6
owners who are responsible for investing in these technologies and vessel operators who are those
who compensate for the fuel consumption and benefit from such technologies (ICCT 2011)
Technical maturity This measure is available on the market (ICCT 2011) Payback time is short to
medium with an average of 5 years (IMO 2009 Crist 2009)
Applicability This measure is applicable to new and retrofit vessels It is applicable for tanker- bulk-
container- and Roro-ships (Crist 2009)
Auxiliary engines and systems
Based on our own estimation auxiliary engines improvement are not bringing gt2-4 energy savings
because auxiliary engines consume much less fuel than the main engine Similar measures as de-rating
for the main engines and common rail upgrade could be implemented for the auxiliary engine
Other options for improving auxiliary systems are speed control of pumps and fans control strategies
of cooling water systems room ventilation redesign of piping and instruments advanced computation
of airgas temperature distribution with reduced storage ventilation and with optimised ventilation
systems (DNV GL 2015)
Barriers There is a split incentive between vessel owners who are responsible for investing in these
technologies and vessel operators who are those who compensate for the fuel consumption and benefit
from such technologies (ICCT 2011)
Technical maturity This measure is available on the market (ICCT 2011) It is easy to apply and
uncomplicated in maintenance (DNV GL 2015) Payback time is short (DNV GL 2015)
Applicability This measure is applicable to all new and retrofit types of ships (DNV GL 2015)
Wind power
Wind power measures are available that can develop enough thrust to provide at least some supportive
propulsion Wind power can be utilised in various ways in shipping like traditional sails solid wing sails
Flettner-rotor and kits (see Figure 6) The techniques are currently used as supplementary power
(Brannigan et al 2009)
Figure 6 from left to right Kite (Cargill 2011) Flettner rotor (MIWB 2015) and solid sails (Wind Chellenger Project
HP 2015)
Solid wing sails are structured similar to aircraft wings which offer more thrust with less drag than
conventional sails Flettner rotors produce thrust from a rotating object in wind using the so-called
TRANL15371 7
Magnus effect The techniques have different characteristics with regards to how the thrust that is
produced relates to other factors such as wind strength wind angle wind stability and ship speed
(IMO 2009)
Towing kites vary from other concepts of wind power by having a small footprint during installation and
therefore being quite feasible to retrofit (Allenstroumlm 2013) Studies conducted at the Technical
University of Berlin indicated that the potential for sail energy has different prospective in the different
regions in the world Best scenarios exist in North Atlantic and North Pacific regions the South Pacific
seems a bit less potential The studies have shown that under normal circumstances the typical savings
using wind power may be 5 at 15 knots and up to 20 at 10 knots This study also revealed that
with optimal weather routing in the North Atlantic and given the best vessel with best sail type savings
can reach 15 percent at 15 knots and 44 at 10 knots (IMO 2009 Crist 2009) Nevertheless the
above figures should be considered indicative since practical experiences are limited Sail- and kite-
assisted power does seem to be a potential opportunity saving energy in the medium- and long-term
picture for shipping (IMO 2009) Christ estimates and average energy saving potential around 20
(2009)
Barriers There is a split incentive between vessel owners who are responsible for investing in these
technologies and vessel operators who are those who compensate for the fuel consumption and benefit
from such technologies (ICCT 2011) Although this technology can bring high energy savings the
investment is so high that there is not a short payback time
For solid wing sails complications could result in a need for masts to run down to the keel which can
be a bigger issue for retrofitting Additionally the presence of the mast and rigging could have significant
impacts on cargo handling (IMO 2009) Downside of the kite systems include the complex launch
recovery and control systems that are needed (IMO 2009)
Technical maturity This is still considered as experimental technology The technical barriers
identified above need to be tackled for this measure to be applied widely in the future Payback time is
estimated to be medium to long term (Allenstroumlm 2013 Crist 2009)
Applicability Wind power technologies are available and a number of cargo ships have been equipped
with wind engines to reduce demands from diesel engines (ICCT 2011) Kites can be used on ships
with a minimum length of 30m and works most energy efficient on ships with a typical speed not faster
than 16 knots Preferably tankers (crude oil product chemical LPG LNG other) and bulk carriers are
being considered as potential users due to this speed restriction (IMO 2011)
Control Systems Waste heat recovery
Waste heat recovery (WHR) technology can pass exhaust gases from a vessels engines through a heat
exchanger to generate steam for a turbine-driven generator The heat energy from the exhaust gas is
taken and transformed into electrical energy to reduce direct engine-fuel consumption for the
propulsion system or reduce auxiliary engine needs (ICCT 2011) Energy saving potential is estimated
between 6-10 on average 8 (Crist 2009 ICCT 2011)
TRANL15371 8
Figure 7 Efficiency of waste heat recover systems Sankey diagramme Even with high 50 efficiency of modern low-
speed engines there is still 50 of fuel input energy not being put to productive use The possibilities are illustrated
by this comparison of Sankey diagrammes for Waumlrtsilauml 12RT-flex96C engines without heat recovery (left) and with
high-efficiency waste heat recovery plant (right) showing in this case 114 gain in overall efficiency with WHR
(waste heat recovery) (WAumlRTSILAuml 2007)
Barriers Large capital investment requirements (around $5-6 million for a large container ship20) and
split incentive between ship owners and ship operators (ICCT 2011)
Technical maturity The technology is available on the market and has medium to long payback time
(WAumlRTSILAuml 2007 Crist 2009)
Applicability A WHR system is applied to vessels with a high production of waste heat and a high
intake of electricity WHR can be employed on ships with main engine average performance is higher
than 20000 kW and auxiliary engine average performance higher than 1000 kW This size
requirements limit the number of ships using this technology (IMO 2011) Generally it is applicable to
all ships types new and retrofit (Crist 2009)
Propellers and Rudders
Numerous devices have been designed for improving the energy consumption of vessels by recovering
as much as possible of this rotational energy in the flow from the propeller or to provide some pre-or
post-rotation of the in flow into and after the propeller to ensure best efficiency The most important
of these will be discussed in the following paragraphs (IMO 2009)
Ducted propeller (Kort Nozzle)
The accelerating ducted propeller consists of a screw propeller surrounded by a non-rotating duct
(nozzle) (Figure 8) Compared to the conventional propeller of the same diameter and thrust this
20 httpgcaptaincompower-exhaust-gas-paybacks-waste
TRANL15371 9
arrangement allows an increase inflow to the propeller improving the operating conditions around the
propeller and the ideal efficiency
Figure 8 Right photos of this Norwegian trawler (SetSail 2009)
The duct creates additional thrust load The potential for energy savings on relevant vessels range
between 1ndash20 (Crist 2009 IMO 2011 Barringhaus und Olds 1999 IMO 2009) whereupon 10 is a
good average value (IMO 2009 Crist 2009) The improvement of the combination of propeller and duct
overweigh negative effect of the increase water resistance caused by the duct
Barriers Since the duct has an optimal operational speed it does not work efficient at all speeds For
instance as drag increases with increasing speed eventually this will become larger than the added
thrust Therefore at high speeds ducts are typically not used (IMO 2009) The split incentive is a barrier
between ship owners (investor) and ship operators (gainer) as explained earlier (ICCT 2011)
Technical maturity Several standard designs are available on the market (IMO 2011) with a medium
payback time (IMO 2011)
Applicability Ducted propellers suits for vessels operating at high propeller loadings such as tankers
bulk carriers especially tugs and some offshore service ships The duct leads to increased friction but
at higher propeller loadings this is more than rewarded for by the positive effect of the combination of
propeller and duct (IMO 2009)
Contra-rotating propellers (CRP)
A rotating propeller induces a rotating motion in its backwash Normally this rotation energy of the
propeller gets lost The contra-rotating propeller is used in order to recover part of this energy (Figure
9) In a contra-rotating configuration two propellers are facing each other rotating in the opposite
direction with the aft propeller recuperating the turning energy in the wake from the forward propeller
(IMO 2011) To avoid complications with cavitation the aft propeller usually has a smaller diameter
than the front propeller Contra-rotating propeller arrangements involve a short shaft line and for that
reason primarily suitable for vessels with single-screw
TRANL15371 10
Figure 9 Left conventional propeller Right contra-rotating propeller The working principle is simple and effective
the power is split in a forward and aft propeller which through the different direction of rotation cancel out the
rotational energy losses behind the propeller (WAumlRTSILAuml 2009)
Potential savings of such measures are assessed to be in the order of 6ndash20 of the power consumption
with an average of 13 although higher figures may be presented by industry for specific cases Two
different full-scale measurements reported gains of 15 and 16 (IMO 2009 Crist 2009)
Barriers The mechanical installation of contra-rotating shafts is complicated and requires more
maintenance (IMO 2011) The split incentive between ship owners (investor) and ship operators
(gainer) is a barrier as explained above Although this technology can bring high energy savings the
investment is so high that there is not a short payback time
Technical maturity The technique is available on the market but problems with gearboxes for
contra-rotating propellers have been reported as well as operational problems with mounting (IMO
2009 IMO 2011) Payback time is reported as short (WAumlRTSILAuml 2009) but also as medium-long with
about ~15-20 years (Shuto 2010)
Applicability The technology is particularly beneficial for rather heavily loaded propellers as for
example very fast cargo vessels like Ro-Ro ships or for container ships (IMO 2011 Crist 2009) Contra-
rotating propellers need a short shaft line and hence mainly suited to single-screw ships (IMO 2011)
Contra-rotating propellers can be implemented as retrofit but it is more likely implemented in new
built ships due to the complicated mechanical installation (Crist 2009)
Post swirl devises
A number of different techniques belong to the post swirl category Several of them contain
modifications to the rudder or propeller (IMO 2009) Depending on vessel type and operational field
various power saving measures can be mounted to optimise water velocity distribution to the propeller
and to minimise slipstream losses due to swirl in the outflow of a propeller The most important among
these measures may be additional thrusting fins at the rudder twisted rudder (Figure 12) rudder-
bulb-systems with fins (Figure 13) and fins on the propeller fairwater also called post swirl fins or
boss cap fins (Figure 10)
Generally post swirl measures reported 1-8 energy efficiency (test models) Even 8-9 energy
efficiency from full-scale measurements for additional thrusting fins at the rudder Payback time is
estimated to be short to medium post swirl devices (DNV GL 2015 Crist 2009 ICCT 2011) Some of
CRP FOR BETTER PROPULSION EFFICIENCY
CONVENTIONAL PROPULSION
TRANL15371 11
the post swirl measure can be combined A good overview is given in Nielsen et al (Combined Kappel
propeller and rudder bulb system for improved propulsion efficiency not dated)
3431 Post swirl fins
The post swirl fins (Figure 10) can recover energy loss of propeller hub vortex in the propeller backward
flow and can lead to 3-5 energy saving on average 4 operating at the same speed (MOL 2011
Barringhaus und Olds 1999 Hansen Dinham-Peren und Nojiri 2011 ICCT 2011)
Figure 10 Example the post swirl fins or propeller boss cap fins (gcaptain 2012)
Barriers It is simple and straightforward measure requiring only the removal of the propeller boss
caps and replacement with the post swirl fins (no hull modification is needed) (Hansen Dinham-Peren
und Nojiri 2011 MOL 2011) However there is a split incentive between ship owners (investor) and
ship operators (gainer) as explained above
Technical maturity The technique is available on the market In 2013 post swirl fins were applied
to over 2500 ships worldwide (MOL 2011) Further advantages of the post swirl fins are reduction in
propeller torque reduced vibration in the stern and less underwater noise and reduced rudder erosion
(MOL 2011) A payback time of 6 months was estimated for 4 efficiency improvement at $600tonne
oil price (Hansen Dinham-Peren und Nojiri 2011) The investment is considered to be low21
Applicability The technique is effective for all screw propellers irrespective of the type or hull form
of the ship Has been tested on large-scale container vessels (MOL 2011 Hansen Dinham-Peren und
Nojiri 2011)
3432 Free rotating wheels
A vane wheel (Grim wheel) is a freely spinning propeller mounted behind the main smaller propeller
(see Figure 11 for example of use on retrofit Queen Elisabeth II in 1986) The vane wheel has a bigger
diameter than the main propeller and increases the propeller diameter The small propeller drives the
freely revolving vane wheel fitted on the wake The inner part of the vane wheel acts as a turbine and
the outer part as an ldquoadditionalrdquo propeller
21 httpgcaptaincompropeller-technology-ship-efficient
TRANL15371 12
Figure 11 Example for a grim vane wheel (Boat design 2007)
This leads to a substantial recovery of the rotational energy The energy saving potential is reported to
be 10 (Brannigan et al 2009) It is stated that the important benefit of the vane wheel is that a
smaller impulsion propeller can be installed which consumes less energy The vane wheel gives a
suitable energy improvement for cargo ships (IMO 2009 Schneekluth und Bertram 1998) and has short
payback time It is also stated that if there is room for a vane wheel in the aft there is also space for
an impulsion propeller of larger diameter leading about the same energy saving potential as the
combination of a small impulsion propeller and a vane wheel (IMO 2009)
Barriers A barrier is the split incentive between vessel owners who are responsible for investing in
these technologies and vessel operators who are those who compensate for the fuel consumption and
benefit from such technologies
Technical maturity Limited application Vane wheels are subjected to strong fluctuations in loading
Problems with the strength of the blades have been encountered frequently (for example the vane
wheels on the Queen Elisabeth II were short lived and not used after22)The payback time is estimated
to be short
Applicability The technique is effective for all screw propellers irrespective of the type or hull form
of the ship both for new and existing ships (Chen Reed und Kim 1989) Recommended for all ship
types except ferry and cruises because of their problem with strong fluctuations in loading as
mentioned above23 (IMO 2009)
3433 Twisted rudder
Rudders can play a significant role of extra frictional resistance Rudders are located in the backwash
of a propeller and rotational energy will act on the rudder Because of these effects the rudder gives
prospects of efficiency gains (Schulze 2007)
22 httpwwwroblightbodycomlinersqe-21987_Refitindexhtm 23 httpwwwroblightbodycomlinersqe-21987_Refitindexhtm
TRANL15371 13
Figure 12 Schematic capture of twisted rudder (Nakashima 2015)
Twisted leading edge technology provides multiple benefits for high-speed vessels compared to
conventional rudder designs Conventional rudders are located behind the propeller with the rudder
profile arranged symmetrically about the vertical rudder centre plane This arrangement does not
consider the fact that the propeller induces a strong rotational flow that strikes on the rudder blade
This consequences in areas of low force on the blade that induce cavitation and associated erosion
problems (Becker Marine System 2015 Schulze 2007)
The twisted rudder is horizontally twisted on the lower and upper side of the segment that is an
extension of the propeller shaft (Figure 12) This decreases cavitation rudder and improves
manoeuvrability of the vessel (Schulze 2007) Twisted rudder types lead to energy efficiency
improvements by approximately 2-4 on average 3 for large-size high-speed vessels (Hollenbach
und Friesch not dated Nakashima 2015)
Barriers Work needs to be done in the dry dock this is not regularly happening for existing ships
(Hochkirch und Bertram not dated) There is a split incentive between vessel owners who are
responsible for investing in these technologies and vessel operators who are those who compensate
for the fuel consumption and benefit from such technologies (ICCT 2011)
Technical maturity This rudder type is a commercially used technology and easy to apply if the ship
is in the dry dock (ICCT 2011)The payback time is estimated to be short to medium (Rolls-Royce 2014
Crist 2009)
Applicability Twisted rudder can used by container vessels reefers Ro-Pax ferries cruise ships and
naval vessels In South Korea this type of rudder is recognised as a standard rudder for large-size
high-speed container carriers (Nakashima 2015)
TRANL15371 14
3434 Rudder bulb
Figure 13 Example for a rudder bulb Kawasaki RBS-F rudder bulb systems with fins (Kawasaki 2015)
The rudder bulb brings smooth inflows from the propeller and can reduce the drag of the rudder The
rudder fins produce thrusts in the rotational flows generated by the propeller (Figure 13) Rudder bulb
measure can improve energy efficiency by 2-5 (Nielsen et al not dated Becker Marine System not
dated) on average 4 (Crist 2009)
Barriers The work needs to be done in the dry dock this is not regularly happening for existing ships
There is a split incentive between vessel owners who are responsible for investing in these technologies
and vessel operators who are those who compensate for the fuel consumption and benefit from such
technologies (ICCT 2011)
Technical maturity The technology is a commercially used technology and easy to apply while the
ship is in the dry dock (Kawasaki 2015) Payback time is estimated to be medium (Crist 2009)
Applicability For new and retrofit tanker- bulk- container- and Roro-ships with a propeller and
rudder (Crist 2009)
TRANL15371 15
Barriers to the transfer and uptake of energy
efficiency technologies for ships and possible
measures to overcome them
Although there are ways to reduce emissions (Chapter 3) and also drivers working towards the
implementation of such measures there are significant barriers to acting on cost-effective opportunities
in the maritime industry This is often referred to as barriers to energy or the energy efficiency gap
(Michele Acciaro 2013) (Sepideh Jafarzadeh 2014) (OECD 2014) Some barriers are shared with other
industries while others are unique to the maritime industry Furthermore many of these barriers are
not specific to the EEDI and the SEEMP but apply to any rule under MARPOL These barriers can exist
on both the supply and the demand side For example there could be barriers to the development and
implementation of measures that reduce CO2 emissions from ships and barriers to the expression of
demand for these measures (ECORYS 2012) Studies have however shown that there are relatively
few barriers related to the development of new technologies or access to related intellectual property
rights by the main shipbuilding nations and that the supply of measures exceeds the demand (ECORYS
2012) Existing studies on barriers to energy efficiency thus focus on what prevents the uptake of
available measures
This section presents an overview of the main barriers to the transfer and uptake of energy efficiency
technologies in the shipping industry and discusses potential ways of overcoming them
Preliminary assessments of technology transfer and financial needs by both workshop participants and
the IMO Ad Hoc Expert Working Group on Facilitation of Transfer of Technology for Ships (AHEWG-TT)
have suggested that the type of assistance needed by Port State and Flag State administrations will be
of a different nature than that required by shipbuilders and owners Our assessment above has shown
that the shipbuilding industry is expected to need less assistance than Port States and Flag States
In the next table we list a summary of the main barriers and the stakeholders concerned in the main
categories as identified by AHEWG-TT as well as the possible measures that could help overcome these
barriers The possible measures to overcome the barriers are further detailed in the sections below
Related costs are estimated in a separate section in order to minimise overlap
TRANL15371 16
Table 2 Summary of main barriers relevant stakeholders and possible measures to overcome them
Barrier Stakeholders Measures forward
Lack of awareness
(administrative and industry)
a MARPOL in general MARPOL Annex
VI EEDI and SEEMP in particular
b Available energy efficiency
technologies
Flag and Port
States
Ship owners
Capacity building
- Workshops
- Trainings
Model course for training
Inventory
Platform for information access and
sharing
Agreements between industry and
administrations
Technology concerns
a Lack of or limited technology supply
chain in some states
b Lack of technology base for RampD in
some states
c Lack of trust (in ability to reduce
emissions in ability to reduce
operational costs in compatibility
with other measures)
Ship owners
Investors
Increase cooperation in ship design
and building
Increased interaction between
industry and educationalRampD
institutes
Establish platform to share
expertiseexperience
Provide special investment or
guarantee funds
Institutional concerns
a Increased administrative burden
1Revision and amendment of existing legislation
2Implement Port and Flag State obligations
b Limited technical capacity in state institutions to implement
c Lack of financial resources for additional compliance and enforcement activities by maritime administrations
Flag States
Port States
Promote increased cooperation and
communication between
administrationswithin regional
administrations
Regional information workshops for
Port and Flag States
Establish platform to share regulatory
experience
Development aid
Commercial
a Increased costs for ship owners to
take up energy efficient technologies
b Lack of motivation of owners to take
up energy efficient technologies (split
incentive)
Ship owners
Financiers
Special EE funds
Smart contracts
TRANL15371 17
Awareness Raising
Barriers Lack of Awareness
The need to create awareness among Flag States Port States and ship owners of the requirements of
Annex VI in general and Chapter 4 in particular was highlighted by participants of the workshop and
emphasised by the AHEWG-TT The level of awareness in the various regions and even in the countries
within the regions differed considerably The AHEWG-TT further suggests it would be beneficial to
undertake an initial evaluation of knowledge needs (gap analysis) in order to ensure workshops and
other awareness-raising activities are appropriately tailored24
Furthermore ship-owners are not always aware of the energy efficiency technologies available on the
market or which operational measures can be implemented to save fuel Ship owners can be companies
people and investment funds Especially private equity groups tend to focus more on short term looking
for quick profit while traditional ship owners tend to hold the ship for at least 20 years25
Measures forward
Though Flag States and Port States should already have implemented measures to ensure that Energy
Efficiency Design Index (EEDI) and Ship Energy Efficiency Management Plan (SEEMP) requirements are
complied with both public administrations and industry representatives could benefit from additional
trainingcapacity building and platforms to share experiencesreceive information with regards the
practicalities of these regulations and available energy efficiency technologies The needs for each
group can be determined through a gap-analysis which we recommend to be carried out by an
independent consultant in cooperation with the flag and port states Once the specific needs for each
group have been determined they can be addressed through the following awareness raising
measures
Capacity Building (workshops trainings)
Workshopstrainings could be organised where formal training is combined with open discussions where
experiences could be shared just within one stakeholder group or between educational institutes
auditors operational managers of ships shipbuilders and authorities Such trainingsworkshops could
focus on just one or all aspects relating to the applicable rules available energy efficiency measures or
assessment methods of technologies (eg training in calculating and verifying EEDI and SEEMP
including development of tools to calculate EEDI and SEEMP) Trainingsworkshops can be local or
regional Sending people physically to regional workshops is generally more conductive to networking
and experience sharing but less adapted to the local situation and more costly
To reduce the costs of training and ensure a certain level of training the IMO or other qualified
international partners (eg WMU) could develop model courses for training In order to better
understand the rules and regulations in detail people use the help of trainers to better understand the
elements that are important for them and to gain experience in doing calculations and other required
24 Ad Hoc Expert Working Group on Facilitation of Transfer of Technology for Ships 2nd Meeting 25 httpwwwftcomcmss0dadcb240-3d97-11e3-b754-00144feab7dehtmlaxzz3aqC3tmNu
TRANL15371 18
activities by the regulations Trainers have to develop their courses and earn back their investments
via trainings Since the trainers are doing this simultaneous it would be more efficient if there would
be a model course available that can easily be tailored to the audience This would reduce the costs for
the development of trainings and would also ensure that the trainers provide the same level of depth
in their trainings Since the IMO is responsible for the rules and regulations it would be the logical
responsible for the efficient implementation and therefore could take the initiative for developing model
courses
Information Sharing
Inventory of energy-efficiency technologies (for example the IMO-GEF-UNDP project) Many
studies and overviews on the internet are available The quality and the scope is often
different
Improved access to information and information sharing with international recognised
organisations including relevant survey and certification training One example of
establishing information sharing between governments is the work of the OECD Council
Working Party on Shipbuilding (WP6)26 which organises regular workshops aimed at
facilitating the exchange of information on policy and industry developments
Note that many of these measures overlap with the measures required to overcome institutional
barriers as laid out in section 43
Agreements between industry and administrations could be envisaged to overcome the
barriers
In order to enhance the sharing of expertise for both administrations and industry technology transfer
and technology cooperation agreements could be formulated in order to strengthen the cooperation
As identified before the technology transfer to the ship building industry is not a mayor barrier so the
agreements should help the administrations to become more aware of the possibilities to further
promote the implementation of MARPOL Annex VI
Typical agreements between industry and administrations could be in the form of initiatives like the
Sustainable Shipping Initiative (SSI) SSI members have developed a vision for a sustainable shipping
industry in 2040 They commit to working towards this in all their own operations andor activities that
involve shipping and in all their dealings with and support for the shipping industry to make their vision
a global reality by 2040 SSI members of over 19 companies represent ship owners and charterers
shipbuilders engineers and service providers banking insurance and classification societies The SSI
explored for instance how to overcome barriers to the uptake of new technologies and techniques which
improve the operational efficiency of ships potentially delivering energy efficiency savings of 10 or
more and payback periods of less than 5 years They also produce case studies to show good examples
and also develop tools By involving administrations in these kind of initiatives (even free of charge)
they could be actively supported with knowledge about sustainable shipping
26 httpwwwoecdorgstiindworkshopongreengrowthinshipbuildinghtm
TRANL15371 19
Technology Concerns
Barriers Technology Concerns
One of key barriers to the implementation of energy efficient technologies (new and retrofit) relates to
the lack of or limited technology supply chain Furthermore the lack of a technology base for RampD in
some states is a barrier Also the existence of concerns relating to the ability of available energy
efficiency measures to reduce emissions and operational costs and their compatibility with other
measures of energy efficient technologies is a barrier This is typically the problem in very isolated ship
yards
Measures forward
Very successful shipyards (Japan and Korea) have already since many years a large number of
licencing technology transfer and similar agreements and continuously exchange information with
competitors in and outside their countries For instance US shipyards have adopted this methodology
since the 1980s (office of technology assessment 1983)
Further technology sharing could be stimulated through educationalRampD institutes locally regionally
or globally in ship design and building The technology will be transferred to the ship builders once the
students start working there or through cooperation between industry and university In order to
facilitate this we recommend the establishment of partnerships to share expertiseexperience
Typically individuals who know both worlds are the driving force behind successful partnerships (AISBL
2012) These partnerships are built around a shared long term research vision Many partners could
contribute (eg financially) in order to establish the responsible management and research programme
The target of the platform could be for example to provide verified information on real-world energy
efficiency improvements via a monitoring programme
For example in order to stimulate the deployment of energy efficient trucks the Dutch government
provides a website to share audited knowledge and data on about 15 energy efficiency technologies27
Additionally climate financing could be leveraged to reduce the investment risk in unproven
technologies For example IMO Member States could create a demonstration fund that can function as
a guarantee for investments in new and immature technologies28 Similarly investment guarantees
can be provided by funds in the same way governments provide export credits to their companies If
the technology does not deliver the expected fuel-savings the fund can cover the difference and hence
reduce investment uncertainty The main objective being to reduce investment risk
Institutional Concerns
Barriers
27 httpwwwtruckvandetoekomstnl 28 An example of a specific EE fund is httpwwweeefeueligible-investmentshtml
TRANL15371 20
For Flag and Port States complying with new regulations of IMO and EEDI and SEEMP particularly
represent and increased administrative burden It requires revisions and amendments of existing
legislation that need to be implemented at Port and Flag State functions There is currently limited
technical capacity in state institutions to implement these changes especially in developing countries
with a relatively low number of ships under their flag
The lack of financial resources is also a barrier for additional compliance and enforcement activities by
maritime administrations This is particularly an issue for least developed countries and small
developing island states Implementation costs are relatively higher for small Flag States because of
limited abilitycapacity to implement new technical regulations Note that this issue is not specific to
the EEDI and the SEEMP but to most regulatory measures (maritime or other)
Measures forward
Measures to assist states in implementing (existing and new) legislation include
Promote an increased cooperation and communication between administrationswithin
regional administrations of Port and Flag States similarly to what has been suggested in
sections 41 (Awareness raising through capacity building activities such as workshops) and
42 (Establish platform to share regulatory expertiseexperience) Platforms could be
managed by IMO in conjunction with industry and development funds in order to share the
costs as this has been done before for GloBallast for example In that case the IMO is in the
lead (executing agency) but the platform is supporting the collaboration with many
stakeholdersfunding partners The goal of the programme is to assist developing countries
eg via e-learning courses
In addition deterrents need to be put in place to discourage Flag States from performing
substandard inspections A system for detecting sub-standard inspections should be
implemented whereby mandatory Port State Control inspections are carried out in close
proximity to mandatory Flag State inspections (ie the Flag State inspection is carried out
prior to the ship leaving port and the Port State inspection is carried out upon arrival at port)
The two inspections should be carried out under a uniform mandatory checklist The IMO
should monitor inspections and investigate where discrepancies between inspections close in
proximity are detected If a Flag or Port State is found to have failed to meet the requisite
inspection standards penalties in the form of substantial fines should follow
In order to overcome the financial barriers financial assistance to states could help with
capacity building and implementation Financial resources are not only needed in the
implementation of the new regulations (training of government experts) but governments of
Flag States also need to be involved continuously in the ongoing discussion around
developments new EEDI targets for 2020 and beyond which requires continuous availability
of experts to represent the interests of the state (Metselaar 2015) Financial aid can therefore
be supplied in the following forms
Increased financial support for compliance and enforcement activities by maritime
administrations
Financial support could be provided to Flag States so that they have the resources to
properly carry out vessel inspections Consideration should be given to the introduction of
TRANL15371 21
an International Fund Convention set up for this purpose and contributed to by Port
States andor their major oil and other cargo exporters and importers
Commercial
Barriers
Private parties such as ship owners and investors are not always commercially incentivised to make
investments in energy efficiency measures This can be due to the split incentives between owner (who
should make the investment) and charterer (who reaps the cost savings) of a ship (see paragraph 25)
Furthermore access to finance can be problematic for smaller players who operate in niche markets
Measures
Bottlenecks in financing private investments and new financing mechanisms could be addressed during
regional or international workshops that include traditional and new financiers that could finance
investments in energy efficiency technologies
One solution that has been brought forward to address the problem of split incentives is the use of
lsquosmart contractsrsquo (Michele Acciaro 2013) The idea is to change charter contracts in a way that risks
and benefits are shared among charterers and ship owners In such contracts speed choice is more
flexible and the chartering cost of vessels is closer to fuel cost as such ship owners get motivated to
invest in energy-efficient technologies and charterers get stimulated to run vessels in an energy
conserving manner
With respect to the shipbuilding industry the following could facilitate the transfer of technology as
well
Financial assistance to shipyards to be provided at the national level or through other
arrangements
Foreign direct investment in software and hardware as an innovative way to support industry
in implementing the requirements
One type of incentive that governments can provide to enhance industry performance and technology
adoption is a competition for top performers Governments could contribute to a fund from which
money is distributed to the top 10 of best performers in a particular year
Cost estimates
Workshops and training
Capacity building workshops for administrations are estimated at euro 1000 per attendee for an
online workshop (1-2 days) Costs for the organisation of such workshops would include expert fees
and administrative costs These costs could be lower if the course material is already developed
(model workshops) Eg 2 attendees per Flag State for the ten most important Flag States
TRANL15371 22
(covering 74 of total fleet tonnage) comes down to euro 20000 or less in case the courseware is
already existent
A situation that is more conductive to networking and experience sharing is to send people physically
to regional workshops The costs of such workshops including participants travel and hotels for 50
participants would be between euro20000 - euro100000 per workshop based on our international
experience with organising workshops in the field of renewable energy and energy efficiency Costs
could be lower depending on the amount of preparation required cost of location (could be sponsored
by participating states)
Technical training
Trainings already exist for calculating and verifying EEDI including development of tools to calculate
EEDI For example MARIN offers 32h courses over 5 days in the Netherlands for euro 5000 per attendee
(excluding travel and accommodation)29 Lloyds offers similar trainings for similar costs30
Model courses for training may need to be updated depending on identified needs Ecofys estimates
the update of eg an existing EEDI model courses to cost in the order of euro 50000
Online platform for inventory of energy efficiency technologies
Inventories of energy-efficiency technologies already exist (for example in reports like (IMO 2009) and
on websites of for instance DNV-GL the efficiency finder31) but they could be further developed since
the websites are either not independent or incomplete
In order to facilitate information exchange a web-based platform could be established The role of the
platform would be for example to provide verified information on real-world energy efficiency
improvements via a monitoring programme For example in order to stimulate the deployment of
energy efficient trucks the Dutch government provides a website to share audited knowledge and data
on about 15 energy efficiency technologies32 The costs of such a website and corresponding
programme are estimated to be around euro 2 million for a 4 year period Furthermore a platform can be
used to inspire others by showing best practices and can be used for sharing of information regarding
network opportunities like conferences and seminars
Capacity building project
Currently the IMO-GEF-UNDP GloBallast project is a capacity building project it assists developing
countries and their maritime industries in implementing international regulations on ballast water
29 httpwwwmarinnlwebEventsCoursesSpecialist-Course-on-Ship-propulsion-model-tests-and-SpeedPower-trials-for-EEDI-Verifiers-
2731-October-2014htm 30 httpwwwlloydslistcomllsectorship-operationsarticle422262ece 31 httpswwwdnvglcommaritimeenergy-efficiencyefficiency-finderhtml 32 httpwwwtruckvandetoekomstnl
TRANL15371 23
management and preventing risks arising from the transfer of harmful aquatic organisms And has
several aspects that could also be used for knowledge transfer of energy efficiency measures
web-site
e-learning course
databasesdirectories
library collections
newsletter
Regional Task Force (RTFs) to support development and adoption of a regional approach
Develop and implement communication education awareness raising and outreach
programme
Develop introductory and more specialised training packages
Develop model legislations
The total budget for the 2008-2012 period was US$23 million out of which US$564 million represents
a GEF grant the rest being mostly in-kind contributions from the participating countries regional co-
ordinating organisations (RCO) and strategic partners including the private sector
Improved access to information and information sharing with international recognised organisations
including relevant survey and certification training would further promote the different technologies
TRANL15371 24
Conclusions
This study provides an overview of existing technologies which could drastically improve the energy
efficiency of ships Furthermore barriers to transfer and uptake of energy efficient technologies are
analysed and categorised and implications of these barriers are listed in order to facilitate the uptake
of energy efficiency technologies for ships
From this research it is clear that conventional technology is available that can cost-effectively (with a
payback time of less than 15 years) achieve high efficiency gains If the maximum gains per category
are added up (for all but ferry and cruise) this would mean a total efficiency improvement of 35
Even without taking two experimental technologies with potentially high efficiency gains into account
(wind power and air lubrication)
High investments like wind power and contra rotating propellers bring the highest savings (13 ndash 20)
The medium investments are in-between (5-10) and the low investments only bring relatively small
energy efficiency improvements (lt5)
When the ship owner has too few opportunities to share investment with charterers this leads to a split
incentive a ship owner may invest the up-front capital to put in energy-efficient technology but not
receive the benefits This is typically a problem for investments with a high payback time ie the wind
power and contra rotating propellers
The main barriers are related to the transfer of technology to Flag States Flag States are generally
third world and developing nations that often do not have the resources to enforce investigate or
prosecute breaches by their flagged vessels
Several ways to overcome the knowledge transfer barriers were presented that can be categorised as
follows
Workshops and trainings
o Capacity building workshops for administrations
o Regional workshops
Technical training
o Training in calculating and verifying the EEDI
o Development of model courses
Online platform
o Inventory of energy-efficiency technologies
o Creation of a website with all relevant information for the target audience
o Improved access to information and information sharing
o Provide verified information on real-world energy efficiency improvements via a
monitoring programme
TRANL15371 25
The most expensive of the capacity building actions is the capacity building project which takes all
aspects above into account If a project would be developed for knowledge transfer regarding energy
efficiency measures similar to GloBallast which assists developing countries and their maritime
industries in implementing international regulations on ballast water management and preventing risks
arising from the transfer of harmful aquatic organisms the total budget needed would be in the order
of US$23 million for a period of 5 years
TRANL15371 26
References
JFE Group 2013 ldquoJapan Marine Unitedrdquo JFE Group Overview JFE Group AISBL 2012 Making Industry-University partnerships work lessons from succesful collaborations
report Belgium AISBL
Allenstroumlm Bjoumlrn 2013 ldquoWind propulsionrdquo SSPA Sweden AB Gothenburg EffShip March
Aqorau T 2000 Illegal Unreported and Unregulated Fishing Considerations for Developing
Countries paper Honiara Solomon Islands South Pacific Forum Fisheries Agency
BALance 2014 Competitive position and future opportunities of the Euroean Marine Supplies
industry BALance Technology Consulting
Barringhaus David and Robert Olds 1999 OLDS ENGINEERING Maximizing Propulsion Efficiency
Marine Division Accessed Februrar 2015
httpwwwoldscomaumarinemaximizing_propulsion_efficiency
Becker Marine System not dated Becker Bulb Rudders httpwwwbecker-marine-
systemscom05_downloadszzpdfproduct_pdfBecker_Bulb_Rudderspdf Becker Marine
System
mdash 2015 Twisted Full Spade Rudder Accessed Feb 2015 httpbecker-marine-
systemscom03_productsproducts_twisted_full_spadehtml
Bloomberg 2014 China Loses Shipbuilding Crown to South Korea Chart of the Day 9th December
httpwwwbusinessweekcomnews2014-12-09china-loses-shipbuilding-crown-to-south-
korea-chart-of-the-day
Bluebird-Electric 2014 Sipbuilding post World War Two httpwwwbluebird-
electricnetship_boat_design_buildingshipbuilders_ship_repairers_associationhtm
Boat design 2007 Accessed Feb 2015
httpwwwboatdesignnetforumsattachmentspropulsion16743d1193341389-new-
propulsion-sytems-ships-grim-prop-1jpg
Brannigan Paschos Eyers and Wood 2009 Report on International avialtion and Mritime Emissions
in a Copenhagen (post 2012) Agreement Oxfordshire AEA Group
Chen Benjamin Arthur Reed and Ki-Han Kim 1989 A Vane-Wheel Propulsor for a Research and
Development Report Newport David Taylor Research Center
CNSS 2015 Clean North Sea Shipping - Clean Shipping Technology Accessed Februar 2015
httpcleantechcnssnoghg-technologiestechnical-measuresmeasures-related-to-the-hull
Crist Philippe 2009 Greenhouse gas emissions reduction potential from international shipping
Working paper OECD
Daily Times 2015 Nigeria Turkey seek collaboration on ships shipyards 5th January
httpwwwdailytimescomngarticlenigeria-turkey-seek-collaboration-ships-shipyards
Dillingham Gerald L 2000 Progress Made to Reduce Marine Pollution by Cruise Ships but Important
Issues Remain GAO report Washington United States General Accounting Office
DK Group 2015 Silverstream technologies January Accessed January 2015 httpdkgroupeu
DNV 2014 Encouraging Construction and Operation of Green Ships OECD
httpwwwoecdorgstiindC-WP6(2013)12-FINAL-ENGpdf
TRANL15371 27
DNV GL 2015 EFFICIENCY FINDER Accessed Feb 2015 httpwwwdnvglcommaritimeenhance-
performanceefficiency-finderaspx
Ecorys 2012 ldquoGreen growth opportunities in the EU shipbuilding sectorrdquo
ECOSPEED 2015 EUROPEAN MARINE amp MACHINERY AGENCIES LTD Accessed February 2015
httpwwweuropeanmarinecoukECOSPEEDhtm
gcaptain 2012 gcaptain - Propeller Technology to Make Your Ship More Efficient - Accessed Feb
2015 httpgcaptaincompropeller-technology-ship-efficient
Hansen Dinham-Peren and Nojiri 2011 Model and Full Scale Evaluation of a lsquoPropeller Boss Cap
FinsrsquoDevice Fitted to an Aframax Tanker Second International Symposium on Marine
Propulsors smprsquo11 Hamburg Germany June 2011
Hellenic Shipping News 2014 Korean ships sell at fuel-saving premium 22nd December
httpwwwhellenicshippingnewscomkorean-ships-sell-at-fuel-saving-premium
Hindawi 2015 Hindawi Puplishing Cooperation Accessed February 2015
httpwwwhindawicomjournalsijrm2012474785fig4
Hochkirch Karsten and Volker Bertram not dated ldquoSlow Steaming Bulbous Bow Optimization for a
Large Containershiprdquo Accessed Februar 2015 http2021148960resourcepdf5096pdf
Hollenbach Uwe and Juumlrgen Friesch not dated Efficient hull forms ndash What can be gained
Conference ship-efficiency Hamburg 2013 Hamburg HSVA Hamburgische Schiffbau-
Versuchsanstalt GmbH HamburgGermany
ICCT 2011 Reduce Greenhouse Gas Emissions from Ships - Cost Effectiveness of Available options -
white paper Washington DC International Council on Clean transportation (ICCT)
IMO 2011 REDUCTION OF GHG EMISSIONS FROM SHIPS Marginal Abatement Costs and Cost
Effectiveness of Energy-Efficiency Measures Submitted by the Institute of Marine Engineering
Science and Technology (IMarEST) MEPC 62INF7 International Maritime Organisation
IMO 2009 Second IMO GHG Study 2009 London International Maritime Organisation
JSEA 2006 ldquoImproved propulsive performance - Universal applies new energy-saving type Leadge
Bowrdquo Japan Ship Exports Association (JSEA) httpwwwjseaorjpVariableJSea318pdf
Kawasaki 2015 Energy-saving Technology Accessed Feb 2015
httpswwwkhicojpenglishshiptechconservationindexhtml
Leddy Fiona Jayne 2012 ldquoA critical legal analysis of International Shipping in Australian Waters and
the risk of ship-based oil pollutionrdquo Queensland Environmental Practice Reporter vol 17
Marinelog 2014 China white lists 51 shipyards 4 September
httpwwwmarinelogcomindexphpoption=com_k2ampview=itemampid=7667china-white-
lists-51-shipyardsampItemid=231
Metselaar Kees interview by Arno van den Bos 2015 Policy officer at directorate maritime affairs of
ministry of Intrastructure and Environment (February)
Michele Acciaro Peter Nyegaard Hoffmann Magnus Strandmyr Eide 2013 ldquoThe Energy Efficiency
Gap in the Maritime Transportrdquo Journal of Shipping and Ocean Engineering 1-9
MIWB 2015 Maritiem Instituut Willem Barentsz Accessed Feb 2015
httpsmijnmiwbnlnieuwsbriefindexphpdo=showampid_artikel=116
MOL 2011 Energy-Saving Propeller Boss Cap Fins System Reaches Major Milestone - Orders
Received for 2000 Vessels Accessed Feb 2015
httpwwwmolcojpenpr20111145html
TRANL15371 28
Motorship 2014 Gas fuelled ships into the future 31 10 httpwwwmotorshipcomnews101ships-
and-shipyardsgas-fuelled-ships-into-the-future
Nakashima 2015 Nakashima propeller CO LTD Accessed Feb 2015
httpwwwnakashimacojpengproductrudderhtml
Nielsen Shin Lundgren and Faghani not dated Combined Kappel propeller and rudder bulb system
for improved propulsion efficiency Frederikshavn MAN Diesel amp Turbo
OECD 2014 The OECD Council Working Party on Shipbuilding
httpwwwoecdorgindustryindshipbuildinghtm
OECD 2011 ldquoThe Shipbuilding Industry in Turkeyrdquo
office of technology assessment 1983 An Assessment of Maritime Technology and Trade report
Washington DC US Congress
Pakarinen Risto 2007 ldquoNothing common about common railrdquo Twentyfour7 (Twentyfour7) 64-65
Ports amp Ships 2015 Ports and Ships Accessed February 2015
httpportscozanewsarticle_2007_10_17_4038html
Rolls-Royce 2014 Propulsors - Moving your business in the right direction httpwwwrolls-
roycecom~mediaFilesRRolls-Roycedocumentscustomersmarinepropulsion-2014-
tcm92-8664pdf Aalesund Rolls-Royce Commercial Marine httpwwwrolls-
roycecom~mediaFilesRRolls-Roycedocumentscustomersmarinepromaspdf
Schneekluth H and V Bertram 1998 Ship Design for Efficiency and Economy Oxford
Butterworth-Heinemann
Schulze Reinhard 2007 Twisted Rudder - Extreme Design 14 SVA-Forum bdquo Ruder in Theorie und
Praxisldquo Potsdam 7 November 2007 Potsdam Schiffbau-Versuchsanstalt Potsdam GmbH
Selenetrawlers 2015 Selenetrawlers Accessed February 2015
httpwwwselenetrawlerscomcompanydesign-notes
Sepideh Jafarzadeh Ingrid Bouwer Utne 2014 ldquoA framework to bridge the energy efficiency gap in
shippinrdquo Energy 603-612
SetSail 2009 SetSail Accessed February 2015 httpwwwsetsailcomprop-nozzle-comments-by-
an-expert
Shuto Hideki 2010 Super Eco Inland Vessels httpwwwccr-
zkrorgtempwrshp120411Presentations2_04_HShuto_enpdf IHI Marine United Inc
Silberschmidt Noah 2014 ldquoGenerating efficiencies from thin airrdquo SMM Green shipping | Efficiency
httpwwwsilverstream-techcomwp-contentuploads201404HANSA-241112pdf
httpwwwsilverstream-techcomwp-contentuploads201404HANSA-241112pdf
Skinner Ian 2009 EU Tranport GHG Routes to 2050 Technical options for maritime and inland
shipping httpwwweutransportghg2050eucmsassetsTechnical-options-maritime-inland-
waterpdf Brussel European Commission
Statista 2015 ldquoLargest shipbuilding nations in 2013 based on completions in gross tonnagerdquo
httpwwwstatistacomstatistics263895shipbuilding-nations-worldwide-by-cgt
UK DfT 2014 ldquoDfT Port Statistics - World fleet registered trading vessels of 100 gross tons and over
gross tonnage on selected registers 1999-2013rdquo
httpswwwgovukgovernmentcollectionsmaritime-and-shipping-statisticsdata-tables-
associated-with-this-series
TRANL15371 29
Voorham 2013 Assessment of sustainable investment in shipping Master Thesis
Report SDPO13029m Delft 27 th November 2013 Delft Delft University of Technology
WAumlRTSILAuml 2009 ldquoEnergy Evironment Economyrdquo Helsinki Finland WAumlRTSILAuml
mdash 2007 ldquoWaste heat recoveryrdquo Waumlrtsilauml Corporation
Wettstein and Brown 2008 Derating a solution for high fuel savings and lower emissions
Winterthur Waumlrtsilauml Switzerland Ltd
Wind Chellenger Project HP 2015 Wind Chellenger Project HP Accessed Feb 2015 httpwindku-
tokyoacjpindex_enhtml
TRANL15371 30
Appendix I - World fleet registered trading vessels
Table 3 World fleet registered trading vessels of 100 gross tons and over 2009-2013 Source UK DfT 2014
Flag Country 2009 2010 2011 2012 2013
(World Total) 8448 9130 9831 10343 10725
Panama 1886 1979 2084 2158 2172
(European Union) 1900 1979 2074 2051 2106
Liberia 908 1037 1167 1238 1241
Marshall Islands 475 590 711 811 900
Hong Kong 449 553 678 785 854
Singapore 398 434 512 592 677
Malta 348 380 438 450 496
Bahamas 452 469 481 483 485
Greece 388 407 411 411 415
China 282 327 356 388 411
United Kingdom (inc IOM and CI) 258 273 294 300 288
Cyprus 201 205 207 197 203
Japan 138 156 167 178 192
Italy 150 169 181 180 176
Norway 152 145 143 144 145
Germany 152 155 153 137 123
Denmark 107 115 113 113 122
Korea South 120 124 116 111 112
Indonesia 69 82 91 101 111
Bermuda 94 100 106 109 105
Antigua amp Barbuda 100 107 111 106 100
United States of America 107 108 102 99 97
India 83 83 89 85 82
Netherlands 76 61 67 66 69
Turkey 54 58 62 64 59
Malaysia 69 72 71 62 57
France 63 63 64 56 53
Russia 47 49 49 51 52
Philippines 50 51 50 43 43
Cayman Islands 27 29 32 32 31
Taiwan 25 26 27 30 31
Iran 09 08 05 21 31
Thailand 25 26 22 26 29
Sweden 39 35 33 28 27
St Vincent amp the Grenadines 47 42 37 28 24
Canada 24 24 25 24 23
Spain 22 25 26 25 23
Kuwait 23 19 24 24 22
Brazil 20 20 19 19 20
Cambodia 18 17 13 13 12
TRANL15371 31
Appendix II - Most important shipbuilding
countries
China
China is an emerging shipbuilder that overtook South Korea during the 2008-2010 global financial crisis
as they won new orders for medium and small-sized container ships (Bloomberg 2014 Bluebird-Electric
2014)
Figure 14 delivery of vessels from Chinese and South Korean shipyards in million compensated gross tons a measure
of building time and human resources used per ton Source (Bloomberg 2014)
China has more than 1600 shipyards Analysts have predicted that about one third of them will fold
as the industry struggles with overcapacity Last year China laid out a three year plan for industry
restructuring that urged yards to concentrate on building higher quality vessels and local governments
to halt approvals for new projects (Bluebird-Electric 2014)
After two decades of a loan-fuelled boom Chinarsquos shipbuilding industry has become saddled with debt
and overcapacity prompting some private firms to seek financial assistance from the state In
September the government issued a list of 51 shipbuilders it deemed worthy of public support
(Marinelog 2014)
TRANL15371 32
New additions to the white list include subsidiaries of the China State Shipbuilding Corporation (CSSC)
and the China Shipbuilding Industry Corporation (CSIC) and the AVIC Weihai Shipyard owned by the
Aviation Industry Corporation of China (AVIC) (Marinelog 2014)
South Korea
By the end of 2014 it seemed South Korea has overtaken China again as the worlds largest
shipbuilding country with a global market share of about 30(see Figure 14) (Bloomberg 2014)
(Bluebird-Electric 2014) South Korea leads in the production of large vessels such as cruise liners
super tankers LNG carriers drill ships and large container ships
South Koreas shipyards are highly efficient with the worlds largest shipyard in Ulsan operated by
Hyundai Heavy Industries slipping a newly built $80 million vessel into the water every four working
days South Koreas big three shipbuilders Hyundai Heavy Industries Samsung Heavy Industries
and Daewoo Shipbuilding amp Marine Engineering dominate global shipbuilding with STX Shipbuilding
Hyundai Samho Heavy Industries Hanjin Heavy Industries and Sungdong Shipbuilding amp Marine
Engineering also ranking among the top ten shipbuilders in the world In 2007 STX Shipbuilding further
strengthened South Koreas leading position in the industry by acquiring Aker Yards the largest
shipbuilding group in Europe (The former Aker Yards was renamed STX Europe in 2008) In the first
half of 2011 South Korean shipbuilders won new orders to build 25 LNG carriers out of the total 29
orders placed worldwide during the period
To maintain their market position Korean yards also focus more and more on greening opportunities
The Korean government introduced a GHG emission reducing program in 2008 The program is aiming
at reducing GHG emissions throughout all economic sectors including the shipping and shipbuilding
industry Also the Japanese Shipbuilding Association (SAJ) is looking into the possibilities to reduce
GHG emissions so that the shipbuilding industry becomes greener and more competitive (Ecorys
2012)
Japan
Japan had been the dominant ship building country from the 1960s through to the end of 1990s but
gradually lost its competitive advantage to the emerging industry in South Korea which had the
advantages of much cheaper wages strong government backing and a cheaper currency South Korean
production overtook Japans in 2003 and Japanese market share has since fallen sharply
The Philippines
The Philippines has placed fourth among shipbuilding nations around the world producing more than
six million deadweight tonnes of ships built in 2012 The country is anchored by South Korean Hanjin
and Japans Tsuneishi shipbuilders The country has shipyards in Subic and Cebu
TRANL15371 33
Europe
For several decades European shipyards have been facing strong global competition from especially
Asian enterprises (Japanese yards in the 1950s and 60s Koreans from the 1970s and 80s and Chinese
since the 1990s) In Europe this has led to an almost complete exit from the mass production segments
of tankers bulkers and containerships Response of the EU industry has been to focus on the higher
value more complex ship types such as ferries and passenger ships non-cargo vessels and general
cargo ships In addition only limited numbers of vessels of the same type are being built (in contrast
with bulk vessels which are mass produced) Europe has a 77 percent market share in building
passenger vessels (including both cruise ships as well as ferries) and a 17 percent share in the
construction of non-cargo vessels (Ecorys 2012) These segments make up a relatively small share of
the world orderbook (in CGT) However in value they represent a much higher share due to their
relatively sophisticated characteristics The position of the European shipbuilding industry in the
manufacturing of specialised innovative vessels is still strong At the same time European equipment
manufacturers have acquired a leading role in quality products especially in complex high value
equipment components
Figure 15 World orderbook and CESA orderbook by ship type in 2010 (CGT x 1000) (Source Ecorys 2012)
Regarding the marine equipment sector the European industry is renowned for propulsion cargo
handling communication automation environmental and security systems This equipment is not only
destined for complex European-built ships but also exported to Asian yards whether or not requested
by their clients (Ecorys 2012)
Compared to the ship construction sector the marine equipment segment is highly heterogeneous and
consists of companies that are often also active in other business areas (ie automotive or aircraft
industry) A study by (BALance 2014) found that the European marine equipment industryrsquos
TRANL15371 34
competitiveness lies in a strong market position and technological leadership at least for globally active
European marine supply companies who build their position on a strong infrastructure and co-operative
partners skill of their employees and close relationship with their customer base Conversely identified
weaknesses are the cost level in Europe and the heterogeneous structure of the industry with many
SMEs which hinder in some cases attempts to follow the markets by globalisation strategies
Turkey
Shipbuilding in Turkey has evolved from an old traditional activity in Anatolia to an internationally
recognised industry especially since the early 1990s The industry has modern shipyards that can build
ships yachts mega-yachts and sailing boats as well as carrying out extensive repair and conversion
works Turkeyrsquos shipyards are mainly located in the Marmara Region namely Tuzla Yalova and İzmit
which have developed into dynamic shipbuilding centres Also in recent years the emerging Black Sea
and Mediterranean Regions have increasingly attracted shipyard investments
In the last decade in parallel with developments in the global market Turkish shipbuilding experienced
a several-fold increase in its shipbuilding and export capacity including a significant product
diversification According to order books this resulted in Turkey being regularly placed in the top ten
countries on the basis of its deadweight (dwt) production and in the top five countries by the number
of ships
In recent years Turkey has increasingly tapped into niche markets which in turn has led to a growing
participation by Turkish shipyards in the international trade in new ships In parallel there has also
been strong growth in the marine equipment manufacturing sector which could increasingly also tap
the export market These developments reflect in part the strategic location of the yards the
experienced workforce the quality of production and Turkeyrsquos significant role as a political cultural and
economic bridge between Europe and Central Asian and Middle Eastern economies (OECD 2011)
ECOFYS Netherlands BV | Kanaalweg 15G | 3526 KL Utrecht| T +31 (0)30 662-3300 | F +31 (0)30 662-3301 | E infoecofyscom | I wwwecofyscom
ECOFYS Netherlands BV
Kanaalweg 15G
3526 KL Utrecht
T +31 (0) 30 662-3300
F +31 (0) 30 662-3301
E infoecofyscom
I wwwecofyscom
HOW TO OBTAIN EU PUBLICATIONS
Free publications
bull one copy
via EU Bookshop (httpbookshopeuropaeu)
bull more than one copy or postersmaps
from the European Unionrsquos representations (httpeceuropaeurepresent_enhtm)
from the delegations in non-EU countries
(httpeeaseuropaeudelegationsindex_enhtm)
by contacting the Europe Direct service (httpeuropaeueuropedirectindex_enhtm)
or calling 00 800 6 7 8 9 10 11 (freephone number from anywhere in the EU) () () The information given is free as are most calls (though some operators phone boxes or hotels may charge you)
Priced publications
bull via EU Bookshop (httpbookshopeuropaeu)
Priced subscriptions
bull via one of the sales agents of the Publications Office of the European Union
(httppublicationseuropaeuothersagentsindex_enhtm)
doi 102834880780
ML-0
1-1
5-4
39-E
N-N
[Ca
talo
gu
e n
um
be
r]
TRANL15371 2
2 Relevant Stakeholders
The IMO resolution on the promotion of technical cooperation and transfer of technology (regulation
23) is intended to support states which request technical assistance Three main categories of
stakeholders were identified that can be considered of relevance
(1) Shipbuilding nations where the ships are produced
(2) Flag States (where the ships are registered) and Port States who are allowed to inspect foreign
ships compliance to international regulations
(3) Ship owners and ship charterers who are responsible for the design and use of the ships
TRANL15371 3
Global Shipbuilding Nations
Shipbuilding nations typically provide incentives for the shipbuilding industry in their country Therefore
they play a role in the transfer of technologies to their industry
In 2012 some 3655 ships were built worldwide The largest share of the tonnage was built in China
South Korea and Japan (Figure 1)
Figure 1 Ship building in 1000 gross tons Source (Statista 2015) quoting IHS and Shipbuilders Association of
Japan
The worldrsquos leading shipyards include South Korearsquos Hyundai Heavy Industries Japanrsquos Mitsubishi
Heavy Industries and Chinarsquos Shanghai Waigaoqiao (Statista 2015) China South Korea and Japan
together are responsible for building about 90 of the ships in gross tons
Flag States and their role in the implementation of MARPOL
Flag States have the responsibility for enforcing the rules set out under MARPOL Every Flag State has
the duty to ensure that its vessels fully comply with the applicable articles of MARPOL3
3 MARPOL Regulation 6
TRANL15371 4
At the end of 2013 about one-fifth of merchant vessels were registered in Flag State Panama 12 in
Flag State Liberia and 8 in the Flag State Marshall Islands (Figure 2 and (UK DfT 2014)) Therefore
already 40 of the world fleet are registered in these three Flag States
Figure 2 World fleet registered trading vessels of 100 gross tons and over 2009-2013 Source UK DfT 2014
Under MARPOL these parties (Flag States) can enforce ship-owners and operators obligations in three
main ways
- by surveyinspection of vessels to ensure that they meet minimum requirements4
- by monitoring vessel compliance with oil discharge requirements5 (not relevant for energy
efficiency) and
- by implementing punishments for failure to comply with requirements6
Surveys
MARPOL Annex VI contains a set of requirements for survey and issuance of International Air
Pollution Prevention Certificate (IAPP) and regulations regarding
Ozone depleting substances from refrigerating plants and firefighting equipment
Nitrogen Oxides (NOx) from diesel engines
Sulphur Oxides (SOx) from diesel engines
4 MARPOL article 5 5 MARPOL Annex I Chapter 4 Regulation 31 6 MARPOL article 4
TRANL15371 5
Volatile Organic Compound Emissions from cargo tanks of oil tankers
Shipboard Incineration
Fuel oil quality
Flag States must conduct an initial survey before a new ship is put into service and before the IAPP is
issued for the first time a renewal survey at intervals specified by the Administration but not exceeding
five years an intermediate survey within three months before or after the second anniversary date or
within three months before or after the third anniversary date of the certificate an annual survey within
three months before or after each anniversary date of the certificate and after prescribed repairs an
additional survey7
For the EEDI and the SEEMP a new certificate the International Energy Efficiency Certificate (IEEC)
was established and must be kept available on board for inspectionssurveys The IEEC Certificate will
be issued for new build ships upon the initial survey before the ship is put into service and for existing
ships of 400 gross tonnage and above The IEE Certificate will be issued once for each ship and is valid
throughout the lifetime of the ship (except flag change major conversion or ship going out of service)
There are no follow-up surveys on the IEEC Certificate
The IMO has created guidelines for surveys that Flag States should follow The energy efficiency related
one is
2014 Guidelines on survey and certification of the Energy Efficiency Design Index (EEDI)
(resolution MEPC254(67))
A Flag State cannot allow a vessel that does not pass inspection to sail until it complies with MARPOL8
An International Energy Efficiency Certificate in accordance with the provisions of regulation 54 to
any ship of 400 gross tonnage and above is needed before that ship may engage in voyages to ports
or offshore terminals under the jurisdiction of other Parties
Punishments for failure to comply
In case of failure to comply the authority carrying out the inspection may detain the ship Article 7 of
MARPOL ensures that unduly delay or detain will be avoided where possible or compensated
A Flag State is obliged to investigate an incident upon receipt of notification or evidence that one of its
vessels has breached MARPOL If the investigations reveal that a breach has occurred the Flag State
has further obligations to initiate legal proceedings against the vessel and report back to the reporting
state on actions taken9
7 MARPOL Annex VI Chapter 2 Regulation 5 8 MARPOL Annex VI Chapter 2 Regulation 6 9 MARPOL article 6
TRANL15371 6
Also other parties are allowed to inspect vessels under MARPOL Article 6 when violations are detected
or for regular inspections A Party may also inspect a ship to which the present Convention applies
when it enters the ports or off-shore terminals under its jurisdiction if a request for an investigation is
received from any Party together with sufficient evidence that the ship has discharged harmful
substances or effluents containing such substances in any place
Role of Port States
Under ldquoPort State Controlrdquo arrangements Port States also have the authority to conduct vessel surveys
on ships which visit their ports and to detain those ships that fall below MARPOL requirements In
relation to MARPOL Annex VI chapter 4 any port state inspection shall be limited to verifying when
appropriate that there is a valid International Energy Efficiency Certificate on board10
Cooperation between Port and Flag States
Under MARPOL parties are required to co-operate in detecting vessel violations and are required to
use all practical measures to detect and monitor violations If a State has evidence of a violation they
are obligated to forward this evidence to the vesselrsquos Flag State
All ships flagged under countries that are signatories to MARPOL are subject to its requirements
regardless of where they sail and member nations are responsible for vessels registered under their
respective nationalities
When incidents occur outside the countrys jurisdiction or jurisdiction cannot be determined the
country refers cases to Flag States in accordance with MARPOL Some States are not happy with the
lack of response from Flag States United States experience of Flag States not responding has led to
new policy which would take direct enforcement action against vessels for MARPOL V violations
occurring between 3 and 200 nautical miles from the United States rather than referring such violations
to the flag states (Dillingham 2000)
Ship owners and charterers
A ship owner is the owner of a commercial ship A ship owner is someone who equips and exploits a
ship usually for delivering cargo at a certain freight rate The ship owner determines the specifications
of the ship and its energy efficiency measures but the benefits of low fuel consumption are not always
theirs when the ship is chartered to someone else
Depending on the type of ship and the type of charter normally a standard contract form called a
charter party is used to record the exact rate duration and terms agreed between the ship owner and
the charterer
10 MARPOL Annex VI Regulation 10
TRANL15371 7
A charterer may be a party without a cargo who takes a vessel on charter for a specified period from
the owner and then trades the ship to carry cargoes at a profit above the hire rate In some cases a
charterer may own cargo and employ a shipbroker to find a ship to deliver the cargo for a certain price
Two main types of charter can be distinguished time charter and voyage charter In a voyage charter
the owner is still responsible for the port fuel and crew costs In a time charter the charterer selects
the ports and directs the vessel where to go The charterer pays for all fuel the vessel consumes port
charges commissions and a daily hire to the owner of the vessel
When there are too few opportunities to share investment with charterers this leads to a split incentive
a ship owner may invest the up-front capital to put in energy-efficient technology but doesnrsquot then
recoup the costs from fuel savings as they charter their ships out as this goes to the charterers This
problem is particularly apparent for short-term time charters11
Conclusions
Regarding energy efficiency the work of the AHEWG-TT12 has shown that the main shipbuilding nations
all have access to the necessary technologies provided there is demand for them It has also been
noted that there is no need for transfers of intellectual property rights13
One of the major barriers to the effective implementation of the EEDI and the SEEMP is the heavy
reliance it places on Flag States for inspection of vessels and enforcement of provisions During the
1970rsquos ships were being reflagged from high tax and high regulation countries such as the United
States and the United Kingdom to countries offering Flags of Convenience (lsquoFOCrsquo) Under FOCs ship-
owners pay less tax to the relevant Flag State and are able to evade the majority of the environmental
and construction standards set out under MARPOL (Leddy 2012) The main reason for that is that
several Flag States are not signatories to all MARPOL Annexes (eg as of 20142015 the Bahamian
Bolivian Cambodian North Korean Georgian Honduran Lebanese and Sri Lankan flags of
convenience had not ratified all MARPOL treaty annexes III-VI14 15)
Many FOCs are developing nations that do not have the resources to enforce investigate or prosecute
breaches by their flagged vessels (Aqorau 2000) As of 2014 55 of merchant ships are flagged by
FOC and 40 of ships are flagged by FOCdeveloping countries MARPOL only provides guidelines for
Flag States to follow when surveying vessels under regulation 6 but none of these guidelines are
mandatory Conversely Port States which are developed are better equipped to bear the cost of
inspection investigation enforcement and prosecution costs However in relation to EEDI and the
11 httpssi2040orgwhat-we-dowork-streamsfinance 12 MEPC 6831 Progress report of the Ad Hoc Expert Working Group on Facilitation of Transfer of Technology for Ships 13 Submission of the United States on Task 3 of the Ad Hoc Expert Working Group on Facilitation of Transfer of Technology for Ships Jan
2015 14 wwwics-shippingorgdocsflag-state-performance-table 15 httpwwwimoorgAboutConventionsStatusOfConventionsPagesDefaultaspx status of conventions
TRANL15371 8
SEEMP port state control is limited to verifying when appropriate that there is a valid International
Energy Efficiency Certificate on board
We therefore conclude that there needs to be a focus on enabling Flag States and Port States that lack
the resourcescapacity to enforce the EEDI and the SEEMP in order to further stimulate the adoption
of energy efficiency technologies Also attention should be paid to overcoming the barrier of split
incentives ie where the benefits of energy efficiency measures are not transferred from the charterer
to the investor (owner)
TRANL15371 9
3 Energy Efficiency Measures for Ships
In order to understand the important energy efficiency measures that can help improve energy
efficiency from shipping it is interesting to see the split between new-built ships and existing fleet In
2012 some 3655 merchant ships were delivered worldwide about 6 of the worldrsquos merchant fleet
of about 60000 The average age of the merchant fleet is 19 years Therefore measures for both new
ships and retrofits for old ships are important for improving the energy efficiency in the next decades
If only the new ships would be targeted only 50 of the fleet would be more efficient in the next
decades while there are many retrofit measures available The total fleet can be broken down to about
4000 passenger ships just under 14000 tankers and about 37000 dry cargo ships including about
5000 container ships (Statista 2015)
In order to identify the most interesting energy efficiency measures for ships we used the information
from several reports to develop a long-list Many measures improve the efficiency in the order of up to
5 Here we would like to focus on measures that result in high savings that can be applied to many
ship types and preferably also to existing ships The resulting short-list is presented in the next table
We used the main categories identified by AHEWG-TT for structuring the measures
The main categories defined by AHEWG-TT are
1 Hull
2 Main Engine
3 Auxiliary engines
4 Propellers and rudders and
5 Control systems
Since the auxiliary engines typically consume only a fraction of the energy that goes to the main
engines their energy efficiency measure results do not show in the short-list below The measures are
worked out in more detail in the paragraphs below The main engine and auxiliary engine improvements
are covered in the same paragraph
The common rail upgrade is a simple measure that can be easily applied to all ships even when the
ship is not in the dry-dock The details are available in the paragraph about engines
From the list it is clear that conventional technology is available to achieve high efficiency gains If the
maximum gain per category is added up (for all but ferry and cruise) this would mean a total efficiency
improvement of 35 even without taking two experimental technologies with potentially high efficiency
gains into account (wind power and air lubrication) Note that some technologies are not applicable to
all ships
In order to find possible financial barriers the investments are rated from ldquovery lowrdquo to ldquohighrdquo relatively
to the size of the ships The same measure on a larger ship is obviously more expensive
TRANL15371 1
Table 1 Inventoryranking of energy efficiency measures
Main category
Measure Estimated efficiency (range)
Efficiency at average circumstances
Ease of installation
Payback time
Investment Implementation References
Hull Bow optimisation
25-20 10 all ship types
short (lt3 years)
Medium conventional technology
(IMO 2009 IMO 2011 Crist 2009 Hochkirch und Bertram not dated)
Main Engines
Wind power 5-44 20 only special ship types
long (gt15 years)
High experimental technology
(IMO 2011 IMO 2009 Crist 2009 ICCT 2011 Brannigan et al 2009 Allenstroumlm 2013)
Propellers and Rudders
Ducted propeller
1-20 10
all ship types except ferry and cruises
medium (4-15 years)
Medium conventional technology
(IMO 2011 IMO 2009 Crist 2009 ICCT 2011)
Propellers and Rudders
Contra-rotating propellers
6-20 13 only special ship types
long (gt15 years)
High conventional technology
(IMO 2011 IMO 2009 Crist 2009 WAumlRTSILAuml 2009 Shuto 2010)
Propellers and Rudders
Wheels 10 10
all ship types except ferry and cruises
short (lt3 years)
Medium conventional technology
(IMO 2009 Schneekluth und Bertram 1998 Brannigan et al 2009)
Control Systems
Waste heat recovery
6-10 8 new build only
medium (4-15 years)
Medium conventional technology
(IMO 2011 IMO 2009 Crist 2009 WAumlRTSILAuml 2007 ICCT 2011)
Propellers and Rudders
Rudder bulb 2-5 4
all ship types except ferry and cruises
medium (4-15 years)
Low conventional technology
(IMO 2011 IMO 2009 Nielsen et al not dated Crist 2009 ICCT 2011)
Propellers and Rudders
Post swirl fins
2-5 4
all ship types except ferry and cruises
short (lt3 years)
Low conventional technology
(IMO 2009 MOL 2011 Hansen Dinham-
Peren und Nojiri 2011 Nielsen et al not
dated)
Hull Hull coating 1-9 5 all ship types
short (lt3 years)
Low conventional technology
(IMO 2011 IMO 2009 ICCT 2011 Voorham 2013 Crist 2009)
Hull Air lubrication
5-15 9 new build only
medium (4-15 years)
Medium experimental technology
(IMO 2011 IMO 2009 Crist 2009 DK Group 2015 CNSS 2015 ICCT 2011)
Propellers and Rudders
Twisted rudder
2-4 3
all ship types except ferry and cruises
medium (4-15 years)
Low conventional technology
(IMO 2009 Schulze 2007 Nakashima 2015 Becker Marine System 2015 Nielsen et al not dated Hollenbach und Friesch not dated Rolls-Royce 2014)
Main Engines
Main engine de-rating
2-4 3
all ship types except ferry and cruises
medium (4-15 years)
Low conventional technology
(IMO 2011 IMO 2009 Crist 2009 Wettstein und Brown 2008 DNV GL 2015)
Auxiliary engines
Common rail upgrade
- - all ship types
medium (4-15 years)
Very Low conventional technology
(DNV GL 2015) (ICCT 2011) (IMO 2009)
Main Engines
Common rail upgrade
01-05-
03 all ship types
medium (4-15 years)
Very low conventional technology
(IMO 2009 Pakarinen 2007 ICCT 2011 Crist 2009)
TRANL15371 2
Hull and superstructure
In general the optimisation of hull and superstructure focuses on minimising the resistance by reducing
the wave resistance and friction between water and hull It is important to recognise which type of
vessel is to be optimised The reduced frictional resistance increases energy performance of the vessel
particularly at low speeds Operability and performances of the ship must be considered in detail The
improvements measures are generally applied at new-built ships but also applicable to retrofitting
Bow optimisation
The different bow optimisations can improve the water flow around the hull and reduce the wave-added
resistance for large vessels with high block coefficient operating within commercial speed ranges The
average energy reduction potential ranges from 25-20 on average 10 (Crist 2009 IMO 2011
Voorham 2013)
Figure 3 Left The green line characterises the ordinary bow wave of the hull The blue line characterises the wave
formed by the bulb The red line is the sum of these two The altitude of the bow wave is noticeably reduced which
reduces the hull drag associated with the bow wave This improves fuel economy and increases range (Selenetrawlers
2015) Right Ordinary bulbous bow leadge bow and ax-bow shape (JSEA 2006)
The below-the-waterline extension of the bulbous bow (Figure 3) modifies the way the water flows
around the hull reducing drag and thus increasing speed range fuel efficiency and stability An altered
design is the ax-bow (Figure 3) The narrow designed bow slashes through the water in order to reduce
slamming and reduces the size of bow generated wave The propeller can act more efficient due to the
absence of slamming The ax-bow allows the ship to steer well to maintain speed and the engine to
save fuel (Crist 2009 IMO 2009) If the bulbous bow is modified during a regular docking period the
investment is estimated to have short payback of about 1-3 years It is most promising for container
vessels (DNV GL 2015 Hochkirch und Bertram not dated)
Barriers The bow optimisation (as retrofit) needs to be done in the dry dock Dry-docking is not
regularly happening for existing ships because it means that the ship cannot operate and economic
losses are suspected Another obstacle might arise due to restricted access to the original contractual
hull plans since shipyards are not always keen to provide detailed plans on their vessels to prevent
TRANL15371 3
imitation (Hochkirch und Bertram not dated DNV GL 2015) A major obstacle is the split incentive
between ship owner and operator Ship owners are responsible for investing in these technologies and
ship operators are those who pay for the fuel consumption and benefit from such technologies (ICCT
2011)
Technical maturity The technique is available on the market and is effective Only conventional
material is needed and redesign can be done in a few weeks16
Applicability Applicable to all ship types but most efficient for ships with a high block coefficient like
tankers and bulk carriers since the reduction of the wave-added resistance is most impacting (IMO
2009)
Hull coating
Hull coatings (Figure 4) can lower frictional resistance and limit fouling by aquatic organisms It can
save between 1-9 fuel consumption on average 5 (ICCT 2011 Voorham 2013 Crist 2009)
Figure 4 Example of hull coating (ECOSPEED 2015)
One way of lowering the frictional resistance is to improve the smoothness of a hull by means of
coatings that reduce fouling The costs are lifetime cost reduction and have to be recur every five years
to be able to gain the fuel benefit
Barriers A new application is typically necessary during each dry-docking The self-polishing coating
must be renewed after a 3-5 years period (IMO 2009) A major obstacle is the divided interest between
ship owner and operator Ship owners are in charge for investing in these technologies and ship
operators are those who pay for the fuel consumption and profit from such technologies (ICCT 2011)
Technical maturity Coating techniques are available on the market and roughly 5 of newly painted
ships are painted with one of the advanced coating systems presently available (IMO 2011 ICCT 2011)
The payback time is short (ICCT 2011) or 0-2 years according to others17
Applicability The technology is applicable to all vessels
Air lubrication
The air lubrication technique creates a layer of bubbles underneath an already streamlined hull in order
to further reduce friction An automation system regulates the compressorsblowers depending on
16 httpwwwship-efficiencyorgonTEAMpdf14-Ship20efficiency20seminar20-20CMA20CGM-
20HydrOcean20120CMA20pdf 17 httpswwwdnvglcommaritimeenergy-efficiencyefficiency-finderhtml
TRANL15371 4
speed The blower keeps holes filled with air and required pressure A thin layer of bubbles trailing
behind of each cavity merge into single large ldquoair layerrdquo for the whole flat bottom part of the hull and
reduces the friction (Figure 5) Depending on the ship type the estimate fuel efficiency ranges between
5-15 (on average 9) where tankers and bulkers can reduce more (10-15 on average 125) in
comparison to container vessels (5-9 on average 7) (IMO 2009 DK Group 2015 CNSS 2015 ICCT
2011 Voorham 2013)18
Figure 5 Schematic view of air lubrication (DK Group 2015)
Barriers Large capital investment requirements with split incentive The vessel owners are
accountable for investing in these technologies whereas vessel operators recompense for the fuel
consumption and benefit from such technologies (ICCT 2011)
Technical maturity The technology is available on the market but still in a pilot phase Sea trials
have been performed with small demonstration ships There are no vessels operating commercially
that currently use this technique Specifications about the payback time vary from short to medium
(Silberschmidt 2014 Skinner 2009)
Applicability The original technology would be likely be applied to new-built ships with at least a
partly flat bottom and a minimum length of 225 metres since the compressor may have technical
problems maintaining air cavities for deep draft ships (IMO 2011 CNSS 2015) Air lubrication can be
used for retrofitting as well (CNSS 2015)
Engines
Speed reductions on existing vessels provide opportunities for engine optimisation on low power
(321) Similar measures as de-rating for the main engines that could be implemented are cylinder
cut-out and new torsional vibration calculation (IMO 2009)
18 It has to be noted that the extra fuel use caused by the system itself should also be taken into account
TRANL15371 5
Another propulsion supportive measure with a high potential measure is wind power This is also
explained in more detail below In order to also provide a measure with a lower improvement potential
per ship but simple and applicable to all ships we describe the common rail system for fuel injection
Main engine de-rating
Slow steaming vessels are known as one of the most effective energy saving measure The potential
comes mainly from the operational behaviour side From the technical side the specific fuel oil
consumption will decline when a ship is no longer operated at its design speed
The design speed can be reduced by de-rating the main engine (IMO 2011 IMO 2009) Reduction of
power combined with injection timing advanced to restore peak combustion pressure can achieve a
certain gain in shaft efficiency Fuel efficiency can be improved by 2-4 when de-rating is performed
for loads lower than the maximum design load (Wettstein und Brown 2008 Crist 2009) on average
3 energy efficiency potential (Crist 2009) Operational costs would be lower mainly due to fuel
savings (DNV GL 2015 Crist 2009 Wettstein und Brown 2008)
Barriers A slower vessel will have lower incomes as it is not capable to perform as much transport
load per unit of time as a faster vessel De-rating the engine is usually done when it is clear that the
ship will become a slower steaming ship There is a split incentive between vessel owners who are
responsible for investing in these technologies and vessel operators who are those who compensate
for the fuel consumption and benefit from such technologies (ICCT 2011)
Technical maturity This technique has been proven as successful particularly on older engines
which are normally built with a low compression ratio and thereby have a significant potential to
improve their efficiency (IMO 2009) De-rating measures have a low to medium payback time (Crist
2009 DNV GL 2015)
Applicability The technologies are available on the market It is applicable to all vessels (DNV GL
2015)
Common-rail upgrade (common-rail fuel injection)
Engines with common-rail fuel injection handle low-load working modes much better (IMO 2009) A
common-rail fuel injection is technique of injecting fuel into an engine cylinder under total control and
thereby achieving optimal combustion Common-rail allows the start and duration of injection
independent of the position of the pistons in that way permitting an operationally optimised injection
per stroke In a normal diesel engine fuel is injected at a static rate by a pump and common practice
is to optimise this pump to run at an optimal setting for the ideal injection time (Pakarinen 2007) The
energy efficiency potential is estimated between 01-05 on average 03 (ICCT 2011 IMO 2009)
Barriers Additional electronics can also introduce possibilities for failures However recent
advancements have increased the systems popularity19 There is a split incentive between vessel
19 httpwwwmarineinsightcommarinean-overview-of-common-rail-system-in-marine-engines
TRANL15371 6
owners who are responsible for investing in these technologies and vessel operators who are those
who compensate for the fuel consumption and benefit from such technologies (ICCT 2011)
Technical maturity This measure is available on the market (ICCT 2011) Payback time is short to
medium with an average of 5 years (IMO 2009 Crist 2009)
Applicability This measure is applicable to new and retrofit vessels It is applicable for tanker- bulk-
container- and Roro-ships (Crist 2009)
Auxiliary engines and systems
Based on our own estimation auxiliary engines improvement are not bringing gt2-4 energy savings
because auxiliary engines consume much less fuel than the main engine Similar measures as de-rating
for the main engines and common rail upgrade could be implemented for the auxiliary engine
Other options for improving auxiliary systems are speed control of pumps and fans control strategies
of cooling water systems room ventilation redesign of piping and instruments advanced computation
of airgas temperature distribution with reduced storage ventilation and with optimised ventilation
systems (DNV GL 2015)
Barriers There is a split incentive between vessel owners who are responsible for investing in these
technologies and vessel operators who are those who compensate for the fuel consumption and benefit
from such technologies (ICCT 2011)
Technical maturity This measure is available on the market (ICCT 2011) It is easy to apply and
uncomplicated in maintenance (DNV GL 2015) Payback time is short (DNV GL 2015)
Applicability This measure is applicable to all new and retrofit types of ships (DNV GL 2015)
Wind power
Wind power measures are available that can develop enough thrust to provide at least some supportive
propulsion Wind power can be utilised in various ways in shipping like traditional sails solid wing sails
Flettner-rotor and kits (see Figure 6) The techniques are currently used as supplementary power
(Brannigan et al 2009)
Figure 6 from left to right Kite (Cargill 2011) Flettner rotor (MIWB 2015) and solid sails (Wind Chellenger Project
HP 2015)
Solid wing sails are structured similar to aircraft wings which offer more thrust with less drag than
conventional sails Flettner rotors produce thrust from a rotating object in wind using the so-called
TRANL15371 7
Magnus effect The techniques have different characteristics with regards to how the thrust that is
produced relates to other factors such as wind strength wind angle wind stability and ship speed
(IMO 2009)
Towing kites vary from other concepts of wind power by having a small footprint during installation and
therefore being quite feasible to retrofit (Allenstroumlm 2013) Studies conducted at the Technical
University of Berlin indicated that the potential for sail energy has different prospective in the different
regions in the world Best scenarios exist in North Atlantic and North Pacific regions the South Pacific
seems a bit less potential The studies have shown that under normal circumstances the typical savings
using wind power may be 5 at 15 knots and up to 20 at 10 knots This study also revealed that
with optimal weather routing in the North Atlantic and given the best vessel with best sail type savings
can reach 15 percent at 15 knots and 44 at 10 knots (IMO 2009 Crist 2009) Nevertheless the
above figures should be considered indicative since practical experiences are limited Sail- and kite-
assisted power does seem to be a potential opportunity saving energy in the medium- and long-term
picture for shipping (IMO 2009) Christ estimates and average energy saving potential around 20
(2009)
Barriers There is a split incentive between vessel owners who are responsible for investing in these
technologies and vessel operators who are those who compensate for the fuel consumption and benefit
from such technologies (ICCT 2011) Although this technology can bring high energy savings the
investment is so high that there is not a short payback time
For solid wing sails complications could result in a need for masts to run down to the keel which can
be a bigger issue for retrofitting Additionally the presence of the mast and rigging could have significant
impacts on cargo handling (IMO 2009) Downside of the kite systems include the complex launch
recovery and control systems that are needed (IMO 2009)
Technical maturity This is still considered as experimental technology The technical barriers
identified above need to be tackled for this measure to be applied widely in the future Payback time is
estimated to be medium to long term (Allenstroumlm 2013 Crist 2009)
Applicability Wind power technologies are available and a number of cargo ships have been equipped
with wind engines to reduce demands from diesel engines (ICCT 2011) Kites can be used on ships
with a minimum length of 30m and works most energy efficient on ships with a typical speed not faster
than 16 knots Preferably tankers (crude oil product chemical LPG LNG other) and bulk carriers are
being considered as potential users due to this speed restriction (IMO 2011)
Control Systems Waste heat recovery
Waste heat recovery (WHR) technology can pass exhaust gases from a vessels engines through a heat
exchanger to generate steam for a turbine-driven generator The heat energy from the exhaust gas is
taken and transformed into electrical energy to reduce direct engine-fuel consumption for the
propulsion system or reduce auxiliary engine needs (ICCT 2011) Energy saving potential is estimated
between 6-10 on average 8 (Crist 2009 ICCT 2011)
TRANL15371 8
Figure 7 Efficiency of waste heat recover systems Sankey diagramme Even with high 50 efficiency of modern low-
speed engines there is still 50 of fuel input energy not being put to productive use The possibilities are illustrated
by this comparison of Sankey diagrammes for Waumlrtsilauml 12RT-flex96C engines without heat recovery (left) and with
high-efficiency waste heat recovery plant (right) showing in this case 114 gain in overall efficiency with WHR
(waste heat recovery) (WAumlRTSILAuml 2007)
Barriers Large capital investment requirements (around $5-6 million for a large container ship20) and
split incentive between ship owners and ship operators (ICCT 2011)
Technical maturity The technology is available on the market and has medium to long payback time
(WAumlRTSILAuml 2007 Crist 2009)
Applicability A WHR system is applied to vessels with a high production of waste heat and a high
intake of electricity WHR can be employed on ships with main engine average performance is higher
than 20000 kW and auxiliary engine average performance higher than 1000 kW This size
requirements limit the number of ships using this technology (IMO 2011) Generally it is applicable to
all ships types new and retrofit (Crist 2009)
Propellers and Rudders
Numerous devices have been designed for improving the energy consumption of vessels by recovering
as much as possible of this rotational energy in the flow from the propeller or to provide some pre-or
post-rotation of the in flow into and after the propeller to ensure best efficiency The most important
of these will be discussed in the following paragraphs (IMO 2009)
Ducted propeller (Kort Nozzle)
The accelerating ducted propeller consists of a screw propeller surrounded by a non-rotating duct
(nozzle) (Figure 8) Compared to the conventional propeller of the same diameter and thrust this
20 httpgcaptaincompower-exhaust-gas-paybacks-waste
TRANL15371 9
arrangement allows an increase inflow to the propeller improving the operating conditions around the
propeller and the ideal efficiency
Figure 8 Right photos of this Norwegian trawler (SetSail 2009)
The duct creates additional thrust load The potential for energy savings on relevant vessels range
between 1ndash20 (Crist 2009 IMO 2011 Barringhaus und Olds 1999 IMO 2009) whereupon 10 is a
good average value (IMO 2009 Crist 2009) The improvement of the combination of propeller and duct
overweigh negative effect of the increase water resistance caused by the duct
Barriers Since the duct has an optimal operational speed it does not work efficient at all speeds For
instance as drag increases with increasing speed eventually this will become larger than the added
thrust Therefore at high speeds ducts are typically not used (IMO 2009) The split incentive is a barrier
between ship owners (investor) and ship operators (gainer) as explained earlier (ICCT 2011)
Technical maturity Several standard designs are available on the market (IMO 2011) with a medium
payback time (IMO 2011)
Applicability Ducted propellers suits for vessels operating at high propeller loadings such as tankers
bulk carriers especially tugs and some offshore service ships The duct leads to increased friction but
at higher propeller loadings this is more than rewarded for by the positive effect of the combination of
propeller and duct (IMO 2009)
Contra-rotating propellers (CRP)
A rotating propeller induces a rotating motion in its backwash Normally this rotation energy of the
propeller gets lost The contra-rotating propeller is used in order to recover part of this energy (Figure
9) In a contra-rotating configuration two propellers are facing each other rotating in the opposite
direction with the aft propeller recuperating the turning energy in the wake from the forward propeller
(IMO 2011) To avoid complications with cavitation the aft propeller usually has a smaller diameter
than the front propeller Contra-rotating propeller arrangements involve a short shaft line and for that
reason primarily suitable for vessels with single-screw
TRANL15371 10
Figure 9 Left conventional propeller Right contra-rotating propeller The working principle is simple and effective
the power is split in a forward and aft propeller which through the different direction of rotation cancel out the
rotational energy losses behind the propeller (WAumlRTSILAuml 2009)
Potential savings of such measures are assessed to be in the order of 6ndash20 of the power consumption
with an average of 13 although higher figures may be presented by industry for specific cases Two
different full-scale measurements reported gains of 15 and 16 (IMO 2009 Crist 2009)
Barriers The mechanical installation of contra-rotating shafts is complicated and requires more
maintenance (IMO 2011) The split incentive between ship owners (investor) and ship operators
(gainer) is a barrier as explained above Although this technology can bring high energy savings the
investment is so high that there is not a short payback time
Technical maturity The technique is available on the market but problems with gearboxes for
contra-rotating propellers have been reported as well as operational problems with mounting (IMO
2009 IMO 2011) Payback time is reported as short (WAumlRTSILAuml 2009) but also as medium-long with
about ~15-20 years (Shuto 2010)
Applicability The technology is particularly beneficial for rather heavily loaded propellers as for
example very fast cargo vessels like Ro-Ro ships or for container ships (IMO 2011 Crist 2009) Contra-
rotating propellers need a short shaft line and hence mainly suited to single-screw ships (IMO 2011)
Contra-rotating propellers can be implemented as retrofit but it is more likely implemented in new
built ships due to the complicated mechanical installation (Crist 2009)
Post swirl devises
A number of different techniques belong to the post swirl category Several of them contain
modifications to the rudder or propeller (IMO 2009) Depending on vessel type and operational field
various power saving measures can be mounted to optimise water velocity distribution to the propeller
and to minimise slipstream losses due to swirl in the outflow of a propeller The most important among
these measures may be additional thrusting fins at the rudder twisted rudder (Figure 12) rudder-
bulb-systems with fins (Figure 13) and fins on the propeller fairwater also called post swirl fins or
boss cap fins (Figure 10)
Generally post swirl measures reported 1-8 energy efficiency (test models) Even 8-9 energy
efficiency from full-scale measurements for additional thrusting fins at the rudder Payback time is
estimated to be short to medium post swirl devices (DNV GL 2015 Crist 2009 ICCT 2011) Some of
CRP FOR BETTER PROPULSION EFFICIENCY
CONVENTIONAL PROPULSION
TRANL15371 11
the post swirl measure can be combined A good overview is given in Nielsen et al (Combined Kappel
propeller and rudder bulb system for improved propulsion efficiency not dated)
3431 Post swirl fins
The post swirl fins (Figure 10) can recover energy loss of propeller hub vortex in the propeller backward
flow and can lead to 3-5 energy saving on average 4 operating at the same speed (MOL 2011
Barringhaus und Olds 1999 Hansen Dinham-Peren und Nojiri 2011 ICCT 2011)
Figure 10 Example the post swirl fins or propeller boss cap fins (gcaptain 2012)
Barriers It is simple and straightforward measure requiring only the removal of the propeller boss
caps and replacement with the post swirl fins (no hull modification is needed) (Hansen Dinham-Peren
und Nojiri 2011 MOL 2011) However there is a split incentive between ship owners (investor) and
ship operators (gainer) as explained above
Technical maturity The technique is available on the market In 2013 post swirl fins were applied
to over 2500 ships worldwide (MOL 2011) Further advantages of the post swirl fins are reduction in
propeller torque reduced vibration in the stern and less underwater noise and reduced rudder erosion
(MOL 2011) A payback time of 6 months was estimated for 4 efficiency improvement at $600tonne
oil price (Hansen Dinham-Peren und Nojiri 2011) The investment is considered to be low21
Applicability The technique is effective for all screw propellers irrespective of the type or hull form
of the ship Has been tested on large-scale container vessels (MOL 2011 Hansen Dinham-Peren und
Nojiri 2011)
3432 Free rotating wheels
A vane wheel (Grim wheel) is a freely spinning propeller mounted behind the main smaller propeller
(see Figure 11 for example of use on retrofit Queen Elisabeth II in 1986) The vane wheel has a bigger
diameter than the main propeller and increases the propeller diameter The small propeller drives the
freely revolving vane wheel fitted on the wake The inner part of the vane wheel acts as a turbine and
the outer part as an ldquoadditionalrdquo propeller
21 httpgcaptaincompropeller-technology-ship-efficient
TRANL15371 12
Figure 11 Example for a grim vane wheel (Boat design 2007)
This leads to a substantial recovery of the rotational energy The energy saving potential is reported to
be 10 (Brannigan et al 2009) It is stated that the important benefit of the vane wheel is that a
smaller impulsion propeller can be installed which consumes less energy The vane wheel gives a
suitable energy improvement for cargo ships (IMO 2009 Schneekluth und Bertram 1998) and has short
payback time It is also stated that if there is room for a vane wheel in the aft there is also space for
an impulsion propeller of larger diameter leading about the same energy saving potential as the
combination of a small impulsion propeller and a vane wheel (IMO 2009)
Barriers A barrier is the split incentive between vessel owners who are responsible for investing in
these technologies and vessel operators who are those who compensate for the fuel consumption and
benefit from such technologies
Technical maturity Limited application Vane wheels are subjected to strong fluctuations in loading
Problems with the strength of the blades have been encountered frequently (for example the vane
wheels on the Queen Elisabeth II were short lived and not used after22)The payback time is estimated
to be short
Applicability The technique is effective for all screw propellers irrespective of the type or hull form
of the ship both for new and existing ships (Chen Reed und Kim 1989) Recommended for all ship
types except ferry and cruises because of their problem with strong fluctuations in loading as
mentioned above23 (IMO 2009)
3433 Twisted rudder
Rudders can play a significant role of extra frictional resistance Rudders are located in the backwash
of a propeller and rotational energy will act on the rudder Because of these effects the rudder gives
prospects of efficiency gains (Schulze 2007)
22 httpwwwroblightbodycomlinersqe-21987_Refitindexhtm 23 httpwwwroblightbodycomlinersqe-21987_Refitindexhtm
TRANL15371 13
Figure 12 Schematic capture of twisted rudder (Nakashima 2015)
Twisted leading edge technology provides multiple benefits for high-speed vessels compared to
conventional rudder designs Conventional rudders are located behind the propeller with the rudder
profile arranged symmetrically about the vertical rudder centre plane This arrangement does not
consider the fact that the propeller induces a strong rotational flow that strikes on the rudder blade
This consequences in areas of low force on the blade that induce cavitation and associated erosion
problems (Becker Marine System 2015 Schulze 2007)
The twisted rudder is horizontally twisted on the lower and upper side of the segment that is an
extension of the propeller shaft (Figure 12) This decreases cavitation rudder and improves
manoeuvrability of the vessel (Schulze 2007) Twisted rudder types lead to energy efficiency
improvements by approximately 2-4 on average 3 for large-size high-speed vessels (Hollenbach
und Friesch not dated Nakashima 2015)
Barriers Work needs to be done in the dry dock this is not regularly happening for existing ships
(Hochkirch und Bertram not dated) There is a split incentive between vessel owners who are
responsible for investing in these technologies and vessel operators who are those who compensate
for the fuel consumption and benefit from such technologies (ICCT 2011)
Technical maturity This rudder type is a commercially used technology and easy to apply if the ship
is in the dry dock (ICCT 2011)The payback time is estimated to be short to medium (Rolls-Royce 2014
Crist 2009)
Applicability Twisted rudder can used by container vessels reefers Ro-Pax ferries cruise ships and
naval vessels In South Korea this type of rudder is recognised as a standard rudder for large-size
high-speed container carriers (Nakashima 2015)
TRANL15371 14
3434 Rudder bulb
Figure 13 Example for a rudder bulb Kawasaki RBS-F rudder bulb systems with fins (Kawasaki 2015)
The rudder bulb brings smooth inflows from the propeller and can reduce the drag of the rudder The
rudder fins produce thrusts in the rotational flows generated by the propeller (Figure 13) Rudder bulb
measure can improve energy efficiency by 2-5 (Nielsen et al not dated Becker Marine System not
dated) on average 4 (Crist 2009)
Barriers The work needs to be done in the dry dock this is not regularly happening for existing ships
There is a split incentive between vessel owners who are responsible for investing in these technologies
and vessel operators who are those who compensate for the fuel consumption and benefit from such
technologies (ICCT 2011)
Technical maturity The technology is a commercially used technology and easy to apply while the
ship is in the dry dock (Kawasaki 2015) Payback time is estimated to be medium (Crist 2009)
Applicability For new and retrofit tanker- bulk- container- and Roro-ships with a propeller and
rudder (Crist 2009)
TRANL15371 15
Barriers to the transfer and uptake of energy
efficiency technologies for ships and possible
measures to overcome them
Although there are ways to reduce emissions (Chapter 3) and also drivers working towards the
implementation of such measures there are significant barriers to acting on cost-effective opportunities
in the maritime industry This is often referred to as barriers to energy or the energy efficiency gap
(Michele Acciaro 2013) (Sepideh Jafarzadeh 2014) (OECD 2014) Some barriers are shared with other
industries while others are unique to the maritime industry Furthermore many of these barriers are
not specific to the EEDI and the SEEMP but apply to any rule under MARPOL These barriers can exist
on both the supply and the demand side For example there could be barriers to the development and
implementation of measures that reduce CO2 emissions from ships and barriers to the expression of
demand for these measures (ECORYS 2012) Studies have however shown that there are relatively
few barriers related to the development of new technologies or access to related intellectual property
rights by the main shipbuilding nations and that the supply of measures exceeds the demand (ECORYS
2012) Existing studies on barriers to energy efficiency thus focus on what prevents the uptake of
available measures
This section presents an overview of the main barriers to the transfer and uptake of energy efficiency
technologies in the shipping industry and discusses potential ways of overcoming them
Preliminary assessments of technology transfer and financial needs by both workshop participants and
the IMO Ad Hoc Expert Working Group on Facilitation of Transfer of Technology for Ships (AHEWG-TT)
have suggested that the type of assistance needed by Port State and Flag State administrations will be
of a different nature than that required by shipbuilders and owners Our assessment above has shown
that the shipbuilding industry is expected to need less assistance than Port States and Flag States
In the next table we list a summary of the main barriers and the stakeholders concerned in the main
categories as identified by AHEWG-TT as well as the possible measures that could help overcome these
barriers The possible measures to overcome the barriers are further detailed in the sections below
Related costs are estimated in a separate section in order to minimise overlap
TRANL15371 16
Table 2 Summary of main barriers relevant stakeholders and possible measures to overcome them
Barrier Stakeholders Measures forward
Lack of awareness
(administrative and industry)
a MARPOL in general MARPOL Annex
VI EEDI and SEEMP in particular
b Available energy efficiency
technologies
Flag and Port
States
Ship owners
Capacity building
- Workshops
- Trainings
Model course for training
Inventory
Platform for information access and
sharing
Agreements between industry and
administrations
Technology concerns
a Lack of or limited technology supply
chain in some states
b Lack of technology base for RampD in
some states
c Lack of trust (in ability to reduce
emissions in ability to reduce
operational costs in compatibility
with other measures)
Ship owners
Investors
Increase cooperation in ship design
and building
Increased interaction between
industry and educationalRampD
institutes
Establish platform to share
expertiseexperience
Provide special investment or
guarantee funds
Institutional concerns
a Increased administrative burden
1Revision and amendment of existing legislation
2Implement Port and Flag State obligations
b Limited technical capacity in state institutions to implement
c Lack of financial resources for additional compliance and enforcement activities by maritime administrations
Flag States
Port States
Promote increased cooperation and
communication between
administrationswithin regional
administrations
Regional information workshops for
Port and Flag States
Establish platform to share regulatory
experience
Development aid
Commercial
a Increased costs for ship owners to
take up energy efficient technologies
b Lack of motivation of owners to take
up energy efficient technologies (split
incentive)
Ship owners
Financiers
Special EE funds
Smart contracts
TRANL15371 17
Awareness Raising
Barriers Lack of Awareness
The need to create awareness among Flag States Port States and ship owners of the requirements of
Annex VI in general and Chapter 4 in particular was highlighted by participants of the workshop and
emphasised by the AHEWG-TT The level of awareness in the various regions and even in the countries
within the regions differed considerably The AHEWG-TT further suggests it would be beneficial to
undertake an initial evaluation of knowledge needs (gap analysis) in order to ensure workshops and
other awareness-raising activities are appropriately tailored24
Furthermore ship-owners are not always aware of the energy efficiency technologies available on the
market or which operational measures can be implemented to save fuel Ship owners can be companies
people and investment funds Especially private equity groups tend to focus more on short term looking
for quick profit while traditional ship owners tend to hold the ship for at least 20 years25
Measures forward
Though Flag States and Port States should already have implemented measures to ensure that Energy
Efficiency Design Index (EEDI) and Ship Energy Efficiency Management Plan (SEEMP) requirements are
complied with both public administrations and industry representatives could benefit from additional
trainingcapacity building and platforms to share experiencesreceive information with regards the
practicalities of these regulations and available energy efficiency technologies The needs for each
group can be determined through a gap-analysis which we recommend to be carried out by an
independent consultant in cooperation with the flag and port states Once the specific needs for each
group have been determined they can be addressed through the following awareness raising
measures
Capacity Building (workshops trainings)
Workshopstrainings could be organised where formal training is combined with open discussions where
experiences could be shared just within one stakeholder group or between educational institutes
auditors operational managers of ships shipbuilders and authorities Such trainingsworkshops could
focus on just one or all aspects relating to the applicable rules available energy efficiency measures or
assessment methods of technologies (eg training in calculating and verifying EEDI and SEEMP
including development of tools to calculate EEDI and SEEMP) Trainingsworkshops can be local or
regional Sending people physically to regional workshops is generally more conductive to networking
and experience sharing but less adapted to the local situation and more costly
To reduce the costs of training and ensure a certain level of training the IMO or other qualified
international partners (eg WMU) could develop model courses for training In order to better
understand the rules and regulations in detail people use the help of trainers to better understand the
elements that are important for them and to gain experience in doing calculations and other required
24 Ad Hoc Expert Working Group on Facilitation of Transfer of Technology for Ships 2nd Meeting 25 httpwwwftcomcmss0dadcb240-3d97-11e3-b754-00144feab7dehtmlaxzz3aqC3tmNu
TRANL15371 18
activities by the regulations Trainers have to develop their courses and earn back their investments
via trainings Since the trainers are doing this simultaneous it would be more efficient if there would
be a model course available that can easily be tailored to the audience This would reduce the costs for
the development of trainings and would also ensure that the trainers provide the same level of depth
in their trainings Since the IMO is responsible for the rules and regulations it would be the logical
responsible for the efficient implementation and therefore could take the initiative for developing model
courses
Information Sharing
Inventory of energy-efficiency technologies (for example the IMO-GEF-UNDP project) Many
studies and overviews on the internet are available The quality and the scope is often
different
Improved access to information and information sharing with international recognised
organisations including relevant survey and certification training One example of
establishing information sharing between governments is the work of the OECD Council
Working Party on Shipbuilding (WP6)26 which organises regular workshops aimed at
facilitating the exchange of information on policy and industry developments
Note that many of these measures overlap with the measures required to overcome institutional
barriers as laid out in section 43
Agreements between industry and administrations could be envisaged to overcome the
barriers
In order to enhance the sharing of expertise for both administrations and industry technology transfer
and technology cooperation agreements could be formulated in order to strengthen the cooperation
As identified before the technology transfer to the ship building industry is not a mayor barrier so the
agreements should help the administrations to become more aware of the possibilities to further
promote the implementation of MARPOL Annex VI
Typical agreements between industry and administrations could be in the form of initiatives like the
Sustainable Shipping Initiative (SSI) SSI members have developed a vision for a sustainable shipping
industry in 2040 They commit to working towards this in all their own operations andor activities that
involve shipping and in all their dealings with and support for the shipping industry to make their vision
a global reality by 2040 SSI members of over 19 companies represent ship owners and charterers
shipbuilders engineers and service providers banking insurance and classification societies The SSI
explored for instance how to overcome barriers to the uptake of new technologies and techniques which
improve the operational efficiency of ships potentially delivering energy efficiency savings of 10 or
more and payback periods of less than 5 years They also produce case studies to show good examples
and also develop tools By involving administrations in these kind of initiatives (even free of charge)
they could be actively supported with knowledge about sustainable shipping
26 httpwwwoecdorgstiindworkshopongreengrowthinshipbuildinghtm
TRANL15371 19
Technology Concerns
Barriers Technology Concerns
One of key barriers to the implementation of energy efficient technologies (new and retrofit) relates to
the lack of or limited technology supply chain Furthermore the lack of a technology base for RampD in
some states is a barrier Also the existence of concerns relating to the ability of available energy
efficiency measures to reduce emissions and operational costs and their compatibility with other
measures of energy efficient technologies is a barrier This is typically the problem in very isolated ship
yards
Measures forward
Very successful shipyards (Japan and Korea) have already since many years a large number of
licencing technology transfer and similar agreements and continuously exchange information with
competitors in and outside their countries For instance US shipyards have adopted this methodology
since the 1980s (office of technology assessment 1983)
Further technology sharing could be stimulated through educationalRampD institutes locally regionally
or globally in ship design and building The technology will be transferred to the ship builders once the
students start working there or through cooperation between industry and university In order to
facilitate this we recommend the establishment of partnerships to share expertiseexperience
Typically individuals who know both worlds are the driving force behind successful partnerships (AISBL
2012) These partnerships are built around a shared long term research vision Many partners could
contribute (eg financially) in order to establish the responsible management and research programme
The target of the platform could be for example to provide verified information on real-world energy
efficiency improvements via a monitoring programme
For example in order to stimulate the deployment of energy efficient trucks the Dutch government
provides a website to share audited knowledge and data on about 15 energy efficiency technologies27
Additionally climate financing could be leveraged to reduce the investment risk in unproven
technologies For example IMO Member States could create a demonstration fund that can function as
a guarantee for investments in new and immature technologies28 Similarly investment guarantees
can be provided by funds in the same way governments provide export credits to their companies If
the technology does not deliver the expected fuel-savings the fund can cover the difference and hence
reduce investment uncertainty The main objective being to reduce investment risk
Institutional Concerns
Barriers
27 httpwwwtruckvandetoekomstnl 28 An example of a specific EE fund is httpwwweeefeueligible-investmentshtml
TRANL15371 20
For Flag and Port States complying with new regulations of IMO and EEDI and SEEMP particularly
represent and increased administrative burden It requires revisions and amendments of existing
legislation that need to be implemented at Port and Flag State functions There is currently limited
technical capacity in state institutions to implement these changes especially in developing countries
with a relatively low number of ships under their flag
The lack of financial resources is also a barrier for additional compliance and enforcement activities by
maritime administrations This is particularly an issue for least developed countries and small
developing island states Implementation costs are relatively higher for small Flag States because of
limited abilitycapacity to implement new technical regulations Note that this issue is not specific to
the EEDI and the SEEMP but to most regulatory measures (maritime or other)
Measures forward
Measures to assist states in implementing (existing and new) legislation include
Promote an increased cooperation and communication between administrationswithin
regional administrations of Port and Flag States similarly to what has been suggested in
sections 41 (Awareness raising through capacity building activities such as workshops) and
42 (Establish platform to share regulatory expertiseexperience) Platforms could be
managed by IMO in conjunction with industry and development funds in order to share the
costs as this has been done before for GloBallast for example In that case the IMO is in the
lead (executing agency) but the platform is supporting the collaboration with many
stakeholdersfunding partners The goal of the programme is to assist developing countries
eg via e-learning courses
In addition deterrents need to be put in place to discourage Flag States from performing
substandard inspections A system for detecting sub-standard inspections should be
implemented whereby mandatory Port State Control inspections are carried out in close
proximity to mandatory Flag State inspections (ie the Flag State inspection is carried out
prior to the ship leaving port and the Port State inspection is carried out upon arrival at port)
The two inspections should be carried out under a uniform mandatory checklist The IMO
should monitor inspections and investigate where discrepancies between inspections close in
proximity are detected If a Flag or Port State is found to have failed to meet the requisite
inspection standards penalties in the form of substantial fines should follow
In order to overcome the financial barriers financial assistance to states could help with
capacity building and implementation Financial resources are not only needed in the
implementation of the new regulations (training of government experts) but governments of
Flag States also need to be involved continuously in the ongoing discussion around
developments new EEDI targets for 2020 and beyond which requires continuous availability
of experts to represent the interests of the state (Metselaar 2015) Financial aid can therefore
be supplied in the following forms
Increased financial support for compliance and enforcement activities by maritime
administrations
Financial support could be provided to Flag States so that they have the resources to
properly carry out vessel inspections Consideration should be given to the introduction of
TRANL15371 21
an International Fund Convention set up for this purpose and contributed to by Port
States andor their major oil and other cargo exporters and importers
Commercial
Barriers
Private parties such as ship owners and investors are not always commercially incentivised to make
investments in energy efficiency measures This can be due to the split incentives between owner (who
should make the investment) and charterer (who reaps the cost savings) of a ship (see paragraph 25)
Furthermore access to finance can be problematic for smaller players who operate in niche markets
Measures
Bottlenecks in financing private investments and new financing mechanisms could be addressed during
regional or international workshops that include traditional and new financiers that could finance
investments in energy efficiency technologies
One solution that has been brought forward to address the problem of split incentives is the use of
lsquosmart contractsrsquo (Michele Acciaro 2013) The idea is to change charter contracts in a way that risks
and benefits are shared among charterers and ship owners In such contracts speed choice is more
flexible and the chartering cost of vessels is closer to fuel cost as such ship owners get motivated to
invest in energy-efficient technologies and charterers get stimulated to run vessels in an energy
conserving manner
With respect to the shipbuilding industry the following could facilitate the transfer of technology as
well
Financial assistance to shipyards to be provided at the national level or through other
arrangements
Foreign direct investment in software and hardware as an innovative way to support industry
in implementing the requirements
One type of incentive that governments can provide to enhance industry performance and technology
adoption is a competition for top performers Governments could contribute to a fund from which
money is distributed to the top 10 of best performers in a particular year
Cost estimates
Workshops and training
Capacity building workshops for administrations are estimated at euro 1000 per attendee for an
online workshop (1-2 days) Costs for the organisation of such workshops would include expert fees
and administrative costs These costs could be lower if the course material is already developed
(model workshops) Eg 2 attendees per Flag State for the ten most important Flag States
TRANL15371 22
(covering 74 of total fleet tonnage) comes down to euro 20000 or less in case the courseware is
already existent
A situation that is more conductive to networking and experience sharing is to send people physically
to regional workshops The costs of such workshops including participants travel and hotels for 50
participants would be between euro20000 - euro100000 per workshop based on our international
experience with organising workshops in the field of renewable energy and energy efficiency Costs
could be lower depending on the amount of preparation required cost of location (could be sponsored
by participating states)
Technical training
Trainings already exist for calculating and verifying EEDI including development of tools to calculate
EEDI For example MARIN offers 32h courses over 5 days in the Netherlands for euro 5000 per attendee
(excluding travel and accommodation)29 Lloyds offers similar trainings for similar costs30
Model courses for training may need to be updated depending on identified needs Ecofys estimates
the update of eg an existing EEDI model courses to cost in the order of euro 50000
Online platform for inventory of energy efficiency technologies
Inventories of energy-efficiency technologies already exist (for example in reports like (IMO 2009) and
on websites of for instance DNV-GL the efficiency finder31) but they could be further developed since
the websites are either not independent or incomplete
In order to facilitate information exchange a web-based platform could be established The role of the
platform would be for example to provide verified information on real-world energy efficiency
improvements via a monitoring programme For example in order to stimulate the deployment of
energy efficient trucks the Dutch government provides a website to share audited knowledge and data
on about 15 energy efficiency technologies32 The costs of such a website and corresponding
programme are estimated to be around euro 2 million for a 4 year period Furthermore a platform can be
used to inspire others by showing best practices and can be used for sharing of information regarding
network opportunities like conferences and seminars
Capacity building project
Currently the IMO-GEF-UNDP GloBallast project is a capacity building project it assists developing
countries and their maritime industries in implementing international regulations on ballast water
29 httpwwwmarinnlwebEventsCoursesSpecialist-Course-on-Ship-propulsion-model-tests-and-SpeedPower-trials-for-EEDI-Verifiers-
2731-October-2014htm 30 httpwwwlloydslistcomllsectorship-operationsarticle422262ece 31 httpswwwdnvglcommaritimeenergy-efficiencyefficiency-finderhtml 32 httpwwwtruckvandetoekomstnl
TRANL15371 23
management and preventing risks arising from the transfer of harmful aquatic organisms And has
several aspects that could also be used for knowledge transfer of energy efficiency measures
web-site
e-learning course
databasesdirectories
library collections
newsletter
Regional Task Force (RTFs) to support development and adoption of a regional approach
Develop and implement communication education awareness raising and outreach
programme
Develop introductory and more specialised training packages
Develop model legislations
The total budget for the 2008-2012 period was US$23 million out of which US$564 million represents
a GEF grant the rest being mostly in-kind contributions from the participating countries regional co-
ordinating organisations (RCO) and strategic partners including the private sector
Improved access to information and information sharing with international recognised organisations
including relevant survey and certification training would further promote the different technologies
TRANL15371 24
Conclusions
This study provides an overview of existing technologies which could drastically improve the energy
efficiency of ships Furthermore barriers to transfer and uptake of energy efficient technologies are
analysed and categorised and implications of these barriers are listed in order to facilitate the uptake
of energy efficiency technologies for ships
From this research it is clear that conventional technology is available that can cost-effectively (with a
payback time of less than 15 years) achieve high efficiency gains If the maximum gains per category
are added up (for all but ferry and cruise) this would mean a total efficiency improvement of 35
Even without taking two experimental technologies with potentially high efficiency gains into account
(wind power and air lubrication)
High investments like wind power and contra rotating propellers bring the highest savings (13 ndash 20)
The medium investments are in-between (5-10) and the low investments only bring relatively small
energy efficiency improvements (lt5)
When the ship owner has too few opportunities to share investment with charterers this leads to a split
incentive a ship owner may invest the up-front capital to put in energy-efficient technology but not
receive the benefits This is typically a problem for investments with a high payback time ie the wind
power and contra rotating propellers
The main barriers are related to the transfer of technology to Flag States Flag States are generally
third world and developing nations that often do not have the resources to enforce investigate or
prosecute breaches by their flagged vessels
Several ways to overcome the knowledge transfer barriers were presented that can be categorised as
follows
Workshops and trainings
o Capacity building workshops for administrations
o Regional workshops
Technical training
o Training in calculating and verifying the EEDI
o Development of model courses
Online platform
o Inventory of energy-efficiency technologies
o Creation of a website with all relevant information for the target audience
o Improved access to information and information sharing
o Provide verified information on real-world energy efficiency improvements via a
monitoring programme
TRANL15371 25
The most expensive of the capacity building actions is the capacity building project which takes all
aspects above into account If a project would be developed for knowledge transfer regarding energy
efficiency measures similar to GloBallast which assists developing countries and their maritime
industries in implementing international regulations on ballast water management and preventing risks
arising from the transfer of harmful aquatic organisms the total budget needed would be in the order
of US$23 million for a period of 5 years
TRANL15371 26
References
JFE Group 2013 ldquoJapan Marine Unitedrdquo JFE Group Overview JFE Group AISBL 2012 Making Industry-University partnerships work lessons from succesful collaborations
report Belgium AISBL
Allenstroumlm Bjoumlrn 2013 ldquoWind propulsionrdquo SSPA Sweden AB Gothenburg EffShip March
Aqorau T 2000 Illegal Unreported and Unregulated Fishing Considerations for Developing
Countries paper Honiara Solomon Islands South Pacific Forum Fisheries Agency
BALance 2014 Competitive position and future opportunities of the Euroean Marine Supplies
industry BALance Technology Consulting
Barringhaus David and Robert Olds 1999 OLDS ENGINEERING Maximizing Propulsion Efficiency
Marine Division Accessed Februrar 2015
httpwwwoldscomaumarinemaximizing_propulsion_efficiency
Becker Marine System not dated Becker Bulb Rudders httpwwwbecker-marine-
systemscom05_downloadszzpdfproduct_pdfBecker_Bulb_Rudderspdf Becker Marine
System
mdash 2015 Twisted Full Spade Rudder Accessed Feb 2015 httpbecker-marine-
systemscom03_productsproducts_twisted_full_spadehtml
Bloomberg 2014 China Loses Shipbuilding Crown to South Korea Chart of the Day 9th December
httpwwwbusinessweekcomnews2014-12-09china-loses-shipbuilding-crown-to-south-
korea-chart-of-the-day
Bluebird-Electric 2014 Sipbuilding post World War Two httpwwwbluebird-
electricnetship_boat_design_buildingshipbuilders_ship_repairers_associationhtm
Boat design 2007 Accessed Feb 2015
httpwwwboatdesignnetforumsattachmentspropulsion16743d1193341389-new-
propulsion-sytems-ships-grim-prop-1jpg
Brannigan Paschos Eyers and Wood 2009 Report on International avialtion and Mritime Emissions
in a Copenhagen (post 2012) Agreement Oxfordshire AEA Group
Chen Benjamin Arthur Reed and Ki-Han Kim 1989 A Vane-Wheel Propulsor for a Research and
Development Report Newport David Taylor Research Center
CNSS 2015 Clean North Sea Shipping - Clean Shipping Technology Accessed Februar 2015
httpcleantechcnssnoghg-technologiestechnical-measuresmeasures-related-to-the-hull
Crist Philippe 2009 Greenhouse gas emissions reduction potential from international shipping
Working paper OECD
Daily Times 2015 Nigeria Turkey seek collaboration on ships shipyards 5th January
httpwwwdailytimescomngarticlenigeria-turkey-seek-collaboration-ships-shipyards
Dillingham Gerald L 2000 Progress Made to Reduce Marine Pollution by Cruise Ships but Important
Issues Remain GAO report Washington United States General Accounting Office
DK Group 2015 Silverstream technologies January Accessed January 2015 httpdkgroupeu
DNV 2014 Encouraging Construction and Operation of Green Ships OECD
httpwwwoecdorgstiindC-WP6(2013)12-FINAL-ENGpdf
TRANL15371 27
DNV GL 2015 EFFICIENCY FINDER Accessed Feb 2015 httpwwwdnvglcommaritimeenhance-
performanceefficiency-finderaspx
Ecorys 2012 ldquoGreen growth opportunities in the EU shipbuilding sectorrdquo
ECOSPEED 2015 EUROPEAN MARINE amp MACHINERY AGENCIES LTD Accessed February 2015
httpwwweuropeanmarinecoukECOSPEEDhtm
gcaptain 2012 gcaptain - Propeller Technology to Make Your Ship More Efficient - Accessed Feb
2015 httpgcaptaincompropeller-technology-ship-efficient
Hansen Dinham-Peren and Nojiri 2011 Model and Full Scale Evaluation of a lsquoPropeller Boss Cap
FinsrsquoDevice Fitted to an Aframax Tanker Second International Symposium on Marine
Propulsors smprsquo11 Hamburg Germany June 2011
Hellenic Shipping News 2014 Korean ships sell at fuel-saving premium 22nd December
httpwwwhellenicshippingnewscomkorean-ships-sell-at-fuel-saving-premium
Hindawi 2015 Hindawi Puplishing Cooperation Accessed February 2015
httpwwwhindawicomjournalsijrm2012474785fig4
Hochkirch Karsten and Volker Bertram not dated ldquoSlow Steaming Bulbous Bow Optimization for a
Large Containershiprdquo Accessed Februar 2015 http2021148960resourcepdf5096pdf
Hollenbach Uwe and Juumlrgen Friesch not dated Efficient hull forms ndash What can be gained
Conference ship-efficiency Hamburg 2013 Hamburg HSVA Hamburgische Schiffbau-
Versuchsanstalt GmbH HamburgGermany
ICCT 2011 Reduce Greenhouse Gas Emissions from Ships - Cost Effectiveness of Available options -
white paper Washington DC International Council on Clean transportation (ICCT)
IMO 2011 REDUCTION OF GHG EMISSIONS FROM SHIPS Marginal Abatement Costs and Cost
Effectiveness of Energy-Efficiency Measures Submitted by the Institute of Marine Engineering
Science and Technology (IMarEST) MEPC 62INF7 International Maritime Organisation
IMO 2009 Second IMO GHG Study 2009 London International Maritime Organisation
JSEA 2006 ldquoImproved propulsive performance - Universal applies new energy-saving type Leadge
Bowrdquo Japan Ship Exports Association (JSEA) httpwwwjseaorjpVariableJSea318pdf
Kawasaki 2015 Energy-saving Technology Accessed Feb 2015
httpswwwkhicojpenglishshiptechconservationindexhtml
Leddy Fiona Jayne 2012 ldquoA critical legal analysis of International Shipping in Australian Waters and
the risk of ship-based oil pollutionrdquo Queensland Environmental Practice Reporter vol 17
Marinelog 2014 China white lists 51 shipyards 4 September
httpwwwmarinelogcomindexphpoption=com_k2ampview=itemampid=7667china-white-
lists-51-shipyardsampItemid=231
Metselaar Kees interview by Arno van den Bos 2015 Policy officer at directorate maritime affairs of
ministry of Intrastructure and Environment (February)
Michele Acciaro Peter Nyegaard Hoffmann Magnus Strandmyr Eide 2013 ldquoThe Energy Efficiency
Gap in the Maritime Transportrdquo Journal of Shipping and Ocean Engineering 1-9
MIWB 2015 Maritiem Instituut Willem Barentsz Accessed Feb 2015
httpsmijnmiwbnlnieuwsbriefindexphpdo=showampid_artikel=116
MOL 2011 Energy-Saving Propeller Boss Cap Fins System Reaches Major Milestone - Orders
Received for 2000 Vessels Accessed Feb 2015
httpwwwmolcojpenpr20111145html
TRANL15371 28
Motorship 2014 Gas fuelled ships into the future 31 10 httpwwwmotorshipcomnews101ships-
and-shipyardsgas-fuelled-ships-into-the-future
Nakashima 2015 Nakashima propeller CO LTD Accessed Feb 2015
httpwwwnakashimacojpengproductrudderhtml
Nielsen Shin Lundgren and Faghani not dated Combined Kappel propeller and rudder bulb system
for improved propulsion efficiency Frederikshavn MAN Diesel amp Turbo
OECD 2014 The OECD Council Working Party on Shipbuilding
httpwwwoecdorgindustryindshipbuildinghtm
OECD 2011 ldquoThe Shipbuilding Industry in Turkeyrdquo
office of technology assessment 1983 An Assessment of Maritime Technology and Trade report
Washington DC US Congress
Pakarinen Risto 2007 ldquoNothing common about common railrdquo Twentyfour7 (Twentyfour7) 64-65
Ports amp Ships 2015 Ports and Ships Accessed February 2015
httpportscozanewsarticle_2007_10_17_4038html
Rolls-Royce 2014 Propulsors - Moving your business in the right direction httpwwwrolls-
roycecom~mediaFilesRRolls-Roycedocumentscustomersmarinepropulsion-2014-
tcm92-8664pdf Aalesund Rolls-Royce Commercial Marine httpwwwrolls-
roycecom~mediaFilesRRolls-Roycedocumentscustomersmarinepromaspdf
Schneekluth H and V Bertram 1998 Ship Design for Efficiency and Economy Oxford
Butterworth-Heinemann
Schulze Reinhard 2007 Twisted Rudder - Extreme Design 14 SVA-Forum bdquo Ruder in Theorie und
Praxisldquo Potsdam 7 November 2007 Potsdam Schiffbau-Versuchsanstalt Potsdam GmbH
Selenetrawlers 2015 Selenetrawlers Accessed February 2015
httpwwwselenetrawlerscomcompanydesign-notes
Sepideh Jafarzadeh Ingrid Bouwer Utne 2014 ldquoA framework to bridge the energy efficiency gap in
shippinrdquo Energy 603-612
SetSail 2009 SetSail Accessed February 2015 httpwwwsetsailcomprop-nozzle-comments-by-
an-expert
Shuto Hideki 2010 Super Eco Inland Vessels httpwwwccr-
zkrorgtempwrshp120411Presentations2_04_HShuto_enpdf IHI Marine United Inc
Silberschmidt Noah 2014 ldquoGenerating efficiencies from thin airrdquo SMM Green shipping | Efficiency
httpwwwsilverstream-techcomwp-contentuploads201404HANSA-241112pdf
httpwwwsilverstream-techcomwp-contentuploads201404HANSA-241112pdf
Skinner Ian 2009 EU Tranport GHG Routes to 2050 Technical options for maritime and inland
shipping httpwwweutransportghg2050eucmsassetsTechnical-options-maritime-inland-
waterpdf Brussel European Commission
Statista 2015 ldquoLargest shipbuilding nations in 2013 based on completions in gross tonnagerdquo
httpwwwstatistacomstatistics263895shipbuilding-nations-worldwide-by-cgt
UK DfT 2014 ldquoDfT Port Statistics - World fleet registered trading vessels of 100 gross tons and over
gross tonnage on selected registers 1999-2013rdquo
httpswwwgovukgovernmentcollectionsmaritime-and-shipping-statisticsdata-tables-
associated-with-this-series
TRANL15371 29
Voorham 2013 Assessment of sustainable investment in shipping Master Thesis
Report SDPO13029m Delft 27 th November 2013 Delft Delft University of Technology
WAumlRTSILAuml 2009 ldquoEnergy Evironment Economyrdquo Helsinki Finland WAumlRTSILAuml
mdash 2007 ldquoWaste heat recoveryrdquo Waumlrtsilauml Corporation
Wettstein and Brown 2008 Derating a solution for high fuel savings and lower emissions
Winterthur Waumlrtsilauml Switzerland Ltd
Wind Chellenger Project HP 2015 Wind Chellenger Project HP Accessed Feb 2015 httpwindku-
tokyoacjpindex_enhtml
TRANL15371 30
Appendix I - World fleet registered trading vessels
Table 3 World fleet registered trading vessels of 100 gross tons and over 2009-2013 Source UK DfT 2014
Flag Country 2009 2010 2011 2012 2013
(World Total) 8448 9130 9831 10343 10725
Panama 1886 1979 2084 2158 2172
(European Union) 1900 1979 2074 2051 2106
Liberia 908 1037 1167 1238 1241
Marshall Islands 475 590 711 811 900
Hong Kong 449 553 678 785 854
Singapore 398 434 512 592 677
Malta 348 380 438 450 496
Bahamas 452 469 481 483 485
Greece 388 407 411 411 415
China 282 327 356 388 411
United Kingdom (inc IOM and CI) 258 273 294 300 288
Cyprus 201 205 207 197 203
Japan 138 156 167 178 192
Italy 150 169 181 180 176
Norway 152 145 143 144 145
Germany 152 155 153 137 123
Denmark 107 115 113 113 122
Korea South 120 124 116 111 112
Indonesia 69 82 91 101 111
Bermuda 94 100 106 109 105
Antigua amp Barbuda 100 107 111 106 100
United States of America 107 108 102 99 97
India 83 83 89 85 82
Netherlands 76 61 67 66 69
Turkey 54 58 62 64 59
Malaysia 69 72 71 62 57
France 63 63 64 56 53
Russia 47 49 49 51 52
Philippines 50 51 50 43 43
Cayman Islands 27 29 32 32 31
Taiwan 25 26 27 30 31
Iran 09 08 05 21 31
Thailand 25 26 22 26 29
Sweden 39 35 33 28 27
St Vincent amp the Grenadines 47 42 37 28 24
Canada 24 24 25 24 23
Spain 22 25 26 25 23
Kuwait 23 19 24 24 22
Brazil 20 20 19 19 20
Cambodia 18 17 13 13 12
TRANL15371 31
Appendix II - Most important shipbuilding
countries
China
China is an emerging shipbuilder that overtook South Korea during the 2008-2010 global financial crisis
as they won new orders for medium and small-sized container ships (Bloomberg 2014 Bluebird-Electric
2014)
Figure 14 delivery of vessels from Chinese and South Korean shipyards in million compensated gross tons a measure
of building time and human resources used per ton Source (Bloomberg 2014)
China has more than 1600 shipyards Analysts have predicted that about one third of them will fold
as the industry struggles with overcapacity Last year China laid out a three year plan for industry
restructuring that urged yards to concentrate on building higher quality vessels and local governments
to halt approvals for new projects (Bluebird-Electric 2014)
After two decades of a loan-fuelled boom Chinarsquos shipbuilding industry has become saddled with debt
and overcapacity prompting some private firms to seek financial assistance from the state In
September the government issued a list of 51 shipbuilders it deemed worthy of public support
(Marinelog 2014)
TRANL15371 32
New additions to the white list include subsidiaries of the China State Shipbuilding Corporation (CSSC)
and the China Shipbuilding Industry Corporation (CSIC) and the AVIC Weihai Shipyard owned by the
Aviation Industry Corporation of China (AVIC) (Marinelog 2014)
South Korea
By the end of 2014 it seemed South Korea has overtaken China again as the worlds largest
shipbuilding country with a global market share of about 30(see Figure 14) (Bloomberg 2014)
(Bluebird-Electric 2014) South Korea leads in the production of large vessels such as cruise liners
super tankers LNG carriers drill ships and large container ships
South Koreas shipyards are highly efficient with the worlds largest shipyard in Ulsan operated by
Hyundai Heavy Industries slipping a newly built $80 million vessel into the water every four working
days South Koreas big three shipbuilders Hyundai Heavy Industries Samsung Heavy Industries
and Daewoo Shipbuilding amp Marine Engineering dominate global shipbuilding with STX Shipbuilding
Hyundai Samho Heavy Industries Hanjin Heavy Industries and Sungdong Shipbuilding amp Marine
Engineering also ranking among the top ten shipbuilders in the world In 2007 STX Shipbuilding further
strengthened South Koreas leading position in the industry by acquiring Aker Yards the largest
shipbuilding group in Europe (The former Aker Yards was renamed STX Europe in 2008) In the first
half of 2011 South Korean shipbuilders won new orders to build 25 LNG carriers out of the total 29
orders placed worldwide during the period
To maintain their market position Korean yards also focus more and more on greening opportunities
The Korean government introduced a GHG emission reducing program in 2008 The program is aiming
at reducing GHG emissions throughout all economic sectors including the shipping and shipbuilding
industry Also the Japanese Shipbuilding Association (SAJ) is looking into the possibilities to reduce
GHG emissions so that the shipbuilding industry becomes greener and more competitive (Ecorys
2012)
Japan
Japan had been the dominant ship building country from the 1960s through to the end of 1990s but
gradually lost its competitive advantage to the emerging industry in South Korea which had the
advantages of much cheaper wages strong government backing and a cheaper currency South Korean
production overtook Japans in 2003 and Japanese market share has since fallen sharply
The Philippines
The Philippines has placed fourth among shipbuilding nations around the world producing more than
six million deadweight tonnes of ships built in 2012 The country is anchored by South Korean Hanjin
and Japans Tsuneishi shipbuilders The country has shipyards in Subic and Cebu
TRANL15371 33
Europe
For several decades European shipyards have been facing strong global competition from especially
Asian enterprises (Japanese yards in the 1950s and 60s Koreans from the 1970s and 80s and Chinese
since the 1990s) In Europe this has led to an almost complete exit from the mass production segments
of tankers bulkers and containerships Response of the EU industry has been to focus on the higher
value more complex ship types such as ferries and passenger ships non-cargo vessels and general
cargo ships In addition only limited numbers of vessels of the same type are being built (in contrast
with bulk vessels which are mass produced) Europe has a 77 percent market share in building
passenger vessels (including both cruise ships as well as ferries) and a 17 percent share in the
construction of non-cargo vessels (Ecorys 2012) These segments make up a relatively small share of
the world orderbook (in CGT) However in value they represent a much higher share due to their
relatively sophisticated characteristics The position of the European shipbuilding industry in the
manufacturing of specialised innovative vessels is still strong At the same time European equipment
manufacturers have acquired a leading role in quality products especially in complex high value
equipment components
Figure 15 World orderbook and CESA orderbook by ship type in 2010 (CGT x 1000) (Source Ecorys 2012)
Regarding the marine equipment sector the European industry is renowned for propulsion cargo
handling communication automation environmental and security systems This equipment is not only
destined for complex European-built ships but also exported to Asian yards whether or not requested
by their clients (Ecorys 2012)
Compared to the ship construction sector the marine equipment segment is highly heterogeneous and
consists of companies that are often also active in other business areas (ie automotive or aircraft
industry) A study by (BALance 2014) found that the European marine equipment industryrsquos
TRANL15371 34
competitiveness lies in a strong market position and technological leadership at least for globally active
European marine supply companies who build their position on a strong infrastructure and co-operative
partners skill of their employees and close relationship with their customer base Conversely identified
weaknesses are the cost level in Europe and the heterogeneous structure of the industry with many
SMEs which hinder in some cases attempts to follow the markets by globalisation strategies
Turkey
Shipbuilding in Turkey has evolved from an old traditional activity in Anatolia to an internationally
recognised industry especially since the early 1990s The industry has modern shipyards that can build
ships yachts mega-yachts and sailing boats as well as carrying out extensive repair and conversion
works Turkeyrsquos shipyards are mainly located in the Marmara Region namely Tuzla Yalova and İzmit
which have developed into dynamic shipbuilding centres Also in recent years the emerging Black Sea
and Mediterranean Regions have increasingly attracted shipyard investments
In the last decade in parallel with developments in the global market Turkish shipbuilding experienced
a several-fold increase in its shipbuilding and export capacity including a significant product
diversification According to order books this resulted in Turkey being regularly placed in the top ten
countries on the basis of its deadweight (dwt) production and in the top five countries by the number
of ships
In recent years Turkey has increasingly tapped into niche markets which in turn has led to a growing
participation by Turkish shipyards in the international trade in new ships In parallel there has also
been strong growth in the marine equipment manufacturing sector which could increasingly also tap
the export market These developments reflect in part the strategic location of the yards the
experienced workforce the quality of production and Turkeyrsquos significant role as a political cultural and
economic bridge between Europe and Central Asian and Middle Eastern economies (OECD 2011)
ECOFYS Netherlands BV | Kanaalweg 15G | 3526 KL Utrecht| T +31 (0)30 662-3300 | F +31 (0)30 662-3301 | E infoecofyscom | I wwwecofyscom
ECOFYS Netherlands BV
Kanaalweg 15G
3526 KL Utrecht
T +31 (0) 30 662-3300
F +31 (0) 30 662-3301
E infoecofyscom
I wwwecofyscom
HOW TO OBTAIN EU PUBLICATIONS
Free publications
bull one copy
via EU Bookshop (httpbookshopeuropaeu)
bull more than one copy or postersmaps
from the European Unionrsquos representations (httpeceuropaeurepresent_enhtm)
from the delegations in non-EU countries
(httpeeaseuropaeudelegationsindex_enhtm)
by contacting the Europe Direct service (httpeuropaeueuropedirectindex_enhtm)
or calling 00 800 6 7 8 9 10 11 (freephone number from anywhere in the EU) () () The information given is free as are most calls (though some operators phone boxes or hotels may charge you)
Priced publications
bull via EU Bookshop (httpbookshopeuropaeu)
Priced subscriptions
bull via one of the sales agents of the Publications Office of the European Union
(httppublicationseuropaeuothersagentsindex_enhtm)
doi 102834880780
ML-0
1-1
5-4
39-E
N-N
[Ca
talo
gu
e n
um
be
r]
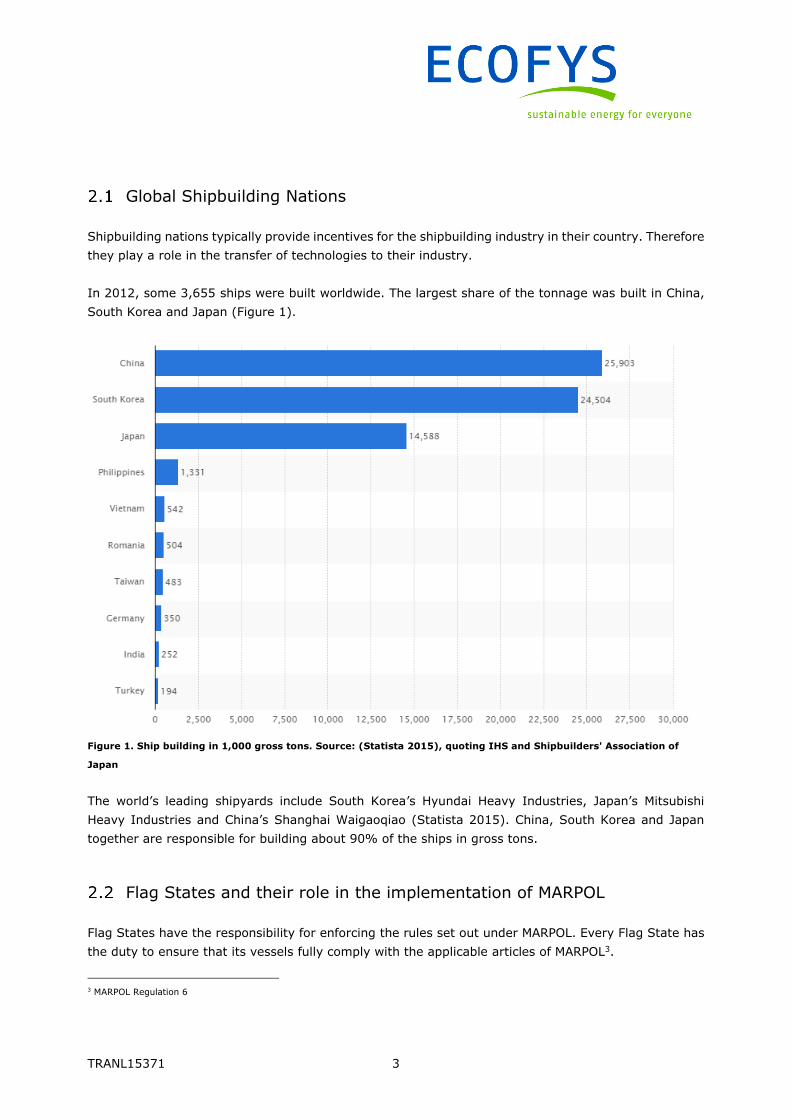
TRANL15371 3
Global Shipbuilding Nations
Shipbuilding nations typically provide incentives for the shipbuilding industry in their country Therefore
they play a role in the transfer of technologies to their industry
In 2012 some 3655 ships were built worldwide The largest share of the tonnage was built in China
South Korea and Japan (Figure 1)
Figure 1 Ship building in 1000 gross tons Source (Statista 2015) quoting IHS and Shipbuilders Association of
Japan
The worldrsquos leading shipyards include South Korearsquos Hyundai Heavy Industries Japanrsquos Mitsubishi
Heavy Industries and Chinarsquos Shanghai Waigaoqiao (Statista 2015) China South Korea and Japan
together are responsible for building about 90 of the ships in gross tons
Flag States and their role in the implementation of MARPOL
Flag States have the responsibility for enforcing the rules set out under MARPOL Every Flag State has
the duty to ensure that its vessels fully comply with the applicable articles of MARPOL3
3 MARPOL Regulation 6
TRANL15371 4
At the end of 2013 about one-fifth of merchant vessels were registered in Flag State Panama 12 in
Flag State Liberia and 8 in the Flag State Marshall Islands (Figure 2 and (UK DfT 2014)) Therefore
already 40 of the world fleet are registered in these three Flag States
Figure 2 World fleet registered trading vessels of 100 gross tons and over 2009-2013 Source UK DfT 2014
Under MARPOL these parties (Flag States) can enforce ship-owners and operators obligations in three
main ways
- by surveyinspection of vessels to ensure that they meet minimum requirements4
- by monitoring vessel compliance with oil discharge requirements5 (not relevant for energy
efficiency) and
- by implementing punishments for failure to comply with requirements6
Surveys
MARPOL Annex VI contains a set of requirements for survey and issuance of International Air
Pollution Prevention Certificate (IAPP) and regulations regarding
Ozone depleting substances from refrigerating plants and firefighting equipment
Nitrogen Oxides (NOx) from diesel engines
Sulphur Oxides (SOx) from diesel engines
4 MARPOL article 5 5 MARPOL Annex I Chapter 4 Regulation 31 6 MARPOL article 4
TRANL15371 5
Volatile Organic Compound Emissions from cargo tanks of oil tankers
Shipboard Incineration
Fuel oil quality
Flag States must conduct an initial survey before a new ship is put into service and before the IAPP is
issued for the first time a renewal survey at intervals specified by the Administration but not exceeding
five years an intermediate survey within three months before or after the second anniversary date or
within three months before or after the third anniversary date of the certificate an annual survey within
three months before or after each anniversary date of the certificate and after prescribed repairs an
additional survey7
For the EEDI and the SEEMP a new certificate the International Energy Efficiency Certificate (IEEC)
was established and must be kept available on board for inspectionssurveys The IEEC Certificate will
be issued for new build ships upon the initial survey before the ship is put into service and for existing
ships of 400 gross tonnage and above The IEE Certificate will be issued once for each ship and is valid
throughout the lifetime of the ship (except flag change major conversion or ship going out of service)
There are no follow-up surveys on the IEEC Certificate
The IMO has created guidelines for surveys that Flag States should follow The energy efficiency related
one is
2014 Guidelines on survey and certification of the Energy Efficiency Design Index (EEDI)
(resolution MEPC254(67))
A Flag State cannot allow a vessel that does not pass inspection to sail until it complies with MARPOL8
An International Energy Efficiency Certificate in accordance with the provisions of regulation 54 to
any ship of 400 gross tonnage and above is needed before that ship may engage in voyages to ports
or offshore terminals under the jurisdiction of other Parties
Punishments for failure to comply
In case of failure to comply the authority carrying out the inspection may detain the ship Article 7 of
MARPOL ensures that unduly delay or detain will be avoided where possible or compensated
A Flag State is obliged to investigate an incident upon receipt of notification or evidence that one of its
vessels has breached MARPOL If the investigations reveal that a breach has occurred the Flag State
has further obligations to initiate legal proceedings against the vessel and report back to the reporting
state on actions taken9
7 MARPOL Annex VI Chapter 2 Regulation 5 8 MARPOL Annex VI Chapter 2 Regulation 6 9 MARPOL article 6
TRANL15371 6
Also other parties are allowed to inspect vessels under MARPOL Article 6 when violations are detected
or for regular inspections A Party may also inspect a ship to which the present Convention applies
when it enters the ports or off-shore terminals under its jurisdiction if a request for an investigation is
received from any Party together with sufficient evidence that the ship has discharged harmful
substances or effluents containing such substances in any place
Role of Port States
Under ldquoPort State Controlrdquo arrangements Port States also have the authority to conduct vessel surveys
on ships which visit their ports and to detain those ships that fall below MARPOL requirements In
relation to MARPOL Annex VI chapter 4 any port state inspection shall be limited to verifying when
appropriate that there is a valid International Energy Efficiency Certificate on board10
Cooperation between Port and Flag States
Under MARPOL parties are required to co-operate in detecting vessel violations and are required to
use all practical measures to detect and monitor violations If a State has evidence of a violation they
are obligated to forward this evidence to the vesselrsquos Flag State
All ships flagged under countries that are signatories to MARPOL are subject to its requirements
regardless of where they sail and member nations are responsible for vessels registered under their
respective nationalities
When incidents occur outside the countrys jurisdiction or jurisdiction cannot be determined the
country refers cases to Flag States in accordance with MARPOL Some States are not happy with the
lack of response from Flag States United States experience of Flag States not responding has led to
new policy which would take direct enforcement action against vessels for MARPOL V violations
occurring between 3 and 200 nautical miles from the United States rather than referring such violations
to the flag states (Dillingham 2000)
Ship owners and charterers
A ship owner is the owner of a commercial ship A ship owner is someone who equips and exploits a
ship usually for delivering cargo at a certain freight rate The ship owner determines the specifications
of the ship and its energy efficiency measures but the benefits of low fuel consumption are not always
theirs when the ship is chartered to someone else
Depending on the type of ship and the type of charter normally a standard contract form called a
charter party is used to record the exact rate duration and terms agreed between the ship owner and
the charterer
10 MARPOL Annex VI Regulation 10
TRANL15371 7
A charterer may be a party without a cargo who takes a vessel on charter for a specified period from
the owner and then trades the ship to carry cargoes at a profit above the hire rate In some cases a
charterer may own cargo and employ a shipbroker to find a ship to deliver the cargo for a certain price
Two main types of charter can be distinguished time charter and voyage charter In a voyage charter
the owner is still responsible for the port fuel and crew costs In a time charter the charterer selects
the ports and directs the vessel where to go The charterer pays for all fuel the vessel consumes port
charges commissions and a daily hire to the owner of the vessel
When there are too few opportunities to share investment with charterers this leads to a split incentive
a ship owner may invest the up-front capital to put in energy-efficient technology but doesnrsquot then
recoup the costs from fuel savings as they charter their ships out as this goes to the charterers This
problem is particularly apparent for short-term time charters11
Conclusions
Regarding energy efficiency the work of the AHEWG-TT12 has shown that the main shipbuilding nations
all have access to the necessary technologies provided there is demand for them It has also been
noted that there is no need for transfers of intellectual property rights13
One of the major barriers to the effective implementation of the EEDI and the SEEMP is the heavy
reliance it places on Flag States for inspection of vessels and enforcement of provisions During the
1970rsquos ships were being reflagged from high tax and high regulation countries such as the United
States and the United Kingdom to countries offering Flags of Convenience (lsquoFOCrsquo) Under FOCs ship-
owners pay less tax to the relevant Flag State and are able to evade the majority of the environmental
and construction standards set out under MARPOL (Leddy 2012) The main reason for that is that
several Flag States are not signatories to all MARPOL Annexes (eg as of 20142015 the Bahamian
Bolivian Cambodian North Korean Georgian Honduran Lebanese and Sri Lankan flags of
convenience had not ratified all MARPOL treaty annexes III-VI14 15)
Many FOCs are developing nations that do not have the resources to enforce investigate or prosecute
breaches by their flagged vessels (Aqorau 2000) As of 2014 55 of merchant ships are flagged by
FOC and 40 of ships are flagged by FOCdeveloping countries MARPOL only provides guidelines for
Flag States to follow when surveying vessels under regulation 6 but none of these guidelines are
mandatory Conversely Port States which are developed are better equipped to bear the cost of
inspection investigation enforcement and prosecution costs However in relation to EEDI and the
11 httpssi2040orgwhat-we-dowork-streamsfinance 12 MEPC 6831 Progress report of the Ad Hoc Expert Working Group on Facilitation of Transfer of Technology for Ships 13 Submission of the United States on Task 3 of the Ad Hoc Expert Working Group on Facilitation of Transfer of Technology for Ships Jan
2015 14 wwwics-shippingorgdocsflag-state-performance-table 15 httpwwwimoorgAboutConventionsStatusOfConventionsPagesDefaultaspx status of conventions
TRANL15371 8
SEEMP port state control is limited to verifying when appropriate that there is a valid International
Energy Efficiency Certificate on board
We therefore conclude that there needs to be a focus on enabling Flag States and Port States that lack
the resourcescapacity to enforce the EEDI and the SEEMP in order to further stimulate the adoption
of energy efficiency technologies Also attention should be paid to overcoming the barrier of split
incentives ie where the benefits of energy efficiency measures are not transferred from the charterer
to the investor (owner)
TRANL15371 9
3 Energy Efficiency Measures for Ships
In order to understand the important energy efficiency measures that can help improve energy
efficiency from shipping it is interesting to see the split between new-built ships and existing fleet In
2012 some 3655 merchant ships were delivered worldwide about 6 of the worldrsquos merchant fleet
of about 60000 The average age of the merchant fleet is 19 years Therefore measures for both new
ships and retrofits for old ships are important for improving the energy efficiency in the next decades
If only the new ships would be targeted only 50 of the fleet would be more efficient in the next
decades while there are many retrofit measures available The total fleet can be broken down to about
4000 passenger ships just under 14000 tankers and about 37000 dry cargo ships including about
5000 container ships (Statista 2015)
In order to identify the most interesting energy efficiency measures for ships we used the information
from several reports to develop a long-list Many measures improve the efficiency in the order of up to
5 Here we would like to focus on measures that result in high savings that can be applied to many
ship types and preferably also to existing ships The resulting short-list is presented in the next table
We used the main categories identified by AHEWG-TT for structuring the measures
The main categories defined by AHEWG-TT are
1 Hull
2 Main Engine
3 Auxiliary engines
4 Propellers and rudders and
5 Control systems
Since the auxiliary engines typically consume only a fraction of the energy that goes to the main
engines their energy efficiency measure results do not show in the short-list below The measures are
worked out in more detail in the paragraphs below The main engine and auxiliary engine improvements
are covered in the same paragraph
The common rail upgrade is a simple measure that can be easily applied to all ships even when the
ship is not in the dry-dock The details are available in the paragraph about engines
From the list it is clear that conventional technology is available to achieve high efficiency gains If the
maximum gain per category is added up (for all but ferry and cruise) this would mean a total efficiency
improvement of 35 even without taking two experimental technologies with potentially high efficiency
gains into account (wind power and air lubrication) Note that some technologies are not applicable to
all ships
In order to find possible financial barriers the investments are rated from ldquovery lowrdquo to ldquohighrdquo relatively
to the size of the ships The same measure on a larger ship is obviously more expensive
TRANL15371 1
Table 1 Inventoryranking of energy efficiency measures
Main category
Measure Estimated efficiency (range)
Efficiency at average circumstances
Ease of installation
Payback time
Investment Implementation References
Hull Bow optimisation
25-20 10 all ship types
short (lt3 years)
Medium conventional technology
(IMO 2009 IMO 2011 Crist 2009 Hochkirch und Bertram not dated)
Main Engines
Wind power 5-44 20 only special ship types
long (gt15 years)
High experimental technology
(IMO 2011 IMO 2009 Crist 2009 ICCT 2011 Brannigan et al 2009 Allenstroumlm 2013)
Propellers and Rudders
Ducted propeller
1-20 10
all ship types except ferry and cruises
medium (4-15 years)
Medium conventional technology
(IMO 2011 IMO 2009 Crist 2009 ICCT 2011)
Propellers and Rudders
Contra-rotating propellers
6-20 13 only special ship types
long (gt15 years)
High conventional technology
(IMO 2011 IMO 2009 Crist 2009 WAumlRTSILAuml 2009 Shuto 2010)
Propellers and Rudders
Wheels 10 10
all ship types except ferry and cruises
short (lt3 years)
Medium conventional technology
(IMO 2009 Schneekluth und Bertram 1998 Brannigan et al 2009)
Control Systems
Waste heat recovery
6-10 8 new build only
medium (4-15 years)
Medium conventional technology
(IMO 2011 IMO 2009 Crist 2009 WAumlRTSILAuml 2007 ICCT 2011)
Propellers and Rudders
Rudder bulb 2-5 4
all ship types except ferry and cruises
medium (4-15 years)
Low conventional technology
(IMO 2011 IMO 2009 Nielsen et al not dated Crist 2009 ICCT 2011)
Propellers and Rudders
Post swirl fins
2-5 4
all ship types except ferry and cruises
short (lt3 years)
Low conventional technology
(IMO 2009 MOL 2011 Hansen Dinham-
Peren und Nojiri 2011 Nielsen et al not
dated)
Hull Hull coating 1-9 5 all ship types
short (lt3 years)
Low conventional technology
(IMO 2011 IMO 2009 ICCT 2011 Voorham 2013 Crist 2009)
Hull Air lubrication
5-15 9 new build only
medium (4-15 years)
Medium experimental technology
(IMO 2011 IMO 2009 Crist 2009 DK Group 2015 CNSS 2015 ICCT 2011)
Propellers and Rudders
Twisted rudder
2-4 3
all ship types except ferry and cruises
medium (4-15 years)
Low conventional technology
(IMO 2009 Schulze 2007 Nakashima 2015 Becker Marine System 2015 Nielsen et al not dated Hollenbach und Friesch not dated Rolls-Royce 2014)
Main Engines
Main engine de-rating
2-4 3
all ship types except ferry and cruises
medium (4-15 years)
Low conventional technology
(IMO 2011 IMO 2009 Crist 2009 Wettstein und Brown 2008 DNV GL 2015)
Auxiliary engines
Common rail upgrade
- - all ship types
medium (4-15 years)
Very Low conventional technology
(DNV GL 2015) (ICCT 2011) (IMO 2009)
Main Engines
Common rail upgrade
01-05-
03 all ship types
medium (4-15 years)
Very low conventional technology
(IMO 2009 Pakarinen 2007 ICCT 2011 Crist 2009)
TRANL15371 2
Hull and superstructure
In general the optimisation of hull and superstructure focuses on minimising the resistance by reducing
the wave resistance and friction between water and hull It is important to recognise which type of
vessel is to be optimised The reduced frictional resistance increases energy performance of the vessel
particularly at low speeds Operability and performances of the ship must be considered in detail The
improvements measures are generally applied at new-built ships but also applicable to retrofitting
Bow optimisation
The different bow optimisations can improve the water flow around the hull and reduce the wave-added
resistance for large vessels with high block coefficient operating within commercial speed ranges The
average energy reduction potential ranges from 25-20 on average 10 (Crist 2009 IMO 2011
Voorham 2013)
Figure 3 Left The green line characterises the ordinary bow wave of the hull The blue line characterises the wave
formed by the bulb The red line is the sum of these two The altitude of the bow wave is noticeably reduced which
reduces the hull drag associated with the bow wave This improves fuel economy and increases range (Selenetrawlers
2015) Right Ordinary bulbous bow leadge bow and ax-bow shape (JSEA 2006)
The below-the-waterline extension of the bulbous bow (Figure 3) modifies the way the water flows
around the hull reducing drag and thus increasing speed range fuel efficiency and stability An altered
design is the ax-bow (Figure 3) The narrow designed bow slashes through the water in order to reduce
slamming and reduces the size of bow generated wave The propeller can act more efficient due to the
absence of slamming The ax-bow allows the ship to steer well to maintain speed and the engine to
save fuel (Crist 2009 IMO 2009) If the bulbous bow is modified during a regular docking period the
investment is estimated to have short payback of about 1-3 years It is most promising for container
vessels (DNV GL 2015 Hochkirch und Bertram not dated)
Barriers The bow optimisation (as retrofit) needs to be done in the dry dock Dry-docking is not
regularly happening for existing ships because it means that the ship cannot operate and economic
losses are suspected Another obstacle might arise due to restricted access to the original contractual
hull plans since shipyards are not always keen to provide detailed plans on their vessels to prevent
TRANL15371 3
imitation (Hochkirch und Bertram not dated DNV GL 2015) A major obstacle is the split incentive
between ship owner and operator Ship owners are responsible for investing in these technologies and
ship operators are those who pay for the fuel consumption and benefit from such technologies (ICCT
2011)
Technical maturity The technique is available on the market and is effective Only conventional
material is needed and redesign can be done in a few weeks16
Applicability Applicable to all ship types but most efficient for ships with a high block coefficient like
tankers and bulk carriers since the reduction of the wave-added resistance is most impacting (IMO
2009)
Hull coating
Hull coatings (Figure 4) can lower frictional resistance and limit fouling by aquatic organisms It can
save between 1-9 fuel consumption on average 5 (ICCT 2011 Voorham 2013 Crist 2009)
Figure 4 Example of hull coating (ECOSPEED 2015)
One way of lowering the frictional resistance is to improve the smoothness of a hull by means of
coatings that reduce fouling The costs are lifetime cost reduction and have to be recur every five years
to be able to gain the fuel benefit
Barriers A new application is typically necessary during each dry-docking The self-polishing coating
must be renewed after a 3-5 years period (IMO 2009) A major obstacle is the divided interest between
ship owner and operator Ship owners are in charge for investing in these technologies and ship
operators are those who pay for the fuel consumption and profit from such technologies (ICCT 2011)
Technical maturity Coating techniques are available on the market and roughly 5 of newly painted
ships are painted with one of the advanced coating systems presently available (IMO 2011 ICCT 2011)
The payback time is short (ICCT 2011) or 0-2 years according to others17
Applicability The technology is applicable to all vessels
Air lubrication
The air lubrication technique creates a layer of bubbles underneath an already streamlined hull in order
to further reduce friction An automation system regulates the compressorsblowers depending on
16 httpwwwship-efficiencyorgonTEAMpdf14-Ship20efficiency20seminar20-20CMA20CGM-
20HydrOcean20120CMA20pdf 17 httpswwwdnvglcommaritimeenergy-efficiencyefficiency-finderhtml
TRANL15371 4
speed The blower keeps holes filled with air and required pressure A thin layer of bubbles trailing
behind of each cavity merge into single large ldquoair layerrdquo for the whole flat bottom part of the hull and
reduces the friction (Figure 5) Depending on the ship type the estimate fuel efficiency ranges between
5-15 (on average 9) where tankers and bulkers can reduce more (10-15 on average 125) in
comparison to container vessels (5-9 on average 7) (IMO 2009 DK Group 2015 CNSS 2015 ICCT
2011 Voorham 2013)18
Figure 5 Schematic view of air lubrication (DK Group 2015)
Barriers Large capital investment requirements with split incentive The vessel owners are
accountable for investing in these technologies whereas vessel operators recompense for the fuel
consumption and benefit from such technologies (ICCT 2011)
Technical maturity The technology is available on the market but still in a pilot phase Sea trials
have been performed with small demonstration ships There are no vessels operating commercially
that currently use this technique Specifications about the payback time vary from short to medium
(Silberschmidt 2014 Skinner 2009)
Applicability The original technology would be likely be applied to new-built ships with at least a
partly flat bottom and a minimum length of 225 metres since the compressor may have technical
problems maintaining air cavities for deep draft ships (IMO 2011 CNSS 2015) Air lubrication can be
used for retrofitting as well (CNSS 2015)
Engines
Speed reductions on existing vessels provide opportunities for engine optimisation on low power
(321) Similar measures as de-rating for the main engines that could be implemented are cylinder
cut-out and new torsional vibration calculation (IMO 2009)
18 It has to be noted that the extra fuel use caused by the system itself should also be taken into account
TRANL15371 5
Another propulsion supportive measure with a high potential measure is wind power This is also
explained in more detail below In order to also provide a measure with a lower improvement potential
per ship but simple and applicable to all ships we describe the common rail system for fuel injection
Main engine de-rating
Slow steaming vessels are known as one of the most effective energy saving measure The potential
comes mainly from the operational behaviour side From the technical side the specific fuel oil
consumption will decline when a ship is no longer operated at its design speed
The design speed can be reduced by de-rating the main engine (IMO 2011 IMO 2009) Reduction of
power combined with injection timing advanced to restore peak combustion pressure can achieve a
certain gain in shaft efficiency Fuel efficiency can be improved by 2-4 when de-rating is performed
for loads lower than the maximum design load (Wettstein und Brown 2008 Crist 2009) on average
3 energy efficiency potential (Crist 2009) Operational costs would be lower mainly due to fuel
savings (DNV GL 2015 Crist 2009 Wettstein und Brown 2008)
Barriers A slower vessel will have lower incomes as it is not capable to perform as much transport
load per unit of time as a faster vessel De-rating the engine is usually done when it is clear that the
ship will become a slower steaming ship There is a split incentive between vessel owners who are
responsible for investing in these technologies and vessel operators who are those who compensate
for the fuel consumption and benefit from such technologies (ICCT 2011)
Technical maturity This technique has been proven as successful particularly on older engines
which are normally built with a low compression ratio and thereby have a significant potential to
improve their efficiency (IMO 2009) De-rating measures have a low to medium payback time (Crist
2009 DNV GL 2015)
Applicability The technologies are available on the market It is applicable to all vessels (DNV GL
2015)
Common-rail upgrade (common-rail fuel injection)
Engines with common-rail fuel injection handle low-load working modes much better (IMO 2009) A
common-rail fuel injection is technique of injecting fuel into an engine cylinder under total control and
thereby achieving optimal combustion Common-rail allows the start and duration of injection
independent of the position of the pistons in that way permitting an operationally optimised injection
per stroke In a normal diesel engine fuel is injected at a static rate by a pump and common practice
is to optimise this pump to run at an optimal setting for the ideal injection time (Pakarinen 2007) The
energy efficiency potential is estimated between 01-05 on average 03 (ICCT 2011 IMO 2009)
Barriers Additional electronics can also introduce possibilities for failures However recent
advancements have increased the systems popularity19 There is a split incentive between vessel
19 httpwwwmarineinsightcommarinean-overview-of-common-rail-system-in-marine-engines
TRANL15371 6
owners who are responsible for investing in these technologies and vessel operators who are those
who compensate for the fuel consumption and benefit from such technologies (ICCT 2011)
Technical maturity This measure is available on the market (ICCT 2011) Payback time is short to
medium with an average of 5 years (IMO 2009 Crist 2009)
Applicability This measure is applicable to new and retrofit vessels It is applicable for tanker- bulk-
container- and Roro-ships (Crist 2009)
Auxiliary engines and systems
Based on our own estimation auxiliary engines improvement are not bringing gt2-4 energy savings
because auxiliary engines consume much less fuel than the main engine Similar measures as de-rating
for the main engines and common rail upgrade could be implemented for the auxiliary engine
Other options for improving auxiliary systems are speed control of pumps and fans control strategies
of cooling water systems room ventilation redesign of piping and instruments advanced computation
of airgas temperature distribution with reduced storage ventilation and with optimised ventilation
systems (DNV GL 2015)
Barriers There is a split incentive between vessel owners who are responsible for investing in these
technologies and vessel operators who are those who compensate for the fuel consumption and benefit
from such technologies (ICCT 2011)
Technical maturity This measure is available on the market (ICCT 2011) It is easy to apply and
uncomplicated in maintenance (DNV GL 2015) Payback time is short (DNV GL 2015)
Applicability This measure is applicable to all new and retrofit types of ships (DNV GL 2015)
Wind power
Wind power measures are available that can develop enough thrust to provide at least some supportive
propulsion Wind power can be utilised in various ways in shipping like traditional sails solid wing sails
Flettner-rotor and kits (see Figure 6) The techniques are currently used as supplementary power
(Brannigan et al 2009)
Figure 6 from left to right Kite (Cargill 2011) Flettner rotor (MIWB 2015) and solid sails (Wind Chellenger Project
HP 2015)
Solid wing sails are structured similar to aircraft wings which offer more thrust with less drag than
conventional sails Flettner rotors produce thrust from a rotating object in wind using the so-called
TRANL15371 7
Magnus effect The techniques have different characteristics with regards to how the thrust that is
produced relates to other factors such as wind strength wind angle wind stability and ship speed
(IMO 2009)
Towing kites vary from other concepts of wind power by having a small footprint during installation and
therefore being quite feasible to retrofit (Allenstroumlm 2013) Studies conducted at the Technical
University of Berlin indicated that the potential for sail energy has different prospective in the different
regions in the world Best scenarios exist in North Atlantic and North Pacific regions the South Pacific
seems a bit less potential The studies have shown that under normal circumstances the typical savings
using wind power may be 5 at 15 knots and up to 20 at 10 knots This study also revealed that
with optimal weather routing in the North Atlantic and given the best vessel with best sail type savings
can reach 15 percent at 15 knots and 44 at 10 knots (IMO 2009 Crist 2009) Nevertheless the
above figures should be considered indicative since practical experiences are limited Sail- and kite-
assisted power does seem to be a potential opportunity saving energy in the medium- and long-term
picture for shipping (IMO 2009) Christ estimates and average energy saving potential around 20
(2009)
Barriers There is a split incentive between vessel owners who are responsible for investing in these
technologies and vessel operators who are those who compensate for the fuel consumption and benefit
from such technologies (ICCT 2011) Although this technology can bring high energy savings the
investment is so high that there is not a short payback time
For solid wing sails complications could result in a need for masts to run down to the keel which can
be a bigger issue for retrofitting Additionally the presence of the mast and rigging could have significant
impacts on cargo handling (IMO 2009) Downside of the kite systems include the complex launch
recovery and control systems that are needed (IMO 2009)
Technical maturity This is still considered as experimental technology The technical barriers
identified above need to be tackled for this measure to be applied widely in the future Payback time is
estimated to be medium to long term (Allenstroumlm 2013 Crist 2009)
Applicability Wind power technologies are available and a number of cargo ships have been equipped
with wind engines to reduce demands from diesel engines (ICCT 2011) Kites can be used on ships
with a minimum length of 30m and works most energy efficient on ships with a typical speed not faster
than 16 knots Preferably tankers (crude oil product chemical LPG LNG other) and bulk carriers are
being considered as potential users due to this speed restriction (IMO 2011)
Control Systems Waste heat recovery
Waste heat recovery (WHR) technology can pass exhaust gases from a vessels engines through a heat
exchanger to generate steam for a turbine-driven generator The heat energy from the exhaust gas is
taken and transformed into electrical energy to reduce direct engine-fuel consumption for the
propulsion system or reduce auxiliary engine needs (ICCT 2011) Energy saving potential is estimated
between 6-10 on average 8 (Crist 2009 ICCT 2011)
TRANL15371 8
Figure 7 Efficiency of waste heat recover systems Sankey diagramme Even with high 50 efficiency of modern low-
speed engines there is still 50 of fuel input energy not being put to productive use The possibilities are illustrated
by this comparison of Sankey diagrammes for Waumlrtsilauml 12RT-flex96C engines without heat recovery (left) and with
high-efficiency waste heat recovery plant (right) showing in this case 114 gain in overall efficiency with WHR
(waste heat recovery) (WAumlRTSILAuml 2007)
Barriers Large capital investment requirements (around $5-6 million for a large container ship20) and
split incentive between ship owners and ship operators (ICCT 2011)
Technical maturity The technology is available on the market and has medium to long payback time
(WAumlRTSILAuml 2007 Crist 2009)
Applicability A WHR system is applied to vessels with a high production of waste heat and a high
intake of electricity WHR can be employed on ships with main engine average performance is higher
than 20000 kW and auxiliary engine average performance higher than 1000 kW This size
requirements limit the number of ships using this technology (IMO 2011) Generally it is applicable to
all ships types new and retrofit (Crist 2009)
Propellers and Rudders
Numerous devices have been designed for improving the energy consumption of vessels by recovering
as much as possible of this rotational energy in the flow from the propeller or to provide some pre-or
post-rotation of the in flow into and after the propeller to ensure best efficiency The most important
of these will be discussed in the following paragraphs (IMO 2009)
Ducted propeller (Kort Nozzle)
The accelerating ducted propeller consists of a screw propeller surrounded by a non-rotating duct
(nozzle) (Figure 8) Compared to the conventional propeller of the same diameter and thrust this
20 httpgcaptaincompower-exhaust-gas-paybacks-waste
TRANL15371 9
arrangement allows an increase inflow to the propeller improving the operating conditions around the
propeller and the ideal efficiency
Figure 8 Right photos of this Norwegian trawler (SetSail 2009)
The duct creates additional thrust load The potential for energy savings on relevant vessels range
between 1ndash20 (Crist 2009 IMO 2011 Barringhaus und Olds 1999 IMO 2009) whereupon 10 is a
good average value (IMO 2009 Crist 2009) The improvement of the combination of propeller and duct
overweigh negative effect of the increase water resistance caused by the duct
Barriers Since the duct has an optimal operational speed it does not work efficient at all speeds For
instance as drag increases with increasing speed eventually this will become larger than the added
thrust Therefore at high speeds ducts are typically not used (IMO 2009) The split incentive is a barrier
between ship owners (investor) and ship operators (gainer) as explained earlier (ICCT 2011)
Technical maturity Several standard designs are available on the market (IMO 2011) with a medium
payback time (IMO 2011)
Applicability Ducted propellers suits for vessels operating at high propeller loadings such as tankers
bulk carriers especially tugs and some offshore service ships The duct leads to increased friction but
at higher propeller loadings this is more than rewarded for by the positive effect of the combination of
propeller and duct (IMO 2009)
Contra-rotating propellers (CRP)
A rotating propeller induces a rotating motion in its backwash Normally this rotation energy of the
propeller gets lost The contra-rotating propeller is used in order to recover part of this energy (Figure
9) In a contra-rotating configuration two propellers are facing each other rotating in the opposite
direction with the aft propeller recuperating the turning energy in the wake from the forward propeller
(IMO 2011) To avoid complications with cavitation the aft propeller usually has a smaller diameter
than the front propeller Contra-rotating propeller arrangements involve a short shaft line and for that
reason primarily suitable for vessels with single-screw
TRANL15371 10
Figure 9 Left conventional propeller Right contra-rotating propeller The working principle is simple and effective
the power is split in a forward and aft propeller which through the different direction of rotation cancel out the
rotational energy losses behind the propeller (WAumlRTSILAuml 2009)
Potential savings of such measures are assessed to be in the order of 6ndash20 of the power consumption
with an average of 13 although higher figures may be presented by industry for specific cases Two
different full-scale measurements reported gains of 15 and 16 (IMO 2009 Crist 2009)
Barriers The mechanical installation of contra-rotating shafts is complicated and requires more
maintenance (IMO 2011) The split incentive between ship owners (investor) and ship operators
(gainer) is a barrier as explained above Although this technology can bring high energy savings the
investment is so high that there is not a short payback time
Technical maturity The technique is available on the market but problems with gearboxes for
contra-rotating propellers have been reported as well as operational problems with mounting (IMO
2009 IMO 2011) Payback time is reported as short (WAumlRTSILAuml 2009) but also as medium-long with
about ~15-20 years (Shuto 2010)
Applicability The technology is particularly beneficial for rather heavily loaded propellers as for
example very fast cargo vessels like Ro-Ro ships or for container ships (IMO 2011 Crist 2009) Contra-
rotating propellers need a short shaft line and hence mainly suited to single-screw ships (IMO 2011)
Contra-rotating propellers can be implemented as retrofit but it is more likely implemented in new
built ships due to the complicated mechanical installation (Crist 2009)
Post swirl devises
A number of different techniques belong to the post swirl category Several of them contain
modifications to the rudder or propeller (IMO 2009) Depending on vessel type and operational field
various power saving measures can be mounted to optimise water velocity distribution to the propeller
and to minimise slipstream losses due to swirl in the outflow of a propeller The most important among
these measures may be additional thrusting fins at the rudder twisted rudder (Figure 12) rudder-
bulb-systems with fins (Figure 13) and fins on the propeller fairwater also called post swirl fins or
boss cap fins (Figure 10)
Generally post swirl measures reported 1-8 energy efficiency (test models) Even 8-9 energy
efficiency from full-scale measurements for additional thrusting fins at the rudder Payback time is
estimated to be short to medium post swirl devices (DNV GL 2015 Crist 2009 ICCT 2011) Some of
CRP FOR BETTER PROPULSION EFFICIENCY
CONVENTIONAL PROPULSION
TRANL15371 11
the post swirl measure can be combined A good overview is given in Nielsen et al (Combined Kappel
propeller and rudder bulb system for improved propulsion efficiency not dated)
3431 Post swirl fins
The post swirl fins (Figure 10) can recover energy loss of propeller hub vortex in the propeller backward
flow and can lead to 3-5 energy saving on average 4 operating at the same speed (MOL 2011
Barringhaus und Olds 1999 Hansen Dinham-Peren und Nojiri 2011 ICCT 2011)
Figure 10 Example the post swirl fins or propeller boss cap fins (gcaptain 2012)
Barriers It is simple and straightforward measure requiring only the removal of the propeller boss
caps and replacement with the post swirl fins (no hull modification is needed) (Hansen Dinham-Peren
und Nojiri 2011 MOL 2011) However there is a split incentive between ship owners (investor) and
ship operators (gainer) as explained above
Technical maturity The technique is available on the market In 2013 post swirl fins were applied
to over 2500 ships worldwide (MOL 2011) Further advantages of the post swirl fins are reduction in
propeller torque reduced vibration in the stern and less underwater noise and reduced rudder erosion
(MOL 2011) A payback time of 6 months was estimated for 4 efficiency improvement at $600tonne
oil price (Hansen Dinham-Peren und Nojiri 2011) The investment is considered to be low21
Applicability The technique is effective for all screw propellers irrespective of the type or hull form
of the ship Has been tested on large-scale container vessels (MOL 2011 Hansen Dinham-Peren und
Nojiri 2011)
3432 Free rotating wheels
A vane wheel (Grim wheel) is a freely spinning propeller mounted behind the main smaller propeller
(see Figure 11 for example of use on retrofit Queen Elisabeth II in 1986) The vane wheel has a bigger
diameter than the main propeller and increases the propeller diameter The small propeller drives the
freely revolving vane wheel fitted on the wake The inner part of the vane wheel acts as a turbine and
the outer part as an ldquoadditionalrdquo propeller
21 httpgcaptaincompropeller-technology-ship-efficient
TRANL15371 12
Figure 11 Example for a grim vane wheel (Boat design 2007)
This leads to a substantial recovery of the rotational energy The energy saving potential is reported to
be 10 (Brannigan et al 2009) It is stated that the important benefit of the vane wheel is that a
smaller impulsion propeller can be installed which consumes less energy The vane wheel gives a
suitable energy improvement for cargo ships (IMO 2009 Schneekluth und Bertram 1998) and has short
payback time It is also stated that if there is room for a vane wheel in the aft there is also space for
an impulsion propeller of larger diameter leading about the same energy saving potential as the
combination of a small impulsion propeller and a vane wheel (IMO 2009)
Barriers A barrier is the split incentive between vessel owners who are responsible for investing in
these technologies and vessel operators who are those who compensate for the fuel consumption and
benefit from such technologies
Technical maturity Limited application Vane wheels are subjected to strong fluctuations in loading
Problems with the strength of the blades have been encountered frequently (for example the vane
wheels on the Queen Elisabeth II were short lived and not used after22)The payback time is estimated
to be short
Applicability The technique is effective for all screw propellers irrespective of the type or hull form
of the ship both for new and existing ships (Chen Reed und Kim 1989) Recommended for all ship
types except ferry and cruises because of their problem with strong fluctuations in loading as
mentioned above23 (IMO 2009)
3433 Twisted rudder
Rudders can play a significant role of extra frictional resistance Rudders are located in the backwash
of a propeller and rotational energy will act on the rudder Because of these effects the rudder gives
prospects of efficiency gains (Schulze 2007)
22 httpwwwroblightbodycomlinersqe-21987_Refitindexhtm 23 httpwwwroblightbodycomlinersqe-21987_Refitindexhtm
TRANL15371 13
Figure 12 Schematic capture of twisted rudder (Nakashima 2015)
Twisted leading edge technology provides multiple benefits for high-speed vessels compared to
conventional rudder designs Conventional rudders are located behind the propeller with the rudder
profile arranged symmetrically about the vertical rudder centre plane This arrangement does not
consider the fact that the propeller induces a strong rotational flow that strikes on the rudder blade
This consequences in areas of low force on the blade that induce cavitation and associated erosion
problems (Becker Marine System 2015 Schulze 2007)
The twisted rudder is horizontally twisted on the lower and upper side of the segment that is an
extension of the propeller shaft (Figure 12) This decreases cavitation rudder and improves
manoeuvrability of the vessel (Schulze 2007) Twisted rudder types lead to energy efficiency
improvements by approximately 2-4 on average 3 for large-size high-speed vessels (Hollenbach
und Friesch not dated Nakashima 2015)
Barriers Work needs to be done in the dry dock this is not regularly happening for existing ships
(Hochkirch und Bertram not dated) There is a split incentive between vessel owners who are
responsible for investing in these technologies and vessel operators who are those who compensate
for the fuel consumption and benefit from such technologies (ICCT 2011)
Technical maturity This rudder type is a commercially used technology and easy to apply if the ship
is in the dry dock (ICCT 2011)The payback time is estimated to be short to medium (Rolls-Royce 2014
Crist 2009)
Applicability Twisted rudder can used by container vessels reefers Ro-Pax ferries cruise ships and
naval vessels In South Korea this type of rudder is recognised as a standard rudder for large-size
high-speed container carriers (Nakashima 2015)
TRANL15371 14
3434 Rudder bulb
Figure 13 Example for a rudder bulb Kawasaki RBS-F rudder bulb systems with fins (Kawasaki 2015)
The rudder bulb brings smooth inflows from the propeller and can reduce the drag of the rudder The
rudder fins produce thrusts in the rotational flows generated by the propeller (Figure 13) Rudder bulb
measure can improve energy efficiency by 2-5 (Nielsen et al not dated Becker Marine System not
dated) on average 4 (Crist 2009)
Barriers The work needs to be done in the dry dock this is not regularly happening for existing ships
There is a split incentive between vessel owners who are responsible for investing in these technologies
and vessel operators who are those who compensate for the fuel consumption and benefit from such
technologies (ICCT 2011)
Technical maturity The technology is a commercially used technology and easy to apply while the
ship is in the dry dock (Kawasaki 2015) Payback time is estimated to be medium (Crist 2009)
Applicability For new and retrofit tanker- bulk- container- and Roro-ships with a propeller and
rudder (Crist 2009)
TRANL15371 15
Barriers to the transfer and uptake of energy
efficiency technologies for ships and possible
measures to overcome them
Although there are ways to reduce emissions (Chapter 3) and also drivers working towards the
implementation of such measures there are significant barriers to acting on cost-effective opportunities
in the maritime industry This is often referred to as barriers to energy or the energy efficiency gap
(Michele Acciaro 2013) (Sepideh Jafarzadeh 2014) (OECD 2014) Some barriers are shared with other
industries while others are unique to the maritime industry Furthermore many of these barriers are
not specific to the EEDI and the SEEMP but apply to any rule under MARPOL These barriers can exist
on both the supply and the demand side For example there could be barriers to the development and
implementation of measures that reduce CO2 emissions from ships and barriers to the expression of
demand for these measures (ECORYS 2012) Studies have however shown that there are relatively
few barriers related to the development of new technologies or access to related intellectual property
rights by the main shipbuilding nations and that the supply of measures exceeds the demand (ECORYS
2012) Existing studies on barriers to energy efficiency thus focus on what prevents the uptake of
available measures
This section presents an overview of the main barriers to the transfer and uptake of energy efficiency
technologies in the shipping industry and discusses potential ways of overcoming them
Preliminary assessments of technology transfer and financial needs by both workshop participants and
the IMO Ad Hoc Expert Working Group on Facilitation of Transfer of Technology for Ships (AHEWG-TT)
have suggested that the type of assistance needed by Port State and Flag State administrations will be
of a different nature than that required by shipbuilders and owners Our assessment above has shown
that the shipbuilding industry is expected to need less assistance than Port States and Flag States
In the next table we list a summary of the main barriers and the stakeholders concerned in the main
categories as identified by AHEWG-TT as well as the possible measures that could help overcome these
barriers The possible measures to overcome the barriers are further detailed in the sections below
Related costs are estimated in a separate section in order to minimise overlap
TRANL15371 16
Table 2 Summary of main barriers relevant stakeholders and possible measures to overcome them
Barrier Stakeholders Measures forward
Lack of awareness
(administrative and industry)
a MARPOL in general MARPOL Annex
VI EEDI and SEEMP in particular
b Available energy efficiency
technologies
Flag and Port
States
Ship owners
Capacity building
- Workshops
- Trainings
Model course for training
Inventory
Platform for information access and
sharing
Agreements between industry and
administrations
Technology concerns
a Lack of or limited technology supply
chain in some states
b Lack of technology base for RampD in
some states
c Lack of trust (in ability to reduce
emissions in ability to reduce
operational costs in compatibility
with other measures)
Ship owners
Investors
Increase cooperation in ship design
and building
Increased interaction between
industry and educationalRampD
institutes
Establish platform to share
expertiseexperience
Provide special investment or
guarantee funds
Institutional concerns
a Increased administrative burden
1Revision and amendment of existing legislation
2Implement Port and Flag State obligations
b Limited technical capacity in state institutions to implement
c Lack of financial resources for additional compliance and enforcement activities by maritime administrations
Flag States
Port States
Promote increased cooperation and
communication between
administrationswithin regional
administrations
Regional information workshops for
Port and Flag States
Establish platform to share regulatory
experience
Development aid
Commercial
a Increased costs for ship owners to
take up energy efficient technologies
b Lack of motivation of owners to take
up energy efficient technologies (split
incentive)
Ship owners
Financiers
Special EE funds
Smart contracts
TRANL15371 17
Awareness Raising
Barriers Lack of Awareness
The need to create awareness among Flag States Port States and ship owners of the requirements of
Annex VI in general and Chapter 4 in particular was highlighted by participants of the workshop and
emphasised by the AHEWG-TT The level of awareness in the various regions and even in the countries
within the regions differed considerably The AHEWG-TT further suggests it would be beneficial to
undertake an initial evaluation of knowledge needs (gap analysis) in order to ensure workshops and
other awareness-raising activities are appropriately tailored24
Furthermore ship-owners are not always aware of the energy efficiency technologies available on the
market or which operational measures can be implemented to save fuel Ship owners can be companies
people and investment funds Especially private equity groups tend to focus more on short term looking
for quick profit while traditional ship owners tend to hold the ship for at least 20 years25
Measures forward
Though Flag States and Port States should already have implemented measures to ensure that Energy
Efficiency Design Index (EEDI) and Ship Energy Efficiency Management Plan (SEEMP) requirements are
complied with both public administrations and industry representatives could benefit from additional
trainingcapacity building and platforms to share experiencesreceive information with regards the
practicalities of these regulations and available energy efficiency technologies The needs for each
group can be determined through a gap-analysis which we recommend to be carried out by an
independent consultant in cooperation with the flag and port states Once the specific needs for each
group have been determined they can be addressed through the following awareness raising
measures
Capacity Building (workshops trainings)
Workshopstrainings could be organised where formal training is combined with open discussions where
experiences could be shared just within one stakeholder group or between educational institutes
auditors operational managers of ships shipbuilders and authorities Such trainingsworkshops could
focus on just one or all aspects relating to the applicable rules available energy efficiency measures or
assessment methods of technologies (eg training in calculating and verifying EEDI and SEEMP
including development of tools to calculate EEDI and SEEMP) Trainingsworkshops can be local or
regional Sending people physically to regional workshops is generally more conductive to networking
and experience sharing but less adapted to the local situation and more costly
To reduce the costs of training and ensure a certain level of training the IMO or other qualified
international partners (eg WMU) could develop model courses for training In order to better
understand the rules and regulations in detail people use the help of trainers to better understand the
elements that are important for them and to gain experience in doing calculations and other required
24 Ad Hoc Expert Working Group on Facilitation of Transfer of Technology for Ships 2nd Meeting 25 httpwwwftcomcmss0dadcb240-3d97-11e3-b754-00144feab7dehtmlaxzz3aqC3tmNu
TRANL15371 18
activities by the regulations Trainers have to develop their courses and earn back their investments
via trainings Since the trainers are doing this simultaneous it would be more efficient if there would
be a model course available that can easily be tailored to the audience This would reduce the costs for
the development of trainings and would also ensure that the trainers provide the same level of depth
in their trainings Since the IMO is responsible for the rules and regulations it would be the logical
responsible for the efficient implementation and therefore could take the initiative for developing model
courses
Information Sharing
Inventory of energy-efficiency technologies (for example the IMO-GEF-UNDP project) Many
studies and overviews on the internet are available The quality and the scope is often
different
Improved access to information and information sharing with international recognised
organisations including relevant survey and certification training One example of
establishing information sharing between governments is the work of the OECD Council
Working Party on Shipbuilding (WP6)26 which organises regular workshops aimed at
facilitating the exchange of information on policy and industry developments
Note that many of these measures overlap with the measures required to overcome institutional
barriers as laid out in section 43
Agreements between industry and administrations could be envisaged to overcome the
barriers
In order to enhance the sharing of expertise for both administrations and industry technology transfer
and technology cooperation agreements could be formulated in order to strengthen the cooperation
As identified before the technology transfer to the ship building industry is not a mayor barrier so the
agreements should help the administrations to become more aware of the possibilities to further
promote the implementation of MARPOL Annex VI
Typical agreements between industry and administrations could be in the form of initiatives like the
Sustainable Shipping Initiative (SSI) SSI members have developed a vision for a sustainable shipping
industry in 2040 They commit to working towards this in all their own operations andor activities that
involve shipping and in all their dealings with and support for the shipping industry to make their vision
a global reality by 2040 SSI members of over 19 companies represent ship owners and charterers
shipbuilders engineers and service providers banking insurance and classification societies The SSI
explored for instance how to overcome barriers to the uptake of new technologies and techniques which
improve the operational efficiency of ships potentially delivering energy efficiency savings of 10 or
more and payback periods of less than 5 years They also produce case studies to show good examples
and also develop tools By involving administrations in these kind of initiatives (even free of charge)
they could be actively supported with knowledge about sustainable shipping
26 httpwwwoecdorgstiindworkshopongreengrowthinshipbuildinghtm
TRANL15371 19
Technology Concerns
Barriers Technology Concerns
One of key barriers to the implementation of energy efficient technologies (new and retrofit) relates to
the lack of or limited technology supply chain Furthermore the lack of a technology base for RampD in
some states is a barrier Also the existence of concerns relating to the ability of available energy
efficiency measures to reduce emissions and operational costs and their compatibility with other
measures of energy efficient technologies is a barrier This is typically the problem in very isolated ship
yards
Measures forward
Very successful shipyards (Japan and Korea) have already since many years a large number of
licencing technology transfer and similar agreements and continuously exchange information with
competitors in and outside their countries For instance US shipyards have adopted this methodology
since the 1980s (office of technology assessment 1983)
Further technology sharing could be stimulated through educationalRampD institutes locally regionally
or globally in ship design and building The technology will be transferred to the ship builders once the
students start working there or through cooperation between industry and university In order to
facilitate this we recommend the establishment of partnerships to share expertiseexperience
Typically individuals who know both worlds are the driving force behind successful partnerships (AISBL
2012) These partnerships are built around a shared long term research vision Many partners could
contribute (eg financially) in order to establish the responsible management and research programme
The target of the platform could be for example to provide verified information on real-world energy
efficiency improvements via a monitoring programme
For example in order to stimulate the deployment of energy efficient trucks the Dutch government
provides a website to share audited knowledge and data on about 15 energy efficiency technologies27
Additionally climate financing could be leveraged to reduce the investment risk in unproven
technologies For example IMO Member States could create a demonstration fund that can function as
a guarantee for investments in new and immature technologies28 Similarly investment guarantees
can be provided by funds in the same way governments provide export credits to their companies If
the technology does not deliver the expected fuel-savings the fund can cover the difference and hence
reduce investment uncertainty The main objective being to reduce investment risk
Institutional Concerns
Barriers
27 httpwwwtruckvandetoekomstnl 28 An example of a specific EE fund is httpwwweeefeueligible-investmentshtml
TRANL15371 20
For Flag and Port States complying with new regulations of IMO and EEDI and SEEMP particularly
represent and increased administrative burden It requires revisions and amendments of existing
legislation that need to be implemented at Port and Flag State functions There is currently limited
technical capacity in state institutions to implement these changes especially in developing countries
with a relatively low number of ships under their flag
The lack of financial resources is also a barrier for additional compliance and enforcement activities by
maritime administrations This is particularly an issue for least developed countries and small
developing island states Implementation costs are relatively higher for small Flag States because of
limited abilitycapacity to implement new technical regulations Note that this issue is not specific to
the EEDI and the SEEMP but to most regulatory measures (maritime or other)
Measures forward
Measures to assist states in implementing (existing and new) legislation include
Promote an increased cooperation and communication between administrationswithin
regional administrations of Port and Flag States similarly to what has been suggested in
sections 41 (Awareness raising through capacity building activities such as workshops) and
42 (Establish platform to share regulatory expertiseexperience) Platforms could be
managed by IMO in conjunction with industry and development funds in order to share the
costs as this has been done before for GloBallast for example In that case the IMO is in the
lead (executing agency) but the platform is supporting the collaboration with many
stakeholdersfunding partners The goal of the programme is to assist developing countries
eg via e-learning courses
In addition deterrents need to be put in place to discourage Flag States from performing
substandard inspections A system for detecting sub-standard inspections should be
implemented whereby mandatory Port State Control inspections are carried out in close
proximity to mandatory Flag State inspections (ie the Flag State inspection is carried out
prior to the ship leaving port and the Port State inspection is carried out upon arrival at port)
The two inspections should be carried out under a uniform mandatory checklist The IMO
should monitor inspections and investigate where discrepancies between inspections close in
proximity are detected If a Flag or Port State is found to have failed to meet the requisite
inspection standards penalties in the form of substantial fines should follow
In order to overcome the financial barriers financial assistance to states could help with
capacity building and implementation Financial resources are not only needed in the
implementation of the new regulations (training of government experts) but governments of
Flag States also need to be involved continuously in the ongoing discussion around
developments new EEDI targets for 2020 and beyond which requires continuous availability
of experts to represent the interests of the state (Metselaar 2015) Financial aid can therefore
be supplied in the following forms
Increased financial support for compliance and enforcement activities by maritime
administrations
Financial support could be provided to Flag States so that they have the resources to
properly carry out vessel inspections Consideration should be given to the introduction of
TRANL15371 21
an International Fund Convention set up for this purpose and contributed to by Port
States andor their major oil and other cargo exporters and importers
Commercial
Barriers
Private parties such as ship owners and investors are not always commercially incentivised to make
investments in energy efficiency measures This can be due to the split incentives between owner (who
should make the investment) and charterer (who reaps the cost savings) of a ship (see paragraph 25)
Furthermore access to finance can be problematic for smaller players who operate in niche markets
Measures
Bottlenecks in financing private investments and new financing mechanisms could be addressed during
regional or international workshops that include traditional and new financiers that could finance
investments in energy efficiency technologies
One solution that has been brought forward to address the problem of split incentives is the use of
lsquosmart contractsrsquo (Michele Acciaro 2013) The idea is to change charter contracts in a way that risks
and benefits are shared among charterers and ship owners In such contracts speed choice is more
flexible and the chartering cost of vessels is closer to fuel cost as such ship owners get motivated to
invest in energy-efficient technologies and charterers get stimulated to run vessels in an energy
conserving manner
With respect to the shipbuilding industry the following could facilitate the transfer of technology as
well
Financial assistance to shipyards to be provided at the national level or through other
arrangements
Foreign direct investment in software and hardware as an innovative way to support industry
in implementing the requirements
One type of incentive that governments can provide to enhance industry performance and technology
adoption is a competition for top performers Governments could contribute to a fund from which
money is distributed to the top 10 of best performers in a particular year
Cost estimates
Workshops and training
Capacity building workshops for administrations are estimated at euro 1000 per attendee for an
online workshop (1-2 days) Costs for the organisation of such workshops would include expert fees
and administrative costs These costs could be lower if the course material is already developed
(model workshops) Eg 2 attendees per Flag State for the ten most important Flag States
TRANL15371 22
(covering 74 of total fleet tonnage) comes down to euro 20000 or less in case the courseware is
already existent
A situation that is more conductive to networking and experience sharing is to send people physically
to regional workshops The costs of such workshops including participants travel and hotels for 50
participants would be between euro20000 - euro100000 per workshop based on our international
experience with organising workshops in the field of renewable energy and energy efficiency Costs
could be lower depending on the amount of preparation required cost of location (could be sponsored
by participating states)
Technical training
Trainings already exist for calculating and verifying EEDI including development of tools to calculate
EEDI For example MARIN offers 32h courses over 5 days in the Netherlands for euro 5000 per attendee
(excluding travel and accommodation)29 Lloyds offers similar trainings for similar costs30
Model courses for training may need to be updated depending on identified needs Ecofys estimates
the update of eg an existing EEDI model courses to cost in the order of euro 50000
Online platform for inventory of energy efficiency technologies
Inventories of energy-efficiency technologies already exist (for example in reports like (IMO 2009) and
on websites of for instance DNV-GL the efficiency finder31) but they could be further developed since
the websites are either not independent or incomplete
In order to facilitate information exchange a web-based platform could be established The role of the
platform would be for example to provide verified information on real-world energy efficiency
improvements via a monitoring programme For example in order to stimulate the deployment of
energy efficient trucks the Dutch government provides a website to share audited knowledge and data
on about 15 energy efficiency technologies32 The costs of such a website and corresponding
programme are estimated to be around euro 2 million for a 4 year period Furthermore a platform can be
used to inspire others by showing best practices and can be used for sharing of information regarding
network opportunities like conferences and seminars
Capacity building project
Currently the IMO-GEF-UNDP GloBallast project is a capacity building project it assists developing
countries and their maritime industries in implementing international regulations on ballast water
29 httpwwwmarinnlwebEventsCoursesSpecialist-Course-on-Ship-propulsion-model-tests-and-SpeedPower-trials-for-EEDI-Verifiers-
2731-October-2014htm 30 httpwwwlloydslistcomllsectorship-operationsarticle422262ece 31 httpswwwdnvglcommaritimeenergy-efficiencyefficiency-finderhtml 32 httpwwwtruckvandetoekomstnl
TRANL15371 23
management and preventing risks arising from the transfer of harmful aquatic organisms And has
several aspects that could also be used for knowledge transfer of energy efficiency measures
web-site
e-learning course
databasesdirectories
library collections
newsletter
Regional Task Force (RTFs) to support development and adoption of a regional approach
Develop and implement communication education awareness raising and outreach
programme
Develop introductory and more specialised training packages
Develop model legislations
The total budget for the 2008-2012 period was US$23 million out of which US$564 million represents
a GEF grant the rest being mostly in-kind contributions from the participating countries regional co-
ordinating organisations (RCO) and strategic partners including the private sector
Improved access to information and information sharing with international recognised organisations
including relevant survey and certification training would further promote the different technologies
TRANL15371 24
Conclusions
This study provides an overview of existing technologies which could drastically improve the energy
efficiency of ships Furthermore barriers to transfer and uptake of energy efficient technologies are
analysed and categorised and implications of these barriers are listed in order to facilitate the uptake
of energy efficiency technologies for ships
From this research it is clear that conventional technology is available that can cost-effectively (with a
payback time of less than 15 years) achieve high efficiency gains If the maximum gains per category
are added up (for all but ferry and cruise) this would mean a total efficiency improvement of 35
Even without taking two experimental technologies with potentially high efficiency gains into account
(wind power and air lubrication)
High investments like wind power and contra rotating propellers bring the highest savings (13 ndash 20)
The medium investments are in-between (5-10) and the low investments only bring relatively small
energy efficiency improvements (lt5)
When the ship owner has too few opportunities to share investment with charterers this leads to a split
incentive a ship owner may invest the up-front capital to put in energy-efficient technology but not
receive the benefits This is typically a problem for investments with a high payback time ie the wind
power and contra rotating propellers
The main barriers are related to the transfer of technology to Flag States Flag States are generally
third world and developing nations that often do not have the resources to enforce investigate or
prosecute breaches by their flagged vessels
Several ways to overcome the knowledge transfer barriers were presented that can be categorised as
follows
Workshops and trainings
o Capacity building workshops for administrations
o Regional workshops
Technical training
o Training in calculating and verifying the EEDI
o Development of model courses
Online platform
o Inventory of energy-efficiency technologies
o Creation of a website with all relevant information for the target audience
o Improved access to information and information sharing
o Provide verified information on real-world energy efficiency improvements via a
monitoring programme
TRANL15371 25
The most expensive of the capacity building actions is the capacity building project which takes all
aspects above into account If a project would be developed for knowledge transfer regarding energy
efficiency measures similar to GloBallast which assists developing countries and their maritime
industries in implementing international regulations on ballast water management and preventing risks
arising from the transfer of harmful aquatic organisms the total budget needed would be in the order
of US$23 million for a period of 5 years
TRANL15371 26
References
JFE Group 2013 ldquoJapan Marine Unitedrdquo JFE Group Overview JFE Group AISBL 2012 Making Industry-University partnerships work lessons from succesful collaborations
report Belgium AISBL
Allenstroumlm Bjoumlrn 2013 ldquoWind propulsionrdquo SSPA Sweden AB Gothenburg EffShip March
Aqorau T 2000 Illegal Unreported and Unregulated Fishing Considerations for Developing
Countries paper Honiara Solomon Islands South Pacific Forum Fisheries Agency
BALance 2014 Competitive position and future opportunities of the Euroean Marine Supplies
industry BALance Technology Consulting
Barringhaus David and Robert Olds 1999 OLDS ENGINEERING Maximizing Propulsion Efficiency
Marine Division Accessed Februrar 2015
httpwwwoldscomaumarinemaximizing_propulsion_efficiency
Becker Marine System not dated Becker Bulb Rudders httpwwwbecker-marine-
systemscom05_downloadszzpdfproduct_pdfBecker_Bulb_Rudderspdf Becker Marine
System
mdash 2015 Twisted Full Spade Rudder Accessed Feb 2015 httpbecker-marine-
systemscom03_productsproducts_twisted_full_spadehtml
Bloomberg 2014 China Loses Shipbuilding Crown to South Korea Chart of the Day 9th December
httpwwwbusinessweekcomnews2014-12-09china-loses-shipbuilding-crown-to-south-
korea-chart-of-the-day
Bluebird-Electric 2014 Sipbuilding post World War Two httpwwwbluebird-
electricnetship_boat_design_buildingshipbuilders_ship_repairers_associationhtm
Boat design 2007 Accessed Feb 2015
httpwwwboatdesignnetforumsattachmentspropulsion16743d1193341389-new-
propulsion-sytems-ships-grim-prop-1jpg
Brannigan Paschos Eyers and Wood 2009 Report on International avialtion and Mritime Emissions
in a Copenhagen (post 2012) Agreement Oxfordshire AEA Group
Chen Benjamin Arthur Reed and Ki-Han Kim 1989 A Vane-Wheel Propulsor for a Research and
Development Report Newport David Taylor Research Center
CNSS 2015 Clean North Sea Shipping - Clean Shipping Technology Accessed Februar 2015
httpcleantechcnssnoghg-technologiestechnical-measuresmeasures-related-to-the-hull
Crist Philippe 2009 Greenhouse gas emissions reduction potential from international shipping
Working paper OECD
Daily Times 2015 Nigeria Turkey seek collaboration on ships shipyards 5th January
httpwwwdailytimescomngarticlenigeria-turkey-seek-collaboration-ships-shipyards
Dillingham Gerald L 2000 Progress Made to Reduce Marine Pollution by Cruise Ships but Important
Issues Remain GAO report Washington United States General Accounting Office
DK Group 2015 Silverstream technologies January Accessed January 2015 httpdkgroupeu
DNV 2014 Encouraging Construction and Operation of Green Ships OECD
httpwwwoecdorgstiindC-WP6(2013)12-FINAL-ENGpdf
TRANL15371 27
DNV GL 2015 EFFICIENCY FINDER Accessed Feb 2015 httpwwwdnvglcommaritimeenhance-
performanceefficiency-finderaspx
Ecorys 2012 ldquoGreen growth opportunities in the EU shipbuilding sectorrdquo
ECOSPEED 2015 EUROPEAN MARINE amp MACHINERY AGENCIES LTD Accessed February 2015
httpwwweuropeanmarinecoukECOSPEEDhtm
gcaptain 2012 gcaptain - Propeller Technology to Make Your Ship More Efficient - Accessed Feb
2015 httpgcaptaincompropeller-technology-ship-efficient
Hansen Dinham-Peren and Nojiri 2011 Model and Full Scale Evaluation of a lsquoPropeller Boss Cap
FinsrsquoDevice Fitted to an Aframax Tanker Second International Symposium on Marine
Propulsors smprsquo11 Hamburg Germany June 2011
Hellenic Shipping News 2014 Korean ships sell at fuel-saving premium 22nd December
httpwwwhellenicshippingnewscomkorean-ships-sell-at-fuel-saving-premium
Hindawi 2015 Hindawi Puplishing Cooperation Accessed February 2015
httpwwwhindawicomjournalsijrm2012474785fig4
Hochkirch Karsten and Volker Bertram not dated ldquoSlow Steaming Bulbous Bow Optimization for a
Large Containershiprdquo Accessed Februar 2015 http2021148960resourcepdf5096pdf
Hollenbach Uwe and Juumlrgen Friesch not dated Efficient hull forms ndash What can be gained
Conference ship-efficiency Hamburg 2013 Hamburg HSVA Hamburgische Schiffbau-
Versuchsanstalt GmbH HamburgGermany
ICCT 2011 Reduce Greenhouse Gas Emissions from Ships - Cost Effectiveness of Available options -
white paper Washington DC International Council on Clean transportation (ICCT)
IMO 2011 REDUCTION OF GHG EMISSIONS FROM SHIPS Marginal Abatement Costs and Cost
Effectiveness of Energy-Efficiency Measures Submitted by the Institute of Marine Engineering
Science and Technology (IMarEST) MEPC 62INF7 International Maritime Organisation
IMO 2009 Second IMO GHG Study 2009 London International Maritime Organisation
JSEA 2006 ldquoImproved propulsive performance - Universal applies new energy-saving type Leadge
Bowrdquo Japan Ship Exports Association (JSEA) httpwwwjseaorjpVariableJSea318pdf
Kawasaki 2015 Energy-saving Technology Accessed Feb 2015
httpswwwkhicojpenglishshiptechconservationindexhtml
Leddy Fiona Jayne 2012 ldquoA critical legal analysis of International Shipping in Australian Waters and
the risk of ship-based oil pollutionrdquo Queensland Environmental Practice Reporter vol 17
Marinelog 2014 China white lists 51 shipyards 4 September
httpwwwmarinelogcomindexphpoption=com_k2ampview=itemampid=7667china-white-
lists-51-shipyardsampItemid=231
Metselaar Kees interview by Arno van den Bos 2015 Policy officer at directorate maritime affairs of
ministry of Intrastructure and Environment (February)
Michele Acciaro Peter Nyegaard Hoffmann Magnus Strandmyr Eide 2013 ldquoThe Energy Efficiency
Gap in the Maritime Transportrdquo Journal of Shipping and Ocean Engineering 1-9
MIWB 2015 Maritiem Instituut Willem Barentsz Accessed Feb 2015
httpsmijnmiwbnlnieuwsbriefindexphpdo=showampid_artikel=116
MOL 2011 Energy-Saving Propeller Boss Cap Fins System Reaches Major Milestone - Orders
Received for 2000 Vessels Accessed Feb 2015
httpwwwmolcojpenpr20111145html
TRANL15371 28
Motorship 2014 Gas fuelled ships into the future 31 10 httpwwwmotorshipcomnews101ships-
and-shipyardsgas-fuelled-ships-into-the-future
Nakashima 2015 Nakashima propeller CO LTD Accessed Feb 2015
httpwwwnakashimacojpengproductrudderhtml
Nielsen Shin Lundgren and Faghani not dated Combined Kappel propeller and rudder bulb system
for improved propulsion efficiency Frederikshavn MAN Diesel amp Turbo
OECD 2014 The OECD Council Working Party on Shipbuilding
httpwwwoecdorgindustryindshipbuildinghtm
OECD 2011 ldquoThe Shipbuilding Industry in Turkeyrdquo
office of technology assessment 1983 An Assessment of Maritime Technology and Trade report
Washington DC US Congress
Pakarinen Risto 2007 ldquoNothing common about common railrdquo Twentyfour7 (Twentyfour7) 64-65
Ports amp Ships 2015 Ports and Ships Accessed February 2015
httpportscozanewsarticle_2007_10_17_4038html
Rolls-Royce 2014 Propulsors - Moving your business in the right direction httpwwwrolls-
roycecom~mediaFilesRRolls-Roycedocumentscustomersmarinepropulsion-2014-
tcm92-8664pdf Aalesund Rolls-Royce Commercial Marine httpwwwrolls-
roycecom~mediaFilesRRolls-Roycedocumentscustomersmarinepromaspdf
Schneekluth H and V Bertram 1998 Ship Design for Efficiency and Economy Oxford
Butterworth-Heinemann
Schulze Reinhard 2007 Twisted Rudder - Extreme Design 14 SVA-Forum bdquo Ruder in Theorie und
Praxisldquo Potsdam 7 November 2007 Potsdam Schiffbau-Versuchsanstalt Potsdam GmbH
Selenetrawlers 2015 Selenetrawlers Accessed February 2015
httpwwwselenetrawlerscomcompanydesign-notes
Sepideh Jafarzadeh Ingrid Bouwer Utne 2014 ldquoA framework to bridge the energy efficiency gap in
shippinrdquo Energy 603-612
SetSail 2009 SetSail Accessed February 2015 httpwwwsetsailcomprop-nozzle-comments-by-
an-expert
Shuto Hideki 2010 Super Eco Inland Vessels httpwwwccr-
zkrorgtempwrshp120411Presentations2_04_HShuto_enpdf IHI Marine United Inc
Silberschmidt Noah 2014 ldquoGenerating efficiencies from thin airrdquo SMM Green shipping | Efficiency
httpwwwsilverstream-techcomwp-contentuploads201404HANSA-241112pdf
httpwwwsilverstream-techcomwp-contentuploads201404HANSA-241112pdf
Skinner Ian 2009 EU Tranport GHG Routes to 2050 Technical options for maritime and inland
shipping httpwwweutransportghg2050eucmsassetsTechnical-options-maritime-inland-
waterpdf Brussel European Commission
Statista 2015 ldquoLargest shipbuilding nations in 2013 based on completions in gross tonnagerdquo
httpwwwstatistacomstatistics263895shipbuilding-nations-worldwide-by-cgt
UK DfT 2014 ldquoDfT Port Statistics - World fleet registered trading vessels of 100 gross tons and over
gross tonnage on selected registers 1999-2013rdquo
httpswwwgovukgovernmentcollectionsmaritime-and-shipping-statisticsdata-tables-
associated-with-this-series
TRANL15371 29
Voorham 2013 Assessment of sustainable investment in shipping Master Thesis
Report SDPO13029m Delft 27 th November 2013 Delft Delft University of Technology
WAumlRTSILAuml 2009 ldquoEnergy Evironment Economyrdquo Helsinki Finland WAumlRTSILAuml
mdash 2007 ldquoWaste heat recoveryrdquo Waumlrtsilauml Corporation
Wettstein and Brown 2008 Derating a solution for high fuel savings and lower emissions
Winterthur Waumlrtsilauml Switzerland Ltd
Wind Chellenger Project HP 2015 Wind Chellenger Project HP Accessed Feb 2015 httpwindku-
tokyoacjpindex_enhtml
TRANL15371 30
Appendix I - World fleet registered trading vessels
Table 3 World fleet registered trading vessels of 100 gross tons and over 2009-2013 Source UK DfT 2014
Flag Country 2009 2010 2011 2012 2013
(World Total) 8448 9130 9831 10343 10725
Panama 1886 1979 2084 2158 2172
(European Union) 1900 1979 2074 2051 2106
Liberia 908 1037 1167 1238 1241
Marshall Islands 475 590 711 811 900
Hong Kong 449 553 678 785 854
Singapore 398 434 512 592 677
Malta 348 380 438 450 496
Bahamas 452 469 481 483 485
Greece 388 407 411 411 415
China 282 327 356 388 411
United Kingdom (inc IOM and CI) 258 273 294 300 288
Cyprus 201 205 207 197 203
Japan 138 156 167 178 192
Italy 150 169 181 180 176
Norway 152 145 143 144 145
Germany 152 155 153 137 123
Denmark 107 115 113 113 122
Korea South 120 124 116 111 112
Indonesia 69 82 91 101 111
Bermuda 94 100 106 109 105
Antigua amp Barbuda 100 107 111 106 100
United States of America 107 108 102 99 97
India 83 83 89 85 82
Netherlands 76 61 67 66 69
Turkey 54 58 62 64 59
Malaysia 69 72 71 62 57
France 63 63 64 56 53
Russia 47 49 49 51 52
Philippines 50 51 50 43 43
Cayman Islands 27 29 32 32 31
Taiwan 25 26 27 30 31
Iran 09 08 05 21 31
Thailand 25 26 22 26 29
Sweden 39 35 33 28 27
St Vincent amp the Grenadines 47 42 37 28 24
Canada 24 24 25 24 23
Spain 22 25 26 25 23
Kuwait 23 19 24 24 22
Brazil 20 20 19 19 20
Cambodia 18 17 13 13 12
TRANL15371 31
Appendix II - Most important shipbuilding
countries
China
China is an emerging shipbuilder that overtook South Korea during the 2008-2010 global financial crisis
as they won new orders for medium and small-sized container ships (Bloomberg 2014 Bluebird-Electric
2014)
Figure 14 delivery of vessels from Chinese and South Korean shipyards in million compensated gross tons a measure
of building time and human resources used per ton Source (Bloomberg 2014)
China has more than 1600 shipyards Analysts have predicted that about one third of them will fold
as the industry struggles with overcapacity Last year China laid out a three year plan for industry
restructuring that urged yards to concentrate on building higher quality vessels and local governments
to halt approvals for new projects (Bluebird-Electric 2014)
After two decades of a loan-fuelled boom Chinarsquos shipbuilding industry has become saddled with debt
and overcapacity prompting some private firms to seek financial assistance from the state In
September the government issued a list of 51 shipbuilders it deemed worthy of public support
(Marinelog 2014)
TRANL15371 32
New additions to the white list include subsidiaries of the China State Shipbuilding Corporation (CSSC)
and the China Shipbuilding Industry Corporation (CSIC) and the AVIC Weihai Shipyard owned by the
Aviation Industry Corporation of China (AVIC) (Marinelog 2014)
South Korea
By the end of 2014 it seemed South Korea has overtaken China again as the worlds largest
shipbuilding country with a global market share of about 30(see Figure 14) (Bloomberg 2014)
(Bluebird-Electric 2014) South Korea leads in the production of large vessels such as cruise liners
super tankers LNG carriers drill ships and large container ships
South Koreas shipyards are highly efficient with the worlds largest shipyard in Ulsan operated by
Hyundai Heavy Industries slipping a newly built $80 million vessel into the water every four working
days South Koreas big three shipbuilders Hyundai Heavy Industries Samsung Heavy Industries
and Daewoo Shipbuilding amp Marine Engineering dominate global shipbuilding with STX Shipbuilding
Hyundai Samho Heavy Industries Hanjin Heavy Industries and Sungdong Shipbuilding amp Marine
Engineering also ranking among the top ten shipbuilders in the world In 2007 STX Shipbuilding further
strengthened South Koreas leading position in the industry by acquiring Aker Yards the largest
shipbuilding group in Europe (The former Aker Yards was renamed STX Europe in 2008) In the first
half of 2011 South Korean shipbuilders won new orders to build 25 LNG carriers out of the total 29
orders placed worldwide during the period
To maintain their market position Korean yards also focus more and more on greening opportunities
The Korean government introduced a GHG emission reducing program in 2008 The program is aiming
at reducing GHG emissions throughout all economic sectors including the shipping and shipbuilding
industry Also the Japanese Shipbuilding Association (SAJ) is looking into the possibilities to reduce
GHG emissions so that the shipbuilding industry becomes greener and more competitive (Ecorys
2012)
Japan
Japan had been the dominant ship building country from the 1960s through to the end of 1990s but
gradually lost its competitive advantage to the emerging industry in South Korea which had the
advantages of much cheaper wages strong government backing and a cheaper currency South Korean
production overtook Japans in 2003 and Japanese market share has since fallen sharply
The Philippines
The Philippines has placed fourth among shipbuilding nations around the world producing more than
six million deadweight tonnes of ships built in 2012 The country is anchored by South Korean Hanjin
and Japans Tsuneishi shipbuilders The country has shipyards in Subic and Cebu
TRANL15371 33
Europe
For several decades European shipyards have been facing strong global competition from especially
Asian enterprises (Japanese yards in the 1950s and 60s Koreans from the 1970s and 80s and Chinese
since the 1990s) In Europe this has led to an almost complete exit from the mass production segments
of tankers bulkers and containerships Response of the EU industry has been to focus on the higher
value more complex ship types such as ferries and passenger ships non-cargo vessels and general
cargo ships In addition only limited numbers of vessels of the same type are being built (in contrast
with bulk vessels which are mass produced) Europe has a 77 percent market share in building
passenger vessels (including both cruise ships as well as ferries) and a 17 percent share in the
construction of non-cargo vessels (Ecorys 2012) These segments make up a relatively small share of
the world orderbook (in CGT) However in value they represent a much higher share due to their
relatively sophisticated characteristics The position of the European shipbuilding industry in the
manufacturing of specialised innovative vessels is still strong At the same time European equipment
manufacturers have acquired a leading role in quality products especially in complex high value
equipment components
Figure 15 World orderbook and CESA orderbook by ship type in 2010 (CGT x 1000) (Source Ecorys 2012)
Regarding the marine equipment sector the European industry is renowned for propulsion cargo
handling communication automation environmental and security systems This equipment is not only
destined for complex European-built ships but also exported to Asian yards whether or not requested
by their clients (Ecorys 2012)
Compared to the ship construction sector the marine equipment segment is highly heterogeneous and
consists of companies that are often also active in other business areas (ie automotive or aircraft
industry) A study by (BALance 2014) found that the European marine equipment industryrsquos
TRANL15371 34
competitiveness lies in a strong market position and technological leadership at least for globally active
European marine supply companies who build their position on a strong infrastructure and co-operative
partners skill of their employees and close relationship with their customer base Conversely identified
weaknesses are the cost level in Europe and the heterogeneous structure of the industry with many
SMEs which hinder in some cases attempts to follow the markets by globalisation strategies
Turkey
Shipbuilding in Turkey has evolved from an old traditional activity in Anatolia to an internationally
recognised industry especially since the early 1990s The industry has modern shipyards that can build
ships yachts mega-yachts and sailing boats as well as carrying out extensive repair and conversion
works Turkeyrsquos shipyards are mainly located in the Marmara Region namely Tuzla Yalova and İzmit
which have developed into dynamic shipbuilding centres Also in recent years the emerging Black Sea
and Mediterranean Regions have increasingly attracted shipyard investments
In the last decade in parallel with developments in the global market Turkish shipbuilding experienced
a several-fold increase in its shipbuilding and export capacity including a significant product
diversification According to order books this resulted in Turkey being regularly placed in the top ten
countries on the basis of its deadweight (dwt) production and in the top five countries by the number
of ships
In recent years Turkey has increasingly tapped into niche markets which in turn has led to a growing
participation by Turkish shipyards in the international trade in new ships In parallel there has also
been strong growth in the marine equipment manufacturing sector which could increasingly also tap
the export market These developments reflect in part the strategic location of the yards the
experienced workforce the quality of production and Turkeyrsquos significant role as a political cultural and
economic bridge between Europe and Central Asian and Middle Eastern economies (OECD 2011)
ECOFYS Netherlands BV | Kanaalweg 15G | 3526 KL Utrecht| T +31 (0)30 662-3300 | F +31 (0)30 662-3301 | E infoecofyscom | I wwwecofyscom
ECOFYS Netherlands BV
Kanaalweg 15G
3526 KL Utrecht
T +31 (0) 30 662-3300
F +31 (0) 30 662-3301
E infoecofyscom
I wwwecofyscom
HOW TO OBTAIN EU PUBLICATIONS
Free publications
bull one copy
via EU Bookshop (httpbookshopeuropaeu)
bull more than one copy or postersmaps
from the European Unionrsquos representations (httpeceuropaeurepresent_enhtm)
from the delegations in non-EU countries
(httpeeaseuropaeudelegationsindex_enhtm)
by contacting the Europe Direct service (httpeuropaeueuropedirectindex_enhtm)
or calling 00 800 6 7 8 9 10 11 (freephone number from anywhere in the EU) () () The information given is free as are most calls (though some operators phone boxes or hotels may charge you)
Priced publications
bull via EU Bookshop (httpbookshopeuropaeu)
Priced subscriptions
bull via one of the sales agents of the Publications Office of the European Union
(httppublicationseuropaeuothersagentsindex_enhtm)
doi 102834880780
ML-0
1-1
5-4
39-E
N-N
[Ca
talo
gu
e n
um
be
r]
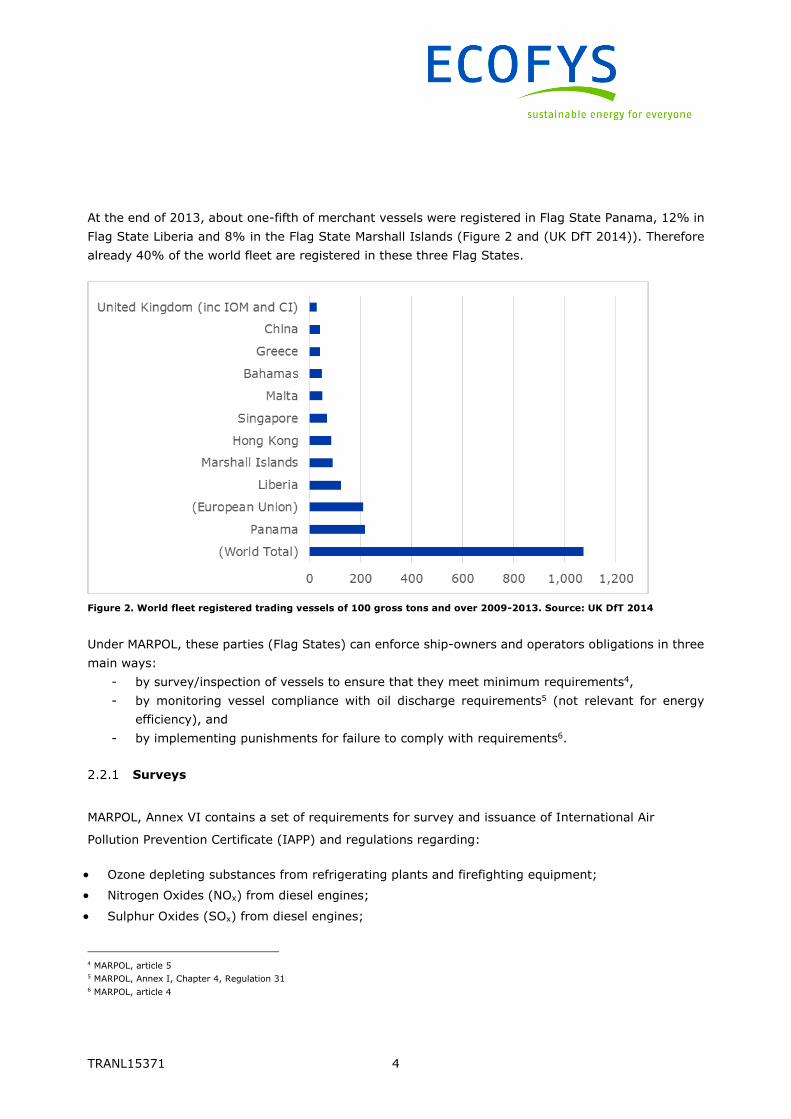
TRANL15371 4
At the end of 2013 about one-fifth of merchant vessels were registered in Flag State Panama 12 in
Flag State Liberia and 8 in the Flag State Marshall Islands (Figure 2 and (UK DfT 2014)) Therefore
already 40 of the world fleet are registered in these three Flag States
Figure 2 World fleet registered trading vessels of 100 gross tons and over 2009-2013 Source UK DfT 2014
Under MARPOL these parties (Flag States) can enforce ship-owners and operators obligations in three
main ways
- by surveyinspection of vessels to ensure that they meet minimum requirements4
- by monitoring vessel compliance with oil discharge requirements5 (not relevant for energy
efficiency) and
- by implementing punishments for failure to comply with requirements6
Surveys
MARPOL Annex VI contains a set of requirements for survey and issuance of International Air
Pollution Prevention Certificate (IAPP) and regulations regarding
Ozone depleting substances from refrigerating plants and firefighting equipment
Nitrogen Oxides (NOx) from diesel engines
Sulphur Oxides (SOx) from diesel engines
4 MARPOL article 5 5 MARPOL Annex I Chapter 4 Regulation 31 6 MARPOL article 4
TRANL15371 5
Volatile Organic Compound Emissions from cargo tanks of oil tankers
Shipboard Incineration
Fuel oil quality
Flag States must conduct an initial survey before a new ship is put into service and before the IAPP is
issued for the first time a renewal survey at intervals specified by the Administration but not exceeding
five years an intermediate survey within three months before or after the second anniversary date or
within three months before or after the third anniversary date of the certificate an annual survey within
three months before or after each anniversary date of the certificate and after prescribed repairs an
additional survey7
For the EEDI and the SEEMP a new certificate the International Energy Efficiency Certificate (IEEC)
was established and must be kept available on board for inspectionssurveys The IEEC Certificate will
be issued for new build ships upon the initial survey before the ship is put into service and for existing
ships of 400 gross tonnage and above The IEE Certificate will be issued once for each ship and is valid
throughout the lifetime of the ship (except flag change major conversion or ship going out of service)
There are no follow-up surveys on the IEEC Certificate
The IMO has created guidelines for surveys that Flag States should follow The energy efficiency related
one is
2014 Guidelines on survey and certification of the Energy Efficiency Design Index (EEDI)
(resolution MEPC254(67))
A Flag State cannot allow a vessel that does not pass inspection to sail until it complies with MARPOL8
An International Energy Efficiency Certificate in accordance with the provisions of regulation 54 to
any ship of 400 gross tonnage and above is needed before that ship may engage in voyages to ports
or offshore terminals under the jurisdiction of other Parties
Punishments for failure to comply
In case of failure to comply the authority carrying out the inspection may detain the ship Article 7 of
MARPOL ensures that unduly delay or detain will be avoided where possible or compensated
A Flag State is obliged to investigate an incident upon receipt of notification or evidence that one of its
vessels has breached MARPOL If the investigations reveal that a breach has occurred the Flag State
has further obligations to initiate legal proceedings against the vessel and report back to the reporting
state on actions taken9
7 MARPOL Annex VI Chapter 2 Regulation 5 8 MARPOL Annex VI Chapter 2 Regulation 6 9 MARPOL article 6
TRANL15371 6
Also other parties are allowed to inspect vessels under MARPOL Article 6 when violations are detected
or for regular inspections A Party may also inspect a ship to which the present Convention applies
when it enters the ports or off-shore terminals under its jurisdiction if a request for an investigation is
received from any Party together with sufficient evidence that the ship has discharged harmful
substances or effluents containing such substances in any place
Role of Port States
Under ldquoPort State Controlrdquo arrangements Port States also have the authority to conduct vessel surveys
on ships which visit their ports and to detain those ships that fall below MARPOL requirements In
relation to MARPOL Annex VI chapter 4 any port state inspection shall be limited to verifying when
appropriate that there is a valid International Energy Efficiency Certificate on board10
Cooperation between Port and Flag States
Under MARPOL parties are required to co-operate in detecting vessel violations and are required to
use all practical measures to detect and monitor violations If a State has evidence of a violation they
are obligated to forward this evidence to the vesselrsquos Flag State
All ships flagged under countries that are signatories to MARPOL are subject to its requirements
regardless of where they sail and member nations are responsible for vessels registered under their
respective nationalities
When incidents occur outside the countrys jurisdiction or jurisdiction cannot be determined the
country refers cases to Flag States in accordance with MARPOL Some States are not happy with the
lack of response from Flag States United States experience of Flag States not responding has led to
new policy which would take direct enforcement action against vessels for MARPOL V violations
occurring between 3 and 200 nautical miles from the United States rather than referring such violations
to the flag states (Dillingham 2000)
Ship owners and charterers
A ship owner is the owner of a commercial ship A ship owner is someone who equips and exploits a
ship usually for delivering cargo at a certain freight rate The ship owner determines the specifications
of the ship and its energy efficiency measures but the benefits of low fuel consumption are not always
theirs when the ship is chartered to someone else
Depending on the type of ship and the type of charter normally a standard contract form called a
charter party is used to record the exact rate duration and terms agreed between the ship owner and
the charterer
10 MARPOL Annex VI Regulation 10
TRANL15371 7
A charterer may be a party without a cargo who takes a vessel on charter for a specified period from
the owner and then trades the ship to carry cargoes at a profit above the hire rate In some cases a
charterer may own cargo and employ a shipbroker to find a ship to deliver the cargo for a certain price
Two main types of charter can be distinguished time charter and voyage charter In a voyage charter
the owner is still responsible for the port fuel and crew costs In a time charter the charterer selects
the ports and directs the vessel where to go The charterer pays for all fuel the vessel consumes port
charges commissions and a daily hire to the owner of the vessel
When there are too few opportunities to share investment with charterers this leads to a split incentive
a ship owner may invest the up-front capital to put in energy-efficient technology but doesnrsquot then
recoup the costs from fuel savings as they charter their ships out as this goes to the charterers This
problem is particularly apparent for short-term time charters11
Conclusions
Regarding energy efficiency the work of the AHEWG-TT12 has shown that the main shipbuilding nations
all have access to the necessary technologies provided there is demand for them It has also been
noted that there is no need for transfers of intellectual property rights13
One of the major barriers to the effective implementation of the EEDI and the SEEMP is the heavy
reliance it places on Flag States for inspection of vessels and enforcement of provisions During the
1970rsquos ships were being reflagged from high tax and high regulation countries such as the United
States and the United Kingdom to countries offering Flags of Convenience (lsquoFOCrsquo) Under FOCs ship-
owners pay less tax to the relevant Flag State and are able to evade the majority of the environmental
and construction standards set out under MARPOL (Leddy 2012) The main reason for that is that
several Flag States are not signatories to all MARPOL Annexes (eg as of 20142015 the Bahamian
Bolivian Cambodian North Korean Georgian Honduran Lebanese and Sri Lankan flags of
convenience had not ratified all MARPOL treaty annexes III-VI14 15)
Many FOCs are developing nations that do not have the resources to enforce investigate or prosecute
breaches by their flagged vessels (Aqorau 2000) As of 2014 55 of merchant ships are flagged by
FOC and 40 of ships are flagged by FOCdeveloping countries MARPOL only provides guidelines for
Flag States to follow when surveying vessels under regulation 6 but none of these guidelines are
mandatory Conversely Port States which are developed are better equipped to bear the cost of
inspection investigation enforcement and prosecution costs However in relation to EEDI and the
11 httpssi2040orgwhat-we-dowork-streamsfinance 12 MEPC 6831 Progress report of the Ad Hoc Expert Working Group on Facilitation of Transfer of Technology for Ships 13 Submission of the United States on Task 3 of the Ad Hoc Expert Working Group on Facilitation of Transfer of Technology for Ships Jan
2015 14 wwwics-shippingorgdocsflag-state-performance-table 15 httpwwwimoorgAboutConventionsStatusOfConventionsPagesDefaultaspx status of conventions
TRANL15371 8
SEEMP port state control is limited to verifying when appropriate that there is a valid International
Energy Efficiency Certificate on board
We therefore conclude that there needs to be a focus on enabling Flag States and Port States that lack
the resourcescapacity to enforce the EEDI and the SEEMP in order to further stimulate the adoption
of energy efficiency technologies Also attention should be paid to overcoming the barrier of split
incentives ie where the benefits of energy efficiency measures are not transferred from the charterer
to the investor (owner)
TRANL15371 9
3 Energy Efficiency Measures for Ships
In order to understand the important energy efficiency measures that can help improve energy
efficiency from shipping it is interesting to see the split between new-built ships and existing fleet In
2012 some 3655 merchant ships were delivered worldwide about 6 of the worldrsquos merchant fleet
of about 60000 The average age of the merchant fleet is 19 years Therefore measures for both new
ships and retrofits for old ships are important for improving the energy efficiency in the next decades
If only the new ships would be targeted only 50 of the fleet would be more efficient in the next
decades while there are many retrofit measures available The total fleet can be broken down to about
4000 passenger ships just under 14000 tankers and about 37000 dry cargo ships including about
5000 container ships (Statista 2015)
In order to identify the most interesting energy efficiency measures for ships we used the information
from several reports to develop a long-list Many measures improve the efficiency in the order of up to
5 Here we would like to focus on measures that result in high savings that can be applied to many
ship types and preferably also to existing ships The resulting short-list is presented in the next table
We used the main categories identified by AHEWG-TT for structuring the measures
The main categories defined by AHEWG-TT are
1 Hull
2 Main Engine
3 Auxiliary engines
4 Propellers and rudders and
5 Control systems
Since the auxiliary engines typically consume only a fraction of the energy that goes to the main
engines their energy efficiency measure results do not show in the short-list below The measures are
worked out in more detail in the paragraphs below The main engine and auxiliary engine improvements
are covered in the same paragraph
The common rail upgrade is a simple measure that can be easily applied to all ships even when the
ship is not in the dry-dock The details are available in the paragraph about engines
From the list it is clear that conventional technology is available to achieve high efficiency gains If the
maximum gain per category is added up (for all but ferry and cruise) this would mean a total efficiency
improvement of 35 even without taking two experimental technologies with potentially high efficiency
gains into account (wind power and air lubrication) Note that some technologies are not applicable to
all ships
In order to find possible financial barriers the investments are rated from ldquovery lowrdquo to ldquohighrdquo relatively
to the size of the ships The same measure on a larger ship is obviously more expensive
TRANL15371 1
Table 1 Inventoryranking of energy efficiency measures
Main category
Measure Estimated efficiency (range)
Efficiency at average circumstances
Ease of installation
Payback time
Investment Implementation References
Hull Bow optimisation
25-20 10 all ship types
short (lt3 years)
Medium conventional technology
(IMO 2009 IMO 2011 Crist 2009 Hochkirch und Bertram not dated)
Main Engines
Wind power 5-44 20 only special ship types
long (gt15 years)
High experimental technology
(IMO 2011 IMO 2009 Crist 2009 ICCT 2011 Brannigan et al 2009 Allenstroumlm 2013)
Propellers and Rudders
Ducted propeller
1-20 10
all ship types except ferry and cruises
medium (4-15 years)
Medium conventional technology
(IMO 2011 IMO 2009 Crist 2009 ICCT 2011)
Propellers and Rudders
Contra-rotating propellers
6-20 13 only special ship types
long (gt15 years)
High conventional technology
(IMO 2011 IMO 2009 Crist 2009 WAumlRTSILAuml 2009 Shuto 2010)
Propellers and Rudders
Wheels 10 10
all ship types except ferry and cruises
short (lt3 years)
Medium conventional technology
(IMO 2009 Schneekluth und Bertram 1998 Brannigan et al 2009)
Control Systems
Waste heat recovery
6-10 8 new build only
medium (4-15 years)
Medium conventional technology
(IMO 2011 IMO 2009 Crist 2009 WAumlRTSILAuml 2007 ICCT 2011)
Propellers and Rudders
Rudder bulb 2-5 4
all ship types except ferry and cruises
medium (4-15 years)
Low conventional technology
(IMO 2011 IMO 2009 Nielsen et al not dated Crist 2009 ICCT 2011)
Propellers and Rudders
Post swirl fins
2-5 4
all ship types except ferry and cruises
short (lt3 years)
Low conventional technology
(IMO 2009 MOL 2011 Hansen Dinham-
Peren und Nojiri 2011 Nielsen et al not
dated)
Hull Hull coating 1-9 5 all ship types
short (lt3 years)
Low conventional technology
(IMO 2011 IMO 2009 ICCT 2011 Voorham 2013 Crist 2009)
Hull Air lubrication
5-15 9 new build only
medium (4-15 years)
Medium experimental technology
(IMO 2011 IMO 2009 Crist 2009 DK Group 2015 CNSS 2015 ICCT 2011)
Propellers and Rudders
Twisted rudder
2-4 3
all ship types except ferry and cruises
medium (4-15 years)
Low conventional technology
(IMO 2009 Schulze 2007 Nakashima 2015 Becker Marine System 2015 Nielsen et al not dated Hollenbach und Friesch not dated Rolls-Royce 2014)
Main Engines
Main engine de-rating
2-4 3
all ship types except ferry and cruises
medium (4-15 years)
Low conventional technology
(IMO 2011 IMO 2009 Crist 2009 Wettstein und Brown 2008 DNV GL 2015)
Auxiliary engines
Common rail upgrade
- - all ship types
medium (4-15 years)
Very Low conventional technology
(DNV GL 2015) (ICCT 2011) (IMO 2009)
Main Engines
Common rail upgrade
01-05-
03 all ship types
medium (4-15 years)
Very low conventional technology
(IMO 2009 Pakarinen 2007 ICCT 2011 Crist 2009)
TRANL15371 2
Hull and superstructure
In general the optimisation of hull and superstructure focuses on minimising the resistance by reducing
the wave resistance and friction between water and hull It is important to recognise which type of
vessel is to be optimised The reduced frictional resistance increases energy performance of the vessel
particularly at low speeds Operability and performances of the ship must be considered in detail The
improvements measures are generally applied at new-built ships but also applicable to retrofitting
Bow optimisation
The different bow optimisations can improve the water flow around the hull and reduce the wave-added
resistance for large vessels with high block coefficient operating within commercial speed ranges The
average energy reduction potential ranges from 25-20 on average 10 (Crist 2009 IMO 2011
Voorham 2013)
Figure 3 Left The green line characterises the ordinary bow wave of the hull The blue line characterises the wave
formed by the bulb The red line is the sum of these two The altitude of the bow wave is noticeably reduced which
reduces the hull drag associated with the bow wave This improves fuel economy and increases range (Selenetrawlers
2015) Right Ordinary bulbous bow leadge bow and ax-bow shape (JSEA 2006)
The below-the-waterline extension of the bulbous bow (Figure 3) modifies the way the water flows
around the hull reducing drag and thus increasing speed range fuel efficiency and stability An altered
design is the ax-bow (Figure 3) The narrow designed bow slashes through the water in order to reduce
slamming and reduces the size of bow generated wave The propeller can act more efficient due to the
absence of slamming The ax-bow allows the ship to steer well to maintain speed and the engine to
save fuel (Crist 2009 IMO 2009) If the bulbous bow is modified during a regular docking period the
investment is estimated to have short payback of about 1-3 years It is most promising for container
vessels (DNV GL 2015 Hochkirch und Bertram not dated)
Barriers The bow optimisation (as retrofit) needs to be done in the dry dock Dry-docking is not
regularly happening for existing ships because it means that the ship cannot operate and economic
losses are suspected Another obstacle might arise due to restricted access to the original contractual
hull plans since shipyards are not always keen to provide detailed plans on their vessels to prevent
TRANL15371 3
imitation (Hochkirch und Bertram not dated DNV GL 2015) A major obstacle is the split incentive
between ship owner and operator Ship owners are responsible for investing in these technologies and
ship operators are those who pay for the fuel consumption and benefit from such technologies (ICCT
2011)
Technical maturity The technique is available on the market and is effective Only conventional
material is needed and redesign can be done in a few weeks16
Applicability Applicable to all ship types but most efficient for ships with a high block coefficient like
tankers and bulk carriers since the reduction of the wave-added resistance is most impacting (IMO
2009)
Hull coating
Hull coatings (Figure 4) can lower frictional resistance and limit fouling by aquatic organisms It can
save between 1-9 fuel consumption on average 5 (ICCT 2011 Voorham 2013 Crist 2009)
Figure 4 Example of hull coating (ECOSPEED 2015)
One way of lowering the frictional resistance is to improve the smoothness of a hull by means of
coatings that reduce fouling The costs are lifetime cost reduction and have to be recur every five years
to be able to gain the fuel benefit
Barriers A new application is typically necessary during each dry-docking The self-polishing coating
must be renewed after a 3-5 years period (IMO 2009) A major obstacle is the divided interest between
ship owner and operator Ship owners are in charge for investing in these technologies and ship
operators are those who pay for the fuel consumption and profit from such technologies (ICCT 2011)
Technical maturity Coating techniques are available on the market and roughly 5 of newly painted
ships are painted with one of the advanced coating systems presently available (IMO 2011 ICCT 2011)
The payback time is short (ICCT 2011) or 0-2 years according to others17
Applicability The technology is applicable to all vessels
Air lubrication
The air lubrication technique creates a layer of bubbles underneath an already streamlined hull in order
to further reduce friction An automation system regulates the compressorsblowers depending on
16 httpwwwship-efficiencyorgonTEAMpdf14-Ship20efficiency20seminar20-20CMA20CGM-
20HydrOcean20120CMA20pdf 17 httpswwwdnvglcommaritimeenergy-efficiencyefficiency-finderhtml
TRANL15371 4
speed The blower keeps holes filled with air and required pressure A thin layer of bubbles trailing
behind of each cavity merge into single large ldquoair layerrdquo for the whole flat bottom part of the hull and
reduces the friction (Figure 5) Depending on the ship type the estimate fuel efficiency ranges between
5-15 (on average 9) where tankers and bulkers can reduce more (10-15 on average 125) in
comparison to container vessels (5-9 on average 7) (IMO 2009 DK Group 2015 CNSS 2015 ICCT
2011 Voorham 2013)18
Figure 5 Schematic view of air lubrication (DK Group 2015)
Barriers Large capital investment requirements with split incentive The vessel owners are
accountable for investing in these technologies whereas vessel operators recompense for the fuel
consumption and benefit from such technologies (ICCT 2011)
Technical maturity The technology is available on the market but still in a pilot phase Sea trials
have been performed with small demonstration ships There are no vessels operating commercially
that currently use this technique Specifications about the payback time vary from short to medium
(Silberschmidt 2014 Skinner 2009)
Applicability The original technology would be likely be applied to new-built ships with at least a
partly flat bottom and a minimum length of 225 metres since the compressor may have technical
problems maintaining air cavities for deep draft ships (IMO 2011 CNSS 2015) Air lubrication can be
used for retrofitting as well (CNSS 2015)
Engines
Speed reductions on existing vessels provide opportunities for engine optimisation on low power
(321) Similar measures as de-rating for the main engines that could be implemented are cylinder
cut-out and new torsional vibration calculation (IMO 2009)
18 It has to be noted that the extra fuel use caused by the system itself should also be taken into account
TRANL15371 5
Another propulsion supportive measure with a high potential measure is wind power This is also
explained in more detail below In order to also provide a measure with a lower improvement potential
per ship but simple and applicable to all ships we describe the common rail system for fuel injection
Main engine de-rating
Slow steaming vessels are known as one of the most effective energy saving measure The potential
comes mainly from the operational behaviour side From the technical side the specific fuel oil
consumption will decline when a ship is no longer operated at its design speed
The design speed can be reduced by de-rating the main engine (IMO 2011 IMO 2009) Reduction of
power combined with injection timing advanced to restore peak combustion pressure can achieve a
certain gain in shaft efficiency Fuel efficiency can be improved by 2-4 when de-rating is performed
for loads lower than the maximum design load (Wettstein und Brown 2008 Crist 2009) on average
3 energy efficiency potential (Crist 2009) Operational costs would be lower mainly due to fuel
savings (DNV GL 2015 Crist 2009 Wettstein und Brown 2008)
Barriers A slower vessel will have lower incomes as it is not capable to perform as much transport
load per unit of time as a faster vessel De-rating the engine is usually done when it is clear that the
ship will become a slower steaming ship There is a split incentive between vessel owners who are
responsible for investing in these technologies and vessel operators who are those who compensate
for the fuel consumption and benefit from such technologies (ICCT 2011)
Technical maturity This technique has been proven as successful particularly on older engines
which are normally built with a low compression ratio and thereby have a significant potential to
improve their efficiency (IMO 2009) De-rating measures have a low to medium payback time (Crist
2009 DNV GL 2015)
Applicability The technologies are available on the market It is applicable to all vessels (DNV GL
2015)
Common-rail upgrade (common-rail fuel injection)
Engines with common-rail fuel injection handle low-load working modes much better (IMO 2009) A
common-rail fuel injection is technique of injecting fuel into an engine cylinder under total control and
thereby achieving optimal combustion Common-rail allows the start and duration of injection
independent of the position of the pistons in that way permitting an operationally optimised injection
per stroke In a normal diesel engine fuel is injected at a static rate by a pump and common practice
is to optimise this pump to run at an optimal setting for the ideal injection time (Pakarinen 2007) The
energy efficiency potential is estimated between 01-05 on average 03 (ICCT 2011 IMO 2009)
Barriers Additional electronics can also introduce possibilities for failures However recent
advancements have increased the systems popularity19 There is a split incentive between vessel
19 httpwwwmarineinsightcommarinean-overview-of-common-rail-system-in-marine-engines
TRANL15371 6
owners who are responsible for investing in these technologies and vessel operators who are those
who compensate for the fuel consumption and benefit from such technologies (ICCT 2011)
Technical maturity This measure is available on the market (ICCT 2011) Payback time is short to
medium with an average of 5 years (IMO 2009 Crist 2009)
Applicability This measure is applicable to new and retrofit vessels It is applicable for tanker- bulk-
container- and Roro-ships (Crist 2009)
Auxiliary engines and systems
Based on our own estimation auxiliary engines improvement are not bringing gt2-4 energy savings
because auxiliary engines consume much less fuel than the main engine Similar measures as de-rating
for the main engines and common rail upgrade could be implemented for the auxiliary engine
Other options for improving auxiliary systems are speed control of pumps and fans control strategies
of cooling water systems room ventilation redesign of piping and instruments advanced computation
of airgas temperature distribution with reduced storage ventilation and with optimised ventilation
systems (DNV GL 2015)
Barriers There is a split incentive between vessel owners who are responsible for investing in these
technologies and vessel operators who are those who compensate for the fuel consumption and benefit
from such technologies (ICCT 2011)
Technical maturity This measure is available on the market (ICCT 2011) It is easy to apply and
uncomplicated in maintenance (DNV GL 2015) Payback time is short (DNV GL 2015)
Applicability This measure is applicable to all new and retrofit types of ships (DNV GL 2015)
Wind power
Wind power measures are available that can develop enough thrust to provide at least some supportive
propulsion Wind power can be utilised in various ways in shipping like traditional sails solid wing sails
Flettner-rotor and kits (see Figure 6) The techniques are currently used as supplementary power
(Brannigan et al 2009)
Figure 6 from left to right Kite (Cargill 2011) Flettner rotor (MIWB 2015) and solid sails (Wind Chellenger Project
HP 2015)
Solid wing sails are structured similar to aircraft wings which offer more thrust with less drag than
conventional sails Flettner rotors produce thrust from a rotating object in wind using the so-called
TRANL15371 7
Magnus effect The techniques have different characteristics with regards to how the thrust that is
produced relates to other factors such as wind strength wind angle wind stability and ship speed
(IMO 2009)
Towing kites vary from other concepts of wind power by having a small footprint during installation and
therefore being quite feasible to retrofit (Allenstroumlm 2013) Studies conducted at the Technical
University of Berlin indicated that the potential for sail energy has different prospective in the different
regions in the world Best scenarios exist in North Atlantic and North Pacific regions the South Pacific
seems a bit less potential The studies have shown that under normal circumstances the typical savings
using wind power may be 5 at 15 knots and up to 20 at 10 knots This study also revealed that
with optimal weather routing in the North Atlantic and given the best vessel with best sail type savings
can reach 15 percent at 15 knots and 44 at 10 knots (IMO 2009 Crist 2009) Nevertheless the
above figures should be considered indicative since practical experiences are limited Sail- and kite-
assisted power does seem to be a potential opportunity saving energy in the medium- and long-term
picture for shipping (IMO 2009) Christ estimates and average energy saving potential around 20
(2009)
Barriers There is a split incentive between vessel owners who are responsible for investing in these
technologies and vessel operators who are those who compensate for the fuel consumption and benefit
from such technologies (ICCT 2011) Although this technology can bring high energy savings the
investment is so high that there is not a short payback time
For solid wing sails complications could result in a need for masts to run down to the keel which can
be a bigger issue for retrofitting Additionally the presence of the mast and rigging could have significant
impacts on cargo handling (IMO 2009) Downside of the kite systems include the complex launch
recovery and control systems that are needed (IMO 2009)
Technical maturity This is still considered as experimental technology The technical barriers
identified above need to be tackled for this measure to be applied widely in the future Payback time is
estimated to be medium to long term (Allenstroumlm 2013 Crist 2009)
Applicability Wind power technologies are available and a number of cargo ships have been equipped
with wind engines to reduce demands from diesel engines (ICCT 2011) Kites can be used on ships
with a minimum length of 30m and works most energy efficient on ships with a typical speed not faster
than 16 knots Preferably tankers (crude oil product chemical LPG LNG other) and bulk carriers are
being considered as potential users due to this speed restriction (IMO 2011)
Control Systems Waste heat recovery
Waste heat recovery (WHR) technology can pass exhaust gases from a vessels engines through a heat
exchanger to generate steam for a turbine-driven generator The heat energy from the exhaust gas is
taken and transformed into electrical energy to reduce direct engine-fuel consumption for the
propulsion system or reduce auxiliary engine needs (ICCT 2011) Energy saving potential is estimated
between 6-10 on average 8 (Crist 2009 ICCT 2011)
TRANL15371 8
Figure 7 Efficiency of waste heat recover systems Sankey diagramme Even with high 50 efficiency of modern low-
speed engines there is still 50 of fuel input energy not being put to productive use The possibilities are illustrated
by this comparison of Sankey diagrammes for Waumlrtsilauml 12RT-flex96C engines without heat recovery (left) and with
high-efficiency waste heat recovery plant (right) showing in this case 114 gain in overall efficiency with WHR
(waste heat recovery) (WAumlRTSILAuml 2007)
Barriers Large capital investment requirements (around $5-6 million for a large container ship20) and
split incentive between ship owners and ship operators (ICCT 2011)
Technical maturity The technology is available on the market and has medium to long payback time
(WAumlRTSILAuml 2007 Crist 2009)
Applicability A WHR system is applied to vessels with a high production of waste heat and a high
intake of electricity WHR can be employed on ships with main engine average performance is higher
than 20000 kW and auxiliary engine average performance higher than 1000 kW This size
requirements limit the number of ships using this technology (IMO 2011) Generally it is applicable to
all ships types new and retrofit (Crist 2009)
Propellers and Rudders
Numerous devices have been designed for improving the energy consumption of vessels by recovering
as much as possible of this rotational energy in the flow from the propeller or to provide some pre-or
post-rotation of the in flow into and after the propeller to ensure best efficiency The most important
of these will be discussed in the following paragraphs (IMO 2009)
Ducted propeller (Kort Nozzle)
The accelerating ducted propeller consists of a screw propeller surrounded by a non-rotating duct
(nozzle) (Figure 8) Compared to the conventional propeller of the same diameter and thrust this
20 httpgcaptaincompower-exhaust-gas-paybacks-waste
TRANL15371 9
arrangement allows an increase inflow to the propeller improving the operating conditions around the
propeller and the ideal efficiency
Figure 8 Right photos of this Norwegian trawler (SetSail 2009)
The duct creates additional thrust load The potential for energy savings on relevant vessels range
between 1ndash20 (Crist 2009 IMO 2011 Barringhaus und Olds 1999 IMO 2009) whereupon 10 is a
good average value (IMO 2009 Crist 2009) The improvement of the combination of propeller and duct
overweigh negative effect of the increase water resistance caused by the duct
Barriers Since the duct has an optimal operational speed it does not work efficient at all speeds For
instance as drag increases with increasing speed eventually this will become larger than the added
thrust Therefore at high speeds ducts are typically not used (IMO 2009) The split incentive is a barrier
between ship owners (investor) and ship operators (gainer) as explained earlier (ICCT 2011)
Technical maturity Several standard designs are available on the market (IMO 2011) with a medium
payback time (IMO 2011)
Applicability Ducted propellers suits for vessels operating at high propeller loadings such as tankers
bulk carriers especially tugs and some offshore service ships The duct leads to increased friction but
at higher propeller loadings this is more than rewarded for by the positive effect of the combination of
propeller and duct (IMO 2009)
Contra-rotating propellers (CRP)
A rotating propeller induces a rotating motion in its backwash Normally this rotation energy of the
propeller gets lost The contra-rotating propeller is used in order to recover part of this energy (Figure
9) In a contra-rotating configuration two propellers are facing each other rotating in the opposite
direction with the aft propeller recuperating the turning energy in the wake from the forward propeller
(IMO 2011) To avoid complications with cavitation the aft propeller usually has a smaller diameter
than the front propeller Contra-rotating propeller arrangements involve a short shaft line and for that
reason primarily suitable for vessels with single-screw
TRANL15371 10
Figure 9 Left conventional propeller Right contra-rotating propeller The working principle is simple and effective
the power is split in a forward and aft propeller which through the different direction of rotation cancel out the
rotational energy losses behind the propeller (WAumlRTSILAuml 2009)
Potential savings of such measures are assessed to be in the order of 6ndash20 of the power consumption
with an average of 13 although higher figures may be presented by industry for specific cases Two
different full-scale measurements reported gains of 15 and 16 (IMO 2009 Crist 2009)
Barriers The mechanical installation of contra-rotating shafts is complicated and requires more
maintenance (IMO 2011) The split incentive between ship owners (investor) and ship operators
(gainer) is a barrier as explained above Although this technology can bring high energy savings the
investment is so high that there is not a short payback time
Technical maturity The technique is available on the market but problems with gearboxes for
contra-rotating propellers have been reported as well as operational problems with mounting (IMO
2009 IMO 2011) Payback time is reported as short (WAumlRTSILAuml 2009) but also as medium-long with
about ~15-20 years (Shuto 2010)
Applicability The technology is particularly beneficial for rather heavily loaded propellers as for
example very fast cargo vessels like Ro-Ro ships or for container ships (IMO 2011 Crist 2009) Contra-
rotating propellers need a short shaft line and hence mainly suited to single-screw ships (IMO 2011)
Contra-rotating propellers can be implemented as retrofit but it is more likely implemented in new
built ships due to the complicated mechanical installation (Crist 2009)
Post swirl devises
A number of different techniques belong to the post swirl category Several of them contain
modifications to the rudder or propeller (IMO 2009) Depending on vessel type and operational field
various power saving measures can be mounted to optimise water velocity distribution to the propeller
and to minimise slipstream losses due to swirl in the outflow of a propeller The most important among
these measures may be additional thrusting fins at the rudder twisted rudder (Figure 12) rudder-
bulb-systems with fins (Figure 13) and fins on the propeller fairwater also called post swirl fins or
boss cap fins (Figure 10)
Generally post swirl measures reported 1-8 energy efficiency (test models) Even 8-9 energy
efficiency from full-scale measurements for additional thrusting fins at the rudder Payback time is
estimated to be short to medium post swirl devices (DNV GL 2015 Crist 2009 ICCT 2011) Some of
CRP FOR BETTER PROPULSION EFFICIENCY
CONVENTIONAL PROPULSION
TRANL15371 11
the post swirl measure can be combined A good overview is given in Nielsen et al (Combined Kappel
propeller and rudder bulb system for improved propulsion efficiency not dated)
3431 Post swirl fins
The post swirl fins (Figure 10) can recover energy loss of propeller hub vortex in the propeller backward
flow and can lead to 3-5 energy saving on average 4 operating at the same speed (MOL 2011
Barringhaus und Olds 1999 Hansen Dinham-Peren und Nojiri 2011 ICCT 2011)
Figure 10 Example the post swirl fins or propeller boss cap fins (gcaptain 2012)
Barriers It is simple and straightforward measure requiring only the removal of the propeller boss
caps and replacement with the post swirl fins (no hull modification is needed) (Hansen Dinham-Peren
und Nojiri 2011 MOL 2011) However there is a split incentive between ship owners (investor) and
ship operators (gainer) as explained above
Technical maturity The technique is available on the market In 2013 post swirl fins were applied
to over 2500 ships worldwide (MOL 2011) Further advantages of the post swirl fins are reduction in
propeller torque reduced vibration in the stern and less underwater noise and reduced rudder erosion
(MOL 2011) A payback time of 6 months was estimated for 4 efficiency improvement at $600tonne
oil price (Hansen Dinham-Peren und Nojiri 2011) The investment is considered to be low21
Applicability The technique is effective for all screw propellers irrespective of the type or hull form
of the ship Has been tested on large-scale container vessels (MOL 2011 Hansen Dinham-Peren und
Nojiri 2011)
3432 Free rotating wheels
A vane wheel (Grim wheel) is a freely spinning propeller mounted behind the main smaller propeller
(see Figure 11 for example of use on retrofit Queen Elisabeth II in 1986) The vane wheel has a bigger
diameter than the main propeller and increases the propeller diameter The small propeller drives the
freely revolving vane wheel fitted on the wake The inner part of the vane wheel acts as a turbine and
the outer part as an ldquoadditionalrdquo propeller
21 httpgcaptaincompropeller-technology-ship-efficient
TRANL15371 12
Figure 11 Example for a grim vane wheel (Boat design 2007)
This leads to a substantial recovery of the rotational energy The energy saving potential is reported to
be 10 (Brannigan et al 2009) It is stated that the important benefit of the vane wheel is that a
smaller impulsion propeller can be installed which consumes less energy The vane wheel gives a
suitable energy improvement for cargo ships (IMO 2009 Schneekluth und Bertram 1998) and has short
payback time It is also stated that if there is room for a vane wheel in the aft there is also space for
an impulsion propeller of larger diameter leading about the same energy saving potential as the
combination of a small impulsion propeller and a vane wheel (IMO 2009)
Barriers A barrier is the split incentive between vessel owners who are responsible for investing in
these technologies and vessel operators who are those who compensate for the fuel consumption and
benefit from such technologies
Technical maturity Limited application Vane wheels are subjected to strong fluctuations in loading
Problems with the strength of the blades have been encountered frequently (for example the vane
wheels on the Queen Elisabeth II were short lived and not used after22)The payback time is estimated
to be short
Applicability The technique is effective for all screw propellers irrespective of the type or hull form
of the ship both for new and existing ships (Chen Reed und Kim 1989) Recommended for all ship
types except ferry and cruises because of their problem with strong fluctuations in loading as
mentioned above23 (IMO 2009)
3433 Twisted rudder
Rudders can play a significant role of extra frictional resistance Rudders are located in the backwash
of a propeller and rotational energy will act on the rudder Because of these effects the rudder gives
prospects of efficiency gains (Schulze 2007)
22 httpwwwroblightbodycomlinersqe-21987_Refitindexhtm 23 httpwwwroblightbodycomlinersqe-21987_Refitindexhtm
TRANL15371 13
Figure 12 Schematic capture of twisted rudder (Nakashima 2015)
Twisted leading edge technology provides multiple benefits for high-speed vessels compared to
conventional rudder designs Conventional rudders are located behind the propeller with the rudder
profile arranged symmetrically about the vertical rudder centre plane This arrangement does not
consider the fact that the propeller induces a strong rotational flow that strikes on the rudder blade
This consequences in areas of low force on the blade that induce cavitation and associated erosion
problems (Becker Marine System 2015 Schulze 2007)
The twisted rudder is horizontally twisted on the lower and upper side of the segment that is an
extension of the propeller shaft (Figure 12) This decreases cavitation rudder and improves
manoeuvrability of the vessel (Schulze 2007) Twisted rudder types lead to energy efficiency
improvements by approximately 2-4 on average 3 for large-size high-speed vessels (Hollenbach
und Friesch not dated Nakashima 2015)
Barriers Work needs to be done in the dry dock this is not regularly happening for existing ships
(Hochkirch und Bertram not dated) There is a split incentive between vessel owners who are
responsible for investing in these technologies and vessel operators who are those who compensate
for the fuel consumption and benefit from such technologies (ICCT 2011)
Technical maturity This rudder type is a commercially used technology and easy to apply if the ship
is in the dry dock (ICCT 2011)The payback time is estimated to be short to medium (Rolls-Royce 2014
Crist 2009)
Applicability Twisted rudder can used by container vessels reefers Ro-Pax ferries cruise ships and
naval vessels In South Korea this type of rudder is recognised as a standard rudder for large-size
high-speed container carriers (Nakashima 2015)
TRANL15371 14
3434 Rudder bulb
Figure 13 Example for a rudder bulb Kawasaki RBS-F rudder bulb systems with fins (Kawasaki 2015)
The rudder bulb brings smooth inflows from the propeller and can reduce the drag of the rudder The
rudder fins produce thrusts in the rotational flows generated by the propeller (Figure 13) Rudder bulb
measure can improve energy efficiency by 2-5 (Nielsen et al not dated Becker Marine System not
dated) on average 4 (Crist 2009)
Barriers The work needs to be done in the dry dock this is not regularly happening for existing ships
There is a split incentive between vessel owners who are responsible for investing in these technologies
and vessel operators who are those who compensate for the fuel consumption and benefit from such
technologies (ICCT 2011)
Technical maturity The technology is a commercially used technology and easy to apply while the
ship is in the dry dock (Kawasaki 2015) Payback time is estimated to be medium (Crist 2009)
Applicability For new and retrofit tanker- bulk- container- and Roro-ships with a propeller and
rudder (Crist 2009)
TRANL15371 15
Barriers to the transfer and uptake of energy
efficiency technologies for ships and possible
measures to overcome them
Although there are ways to reduce emissions (Chapter 3) and also drivers working towards the
implementation of such measures there are significant barriers to acting on cost-effective opportunities
in the maritime industry This is often referred to as barriers to energy or the energy efficiency gap
(Michele Acciaro 2013) (Sepideh Jafarzadeh 2014) (OECD 2014) Some barriers are shared with other
industries while others are unique to the maritime industry Furthermore many of these barriers are
not specific to the EEDI and the SEEMP but apply to any rule under MARPOL These barriers can exist
on both the supply and the demand side For example there could be barriers to the development and
implementation of measures that reduce CO2 emissions from ships and barriers to the expression of
demand for these measures (ECORYS 2012) Studies have however shown that there are relatively
few barriers related to the development of new technologies or access to related intellectual property
rights by the main shipbuilding nations and that the supply of measures exceeds the demand (ECORYS
2012) Existing studies on barriers to energy efficiency thus focus on what prevents the uptake of
available measures
This section presents an overview of the main barriers to the transfer and uptake of energy efficiency
technologies in the shipping industry and discusses potential ways of overcoming them
Preliminary assessments of technology transfer and financial needs by both workshop participants and
the IMO Ad Hoc Expert Working Group on Facilitation of Transfer of Technology for Ships (AHEWG-TT)
have suggested that the type of assistance needed by Port State and Flag State administrations will be
of a different nature than that required by shipbuilders and owners Our assessment above has shown
that the shipbuilding industry is expected to need less assistance than Port States and Flag States
In the next table we list a summary of the main barriers and the stakeholders concerned in the main
categories as identified by AHEWG-TT as well as the possible measures that could help overcome these
barriers The possible measures to overcome the barriers are further detailed in the sections below
Related costs are estimated in a separate section in order to minimise overlap
TRANL15371 16
Table 2 Summary of main barriers relevant stakeholders and possible measures to overcome them
Barrier Stakeholders Measures forward
Lack of awareness
(administrative and industry)
a MARPOL in general MARPOL Annex
VI EEDI and SEEMP in particular
b Available energy efficiency
technologies
Flag and Port
States
Ship owners
Capacity building
- Workshops
- Trainings
Model course for training
Inventory
Platform for information access and
sharing
Agreements between industry and
administrations
Technology concerns
a Lack of or limited technology supply
chain in some states
b Lack of technology base for RampD in
some states
c Lack of trust (in ability to reduce
emissions in ability to reduce
operational costs in compatibility
with other measures)
Ship owners
Investors
Increase cooperation in ship design
and building
Increased interaction between
industry and educationalRampD
institutes
Establish platform to share
expertiseexperience
Provide special investment or
guarantee funds
Institutional concerns
a Increased administrative burden
1Revision and amendment of existing legislation
2Implement Port and Flag State obligations
b Limited technical capacity in state institutions to implement
c Lack of financial resources for additional compliance and enforcement activities by maritime administrations
Flag States
Port States
Promote increased cooperation and
communication between
administrationswithin regional
administrations
Regional information workshops for
Port and Flag States
Establish platform to share regulatory
experience
Development aid
Commercial
a Increased costs for ship owners to
take up energy efficient technologies
b Lack of motivation of owners to take
up energy efficient technologies (split
incentive)
Ship owners
Financiers
Special EE funds
Smart contracts
TRANL15371 17
Awareness Raising
Barriers Lack of Awareness
The need to create awareness among Flag States Port States and ship owners of the requirements of
Annex VI in general and Chapter 4 in particular was highlighted by participants of the workshop and
emphasised by the AHEWG-TT The level of awareness in the various regions and even in the countries
within the regions differed considerably The AHEWG-TT further suggests it would be beneficial to
undertake an initial evaluation of knowledge needs (gap analysis) in order to ensure workshops and
other awareness-raising activities are appropriately tailored24
Furthermore ship-owners are not always aware of the energy efficiency technologies available on the
market or which operational measures can be implemented to save fuel Ship owners can be companies
people and investment funds Especially private equity groups tend to focus more on short term looking
for quick profit while traditional ship owners tend to hold the ship for at least 20 years25
Measures forward
Though Flag States and Port States should already have implemented measures to ensure that Energy
Efficiency Design Index (EEDI) and Ship Energy Efficiency Management Plan (SEEMP) requirements are
complied with both public administrations and industry representatives could benefit from additional
trainingcapacity building and platforms to share experiencesreceive information with regards the
practicalities of these regulations and available energy efficiency technologies The needs for each
group can be determined through a gap-analysis which we recommend to be carried out by an
independent consultant in cooperation with the flag and port states Once the specific needs for each
group have been determined they can be addressed through the following awareness raising
measures
Capacity Building (workshops trainings)
Workshopstrainings could be organised where formal training is combined with open discussions where
experiences could be shared just within one stakeholder group or between educational institutes
auditors operational managers of ships shipbuilders and authorities Such trainingsworkshops could
focus on just one or all aspects relating to the applicable rules available energy efficiency measures or
assessment methods of technologies (eg training in calculating and verifying EEDI and SEEMP
including development of tools to calculate EEDI and SEEMP) Trainingsworkshops can be local or
regional Sending people physically to regional workshops is generally more conductive to networking
and experience sharing but less adapted to the local situation and more costly
To reduce the costs of training and ensure a certain level of training the IMO or other qualified
international partners (eg WMU) could develop model courses for training In order to better
understand the rules and regulations in detail people use the help of trainers to better understand the
elements that are important for them and to gain experience in doing calculations and other required
24 Ad Hoc Expert Working Group on Facilitation of Transfer of Technology for Ships 2nd Meeting 25 httpwwwftcomcmss0dadcb240-3d97-11e3-b754-00144feab7dehtmlaxzz3aqC3tmNu
TRANL15371 18
activities by the regulations Trainers have to develop their courses and earn back their investments
via trainings Since the trainers are doing this simultaneous it would be more efficient if there would
be a model course available that can easily be tailored to the audience This would reduce the costs for
the development of trainings and would also ensure that the trainers provide the same level of depth
in their trainings Since the IMO is responsible for the rules and regulations it would be the logical
responsible for the efficient implementation and therefore could take the initiative for developing model
courses
Information Sharing
Inventory of energy-efficiency technologies (for example the IMO-GEF-UNDP project) Many
studies and overviews on the internet are available The quality and the scope is often
different
Improved access to information and information sharing with international recognised
organisations including relevant survey and certification training One example of
establishing information sharing between governments is the work of the OECD Council
Working Party on Shipbuilding (WP6)26 which organises regular workshops aimed at
facilitating the exchange of information on policy and industry developments
Note that many of these measures overlap with the measures required to overcome institutional
barriers as laid out in section 43
Agreements between industry and administrations could be envisaged to overcome the
barriers
In order to enhance the sharing of expertise for both administrations and industry technology transfer
and technology cooperation agreements could be formulated in order to strengthen the cooperation
As identified before the technology transfer to the ship building industry is not a mayor barrier so the
agreements should help the administrations to become more aware of the possibilities to further
promote the implementation of MARPOL Annex VI
Typical agreements between industry and administrations could be in the form of initiatives like the
Sustainable Shipping Initiative (SSI) SSI members have developed a vision for a sustainable shipping
industry in 2040 They commit to working towards this in all their own operations andor activities that
involve shipping and in all their dealings with and support for the shipping industry to make their vision
a global reality by 2040 SSI members of over 19 companies represent ship owners and charterers
shipbuilders engineers and service providers banking insurance and classification societies The SSI
explored for instance how to overcome barriers to the uptake of new technologies and techniques which
improve the operational efficiency of ships potentially delivering energy efficiency savings of 10 or
more and payback periods of less than 5 years They also produce case studies to show good examples
and also develop tools By involving administrations in these kind of initiatives (even free of charge)
they could be actively supported with knowledge about sustainable shipping
26 httpwwwoecdorgstiindworkshopongreengrowthinshipbuildinghtm
TRANL15371 19
Technology Concerns
Barriers Technology Concerns
One of key barriers to the implementation of energy efficient technologies (new and retrofit) relates to
the lack of or limited technology supply chain Furthermore the lack of a technology base for RampD in
some states is a barrier Also the existence of concerns relating to the ability of available energy
efficiency measures to reduce emissions and operational costs and their compatibility with other
measures of energy efficient technologies is a barrier This is typically the problem in very isolated ship
yards
Measures forward
Very successful shipyards (Japan and Korea) have already since many years a large number of
licencing technology transfer and similar agreements and continuously exchange information with
competitors in and outside their countries For instance US shipyards have adopted this methodology
since the 1980s (office of technology assessment 1983)
Further technology sharing could be stimulated through educationalRampD institutes locally regionally
or globally in ship design and building The technology will be transferred to the ship builders once the
students start working there or through cooperation between industry and university In order to
facilitate this we recommend the establishment of partnerships to share expertiseexperience
Typically individuals who know both worlds are the driving force behind successful partnerships (AISBL
2012) These partnerships are built around a shared long term research vision Many partners could
contribute (eg financially) in order to establish the responsible management and research programme
The target of the platform could be for example to provide verified information on real-world energy
efficiency improvements via a monitoring programme
For example in order to stimulate the deployment of energy efficient trucks the Dutch government
provides a website to share audited knowledge and data on about 15 energy efficiency technologies27
Additionally climate financing could be leveraged to reduce the investment risk in unproven
technologies For example IMO Member States could create a demonstration fund that can function as
a guarantee for investments in new and immature technologies28 Similarly investment guarantees
can be provided by funds in the same way governments provide export credits to their companies If
the technology does not deliver the expected fuel-savings the fund can cover the difference and hence
reduce investment uncertainty The main objective being to reduce investment risk
Institutional Concerns
Barriers
27 httpwwwtruckvandetoekomstnl 28 An example of a specific EE fund is httpwwweeefeueligible-investmentshtml
TRANL15371 20
For Flag and Port States complying with new regulations of IMO and EEDI and SEEMP particularly
represent and increased administrative burden It requires revisions and amendments of existing
legislation that need to be implemented at Port and Flag State functions There is currently limited
technical capacity in state institutions to implement these changes especially in developing countries
with a relatively low number of ships under their flag
The lack of financial resources is also a barrier for additional compliance and enforcement activities by
maritime administrations This is particularly an issue for least developed countries and small
developing island states Implementation costs are relatively higher for small Flag States because of
limited abilitycapacity to implement new technical regulations Note that this issue is not specific to
the EEDI and the SEEMP but to most regulatory measures (maritime or other)
Measures forward
Measures to assist states in implementing (existing and new) legislation include
Promote an increased cooperation and communication between administrationswithin
regional administrations of Port and Flag States similarly to what has been suggested in
sections 41 (Awareness raising through capacity building activities such as workshops) and
42 (Establish platform to share regulatory expertiseexperience) Platforms could be
managed by IMO in conjunction with industry and development funds in order to share the
costs as this has been done before for GloBallast for example In that case the IMO is in the
lead (executing agency) but the platform is supporting the collaboration with many
stakeholdersfunding partners The goal of the programme is to assist developing countries
eg via e-learning courses
In addition deterrents need to be put in place to discourage Flag States from performing
substandard inspections A system for detecting sub-standard inspections should be
implemented whereby mandatory Port State Control inspections are carried out in close
proximity to mandatory Flag State inspections (ie the Flag State inspection is carried out
prior to the ship leaving port and the Port State inspection is carried out upon arrival at port)
The two inspections should be carried out under a uniform mandatory checklist The IMO
should monitor inspections and investigate where discrepancies between inspections close in
proximity are detected If a Flag or Port State is found to have failed to meet the requisite
inspection standards penalties in the form of substantial fines should follow
In order to overcome the financial barriers financial assistance to states could help with
capacity building and implementation Financial resources are not only needed in the
implementation of the new regulations (training of government experts) but governments of
Flag States also need to be involved continuously in the ongoing discussion around
developments new EEDI targets for 2020 and beyond which requires continuous availability
of experts to represent the interests of the state (Metselaar 2015) Financial aid can therefore
be supplied in the following forms
Increased financial support for compliance and enforcement activities by maritime
administrations
Financial support could be provided to Flag States so that they have the resources to
properly carry out vessel inspections Consideration should be given to the introduction of
TRANL15371 21
an International Fund Convention set up for this purpose and contributed to by Port
States andor their major oil and other cargo exporters and importers
Commercial
Barriers
Private parties such as ship owners and investors are not always commercially incentivised to make
investments in energy efficiency measures This can be due to the split incentives between owner (who
should make the investment) and charterer (who reaps the cost savings) of a ship (see paragraph 25)
Furthermore access to finance can be problematic for smaller players who operate in niche markets
Measures
Bottlenecks in financing private investments and new financing mechanisms could be addressed during
regional or international workshops that include traditional and new financiers that could finance
investments in energy efficiency technologies
One solution that has been brought forward to address the problem of split incentives is the use of
lsquosmart contractsrsquo (Michele Acciaro 2013) The idea is to change charter contracts in a way that risks
and benefits are shared among charterers and ship owners In such contracts speed choice is more
flexible and the chartering cost of vessels is closer to fuel cost as such ship owners get motivated to
invest in energy-efficient technologies and charterers get stimulated to run vessels in an energy
conserving manner
With respect to the shipbuilding industry the following could facilitate the transfer of technology as
well
Financial assistance to shipyards to be provided at the national level or through other
arrangements
Foreign direct investment in software and hardware as an innovative way to support industry
in implementing the requirements
One type of incentive that governments can provide to enhance industry performance and technology
adoption is a competition for top performers Governments could contribute to a fund from which
money is distributed to the top 10 of best performers in a particular year
Cost estimates
Workshops and training
Capacity building workshops for administrations are estimated at euro 1000 per attendee for an
online workshop (1-2 days) Costs for the organisation of such workshops would include expert fees
and administrative costs These costs could be lower if the course material is already developed
(model workshops) Eg 2 attendees per Flag State for the ten most important Flag States
TRANL15371 22
(covering 74 of total fleet tonnage) comes down to euro 20000 or less in case the courseware is
already existent
A situation that is more conductive to networking and experience sharing is to send people physically
to regional workshops The costs of such workshops including participants travel and hotels for 50
participants would be between euro20000 - euro100000 per workshop based on our international
experience with organising workshops in the field of renewable energy and energy efficiency Costs
could be lower depending on the amount of preparation required cost of location (could be sponsored
by participating states)
Technical training
Trainings already exist for calculating and verifying EEDI including development of tools to calculate
EEDI For example MARIN offers 32h courses over 5 days in the Netherlands for euro 5000 per attendee
(excluding travel and accommodation)29 Lloyds offers similar trainings for similar costs30
Model courses for training may need to be updated depending on identified needs Ecofys estimates
the update of eg an existing EEDI model courses to cost in the order of euro 50000
Online platform for inventory of energy efficiency technologies
Inventories of energy-efficiency technologies already exist (for example in reports like (IMO 2009) and
on websites of for instance DNV-GL the efficiency finder31) but they could be further developed since
the websites are either not independent or incomplete
In order to facilitate information exchange a web-based platform could be established The role of the
platform would be for example to provide verified information on real-world energy efficiency
improvements via a monitoring programme For example in order to stimulate the deployment of
energy efficient trucks the Dutch government provides a website to share audited knowledge and data
on about 15 energy efficiency technologies32 The costs of such a website and corresponding
programme are estimated to be around euro 2 million for a 4 year period Furthermore a platform can be
used to inspire others by showing best practices and can be used for sharing of information regarding
network opportunities like conferences and seminars
Capacity building project
Currently the IMO-GEF-UNDP GloBallast project is a capacity building project it assists developing
countries and their maritime industries in implementing international regulations on ballast water
29 httpwwwmarinnlwebEventsCoursesSpecialist-Course-on-Ship-propulsion-model-tests-and-SpeedPower-trials-for-EEDI-Verifiers-
2731-October-2014htm 30 httpwwwlloydslistcomllsectorship-operationsarticle422262ece 31 httpswwwdnvglcommaritimeenergy-efficiencyefficiency-finderhtml 32 httpwwwtruckvandetoekomstnl
TRANL15371 23
management and preventing risks arising from the transfer of harmful aquatic organisms And has
several aspects that could also be used for knowledge transfer of energy efficiency measures
web-site
e-learning course
databasesdirectories
library collections
newsletter
Regional Task Force (RTFs) to support development and adoption of a regional approach
Develop and implement communication education awareness raising and outreach
programme
Develop introductory and more specialised training packages
Develop model legislations
The total budget for the 2008-2012 period was US$23 million out of which US$564 million represents
a GEF grant the rest being mostly in-kind contributions from the participating countries regional co-
ordinating organisations (RCO) and strategic partners including the private sector
Improved access to information and information sharing with international recognised organisations
including relevant survey and certification training would further promote the different technologies
TRANL15371 24
Conclusions
This study provides an overview of existing technologies which could drastically improve the energy
efficiency of ships Furthermore barriers to transfer and uptake of energy efficient technologies are
analysed and categorised and implications of these barriers are listed in order to facilitate the uptake
of energy efficiency technologies for ships
From this research it is clear that conventional technology is available that can cost-effectively (with a
payback time of less than 15 years) achieve high efficiency gains If the maximum gains per category
are added up (for all but ferry and cruise) this would mean a total efficiency improvement of 35
Even without taking two experimental technologies with potentially high efficiency gains into account
(wind power and air lubrication)
High investments like wind power and contra rotating propellers bring the highest savings (13 ndash 20)
The medium investments are in-between (5-10) and the low investments only bring relatively small
energy efficiency improvements (lt5)
When the ship owner has too few opportunities to share investment with charterers this leads to a split
incentive a ship owner may invest the up-front capital to put in energy-efficient technology but not
receive the benefits This is typically a problem for investments with a high payback time ie the wind
power and contra rotating propellers
The main barriers are related to the transfer of technology to Flag States Flag States are generally
third world and developing nations that often do not have the resources to enforce investigate or
prosecute breaches by their flagged vessels
Several ways to overcome the knowledge transfer barriers were presented that can be categorised as
follows
Workshops and trainings
o Capacity building workshops for administrations
o Regional workshops
Technical training
o Training in calculating and verifying the EEDI
o Development of model courses
Online platform
o Inventory of energy-efficiency technologies
o Creation of a website with all relevant information for the target audience
o Improved access to information and information sharing
o Provide verified information on real-world energy efficiency improvements via a
monitoring programme
TRANL15371 25
The most expensive of the capacity building actions is the capacity building project which takes all
aspects above into account If a project would be developed for knowledge transfer regarding energy
efficiency measures similar to GloBallast which assists developing countries and their maritime
industries in implementing international regulations on ballast water management and preventing risks
arising from the transfer of harmful aquatic organisms the total budget needed would be in the order
of US$23 million for a period of 5 years
TRANL15371 26
References
JFE Group 2013 ldquoJapan Marine Unitedrdquo JFE Group Overview JFE Group AISBL 2012 Making Industry-University partnerships work lessons from succesful collaborations
report Belgium AISBL
Allenstroumlm Bjoumlrn 2013 ldquoWind propulsionrdquo SSPA Sweden AB Gothenburg EffShip March
Aqorau T 2000 Illegal Unreported and Unregulated Fishing Considerations for Developing
Countries paper Honiara Solomon Islands South Pacific Forum Fisheries Agency
BALance 2014 Competitive position and future opportunities of the Euroean Marine Supplies
industry BALance Technology Consulting
Barringhaus David and Robert Olds 1999 OLDS ENGINEERING Maximizing Propulsion Efficiency
Marine Division Accessed Februrar 2015
httpwwwoldscomaumarinemaximizing_propulsion_efficiency
Becker Marine System not dated Becker Bulb Rudders httpwwwbecker-marine-
systemscom05_downloadszzpdfproduct_pdfBecker_Bulb_Rudderspdf Becker Marine
System
mdash 2015 Twisted Full Spade Rudder Accessed Feb 2015 httpbecker-marine-
systemscom03_productsproducts_twisted_full_spadehtml
Bloomberg 2014 China Loses Shipbuilding Crown to South Korea Chart of the Day 9th December
httpwwwbusinessweekcomnews2014-12-09china-loses-shipbuilding-crown-to-south-
korea-chart-of-the-day
Bluebird-Electric 2014 Sipbuilding post World War Two httpwwwbluebird-
electricnetship_boat_design_buildingshipbuilders_ship_repairers_associationhtm
Boat design 2007 Accessed Feb 2015
httpwwwboatdesignnetforumsattachmentspropulsion16743d1193341389-new-
propulsion-sytems-ships-grim-prop-1jpg
Brannigan Paschos Eyers and Wood 2009 Report on International avialtion and Mritime Emissions
in a Copenhagen (post 2012) Agreement Oxfordshire AEA Group
Chen Benjamin Arthur Reed and Ki-Han Kim 1989 A Vane-Wheel Propulsor for a Research and
Development Report Newport David Taylor Research Center
CNSS 2015 Clean North Sea Shipping - Clean Shipping Technology Accessed Februar 2015
httpcleantechcnssnoghg-technologiestechnical-measuresmeasures-related-to-the-hull
Crist Philippe 2009 Greenhouse gas emissions reduction potential from international shipping
Working paper OECD
Daily Times 2015 Nigeria Turkey seek collaboration on ships shipyards 5th January
httpwwwdailytimescomngarticlenigeria-turkey-seek-collaboration-ships-shipyards
Dillingham Gerald L 2000 Progress Made to Reduce Marine Pollution by Cruise Ships but Important
Issues Remain GAO report Washington United States General Accounting Office
DK Group 2015 Silverstream technologies January Accessed January 2015 httpdkgroupeu
DNV 2014 Encouraging Construction and Operation of Green Ships OECD
httpwwwoecdorgstiindC-WP6(2013)12-FINAL-ENGpdf
TRANL15371 27
DNV GL 2015 EFFICIENCY FINDER Accessed Feb 2015 httpwwwdnvglcommaritimeenhance-
performanceefficiency-finderaspx
Ecorys 2012 ldquoGreen growth opportunities in the EU shipbuilding sectorrdquo
ECOSPEED 2015 EUROPEAN MARINE amp MACHINERY AGENCIES LTD Accessed February 2015
httpwwweuropeanmarinecoukECOSPEEDhtm
gcaptain 2012 gcaptain - Propeller Technology to Make Your Ship More Efficient - Accessed Feb
2015 httpgcaptaincompropeller-technology-ship-efficient
Hansen Dinham-Peren and Nojiri 2011 Model and Full Scale Evaluation of a lsquoPropeller Boss Cap
FinsrsquoDevice Fitted to an Aframax Tanker Second International Symposium on Marine
Propulsors smprsquo11 Hamburg Germany June 2011
Hellenic Shipping News 2014 Korean ships sell at fuel-saving premium 22nd December
httpwwwhellenicshippingnewscomkorean-ships-sell-at-fuel-saving-premium
Hindawi 2015 Hindawi Puplishing Cooperation Accessed February 2015
httpwwwhindawicomjournalsijrm2012474785fig4
Hochkirch Karsten and Volker Bertram not dated ldquoSlow Steaming Bulbous Bow Optimization for a
Large Containershiprdquo Accessed Februar 2015 http2021148960resourcepdf5096pdf
Hollenbach Uwe and Juumlrgen Friesch not dated Efficient hull forms ndash What can be gained
Conference ship-efficiency Hamburg 2013 Hamburg HSVA Hamburgische Schiffbau-
Versuchsanstalt GmbH HamburgGermany
ICCT 2011 Reduce Greenhouse Gas Emissions from Ships - Cost Effectiveness of Available options -
white paper Washington DC International Council on Clean transportation (ICCT)
IMO 2011 REDUCTION OF GHG EMISSIONS FROM SHIPS Marginal Abatement Costs and Cost
Effectiveness of Energy-Efficiency Measures Submitted by the Institute of Marine Engineering
Science and Technology (IMarEST) MEPC 62INF7 International Maritime Organisation
IMO 2009 Second IMO GHG Study 2009 London International Maritime Organisation
JSEA 2006 ldquoImproved propulsive performance - Universal applies new energy-saving type Leadge
Bowrdquo Japan Ship Exports Association (JSEA) httpwwwjseaorjpVariableJSea318pdf
Kawasaki 2015 Energy-saving Technology Accessed Feb 2015
httpswwwkhicojpenglishshiptechconservationindexhtml
Leddy Fiona Jayne 2012 ldquoA critical legal analysis of International Shipping in Australian Waters and
the risk of ship-based oil pollutionrdquo Queensland Environmental Practice Reporter vol 17
Marinelog 2014 China white lists 51 shipyards 4 September
httpwwwmarinelogcomindexphpoption=com_k2ampview=itemampid=7667china-white-
lists-51-shipyardsampItemid=231
Metselaar Kees interview by Arno van den Bos 2015 Policy officer at directorate maritime affairs of
ministry of Intrastructure and Environment (February)
Michele Acciaro Peter Nyegaard Hoffmann Magnus Strandmyr Eide 2013 ldquoThe Energy Efficiency
Gap in the Maritime Transportrdquo Journal of Shipping and Ocean Engineering 1-9
MIWB 2015 Maritiem Instituut Willem Barentsz Accessed Feb 2015
httpsmijnmiwbnlnieuwsbriefindexphpdo=showampid_artikel=116
MOL 2011 Energy-Saving Propeller Boss Cap Fins System Reaches Major Milestone - Orders
Received for 2000 Vessels Accessed Feb 2015
httpwwwmolcojpenpr20111145html
TRANL15371 28
Motorship 2014 Gas fuelled ships into the future 31 10 httpwwwmotorshipcomnews101ships-
and-shipyardsgas-fuelled-ships-into-the-future
Nakashima 2015 Nakashima propeller CO LTD Accessed Feb 2015
httpwwwnakashimacojpengproductrudderhtml
Nielsen Shin Lundgren and Faghani not dated Combined Kappel propeller and rudder bulb system
for improved propulsion efficiency Frederikshavn MAN Diesel amp Turbo
OECD 2014 The OECD Council Working Party on Shipbuilding
httpwwwoecdorgindustryindshipbuildinghtm
OECD 2011 ldquoThe Shipbuilding Industry in Turkeyrdquo
office of technology assessment 1983 An Assessment of Maritime Technology and Trade report
Washington DC US Congress
Pakarinen Risto 2007 ldquoNothing common about common railrdquo Twentyfour7 (Twentyfour7) 64-65
Ports amp Ships 2015 Ports and Ships Accessed February 2015
httpportscozanewsarticle_2007_10_17_4038html
Rolls-Royce 2014 Propulsors - Moving your business in the right direction httpwwwrolls-
roycecom~mediaFilesRRolls-Roycedocumentscustomersmarinepropulsion-2014-
tcm92-8664pdf Aalesund Rolls-Royce Commercial Marine httpwwwrolls-
roycecom~mediaFilesRRolls-Roycedocumentscustomersmarinepromaspdf
Schneekluth H and V Bertram 1998 Ship Design for Efficiency and Economy Oxford
Butterworth-Heinemann
Schulze Reinhard 2007 Twisted Rudder - Extreme Design 14 SVA-Forum bdquo Ruder in Theorie und
Praxisldquo Potsdam 7 November 2007 Potsdam Schiffbau-Versuchsanstalt Potsdam GmbH
Selenetrawlers 2015 Selenetrawlers Accessed February 2015
httpwwwselenetrawlerscomcompanydesign-notes
Sepideh Jafarzadeh Ingrid Bouwer Utne 2014 ldquoA framework to bridge the energy efficiency gap in
shippinrdquo Energy 603-612
SetSail 2009 SetSail Accessed February 2015 httpwwwsetsailcomprop-nozzle-comments-by-
an-expert
Shuto Hideki 2010 Super Eco Inland Vessels httpwwwccr-
zkrorgtempwrshp120411Presentations2_04_HShuto_enpdf IHI Marine United Inc
Silberschmidt Noah 2014 ldquoGenerating efficiencies from thin airrdquo SMM Green shipping | Efficiency
httpwwwsilverstream-techcomwp-contentuploads201404HANSA-241112pdf
httpwwwsilverstream-techcomwp-contentuploads201404HANSA-241112pdf
Skinner Ian 2009 EU Tranport GHG Routes to 2050 Technical options for maritime and inland
shipping httpwwweutransportghg2050eucmsassetsTechnical-options-maritime-inland-
waterpdf Brussel European Commission
Statista 2015 ldquoLargest shipbuilding nations in 2013 based on completions in gross tonnagerdquo
httpwwwstatistacomstatistics263895shipbuilding-nations-worldwide-by-cgt
UK DfT 2014 ldquoDfT Port Statistics - World fleet registered trading vessels of 100 gross tons and over
gross tonnage on selected registers 1999-2013rdquo
httpswwwgovukgovernmentcollectionsmaritime-and-shipping-statisticsdata-tables-
associated-with-this-series
TRANL15371 29
Voorham 2013 Assessment of sustainable investment in shipping Master Thesis
Report SDPO13029m Delft 27 th November 2013 Delft Delft University of Technology
WAumlRTSILAuml 2009 ldquoEnergy Evironment Economyrdquo Helsinki Finland WAumlRTSILAuml
mdash 2007 ldquoWaste heat recoveryrdquo Waumlrtsilauml Corporation
Wettstein and Brown 2008 Derating a solution for high fuel savings and lower emissions
Winterthur Waumlrtsilauml Switzerland Ltd
Wind Chellenger Project HP 2015 Wind Chellenger Project HP Accessed Feb 2015 httpwindku-
tokyoacjpindex_enhtml
TRANL15371 30
Appendix I - World fleet registered trading vessels
Table 3 World fleet registered trading vessels of 100 gross tons and over 2009-2013 Source UK DfT 2014
Flag Country 2009 2010 2011 2012 2013
(World Total) 8448 9130 9831 10343 10725
Panama 1886 1979 2084 2158 2172
(European Union) 1900 1979 2074 2051 2106
Liberia 908 1037 1167 1238 1241
Marshall Islands 475 590 711 811 900
Hong Kong 449 553 678 785 854
Singapore 398 434 512 592 677
Malta 348 380 438 450 496
Bahamas 452 469 481 483 485
Greece 388 407 411 411 415
China 282 327 356 388 411
United Kingdom (inc IOM and CI) 258 273 294 300 288
Cyprus 201 205 207 197 203
Japan 138 156 167 178 192
Italy 150 169 181 180 176
Norway 152 145 143 144 145
Germany 152 155 153 137 123
Denmark 107 115 113 113 122
Korea South 120 124 116 111 112
Indonesia 69 82 91 101 111
Bermuda 94 100 106 109 105
Antigua amp Barbuda 100 107 111 106 100
United States of America 107 108 102 99 97
India 83 83 89 85 82
Netherlands 76 61 67 66 69
Turkey 54 58 62 64 59
Malaysia 69 72 71 62 57
France 63 63 64 56 53
Russia 47 49 49 51 52
Philippines 50 51 50 43 43
Cayman Islands 27 29 32 32 31
Taiwan 25 26 27 30 31
Iran 09 08 05 21 31
Thailand 25 26 22 26 29
Sweden 39 35 33 28 27
St Vincent amp the Grenadines 47 42 37 28 24
Canada 24 24 25 24 23
Spain 22 25 26 25 23
Kuwait 23 19 24 24 22
Brazil 20 20 19 19 20
Cambodia 18 17 13 13 12
TRANL15371 31
Appendix II - Most important shipbuilding
countries
China
China is an emerging shipbuilder that overtook South Korea during the 2008-2010 global financial crisis
as they won new orders for medium and small-sized container ships (Bloomberg 2014 Bluebird-Electric
2014)
Figure 14 delivery of vessels from Chinese and South Korean shipyards in million compensated gross tons a measure
of building time and human resources used per ton Source (Bloomberg 2014)
China has more than 1600 shipyards Analysts have predicted that about one third of them will fold
as the industry struggles with overcapacity Last year China laid out a three year plan for industry
restructuring that urged yards to concentrate on building higher quality vessels and local governments
to halt approvals for new projects (Bluebird-Electric 2014)
After two decades of a loan-fuelled boom Chinarsquos shipbuilding industry has become saddled with debt
and overcapacity prompting some private firms to seek financial assistance from the state In
September the government issued a list of 51 shipbuilders it deemed worthy of public support
(Marinelog 2014)
TRANL15371 32
New additions to the white list include subsidiaries of the China State Shipbuilding Corporation (CSSC)
and the China Shipbuilding Industry Corporation (CSIC) and the AVIC Weihai Shipyard owned by the
Aviation Industry Corporation of China (AVIC) (Marinelog 2014)
South Korea
By the end of 2014 it seemed South Korea has overtaken China again as the worlds largest
shipbuilding country with a global market share of about 30(see Figure 14) (Bloomberg 2014)
(Bluebird-Electric 2014) South Korea leads in the production of large vessels such as cruise liners
super tankers LNG carriers drill ships and large container ships
South Koreas shipyards are highly efficient with the worlds largest shipyard in Ulsan operated by
Hyundai Heavy Industries slipping a newly built $80 million vessel into the water every four working
days South Koreas big three shipbuilders Hyundai Heavy Industries Samsung Heavy Industries
and Daewoo Shipbuilding amp Marine Engineering dominate global shipbuilding with STX Shipbuilding
Hyundai Samho Heavy Industries Hanjin Heavy Industries and Sungdong Shipbuilding amp Marine
Engineering also ranking among the top ten shipbuilders in the world In 2007 STX Shipbuilding further
strengthened South Koreas leading position in the industry by acquiring Aker Yards the largest
shipbuilding group in Europe (The former Aker Yards was renamed STX Europe in 2008) In the first
half of 2011 South Korean shipbuilders won new orders to build 25 LNG carriers out of the total 29
orders placed worldwide during the period
To maintain their market position Korean yards also focus more and more on greening opportunities
The Korean government introduced a GHG emission reducing program in 2008 The program is aiming
at reducing GHG emissions throughout all economic sectors including the shipping and shipbuilding
industry Also the Japanese Shipbuilding Association (SAJ) is looking into the possibilities to reduce
GHG emissions so that the shipbuilding industry becomes greener and more competitive (Ecorys
2012)
Japan
Japan had been the dominant ship building country from the 1960s through to the end of 1990s but
gradually lost its competitive advantage to the emerging industry in South Korea which had the
advantages of much cheaper wages strong government backing and a cheaper currency South Korean
production overtook Japans in 2003 and Japanese market share has since fallen sharply
The Philippines
The Philippines has placed fourth among shipbuilding nations around the world producing more than
six million deadweight tonnes of ships built in 2012 The country is anchored by South Korean Hanjin
and Japans Tsuneishi shipbuilders The country has shipyards in Subic and Cebu
TRANL15371 33
Europe
For several decades European shipyards have been facing strong global competition from especially
Asian enterprises (Japanese yards in the 1950s and 60s Koreans from the 1970s and 80s and Chinese
since the 1990s) In Europe this has led to an almost complete exit from the mass production segments
of tankers bulkers and containerships Response of the EU industry has been to focus on the higher
value more complex ship types such as ferries and passenger ships non-cargo vessels and general
cargo ships In addition only limited numbers of vessels of the same type are being built (in contrast
with bulk vessels which are mass produced) Europe has a 77 percent market share in building
passenger vessels (including both cruise ships as well as ferries) and a 17 percent share in the
construction of non-cargo vessels (Ecorys 2012) These segments make up a relatively small share of
the world orderbook (in CGT) However in value they represent a much higher share due to their
relatively sophisticated characteristics The position of the European shipbuilding industry in the
manufacturing of specialised innovative vessels is still strong At the same time European equipment
manufacturers have acquired a leading role in quality products especially in complex high value
equipment components
Figure 15 World orderbook and CESA orderbook by ship type in 2010 (CGT x 1000) (Source Ecorys 2012)
Regarding the marine equipment sector the European industry is renowned for propulsion cargo
handling communication automation environmental and security systems This equipment is not only
destined for complex European-built ships but also exported to Asian yards whether or not requested
by their clients (Ecorys 2012)
Compared to the ship construction sector the marine equipment segment is highly heterogeneous and
consists of companies that are often also active in other business areas (ie automotive or aircraft
industry) A study by (BALance 2014) found that the European marine equipment industryrsquos
TRANL15371 34
competitiveness lies in a strong market position and technological leadership at least for globally active
European marine supply companies who build their position on a strong infrastructure and co-operative
partners skill of their employees and close relationship with their customer base Conversely identified
weaknesses are the cost level in Europe and the heterogeneous structure of the industry with many
SMEs which hinder in some cases attempts to follow the markets by globalisation strategies
Turkey
Shipbuilding in Turkey has evolved from an old traditional activity in Anatolia to an internationally
recognised industry especially since the early 1990s The industry has modern shipyards that can build
ships yachts mega-yachts and sailing boats as well as carrying out extensive repair and conversion
works Turkeyrsquos shipyards are mainly located in the Marmara Region namely Tuzla Yalova and İzmit
which have developed into dynamic shipbuilding centres Also in recent years the emerging Black Sea
and Mediterranean Regions have increasingly attracted shipyard investments
In the last decade in parallel with developments in the global market Turkish shipbuilding experienced
a several-fold increase in its shipbuilding and export capacity including a significant product
diversification According to order books this resulted in Turkey being regularly placed in the top ten
countries on the basis of its deadweight (dwt) production and in the top five countries by the number
of ships
In recent years Turkey has increasingly tapped into niche markets which in turn has led to a growing
participation by Turkish shipyards in the international trade in new ships In parallel there has also
been strong growth in the marine equipment manufacturing sector which could increasingly also tap
the export market These developments reflect in part the strategic location of the yards the
experienced workforce the quality of production and Turkeyrsquos significant role as a political cultural and
economic bridge between Europe and Central Asian and Middle Eastern economies (OECD 2011)
ECOFYS Netherlands BV | Kanaalweg 15G | 3526 KL Utrecht| T +31 (0)30 662-3300 | F +31 (0)30 662-3301 | E infoecofyscom | I wwwecofyscom
ECOFYS Netherlands BV
Kanaalweg 15G
3526 KL Utrecht
T +31 (0) 30 662-3300
F +31 (0) 30 662-3301
E infoecofyscom
I wwwecofyscom
HOW TO OBTAIN EU PUBLICATIONS
Free publications
bull one copy
via EU Bookshop (httpbookshopeuropaeu)
bull more than one copy or postersmaps
from the European Unionrsquos representations (httpeceuropaeurepresent_enhtm)
from the delegations in non-EU countries
(httpeeaseuropaeudelegationsindex_enhtm)
by contacting the Europe Direct service (httpeuropaeueuropedirectindex_enhtm)
or calling 00 800 6 7 8 9 10 11 (freephone number from anywhere in the EU) () () The information given is free as are most calls (though some operators phone boxes or hotels may charge you)
Priced publications
bull via EU Bookshop (httpbookshopeuropaeu)
Priced subscriptions
bull via one of the sales agents of the Publications Office of the European Union
(httppublicationseuropaeuothersagentsindex_enhtm)
doi 102834880780
ML-0
1-1
5-4
39-E
N-N
[Ca
talo
gu
e n
um
be
r]
TRANL15371 5
Volatile Organic Compound Emissions from cargo tanks of oil tankers
Shipboard Incineration
Fuel oil quality
Flag States must conduct an initial survey before a new ship is put into service and before the IAPP is
issued for the first time a renewal survey at intervals specified by the Administration but not exceeding
five years an intermediate survey within three months before or after the second anniversary date or
within three months before or after the third anniversary date of the certificate an annual survey within
three months before or after each anniversary date of the certificate and after prescribed repairs an
additional survey7
For the EEDI and the SEEMP a new certificate the International Energy Efficiency Certificate (IEEC)
was established and must be kept available on board for inspectionssurveys The IEEC Certificate will
be issued for new build ships upon the initial survey before the ship is put into service and for existing
ships of 400 gross tonnage and above The IEE Certificate will be issued once for each ship and is valid
throughout the lifetime of the ship (except flag change major conversion or ship going out of service)
There are no follow-up surveys on the IEEC Certificate
The IMO has created guidelines for surveys that Flag States should follow The energy efficiency related
one is
2014 Guidelines on survey and certification of the Energy Efficiency Design Index (EEDI)
(resolution MEPC254(67))
A Flag State cannot allow a vessel that does not pass inspection to sail until it complies with MARPOL8
An International Energy Efficiency Certificate in accordance with the provisions of regulation 54 to
any ship of 400 gross tonnage and above is needed before that ship may engage in voyages to ports
or offshore terminals under the jurisdiction of other Parties
Punishments for failure to comply
In case of failure to comply the authority carrying out the inspection may detain the ship Article 7 of
MARPOL ensures that unduly delay or detain will be avoided where possible or compensated
A Flag State is obliged to investigate an incident upon receipt of notification or evidence that one of its
vessels has breached MARPOL If the investigations reveal that a breach has occurred the Flag State
has further obligations to initiate legal proceedings against the vessel and report back to the reporting
state on actions taken9
7 MARPOL Annex VI Chapter 2 Regulation 5 8 MARPOL Annex VI Chapter 2 Regulation 6 9 MARPOL article 6
TRANL15371 6
Also other parties are allowed to inspect vessels under MARPOL Article 6 when violations are detected
or for regular inspections A Party may also inspect a ship to which the present Convention applies
when it enters the ports or off-shore terminals under its jurisdiction if a request for an investigation is
received from any Party together with sufficient evidence that the ship has discharged harmful
substances or effluents containing such substances in any place
Role of Port States
Under ldquoPort State Controlrdquo arrangements Port States also have the authority to conduct vessel surveys
on ships which visit their ports and to detain those ships that fall below MARPOL requirements In
relation to MARPOL Annex VI chapter 4 any port state inspection shall be limited to verifying when
appropriate that there is a valid International Energy Efficiency Certificate on board10
Cooperation between Port and Flag States
Under MARPOL parties are required to co-operate in detecting vessel violations and are required to
use all practical measures to detect and monitor violations If a State has evidence of a violation they
are obligated to forward this evidence to the vesselrsquos Flag State
All ships flagged under countries that are signatories to MARPOL are subject to its requirements
regardless of where they sail and member nations are responsible for vessels registered under their
respective nationalities
When incidents occur outside the countrys jurisdiction or jurisdiction cannot be determined the
country refers cases to Flag States in accordance with MARPOL Some States are not happy with the
lack of response from Flag States United States experience of Flag States not responding has led to
new policy which would take direct enforcement action against vessels for MARPOL V violations
occurring between 3 and 200 nautical miles from the United States rather than referring such violations
to the flag states (Dillingham 2000)
Ship owners and charterers
A ship owner is the owner of a commercial ship A ship owner is someone who equips and exploits a
ship usually for delivering cargo at a certain freight rate The ship owner determines the specifications
of the ship and its energy efficiency measures but the benefits of low fuel consumption are not always
theirs when the ship is chartered to someone else
Depending on the type of ship and the type of charter normally a standard contract form called a
charter party is used to record the exact rate duration and terms agreed between the ship owner and
the charterer
10 MARPOL Annex VI Regulation 10
TRANL15371 7
A charterer may be a party without a cargo who takes a vessel on charter for a specified period from
the owner and then trades the ship to carry cargoes at a profit above the hire rate In some cases a
charterer may own cargo and employ a shipbroker to find a ship to deliver the cargo for a certain price
Two main types of charter can be distinguished time charter and voyage charter In a voyage charter
the owner is still responsible for the port fuel and crew costs In a time charter the charterer selects
the ports and directs the vessel where to go The charterer pays for all fuel the vessel consumes port
charges commissions and a daily hire to the owner of the vessel
When there are too few opportunities to share investment with charterers this leads to a split incentive
a ship owner may invest the up-front capital to put in energy-efficient technology but doesnrsquot then
recoup the costs from fuel savings as they charter their ships out as this goes to the charterers This
problem is particularly apparent for short-term time charters11
Conclusions
Regarding energy efficiency the work of the AHEWG-TT12 has shown that the main shipbuilding nations
all have access to the necessary technologies provided there is demand for them It has also been
noted that there is no need for transfers of intellectual property rights13
One of the major barriers to the effective implementation of the EEDI and the SEEMP is the heavy
reliance it places on Flag States for inspection of vessels and enforcement of provisions During the
1970rsquos ships were being reflagged from high tax and high regulation countries such as the United
States and the United Kingdom to countries offering Flags of Convenience (lsquoFOCrsquo) Under FOCs ship-
owners pay less tax to the relevant Flag State and are able to evade the majority of the environmental
and construction standards set out under MARPOL (Leddy 2012) The main reason for that is that
several Flag States are not signatories to all MARPOL Annexes (eg as of 20142015 the Bahamian
Bolivian Cambodian North Korean Georgian Honduran Lebanese and Sri Lankan flags of
convenience had not ratified all MARPOL treaty annexes III-VI14 15)
Many FOCs are developing nations that do not have the resources to enforce investigate or prosecute
breaches by their flagged vessels (Aqorau 2000) As of 2014 55 of merchant ships are flagged by
FOC and 40 of ships are flagged by FOCdeveloping countries MARPOL only provides guidelines for
Flag States to follow when surveying vessels under regulation 6 but none of these guidelines are
mandatory Conversely Port States which are developed are better equipped to bear the cost of
inspection investigation enforcement and prosecution costs However in relation to EEDI and the
11 httpssi2040orgwhat-we-dowork-streamsfinance 12 MEPC 6831 Progress report of the Ad Hoc Expert Working Group on Facilitation of Transfer of Technology for Ships 13 Submission of the United States on Task 3 of the Ad Hoc Expert Working Group on Facilitation of Transfer of Technology for Ships Jan
2015 14 wwwics-shippingorgdocsflag-state-performance-table 15 httpwwwimoorgAboutConventionsStatusOfConventionsPagesDefaultaspx status of conventions
TRANL15371 8
SEEMP port state control is limited to verifying when appropriate that there is a valid International
Energy Efficiency Certificate on board
We therefore conclude that there needs to be a focus on enabling Flag States and Port States that lack
the resourcescapacity to enforce the EEDI and the SEEMP in order to further stimulate the adoption
of energy efficiency technologies Also attention should be paid to overcoming the barrier of split
incentives ie where the benefits of energy efficiency measures are not transferred from the charterer
to the investor (owner)
TRANL15371 9
3 Energy Efficiency Measures for Ships
In order to understand the important energy efficiency measures that can help improve energy
efficiency from shipping it is interesting to see the split between new-built ships and existing fleet In
2012 some 3655 merchant ships were delivered worldwide about 6 of the worldrsquos merchant fleet
of about 60000 The average age of the merchant fleet is 19 years Therefore measures for both new
ships and retrofits for old ships are important for improving the energy efficiency in the next decades
If only the new ships would be targeted only 50 of the fleet would be more efficient in the next
decades while there are many retrofit measures available The total fleet can be broken down to about
4000 passenger ships just under 14000 tankers and about 37000 dry cargo ships including about
5000 container ships (Statista 2015)
In order to identify the most interesting energy efficiency measures for ships we used the information
from several reports to develop a long-list Many measures improve the efficiency in the order of up to
5 Here we would like to focus on measures that result in high savings that can be applied to many
ship types and preferably also to existing ships The resulting short-list is presented in the next table
We used the main categories identified by AHEWG-TT for structuring the measures
The main categories defined by AHEWG-TT are
1 Hull
2 Main Engine
3 Auxiliary engines
4 Propellers and rudders and
5 Control systems
Since the auxiliary engines typically consume only a fraction of the energy that goes to the main
engines their energy efficiency measure results do not show in the short-list below The measures are
worked out in more detail in the paragraphs below The main engine and auxiliary engine improvements
are covered in the same paragraph
The common rail upgrade is a simple measure that can be easily applied to all ships even when the
ship is not in the dry-dock The details are available in the paragraph about engines
From the list it is clear that conventional technology is available to achieve high efficiency gains If the
maximum gain per category is added up (for all but ferry and cruise) this would mean a total efficiency
improvement of 35 even without taking two experimental technologies with potentially high efficiency
gains into account (wind power and air lubrication) Note that some technologies are not applicable to
all ships
In order to find possible financial barriers the investments are rated from ldquovery lowrdquo to ldquohighrdquo relatively
to the size of the ships The same measure on a larger ship is obviously more expensive
TRANL15371 1
Table 1 Inventoryranking of energy efficiency measures
Main category
Measure Estimated efficiency (range)
Efficiency at average circumstances
Ease of installation
Payback time
Investment Implementation References
Hull Bow optimisation
25-20 10 all ship types
short (lt3 years)
Medium conventional technology
(IMO 2009 IMO 2011 Crist 2009 Hochkirch und Bertram not dated)
Main Engines
Wind power 5-44 20 only special ship types
long (gt15 years)
High experimental technology
(IMO 2011 IMO 2009 Crist 2009 ICCT 2011 Brannigan et al 2009 Allenstroumlm 2013)
Propellers and Rudders
Ducted propeller
1-20 10
all ship types except ferry and cruises
medium (4-15 years)
Medium conventional technology
(IMO 2011 IMO 2009 Crist 2009 ICCT 2011)
Propellers and Rudders
Contra-rotating propellers
6-20 13 only special ship types
long (gt15 years)
High conventional technology
(IMO 2011 IMO 2009 Crist 2009 WAumlRTSILAuml 2009 Shuto 2010)
Propellers and Rudders
Wheels 10 10
all ship types except ferry and cruises
short (lt3 years)
Medium conventional technology
(IMO 2009 Schneekluth und Bertram 1998 Brannigan et al 2009)
Control Systems
Waste heat recovery
6-10 8 new build only
medium (4-15 years)
Medium conventional technology
(IMO 2011 IMO 2009 Crist 2009 WAumlRTSILAuml 2007 ICCT 2011)
Propellers and Rudders
Rudder bulb 2-5 4
all ship types except ferry and cruises
medium (4-15 years)
Low conventional technology
(IMO 2011 IMO 2009 Nielsen et al not dated Crist 2009 ICCT 2011)
Propellers and Rudders
Post swirl fins
2-5 4
all ship types except ferry and cruises
short (lt3 years)
Low conventional technology
(IMO 2009 MOL 2011 Hansen Dinham-
Peren und Nojiri 2011 Nielsen et al not
dated)
Hull Hull coating 1-9 5 all ship types
short (lt3 years)
Low conventional technology
(IMO 2011 IMO 2009 ICCT 2011 Voorham 2013 Crist 2009)
Hull Air lubrication
5-15 9 new build only
medium (4-15 years)
Medium experimental technology
(IMO 2011 IMO 2009 Crist 2009 DK Group 2015 CNSS 2015 ICCT 2011)
Propellers and Rudders
Twisted rudder
2-4 3
all ship types except ferry and cruises
medium (4-15 years)
Low conventional technology
(IMO 2009 Schulze 2007 Nakashima 2015 Becker Marine System 2015 Nielsen et al not dated Hollenbach und Friesch not dated Rolls-Royce 2014)
Main Engines
Main engine de-rating
2-4 3
all ship types except ferry and cruises
medium (4-15 years)
Low conventional technology
(IMO 2011 IMO 2009 Crist 2009 Wettstein und Brown 2008 DNV GL 2015)
Auxiliary engines
Common rail upgrade
- - all ship types
medium (4-15 years)
Very Low conventional technology
(DNV GL 2015) (ICCT 2011) (IMO 2009)
Main Engines
Common rail upgrade
01-05-
03 all ship types
medium (4-15 years)
Very low conventional technology
(IMO 2009 Pakarinen 2007 ICCT 2011 Crist 2009)
TRANL15371 2
Hull and superstructure
In general the optimisation of hull and superstructure focuses on minimising the resistance by reducing
the wave resistance and friction between water and hull It is important to recognise which type of
vessel is to be optimised The reduced frictional resistance increases energy performance of the vessel
particularly at low speeds Operability and performances of the ship must be considered in detail The
improvements measures are generally applied at new-built ships but also applicable to retrofitting
Bow optimisation
The different bow optimisations can improve the water flow around the hull and reduce the wave-added
resistance for large vessels with high block coefficient operating within commercial speed ranges The
average energy reduction potential ranges from 25-20 on average 10 (Crist 2009 IMO 2011
Voorham 2013)
Figure 3 Left The green line characterises the ordinary bow wave of the hull The blue line characterises the wave
formed by the bulb The red line is the sum of these two The altitude of the bow wave is noticeably reduced which
reduces the hull drag associated with the bow wave This improves fuel economy and increases range (Selenetrawlers
2015) Right Ordinary bulbous bow leadge bow and ax-bow shape (JSEA 2006)
The below-the-waterline extension of the bulbous bow (Figure 3) modifies the way the water flows
around the hull reducing drag and thus increasing speed range fuel efficiency and stability An altered
design is the ax-bow (Figure 3) The narrow designed bow slashes through the water in order to reduce
slamming and reduces the size of bow generated wave The propeller can act more efficient due to the
absence of slamming The ax-bow allows the ship to steer well to maintain speed and the engine to
save fuel (Crist 2009 IMO 2009) If the bulbous bow is modified during a regular docking period the
investment is estimated to have short payback of about 1-3 years It is most promising for container
vessels (DNV GL 2015 Hochkirch und Bertram not dated)
Barriers The bow optimisation (as retrofit) needs to be done in the dry dock Dry-docking is not
regularly happening for existing ships because it means that the ship cannot operate and economic
losses are suspected Another obstacle might arise due to restricted access to the original contractual
hull plans since shipyards are not always keen to provide detailed plans on their vessels to prevent
TRANL15371 3
imitation (Hochkirch und Bertram not dated DNV GL 2015) A major obstacle is the split incentive
between ship owner and operator Ship owners are responsible for investing in these technologies and
ship operators are those who pay for the fuel consumption and benefit from such technologies (ICCT
2011)
Technical maturity The technique is available on the market and is effective Only conventional
material is needed and redesign can be done in a few weeks16
Applicability Applicable to all ship types but most efficient for ships with a high block coefficient like
tankers and bulk carriers since the reduction of the wave-added resistance is most impacting (IMO
2009)
Hull coating
Hull coatings (Figure 4) can lower frictional resistance and limit fouling by aquatic organisms It can
save between 1-9 fuel consumption on average 5 (ICCT 2011 Voorham 2013 Crist 2009)
Figure 4 Example of hull coating (ECOSPEED 2015)
One way of lowering the frictional resistance is to improve the smoothness of a hull by means of
coatings that reduce fouling The costs are lifetime cost reduction and have to be recur every five years
to be able to gain the fuel benefit
Barriers A new application is typically necessary during each dry-docking The self-polishing coating
must be renewed after a 3-5 years period (IMO 2009) A major obstacle is the divided interest between
ship owner and operator Ship owners are in charge for investing in these technologies and ship
operators are those who pay for the fuel consumption and profit from such technologies (ICCT 2011)
Technical maturity Coating techniques are available on the market and roughly 5 of newly painted
ships are painted with one of the advanced coating systems presently available (IMO 2011 ICCT 2011)
The payback time is short (ICCT 2011) or 0-2 years according to others17
Applicability The technology is applicable to all vessels
Air lubrication
The air lubrication technique creates a layer of bubbles underneath an already streamlined hull in order
to further reduce friction An automation system regulates the compressorsblowers depending on
16 httpwwwship-efficiencyorgonTEAMpdf14-Ship20efficiency20seminar20-20CMA20CGM-
20HydrOcean20120CMA20pdf 17 httpswwwdnvglcommaritimeenergy-efficiencyefficiency-finderhtml
TRANL15371 4
speed The blower keeps holes filled with air and required pressure A thin layer of bubbles trailing
behind of each cavity merge into single large ldquoair layerrdquo for the whole flat bottom part of the hull and
reduces the friction (Figure 5) Depending on the ship type the estimate fuel efficiency ranges between
5-15 (on average 9) where tankers and bulkers can reduce more (10-15 on average 125) in
comparison to container vessels (5-9 on average 7) (IMO 2009 DK Group 2015 CNSS 2015 ICCT
2011 Voorham 2013)18
Figure 5 Schematic view of air lubrication (DK Group 2015)
Barriers Large capital investment requirements with split incentive The vessel owners are
accountable for investing in these technologies whereas vessel operators recompense for the fuel
consumption and benefit from such technologies (ICCT 2011)
Technical maturity The technology is available on the market but still in a pilot phase Sea trials
have been performed with small demonstration ships There are no vessels operating commercially
that currently use this technique Specifications about the payback time vary from short to medium
(Silberschmidt 2014 Skinner 2009)
Applicability The original technology would be likely be applied to new-built ships with at least a
partly flat bottom and a minimum length of 225 metres since the compressor may have technical
problems maintaining air cavities for deep draft ships (IMO 2011 CNSS 2015) Air lubrication can be
used for retrofitting as well (CNSS 2015)
Engines
Speed reductions on existing vessels provide opportunities for engine optimisation on low power
(321) Similar measures as de-rating for the main engines that could be implemented are cylinder
cut-out and new torsional vibration calculation (IMO 2009)
18 It has to be noted that the extra fuel use caused by the system itself should also be taken into account
TRANL15371 5
Another propulsion supportive measure with a high potential measure is wind power This is also
explained in more detail below In order to also provide a measure with a lower improvement potential
per ship but simple and applicable to all ships we describe the common rail system for fuel injection
Main engine de-rating
Slow steaming vessels are known as one of the most effective energy saving measure The potential
comes mainly from the operational behaviour side From the technical side the specific fuel oil
consumption will decline when a ship is no longer operated at its design speed
The design speed can be reduced by de-rating the main engine (IMO 2011 IMO 2009) Reduction of
power combined with injection timing advanced to restore peak combustion pressure can achieve a
certain gain in shaft efficiency Fuel efficiency can be improved by 2-4 when de-rating is performed
for loads lower than the maximum design load (Wettstein und Brown 2008 Crist 2009) on average
3 energy efficiency potential (Crist 2009) Operational costs would be lower mainly due to fuel
savings (DNV GL 2015 Crist 2009 Wettstein und Brown 2008)
Barriers A slower vessel will have lower incomes as it is not capable to perform as much transport
load per unit of time as a faster vessel De-rating the engine is usually done when it is clear that the
ship will become a slower steaming ship There is a split incentive between vessel owners who are
responsible for investing in these technologies and vessel operators who are those who compensate
for the fuel consumption and benefit from such technologies (ICCT 2011)
Technical maturity This technique has been proven as successful particularly on older engines
which are normally built with a low compression ratio and thereby have a significant potential to
improve their efficiency (IMO 2009) De-rating measures have a low to medium payback time (Crist
2009 DNV GL 2015)
Applicability The technologies are available on the market It is applicable to all vessels (DNV GL
2015)
Common-rail upgrade (common-rail fuel injection)
Engines with common-rail fuel injection handle low-load working modes much better (IMO 2009) A
common-rail fuel injection is technique of injecting fuel into an engine cylinder under total control and
thereby achieving optimal combustion Common-rail allows the start and duration of injection
independent of the position of the pistons in that way permitting an operationally optimised injection
per stroke In a normal diesel engine fuel is injected at a static rate by a pump and common practice
is to optimise this pump to run at an optimal setting for the ideal injection time (Pakarinen 2007) The
energy efficiency potential is estimated between 01-05 on average 03 (ICCT 2011 IMO 2009)
Barriers Additional electronics can also introduce possibilities for failures However recent
advancements have increased the systems popularity19 There is a split incentive between vessel
19 httpwwwmarineinsightcommarinean-overview-of-common-rail-system-in-marine-engines
TRANL15371 6
owners who are responsible for investing in these technologies and vessel operators who are those
who compensate for the fuel consumption and benefit from such technologies (ICCT 2011)
Technical maturity This measure is available on the market (ICCT 2011) Payback time is short to
medium with an average of 5 years (IMO 2009 Crist 2009)
Applicability This measure is applicable to new and retrofit vessels It is applicable for tanker- bulk-
container- and Roro-ships (Crist 2009)
Auxiliary engines and systems
Based on our own estimation auxiliary engines improvement are not bringing gt2-4 energy savings
because auxiliary engines consume much less fuel than the main engine Similar measures as de-rating
for the main engines and common rail upgrade could be implemented for the auxiliary engine
Other options for improving auxiliary systems are speed control of pumps and fans control strategies
of cooling water systems room ventilation redesign of piping and instruments advanced computation
of airgas temperature distribution with reduced storage ventilation and with optimised ventilation
systems (DNV GL 2015)
Barriers There is a split incentive between vessel owners who are responsible for investing in these
technologies and vessel operators who are those who compensate for the fuel consumption and benefit
from such technologies (ICCT 2011)
Technical maturity This measure is available on the market (ICCT 2011) It is easy to apply and
uncomplicated in maintenance (DNV GL 2015) Payback time is short (DNV GL 2015)
Applicability This measure is applicable to all new and retrofit types of ships (DNV GL 2015)
Wind power
Wind power measures are available that can develop enough thrust to provide at least some supportive
propulsion Wind power can be utilised in various ways in shipping like traditional sails solid wing sails
Flettner-rotor and kits (see Figure 6) The techniques are currently used as supplementary power
(Brannigan et al 2009)
Figure 6 from left to right Kite (Cargill 2011) Flettner rotor (MIWB 2015) and solid sails (Wind Chellenger Project
HP 2015)
Solid wing sails are structured similar to aircraft wings which offer more thrust with less drag than
conventional sails Flettner rotors produce thrust from a rotating object in wind using the so-called
TRANL15371 7
Magnus effect The techniques have different characteristics with regards to how the thrust that is
produced relates to other factors such as wind strength wind angle wind stability and ship speed
(IMO 2009)
Towing kites vary from other concepts of wind power by having a small footprint during installation and
therefore being quite feasible to retrofit (Allenstroumlm 2013) Studies conducted at the Technical
University of Berlin indicated that the potential for sail energy has different prospective in the different
regions in the world Best scenarios exist in North Atlantic and North Pacific regions the South Pacific
seems a bit less potential The studies have shown that under normal circumstances the typical savings
using wind power may be 5 at 15 knots and up to 20 at 10 knots This study also revealed that
with optimal weather routing in the North Atlantic and given the best vessel with best sail type savings
can reach 15 percent at 15 knots and 44 at 10 knots (IMO 2009 Crist 2009) Nevertheless the
above figures should be considered indicative since practical experiences are limited Sail- and kite-
assisted power does seem to be a potential opportunity saving energy in the medium- and long-term
picture for shipping (IMO 2009) Christ estimates and average energy saving potential around 20
(2009)
Barriers There is a split incentive between vessel owners who are responsible for investing in these
technologies and vessel operators who are those who compensate for the fuel consumption and benefit
from such technologies (ICCT 2011) Although this technology can bring high energy savings the
investment is so high that there is not a short payback time
For solid wing sails complications could result in a need for masts to run down to the keel which can
be a bigger issue for retrofitting Additionally the presence of the mast and rigging could have significant
impacts on cargo handling (IMO 2009) Downside of the kite systems include the complex launch
recovery and control systems that are needed (IMO 2009)
Technical maturity This is still considered as experimental technology The technical barriers
identified above need to be tackled for this measure to be applied widely in the future Payback time is
estimated to be medium to long term (Allenstroumlm 2013 Crist 2009)
Applicability Wind power technologies are available and a number of cargo ships have been equipped
with wind engines to reduce demands from diesel engines (ICCT 2011) Kites can be used on ships
with a minimum length of 30m and works most energy efficient on ships with a typical speed not faster
than 16 knots Preferably tankers (crude oil product chemical LPG LNG other) and bulk carriers are
being considered as potential users due to this speed restriction (IMO 2011)
Control Systems Waste heat recovery
Waste heat recovery (WHR) technology can pass exhaust gases from a vessels engines through a heat
exchanger to generate steam for a turbine-driven generator The heat energy from the exhaust gas is
taken and transformed into electrical energy to reduce direct engine-fuel consumption for the
propulsion system or reduce auxiliary engine needs (ICCT 2011) Energy saving potential is estimated
between 6-10 on average 8 (Crist 2009 ICCT 2011)
TRANL15371 8
Figure 7 Efficiency of waste heat recover systems Sankey diagramme Even with high 50 efficiency of modern low-
speed engines there is still 50 of fuel input energy not being put to productive use The possibilities are illustrated
by this comparison of Sankey diagrammes for Waumlrtsilauml 12RT-flex96C engines without heat recovery (left) and with
high-efficiency waste heat recovery plant (right) showing in this case 114 gain in overall efficiency with WHR
(waste heat recovery) (WAumlRTSILAuml 2007)
Barriers Large capital investment requirements (around $5-6 million for a large container ship20) and
split incentive between ship owners and ship operators (ICCT 2011)
Technical maturity The technology is available on the market and has medium to long payback time
(WAumlRTSILAuml 2007 Crist 2009)
Applicability A WHR system is applied to vessels with a high production of waste heat and a high
intake of electricity WHR can be employed on ships with main engine average performance is higher
than 20000 kW and auxiliary engine average performance higher than 1000 kW This size
requirements limit the number of ships using this technology (IMO 2011) Generally it is applicable to
all ships types new and retrofit (Crist 2009)
Propellers and Rudders
Numerous devices have been designed for improving the energy consumption of vessels by recovering
as much as possible of this rotational energy in the flow from the propeller or to provide some pre-or
post-rotation of the in flow into and after the propeller to ensure best efficiency The most important
of these will be discussed in the following paragraphs (IMO 2009)
Ducted propeller (Kort Nozzle)
The accelerating ducted propeller consists of a screw propeller surrounded by a non-rotating duct
(nozzle) (Figure 8) Compared to the conventional propeller of the same diameter and thrust this
20 httpgcaptaincompower-exhaust-gas-paybacks-waste
TRANL15371 9
arrangement allows an increase inflow to the propeller improving the operating conditions around the
propeller and the ideal efficiency
Figure 8 Right photos of this Norwegian trawler (SetSail 2009)
The duct creates additional thrust load The potential for energy savings on relevant vessels range
between 1ndash20 (Crist 2009 IMO 2011 Barringhaus und Olds 1999 IMO 2009) whereupon 10 is a
good average value (IMO 2009 Crist 2009) The improvement of the combination of propeller and duct
overweigh negative effect of the increase water resistance caused by the duct
Barriers Since the duct has an optimal operational speed it does not work efficient at all speeds For
instance as drag increases with increasing speed eventually this will become larger than the added
thrust Therefore at high speeds ducts are typically not used (IMO 2009) The split incentive is a barrier
between ship owners (investor) and ship operators (gainer) as explained earlier (ICCT 2011)
Technical maturity Several standard designs are available on the market (IMO 2011) with a medium
payback time (IMO 2011)
Applicability Ducted propellers suits for vessels operating at high propeller loadings such as tankers
bulk carriers especially tugs and some offshore service ships The duct leads to increased friction but
at higher propeller loadings this is more than rewarded for by the positive effect of the combination of
propeller and duct (IMO 2009)
Contra-rotating propellers (CRP)
A rotating propeller induces a rotating motion in its backwash Normally this rotation energy of the
propeller gets lost The contra-rotating propeller is used in order to recover part of this energy (Figure
9) In a contra-rotating configuration two propellers are facing each other rotating in the opposite
direction with the aft propeller recuperating the turning energy in the wake from the forward propeller
(IMO 2011) To avoid complications with cavitation the aft propeller usually has a smaller diameter
than the front propeller Contra-rotating propeller arrangements involve a short shaft line and for that
reason primarily suitable for vessels with single-screw
TRANL15371 10
Figure 9 Left conventional propeller Right contra-rotating propeller The working principle is simple and effective
the power is split in a forward and aft propeller which through the different direction of rotation cancel out the
rotational energy losses behind the propeller (WAumlRTSILAuml 2009)
Potential savings of such measures are assessed to be in the order of 6ndash20 of the power consumption
with an average of 13 although higher figures may be presented by industry for specific cases Two
different full-scale measurements reported gains of 15 and 16 (IMO 2009 Crist 2009)
Barriers The mechanical installation of contra-rotating shafts is complicated and requires more
maintenance (IMO 2011) The split incentive between ship owners (investor) and ship operators
(gainer) is a barrier as explained above Although this technology can bring high energy savings the
investment is so high that there is not a short payback time
Technical maturity The technique is available on the market but problems with gearboxes for
contra-rotating propellers have been reported as well as operational problems with mounting (IMO
2009 IMO 2011) Payback time is reported as short (WAumlRTSILAuml 2009) but also as medium-long with
about ~15-20 years (Shuto 2010)
Applicability The technology is particularly beneficial for rather heavily loaded propellers as for
example very fast cargo vessels like Ro-Ro ships or for container ships (IMO 2011 Crist 2009) Contra-
rotating propellers need a short shaft line and hence mainly suited to single-screw ships (IMO 2011)
Contra-rotating propellers can be implemented as retrofit but it is more likely implemented in new
built ships due to the complicated mechanical installation (Crist 2009)
Post swirl devises
A number of different techniques belong to the post swirl category Several of them contain
modifications to the rudder or propeller (IMO 2009) Depending on vessel type and operational field
various power saving measures can be mounted to optimise water velocity distribution to the propeller
and to minimise slipstream losses due to swirl in the outflow of a propeller The most important among
these measures may be additional thrusting fins at the rudder twisted rudder (Figure 12) rudder-
bulb-systems with fins (Figure 13) and fins on the propeller fairwater also called post swirl fins or
boss cap fins (Figure 10)
Generally post swirl measures reported 1-8 energy efficiency (test models) Even 8-9 energy
efficiency from full-scale measurements for additional thrusting fins at the rudder Payback time is
estimated to be short to medium post swirl devices (DNV GL 2015 Crist 2009 ICCT 2011) Some of
CRP FOR BETTER PROPULSION EFFICIENCY
CONVENTIONAL PROPULSION
TRANL15371 11
the post swirl measure can be combined A good overview is given in Nielsen et al (Combined Kappel
propeller and rudder bulb system for improved propulsion efficiency not dated)
3431 Post swirl fins
The post swirl fins (Figure 10) can recover energy loss of propeller hub vortex in the propeller backward
flow and can lead to 3-5 energy saving on average 4 operating at the same speed (MOL 2011
Barringhaus und Olds 1999 Hansen Dinham-Peren und Nojiri 2011 ICCT 2011)
Figure 10 Example the post swirl fins or propeller boss cap fins (gcaptain 2012)
Barriers It is simple and straightforward measure requiring only the removal of the propeller boss
caps and replacement with the post swirl fins (no hull modification is needed) (Hansen Dinham-Peren
und Nojiri 2011 MOL 2011) However there is a split incentive between ship owners (investor) and
ship operators (gainer) as explained above
Technical maturity The technique is available on the market In 2013 post swirl fins were applied
to over 2500 ships worldwide (MOL 2011) Further advantages of the post swirl fins are reduction in
propeller torque reduced vibration in the stern and less underwater noise and reduced rudder erosion
(MOL 2011) A payback time of 6 months was estimated for 4 efficiency improvement at $600tonne
oil price (Hansen Dinham-Peren und Nojiri 2011) The investment is considered to be low21
Applicability The technique is effective for all screw propellers irrespective of the type or hull form
of the ship Has been tested on large-scale container vessels (MOL 2011 Hansen Dinham-Peren und
Nojiri 2011)
3432 Free rotating wheels
A vane wheel (Grim wheel) is a freely spinning propeller mounted behind the main smaller propeller
(see Figure 11 for example of use on retrofit Queen Elisabeth II in 1986) The vane wheel has a bigger
diameter than the main propeller and increases the propeller diameter The small propeller drives the
freely revolving vane wheel fitted on the wake The inner part of the vane wheel acts as a turbine and
the outer part as an ldquoadditionalrdquo propeller
21 httpgcaptaincompropeller-technology-ship-efficient
TRANL15371 12
Figure 11 Example for a grim vane wheel (Boat design 2007)
This leads to a substantial recovery of the rotational energy The energy saving potential is reported to
be 10 (Brannigan et al 2009) It is stated that the important benefit of the vane wheel is that a
smaller impulsion propeller can be installed which consumes less energy The vane wheel gives a
suitable energy improvement for cargo ships (IMO 2009 Schneekluth und Bertram 1998) and has short
payback time It is also stated that if there is room for a vane wheel in the aft there is also space for
an impulsion propeller of larger diameter leading about the same energy saving potential as the
combination of a small impulsion propeller and a vane wheel (IMO 2009)
Barriers A barrier is the split incentive between vessel owners who are responsible for investing in
these technologies and vessel operators who are those who compensate for the fuel consumption and
benefit from such technologies
Technical maturity Limited application Vane wheels are subjected to strong fluctuations in loading
Problems with the strength of the blades have been encountered frequently (for example the vane
wheels on the Queen Elisabeth II were short lived and not used after22)The payback time is estimated
to be short
Applicability The technique is effective for all screw propellers irrespective of the type or hull form
of the ship both for new and existing ships (Chen Reed und Kim 1989) Recommended for all ship
types except ferry and cruises because of their problem with strong fluctuations in loading as
mentioned above23 (IMO 2009)
3433 Twisted rudder
Rudders can play a significant role of extra frictional resistance Rudders are located in the backwash
of a propeller and rotational energy will act on the rudder Because of these effects the rudder gives
prospects of efficiency gains (Schulze 2007)
22 httpwwwroblightbodycomlinersqe-21987_Refitindexhtm 23 httpwwwroblightbodycomlinersqe-21987_Refitindexhtm
TRANL15371 13
Figure 12 Schematic capture of twisted rudder (Nakashima 2015)
Twisted leading edge technology provides multiple benefits for high-speed vessels compared to
conventional rudder designs Conventional rudders are located behind the propeller with the rudder
profile arranged symmetrically about the vertical rudder centre plane This arrangement does not
consider the fact that the propeller induces a strong rotational flow that strikes on the rudder blade
This consequences in areas of low force on the blade that induce cavitation and associated erosion
problems (Becker Marine System 2015 Schulze 2007)
The twisted rudder is horizontally twisted on the lower and upper side of the segment that is an
extension of the propeller shaft (Figure 12) This decreases cavitation rudder and improves
manoeuvrability of the vessel (Schulze 2007) Twisted rudder types lead to energy efficiency
improvements by approximately 2-4 on average 3 for large-size high-speed vessels (Hollenbach
und Friesch not dated Nakashima 2015)
Barriers Work needs to be done in the dry dock this is not regularly happening for existing ships
(Hochkirch und Bertram not dated) There is a split incentive between vessel owners who are
responsible for investing in these technologies and vessel operators who are those who compensate
for the fuel consumption and benefit from such technologies (ICCT 2011)
Technical maturity This rudder type is a commercially used technology and easy to apply if the ship
is in the dry dock (ICCT 2011)The payback time is estimated to be short to medium (Rolls-Royce 2014
Crist 2009)
Applicability Twisted rudder can used by container vessels reefers Ro-Pax ferries cruise ships and
naval vessels In South Korea this type of rudder is recognised as a standard rudder for large-size
high-speed container carriers (Nakashima 2015)
TRANL15371 14
3434 Rudder bulb
Figure 13 Example for a rudder bulb Kawasaki RBS-F rudder bulb systems with fins (Kawasaki 2015)
The rudder bulb brings smooth inflows from the propeller and can reduce the drag of the rudder The
rudder fins produce thrusts in the rotational flows generated by the propeller (Figure 13) Rudder bulb
measure can improve energy efficiency by 2-5 (Nielsen et al not dated Becker Marine System not
dated) on average 4 (Crist 2009)
Barriers The work needs to be done in the dry dock this is not regularly happening for existing ships
There is a split incentive between vessel owners who are responsible for investing in these technologies
and vessel operators who are those who compensate for the fuel consumption and benefit from such
technologies (ICCT 2011)
Technical maturity The technology is a commercially used technology and easy to apply while the
ship is in the dry dock (Kawasaki 2015) Payback time is estimated to be medium (Crist 2009)
Applicability For new and retrofit tanker- bulk- container- and Roro-ships with a propeller and
rudder (Crist 2009)
TRANL15371 15
Barriers to the transfer and uptake of energy
efficiency technologies for ships and possible
measures to overcome them
Although there are ways to reduce emissions (Chapter 3) and also drivers working towards the
implementation of such measures there are significant barriers to acting on cost-effective opportunities
in the maritime industry This is often referred to as barriers to energy or the energy efficiency gap
(Michele Acciaro 2013) (Sepideh Jafarzadeh 2014) (OECD 2014) Some barriers are shared with other
industries while others are unique to the maritime industry Furthermore many of these barriers are
not specific to the EEDI and the SEEMP but apply to any rule under MARPOL These barriers can exist
on both the supply and the demand side For example there could be barriers to the development and
implementation of measures that reduce CO2 emissions from ships and barriers to the expression of
demand for these measures (ECORYS 2012) Studies have however shown that there are relatively
few barriers related to the development of new technologies or access to related intellectual property
rights by the main shipbuilding nations and that the supply of measures exceeds the demand (ECORYS
2012) Existing studies on barriers to energy efficiency thus focus on what prevents the uptake of
available measures
This section presents an overview of the main barriers to the transfer and uptake of energy efficiency
technologies in the shipping industry and discusses potential ways of overcoming them
Preliminary assessments of technology transfer and financial needs by both workshop participants and
the IMO Ad Hoc Expert Working Group on Facilitation of Transfer of Technology for Ships (AHEWG-TT)
have suggested that the type of assistance needed by Port State and Flag State administrations will be
of a different nature than that required by shipbuilders and owners Our assessment above has shown
that the shipbuilding industry is expected to need less assistance than Port States and Flag States
In the next table we list a summary of the main barriers and the stakeholders concerned in the main
categories as identified by AHEWG-TT as well as the possible measures that could help overcome these
barriers The possible measures to overcome the barriers are further detailed in the sections below
Related costs are estimated in a separate section in order to minimise overlap
TRANL15371 16
Table 2 Summary of main barriers relevant stakeholders and possible measures to overcome them
Barrier Stakeholders Measures forward
Lack of awareness
(administrative and industry)
a MARPOL in general MARPOL Annex
VI EEDI and SEEMP in particular
b Available energy efficiency
technologies
Flag and Port
States
Ship owners
Capacity building
- Workshops
- Trainings
Model course for training
Inventory
Platform for information access and
sharing
Agreements between industry and
administrations
Technology concerns
a Lack of or limited technology supply
chain in some states
b Lack of technology base for RampD in
some states
c Lack of trust (in ability to reduce
emissions in ability to reduce
operational costs in compatibility
with other measures)
Ship owners
Investors
Increase cooperation in ship design
and building
Increased interaction between
industry and educationalRampD
institutes
Establish platform to share
expertiseexperience
Provide special investment or
guarantee funds
Institutional concerns
a Increased administrative burden
1Revision and amendment of existing legislation
2Implement Port and Flag State obligations
b Limited technical capacity in state institutions to implement
c Lack of financial resources for additional compliance and enforcement activities by maritime administrations
Flag States
Port States
Promote increased cooperation and
communication between
administrationswithin regional
administrations
Regional information workshops for
Port and Flag States
Establish platform to share regulatory
experience
Development aid
Commercial
a Increased costs for ship owners to
take up energy efficient technologies
b Lack of motivation of owners to take
up energy efficient technologies (split
incentive)
Ship owners
Financiers
Special EE funds
Smart contracts
TRANL15371 17
Awareness Raising
Barriers Lack of Awareness
The need to create awareness among Flag States Port States and ship owners of the requirements of
Annex VI in general and Chapter 4 in particular was highlighted by participants of the workshop and
emphasised by the AHEWG-TT The level of awareness in the various regions and even in the countries
within the regions differed considerably The AHEWG-TT further suggests it would be beneficial to
undertake an initial evaluation of knowledge needs (gap analysis) in order to ensure workshops and
other awareness-raising activities are appropriately tailored24
Furthermore ship-owners are not always aware of the energy efficiency technologies available on the
market or which operational measures can be implemented to save fuel Ship owners can be companies
people and investment funds Especially private equity groups tend to focus more on short term looking
for quick profit while traditional ship owners tend to hold the ship for at least 20 years25
Measures forward
Though Flag States and Port States should already have implemented measures to ensure that Energy
Efficiency Design Index (EEDI) and Ship Energy Efficiency Management Plan (SEEMP) requirements are
complied with both public administrations and industry representatives could benefit from additional
trainingcapacity building and platforms to share experiencesreceive information with regards the
practicalities of these regulations and available energy efficiency technologies The needs for each
group can be determined through a gap-analysis which we recommend to be carried out by an
independent consultant in cooperation with the flag and port states Once the specific needs for each
group have been determined they can be addressed through the following awareness raising
measures
Capacity Building (workshops trainings)
Workshopstrainings could be organised where formal training is combined with open discussions where
experiences could be shared just within one stakeholder group or between educational institutes
auditors operational managers of ships shipbuilders and authorities Such trainingsworkshops could
focus on just one or all aspects relating to the applicable rules available energy efficiency measures or
assessment methods of technologies (eg training in calculating and verifying EEDI and SEEMP
including development of tools to calculate EEDI and SEEMP) Trainingsworkshops can be local or
regional Sending people physically to regional workshops is generally more conductive to networking
and experience sharing but less adapted to the local situation and more costly
To reduce the costs of training and ensure a certain level of training the IMO or other qualified
international partners (eg WMU) could develop model courses for training In order to better
understand the rules and regulations in detail people use the help of trainers to better understand the
elements that are important for them and to gain experience in doing calculations and other required
24 Ad Hoc Expert Working Group on Facilitation of Transfer of Technology for Ships 2nd Meeting 25 httpwwwftcomcmss0dadcb240-3d97-11e3-b754-00144feab7dehtmlaxzz3aqC3tmNu
TRANL15371 18
activities by the regulations Trainers have to develop their courses and earn back their investments
via trainings Since the trainers are doing this simultaneous it would be more efficient if there would
be a model course available that can easily be tailored to the audience This would reduce the costs for
the development of trainings and would also ensure that the trainers provide the same level of depth
in their trainings Since the IMO is responsible for the rules and regulations it would be the logical
responsible for the efficient implementation and therefore could take the initiative for developing model
courses
Information Sharing
Inventory of energy-efficiency technologies (for example the IMO-GEF-UNDP project) Many
studies and overviews on the internet are available The quality and the scope is often
different
Improved access to information and information sharing with international recognised
organisations including relevant survey and certification training One example of
establishing information sharing between governments is the work of the OECD Council
Working Party on Shipbuilding (WP6)26 which organises regular workshops aimed at
facilitating the exchange of information on policy and industry developments
Note that many of these measures overlap with the measures required to overcome institutional
barriers as laid out in section 43
Agreements between industry and administrations could be envisaged to overcome the
barriers
In order to enhance the sharing of expertise for both administrations and industry technology transfer
and technology cooperation agreements could be formulated in order to strengthen the cooperation
As identified before the technology transfer to the ship building industry is not a mayor barrier so the
agreements should help the administrations to become more aware of the possibilities to further
promote the implementation of MARPOL Annex VI
Typical agreements between industry and administrations could be in the form of initiatives like the
Sustainable Shipping Initiative (SSI) SSI members have developed a vision for a sustainable shipping
industry in 2040 They commit to working towards this in all their own operations andor activities that
involve shipping and in all their dealings with and support for the shipping industry to make their vision
a global reality by 2040 SSI members of over 19 companies represent ship owners and charterers
shipbuilders engineers and service providers banking insurance and classification societies The SSI
explored for instance how to overcome barriers to the uptake of new technologies and techniques which
improve the operational efficiency of ships potentially delivering energy efficiency savings of 10 or
more and payback periods of less than 5 years They also produce case studies to show good examples
and also develop tools By involving administrations in these kind of initiatives (even free of charge)
they could be actively supported with knowledge about sustainable shipping
26 httpwwwoecdorgstiindworkshopongreengrowthinshipbuildinghtm
TRANL15371 19
Technology Concerns
Barriers Technology Concerns
One of key barriers to the implementation of energy efficient technologies (new and retrofit) relates to
the lack of or limited technology supply chain Furthermore the lack of a technology base for RampD in
some states is a barrier Also the existence of concerns relating to the ability of available energy
efficiency measures to reduce emissions and operational costs and their compatibility with other
measures of energy efficient technologies is a barrier This is typically the problem in very isolated ship
yards
Measures forward
Very successful shipyards (Japan and Korea) have already since many years a large number of
licencing technology transfer and similar agreements and continuously exchange information with
competitors in and outside their countries For instance US shipyards have adopted this methodology
since the 1980s (office of technology assessment 1983)
Further technology sharing could be stimulated through educationalRampD institutes locally regionally
or globally in ship design and building The technology will be transferred to the ship builders once the
students start working there or through cooperation between industry and university In order to
facilitate this we recommend the establishment of partnerships to share expertiseexperience
Typically individuals who know both worlds are the driving force behind successful partnerships (AISBL
2012) These partnerships are built around a shared long term research vision Many partners could
contribute (eg financially) in order to establish the responsible management and research programme
The target of the platform could be for example to provide verified information on real-world energy
efficiency improvements via a monitoring programme
For example in order to stimulate the deployment of energy efficient trucks the Dutch government
provides a website to share audited knowledge and data on about 15 energy efficiency technologies27
Additionally climate financing could be leveraged to reduce the investment risk in unproven
technologies For example IMO Member States could create a demonstration fund that can function as
a guarantee for investments in new and immature technologies28 Similarly investment guarantees
can be provided by funds in the same way governments provide export credits to their companies If
the technology does not deliver the expected fuel-savings the fund can cover the difference and hence
reduce investment uncertainty The main objective being to reduce investment risk
Institutional Concerns
Barriers
27 httpwwwtruckvandetoekomstnl 28 An example of a specific EE fund is httpwwweeefeueligible-investmentshtml
TRANL15371 20
For Flag and Port States complying with new regulations of IMO and EEDI and SEEMP particularly
represent and increased administrative burden It requires revisions and amendments of existing
legislation that need to be implemented at Port and Flag State functions There is currently limited
technical capacity in state institutions to implement these changes especially in developing countries
with a relatively low number of ships under their flag
The lack of financial resources is also a barrier for additional compliance and enforcement activities by
maritime administrations This is particularly an issue for least developed countries and small
developing island states Implementation costs are relatively higher for small Flag States because of
limited abilitycapacity to implement new technical regulations Note that this issue is not specific to
the EEDI and the SEEMP but to most regulatory measures (maritime or other)
Measures forward
Measures to assist states in implementing (existing and new) legislation include
Promote an increased cooperation and communication between administrationswithin
regional administrations of Port and Flag States similarly to what has been suggested in
sections 41 (Awareness raising through capacity building activities such as workshops) and
42 (Establish platform to share regulatory expertiseexperience) Platforms could be
managed by IMO in conjunction with industry and development funds in order to share the
costs as this has been done before for GloBallast for example In that case the IMO is in the
lead (executing agency) but the platform is supporting the collaboration with many
stakeholdersfunding partners The goal of the programme is to assist developing countries
eg via e-learning courses
In addition deterrents need to be put in place to discourage Flag States from performing
substandard inspections A system for detecting sub-standard inspections should be
implemented whereby mandatory Port State Control inspections are carried out in close
proximity to mandatory Flag State inspections (ie the Flag State inspection is carried out
prior to the ship leaving port and the Port State inspection is carried out upon arrival at port)
The two inspections should be carried out under a uniform mandatory checklist The IMO
should monitor inspections and investigate where discrepancies between inspections close in
proximity are detected If a Flag or Port State is found to have failed to meet the requisite
inspection standards penalties in the form of substantial fines should follow
In order to overcome the financial barriers financial assistance to states could help with
capacity building and implementation Financial resources are not only needed in the
implementation of the new regulations (training of government experts) but governments of
Flag States also need to be involved continuously in the ongoing discussion around
developments new EEDI targets for 2020 and beyond which requires continuous availability
of experts to represent the interests of the state (Metselaar 2015) Financial aid can therefore
be supplied in the following forms
Increased financial support for compliance and enforcement activities by maritime
administrations
Financial support could be provided to Flag States so that they have the resources to
properly carry out vessel inspections Consideration should be given to the introduction of
TRANL15371 21
an International Fund Convention set up for this purpose and contributed to by Port
States andor their major oil and other cargo exporters and importers
Commercial
Barriers
Private parties such as ship owners and investors are not always commercially incentivised to make
investments in energy efficiency measures This can be due to the split incentives between owner (who
should make the investment) and charterer (who reaps the cost savings) of a ship (see paragraph 25)
Furthermore access to finance can be problematic for smaller players who operate in niche markets
Measures
Bottlenecks in financing private investments and new financing mechanisms could be addressed during
regional or international workshops that include traditional and new financiers that could finance
investments in energy efficiency technologies
One solution that has been brought forward to address the problem of split incentives is the use of
lsquosmart contractsrsquo (Michele Acciaro 2013) The idea is to change charter contracts in a way that risks
and benefits are shared among charterers and ship owners In such contracts speed choice is more
flexible and the chartering cost of vessels is closer to fuel cost as such ship owners get motivated to
invest in energy-efficient technologies and charterers get stimulated to run vessels in an energy
conserving manner
With respect to the shipbuilding industry the following could facilitate the transfer of technology as
well
Financial assistance to shipyards to be provided at the national level or through other
arrangements
Foreign direct investment in software and hardware as an innovative way to support industry
in implementing the requirements
One type of incentive that governments can provide to enhance industry performance and technology
adoption is a competition for top performers Governments could contribute to a fund from which
money is distributed to the top 10 of best performers in a particular year
Cost estimates
Workshops and training
Capacity building workshops for administrations are estimated at euro 1000 per attendee for an
online workshop (1-2 days) Costs for the organisation of such workshops would include expert fees
and administrative costs These costs could be lower if the course material is already developed
(model workshops) Eg 2 attendees per Flag State for the ten most important Flag States
TRANL15371 22
(covering 74 of total fleet tonnage) comes down to euro 20000 or less in case the courseware is
already existent
A situation that is more conductive to networking and experience sharing is to send people physically
to regional workshops The costs of such workshops including participants travel and hotels for 50
participants would be between euro20000 - euro100000 per workshop based on our international
experience with organising workshops in the field of renewable energy and energy efficiency Costs
could be lower depending on the amount of preparation required cost of location (could be sponsored
by participating states)
Technical training
Trainings already exist for calculating and verifying EEDI including development of tools to calculate
EEDI For example MARIN offers 32h courses over 5 days in the Netherlands for euro 5000 per attendee
(excluding travel and accommodation)29 Lloyds offers similar trainings for similar costs30
Model courses for training may need to be updated depending on identified needs Ecofys estimates
the update of eg an existing EEDI model courses to cost in the order of euro 50000
Online platform for inventory of energy efficiency technologies
Inventories of energy-efficiency technologies already exist (for example in reports like (IMO 2009) and
on websites of for instance DNV-GL the efficiency finder31) but they could be further developed since
the websites are either not independent or incomplete
In order to facilitate information exchange a web-based platform could be established The role of the
platform would be for example to provide verified information on real-world energy efficiency
improvements via a monitoring programme For example in order to stimulate the deployment of
energy efficient trucks the Dutch government provides a website to share audited knowledge and data
on about 15 energy efficiency technologies32 The costs of such a website and corresponding
programme are estimated to be around euro 2 million for a 4 year period Furthermore a platform can be
used to inspire others by showing best practices and can be used for sharing of information regarding
network opportunities like conferences and seminars
Capacity building project
Currently the IMO-GEF-UNDP GloBallast project is a capacity building project it assists developing
countries and their maritime industries in implementing international regulations on ballast water
29 httpwwwmarinnlwebEventsCoursesSpecialist-Course-on-Ship-propulsion-model-tests-and-SpeedPower-trials-for-EEDI-Verifiers-
2731-October-2014htm 30 httpwwwlloydslistcomllsectorship-operationsarticle422262ece 31 httpswwwdnvglcommaritimeenergy-efficiencyefficiency-finderhtml 32 httpwwwtruckvandetoekomstnl
TRANL15371 23
management and preventing risks arising from the transfer of harmful aquatic organisms And has
several aspects that could also be used for knowledge transfer of energy efficiency measures
web-site
e-learning course
databasesdirectories
library collections
newsletter
Regional Task Force (RTFs) to support development and adoption of a regional approach
Develop and implement communication education awareness raising and outreach
programme
Develop introductory and more specialised training packages
Develop model legislations
The total budget for the 2008-2012 period was US$23 million out of which US$564 million represents
a GEF grant the rest being mostly in-kind contributions from the participating countries regional co-
ordinating organisations (RCO) and strategic partners including the private sector
Improved access to information and information sharing with international recognised organisations
including relevant survey and certification training would further promote the different technologies
TRANL15371 24
Conclusions
This study provides an overview of existing technologies which could drastically improve the energy
efficiency of ships Furthermore barriers to transfer and uptake of energy efficient technologies are
analysed and categorised and implications of these barriers are listed in order to facilitate the uptake
of energy efficiency technologies for ships
From this research it is clear that conventional technology is available that can cost-effectively (with a
payback time of less than 15 years) achieve high efficiency gains If the maximum gains per category
are added up (for all but ferry and cruise) this would mean a total efficiency improvement of 35
Even without taking two experimental technologies with potentially high efficiency gains into account
(wind power and air lubrication)
High investments like wind power and contra rotating propellers bring the highest savings (13 ndash 20)
The medium investments are in-between (5-10) and the low investments only bring relatively small
energy efficiency improvements (lt5)
When the ship owner has too few opportunities to share investment with charterers this leads to a split
incentive a ship owner may invest the up-front capital to put in energy-efficient technology but not
receive the benefits This is typically a problem for investments with a high payback time ie the wind
power and contra rotating propellers
The main barriers are related to the transfer of technology to Flag States Flag States are generally
third world and developing nations that often do not have the resources to enforce investigate or
prosecute breaches by their flagged vessels
Several ways to overcome the knowledge transfer barriers were presented that can be categorised as
follows
Workshops and trainings
o Capacity building workshops for administrations
o Regional workshops
Technical training
o Training in calculating and verifying the EEDI
o Development of model courses
Online platform
o Inventory of energy-efficiency technologies
o Creation of a website with all relevant information for the target audience
o Improved access to information and information sharing
o Provide verified information on real-world energy efficiency improvements via a
monitoring programme
TRANL15371 25
The most expensive of the capacity building actions is the capacity building project which takes all
aspects above into account If a project would be developed for knowledge transfer regarding energy
efficiency measures similar to GloBallast which assists developing countries and their maritime
industries in implementing international regulations on ballast water management and preventing risks
arising from the transfer of harmful aquatic organisms the total budget needed would be in the order
of US$23 million for a period of 5 years
TRANL15371 26
References
JFE Group 2013 ldquoJapan Marine Unitedrdquo JFE Group Overview JFE Group AISBL 2012 Making Industry-University partnerships work lessons from succesful collaborations
report Belgium AISBL
Allenstroumlm Bjoumlrn 2013 ldquoWind propulsionrdquo SSPA Sweden AB Gothenburg EffShip March
Aqorau T 2000 Illegal Unreported and Unregulated Fishing Considerations for Developing
Countries paper Honiara Solomon Islands South Pacific Forum Fisheries Agency
BALance 2014 Competitive position and future opportunities of the Euroean Marine Supplies
industry BALance Technology Consulting
Barringhaus David and Robert Olds 1999 OLDS ENGINEERING Maximizing Propulsion Efficiency
Marine Division Accessed Februrar 2015
httpwwwoldscomaumarinemaximizing_propulsion_efficiency
Becker Marine System not dated Becker Bulb Rudders httpwwwbecker-marine-
systemscom05_downloadszzpdfproduct_pdfBecker_Bulb_Rudderspdf Becker Marine
System
mdash 2015 Twisted Full Spade Rudder Accessed Feb 2015 httpbecker-marine-
systemscom03_productsproducts_twisted_full_spadehtml
Bloomberg 2014 China Loses Shipbuilding Crown to South Korea Chart of the Day 9th December
httpwwwbusinessweekcomnews2014-12-09china-loses-shipbuilding-crown-to-south-
korea-chart-of-the-day
Bluebird-Electric 2014 Sipbuilding post World War Two httpwwwbluebird-
electricnetship_boat_design_buildingshipbuilders_ship_repairers_associationhtm
Boat design 2007 Accessed Feb 2015
httpwwwboatdesignnetforumsattachmentspropulsion16743d1193341389-new-
propulsion-sytems-ships-grim-prop-1jpg
Brannigan Paschos Eyers and Wood 2009 Report on International avialtion and Mritime Emissions
in a Copenhagen (post 2012) Agreement Oxfordshire AEA Group
Chen Benjamin Arthur Reed and Ki-Han Kim 1989 A Vane-Wheel Propulsor for a Research and
Development Report Newport David Taylor Research Center
CNSS 2015 Clean North Sea Shipping - Clean Shipping Technology Accessed Februar 2015
httpcleantechcnssnoghg-technologiestechnical-measuresmeasures-related-to-the-hull
Crist Philippe 2009 Greenhouse gas emissions reduction potential from international shipping
Working paper OECD
Daily Times 2015 Nigeria Turkey seek collaboration on ships shipyards 5th January
httpwwwdailytimescomngarticlenigeria-turkey-seek-collaboration-ships-shipyards
Dillingham Gerald L 2000 Progress Made to Reduce Marine Pollution by Cruise Ships but Important
Issues Remain GAO report Washington United States General Accounting Office
DK Group 2015 Silverstream technologies January Accessed January 2015 httpdkgroupeu
DNV 2014 Encouraging Construction and Operation of Green Ships OECD
httpwwwoecdorgstiindC-WP6(2013)12-FINAL-ENGpdf
TRANL15371 27
DNV GL 2015 EFFICIENCY FINDER Accessed Feb 2015 httpwwwdnvglcommaritimeenhance-
performanceefficiency-finderaspx
Ecorys 2012 ldquoGreen growth opportunities in the EU shipbuilding sectorrdquo
ECOSPEED 2015 EUROPEAN MARINE amp MACHINERY AGENCIES LTD Accessed February 2015
httpwwweuropeanmarinecoukECOSPEEDhtm
gcaptain 2012 gcaptain - Propeller Technology to Make Your Ship More Efficient - Accessed Feb
2015 httpgcaptaincompropeller-technology-ship-efficient
Hansen Dinham-Peren and Nojiri 2011 Model and Full Scale Evaluation of a lsquoPropeller Boss Cap
FinsrsquoDevice Fitted to an Aframax Tanker Second International Symposium on Marine
Propulsors smprsquo11 Hamburg Germany June 2011
Hellenic Shipping News 2014 Korean ships sell at fuel-saving premium 22nd December
httpwwwhellenicshippingnewscomkorean-ships-sell-at-fuel-saving-premium
Hindawi 2015 Hindawi Puplishing Cooperation Accessed February 2015
httpwwwhindawicomjournalsijrm2012474785fig4
Hochkirch Karsten and Volker Bertram not dated ldquoSlow Steaming Bulbous Bow Optimization for a
Large Containershiprdquo Accessed Februar 2015 http2021148960resourcepdf5096pdf
Hollenbach Uwe and Juumlrgen Friesch not dated Efficient hull forms ndash What can be gained
Conference ship-efficiency Hamburg 2013 Hamburg HSVA Hamburgische Schiffbau-
Versuchsanstalt GmbH HamburgGermany
ICCT 2011 Reduce Greenhouse Gas Emissions from Ships - Cost Effectiveness of Available options -
white paper Washington DC International Council on Clean transportation (ICCT)
IMO 2011 REDUCTION OF GHG EMISSIONS FROM SHIPS Marginal Abatement Costs and Cost
Effectiveness of Energy-Efficiency Measures Submitted by the Institute of Marine Engineering
Science and Technology (IMarEST) MEPC 62INF7 International Maritime Organisation
IMO 2009 Second IMO GHG Study 2009 London International Maritime Organisation
JSEA 2006 ldquoImproved propulsive performance - Universal applies new energy-saving type Leadge
Bowrdquo Japan Ship Exports Association (JSEA) httpwwwjseaorjpVariableJSea318pdf
Kawasaki 2015 Energy-saving Technology Accessed Feb 2015
httpswwwkhicojpenglishshiptechconservationindexhtml
Leddy Fiona Jayne 2012 ldquoA critical legal analysis of International Shipping in Australian Waters and
the risk of ship-based oil pollutionrdquo Queensland Environmental Practice Reporter vol 17
Marinelog 2014 China white lists 51 shipyards 4 September
httpwwwmarinelogcomindexphpoption=com_k2ampview=itemampid=7667china-white-
lists-51-shipyardsampItemid=231
Metselaar Kees interview by Arno van den Bos 2015 Policy officer at directorate maritime affairs of
ministry of Intrastructure and Environment (February)
Michele Acciaro Peter Nyegaard Hoffmann Magnus Strandmyr Eide 2013 ldquoThe Energy Efficiency
Gap in the Maritime Transportrdquo Journal of Shipping and Ocean Engineering 1-9
MIWB 2015 Maritiem Instituut Willem Barentsz Accessed Feb 2015
httpsmijnmiwbnlnieuwsbriefindexphpdo=showampid_artikel=116
MOL 2011 Energy-Saving Propeller Boss Cap Fins System Reaches Major Milestone - Orders
Received for 2000 Vessels Accessed Feb 2015
httpwwwmolcojpenpr20111145html
TRANL15371 28
Motorship 2014 Gas fuelled ships into the future 31 10 httpwwwmotorshipcomnews101ships-
and-shipyardsgas-fuelled-ships-into-the-future
Nakashima 2015 Nakashima propeller CO LTD Accessed Feb 2015
httpwwwnakashimacojpengproductrudderhtml
Nielsen Shin Lundgren and Faghani not dated Combined Kappel propeller and rudder bulb system
for improved propulsion efficiency Frederikshavn MAN Diesel amp Turbo
OECD 2014 The OECD Council Working Party on Shipbuilding
httpwwwoecdorgindustryindshipbuildinghtm
OECD 2011 ldquoThe Shipbuilding Industry in Turkeyrdquo
office of technology assessment 1983 An Assessment of Maritime Technology and Trade report
Washington DC US Congress
Pakarinen Risto 2007 ldquoNothing common about common railrdquo Twentyfour7 (Twentyfour7) 64-65
Ports amp Ships 2015 Ports and Ships Accessed February 2015
httpportscozanewsarticle_2007_10_17_4038html
Rolls-Royce 2014 Propulsors - Moving your business in the right direction httpwwwrolls-
roycecom~mediaFilesRRolls-Roycedocumentscustomersmarinepropulsion-2014-
tcm92-8664pdf Aalesund Rolls-Royce Commercial Marine httpwwwrolls-
roycecom~mediaFilesRRolls-Roycedocumentscustomersmarinepromaspdf
Schneekluth H and V Bertram 1998 Ship Design for Efficiency and Economy Oxford
Butterworth-Heinemann
Schulze Reinhard 2007 Twisted Rudder - Extreme Design 14 SVA-Forum bdquo Ruder in Theorie und
Praxisldquo Potsdam 7 November 2007 Potsdam Schiffbau-Versuchsanstalt Potsdam GmbH
Selenetrawlers 2015 Selenetrawlers Accessed February 2015
httpwwwselenetrawlerscomcompanydesign-notes
Sepideh Jafarzadeh Ingrid Bouwer Utne 2014 ldquoA framework to bridge the energy efficiency gap in
shippinrdquo Energy 603-612
SetSail 2009 SetSail Accessed February 2015 httpwwwsetsailcomprop-nozzle-comments-by-
an-expert
Shuto Hideki 2010 Super Eco Inland Vessels httpwwwccr-
zkrorgtempwrshp120411Presentations2_04_HShuto_enpdf IHI Marine United Inc
Silberschmidt Noah 2014 ldquoGenerating efficiencies from thin airrdquo SMM Green shipping | Efficiency
httpwwwsilverstream-techcomwp-contentuploads201404HANSA-241112pdf
httpwwwsilverstream-techcomwp-contentuploads201404HANSA-241112pdf
Skinner Ian 2009 EU Tranport GHG Routes to 2050 Technical options for maritime and inland
shipping httpwwweutransportghg2050eucmsassetsTechnical-options-maritime-inland-
waterpdf Brussel European Commission
Statista 2015 ldquoLargest shipbuilding nations in 2013 based on completions in gross tonnagerdquo
httpwwwstatistacomstatistics263895shipbuilding-nations-worldwide-by-cgt
UK DfT 2014 ldquoDfT Port Statistics - World fleet registered trading vessels of 100 gross tons and over
gross tonnage on selected registers 1999-2013rdquo
httpswwwgovukgovernmentcollectionsmaritime-and-shipping-statisticsdata-tables-
associated-with-this-series
TRANL15371 29
Voorham 2013 Assessment of sustainable investment in shipping Master Thesis
Report SDPO13029m Delft 27 th November 2013 Delft Delft University of Technology
WAumlRTSILAuml 2009 ldquoEnergy Evironment Economyrdquo Helsinki Finland WAumlRTSILAuml
mdash 2007 ldquoWaste heat recoveryrdquo Waumlrtsilauml Corporation
Wettstein and Brown 2008 Derating a solution for high fuel savings and lower emissions
Winterthur Waumlrtsilauml Switzerland Ltd
Wind Chellenger Project HP 2015 Wind Chellenger Project HP Accessed Feb 2015 httpwindku-
tokyoacjpindex_enhtml
TRANL15371 30
Appendix I - World fleet registered trading vessels
Table 3 World fleet registered trading vessels of 100 gross tons and over 2009-2013 Source UK DfT 2014
Flag Country 2009 2010 2011 2012 2013
(World Total) 8448 9130 9831 10343 10725
Panama 1886 1979 2084 2158 2172
(European Union) 1900 1979 2074 2051 2106
Liberia 908 1037 1167 1238 1241
Marshall Islands 475 590 711 811 900
Hong Kong 449 553 678 785 854
Singapore 398 434 512 592 677
Malta 348 380 438 450 496
Bahamas 452 469 481 483 485
Greece 388 407 411 411 415
China 282 327 356 388 411
United Kingdom (inc IOM and CI) 258 273 294 300 288
Cyprus 201 205 207 197 203
Japan 138 156 167 178 192
Italy 150 169 181 180 176
Norway 152 145 143 144 145
Germany 152 155 153 137 123
Denmark 107 115 113 113 122
Korea South 120 124 116 111 112
Indonesia 69 82 91 101 111
Bermuda 94 100 106 109 105
Antigua amp Barbuda 100 107 111 106 100
United States of America 107 108 102 99 97
India 83 83 89 85 82
Netherlands 76 61 67 66 69
Turkey 54 58 62 64 59
Malaysia 69 72 71 62 57
France 63 63 64 56 53
Russia 47 49 49 51 52
Philippines 50 51 50 43 43
Cayman Islands 27 29 32 32 31
Taiwan 25 26 27 30 31
Iran 09 08 05 21 31
Thailand 25 26 22 26 29
Sweden 39 35 33 28 27
St Vincent amp the Grenadines 47 42 37 28 24
Canada 24 24 25 24 23
Spain 22 25 26 25 23
Kuwait 23 19 24 24 22
Brazil 20 20 19 19 20
Cambodia 18 17 13 13 12
TRANL15371 31
Appendix II - Most important shipbuilding
countries
China
China is an emerging shipbuilder that overtook South Korea during the 2008-2010 global financial crisis
as they won new orders for medium and small-sized container ships (Bloomberg 2014 Bluebird-Electric
2014)
Figure 14 delivery of vessels from Chinese and South Korean shipyards in million compensated gross tons a measure
of building time and human resources used per ton Source (Bloomberg 2014)
China has more than 1600 shipyards Analysts have predicted that about one third of them will fold
as the industry struggles with overcapacity Last year China laid out a three year plan for industry
restructuring that urged yards to concentrate on building higher quality vessels and local governments
to halt approvals for new projects (Bluebird-Electric 2014)
After two decades of a loan-fuelled boom Chinarsquos shipbuilding industry has become saddled with debt
and overcapacity prompting some private firms to seek financial assistance from the state In
September the government issued a list of 51 shipbuilders it deemed worthy of public support
(Marinelog 2014)
TRANL15371 32
New additions to the white list include subsidiaries of the China State Shipbuilding Corporation (CSSC)
and the China Shipbuilding Industry Corporation (CSIC) and the AVIC Weihai Shipyard owned by the
Aviation Industry Corporation of China (AVIC) (Marinelog 2014)
South Korea
By the end of 2014 it seemed South Korea has overtaken China again as the worlds largest
shipbuilding country with a global market share of about 30(see Figure 14) (Bloomberg 2014)
(Bluebird-Electric 2014) South Korea leads in the production of large vessels such as cruise liners
super tankers LNG carriers drill ships and large container ships
South Koreas shipyards are highly efficient with the worlds largest shipyard in Ulsan operated by
Hyundai Heavy Industries slipping a newly built $80 million vessel into the water every four working
days South Koreas big three shipbuilders Hyundai Heavy Industries Samsung Heavy Industries
and Daewoo Shipbuilding amp Marine Engineering dominate global shipbuilding with STX Shipbuilding
Hyundai Samho Heavy Industries Hanjin Heavy Industries and Sungdong Shipbuilding amp Marine
Engineering also ranking among the top ten shipbuilders in the world In 2007 STX Shipbuilding further
strengthened South Koreas leading position in the industry by acquiring Aker Yards the largest
shipbuilding group in Europe (The former Aker Yards was renamed STX Europe in 2008) In the first
half of 2011 South Korean shipbuilders won new orders to build 25 LNG carriers out of the total 29
orders placed worldwide during the period
To maintain their market position Korean yards also focus more and more on greening opportunities
The Korean government introduced a GHG emission reducing program in 2008 The program is aiming
at reducing GHG emissions throughout all economic sectors including the shipping and shipbuilding
industry Also the Japanese Shipbuilding Association (SAJ) is looking into the possibilities to reduce
GHG emissions so that the shipbuilding industry becomes greener and more competitive (Ecorys
2012)
Japan
Japan had been the dominant ship building country from the 1960s through to the end of 1990s but
gradually lost its competitive advantage to the emerging industry in South Korea which had the
advantages of much cheaper wages strong government backing and a cheaper currency South Korean
production overtook Japans in 2003 and Japanese market share has since fallen sharply
The Philippines
The Philippines has placed fourth among shipbuilding nations around the world producing more than
six million deadweight tonnes of ships built in 2012 The country is anchored by South Korean Hanjin
and Japans Tsuneishi shipbuilders The country has shipyards in Subic and Cebu
TRANL15371 33
Europe
For several decades European shipyards have been facing strong global competition from especially
Asian enterprises (Japanese yards in the 1950s and 60s Koreans from the 1970s and 80s and Chinese
since the 1990s) In Europe this has led to an almost complete exit from the mass production segments
of tankers bulkers and containerships Response of the EU industry has been to focus on the higher
value more complex ship types such as ferries and passenger ships non-cargo vessels and general
cargo ships In addition only limited numbers of vessels of the same type are being built (in contrast
with bulk vessels which are mass produced) Europe has a 77 percent market share in building
passenger vessels (including both cruise ships as well as ferries) and a 17 percent share in the
construction of non-cargo vessels (Ecorys 2012) These segments make up a relatively small share of
the world orderbook (in CGT) However in value they represent a much higher share due to their
relatively sophisticated characteristics The position of the European shipbuilding industry in the
manufacturing of specialised innovative vessels is still strong At the same time European equipment
manufacturers have acquired a leading role in quality products especially in complex high value
equipment components
Figure 15 World orderbook and CESA orderbook by ship type in 2010 (CGT x 1000) (Source Ecorys 2012)
Regarding the marine equipment sector the European industry is renowned for propulsion cargo
handling communication automation environmental and security systems This equipment is not only
destined for complex European-built ships but also exported to Asian yards whether or not requested
by their clients (Ecorys 2012)
Compared to the ship construction sector the marine equipment segment is highly heterogeneous and
consists of companies that are often also active in other business areas (ie automotive or aircraft
industry) A study by (BALance 2014) found that the European marine equipment industryrsquos
TRANL15371 34
competitiveness lies in a strong market position and technological leadership at least for globally active
European marine supply companies who build their position on a strong infrastructure and co-operative
partners skill of their employees and close relationship with their customer base Conversely identified
weaknesses are the cost level in Europe and the heterogeneous structure of the industry with many
SMEs which hinder in some cases attempts to follow the markets by globalisation strategies
Turkey
Shipbuilding in Turkey has evolved from an old traditional activity in Anatolia to an internationally
recognised industry especially since the early 1990s The industry has modern shipyards that can build
ships yachts mega-yachts and sailing boats as well as carrying out extensive repair and conversion
works Turkeyrsquos shipyards are mainly located in the Marmara Region namely Tuzla Yalova and İzmit
which have developed into dynamic shipbuilding centres Also in recent years the emerging Black Sea
and Mediterranean Regions have increasingly attracted shipyard investments
In the last decade in parallel with developments in the global market Turkish shipbuilding experienced
a several-fold increase in its shipbuilding and export capacity including a significant product
diversification According to order books this resulted in Turkey being regularly placed in the top ten
countries on the basis of its deadweight (dwt) production and in the top five countries by the number
of ships
In recent years Turkey has increasingly tapped into niche markets which in turn has led to a growing
participation by Turkish shipyards in the international trade in new ships In parallel there has also
been strong growth in the marine equipment manufacturing sector which could increasingly also tap
the export market These developments reflect in part the strategic location of the yards the
experienced workforce the quality of production and Turkeyrsquos significant role as a political cultural and
economic bridge between Europe and Central Asian and Middle Eastern economies (OECD 2011)
ECOFYS Netherlands BV | Kanaalweg 15G | 3526 KL Utrecht| T +31 (0)30 662-3300 | F +31 (0)30 662-3301 | E infoecofyscom | I wwwecofyscom
ECOFYS Netherlands BV
Kanaalweg 15G
3526 KL Utrecht
T +31 (0) 30 662-3300
F +31 (0) 30 662-3301
E infoecofyscom
I wwwecofyscom
HOW TO OBTAIN EU PUBLICATIONS
Free publications
bull one copy
via EU Bookshop (httpbookshopeuropaeu)
bull more than one copy or postersmaps
from the European Unionrsquos representations (httpeceuropaeurepresent_enhtm)
from the delegations in non-EU countries
(httpeeaseuropaeudelegationsindex_enhtm)
by contacting the Europe Direct service (httpeuropaeueuropedirectindex_enhtm)
or calling 00 800 6 7 8 9 10 11 (freephone number from anywhere in the EU) () () The information given is free as are most calls (though some operators phone boxes or hotels may charge you)
Priced publications
bull via EU Bookshop (httpbookshopeuropaeu)
Priced subscriptions
bull via one of the sales agents of the Publications Office of the European Union
(httppublicationseuropaeuothersagentsindex_enhtm)
doi 102834880780
ML-0
1-1
5-4
39-E
N-N
[Ca
talo
gu
e n
um
be
r]
TRANL15371 6
Also other parties are allowed to inspect vessels under MARPOL Article 6 when violations are detected
or for regular inspections A Party may also inspect a ship to which the present Convention applies
when it enters the ports or off-shore terminals under its jurisdiction if a request for an investigation is
received from any Party together with sufficient evidence that the ship has discharged harmful
substances or effluents containing such substances in any place
Role of Port States
Under ldquoPort State Controlrdquo arrangements Port States also have the authority to conduct vessel surveys
on ships which visit their ports and to detain those ships that fall below MARPOL requirements In
relation to MARPOL Annex VI chapter 4 any port state inspection shall be limited to verifying when
appropriate that there is a valid International Energy Efficiency Certificate on board10
Cooperation between Port and Flag States
Under MARPOL parties are required to co-operate in detecting vessel violations and are required to
use all practical measures to detect and monitor violations If a State has evidence of a violation they
are obligated to forward this evidence to the vesselrsquos Flag State
All ships flagged under countries that are signatories to MARPOL are subject to its requirements
regardless of where they sail and member nations are responsible for vessels registered under their
respective nationalities
When incidents occur outside the countrys jurisdiction or jurisdiction cannot be determined the
country refers cases to Flag States in accordance with MARPOL Some States are not happy with the
lack of response from Flag States United States experience of Flag States not responding has led to
new policy which would take direct enforcement action against vessels for MARPOL V violations
occurring between 3 and 200 nautical miles from the United States rather than referring such violations
to the flag states (Dillingham 2000)
Ship owners and charterers
A ship owner is the owner of a commercial ship A ship owner is someone who equips and exploits a
ship usually for delivering cargo at a certain freight rate The ship owner determines the specifications
of the ship and its energy efficiency measures but the benefits of low fuel consumption are not always
theirs when the ship is chartered to someone else
Depending on the type of ship and the type of charter normally a standard contract form called a
charter party is used to record the exact rate duration and terms agreed between the ship owner and
the charterer
10 MARPOL Annex VI Regulation 10
TRANL15371 7
A charterer may be a party without a cargo who takes a vessel on charter for a specified period from
the owner and then trades the ship to carry cargoes at a profit above the hire rate In some cases a
charterer may own cargo and employ a shipbroker to find a ship to deliver the cargo for a certain price
Two main types of charter can be distinguished time charter and voyage charter In a voyage charter
the owner is still responsible for the port fuel and crew costs In a time charter the charterer selects
the ports and directs the vessel where to go The charterer pays for all fuel the vessel consumes port
charges commissions and a daily hire to the owner of the vessel
When there are too few opportunities to share investment with charterers this leads to a split incentive
a ship owner may invest the up-front capital to put in energy-efficient technology but doesnrsquot then
recoup the costs from fuel savings as they charter their ships out as this goes to the charterers This
problem is particularly apparent for short-term time charters11
Conclusions
Regarding energy efficiency the work of the AHEWG-TT12 has shown that the main shipbuilding nations
all have access to the necessary technologies provided there is demand for them It has also been
noted that there is no need for transfers of intellectual property rights13
One of the major barriers to the effective implementation of the EEDI and the SEEMP is the heavy
reliance it places on Flag States for inspection of vessels and enforcement of provisions During the
1970rsquos ships were being reflagged from high tax and high regulation countries such as the United
States and the United Kingdom to countries offering Flags of Convenience (lsquoFOCrsquo) Under FOCs ship-
owners pay less tax to the relevant Flag State and are able to evade the majority of the environmental
and construction standards set out under MARPOL (Leddy 2012) The main reason for that is that
several Flag States are not signatories to all MARPOL Annexes (eg as of 20142015 the Bahamian
Bolivian Cambodian North Korean Georgian Honduran Lebanese and Sri Lankan flags of
convenience had not ratified all MARPOL treaty annexes III-VI14 15)
Many FOCs are developing nations that do not have the resources to enforce investigate or prosecute
breaches by their flagged vessels (Aqorau 2000) As of 2014 55 of merchant ships are flagged by
FOC and 40 of ships are flagged by FOCdeveloping countries MARPOL only provides guidelines for
Flag States to follow when surveying vessels under regulation 6 but none of these guidelines are
mandatory Conversely Port States which are developed are better equipped to bear the cost of
inspection investigation enforcement and prosecution costs However in relation to EEDI and the
11 httpssi2040orgwhat-we-dowork-streamsfinance 12 MEPC 6831 Progress report of the Ad Hoc Expert Working Group on Facilitation of Transfer of Technology for Ships 13 Submission of the United States on Task 3 of the Ad Hoc Expert Working Group on Facilitation of Transfer of Technology for Ships Jan
2015 14 wwwics-shippingorgdocsflag-state-performance-table 15 httpwwwimoorgAboutConventionsStatusOfConventionsPagesDefaultaspx status of conventions
TRANL15371 8
SEEMP port state control is limited to verifying when appropriate that there is a valid International
Energy Efficiency Certificate on board
We therefore conclude that there needs to be a focus on enabling Flag States and Port States that lack
the resourcescapacity to enforce the EEDI and the SEEMP in order to further stimulate the adoption
of energy efficiency technologies Also attention should be paid to overcoming the barrier of split
incentives ie where the benefits of energy efficiency measures are not transferred from the charterer
to the investor (owner)
TRANL15371 9
3 Energy Efficiency Measures for Ships
In order to understand the important energy efficiency measures that can help improve energy
efficiency from shipping it is interesting to see the split between new-built ships and existing fleet In
2012 some 3655 merchant ships were delivered worldwide about 6 of the worldrsquos merchant fleet
of about 60000 The average age of the merchant fleet is 19 years Therefore measures for both new
ships and retrofits for old ships are important for improving the energy efficiency in the next decades
If only the new ships would be targeted only 50 of the fleet would be more efficient in the next
decades while there are many retrofit measures available The total fleet can be broken down to about
4000 passenger ships just under 14000 tankers and about 37000 dry cargo ships including about
5000 container ships (Statista 2015)
In order to identify the most interesting energy efficiency measures for ships we used the information
from several reports to develop a long-list Many measures improve the efficiency in the order of up to
5 Here we would like to focus on measures that result in high savings that can be applied to many
ship types and preferably also to existing ships The resulting short-list is presented in the next table
We used the main categories identified by AHEWG-TT for structuring the measures
The main categories defined by AHEWG-TT are
1 Hull
2 Main Engine
3 Auxiliary engines
4 Propellers and rudders and
5 Control systems
Since the auxiliary engines typically consume only a fraction of the energy that goes to the main
engines their energy efficiency measure results do not show in the short-list below The measures are
worked out in more detail in the paragraphs below The main engine and auxiliary engine improvements
are covered in the same paragraph
The common rail upgrade is a simple measure that can be easily applied to all ships even when the
ship is not in the dry-dock The details are available in the paragraph about engines
From the list it is clear that conventional technology is available to achieve high efficiency gains If the
maximum gain per category is added up (for all but ferry and cruise) this would mean a total efficiency
improvement of 35 even without taking two experimental technologies with potentially high efficiency
gains into account (wind power and air lubrication) Note that some technologies are not applicable to
all ships
In order to find possible financial barriers the investments are rated from ldquovery lowrdquo to ldquohighrdquo relatively
to the size of the ships The same measure on a larger ship is obviously more expensive
TRANL15371 1
Table 1 Inventoryranking of energy efficiency measures
Main category
Measure Estimated efficiency (range)
Efficiency at average circumstances
Ease of installation
Payback time
Investment Implementation References
Hull Bow optimisation
25-20 10 all ship types
short (lt3 years)
Medium conventional technology
(IMO 2009 IMO 2011 Crist 2009 Hochkirch und Bertram not dated)
Main Engines
Wind power 5-44 20 only special ship types
long (gt15 years)
High experimental technology
(IMO 2011 IMO 2009 Crist 2009 ICCT 2011 Brannigan et al 2009 Allenstroumlm 2013)
Propellers and Rudders
Ducted propeller
1-20 10
all ship types except ferry and cruises
medium (4-15 years)
Medium conventional technology
(IMO 2011 IMO 2009 Crist 2009 ICCT 2011)
Propellers and Rudders
Contra-rotating propellers
6-20 13 only special ship types
long (gt15 years)
High conventional technology
(IMO 2011 IMO 2009 Crist 2009 WAumlRTSILAuml 2009 Shuto 2010)
Propellers and Rudders
Wheels 10 10
all ship types except ferry and cruises
short (lt3 years)
Medium conventional technology
(IMO 2009 Schneekluth und Bertram 1998 Brannigan et al 2009)
Control Systems
Waste heat recovery
6-10 8 new build only
medium (4-15 years)
Medium conventional technology
(IMO 2011 IMO 2009 Crist 2009 WAumlRTSILAuml 2007 ICCT 2011)
Propellers and Rudders
Rudder bulb 2-5 4
all ship types except ferry and cruises
medium (4-15 years)
Low conventional technology
(IMO 2011 IMO 2009 Nielsen et al not dated Crist 2009 ICCT 2011)
Propellers and Rudders
Post swirl fins
2-5 4
all ship types except ferry and cruises
short (lt3 years)
Low conventional technology
(IMO 2009 MOL 2011 Hansen Dinham-
Peren und Nojiri 2011 Nielsen et al not
dated)
Hull Hull coating 1-9 5 all ship types
short (lt3 years)
Low conventional technology
(IMO 2011 IMO 2009 ICCT 2011 Voorham 2013 Crist 2009)
Hull Air lubrication
5-15 9 new build only
medium (4-15 years)
Medium experimental technology
(IMO 2011 IMO 2009 Crist 2009 DK Group 2015 CNSS 2015 ICCT 2011)
Propellers and Rudders
Twisted rudder
2-4 3
all ship types except ferry and cruises
medium (4-15 years)
Low conventional technology
(IMO 2009 Schulze 2007 Nakashima 2015 Becker Marine System 2015 Nielsen et al not dated Hollenbach und Friesch not dated Rolls-Royce 2014)
Main Engines
Main engine de-rating
2-4 3
all ship types except ferry and cruises
medium (4-15 years)
Low conventional technology
(IMO 2011 IMO 2009 Crist 2009 Wettstein und Brown 2008 DNV GL 2015)
Auxiliary engines
Common rail upgrade
- - all ship types
medium (4-15 years)
Very Low conventional technology
(DNV GL 2015) (ICCT 2011) (IMO 2009)
Main Engines
Common rail upgrade
01-05-
03 all ship types
medium (4-15 years)
Very low conventional technology
(IMO 2009 Pakarinen 2007 ICCT 2011 Crist 2009)
TRANL15371 2
Hull and superstructure
In general the optimisation of hull and superstructure focuses on minimising the resistance by reducing
the wave resistance and friction between water and hull It is important to recognise which type of
vessel is to be optimised The reduced frictional resistance increases energy performance of the vessel
particularly at low speeds Operability and performances of the ship must be considered in detail The
improvements measures are generally applied at new-built ships but also applicable to retrofitting
Bow optimisation
The different bow optimisations can improve the water flow around the hull and reduce the wave-added
resistance for large vessels with high block coefficient operating within commercial speed ranges The
average energy reduction potential ranges from 25-20 on average 10 (Crist 2009 IMO 2011
Voorham 2013)
Figure 3 Left The green line characterises the ordinary bow wave of the hull The blue line characterises the wave
formed by the bulb The red line is the sum of these two The altitude of the bow wave is noticeably reduced which
reduces the hull drag associated with the bow wave This improves fuel economy and increases range (Selenetrawlers
2015) Right Ordinary bulbous bow leadge bow and ax-bow shape (JSEA 2006)
The below-the-waterline extension of the bulbous bow (Figure 3) modifies the way the water flows
around the hull reducing drag and thus increasing speed range fuel efficiency and stability An altered
design is the ax-bow (Figure 3) The narrow designed bow slashes through the water in order to reduce
slamming and reduces the size of bow generated wave The propeller can act more efficient due to the
absence of slamming The ax-bow allows the ship to steer well to maintain speed and the engine to
save fuel (Crist 2009 IMO 2009) If the bulbous bow is modified during a regular docking period the
investment is estimated to have short payback of about 1-3 years It is most promising for container
vessels (DNV GL 2015 Hochkirch und Bertram not dated)
Barriers The bow optimisation (as retrofit) needs to be done in the dry dock Dry-docking is not
regularly happening for existing ships because it means that the ship cannot operate and economic
losses are suspected Another obstacle might arise due to restricted access to the original contractual
hull plans since shipyards are not always keen to provide detailed plans on their vessels to prevent
TRANL15371 3
imitation (Hochkirch und Bertram not dated DNV GL 2015) A major obstacle is the split incentive
between ship owner and operator Ship owners are responsible for investing in these technologies and
ship operators are those who pay for the fuel consumption and benefit from such technologies (ICCT
2011)
Technical maturity The technique is available on the market and is effective Only conventional
material is needed and redesign can be done in a few weeks16
Applicability Applicable to all ship types but most efficient for ships with a high block coefficient like
tankers and bulk carriers since the reduction of the wave-added resistance is most impacting (IMO
2009)
Hull coating
Hull coatings (Figure 4) can lower frictional resistance and limit fouling by aquatic organisms It can
save between 1-9 fuel consumption on average 5 (ICCT 2011 Voorham 2013 Crist 2009)
Figure 4 Example of hull coating (ECOSPEED 2015)
One way of lowering the frictional resistance is to improve the smoothness of a hull by means of
coatings that reduce fouling The costs are lifetime cost reduction and have to be recur every five years
to be able to gain the fuel benefit
Barriers A new application is typically necessary during each dry-docking The self-polishing coating
must be renewed after a 3-5 years period (IMO 2009) A major obstacle is the divided interest between
ship owner and operator Ship owners are in charge for investing in these technologies and ship
operators are those who pay for the fuel consumption and profit from such technologies (ICCT 2011)
Technical maturity Coating techniques are available on the market and roughly 5 of newly painted
ships are painted with one of the advanced coating systems presently available (IMO 2011 ICCT 2011)
The payback time is short (ICCT 2011) or 0-2 years according to others17
Applicability The technology is applicable to all vessels
Air lubrication
The air lubrication technique creates a layer of bubbles underneath an already streamlined hull in order
to further reduce friction An automation system regulates the compressorsblowers depending on
16 httpwwwship-efficiencyorgonTEAMpdf14-Ship20efficiency20seminar20-20CMA20CGM-
20HydrOcean20120CMA20pdf 17 httpswwwdnvglcommaritimeenergy-efficiencyefficiency-finderhtml
TRANL15371 4
speed The blower keeps holes filled with air and required pressure A thin layer of bubbles trailing
behind of each cavity merge into single large ldquoair layerrdquo for the whole flat bottom part of the hull and
reduces the friction (Figure 5) Depending on the ship type the estimate fuel efficiency ranges between
5-15 (on average 9) where tankers and bulkers can reduce more (10-15 on average 125) in
comparison to container vessels (5-9 on average 7) (IMO 2009 DK Group 2015 CNSS 2015 ICCT
2011 Voorham 2013)18
Figure 5 Schematic view of air lubrication (DK Group 2015)
Barriers Large capital investment requirements with split incentive The vessel owners are
accountable for investing in these technologies whereas vessel operators recompense for the fuel
consumption and benefit from such technologies (ICCT 2011)
Technical maturity The technology is available on the market but still in a pilot phase Sea trials
have been performed with small demonstration ships There are no vessels operating commercially
that currently use this technique Specifications about the payback time vary from short to medium
(Silberschmidt 2014 Skinner 2009)
Applicability The original technology would be likely be applied to new-built ships with at least a
partly flat bottom and a minimum length of 225 metres since the compressor may have technical
problems maintaining air cavities for deep draft ships (IMO 2011 CNSS 2015) Air lubrication can be
used for retrofitting as well (CNSS 2015)
Engines
Speed reductions on existing vessels provide opportunities for engine optimisation on low power
(321) Similar measures as de-rating for the main engines that could be implemented are cylinder
cut-out and new torsional vibration calculation (IMO 2009)
18 It has to be noted that the extra fuel use caused by the system itself should also be taken into account
TRANL15371 5
Another propulsion supportive measure with a high potential measure is wind power This is also
explained in more detail below In order to also provide a measure with a lower improvement potential
per ship but simple and applicable to all ships we describe the common rail system for fuel injection
Main engine de-rating
Slow steaming vessels are known as one of the most effective energy saving measure The potential
comes mainly from the operational behaviour side From the technical side the specific fuel oil
consumption will decline when a ship is no longer operated at its design speed
The design speed can be reduced by de-rating the main engine (IMO 2011 IMO 2009) Reduction of
power combined with injection timing advanced to restore peak combustion pressure can achieve a
certain gain in shaft efficiency Fuel efficiency can be improved by 2-4 when de-rating is performed
for loads lower than the maximum design load (Wettstein und Brown 2008 Crist 2009) on average
3 energy efficiency potential (Crist 2009) Operational costs would be lower mainly due to fuel
savings (DNV GL 2015 Crist 2009 Wettstein und Brown 2008)
Barriers A slower vessel will have lower incomes as it is not capable to perform as much transport
load per unit of time as a faster vessel De-rating the engine is usually done when it is clear that the
ship will become a slower steaming ship There is a split incentive between vessel owners who are
responsible for investing in these technologies and vessel operators who are those who compensate
for the fuel consumption and benefit from such technologies (ICCT 2011)
Technical maturity This technique has been proven as successful particularly on older engines
which are normally built with a low compression ratio and thereby have a significant potential to
improve their efficiency (IMO 2009) De-rating measures have a low to medium payback time (Crist
2009 DNV GL 2015)
Applicability The technologies are available on the market It is applicable to all vessels (DNV GL
2015)
Common-rail upgrade (common-rail fuel injection)
Engines with common-rail fuel injection handle low-load working modes much better (IMO 2009) A
common-rail fuel injection is technique of injecting fuel into an engine cylinder under total control and
thereby achieving optimal combustion Common-rail allows the start and duration of injection
independent of the position of the pistons in that way permitting an operationally optimised injection
per stroke In a normal diesel engine fuel is injected at a static rate by a pump and common practice
is to optimise this pump to run at an optimal setting for the ideal injection time (Pakarinen 2007) The
energy efficiency potential is estimated between 01-05 on average 03 (ICCT 2011 IMO 2009)
Barriers Additional electronics can also introduce possibilities for failures However recent
advancements have increased the systems popularity19 There is a split incentive between vessel
19 httpwwwmarineinsightcommarinean-overview-of-common-rail-system-in-marine-engines
TRANL15371 6
owners who are responsible for investing in these technologies and vessel operators who are those
who compensate for the fuel consumption and benefit from such technologies (ICCT 2011)
Technical maturity This measure is available on the market (ICCT 2011) Payback time is short to
medium with an average of 5 years (IMO 2009 Crist 2009)
Applicability This measure is applicable to new and retrofit vessels It is applicable for tanker- bulk-
container- and Roro-ships (Crist 2009)
Auxiliary engines and systems
Based on our own estimation auxiliary engines improvement are not bringing gt2-4 energy savings
because auxiliary engines consume much less fuel than the main engine Similar measures as de-rating
for the main engines and common rail upgrade could be implemented for the auxiliary engine
Other options for improving auxiliary systems are speed control of pumps and fans control strategies
of cooling water systems room ventilation redesign of piping and instruments advanced computation
of airgas temperature distribution with reduced storage ventilation and with optimised ventilation
systems (DNV GL 2015)
Barriers There is a split incentive between vessel owners who are responsible for investing in these
technologies and vessel operators who are those who compensate for the fuel consumption and benefit
from such technologies (ICCT 2011)
Technical maturity This measure is available on the market (ICCT 2011) It is easy to apply and
uncomplicated in maintenance (DNV GL 2015) Payback time is short (DNV GL 2015)
Applicability This measure is applicable to all new and retrofit types of ships (DNV GL 2015)
Wind power
Wind power measures are available that can develop enough thrust to provide at least some supportive
propulsion Wind power can be utilised in various ways in shipping like traditional sails solid wing sails
Flettner-rotor and kits (see Figure 6) The techniques are currently used as supplementary power
(Brannigan et al 2009)
Figure 6 from left to right Kite (Cargill 2011) Flettner rotor (MIWB 2015) and solid sails (Wind Chellenger Project
HP 2015)
Solid wing sails are structured similar to aircraft wings which offer more thrust with less drag than
conventional sails Flettner rotors produce thrust from a rotating object in wind using the so-called
TRANL15371 7
Magnus effect The techniques have different characteristics with regards to how the thrust that is
produced relates to other factors such as wind strength wind angle wind stability and ship speed
(IMO 2009)
Towing kites vary from other concepts of wind power by having a small footprint during installation and
therefore being quite feasible to retrofit (Allenstroumlm 2013) Studies conducted at the Technical
University of Berlin indicated that the potential for sail energy has different prospective in the different
regions in the world Best scenarios exist in North Atlantic and North Pacific regions the South Pacific
seems a bit less potential The studies have shown that under normal circumstances the typical savings
using wind power may be 5 at 15 knots and up to 20 at 10 knots This study also revealed that
with optimal weather routing in the North Atlantic and given the best vessel with best sail type savings
can reach 15 percent at 15 knots and 44 at 10 knots (IMO 2009 Crist 2009) Nevertheless the
above figures should be considered indicative since practical experiences are limited Sail- and kite-
assisted power does seem to be a potential opportunity saving energy in the medium- and long-term
picture for shipping (IMO 2009) Christ estimates and average energy saving potential around 20
(2009)
Barriers There is a split incentive between vessel owners who are responsible for investing in these
technologies and vessel operators who are those who compensate for the fuel consumption and benefit
from such technologies (ICCT 2011) Although this technology can bring high energy savings the
investment is so high that there is not a short payback time
For solid wing sails complications could result in a need for masts to run down to the keel which can
be a bigger issue for retrofitting Additionally the presence of the mast and rigging could have significant
impacts on cargo handling (IMO 2009) Downside of the kite systems include the complex launch
recovery and control systems that are needed (IMO 2009)
Technical maturity This is still considered as experimental technology The technical barriers
identified above need to be tackled for this measure to be applied widely in the future Payback time is
estimated to be medium to long term (Allenstroumlm 2013 Crist 2009)
Applicability Wind power technologies are available and a number of cargo ships have been equipped
with wind engines to reduce demands from diesel engines (ICCT 2011) Kites can be used on ships
with a minimum length of 30m and works most energy efficient on ships with a typical speed not faster
than 16 knots Preferably tankers (crude oil product chemical LPG LNG other) and bulk carriers are
being considered as potential users due to this speed restriction (IMO 2011)
Control Systems Waste heat recovery
Waste heat recovery (WHR) technology can pass exhaust gases from a vessels engines through a heat
exchanger to generate steam for a turbine-driven generator The heat energy from the exhaust gas is
taken and transformed into electrical energy to reduce direct engine-fuel consumption for the
propulsion system or reduce auxiliary engine needs (ICCT 2011) Energy saving potential is estimated
between 6-10 on average 8 (Crist 2009 ICCT 2011)
TRANL15371 8
Figure 7 Efficiency of waste heat recover systems Sankey diagramme Even with high 50 efficiency of modern low-
speed engines there is still 50 of fuel input energy not being put to productive use The possibilities are illustrated
by this comparison of Sankey diagrammes for Waumlrtsilauml 12RT-flex96C engines without heat recovery (left) and with
high-efficiency waste heat recovery plant (right) showing in this case 114 gain in overall efficiency with WHR
(waste heat recovery) (WAumlRTSILAuml 2007)
Barriers Large capital investment requirements (around $5-6 million for a large container ship20) and
split incentive between ship owners and ship operators (ICCT 2011)
Technical maturity The technology is available on the market and has medium to long payback time
(WAumlRTSILAuml 2007 Crist 2009)
Applicability A WHR system is applied to vessels with a high production of waste heat and a high
intake of electricity WHR can be employed on ships with main engine average performance is higher
than 20000 kW and auxiliary engine average performance higher than 1000 kW This size
requirements limit the number of ships using this technology (IMO 2011) Generally it is applicable to
all ships types new and retrofit (Crist 2009)
Propellers and Rudders
Numerous devices have been designed for improving the energy consumption of vessels by recovering
as much as possible of this rotational energy in the flow from the propeller or to provide some pre-or
post-rotation of the in flow into and after the propeller to ensure best efficiency The most important
of these will be discussed in the following paragraphs (IMO 2009)
Ducted propeller (Kort Nozzle)
The accelerating ducted propeller consists of a screw propeller surrounded by a non-rotating duct
(nozzle) (Figure 8) Compared to the conventional propeller of the same diameter and thrust this
20 httpgcaptaincompower-exhaust-gas-paybacks-waste
TRANL15371 9
arrangement allows an increase inflow to the propeller improving the operating conditions around the
propeller and the ideal efficiency
Figure 8 Right photos of this Norwegian trawler (SetSail 2009)
The duct creates additional thrust load The potential for energy savings on relevant vessels range
between 1ndash20 (Crist 2009 IMO 2011 Barringhaus und Olds 1999 IMO 2009) whereupon 10 is a
good average value (IMO 2009 Crist 2009) The improvement of the combination of propeller and duct
overweigh negative effect of the increase water resistance caused by the duct
Barriers Since the duct has an optimal operational speed it does not work efficient at all speeds For
instance as drag increases with increasing speed eventually this will become larger than the added
thrust Therefore at high speeds ducts are typically not used (IMO 2009) The split incentive is a barrier
between ship owners (investor) and ship operators (gainer) as explained earlier (ICCT 2011)
Technical maturity Several standard designs are available on the market (IMO 2011) with a medium
payback time (IMO 2011)
Applicability Ducted propellers suits for vessels operating at high propeller loadings such as tankers
bulk carriers especially tugs and some offshore service ships The duct leads to increased friction but
at higher propeller loadings this is more than rewarded for by the positive effect of the combination of
propeller and duct (IMO 2009)
Contra-rotating propellers (CRP)
A rotating propeller induces a rotating motion in its backwash Normally this rotation energy of the
propeller gets lost The contra-rotating propeller is used in order to recover part of this energy (Figure
9) In a contra-rotating configuration two propellers are facing each other rotating in the opposite
direction with the aft propeller recuperating the turning energy in the wake from the forward propeller
(IMO 2011) To avoid complications with cavitation the aft propeller usually has a smaller diameter
than the front propeller Contra-rotating propeller arrangements involve a short shaft line and for that
reason primarily suitable for vessels with single-screw
TRANL15371 10
Figure 9 Left conventional propeller Right contra-rotating propeller The working principle is simple and effective
the power is split in a forward and aft propeller which through the different direction of rotation cancel out the
rotational energy losses behind the propeller (WAumlRTSILAuml 2009)
Potential savings of such measures are assessed to be in the order of 6ndash20 of the power consumption
with an average of 13 although higher figures may be presented by industry for specific cases Two
different full-scale measurements reported gains of 15 and 16 (IMO 2009 Crist 2009)
Barriers The mechanical installation of contra-rotating shafts is complicated and requires more
maintenance (IMO 2011) The split incentive between ship owners (investor) and ship operators
(gainer) is a barrier as explained above Although this technology can bring high energy savings the
investment is so high that there is not a short payback time
Technical maturity The technique is available on the market but problems with gearboxes for
contra-rotating propellers have been reported as well as operational problems with mounting (IMO
2009 IMO 2011) Payback time is reported as short (WAumlRTSILAuml 2009) but also as medium-long with
about ~15-20 years (Shuto 2010)
Applicability The technology is particularly beneficial for rather heavily loaded propellers as for
example very fast cargo vessels like Ro-Ro ships or for container ships (IMO 2011 Crist 2009) Contra-
rotating propellers need a short shaft line and hence mainly suited to single-screw ships (IMO 2011)
Contra-rotating propellers can be implemented as retrofit but it is more likely implemented in new
built ships due to the complicated mechanical installation (Crist 2009)
Post swirl devises
A number of different techniques belong to the post swirl category Several of them contain
modifications to the rudder or propeller (IMO 2009) Depending on vessel type and operational field
various power saving measures can be mounted to optimise water velocity distribution to the propeller
and to minimise slipstream losses due to swirl in the outflow of a propeller The most important among
these measures may be additional thrusting fins at the rudder twisted rudder (Figure 12) rudder-
bulb-systems with fins (Figure 13) and fins on the propeller fairwater also called post swirl fins or
boss cap fins (Figure 10)
Generally post swirl measures reported 1-8 energy efficiency (test models) Even 8-9 energy
efficiency from full-scale measurements for additional thrusting fins at the rudder Payback time is
estimated to be short to medium post swirl devices (DNV GL 2015 Crist 2009 ICCT 2011) Some of
CRP FOR BETTER PROPULSION EFFICIENCY
CONVENTIONAL PROPULSION
TRANL15371 11
the post swirl measure can be combined A good overview is given in Nielsen et al (Combined Kappel
propeller and rudder bulb system for improved propulsion efficiency not dated)
3431 Post swirl fins
The post swirl fins (Figure 10) can recover energy loss of propeller hub vortex in the propeller backward
flow and can lead to 3-5 energy saving on average 4 operating at the same speed (MOL 2011
Barringhaus und Olds 1999 Hansen Dinham-Peren und Nojiri 2011 ICCT 2011)
Figure 10 Example the post swirl fins or propeller boss cap fins (gcaptain 2012)
Barriers It is simple and straightforward measure requiring only the removal of the propeller boss
caps and replacement with the post swirl fins (no hull modification is needed) (Hansen Dinham-Peren
und Nojiri 2011 MOL 2011) However there is a split incentive between ship owners (investor) and
ship operators (gainer) as explained above
Technical maturity The technique is available on the market In 2013 post swirl fins were applied
to over 2500 ships worldwide (MOL 2011) Further advantages of the post swirl fins are reduction in
propeller torque reduced vibration in the stern and less underwater noise and reduced rudder erosion
(MOL 2011) A payback time of 6 months was estimated for 4 efficiency improvement at $600tonne
oil price (Hansen Dinham-Peren und Nojiri 2011) The investment is considered to be low21
Applicability The technique is effective for all screw propellers irrespective of the type or hull form
of the ship Has been tested on large-scale container vessels (MOL 2011 Hansen Dinham-Peren und
Nojiri 2011)
3432 Free rotating wheels
A vane wheel (Grim wheel) is a freely spinning propeller mounted behind the main smaller propeller
(see Figure 11 for example of use on retrofit Queen Elisabeth II in 1986) The vane wheel has a bigger
diameter than the main propeller and increases the propeller diameter The small propeller drives the
freely revolving vane wheel fitted on the wake The inner part of the vane wheel acts as a turbine and
the outer part as an ldquoadditionalrdquo propeller
21 httpgcaptaincompropeller-technology-ship-efficient
TRANL15371 12
Figure 11 Example for a grim vane wheel (Boat design 2007)
This leads to a substantial recovery of the rotational energy The energy saving potential is reported to
be 10 (Brannigan et al 2009) It is stated that the important benefit of the vane wheel is that a
smaller impulsion propeller can be installed which consumes less energy The vane wheel gives a
suitable energy improvement for cargo ships (IMO 2009 Schneekluth und Bertram 1998) and has short
payback time It is also stated that if there is room for a vane wheel in the aft there is also space for
an impulsion propeller of larger diameter leading about the same energy saving potential as the
combination of a small impulsion propeller and a vane wheel (IMO 2009)
Barriers A barrier is the split incentive between vessel owners who are responsible for investing in
these technologies and vessel operators who are those who compensate for the fuel consumption and
benefit from such technologies
Technical maturity Limited application Vane wheels are subjected to strong fluctuations in loading
Problems with the strength of the blades have been encountered frequently (for example the vane
wheels on the Queen Elisabeth II were short lived and not used after22)The payback time is estimated
to be short
Applicability The technique is effective for all screw propellers irrespective of the type or hull form
of the ship both for new and existing ships (Chen Reed und Kim 1989) Recommended for all ship
types except ferry and cruises because of their problem with strong fluctuations in loading as
mentioned above23 (IMO 2009)
3433 Twisted rudder
Rudders can play a significant role of extra frictional resistance Rudders are located in the backwash
of a propeller and rotational energy will act on the rudder Because of these effects the rudder gives
prospects of efficiency gains (Schulze 2007)
22 httpwwwroblightbodycomlinersqe-21987_Refitindexhtm 23 httpwwwroblightbodycomlinersqe-21987_Refitindexhtm
TRANL15371 13
Figure 12 Schematic capture of twisted rudder (Nakashima 2015)
Twisted leading edge technology provides multiple benefits for high-speed vessels compared to
conventional rudder designs Conventional rudders are located behind the propeller with the rudder
profile arranged symmetrically about the vertical rudder centre plane This arrangement does not
consider the fact that the propeller induces a strong rotational flow that strikes on the rudder blade
This consequences in areas of low force on the blade that induce cavitation and associated erosion
problems (Becker Marine System 2015 Schulze 2007)
The twisted rudder is horizontally twisted on the lower and upper side of the segment that is an
extension of the propeller shaft (Figure 12) This decreases cavitation rudder and improves
manoeuvrability of the vessel (Schulze 2007) Twisted rudder types lead to energy efficiency
improvements by approximately 2-4 on average 3 for large-size high-speed vessels (Hollenbach
und Friesch not dated Nakashima 2015)
Barriers Work needs to be done in the dry dock this is not regularly happening for existing ships
(Hochkirch und Bertram not dated) There is a split incentive between vessel owners who are
responsible for investing in these technologies and vessel operators who are those who compensate
for the fuel consumption and benefit from such technologies (ICCT 2011)
Technical maturity This rudder type is a commercially used technology and easy to apply if the ship
is in the dry dock (ICCT 2011)The payback time is estimated to be short to medium (Rolls-Royce 2014
Crist 2009)
Applicability Twisted rudder can used by container vessels reefers Ro-Pax ferries cruise ships and
naval vessels In South Korea this type of rudder is recognised as a standard rudder for large-size
high-speed container carriers (Nakashima 2015)
TRANL15371 14
3434 Rudder bulb
Figure 13 Example for a rudder bulb Kawasaki RBS-F rudder bulb systems with fins (Kawasaki 2015)
The rudder bulb brings smooth inflows from the propeller and can reduce the drag of the rudder The
rudder fins produce thrusts in the rotational flows generated by the propeller (Figure 13) Rudder bulb
measure can improve energy efficiency by 2-5 (Nielsen et al not dated Becker Marine System not
dated) on average 4 (Crist 2009)
Barriers The work needs to be done in the dry dock this is not regularly happening for existing ships
There is a split incentive between vessel owners who are responsible for investing in these technologies
and vessel operators who are those who compensate for the fuel consumption and benefit from such
technologies (ICCT 2011)
Technical maturity The technology is a commercially used technology and easy to apply while the
ship is in the dry dock (Kawasaki 2015) Payback time is estimated to be medium (Crist 2009)
Applicability For new and retrofit tanker- bulk- container- and Roro-ships with a propeller and
rudder (Crist 2009)
TRANL15371 15
Barriers to the transfer and uptake of energy
efficiency technologies for ships and possible
measures to overcome them
Although there are ways to reduce emissions (Chapter 3) and also drivers working towards the
implementation of such measures there are significant barriers to acting on cost-effective opportunities
in the maritime industry This is often referred to as barriers to energy or the energy efficiency gap
(Michele Acciaro 2013) (Sepideh Jafarzadeh 2014) (OECD 2014) Some barriers are shared with other
industries while others are unique to the maritime industry Furthermore many of these barriers are
not specific to the EEDI and the SEEMP but apply to any rule under MARPOL These barriers can exist
on both the supply and the demand side For example there could be barriers to the development and
implementation of measures that reduce CO2 emissions from ships and barriers to the expression of
demand for these measures (ECORYS 2012) Studies have however shown that there are relatively
few barriers related to the development of new technologies or access to related intellectual property
rights by the main shipbuilding nations and that the supply of measures exceeds the demand (ECORYS
2012) Existing studies on barriers to energy efficiency thus focus on what prevents the uptake of
available measures
This section presents an overview of the main barriers to the transfer and uptake of energy efficiency
technologies in the shipping industry and discusses potential ways of overcoming them
Preliminary assessments of technology transfer and financial needs by both workshop participants and
the IMO Ad Hoc Expert Working Group on Facilitation of Transfer of Technology for Ships (AHEWG-TT)
have suggested that the type of assistance needed by Port State and Flag State administrations will be
of a different nature than that required by shipbuilders and owners Our assessment above has shown
that the shipbuilding industry is expected to need less assistance than Port States and Flag States
In the next table we list a summary of the main barriers and the stakeholders concerned in the main
categories as identified by AHEWG-TT as well as the possible measures that could help overcome these
barriers The possible measures to overcome the barriers are further detailed in the sections below
Related costs are estimated in a separate section in order to minimise overlap
TRANL15371 16
Table 2 Summary of main barriers relevant stakeholders and possible measures to overcome them
Barrier Stakeholders Measures forward
Lack of awareness
(administrative and industry)
a MARPOL in general MARPOL Annex
VI EEDI and SEEMP in particular
b Available energy efficiency
technologies
Flag and Port
States
Ship owners
Capacity building
- Workshops
- Trainings
Model course for training
Inventory
Platform for information access and
sharing
Agreements between industry and
administrations
Technology concerns
a Lack of or limited technology supply
chain in some states
b Lack of technology base for RampD in
some states
c Lack of trust (in ability to reduce
emissions in ability to reduce
operational costs in compatibility
with other measures)
Ship owners
Investors
Increase cooperation in ship design
and building
Increased interaction between
industry and educationalRampD
institutes
Establish platform to share
expertiseexperience
Provide special investment or
guarantee funds
Institutional concerns
a Increased administrative burden
1Revision and amendment of existing legislation
2Implement Port and Flag State obligations
b Limited technical capacity in state institutions to implement
c Lack of financial resources for additional compliance and enforcement activities by maritime administrations
Flag States
Port States
Promote increased cooperation and
communication between
administrationswithin regional
administrations
Regional information workshops for
Port and Flag States
Establish platform to share regulatory
experience
Development aid
Commercial
a Increased costs for ship owners to
take up energy efficient technologies
b Lack of motivation of owners to take
up energy efficient technologies (split
incentive)
Ship owners
Financiers
Special EE funds
Smart contracts
TRANL15371 17
Awareness Raising
Barriers Lack of Awareness
The need to create awareness among Flag States Port States and ship owners of the requirements of
Annex VI in general and Chapter 4 in particular was highlighted by participants of the workshop and
emphasised by the AHEWG-TT The level of awareness in the various regions and even in the countries
within the regions differed considerably The AHEWG-TT further suggests it would be beneficial to
undertake an initial evaluation of knowledge needs (gap analysis) in order to ensure workshops and
other awareness-raising activities are appropriately tailored24
Furthermore ship-owners are not always aware of the energy efficiency technologies available on the
market or which operational measures can be implemented to save fuel Ship owners can be companies
people and investment funds Especially private equity groups tend to focus more on short term looking
for quick profit while traditional ship owners tend to hold the ship for at least 20 years25
Measures forward
Though Flag States and Port States should already have implemented measures to ensure that Energy
Efficiency Design Index (EEDI) and Ship Energy Efficiency Management Plan (SEEMP) requirements are
complied with both public administrations and industry representatives could benefit from additional
trainingcapacity building and platforms to share experiencesreceive information with regards the
practicalities of these regulations and available energy efficiency technologies The needs for each
group can be determined through a gap-analysis which we recommend to be carried out by an
independent consultant in cooperation with the flag and port states Once the specific needs for each
group have been determined they can be addressed through the following awareness raising
measures
Capacity Building (workshops trainings)
Workshopstrainings could be organised where formal training is combined with open discussions where
experiences could be shared just within one stakeholder group or between educational institutes
auditors operational managers of ships shipbuilders and authorities Such trainingsworkshops could
focus on just one or all aspects relating to the applicable rules available energy efficiency measures or
assessment methods of technologies (eg training in calculating and verifying EEDI and SEEMP
including development of tools to calculate EEDI and SEEMP) Trainingsworkshops can be local or
regional Sending people physically to regional workshops is generally more conductive to networking
and experience sharing but less adapted to the local situation and more costly
To reduce the costs of training and ensure a certain level of training the IMO or other qualified
international partners (eg WMU) could develop model courses for training In order to better
understand the rules and regulations in detail people use the help of trainers to better understand the
elements that are important for them and to gain experience in doing calculations and other required
24 Ad Hoc Expert Working Group on Facilitation of Transfer of Technology for Ships 2nd Meeting 25 httpwwwftcomcmss0dadcb240-3d97-11e3-b754-00144feab7dehtmlaxzz3aqC3tmNu
TRANL15371 18
activities by the regulations Trainers have to develop their courses and earn back their investments
via trainings Since the trainers are doing this simultaneous it would be more efficient if there would
be a model course available that can easily be tailored to the audience This would reduce the costs for
the development of trainings and would also ensure that the trainers provide the same level of depth
in their trainings Since the IMO is responsible for the rules and regulations it would be the logical
responsible for the efficient implementation and therefore could take the initiative for developing model
courses
Information Sharing
Inventory of energy-efficiency technologies (for example the IMO-GEF-UNDP project) Many
studies and overviews on the internet are available The quality and the scope is often
different
Improved access to information and information sharing with international recognised
organisations including relevant survey and certification training One example of
establishing information sharing between governments is the work of the OECD Council
Working Party on Shipbuilding (WP6)26 which organises regular workshops aimed at
facilitating the exchange of information on policy and industry developments
Note that many of these measures overlap with the measures required to overcome institutional
barriers as laid out in section 43
Agreements between industry and administrations could be envisaged to overcome the
barriers
In order to enhance the sharing of expertise for both administrations and industry technology transfer
and technology cooperation agreements could be formulated in order to strengthen the cooperation
As identified before the technology transfer to the ship building industry is not a mayor barrier so the
agreements should help the administrations to become more aware of the possibilities to further
promote the implementation of MARPOL Annex VI
Typical agreements between industry and administrations could be in the form of initiatives like the
Sustainable Shipping Initiative (SSI) SSI members have developed a vision for a sustainable shipping
industry in 2040 They commit to working towards this in all their own operations andor activities that
involve shipping and in all their dealings with and support for the shipping industry to make their vision
a global reality by 2040 SSI members of over 19 companies represent ship owners and charterers
shipbuilders engineers and service providers banking insurance and classification societies The SSI
explored for instance how to overcome barriers to the uptake of new technologies and techniques which
improve the operational efficiency of ships potentially delivering energy efficiency savings of 10 or
more and payback periods of less than 5 years They also produce case studies to show good examples
and also develop tools By involving administrations in these kind of initiatives (even free of charge)
they could be actively supported with knowledge about sustainable shipping
26 httpwwwoecdorgstiindworkshopongreengrowthinshipbuildinghtm
TRANL15371 19
Technology Concerns
Barriers Technology Concerns
One of key barriers to the implementation of energy efficient technologies (new and retrofit) relates to
the lack of or limited technology supply chain Furthermore the lack of a technology base for RampD in
some states is a barrier Also the existence of concerns relating to the ability of available energy
efficiency measures to reduce emissions and operational costs and their compatibility with other
measures of energy efficient technologies is a barrier This is typically the problem in very isolated ship
yards
Measures forward
Very successful shipyards (Japan and Korea) have already since many years a large number of
licencing technology transfer and similar agreements and continuously exchange information with
competitors in and outside their countries For instance US shipyards have adopted this methodology
since the 1980s (office of technology assessment 1983)
Further technology sharing could be stimulated through educationalRampD institutes locally regionally
or globally in ship design and building The technology will be transferred to the ship builders once the
students start working there or through cooperation between industry and university In order to
facilitate this we recommend the establishment of partnerships to share expertiseexperience
Typically individuals who know both worlds are the driving force behind successful partnerships (AISBL
2012) These partnerships are built around a shared long term research vision Many partners could
contribute (eg financially) in order to establish the responsible management and research programme
The target of the platform could be for example to provide verified information on real-world energy
efficiency improvements via a monitoring programme
For example in order to stimulate the deployment of energy efficient trucks the Dutch government
provides a website to share audited knowledge and data on about 15 energy efficiency technologies27
Additionally climate financing could be leveraged to reduce the investment risk in unproven
technologies For example IMO Member States could create a demonstration fund that can function as
a guarantee for investments in new and immature technologies28 Similarly investment guarantees
can be provided by funds in the same way governments provide export credits to their companies If
the technology does not deliver the expected fuel-savings the fund can cover the difference and hence
reduce investment uncertainty The main objective being to reduce investment risk
Institutional Concerns
Barriers
27 httpwwwtruckvandetoekomstnl 28 An example of a specific EE fund is httpwwweeefeueligible-investmentshtml
TRANL15371 20
For Flag and Port States complying with new regulations of IMO and EEDI and SEEMP particularly
represent and increased administrative burden It requires revisions and amendments of existing
legislation that need to be implemented at Port and Flag State functions There is currently limited
technical capacity in state institutions to implement these changes especially in developing countries
with a relatively low number of ships under their flag
The lack of financial resources is also a barrier for additional compliance and enforcement activities by
maritime administrations This is particularly an issue for least developed countries and small
developing island states Implementation costs are relatively higher for small Flag States because of
limited abilitycapacity to implement new technical regulations Note that this issue is not specific to
the EEDI and the SEEMP but to most regulatory measures (maritime or other)
Measures forward
Measures to assist states in implementing (existing and new) legislation include
Promote an increased cooperation and communication between administrationswithin
regional administrations of Port and Flag States similarly to what has been suggested in
sections 41 (Awareness raising through capacity building activities such as workshops) and
42 (Establish platform to share regulatory expertiseexperience) Platforms could be
managed by IMO in conjunction with industry and development funds in order to share the
costs as this has been done before for GloBallast for example In that case the IMO is in the
lead (executing agency) but the platform is supporting the collaboration with many
stakeholdersfunding partners The goal of the programme is to assist developing countries
eg via e-learning courses
In addition deterrents need to be put in place to discourage Flag States from performing
substandard inspections A system for detecting sub-standard inspections should be
implemented whereby mandatory Port State Control inspections are carried out in close
proximity to mandatory Flag State inspections (ie the Flag State inspection is carried out
prior to the ship leaving port and the Port State inspection is carried out upon arrival at port)
The two inspections should be carried out under a uniform mandatory checklist The IMO
should monitor inspections and investigate where discrepancies between inspections close in
proximity are detected If a Flag or Port State is found to have failed to meet the requisite
inspection standards penalties in the form of substantial fines should follow
In order to overcome the financial barriers financial assistance to states could help with
capacity building and implementation Financial resources are not only needed in the
implementation of the new regulations (training of government experts) but governments of
Flag States also need to be involved continuously in the ongoing discussion around
developments new EEDI targets for 2020 and beyond which requires continuous availability
of experts to represent the interests of the state (Metselaar 2015) Financial aid can therefore
be supplied in the following forms
Increased financial support for compliance and enforcement activities by maritime
administrations
Financial support could be provided to Flag States so that they have the resources to
properly carry out vessel inspections Consideration should be given to the introduction of
TRANL15371 21
an International Fund Convention set up for this purpose and contributed to by Port
States andor their major oil and other cargo exporters and importers
Commercial
Barriers
Private parties such as ship owners and investors are not always commercially incentivised to make
investments in energy efficiency measures This can be due to the split incentives between owner (who
should make the investment) and charterer (who reaps the cost savings) of a ship (see paragraph 25)
Furthermore access to finance can be problematic for smaller players who operate in niche markets
Measures
Bottlenecks in financing private investments and new financing mechanisms could be addressed during
regional or international workshops that include traditional and new financiers that could finance
investments in energy efficiency technologies
One solution that has been brought forward to address the problem of split incentives is the use of
lsquosmart contractsrsquo (Michele Acciaro 2013) The idea is to change charter contracts in a way that risks
and benefits are shared among charterers and ship owners In such contracts speed choice is more
flexible and the chartering cost of vessels is closer to fuel cost as such ship owners get motivated to
invest in energy-efficient technologies and charterers get stimulated to run vessels in an energy
conserving manner
With respect to the shipbuilding industry the following could facilitate the transfer of technology as
well
Financial assistance to shipyards to be provided at the national level or through other
arrangements
Foreign direct investment in software and hardware as an innovative way to support industry
in implementing the requirements
One type of incentive that governments can provide to enhance industry performance and technology
adoption is a competition for top performers Governments could contribute to a fund from which
money is distributed to the top 10 of best performers in a particular year
Cost estimates
Workshops and training
Capacity building workshops for administrations are estimated at euro 1000 per attendee for an
online workshop (1-2 days) Costs for the organisation of such workshops would include expert fees
and administrative costs These costs could be lower if the course material is already developed
(model workshops) Eg 2 attendees per Flag State for the ten most important Flag States
TRANL15371 22
(covering 74 of total fleet tonnage) comes down to euro 20000 or less in case the courseware is
already existent
A situation that is more conductive to networking and experience sharing is to send people physically
to regional workshops The costs of such workshops including participants travel and hotels for 50
participants would be between euro20000 - euro100000 per workshop based on our international
experience with organising workshops in the field of renewable energy and energy efficiency Costs
could be lower depending on the amount of preparation required cost of location (could be sponsored
by participating states)
Technical training
Trainings already exist for calculating and verifying EEDI including development of tools to calculate
EEDI For example MARIN offers 32h courses over 5 days in the Netherlands for euro 5000 per attendee
(excluding travel and accommodation)29 Lloyds offers similar trainings for similar costs30
Model courses for training may need to be updated depending on identified needs Ecofys estimates
the update of eg an existing EEDI model courses to cost in the order of euro 50000
Online platform for inventory of energy efficiency technologies
Inventories of energy-efficiency technologies already exist (for example in reports like (IMO 2009) and
on websites of for instance DNV-GL the efficiency finder31) but they could be further developed since
the websites are either not independent or incomplete
In order to facilitate information exchange a web-based platform could be established The role of the
platform would be for example to provide verified information on real-world energy efficiency
improvements via a monitoring programme For example in order to stimulate the deployment of
energy efficient trucks the Dutch government provides a website to share audited knowledge and data
on about 15 energy efficiency technologies32 The costs of such a website and corresponding
programme are estimated to be around euro 2 million for a 4 year period Furthermore a platform can be
used to inspire others by showing best practices and can be used for sharing of information regarding
network opportunities like conferences and seminars
Capacity building project
Currently the IMO-GEF-UNDP GloBallast project is a capacity building project it assists developing
countries and their maritime industries in implementing international regulations on ballast water
29 httpwwwmarinnlwebEventsCoursesSpecialist-Course-on-Ship-propulsion-model-tests-and-SpeedPower-trials-for-EEDI-Verifiers-
2731-October-2014htm 30 httpwwwlloydslistcomllsectorship-operationsarticle422262ece 31 httpswwwdnvglcommaritimeenergy-efficiencyefficiency-finderhtml 32 httpwwwtruckvandetoekomstnl
TRANL15371 23
management and preventing risks arising from the transfer of harmful aquatic organisms And has
several aspects that could also be used for knowledge transfer of energy efficiency measures
web-site
e-learning course
databasesdirectories
library collections
newsletter
Regional Task Force (RTFs) to support development and adoption of a regional approach
Develop and implement communication education awareness raising and outreach
programme
Develop introductory and more specialised training packages
Develop model legislations
The total budget for the 2008-2012 period was US$23 million out of which US$564 million represents
a GEF grant the rest being mostly in-kind contributions from the participating countries regional co-
ordinating organisations (RCO) and strategic partners including the private sector
Improved access to information and information sharing with international recognised organisations
including relevant survey and certification training would further promote the different technologies
TRANL15371 24
Conclusions
This study provides an overview of existing technologies which could drastically improve the energy
efficiency of ships Furthermore barriers to transfer and uptake of energy efficient technologies are
analysed and categorised and implications of these barriers are listed in order to facilitate the uptake
of energy efficiency technologies for ships
From this research it is clear that conventional technology is available that can cost-effectively (with a
payback time of less than 15 years) achieve high efficiency gains If the maximum gains per category
are added up (for all but ferry and cruise) this would mean a total efficiency improvement of 35
Even without taking two experimental technologies with potentially high efficiency gains into account
(wind power and air lubrication)
High investments like wind power and contra rotating propellers bring the highest savings (13 ndash 20)
The medium investments are in-between (5-10) and the low investments only bring relatively small
energy efficiency improvements (lt5)
When the ship owner has too few opportunities to share investment with charterers this leads to a split
incentive a ship owner may invest the up-front capital to put in energy-efficient technology but not
receive the benefits This is typically a problem for investments with a high payback time ie the wind
power and contra rotating propellers
The main barriers are related to the transfer of technology to Flag States Flag States are generally
third world and developing nations that often do not have the resources to enforce investigate or
prosecute breaches by their flagged vessels
Several ways to overcome the knowledge transfer barriers were presented that can be categorised as
follows
Workshops and trainings
o Capacity building workshops for administrations
o Regional workshops
Technical training
o Training in calculating and verifying the EEDI
o Development of model courses
Online platform
o Inventory of energy-efficiency technologies
o Creation of a website with all relevant information for the target audience
o Improved access to information and information sharing
o Provide verified information on real-world energy efficiency improvements via a
monitoring programme
TRANL15371 25
The most expensive of the capacity building actions is the capacity building project which takes all
aspects above into account If a project would be developed for knowledge transfer regarding energy
efficiency measures similar to GloBallast which assists developing countries and their maritime
industries in implementing international regulations on ballast water management and preventing risks
arising from the transfer of harmful aquatic organisms the total budget needed would be in the order
of US$23 million for a period of 5 years
TRANL15371 26
References
JFE Group 2013 ldquoJapan Marine Unitedrdquo JFE Group Overview JFE Group AISBL 2012 Making Industry-University partnerships work lessons from succesful collaborations
report Belgium AISBL
Allenstroumlm Bjoumlrn 2013 ldquoWind propulsionrdquo SSPA Sweden AB Gothenburg EffShip March
Aqorau T 2000 Illegal Unreported and Unregulated Fishing Considerations for Developing
Countries paper Honiara Solomon Islands South Pacific Forum Fisheries Agency
BALance 2014 Competitive position and future opportunities of the Euroean Marine Supplies
industry BALance Technology Consulting
Barringhaus David and Robert Olds 1999 OLDS ENGINEERING Maximizing Propulsion Efficiency
Marine Division Accessed Februrar 2015
httpwwwoldscomaumarinemaximizing_propulsion_efficiency
Becker Marine System not dated Becker Bulb Rudders httpwwwbecker-marine-
systemscom05_downloadszzpdfproduct_pdfBecker_Bulb_Rudderspdf Becker Marine
System
mdash 2015 Twisted Full Spade Rudder Accessed Feb 2015 httpbecker-marine-
systemscom03_productsproducts_twisted_full_spadehtml
Bloomberg 2014 China Loses Shipbuilding Crown to South Korea Chart of the Day 9th December
httpwwwbusinessweekcomnews2014-12-09china-loses-shipbuilding-crown-to-south-
korea-chart-of-the-day
Bluebird-Electric 2014 Sipbuilding post World War Two httpwwwbluebird-
electricnetship_boat_design_buildingshipbuilders_ship_repairers_associationhtm
Boat design 2007 Accessed Feb 2015
httpwwwboatdesignnetforumsattachmentspropulsion16743d1193341389-new-
propulsion-sytems-ships-grim-prop-1jpg
Brannigan Paschos Eyers and Wood 2009 Report on International avialtion and Mritime Emissions
in a Copenhagen (post 2012) Agreement Oxfordshire AEA Group
Chen Benjamin Arthur Reed and Ki-Han Kim 1989 A Vane-Wheel Propulsor for a Research and
Development Report Newport David Taylor Research Center
CNSS 2015 Clean North Sea Shipping - Clean Shipping Technology Accessed Februar 2015
httpcleantechcnssnoghg-technologiestechnical-measuresmeasures-related-to-the-hull
Crist Philippe 2009 Greenhouse gas emissions reduction potential from international shipping
Working paper OECD
Daily Times 2015 Nigeria Turkey seek collaboration on ships shipyards 5th January
httpwwwdailytimescomngarticlenigeria-turkey-seek-collaboration-ships-shipyards
Dillingham Gerald L 2000 Progress Made to Reduce Marine Pollution by Cruise Ships but Important
Issues Remain GAO report Washington United States General Accounting Office
DK Group 2015 Silverstream technologies January Accessed January 2015 httpdkgroupeu
DNV 2014 Encouraging Construction and Operation of Green Ships OECD
httpwwwoecdorgstiindC-WP6(2013)12-FINAL-ENGpdf
TRANL15371 27
DNV GL 2015 EFFICIENCY FINDER Accessed Feb 2015 httpwwwdnvglcommaritimeenhance-
performanceefficiency-finderaspx
Ecorys 2012 ldquoGreen growth opportunities in the EU shipbuilding sectorrdquo
ECOSPEED 2015 EUROPEAN MARINE amp MACHINERY AGENCIES LTD Accessed February 2015
httpwwweuropeanmarinecoukECOSPEEDhtm
gcaptain 2012 gcaptain - Propeller Technology to Make Your Ship More Efficient - Accessed Feb
2015 httpgcaptaincompropeller-technology-ship-efficient
Hansen Dinham-Peren and Nojiri 2011 Model and Full Scale Evaluation of a lsquoPropeller Boss Cap
FinsrsquoDevice Fitted to an Aframax Tanker Second International Symposium on Marine
Propulsors smprsquo11 Hamburg Germany June 2011
Hellenic Shipping News 2014 Korean ships sell at fuel-saving premium 22nd December
httpwwwhellenicshippingnewscomkorean-ships-sell-at-fuel-saving-premium
Hindawi 2015 Hindawi Puplishing Cooperation Accessed February 2015
httpwwwhindawicomjournalsijrm2012474785fig4
Hochkirch Karsten and Volker Bertram not dated ldquoSlow Steaming Bulbous Bow Optimization for a
Large Containershiprdquo Accessed Februar 2015 http2021148960resourcepdf5096pdf
Hollenbach Uwe and Juumlrgen Friesch not dated Efficient hull forms ndash What can be gained
Conference ship-efficiency Hamburg 2013 Hamburg HSVA Hamburgische Schiffbau-
Versuchsanstalt GmbH HamburgGermany
ICCT 2011 Reduce Greenhouse Gas Emissions from Ships - Cost Effectiveness of Available options -
white paper Washington DC International Council on Clean transportation (ICCT)
IMO 2011 REDUCTION OF GHG EMISSIONS FROM SHIPS Marginal Abatement Costs and Cost
Effectiveness of Energy-Efficiency Measures Submitted by the Institute of Marine Engineering
Science and Technology (IMarEST) MEPC 62INF7 International Maritime Organisation
IMO 2009 Second IMO GHG Study 2009 London International Maritime Organisation
JSEA 2006 ldquoImproved propulsive performance - Universal applies new energy-saving type Leadge
Bowrdquo Japan Ship Exports Association (JSEA) httpwwwjseaorjpVariableJSea318pdf
Kawasaki 2015 Energy-saving Technology Accessed Feb 2015
httpswwwkhicojpenglishshiptechconservationindexhtml
Leddy Fiona Jayne 2012 ldquoA critical legal analysis of International Shipping in Australian Waters and
the risk of ship-based oil pollutionrdquo Queensland Environmental Practice Reporter vol 17
Marinelog 2014 China white lists 51 shipyards 4 September
httpwwwmarinelogcomindexphpoption=com_k2ampview=itemampid=7667china-white-
lists-51-shipyardsampItemid=231
Metselaar Kees interview by Arno van den Bos 2015 Policy officer at directorate maritime affairs of
ministry of Intrastructure and Environment (February)
Michele Acciaro Peter Nyegaard Hoffmann Magnus Strandmyr Eide 2013 ldquoThe Energy Efficiency
Gap in the Maritime Transportrdquo Journal of Shipping and Ocean Engineering 1-9
MIWB 2015 Maritiem Instituut Willem Barentsz Accessed Feb 2015
httpsmijnmiwbnlnieuwsbriefindexphpdo=showampid_artikel=116
MOL 2011 Energy-Saving Propeller Boss Cap Fins System Reaches Major Milestone - Orders
Received for 2000 Vessels Accessed Feb 2015
httpwwwmolcojpenpr20111145html
TRANL15371 28
Motorship 2014 Gas fuelled ships into the future 31 10 httpwwwmotorshipcomnews101ships-
and-shipyardsgas-fuelled-ships-into-the-future
Nakashima 2015 Nakashima propeller CO LTD Accessed Feb 2015
httpwwwnakashimacojpengproductrudderhtml
Nielsen Shin Lundgren and Faghani not dated Combined Kappel propeller and rudder bulb system
for improved propulsion efficiency Frederikshavn MAN Diesel amp Turbo
OECD 2014 The OECD Council Working Party on Shipbuilding
httpwwwoecdorgindustryindshipbuildinghtm
OECD 2011 ldquoThe Shipbuilding Industry in Turkeyrdquo
office of technology assessment 1983 An Assessment of Maritime Technology and Trade report
Washington DC US Congress
Pakarinen Risto 2007 ldquoNothing common about common railrdquo Twentyfour7 (Twentyfour7) 64-65
Ports amp Ships 2015 Ports and Ships Accessed February 2015
httpportscozanewsarticle_2007_10_17_4038html
Rolls-Royce 2014 Propulsors - Moving your business in the right direction httpwwwrolls-
roycecom~mediaFilesRRolls-Roycedocumentscustomersmarinepropulsion-2014-
tcm92-8664pdf Aalesund Rolls-Royce Commercial Marine httpwwwrolls-
roycecom~mediaFilesRRolls-Roycedocumentscustomersmarinepromaspdf
Schneekluth H and V Bertram 1998 Ship Design for Efficiency and Economy Oxford
Butterworth-Heinemann
Schulze Reinhard 2007 Twisted Rudder - Extreme Design 14 SVA-Forum bdquo Ruder in Theorie und
Praxisldquo Potsdam 7 November 2007 Potsdam Schiffbau-Versuchsanstalt Potsdam GmbH
Selenetrawlers 2015 Selenetrawlers Accessed February 2015
httpwwwselenetrawlerscomcompanydesign-notes
Sepideh Jafarzadeh Ingrid Bouwer Utne 2014 ldquoA framework to bridge the energy efficiency gap in
shippinrdquo Energy 603-612
SetSail 2009 SetSail Accessed February 2015 httpwwwsetsailcomprop-nozzle-comments-by-
an-expert
Shuto Hideki 2010 Super Eco Inland Vessels httpwwwccr-
zkrorgtempwrshp120411Presentations2_04_HShuto_enpdf IHI Marine United Inc
Silberschmidt Noah 2014 ldquoGenerating efficiencies from thin airrdquo SMM Green shipping | Efficiency
httpwwwsilverstream-techcomwp-contentuploads201404HANSA-241112pdf
httpwwwsilverstream-techcomwp-contentuploads201404HANSA-241112pdf
Skinner Ian 2009 EU Tranport GHG Routes to 2050 Technical options for maritime and inland
shipping httpwwweutransportghg2050eucmsassetsTechnical-options-maritime-inland-
waterpdf Brussel European Commission
Statista 2015 ldquoLargest shipbuilding nations in 2013 based on completions in gross tonnagerdquo
httpwwwstatistacomstatistics263895shipbuilding-nations-worldwide-by-cgt
UK DfT 2014 ldquoDfT Port Statistics - World fleet registered trading vessels of 100 gross tons and over
gross tonnage on selected registers 1999-2013rdquo
httpswwwgovukgovernmentcollectionsmaritime-and-shipping-statisticsdata-tables-
associated-with-this-series
TRANL15371 29
Voorham 2013 Assessment of sustainable investment in shipping Master Thesis
Report SDPO13029m Delft 27 th November 2013 Delft Delft University of Technology
WAumlRTSILAuml 2009 ldquoEnergy Evironment Economyrdquo Helsinki Finland WAumlRTSILAuml
mdash 2007 ldquoWaste heat recoveryrdquo Waumlrtsilauml Corporation
Wettstein and Brown 2008 Derating a solution for high fuel savings and lower emissions
Winterthur Waumlrtsilauml Switzerland Ltd
Wind Chellenger Project HP 2015 Wind Chellenger Project HP Accessed Feb 2015 httpwindku-
tokyoacjpindex_enhtml
TRANL15371 30
Appendix I - World fleet registered trading vessels
Table 3 World fleet registered trading vessels of 100 gross tons and over 2009-2013 Source UK DfT 2014
Flag Country 2009 2010 2011 2012 2013
(World Total) 8448 9130 9831 10343 10725
Panama 1886 1979 2084 2158 2172
(European Union) 1900 1979 2074 2051 2106
Liberia 908 1037 1167 1238 1241
Marshall Islands 475 590 711 811 900
Hong Kong 449 553 678 785 854
Singapore 398 434 512 592 677
Malta 348 380 438 450 496
Bahamas 452 469 481 483 485
Greece 388 407 411 411 415
China 282 327 356 388 411
United Kingdom (inc IOM and CI) 258 273 294 300 288
Cyprus 201 205 207 197 203
Japan 138 156 167 178 192
Italy 150 169 181 180 176
Norway 152 145 143 144 145
Germany 152 155 153 137 123
Denmark 107 115 113 113 122
Korea South 120 124 116 111 112
Indonesia 69 82 91 101 111
Bermuda 94 100 106 109 105
Antigua amp Barbuda 100 107 111 106 100
United States of America 107 108 102 99 97
India 83 83 89 85 82
Netherlands 76 61 67 66 69
Turkey 54 58 62 64 59
Malaysia 69 72 71 62 57
France 63 63 64 56 53
Russia 47 49 49 51 52
Philippines 50 51 50 43 43
Cayman Islands 27 29 32 32 31
Taiwan 25 26 27 30 31
Iran 09 08 05 21 31
Thailand 25 26 22 26 29
Sweden 39 35 33 28 27
St Vincent amp the Grenadines 47 42 37 28 24
Canada 24 24 25 24 23
Spain 22 25 26 25 23
Kuwait 23 19 24 24 22
Brazil 20 20 19 19 20
Cambodia 18 17 13 13 12
TRANL15371 31
Appendix II - Most important shipbuilding
countries
China
China is an emerging shipbuilder that overtook South Korea during the 2008-2010 global financial crisis
as they won new orders for medium and small-sized container ships (Bloomberg 2014 Bluebird-Electric
2014)
Figure 14 delivery of vessels from Chinese and South Korean shipyards in million compensated gross tons a measure
of building time and human resources used per ton Source (Bloomberg 2014)
China has more than 1600 shipyards Analysts have predicted that about one third of them will fold
as the industry struggles with overcapacity Last year China laid out a three year plan for industry
restructuring that urged yards to concentrate on building higher quality vessels and local governments
to halt approvals for new projects (Bluebird-Electric 2014)
After two decades of a loan-fuelled boom Chinarsquos shipbuilding industry has become saddled with debt
and overcapacity prompting some private firms to seek financial assistance from the state In
September the government issued a list of 51 shipbuilders it deemed worthy of public support
(Marinelog 2014)
TRANL15371 32
New additions to the white list include subsidiaries of the China State Shipbuilding Corporation (CSSC)
and the China Shipbuilding Industry Corporation (CSIC) and the AVIC Weihai Shipyard owned by the
Aviation Industry Corporation of China (AVIC) (Marinelog 2014)
South Korea
By the end of 2014 it seemed South Korea has overtaken China again as the worlds largest
shipbuilding country with a global market share of about 30(see Figure 14) (Bloomberg 2014)
(Bluebird-Electric 2014) South Korea leads in the production of large vessels such as cruise liners
super tankers LNG carriers drill ships and large container ships
South Koreas shipyards are highly efficient with the worlds largest shipyard in Ulsan operated by
Hyundai Heavy Industries slipping a newly built $80 million vessel into the water every four working
days South Koreas big three shipbuilders Hyundai Heavy Industries Samsung Heavy Industries
and Daewoo Shipbuilding amp Marine Engineering dominate global shipbuilding with STX Shipbuilding
Hyundai Samho Heavy Industries Hanjin Heavy Industries and Sungdong Shipbuilding amp Marine
Engineering also ranking among the top ten shipbuilders in the world In 2007 STX Shipbuilding further
strengthened South Koreas leading position in the industry by acquiring Aker Yards the largest
shipbuilding group in Europe (The former Aker Yards was renamed STX Europe in 2008) In the first
half of 2011 South Korean shipbuilders won new orders to build 25 LNG carriers out of the total 29
orders placed worldwide during the period
To maintain their market position Korean yards also focus more and more on greening opportunities
The Korean government introduced a GHG emission reducing program in 2008 The program is aiming
at reducing GHG emissions throughout all economic sectors including the shipping and shipbuilding
industry Also the Japanese Shipbuilding Association (SAJ) is looking into the possibilities to reduce
GHG emissions so that the shipbuilding industry becomes greener and more competitive (Ecorys
2012)
Japan
Japan had been the dominant ship building country from the 1960s through to the end of 1990s but
gradually lost its competitive advantage to the emerging industry in South Korea which had the
advantages of much cheaper wages strong government backing and a cheaper currency South Korean
production overtook Japans in 2003 and Japanese market share has since fallen sharply
The Philippines
The Philippines has placed fourth among shipbuilding nations around the world producing more than
six million deadweight tonnes of ships built in 2012 The country is anchored by South Korean Hanjin
and Japans Tsuneishi shipbuilders The country has shipyards in Subic and Cebu
TRANL15371 33
Europe
For several decades European shipyards have been facing strong global competition from especially
Asian enterprises (Japanese yards in the 1950s and 60s Koreans from the 1970s and 80s and Chinese
since the 1990s) In Europe this has led to an almost complete exit from the mass production segments
of tankers bulkers and containerships Response of the EU industry has been to focus on the higher
value more complex ship types such as ferries and passenger ships non-cargo vessels and general
cargo ships In addition only limited numbers of vessels of the same type are being built (in contrast
with bulk vessels which are mass produced) Europe has a 77 percent market share in building
passenger vessels (including both cruise ships as well as ferries) and a 17 percent share in the
construction of non-cargo vessels (Ecorys 2012) These segments make up a relatively small share of
the world orderbook (in CGT) However in value they represent a much higher share due to their
relatively sophisticated characteristics The position of the European shipbuilding industry in the
manufacturing of specialised innovative vessels is still strong At the same time European equipment
manufacturers have acquired a leading role in quality products especially in complex high value
equipment components
Figure 15 World orderbook and CESA orderbook by ship type in 2010 (CGT x 1000) (Source Ecorys 2012)
Regarding the marine equipment sector the European industry is renowned for propulsion cargo
handling communication automation environmental and security systems This equipment is not only
destined for complex European-built ships but also exported to Asian yards whether or not requested
by their clients (Ecorys 2012)
Compared to the ship construction sector the marine equipment segment is highly heterogeneous and
consists of companies that are often also active in other business areas (ie automotive or aircraft
industry) A study by (BALance 2014) found that the European marine equipment industryrsquos
TRANL15371 34
competitiveness lies in a strong market position and technological leadership at least for globally active
European marine supply companies who build their position on a strong infrastructure and co-operative
partners skill of their employees and close relationship with their customer base Conversely identified
weaknesses are the cost level in Europe and the heterogeneous structure of the industry with many
SMEs which hinder in some cases attempts to follow the markets by globalisation strategies
Turkey
Shipbuilding in Turkey has evolved from an old traditional activity in Anatolia to an internationally
recognised industry especially since the early 1990s The industry has modern shipyards that can build
ships yachts mega-yachts and sailing boats as well as carrying out extensive repair and conversion
works Turkeyrsquos shipyards are mainly located in the Marmara Region namely Tuzla Yalova and İzmit
which have developed into dynamic shipbuilding centres Also in recent years the emerging Black Sea
and Mediterranean Regions have increasingly attracted shipyard investments
In the last decade in parallel with developments in the global market Turkish shipbuilding experienced
a several-fold increase in its shipbuilding and export capacity including a significant product
diversification According to order books this resulted in Turkey being regularly placed in the top ten
countries on the basis of its deadweight (dwt) production and in the top five countries by the number
of ships
In recent years Turkey has increasingly tapped into niche markets which in turn has led to a growing
participation by Turkish shipyards in the international trade in new ships In parallel there has also
been strong growth in the marine equipment manufacturing sector which could increasingly also tap
the export market These developments reflect in part the strategic location of the yards the
experienced workforce the quality of production and Turkeyrsquos significant role as a political cultural and
economic bridge between Europe and Central Asian and Middle Eastern economies (OECD 2011)
ECOFYS Netherlands BV | Kanaalweg 15G | 3526 KL Utrecht| T +31 (0)30 662-3300 | F +31 (0)30 662-3301 | E infoecofyscom | I wwwecofyscom
ECOFYS Netherlands BV
Kanaalweg 15G
3526 KL Utrecht
T +31 (0) 30 662-3300
F +31 (0) 30 662-3301
E infoecofyscom
I wwwecofyscom
HOW TO OBTAIN EU PUBLICATIONS
Free publications
bull one copy
via EU Bookshop (httpbookshopeuropaeu)
bull more than one copy or postersmaps
from the European Unionrsquos representations (httpeceuropaeurepresent_enhtm)
from the delegations in non-EU countries
(httpeeaseuropaeudelegationsindex_enhtm)
by contacting the Europe Direct service (httpeuropaeueuropedirectindex_enhtm)
or calling 00 800 6 7 8 9 10 11 (freephone number from anywhere in the EU) () () The information given is free as are most calls (though some operators phone boxes or hotels may charge you)
Priced publications
bull via EU Bookshop (httpbookshopeuropaeu)
Priced subscriptions
bull via one of the sales agents of the Publications Office of the European Union
(httppublicationseuropaeuothersagentsindex_enhtm)
doi 102834880780
ML-0
1-1
5-4
39-E
N-N
[Ca
talo
gu
e n
um
be
r]
TRANL15371 7
A charterer may be a party without a cargo who takes a vessel on charter for a specified period from
the owner and then trades the ship to carry cargoes at a profit above the hire rate In some cases a
charterer may own cargo and employ a shipbroker to find a ship to deliver the cargo for a certain price
Two main types of charter can be distinguished time charter and voyage charter In a voyage charter
the owner is still responsible for the port fuel and crew costs In a time charter the charterer selects
the ports and directs the vessel where to go The charterer pays for all fuel the vessel consumes port
charges commissions and a daily hire to the owner of the vessel
When there are too few opportunities to share investment with charterers this leads to a split incentive
a ship owner may invest the up-front capital to put in energy-efficient technology but doesnrsquot then
recoup the costs from fuel savings as they charter their ships out as this goes to the charterers This
problem is particularly apparent for short-term time charters11
Conclusions
Regarding energy efficiency the work of the AHEWG-TT12 has shown that the main shipbuilding nations
all have access to the necessary technologies provided there is demand for them It has also been
noted that there is no need for transfers of intellectual property rights13
One of the major barriers to the effective implementation of the EEDI and the SEEMP is the heavy
reliance it places on Flag States for inspection of vessels and enforcement of provisions During the
1970rsquos ships were being reflagged from high tax and high regulation countries such as the United
States and the United Kingdom to countries offering Flags of Convenience (lsquoFOCrsquo) Under FOCs ship-
owners pay less tax to the relevant Flag State and are able to evade the majority of the environmental
and construction standards set out under MARPOL (Leddy 2012) The main reason for that is that
several Flag States are not signatories to all MARPOL Annexes (eg as of 20142015 the Bahamian
Bolivian Cambodian North Korean Georgian Honduran Lebanese and Sri Lankan flags of
convenience had not ratified all MARPOL treaty annexes III-VI14 15)
Many FOCs are developing nations that do not have the resources to enforce investigate or prosecute
breaches by their flagged vessels (Aqorau 2000) As of 2014 55 of merchant ships are flagged by
FOC and 40 of ships are flagged by FOCdeveloping countries MARPOL only provides guidelines for
Flag States to follow when surveying vessels under regulation 6 but none of these guidelines are
mandatory Conversely Port States which are developed are better equipped to bear the cost of
inspection investigation enforcement and prosecution costs However in relation to EEDI and the
11 httpssi2040orgwhat-we-dowork-streamsfinance 12 MEPC 6831 Progress report of the Ad Hoc Expert Working Group on Facilitation of Transfer of Technology for Ships 13 Submission of the United States on Task 3 of the Ad Hoc Expert Working Group on Facilitation of Transfer of Technology for Ships Jan
2015 14 wwwics-shippingorgdocsflag-state-performance-table 15 httpwwwimoorgAboutConventionsStatusOfConventionsPagesDefaultaspx status of conventions
TRANL15371 8
SEEMP port state control is limited to verifying when appropriate that there is a valid International
Energy Efficiency Certificate on board
We therefore conclude that there needs to be a focus on enabling Flag States and Port States that lack
the resourcescapacity to enforce the EEDI and the SEEMP in order to further stimulate the adoption
of energy efficiency technologies Also attention should be paid to overcoming the barrier of split
incentives ie where the benefits of energy efficiency measures are not transferred from the charterer
to the investor (owner)
TRANL15371 9
3 Energy Efficiency Measures for Ships
In order to understand the important energy efficiency measures that can help improve energy
efficiency from shipping it is interesting to see the split between new-built ships and existing fleet In
2012 some 3655 merchant ships were delivered worldwide about 6 of the worldrsquos merchant fleet
of about 60000 The average age of the merchant fleet is 19 years Therefore measures for both new
ships and retrofits for old ships are important for improving the energy efficiency in the next decades
If only the new ships would be targeted only 50 of the fleet would be more efficient in the next
decades while there are many retrofit measures available The total fleet can be broken down to about
4000 passenger ships just under 14000 tankers and about 37000 dry cargo ships including about
5000 container ships (Statista 2015)
In order to identify the most interesting energy efficiency measures for ships we used the information
from several reports to develop a long-list Many measures improve the efficiency in the order of up to
5 Here we would like to focus on measures that result in high savings that can be applied to many
ship types and preferably also to existing ships The resulting short-list is presented in the next table
We used the main categories identified by AHEWG-TT for structuring the measures
The main categories defined by AHEWG-TT are
1 Hull
2 Main Engine
3 Auxiliary engines
4 Propellers and rudders and
5 Control systems
Since the auxiliary engines typically consume only a fraction of the energy that goes to the main
engines their energy efficiency measure results do not show in the short-list below The measures are
worked out in more detail in the paragraphs below The main engine and auxiliary engine improvements
are covered in the same paragraph
The common rail upgrade is a simple measure that can be easily applied to all ships even when the
ship is not in the dry-dock The details are available in the paragraph about engines
From the list it is clear that conventional technology is available to achieve high efficiency gains If the
maximum gain per category is added up (for all but ferry and cruise) this would mean a total efficiency
improvement of 35 even without taking two experimental technologies with potentially high efficiency
gains into account (wind power and air lubrication) Note that some technologies are not applicable to
all ships
In order to find possible financial barriers the investments are rated from ldquovery lowrdquo to ldquohighrdquo relatively
to the size of the ships The same measure on a larger ship is obviously more expensive
TRANL15371 1
Table 1 Inventoryranking of energy efficiency measures
Main category
Measure Estimated efficiency (range)
Efficiency at average circumstances
Ease of installation
Payback time
Investment Implementation References
Hull Bow optimisation
25-20 10 all ship types
short (lt3 years)
Medium conventional technology
(IMO 2009 IMO 2011 Crist 2009 Hochkirch und Bertram not dated)
Main Engines
Wind power 5-44 20 only special ship types
long (gt15 years)
High experimental technology
(IMO 2011 IMO 2009 Crist 2009 ICCT 2011 Brannigan et al 2009 Allenstroumlm 2013)
Propellers and Rudders
Ducted propeller
1-20 10
all ship types except ferry and cruises
medium (4-15 years)
Medium conventional technology
(IMO 2011 IMO 2009 Crist 2009 ICCT 2011)
Propellers and Rudders
Contra-rotating propellers
6-20 13 only special ship types
long (gt15 years)
High conventional technology
(IMO 2011 IMO 2009 Crist 2009 WAumlRTSILAuml 2009 Shuto 2010)
Propellers and Rudders
Wheels 10 10
all ship types except ferry and cruises
short (lt3 years)
Medium conventional technology
(IMO 2009 Schneekluth und Bertram 1998 Brannigan et al 2009)
Control Systems
Waste heat recovery
6-10 8 new build only
medium (4-15 years)
Medium conventional technology
(IMO 2011 IMO 2009 Crist 2009 WAumlRTSILAuml 2007 ICCT 2011)
Propellers and Rudders
Rudder bulb 2-5 4
all ship types except ferry and cruises
medium (4-15 years)
Low conventional technology
(IMO 2011 IMO 2009 Nielsen et al not dated Crist 2009 ICCT 2011)
Propellers and Rudders
Post swirl fins
2-5 4
all ship types except ferry and cruises
short (lt3 years)
Low conventional technology
(IMO 2009 MOL 2011 Hansen Dinham-
Peren und Nojiri 2011 Nielsen et al not
dated)
Hull Hull coating 1-9 5 all ship types
short (lt3 years)
Low conventional technology
(IMO 2011 IMO 2009 ICCT 2011 Voorham 2013 Crist 2009)
Hull Air lubrication
5-15 9 new build only
medium (4-15 years)
Medium experimental technology
(IMO 2011 IMO 2009 Crist 2009 DK Group 2015 CNSS 2015 ICCT 2011)
Propellers and Rudders
Twisted rudder
2-4 3
all ship types except ferry and cruises
medium (4-15 years)
Low conventional technology
(IMO 2009 Schulze 2007 Nakashima 2015 Becker Marine System 2015 Nielsen et al not dated Hollenbach und Friesch not dated Rolls-Royce 2014)
Main Engines
Main engine de-rating
2-4 3
all ship types except ferry and cruises
medium (4-15 years)
Low conventional technology
(IMO 2011 IMO 2009 Crist 2009 Wettstein und Brown 2008 DNV GL 2015)
Auxiliary engines
Common rail upgrade
- - all ship types
medium (4-15 years)
Very Low conventional technology
(DNV GL 2015) (ICCT 2011) (IMO 2009)
Main Engines
Common rail upgrade
01-05-
03 all ship types
medium (4-15 years)
Very low conventional technology
(IMO 2009 Pakarinen 2007 ICCT 2011 Crist 2009)
TRANL15371 2
Hull and superstructure
In general the optimisation of hull and superstructure focuses on minimising the resistance by reducing
the wave resistance and friction between water and hull It is important to recognise which type of
vessel is to be optimised The reduced frictional resistance increases energy performance of the vessel
particularly at low speeds Operability and performances of the ship must be considered in detail The
improvements measures are generally applied at new-built ships but also applicable to retrofitting
Bow optimisation
The different bow optimisations can improve the water flow around the hull and reduce the wave-added
resistance for large vessels with high block coefficient operating within commercial speed ranges The
average energy reduction potential ranges from 25-20 on average 10 (Crist 2009 IMO 2011
Voorham 2013)
Figure 3 Left The green line characterises the ordinary bow wave of the hull The blue line characterises the wave
formed by the bulb The red line is the sum of these two The altitude of the bow wave is noticeably reduced which
reduces the hull drag associated with the bow wave This improves fuel economy and increases range (Selenetrawlers
2015) Right Ordinary bulbous bow leadge bow and ax-bow shape (JSEA 2006)
The below-the-waterline extension of the bulbous bow (Figure 3) modifies the way the water flows
around the hull reducing drag and thus increasing speed range fuel efficiency and stability An altered
design is the ax-bow (Figure 3) The narrow designed bow slashes through the water in order to reduce
slamming and reduces the size of bow generated wave The propeller can act more efficient due to the
absence of slamming The ax-bow allows the ship to steer well to maintain speed and the engine to
save fuel (Crist 2009 IMO 2009) If the bulbous bow is modified during a regular docking period the
investment is estimated to have short payback of about 1-3 years It is most promising for container
vessels (DNV GL 2015 Hochkirch und Bertram not dated)
Barriers The bow optimisation (as retrofit) needs to be done in the dry dock Dry-docking is not
regularly happening for existing ships because it means that the ship cannot operate and economic
losses are suspected Another obstacle might arise due to restricted access to the original contractual
hull plans since shipyards are not always keen to provide detailed plans on their vessels to prevent
TRANL15371 3
imitation (Hochkirch und Bertram not dated DNV GL 2015) A major obstacle is the split incentive
between ship owner and operator Ship owners are responsible for investing in these technologies and
ship operators are those who pay for the fuel consumption and benefit from such technologies (ICCT
2011)
Technical maturity The technique is available on the market and is effective Only conventional
material is needed and redesign can be done in a few weeks16
Applicability Applicable to all ship types but most efficient for ships with a high block coefficient like
tankers and bulk carriers since the reduction of the wave-added resistance is most impacting (IMO
2009)
Hull coating
Hull coatings (Figure 4) can lower frictional resistance and limit fouling by aquatic organisms It can
save between 1-9 fuel consumption on average 5 (ICCT 2011 Voorham 2013 Crist 2009)
Figure 4 Example of hull coating (ECOSPEED 2015)
One way of lowering the frictional resistance is to improve the smoothness of a hull by means of
coatings that reduce fouling The costs are lifetime cost reduction and have to be recur every five years
to be able to gain the fuel benefit
Barriers A new application is typically necessary during each dry-docking The self-polishing coating
must be renewed after a 3-5 years period (IMO 2009) A major obstacle is the divided interest between
ship owner and operator Ship owners are in charge for investing in these technologies and ship
operators are those who pay for the fuel consumption and profit from such technologies (ICCT 2011)
Technical maturity Coating techniques are available on the market and roughly 5 of newly painted
ships are painted with one of the advanced coating systems presently available (IMO 2011 ICCT 2011)
The payback time is short (ICCT 2011) or 0-2 years according to others17
Applicability The technology is applicable to all vessels
Air lubrication
The air lubrication technique creates a layer of bubbles underneath an already streamlined hull in order
to further reduce friction An automation system regulates the compressorsblowers depending on
16 httpwwwship-efficiencyorgonTEAMpdf14-Ship20efficiency20seminar20-20CMA20CGM-
20HydrOcean20120CMA20pdf 17 httpswwwdnvglcommaritimeenergy-efficiencyefficiency-finderhtml
TRANL15371 4
speed The blower keeps holes filled with air and required pressure A thin layer of bubbles trailing
behind of each cavity merge into single large ldquoair layerrdquo for the whole flat bottom part of the hull and
reduces the friction (Figure 5) Depending on the ship type the estimate fuel efficiency ranges between
5-15 (on average 9) where tankers and bulkers can reduce more (10-15 on average 125) in
comparison to container vessels (5-9 on average 7) (IMO 2009 DK Group 2015 CNSS 2015 ICCT
2011 Voorham 2013)18
Figure 5 Schematic view of air lubrication (DK Group 2015)
Barriers Large capital investment requirements with split incentive The vessel owners are
accountable for investing in these technologies whereas vessel operators recompense for the fuel
consumption and benefit from such technologies (ICCT 2011)
Technical maturity The technology is available on the market but still in a pilot phase Sea trials
have been performed with small demonstration ships There are no vessels operating commercially
that currently use this technique Specifications about the payback time vary from short to medium
(Silberschmidt 2014 Skinner 2009)
Applicability The original technology would be likely be applied to new-built ships with at least a
partly flat bottom and a minimum length of 225 metres since the compressor may have technical
problems maintaining air cavities for deep draft ships (IMO 2011 CNSS 2015) Air lubrication can be
used for retrofitting as well (CNSS 2015)
Engines
Speed reductions on existing vessels provide opportunities for engine optimisation on low power
(321) Similar measures as de-rating for the main engines that could be implemented are cylinder
cut-out and new torsional vibration calculation (IMO 2009)
18 It has to be noted that the extra fuel use caused by the system itself should also be taken into account
TRANL15371 5
Another propulsion supportive measure with a high potential measure is wind power This is also
explained in more detail below In order to also provide a measure with a lower improvement potential
per ship but simple and applicable to all ships we describe the common rail system for fuel injection
Main engine de-rating
Slow steaming vessels are known as one of the most effective energy saving measure The potential
comes mainly from the operational behaviour side From the technical side the specific fuel oil
consumption will decline when a ship is no longer operated at its design speed
The design speed can be reduced by de-rating the main engine (IMO 2011 IMO 2009) Reduction of
power combined with injection timing advanced to restore peak combustion pressure can achieve a
certain gain in shaft efficiency Fuel efficiency can be improved by 2-4 when de-rating is performed
for loads lower than the maximum design load (Wettstein und Brown 2008 Crist 2009) on average
3 energy efficiency potential (Crist 2009) Operational costs would be lower mainly due to fuel
savings (DNV GL 2015 Crist 2009 Wettstein und Brown 2008)
Barriers A slower vessel will have lower incomes as it is not capable to perform as much transport
load per unit of time as a faster vessel De-rating the engine is usually done when it is clear that the
ship will become a slower steaming ship There is a split incentive between vessel owners who are
responsible for investing in these technologies and vessel operators who are those who compensate
for the fuel consumption and benefit from such technologies (ICCT 2011)
Technical maturity This technique has been proven as successful particularly on older engines
which are normally built with a low compression ratio and thereby have a significant potential to
improve their efficiency (IMO 2009) De-rating measures have a low to medium payback time (Crist
2009 DNV GL 2015)
Applicability The technologies are available on the market It is applicable to all vessels (DNV GL
2015)
Common-rail upgrade (common-rail fuel injection)
Engines with common-rail fuel injection handle low-load working modes much better (IMO 2009) A
common-rail fuel injection is technique of injecting fuel into an engine cylinder under total control and
thereby achieving optimal combustion Common-rail allows the start and duration of injection
independent of the position of the pistons in that way permitting an operationally optimised injection
per stroke In a normal diesel engine fuel is injected at a static rate by a pump and common practice
is to optimise this pump to run at an optimal setting for the ideal injection time (Pakarinen 2007) The
energy efficiency potential is estimated between 01-05 on average 03 (ICCT 2011 IMO 2009)
Barriers Additional electronics can also introduce possibilities for failures However recent
advancements have increased the systems popularity19 There is a split incentive between vessel
19 httpwwwmarineinsightcommarinean-overview-of-common-rail-system-in-marine-engines
TRANL15371 6
owners who are responsible for investing in these technologies and vessel operators who are those
who compensate for the fuel consumption and benefit from such technologies (ICCT 2011)
Technical maturity This measure is available on the market (ICCT 2011) Payback time is short to
medium with an average of 5 years (IMO 2009 Crist 2009)
Applicability This measure is applicable to new and retrofit vessels It is applicable for tanker- bulk-
container- and Roro-ships (Crist 2009)
Auxiliary engines and systems
Based on our own estimation auxiliary engines improvement are not bringing gt2-4 energy savings
because auxiliary engines consume much less fuel than the main engine Similar measures as de-rating
for the main engines and common rail upgrade could be implemented for the auxiliary engine
Other options for improving auxiliary systems are speed control of pumps and fans control strategies
of cooling water systems room ventilation redesign of piping and instruments advanced computation
of airgas temperature distribution with reduced storage ventilation and with optimised ventilation
systems (DNV GL 2015)
Barriers There is a split incentive between vessel owners who are responsible for investing in these
technologies and vessel operators who are those who compensate for the fuel consumption and benefit
from such technologies (ICCT 2011)
Technical maturity This measure is available on the market (ICCT 2011) It is easy to apply and
uncomplicated in maintenance (DNV GL 2015) Payback time is short (DNV GL 2015)
Applicability This measure is applicable to all new and retrofit types of ships (DNV GL 2015)
Wind power
Wind power measures are available that can develop enough thrust to provide at least some supportive
propulsion Wind power can be utilised in various ways in shipping like traditional sails solid wing sails
Flettner-rotor and kits (see Figure 6) The techniques are currently used as supplementary power
(Brannigan et al 2009)
Figure 6 from left to right Kite (Cargill 2011) Flettner rotor (MIWB 2015) and solid sails (Wind Chellenger Project
HP 2015)
Solid wing sails are structured similar to aircraft wings which offer more thrust with less drag than
conventional sails Flettner rotors produce thrust from a rotating object in wind using the so-called
TRANL15371 7
Magnus effect The techniques have different characteristics with regards to how the thrust that is
produced relates to other factors such as wind strength wind angle wind stability and ship speed
(IMO 2009)
Towing kites vary from other concepts of wind power by having a small footprint during installation and
therefore being quite feasible to retrofit (Allenstroumlm 2013) Studies conducted at the Technical
University of Berlin indicated that the potential for sail energy has different prospective in the different
regions in the world Best scenarios exist in North Atlantic and North Pacific regions the South Pacific
seems a bit less potential The studies have shown that under normal circumstances the typical savings
using wind power may be 5 at 15 knots and up to 20 at 10 knots This study also revealed that
with optimal weather routing in the North Atlantic and given the best vessel with best sail type savings
can reach 15 percent at 15 knots and 44 at 10 knots (IMO 2009 Crist 2009) Nevertheless the
above figures should be considered indicative since practical experiences are limited Sail- and kite-
assisted power does seem to be a potential opportunity saving energy in the medium- and long-term
picture for shipping (IMO 2009) Christ estimates and average energy saving potential around 20
(2009)
Barriers There is a split incentive between vessel owners who are responsible for investing in these
technologies and vessel operators who are those who compensate for the fuel consumption and benefit
from such technologies (ICCT 2011) Although this technology can bring high energy savings the
investment is so high that there is not a short payback time
For solid wing sails complications could result in a need for masts to run down to the keel which can
be a bigger issue for retrofitting Additionally the presence of the mast and rigging could have significant
impacts on cargo handling (IMO 2009) Downside of the kite systems include the complex launch
recovery and control systems that are needed (IMO 2009)
Technical maturity This is still considered as experimental technology The technical barriers
identified above need to be tackled for this measure to be applied widely in the future Payback time is
estimated to be medium to long term (Allenstroumlm 2013 Crist 2009)
Applicability Wind power technologies are available and a number of cargo ships have been equipped
with wind engines to reduce demands from diesel engines (ICCT 2011) Kites can be used on ships
with a minimum length of 30m and works most energy efficient on ships with a typical speed not faster
than 16 knots Preferably tankers (crude oil product chemical LPG LNG other) and bulk carriers are
being considered as potential users due to this speed restriction (IMO 2011)
Control Systems Waste heat recovery
Waste heat recovery (WHR) technology can pass exhaust gases from a vessels engines through a heat
exchanger to generate steam for a turbine-driven generator The heat energy from the exhaust gas is
taken and transformed into electrical energy to reduce direct engine-fuel consumption for the
propulsion system or reduce auxiliary engine needs (ICCT 2011) Energy saving potential is estimated
between 6-10 on average 8 (Crist 2009 ICCT 2011)
TRANL15371 8
Figure 7 Efficiency of waste heat recover systems Sankey diagramme Even with high 50 efficiency of modern low-
speed engines there is still 50 of fuel input energy not being put to productive use The possibilities are illustrated
by this comparison of Sankey diagrammes for Waumlrtsilauml 12RT-flex96C engines without heat recovery (left) and with
high-efficiency waste heat recovery plant (right) showing in this case 114 gain in overall efficiency with WHR
(waste heat recovery) (WAumlRTSILAuml 2007)
Barriers Large capital investment requirements (around $5-6 million for a large container ship20) and
split incentive between ship owners and ship operators (ICCT 2011)
Technical maturity The technology is available on the market and has medium to long payback time
(WAumlRTSILAuml 2007 Crist 2009)
Applicability A WHR system is applied to vessels with a high production of waste heat and a high
intake of electricity WHR can be employed on ships with main engine average performance is higher
than 20000 kW and auxiliary engine average performance higher than 1000 kW This size
requirements limit the number of ships using this technology (IMO 2011) Generally it is applicable to
all ships types new and retrofit (Crist 2009)
Propellers and Rudders
Numerous devices have been designed for improving the energy consumption of vessels by recovering
as much as possible of this rotational energy in the flow from the propeller or to provide some pre-or
post-rotation of the in flow into and after the propeller to ensure best efficiency The most important
of these will be discussed in the following paragraphs (IMO 2009)
Ducted propeller (Kort Nozzle)
The accelerating ducted propeller consists of a screw propeller surrounded by a non-rotating duct
(nozzle) (Figure 8) Compared to the conventional propeller of the same diameter and thrust this
20 httpgcaptaincompower-exhaust-gas-paybacks-waste
TRANL15371 9
arrangement allows an increase inflow to the propeller improving the operating conditions around the
propeller and the ideal efficiency
Figure 8 Right photos of this Norwegian trawler (SetSail 2009)
The duct creates additional thrust load The potential for energy savings on relevant vessels range
between 1ndash20 (Crist 2009 IMO 2011 Barringhaus und Olds 1999 IMO 2009) whereupon 10 is a
good average value (IMO 2009 Crist 2009) The improvement of the combination of propeller and duct
overweigh negative effect of the increase water resistance caused by the duct
Barriers Since the duct has an optimal operational speed it does not work efficient at all speeds For
instance as drag increases with increasing speed eventually this will become larger than the added
thrust Therefore at high speeds ducts are typically not used (IMO 2009) The split incentive is a barrier
between ship owners (investor) and ship operators (gainer) as explained earlier (ICCT 2011)
Technical maturity Several standard designs are available on the market (IMO 2011) with a medium
payback time (IMO 2011)
Applicability Ducted propellers suits for vessels operating at high propeller loadings such as tankers
bulk carriers especially tugs and some offshore service ships The duct leads to increased friction but
at higher propeller loadings this is more than rewarded for by the positive effect of the combination of
propeller and duct (IMO 2009)
Contra-rotating propellers (CRP)
A rotating propeller induces a rotating motion in its backwash Normally this rotation energy of the
propeller gets lost The contra-rotating propeller is used in order to recover part of this energy (Figure
9) In a contra-rotating configuration two propellers are facing each other rotating in the opposite
direction with the aft propeller recuperating the turning energy in the wake from the forward propeller
(IMO 2011) To avoid complications with cavitation the aft propeller usually has a smaller diameter
than the front propeller Contra-rotating propeller arrangements involve a short shaft line and for that
reason primarily suitable for vessels with single-screw
TRANL15371 10
Figure 9 Left conventional propeller Right contra-rotating propeller The working principle is simple and effective
the power is split in a forward and aft propeller which through the different direction of rotation cancel out the
rotational energy losses behind the propeller (WAumlRTSILAuml 2009)
Potential savings of such measures are assessed to be in the order of 6ndash20 of the power consumption
with an average of 13 although higher figures may be presented by industry for specific cases Two
different full-scale measurements reported gains of 15 and 16 (IMO 2009 Crist 2009)
Barriers The mechanical installation of contra-rotating shafts is complicated and requires more
maintenance (IMO 2011) The split incentive between ship owners (investor) and ship operators
(gainer) is a barrier as explained above Although this technology can bring high energy savings the
investment is so high that there is not a short payback time
Technical maturity The technique is available on the market but problems with gearboxes for
contra-rotating propellers have been reported as well as operational problems with mounting (IMO
2009 IMO 2011) Payback time is reported as short (WAumlRTSILAuml 2009) but also as medium-long with
about ~15-20 years (Shuto 2010)
Applicability The technology is particularly beneficial for rather heavily loaded propellers as for
example very fast cargo vessels like Ro-Ro ships or for container ships (IMO 2011 Crist 2009) Contra-
rotating propellers need a short shaft line and hence mainly suited to single-screw ships (IMO 2011)
Contra-rotating propellers can be implemented as retrofit but it is more likely implemented in new
built ships due to the complicated mechanical installation (Crist 2009)
Post swirl devises
A number of different techniques belong to the post swirl category Several of them contain
modifications to the rudder or propeller (IMO 2009) Depending on vessel type and operational field
various power saving measures can be mounted to optimise water velocity distribution to the propeller
and to minimise slipstream losses due to swirl in the outflow of a propeller The most important among
these measures may be additional thrusting fins at the rudder twisted rudder (Figure 12) rudder-
bulb-systems with fins (Figure 13) and fins on the propeller fairwater also called post swirl fins or
boss cap fins (Figure 10)
Generally post swirl measures reported 1-8 energy efficiency (test models) Even 8-9 energy
efficiency from full-scale measurements for additional thrusting fins at the rudder Payback time is
estimated to be short to medium post swirl devices (DNV GL 2015 Crist 2009 ICCT 2011) Some of
CRP FOR BETTER PROPULSION EFFICIENCY
CONVENTIONAL PROPULSION
TRANL15371 11
the post swirl measure can be combined A good overview is given in Nielsen et al (Combined Kappel
propeller and rudder bulb system for improved propulsion efficiency not dated)
3431 Post swirl fins
The post swirl fins (Figure 10) can recover energy loss of propeller hub vortex in the propeller backward
flow and can lead to 3-5 energy saving on average 4 operating at the same speed (MOL 2011
Barringhaus und Olds 1999 Hansen Dinham-Peren und Nojiri 2011 ICCT 2011)
Figure 10 Example the post swirl fins or propeller boss cap fins (gcaptain 2012)
Barriers It is simple and straightforward measure requiring only the removal of the propeller boss
caps and replacement with the post swirl fins (no hull modification is needed) (Hansen Dinham-Peren
und Nojiri 2011 MOL 2011) However there is a split incentive between ship owners (investor) and
ship operators (gainer) as explained above
Technical maturity The technique is available on the market In 2013 post swirl fins were applied
to over 2500 ships worldwide (MOL 2011) Further advantages of the post swirl fins are reduction in
propeller torque reduced vibration in the stern and less underwater noise and reduced rudder erosion
(MOL 2011) A payback time of 6 months was estimated for 4 efficiency improvement at $600tonne
oil price (Hansen Dinham-Peren und Nojiri 2011) The investment is considered to be low21
Applicability The technique is effective for all screw propellers irrespective of the type or hull form
of the ship Has been tested on large-scale container vessels (MOL 2011 Hansen Dinham-Peren und
Nojiri 2011)
3432 Free rotating wheels
A vane wheel (Grim wheel) is a freely spinning propeller mounted behind the main smaller propeller
(see Figure 11 for example of use on retrofit Queen Elisabeth II in 1986) The vane wheel has a bigger
diameter than the main propeller and increases the propeller diameter The small propeller drives the
freely revolving vane wheel fitted on the wake The inner part of the vane wheel acts as a turbine and
the outer part as an ldquoadditionalrdquo propeller
21 httpgcaptaincompropeller-technology-ship-efficient
TRANL15371 12
Figure 11 Example for a grim vane wheel (Boat design 2007)
This leads to a substantial recovery of the rotational energy The energy saving potential is reported to
be 10 (Brannigan et al 2009) It is stated that the important benefit of the vane wheel is that a
smaller impulsion propeller can be installed which consumes less energy The vane wheel gives a
suitable energy improvement for cargo ships (IMO 2009 Schneekluth und Bertram 1998) and has short
payback time It is also stated that if there is room for a vane wheel in the aft there is also space for
an impulsion propeller of larger diameter leading about the same energy saving potential as the
combination of a small impulsion propeller and a vane wheel (IMO 2009)
Barriers A barrier is the split incentive between vessel owners who are responsible for investing in
these technologies and vessel operators who are those who compensate for the fuel consumption and
benefit from such technologies
Technical maturity Limited application Vane wheels are subjected to strong fluctuations in loading
Problems with the strength of the blades have been encountered frequently (for example the vane
wheels on the Queen Elisabeth II were short lived and not used after22)The payback time is estimated
to be short
Applicability The technique is effective for all screw propellers irrespective of the type or hull form
of the ship both for new and existing ships (Chen Reed und Kim 1989) Recommended for all ship
types except ferry and cruises because of their problem with strong fluctuations in loading as
mentioned above23 (IMO 2009)
3433 Twisted rudder
Rudders can play a significant role of extra frictional resistance Rudders are located in the backwash
of a propeller and rotational energy will act on the rudder Because of these effects the rudder gives
prospects of efficiency gains (Schulze 2007)
22 httpwwwroblightbodycomlinersqe-21987_Refitindexhtm 23 httpwwwroblightbodycomlinersqe-21987_Refitindexhtm
TRANL15371 13
Figure 12 Schematic capture of twisted rudder (Nakashima 2015)
Twisted leading edge technology provides multiple benefits for high-speed vessels compared to
conventional rudder designs Conventional rudders are located behind the propeller with the rudder
profile arranged symmetrically about the vertical rudder centre plane This arrangement does not
consider the fact that the propeller induces a strong rotational flow that strikes on the rudder blade
This consequences in areas of low force on the blade that induce cavitation and associated erosion
problems (Becker Marine System 2015 Schulze 2007)
The twisted rudder is horizontally twisted on the lower and upper side of the segment that is an
extension of the propeller shaft (Figure 12) This decreases cavitation rudder and improves
manoeuvrability of the vessel (Schulze 2007) Twisted rudder types lead to energy efficiency
improvements by approximately 2-4 on average 3 for large-size high-speed vessels (Hollenbach
und Friesch not dated Nakashima 2015)
Barriers Work needs to be done in the dry dock this is not regularly happening for existing ships
(Hochkirch und Bertram not dated) There is a split incentive between vessel owners who are
responsible for investing in these technologies and vessel operators who are those who compensate
for the fuel consumption and benefit from such technologies (ICCT 2011)
Technical maturity This rudder type is a commercially used technology and easy to apply if the ship
is in the dry dock (ICCT 2011)The payback time is estimated to be short to medium (Rolls-Royce 2014
Crist 2009)
Applicability Twisted rudder can used by container vessels reefers Ro-Pax ferries cruise ships and
naval vessels In South Korea this type of rudder is recognised as a standard rudder for large-size
high-speed container carriers (Nakashima 2015)
TRANL15371 14
3434 Rudder bulb
Figure 13 Example for a rudder bulb Kawasaki RBS-F rudder bulb systems with fins (Kawasaki 2015)
The rudder bulb brings smooth inflows from the propeller and can reduce the drag of the rudder The
rudder fins produce thrusts in the rotational flows generated by the propeller (Figure 13) Rudder bulb
measure can improve energy efficiency by 2-5 (Nielsen et al not dated Becker Marine System not
dated) on average 4 (Crist 2009)
Barriers The work needs to be done in the dry dock this is not regularly happening for existing ships
There is a split incentive between vessel owners who are responsible for investing in these technologies
and vessel operators who are those who compensate for the fuel consumption and benefit from such
technologies (ICCT 2011)
Technical maturity The technology is a commercially used technology and easy to apply while the
ship is in the dry dock (Kawasaki 2015) Payback time is estimated to be medium (Crist 2009)
Applicability For new and retrofit tanker- bulk- container- and Roro-ships with a propeller and
rudder (Crist 2009)
TRANL15371 15
Barriers to the transfer and uptake of energy
efficiency technologies for ships and possible
measures to overcome them
Although there are ways to reduce emissions (Chapter 3) and also drivers working towards the
implementation of such measures there are significant barriers to acting on cost-effective opportunities
in the maritime industry This is often referred to as barriers to energy or the energy efficiency gap
(Michele Acciaro 2013) (Sepideh Jafarzadeh 2014) (OECD 2014) Some barriers are shared with other
industries while others are unique to the maritime industry Furthermore many of these barriers are
not specific to the EEDI and the SEEMP but apply to any rule under MARPOL These barriers can exist
on both the supply and the demand side For example there could be barriers to the development and
implementation of measures that reduce CO2 emissions from ships and barriers to the expression of
demand for these measures (ECORYS 2012) Studies have however shown that there are relatively
few barriers related to the development of new technologies or access to related intellectual property
rights by the main shipbuilding nations and that the supply of measures exceeds the demand (ECORYS
2012) Existing studies on barriers to energy efficiency thus focus on what prevents the uptake of
available measures
This section presents an overview of the main barriers to the transfer and uptake of energy efficiency
technologies in the shipping industry and discusses potential ways of overcoming them
Preliminary assessments of technology transfer and financial needs by both workshop participants and
the IMO Ad Hoc Expert Working Group on Facilitation of Transfer of Technology for Ships (AHEWG-TT)
have suggested that the type of assistance needed by Port State and Flag State administrations will be
of a different nature than that required by shipbuilders and owners Our assessment above has shown
that the shipbuilding industry is expected to need less assistance than Port States and Flag States
In the next table we list a summary of the main barriers and the stakeholders concerned in the main
categories as identified by AHEWG-TT as well as the possible measures that could help overcome these
barriers The possible measures to overcome the barriers are further detailed in the sections below
Related costs are estimated in a separate section in order to minimise overlap
TRANL15371 16
Table 2 Summary of main barriers relevant stakeholders and possible measures to overcome them
Barrier Stakeholders Measures forward
Lack of awareness
(administrative and industry)
a MARPOL in general MARPOL Annex
VI EEDI and SEEMP in particular
b Available energy efficiency
technologies
Flag and Port
States
Ship owners
Capacity building
- Workshops
- Trainings
Model course for training
Inventory
Platform for information access and
sharing
Agreements between industry and
administrations
Technology concerns
a Lack of or limited technology supply
chain in some states
b Lack of technology base for RampD in
some states
c Lack of trust (in ability to reduce
emissions in ability to reduce
operational costs in compatibility
with other measures)
Ship owners
Investors
Increase cooperation in ship design
and building
Increased interaction between
industry and educationalRampD
institutes
Establish platform to share
expertiseexperience
Provide special investment or
guarantee funds
Institutional concerns
a Increased administrative burden
1Revision and amendment of existing legislation
2Implement Port and Flag State obligations
b Limited technical capacity in state institutions to implement
c Lack of financial resources for additional compliance and enforcement activities by maritime administrations
Flag States
Port States
Promote increased cooperation and
communication between
administrationswithin regional
administrations
Regional information workshops for
Port and Flag States
Establish platform to share regulatory
experience
Development aid
Commercial
a Increased costs for ship owners to
take up energy efficient technologies
b Lack of motivation of owners to take
up energy efficient technologies (split
incentive)
Ship owners
Financiers
Special EE funds
Smart contracts
TRANL15371 17
Awareness Raising
Barriers Lack of Awareness
The need to create awareness among Flag States Port States and ship owners of the requirements of
Annex VI in general and Chapter 4 in particular was highlighted by participants of the workshop and
emphasised by the AHEWG-TT The level of awareness in the various regions and even in the countries
within the regions differed considerably The AHEWG-TT further suggests it would be beneficial to
undertake an initial evaluation of knowledge needs (gap analysis) in order to ensure workshops and
other awareness-raising activities are appropriately tailored24
Furthermore ship-owners are not always aware of the energy efficiency technologies available on the
market or which operational measures can be implemented to save fuel Ship owners can be companies
people and investment funds Especially private equity groups tend to focus more on short term looking
for quick profit while traditional ship owners tend to hold the ship for at least 20 years25
Measures forward
Though Flag States and Port States should already have implemented measures to ensure that Energy
Efficiency Design Index (EEDI) and Ship Energy Efficiency Management Plan (SEEMP) requirements are
complied with both public administrations and industry representatives could benefit from additional
trainingcapacity building and platforms to share experiencesreceive information with regards the
practicalities of these regulations and available energy efficiency technologies The needs for each
group can be determined through a gap-analysis which we recommend to be carried out by an
independent consultant in cooperation with the flag and port states Once the specific needs for each
group have been determined they can be addressed through the following awareness raising
measures
Capacity Building (workshops trainings)
Workshopstrainings could be organised where formal training is combined with open discussions where
experiences could be shared just within one stakeholder group or between educational institutes
auditors operational managers of ships shipbuilders and authorities Such trainingsworkshops could
focus on just one or all aspects relating to the applicable rules available energy efficiency measures or
assessment methods of technologies (eg training in calculating and verifying EEDI and SEEMP
including development of tools to calculate EEDI and SEEMP) Trainingsworkshops can be local or
regional Sending people physically to regional workshops is generally more conductive to networking
and experience sharing but less adapted to the local situation and more costly
To reduce the costs of training and ensure a certain level of training the IMO or other qualified
international partners (eg WMU) could develop model courses for training In order to better
understand the rules and regulations in detail people use the help of trainers to better understand the
elements that are important for them and to gain experience in doing calculations and other required
24 Ad Hoc Expert Working Group on Facilitation of Transfer of Technology for Ships 2nd Meeting 25 httpwwwftcomcmss0dadcb240-3d97-11e3-b754-00144feab7dehtmlaxzz3aqC3tmNu
TRANL15371 18
activities by the regulations Trainers have to develop their courses and earn back their investments
via trainings Since the trainers are doing this simultaneous it would be more efficient if there would
be a model course available that can easily be tailored to the audience This would reduce the costs for
the development of trainings and would also ensure that the trainers provide the same level of depth
in their trainings Since the IMO is responsible for the rules and regulations it would be the logical
responsible for the efficient implementation and therefore could take the initiative for developing model
courses
Information Sharing
Inventory of energy-efficiency technologies (for example the IMO-GEF-UNDP project) Many
studies and overviews on the internet are available The quality and the scope is often
different
Improved access to information and information sharing with international recognised
organisations including relevant survey and certification training One example of
establishing information sharing between governments is the work of the OECD Council
Working Party on Shipbuilding (WP6)26 which organises regular workshops aimed at
facilitating the exchange of information on policy and industry developments
Note that many of these measures overlap with the measures required to overcome institutional
barriers as laid out in section 43
Agreements between industry and administrations could be envisaged to overcome the
barriers
In order to enhance the sharing of expertise for both administrations and industry technology transfer
and technology cooperation agreements could be formulated in order to strengthen the cooperation
As identified before the technology transfer to the ship building industry is not a mayor barrier so the
agreements should help the administrations to become more aware of the possibilities to further
promote the implementation of MARPOL Annex VI
Typical agreements between industry and administrations could be in the form of initiatives like the
Sustainable Shipping Initiative (SSI) SSI members have developed a vision for a sustainable shipping
industry in 2040 They commit to working towards this in all their own operations andor activities that
involve shipping and in all their dealings with and support for the shipping industry to make their vision
a global reality by 2040 SSI members of over 19 companies represent ship owners and charterers
shipbuilders engineers and service providers banking insurance and classification societies The SSI
explored for instance how to overcome barriers to the uptake of new technologies and techniques which
improve the operational efficiency of ships potentially delivering energy efficiency savings of 10 or
more and payback periods of less than 5 years They also produce case studies to show good examples
and also develop tools By involving administrations in these kind of initiatives (even free of charge)
they could be actively supported with knowledge about sustainable shipping
26 httpwwwoecdorgstiindworkshopongreengrowthinshipbuildinghtm
TRANL15371 19
Technology Concerns
Barriers Technology Concerns
One of key barriers to the implementation of energy efficient technologies (new and retrofit) relates to
the lack of or limited technology supply chain Furthermore the lack of a technology base for RampD in
some states is a barrier Also the existence of concerns relating to the ability of available energy
efficiency measures to reduce emissions and operational costs and their compatibility with other
measures of energy efficient technologies is a barrier This is typically the problem in very isolated ship
yards
Measures forward
Very successful shipyards (Japan and Korea) have already since many years a large number of
licencing technology transfer and similar agreements and continuously exchange information with
competitors in and outside their countries For instance US shipyards have adopted this methodology
since the 1980s (office of technology assessment 1983)
Further technology sharing could be stimulated through educationalRampD institutes locally regionally
or globally in ship design and building The technology will be transferred to the ship builders once the
students start working there or through cooperation between industry and university In order to
facilitate this we recommend the establishment of partnerships to share expertiseexperience
Typically individuals who know both worlds are the driving force behind successful partnerships (AISBL
2012) These partnerships are built around a shared long term research vision Many partners could
contribute (eg financially) in order to establish the responsible management and research programme
The target of the platform could be for example to provide verified information on real-world energy
efficiency improvements via a monitoring programme
For example in order to stimulate the deployment of energy efficient trucks the Dutch government
provides a website to share audited knowledge and data on about 15 energy efficiency technologies27
Additionally climate financing could be leveraged to reduce the investment risk in unproven
technologies For example IMO Member States could create a demonstration fund that can function as
a guarantee for investments in new and immature technologies28 Similarly investment guarantees
can be provided by funds in the same way governments provide export credits to their companies If
the technology does not deliver the expected fuel-savings the fund can cover the difference and hence
reduce investment uncertainty The main objective being to reduce investment risk
Institutional Concerns
Barriers
27 httpwwwtruckvandetoekomstnl 28 An example of a specific EE fund is httpwwweeefeueligible-investmentshtml
TRANL15371 20
For Flag and Port States complying with new regulations of IMO and EEDI and SEEMP particularly
represent and increased administrative burden It requires revisions and amendments of existing
legislation that need to be implemented at Port and Flag State functions There is currently limited
technical capacity in state institutions to implement these changes especially in developing countries
with a relatively low number of ships under their flag
The lack of financial resources is also a barrier for additional compliance and enforcement activities by
maritime administrations This is particularly an issue for least developed countries and small
developing island states Implementation costs are relatively higher for small Flag States because of
limited abilitycapacity to implement new technical regulations Note that this issue is not specific to
the EEDI and the SEEMP but to most regulatory measures (maritime or other)
Measures forward
Measures to assist states in implementing (existing and new) legislation include
Promote an increased cooperation and communication between administrationswithin
regional administrations of Port and Flag States similarly to what has been suggested in
sections 41 (Awareness raising through capacity building activities such as workshops) and
42 (Establish platform to share regulatory expertiseexperience) Platforms could be
managed by IMO in conjunction with industry and development funds in order to share the
costs as this has been done before for GloBallast for example In that case the IMO is in the
lead (executing agency) but the platform is supporting the collaboration with many
stakeholdersfunding partners The goal of the programme is to assist developing countries
eg via e-learning courses
In addition deterrents need to be put in place to discourage Flag States from performing
substandard inspections A system for detecting sub-standard inspections should be
implemented whereby mandatory Port State Control inspections are carried out in close
proximity to mandatory Flag State inspections (ie the Flag State inspection is carried out
prior to the ship leaving port and the Port State inspection is carried out upon arrival at port)
The two inspections should be carried out under a uniform mandatory checklist The IMO
should monitor inspections and investigate where discrepancies between inspections close in
proximity are detected If a Flag or Port State is found to have failed to meet the requisite
inspection standards penalties in the form of substantial fines should follow
In order to overcome the financial barriers financial assistance to states could help with
capacity building and implementation Financial resources are not only needed in the
implementation of the new regulations (training of government experts) but governments of
Flag States also need to be involved continuously in the ongoing discussion around
developments new EEDI targets for 2020 and beyond which requires continuous availability
of experts to represent the interests of the state (Metselaar 2015) Financial aid can therefore
be supplied in the following forms
Increased financial support for compliance and enforcement activities by maritime
administrations
Financial support could be provided to Flag States so that they have the resources to
properly carry out vessel inspections Consideration should be given to the introduction of
TRANL15371 21
an International Fund Convention set up for this purpose and contributed to by Port
States andor their major oil and other cargo exporters and importers
Commercial
Barriers
Private parties such as ship owners and investors are not always commercially incentivised to make
investments in energy efficiency measures This can be due to the split incentives between owner (who
should make the investment) and charterer (who reaps the cost savings) of a ship (see paragraph 25)
Furthermore access to finance can be problematic for smaller players who operate in niche markets
Measures
Bottlenecks in financing private investments and new financing mechanisms could be addressed during
regional or international workshops that include traditional and new financiers that could finance
investments in energy efficiency technologies
One solution that has been brought forward to address the problem of split incentives is the use of
lsquosmart contractsrsquo (Michele Acciaro 2013) The idea is to change charter contracts in a way that risks
and benefits are shared among charterers and ship owners In such contracts speed choice is more
flexible and the chartering cost of vessels is closer to fuel cost as such ship owners get motivated to
invest in energy-efficient technologies and charterers get stimulated to run vessels in an energy
conserving manner
With respect to the shipbuilding industry the following could facilitate the transfer of technology as
well
Financial assistance to shipyards to be provided at the national level or through other
arrangements
Foreign direct investment in software and hardware as an innovative way to support industry
in implementing the requirements
One type of incentive that governments can provide to enhance industry performance and technology
adoption is a competition for top performers Governments could contribute to a fund from which
money is distributed to the top 10 of best performers in a particular year
Cost estimates
Workshops and training
Capacity building workshops for administrations are estimated at euro 1000 per attendee for an
online workshop (1-2 days) Costs for the organisation of such workshops would include expert fees
and administrative costs These costs could be lower if the course material is already developed
(model workshops) Eg 2 attendees per Flag State for the ten most important Flag States
TRANL15371 22
(covering 74 of total fleet tonnage) comes down to euro 20000 or less in case the courseware is
already existent
A situation that is more conductive to networking and experience sharing is to send people physically
to regional workshops The costs of such workshops including participants travel and hotels for 50
participants would be between euro20000 - euro100000 per workshop based on our international
experience with organising workshops in the field of renewable energy and energy efficiency Costs
could be lower depending on the amount of preparation required cost of location (could be sponsored
by participating states)
Technical training
Trainings already exist for calculating and verifying EEDI including development of tools to calculate
EEDI For example MARIN offers 32h courses over 5 days in the Netherlands for euro 5000 per attendee
(excluding travel and accommodation)29 Lloyds offers similar trainings for similar costs30
Model courses for training may need to be updated depending on identified needs Ecofys estimates
the update of eg an existing EEDI model courses to cost in the order of euro 50000
Online platform for inventory of energy efficiency technologies
Inventories of energy-efficiency technologies already exist (for example in reports like (IMO 2009) and
on websites of for instance DNV-GL the efficiency finder31) but they could be further developed since
the websites are either not independent or incomplete
In order to facilitate information exchange a web-based platform could be established The role of the
platform would be for example to provide verified information on real-world energy efficiency
improvements via a monitoring programme For example in order to stimulate the deployment of
energy efficient trucks the Dutch government provides a website to share audited knowledge and data
on about 15 energy efficiency technologies32 The costs of such a website and corresponding
programme are estimated to be around euro 2 million for a 4 year period Furthermore a platform can be
used to inspire others by showing best practices and can be used for sharing of information regarding
network opportunities like conferences and seminars
Capacity building project
Currently the IMO-GEF-UNDP GloBallast project is a capacity building project it assists developing
countries and their maritime industries in implementing international regulations on ballast water
29 httpwwwmarinnlwebEventsCoursesSpecialist-Course-on-Ship-propulsion-model-tests-and-SpeedPower-trials-for-EEDI-Verifiers-
2731-October-2014htm 30 httpwwwlloydslistcomllsectorship-operationsarticle422262ece 31 httpswwwdnvglcommaritimeenergy-efficiencyefficiency-finderhtml 32 httpwwwtruckvandetoekomstnl
TRANL15371 23
management and preventing risks arising from the transfer of harmful aquatic organisms And has
several aspects that could also be used for knowledge transfer of energy efficiency measures
web-site
e-learning course
databasesdirectories
library collections
newsletter
Regional Task Force (RTFs) to support development and adoption of a regional approach
Develop and implement communication education awareness raising and outreach
programme
Develop introductory and more specialised training packages
Develop model legislations
The total budget for the 2008-2012 period was US$23 million out of which US$564 million represents
a GEF grant the rest being mostly in-kind contributions from the participating countries regional co-
ordinating organisations (RCO) and strategic partners including the private sector
Improved access to information and information sharing with international recognised organisations
including relevant survey and certification training would further promote the different technologies
TRANL15371 24
Conclusions
This study provides an overview of existing technologies which could drastically improve the energy
efficiency of ships Furthermore barriers to transfer and uptake of energy efficient technologies are
analysed and categorised and implications of these barriers are listed in order to facilitate the uptake
of energy efficiency technologies for ships
From this research it is clear that conventional technology is available that can cost-effectively (with a
payback time of less than 15 years) achieve high efficiency gains If the maximum gains per category
are added up (for all but ferry and cruise) this would mean a total efficiency improvement of 35
Even without taking two experimental technologies with potentially high efficiency gains into account
(wind power and air lubrication)
High investments like wind power and contra rotating propellers bring the highest savings (13 ndash 20)
The medium investments are in-between (5-10) and the low investments only bring relatively small
energy efficiency improvements (lt5)
When the ship owner has too few opportunities to share investment with charterers this leads to a split
incentive a ship owner may invest the up-front capital to put in energy-efficient technology but not
receive the benefits This is typically a problem for investments with a high payback time ie the wind
power and contra rotating propellers
The main barriers are related to the transfer of technology to Flag States Flag States are generally
third world and developing nations that often do not have the resources to enforce investigate or
prosecute breaches by their flagged vessels
Several ways to overcome the knowledge transfer barriers were presented that can be categorised as
follows
Workshops and trainings
o Capacity building workshops for administrations
o Regional workshops
Technical training
o Training in calculating and verifying the EEDI
o Development of model courses
Online platform
o Inventory of energy-efficiency technologies
o Creation of a website with all relevant information for the target audience
o Improved access to information and information sharing
o Provide verified information on real-world energy efficiency improvements via a
monitoring programme
TRANL15371 25
The most expensive of the capacity building actions is the capacity building project which takes all
aspects above into account If a project would be developed for knowledge transfer regarding energy
efficiency measures similar to GloBallast which assists developing countries and their maritime
industries in implementing international regulations on ballast water management and preventing risks
arising from the transfer of harmful aquatic organisms the total budget needed would be in the order
of US$23 million for a period of 5 years
TRANL15371 26
References
JFE Group 2013 ldquoJapan Marine Unitedrdquo JFE Group Overview JFE Group AISBL 2012 Making Industry-University partnerships work lessons from succesful collaborations
report Belgium AISBL
Allenstroumlm Bjoumlrn 2013 ldquoWind propulsionrdquo SSPA Sweden AB Gothenburg EffShip March
Aqorau T 2000 Illegal Unreported and Unregulated Fishing Considerations for Developing
Countries paper Honiara Solomon Islands South Pacific Forum Fisheries Agency
BALance 2014 Competitive position and future opportunities of the Euroean Marine Supplies
industry BALance Technology Consulting
Barringhaus David and Robert Olds 1999 OLDS ENGINEERING Maximizing Propulsion Efficiency
Marine Division Accessed Februrar 2015
httpwwwoldscomaumarinemaximizing_propulsion_efficiency
Becker Marine System not dated Becker Bulb Rudders httpwwwbecker-marine-
systemscom05_downloadszzpdfproduct_pdfBecker_Bulb_Rudderspdf Becker Marine
System
mdash 2015 Twisted Full Spade Rudder Accessed Feb 2015 httpbecker-marine-
systemscom03_productsproducts_twisted_full_spadehtml
Bloomberg 2014 China Loses Shipbuilding Crown to South Korea Chart of the Day 9th December
httpwwwbusinessweekcomnews2014-12-09china-loses-shipbuilding-crown-to-south-
korea-chart-of-the-day
Bluebird-Electric 2014 Sipbuilding post World War Two httpwwwbluebird-
electricnetship_boat_design_buildingshipbuilders_ship_repairers_associationhtm
Boat design 2007 Accessed Feb 2015
httpwwwboatdesignnetforumsattachmentspropulsion16743d1193341389-new-
propulsion-sytems-ships-grim-prop-1jpg
Brannigan Paschos Eyers and Wood 2009 Report on International avialtion and Mritime Emissions
in a Copenhagen (post 2012) Agreement Oxfordshire AEA Group
Chen Benjamin Arthur Reed and Ki-Han Kim 1989 A Vane-Wheel Propulsor for a Research and
Development Report Newport David Taylor Research Center
CNSS 2015 Clean North Sea Shipping - Clean Shipping Technology Accessed Februar 2015
httpcleantechcnssnoghg-technologiestechnical-measuresmeasures-related-to-the-hull
Crist Philippe 2009 Greenhouse gas emissions reduction potential from international shipping
Working paper OECD
Daily Times 2015 Nigeria Turkey seek collaboration on ships shipyards 5th January
httpwwwdailytimescomngarticlenigeria-turkey-seek-collaboration-ships-shipyards
Dillingham Gerald L 2000 Progress Made to Reduce Marine Pollution by Cruise Ships but Important
Issues Remain GAO report Washington United States General Accounting Office
DK Group 2015 Silverstream technologies January Accessed January 2015 httpdkgroupeu
DNV 2014 Encouraging Construction and Operation of Green Ships OECD
httpwwwoecdorgstiindC-WP6(2013)12-FINAL-ENGpdf
TRANL15371 27
DNV GL 2015 EFFICIENCY FINDER Accessed Feb 2015 httpwwwdnvglcommaritimeenhance-
performanceefficiency-finderaspx
Ecorys 2012 ldquoGreen growth opportunities in the EU shipbuilding sectorrdquo
ECOSPEED 2015 EUROPEAN MARINE amp MACHINERY AGENCIES LTD Accessed February 2015
httpwwweuropeanmarinecoukECOSPEEDhtm
gcaptain 2012 gcaptain - Propeller Technology to Make Your Ship More Efficient - Accessed Feb
2015 httpgcaptaincompropeller-technology-ship-efficient
Hansen Dinham-Peren and Nojiri 2011 Model and Full Scale Evaluation of a lsquoPropeller Boss Cap
FinsrsquoDevice Fitted to an Aframax Tanker Second International Symposium on Marine
Propulsors smprsquo11 Hamburg Germany June 2011
Hellenic Shipping News 2014 Korean ships sell at fuel-saving premium 22nd December
httpwwwhellenicshippingnewscomkorean-ships-sell-at-fuel-saving-premium
Hindawi 2015 Hindawi Puplishing Cooperation Accessed February 2015
httpwwwhindawicomjournalsijrm2012474785fig4
Hochkirch Karsten and Volker Bertram not dated ldquoSlow Steaming Bulbous Bow Optimization for a
Large Containershiprdquo Accessed Februar 2015 http2021148960resourcepdf5096pdf
Hollenbach Uwe and Juumlrgen Friesch not dated Efficient hull forms ndash What can be gained
Conference ship-efficiency Hamburg 2013 Hamburg HSVA Hamburgische Schiffbau-
Versuchsanstalt GmbH HamburgGermany
ICCT 2011 Reduce Greenhouse Gas Emissions from Ships - Cost Effectiveness of Available options -
white paper Washington DC International Council on Clean transportation (ICCT)
IMO 2011 REDUCTION OF GHG EMISSIONS FROM SHIPS Marginal Abatement Costs and Cost
Effectiveness of Energy-Efficiency Measures Submitted by the Institute of Marine Engineering
Science and Technology (IMarEST) MEPC 62INF7 International Maritime Organisation
IMO 2009 Second IMO GHG Study 2009 London International Maritime Organisation
JSEA 2006 ldquoImproved propulsive performance - Universal applies new energy-saving type Leadge
Bowrdquo Japan Ship Exports Association (JSEA) httpwwwjseaorjpVariableJSea318pdf
Kawasaki 2015 Energy-saving Technology Accessed Feb 2015
httpswwwkhicojpenglishshiptechconservationindexhtml
Leddy Fiona Jayne 2012 ldquoA critical legal analysis of International Shipping in Australian Waters and
the risk of ship-based oil pollutionrdquo Queensland Environmental Practice Reporter vol 17
Marinelog 2014 China white lists 51 shipyards 4 September
httpwwwmarinelogcomindexphpoption=com_k2ampview=itemampid=7667china-white-
lists-51-shipyardsampItemid=231
Metselaar Kees interview by Arno van den Bos 2015 Policy officer at directorate maritime affairs of
ministry of Intrastructure and Environment (February)
Michele Acciaro Peter Nyegaard Hoffmann Magnus Strandmyr Eide 2013 ldquoThe Energy Efficiency
Gap in the Maritime Transportrdquo Journal of Shipping and Ocean Engineering 1-9
MIWB 2015 Maritiem Instituut Willem Barentsz Accessed Feb 2015
httpsmijnmiwbnlnieuwsbriefindexphpdo=showampid_artikel=116
MOL 2011 Energy-Saving Propeller Boss Cap Fins System Reaches Major Milestone - Orders
Received for 2000 Vessels Accessed Feb 2015
httpwwwmolcojpenpr20111145html
TRANL15371 28
Motorship 2014 Gas fuelled ships into the future 31 10 httpwwwmotorshipcomnews101ships-
and-shipyardsgas-fuelled-ships-into-the-future
Nakashima 2015 Nakashima propeller CO LTD Accessed Feb 2015
httpwwwnakashimacojpengproductrudderhtml
Nielsen Shin Lundgren and Faghani not dated Combined Kappel propeller and rudder bulb system
for improved propulsion efficiency Frederikshavn MAN Diesel amp Turbo
OECD 2014 The OECD Council Working Party on Shipbuilding
httpwwwoecdorgindustryindshipbuildinghtm
OECD 2011 ldquoThe Shipbuilding Industry in Turkeyrdquo
office of technology assessment 1983 An Assessment of Maritime Technology and Trade report
Washington DC US Congress
Pakarinen Risto 2007 ldquoNothing common about common railrdquo Twentyfour7 (Twentyfour7) 64-65
Ports amp Ships 2015 Ports and Ships Accessed February 2015
httpportscozanewsarticle_2007_10_17_4038html
Rolls-Royce 2014 Propulsors - Moving your business in the right direction httpwwwrolls-
roycecom~mediaFilesRRolls-Roycedocumentscustomersmarinepropulsion-2014-
tcm92-8664pdf Aalesund Rolls-Royce Commercial Marine httpwwwrolls-
roycecom~mediaFilesRRolls-Roycedocumentscustomersmarinepromaspdf
Schneekluth H and V Bertram 1998 Ship Design for Efficiency and Economy Oxford
Butterworth-Heinemann
Schulze Reinhard 2007 Twisted Rudder - Extreme Design 14 SVA-Forum bdquo Ruder in Theorie und
Praxisldquo Potsdam 7 November 2007 Potsdam Schiffbau-Versuchsanstalt Potsdam GmbH
Selenetrawlers 2015 Selenetrawlers Accessed February 2015
httpwwwselenetrawlerscomcompanydesign-notes
Sepideh Jafarzadeh Ingrid Bouwer Utne 2014 ldquoA framework to bridge the energy efficiency gap in
shippinrdquo Energy 603-612
SetSail 2009 SetSail Accessed February 2015 httpwwwsetsailcomprop-nozzle-comments-by-
an-expert
Shuto Hideki 2010 Super Eco Inland Vessels httpwwwccr-
zkrorgtempwrshp120411Presentations2_04_HShuto_enpdf IHI Marine United Inc
Silberschmidt Noah 2014 ldquoGenerating efficiencies from thin airrdquo SMM Green shipping | Efficiency
httpwwwsilverstream-techcomwp-contentuploads201404HANSA-241112pdf
httpwwwsilverstream-techcomwp-contentuploads201404HANSA-241112pdf
Skinner Ian 2009 EU Tranport GHG Routes to 2050 Technical options for maritime and inland
shipping httpwwweutransportghg2050eucmsassetsTechnical-options-maritime-inland-
waterpdf Brussel European Commission
Statista 2015 ldquoLargest shipbuilding nations in 2013 based on completions in gross tonnagerdquo
httpwwwstatistacomstatistics263895shipbuilding-nations-worldwide-by-cgt
UK DfT 2014 ldquoDfT Port Statistics - World fleet registered trading vessels of 100 gross tons and over
gross tonnage on selected registers 1999-2013rdquo
httpswwwgovukgovernmentcollectionsmaritime-and-shipping-statisticsdata-tables-
associated-with-this-series
TRANL15371 29
Voorham 2013 Assessment of sustainable investment in shipping Master Thesis
Report SDPO13029m Delft 27 th November 2013 Delft Delft University of Technology
WAumlRTSILAuml 2009 ldquoEnergy Evironment Economyrdquo Helsinki Finland WAumlRTSILAuml
mdash 2007 ldquoWaste heat recoveryrdquo Waumlrtsilauml Corporation
Wettstein and Brown 2008 Derating a solution for high fuel savings and lower emissions
Winterthur Waumlrtsilauml Switzerland Ltd
Wind Chellenger Project HP 2015 Wind Chellenger Project HP Accessed Feb 2015 httpwindku-
tokyoacjpindex_enhtml
TRANL15371 30
Appendix I - World fleet registered trading vessels
Table 3 World fleet registered trading vessels of 100 gross tons and over 2009-2013 Source UK DfT 2014
Flag Country 2009 2010 2011 2012 2013
(World Total) 8448 9130 9831 10343 10725
Panama 1886 1979 2084 2158 2172
(European Union) 1900 1979 2074 2051 2106
Liberia 908 1037 1167 1238 1241
Marshall Islands 475 590 711 811 900
Hong Kong 449 553 678 785 854
Singapore 398 434 512 592 677
Malta 348 380 438 450 496
Bahamas 452 469 481 483 485
Greece 388 407 411 411 415
China 282 327 356 388 411
United Kingdom (inc IOM and CI) 258 273 294 300 288
Cyprus 201 205 207 197 203
Japan 138 156 167 178 192
Italy 150 169 181 180 176
Norway 152 145 143 144 145
Germany 152 155 153 137 123
Denmark 107 115 113 113 122
Korea South 120 124 116 111 112
Indonesia 69 82 91 101 111
Bermuda 94 100 106 109 105
Antigua amp Barbuda 100 107 111 106 100
United States of America 107 108 102 99 97
India 83 83 89 85 82
Netherlands 76 61 67 66 69
Turkey 54 58 62 64 59
Malaysia 69 72 71 62 57
France 63 63 64 56 53
Russia 47 49 49 51 52
Philippines 50 51 50 43 43
Cayman Islands 27 29 32 32 31
Taiwan 25 26 27 30 31
Iran 09 08 05 21 31
Thailand 25 26 22 26 29
Sweden 39 35 33 28 27
St Vincent amp the Grenadines 47 42 37 28 24
Canada 24 24 25 24 23
Spain 22 25 26 25 23
Kuwait 23 19 24 24 22
Brazil 20 20 19 19 20
Cambodia 18 17 13 13 12
TRANL15371 31
Appendix II - Most important shipbuilding
countries
China
China is an emerging shipbuilder that overtook South Korea during the 2008-2010 global financial crisis
as they won new orders for medium and small-sized container ships (Bloomberg 2014 Bluebird-Electric
2014)
Figure 14 delivery of vessels from Chinese and South Korean shipyards in million compensated gross tons a measure
of building time and human resources used per ton Source (Bloomberg 2014)
China has more than 1600 shipyards Analysts have predicted that about one third of them will fold
as the industry struggles with overcapacity Last year China laid out a three year plan for industry
restructuring that urged yards to concentrate on building higher quality vessels and local governments
to halt approvals for new projects (Bluebird-Electric 2014)
After two decades of a loan-fuelled boom Chinarsquos shipbuilding industry has become saddled with debt
and overcapacity prompting some private firms to seek financial assistance from the state In
September the government issued a list of 51 shipbuilders it deemed worthy of public support
(Marinelog 2014)
TRANL15371 32
New additions to the white list include subsidiaries of the China State Shipbuilding Corporation (CSSC)
and the China Shipbuilding Industry Corporation (CSIC) and the AVIC Weihai Shipyard owned by the
Aviation Industry Corporation of China (AVIC) (Marinelog 2014)
South Korea
By the end of 2014 it seemed South Korea has overtaken China again as the worlds largest
shipbuilding country with a global market share of about 30(see Figure 14) (Bloomberg 2014)
(Bluebird-Electric 2014) South Korea leads in the production of large vessels such as cruise liners
super tankers LNG carriers drill ships and large container ships
South Koreas shipyards are highly efficient with the worlds largest shipyard in Ulsan operated by
Hyundai Heavy Industries slipping a newly built $80 million vessel into the water every four working
days South Koreas big three shipbuilders Hyundai Heavy Industries Samsung Heavy Industries
and Daewoo Shipbuilding amp Marine Engineering dominate global shipbuilding with STX Shipbuilding
Hyundai Samho Heavy Industries Hanjin Heavy Industries and Sungdong Shipbuilding amp Marine
Engineering also ranking among the top ten shipbuilders in the world In 2007 STX Shipbuilding further
strengthened South Koreas leading position in the industry by acquiring Aker Yards the largest
shipbuilding group in Europe (The former Aker Yards was renamed STX Europe in 2008) In the first
half of 2011 South Korean shipbuilders won new orders to build 25 LNG carriers out of the total 29
orders placed worldwide during the period
To maintain their market position Korean yards also focus more and more on greening opportunities
The Korean government introduced a GHG emission reducing program in 2008 The program is aiming
at reducing GHG emissions throughout all economic sectors including the shipping and shipbuilding
industry Also the Japanese Shipbuilding Association (SAJ) is looking into the possibilities to reduce
GHG emissions so that the shipbuilding industry becomes greener and more competitive (Ecorys
2012)
Japan
Japan had been the dominant ship building country from the 1960s through to the end of 1990s but
gradually lost its competitive advantage to the emerging industry in South Korea which had the
advantages of much cheaper wages strong government backing and a cheaper currency South Korean
production overtook Japans in 2003 and Japanese market share has since fallen sharply
The Philippines
The Philippines has placed fourth among shipbuilding nations around the world producing more than
six million deadweight tonnes of ships built in 2012 The country is anchored by South Korean Hanjin
and Japans Tsuneishi shipbuilders The country has shipyards in Subic and Cebu
TRANL15371 33
Europe
For several decades European shipyards have been facing strong global competition from especially
Asian enterprises (Japanese yards in the 1950s and 60s Koreans from the 1970s and 80s and Chinese
since the 1990s) In Europe this has led to an almost complete exit from the mass production segments
of tankers bulkers and containerships Response of the EU industry has been to focus on the higher
value more complex ship types such as ferries and passenger ships non-cargo vessels and general
cargo ships In addition only limited numbers of vessels of the same type are being built (in contrast
with bulk vessels which are mass produced) Europe has a 77 percent market share in building
passenger vessels (including both cruise ships as well as ferries) and a 17 percent share in the
construction of non-cargo vessels (Ecorys 2012) These segments make up a relatively small share of
the world orderbook (in CGT) However in value they represent a much higher share due to their
relatively sophisticated characteristics The position of the European shipbuilding industry in the
manufacturing of specialised innovative vessels is still strong At the same time European equipment
manufacturers have acquired a leading role in quality products especially in complex high value
equipment components
Figure 15 World orderbook and CESA orderbook by ship type in 2010 (CGT x 1000) (Source Ecorys 2012)
Regarding the marine equipment sector the European industry is renowned for propulsion cargo
handling communication automation environmental and security systems This equipment is not only
destined for complex European-built ships but also exported to Asian yards whether or not requested
by their clients (Ecorys 2012)
Compared to the ship construction sector the marine equipment segment is highly heterogeneous and
consists of companies that are often also active in other business areas (ie automotive or aircraft
industry) A study by (BALance 2014) found that the European marine equipment industryrsquos
TRANL15371 34
competitiveness lies in a strong market position and technological leadership at least for globally active
European marine supply companies who build their position on a strong infrastructure and co-operative
partners skill of their employees and close relationship with their customer base Conversely identified
weaknesses are the cost level in Europe and the heterogeneous structure of the industry with many
SMEs which hinder in some cases attempts to follow the markets by globalisation strategies
Turkey
Shipbuilding in Turkey has evolved from an old traditional activity in Anatolia to an internationally
recognised industry especially since the early 1990s The industry has modern shipyards that can build
ships yachts mega-yachts and sailing boats as well as carrying out extensive repair and conversion
works Turkeyrsquos shipyards are mainly located in the Marmara Region namely Tuzla Yalova and İzmit
which have developed into dynamic shipbuilding centres Also in recent years the emerging Black Sea
and Mediterranean Regions have increasingly attracted shipyard investments
In the last decade in parallel with developments in the global market Turkish shipbuilding experienced
a several-fold increase in its shipbuilding and export capacity including a significant product
diversification According to order books this resulted in Turkey being regularly placed in the top ten
countries on the basis of its deadweight (dwt) production and in the top five countries by the number
of ships
In recent years Turkey has increasingly tapped into niche markets which in turn has led to a growing
participation by Turkish shipyards in the international trade in new ships In parallel there has also
been strong growth in the marine equipment manufacturing sector which could increasingly also tap
the export market These developments reflect in part the strategic location of the yards the
experienced workforce the quality of production and Turkeyrsquos significant role as a political cultural and
economic bridge between Europe and Central Asian and Middle Eastern economies (OECD 2011)
ECOFYS Netherlands BV | Kanaalweg 15G | 3526 KL Utrecht| T +31 (0)30 662-3300 | F +31 (0)30 662-3301 | E infoecofyscom | I wwwecofyscom
ECOFYS Netherlands BV
Kanaalweg 15G
3526 KL Utrecht
T +31 (0) 30 662-3300
F +31 (0) 30 662-3301
E infoecofyscom
I wwwecofyscom
HOW TO OBTAIN EU PUBLICATIONS
Free publications
bull one copy
via EU Bookshop (httpbookshopeuropaeu)
bull more than one copy or postersmaps
from the European Unionrsquos representations (httpeceuropaeurepresent_enhtm)
from the delegations in non-EU countries
(httpeeaseuropaeudelegationsindex_enhtm)
by contacting the Europe Direct service (httpeuropaeueuropedirectindex_enhtm)
or calling 00 800 6 7 8 9 10 11 (freephone number from anywhere in the EU) () () The information given is free as are most calls (though some operators phone boxes or hotels may charge you)
Priced publications
bull via EU Bookshop (httpbookshopeuropaeu)
Priced subscriptions
bull via one of the sales agents of the Publications Office of the European Union
(httppublicationseuropaeuothersagentsindex_enhtm)
doi 102834880780
ML-0
1-1
5-4
39-E
N-N
[Ca
talo
gu
e n
um
be
r]

TRANL15371 8
SEEMP port state control is limited to verifying when appropriate that there is a valid International
Energy Efficiency Certificate on board
We therefore conclude that there needs to be a focus on enabling Flag States and Port States that lack
the resourcescapacity to enforce the EEDI and the SEEMP in order to further stimulate the adoption
of energy efficiency technologies Also attention should be paid to overcoming the barrier of split
incentives ie where the benefits of energy efficiency measures are not transferred from the charterer
to the investor (owner)
TRANL15371 9
3 Energy Efficiency Measures for Ships
In order to understand the important energy efficiency measures that can help improve energy
efficiency from shipping it is interesting to see the split between new-built ships and existing fleet In
2012 some 3655 merchant ships were delivered worldwide about 6 of the worldrsquos merchant fleet
of about 60000 The average age of the merchant fleet is 19 years Therefore measures for both new
ships and retrofits for old ships are important for improving the energy efficiency in the next decades
If only the new ships would be targeted only 50 of the fleet would be more efficient in the next
decades while there are many retrofit measures available The total fleet can be broken down to about
4000 passenger ships just under 14000 tankers and about 37000 dry cargo ships including about
5000 container ships (Statista 2015)
In order to identify the most interesting energy efficiency measures for ships we used the information
from several reports to develop a long-list Many measures improve the efficiency in the order of up to
5 Here we would like to focus on measures that result in high savings that can be applied to many
ship types and preferably also to existing ships The resulting short-list is presented in the next table
We used the main categories identified by AHEWG-TT for structuring the measures
The main categories defined by AHEWG-TT are
1 Hull
2 Main Engine
3 Auxiliary engines
4 Propellers and rudders and
5 Control systems
Since the auxiliary engines typically consume only a fraction of the energy that goes to the main
engines their energy efficiency measure results do not show in the short-list below The measures are
worked out in more detail in the paragraphs below The main engine and auxiliary engine improvements
are covered in the same paragraph
The common rail upgrade is a simple measure that can be easily applied to all ships even when the
ship is not in the dry-dock The details are available in the paragraph about engines
From the list it is clear that conventional technology is available to achieve high efficiency gains If the
maximum gain per category is added up (for all but ferry and cruise) this would mean a total efficiency
improvement of 35 even without taking two experimental technologies with potentially high efficiency
gains into account (wind power and air lubrication) Note that some technologies are not applicable to
all ships
In order to find possible financial barriers the investments are rated from ldquovery lowrdquo to ldquohighrdquo relatively
to the size of the ships The same measure on a larger ship is obviously more expensive
TRANL15371 1
Table 1 Inventoryranking of energy efficiency measures
Main category
Measure Estimated efficiency (range)
Efficiency at average circumstances
Ease of installation
Payback time
Investment Implementation References
Hull Bow optimisation
25-20 10 all ship types
short (lt3 years)
Medium conventional technology
(IMO 2009 IMO 2011 Crist 2009 Hochkirch und Bertram not dated)
Main Engines
Wind power 5-44 20 only special ship types
long (gt15 years)
High experimental technology
(IMO 2011 IMO 2009 Crist 2009 ICCT 2011 Brannigan et al 2009 Allenstroumlm 2013)
Propellers and Rudders
Ducted propeller
1-20 10
all ship types except ferry and cruises
medium (4-15 years)
Medium conventional technology
(IMO 2011 IMO 2009 Crist 2009 ICCT 2011)
Propellers and Rudders
Contra-rotating propellers
6-20 13 only special ship types
long (gt15 years)
High conventional technology
(IMO 2011 IMO 2009 Crist 2009 WAumlRTSILAuml 2009 Shuto 2010)
Propellers and Rudders
Wheels 10 10
all ship types except ferry and cruises
short (lt3 years)
Medium conventional technology
(IMO 2009 Schneekluth und Bertram 1998 Brannigan et al 2009)
Control Systems
Waste heat recovery
6-10 8 new build only
medium (4-15 years)
Medium conventional technology
(IMO 2011 IMO 2009 Crist 2009 WAumlRTSILAuml 2007 ICCT 2011)
Propellers and Rudders
Rudder bulb 2-5 4
all ship types except ferry and cruises
medium (4-15 years)
Low conventional technology
(IMO 2011 IMO 2009 Nielsen et al not dated Crist 2009 ICCT 2011)
Propellers and Rudders
Post swirl fins
2-5 4
all ship types except ferry and cruises
short (lt3 years)
Low conventional technology
(IMO 2009 MOL 2011 Hansen Dinham-
Peren und Nojiri 2011 Nielsen et al not
dated)
Hull Hull coating 1-9 5 all ship types
short (lt3 years)
Low conventional technology
(IMO 2011 IMO 2009 ICCT 2011 Voorham 2013 Crist 2009)
Hull Air lubrication
5-15 9 new build only
medium (4-15 years)
Medium experimental technology
(IMO 2011 IMO 2009 Crist 2009 DK Group 2015 CNSS 2015 ICCT 2011)
Propellers and Rudders
Twisted rudder
2-4 3
all ship types except ferry and cruises
medium (4-15 years)
Low conventional technology
(IMO 2009 Schulze 2007 Nakashima 2015 Becker Marine System 2015 Nielsen et al not dated Hollenbach und Friesch not dated Rolls-Royce 2014)
Main Engines
Main engine de-rating
2-4 3
all ship types except ferry and cruises
medium (4-15 years)
Low conventional technology
(IMO 2011 IMO 2009 Crist 2009 Wettstein und Brown 2008 DNV GL 2015)
Auxiliary engines
Common rail upgrade
- - all ship types
medium (4-15 years)
Very Low conventional technology
(DNV GL 2015) (ICCT 2011) (IMO 2009)
Main Engines
Common rail upgrade
01-05-
03 all ship types
medium (4-15 years)
Very low conventional technology
(IMO 2009 Pakarinen 2007 ICCT 2011 Crist 2009)
TRANL15371 2
Hull and superstructure
In general the optimisation of hull and superstructure focuses on minimising the resistance by reducing
the wave resistance and friction between water and hull It is important to recognise which type of
vessel is to be optimised The reduced frictional resistance increases energy performance of the vessel
particularly at low speeds Operability and performances of the ship must be considered in detail The
improvements measures are generally applied at new-built ships but also applicable to retrofitting
Bow optimisation
The different bow optimisations can improve the water flow around the hull and reduce the wave-added
resistance for large vessels with high block coefficient operating within commercial speed ranges The
average energy reduction potential ranges from 25-20 on average 10 (Crist 2009 IMO 2011
Voorham 2013)
Figure 3 Left The green line characterises the ordinary bow wave of the hull The blue line characterises the wave
formed by the bulb The red line is the sum of these two The altitude of the bow wave is noticeably reduced which
reduces the hull drag associated with the bow wave This improves fuel economy and increases range (Selenetrawlers
2015) Right Ordinary bulbous bow leadge bow and ax-bow shape (JSEA 2006)
The below-the-waterline extension of the bulbous bow (Figure 3) modifies the way the water flows
around the hull reducing drag and thus increasing speed range fuel efficiency and stability An altered
design is the ax-bow (Figure 3) The narrow designed bow slashes through the water in order to reduce
slamming and reduces the size of bow generated wave The propeller can act more efficient due to the
absence of slamming The ax-bow allows the ship to steer well to maintain speed and the engine to
save fuel (Crist 2009 IMO 2009) If the bulbous bow is modified during a regular docking period the
investment is estimated to have short payback of about 1-3 years It is most promising for container
vessels (DNV GL 2015 Hochkirch und Bertram not dated)
Barriers The bow optimisation (as retrofit) needs to be done in the dry dock Dry-docking is not
regularly happening for existing ships because it means that the ship cannot operate and economic
losses are suspected Another obstacle might arise due to restricted access to the original contractual
hull plans since shipyards are not always keen to provide detailed plans on their vessels to prevent
TRANL15371 3
imitation (Hochkirch und Bertram not dated DNV GL 2015) A major obstacle is the split incentive
between ship owner and operator Ship owners are responsible for investing in these technologies and
ship operators are those who pay for the fuel consumption and benefit from such technologies (ICCT
2011)
Technical maturity The technique is available on the market and is effective Only conventional
material is needed and redesign can be done in a few weeks16
Applicability Applicable to all ship types but most efficient for ships with a high block coefficient like
tankers and bulk carriers since the reduction of the wave-added resistance is most impacting (IMO
2009)
Hull coating
Hull coatings (Figure 4) can lower frictional resistance and limit fouling by aquatic organisms It can
save between 1-9 fuel consumption on average 5 (ICCT 2011 Voorham 2013 Crist 2009)
Figure 4 Example of hull coating (ECOSPEED 2015)
One way of lowering the frictional resistance is to improve the smoothness of a hull by means of
coatings that reduce fouling The costs are lifetime cost reduction and have to be recur every five years
to be able to gain the fuel benefit
Barriers A new application is typically necessary during each dry-docking The self-polishing coating
must be renewed after a 3-5 years period (IMO 2009) A major obstacle is the divided interest between
ship owner and operator Ship owners are in charge for investing in these technologies and ship
operators are those who pay for the fuel consumption and profit from such technologies (ICCT 2011)
Technical maturity Coating techniques are available on the market and roughly 5 of newly painted
ships are painted with one of the advanced coating systems presently available (IMO 2011 ICCT 2011)
The payback time is short (ICCT 2011) or 0-2 years according to others17
Applicability The technology is applicable to all vessels
Air lubrication
The air lubrication technique creates a layer of bubbles underneath an already streamlined hull in order
to further reduce friction An automation system regulates the compressorsblowers depending on
16 httpwwwship-efficiencyorgonTEAMpdf14-Ship20efficiency20seminar20-20CMA20CGM-
20HydrOcean20120CMA20pdf 17 httpswwwdnvglcommaritimeenergy-efficiencyefficiency-finderhtml
TRANL15371 4
speed The blower keeps holes filled with air and required pressure A thin layer of bubbles trailing
behind of each cavity merge into single large ldquoair layerrdquo for the whole flat bottom part of the hull and
reduces the friction (Figure 5) Depending on the ship type the estimate fuel efficiency ranges between
5-15 (on average 9) where tankers and bulkers can reduce more (10-15 on average 125) in
comparison to container vessels (5-9 on average 7) (IMO 2009 DK Group 2015 CNSS 2015 ICCT
2011 Voorham 2013)18
Figure 5 Schematic view of air lubrication (DK Group 2015)
Barriers Large capital investment requirements with split incentive The vessel owners are
accountable for investing in these technologies whereas vessel operators recompense for the fuel
consumption and benefit from such technologies (ICCT 2011)
Technical maturity The technology is available on the market but still in a pilot phase Sea trials
have been performed with small demonstration ships There are no vessels operating commercially
that currently use this technique Specifications about the payback time vary from short to medium
(Silberschmidt 2014 Skinner 2009)
Applicability The original technology would be likely be applied to new-built ships with at least a
partly flat bottom and a minimum length of 225 metres since the compressor may have technical
problems maintaining air cavities for deep draft ships (IMO 2011 CNSS 2015) Air lubrication can be
used for retrofitting as well (CNSS 2015)
Engines
Speed reductions on existing vessels provide opportunities for engine optimisation on low power
(321) Similar measures as de-rating for the main engines that could be implemented are cylinder
cut-out and new torsional vibration calculation (IMO 2009)
18 It has to be noted that the extra fuel use caused by the system itself should also be taken into account
TRANL15371 5
Another propulsion supportive measure with a high potential measure is wind power This is also
explained in more detail below In order to also provide a measure with a lower improvement potential
per ship but simple and applicable to all ships we describe the common rail system for fuel injection
Main engine de-rating
Slow steaming vessels are known as one of the most effective energy saving measure The potential
comes mainly from the operational behaviour side From the technical side the specific fuel oil
consumption will decline when a ship is no longer operated at its design speed
The design speed can be reduced by de-rating the main engine (IMO 2011 IMO 2009) Reduction of
power combined with injection timing advanced to restore peak combustion pressure can achieve a
certain gain in shaft efficiency Fuel efficiency can be improved by 2-4 when de-rating is performed
for loads lower than the maximum design load (Wettstein und Brown 2008 Crist 2009) on average
3 energy efficiency potential (Crist 2009) Operational costs would be lower mainly due to fuel
savings (DNV GL 2015 Crist 2009 Wettstein und Brown 2008)
Barriers A slower vessel will have lower incomes as it is not capable to perform as much transport
load per unit of time as a faster vessel De-rating the engine is usually done when it is clear that the
ship will become a slower steaming ship There is a split incentive between vessel owners who are
responsible for investing in these technologies and vessel operators who are those who compensate
for the fuel consumption and benefit from such technologies (ICCT 2011)
Technical maturity This technique has been proven as successful particularly on older engines
which are normally built with a low compression ratio and thereby have a significant potential to
improve their efficiency (IMO 2009) De-rating measures have a low to medium payback time (Crist
2009 DNV GL 2015)
Applicability The technologies are available on the market It is applicable to all vessels (DNV GL
2015)
Common-rail upgrade (common-rail fuel injection)
Engines with common-rail fuel injection handle low-load working modes much better (IMO 2009) A
common-rail fuel injection is technique of injecting fuel into an engine cylinder under total control and
thereby achieving optimal combustion Common-rail allows the start and duration of injection
independent of the position of the pistons in that way permitting an operationally optimised injection
per stroke In a normal diesel engine fuel is injected at a static rate by a pump and common practice
is to optimise this pump to run at an optimal setting for the ideal injection time (Pakarinen 2007) The
energy efficiency potential is estimated between 01-05 on average 03 (ICCT 2011 IMO 2009)
Barriers Additional electronics can also introduce possibilities for failures However recent
advancements have increased the systems popularity19 There is a split incentive between vessel
19 httpwwwmarineinsightcommarinean-overview-of-common-rail-system-in-marine-engines
TRANL15371 6
owners who are responsible for investing in these technologies and vessel operators who are those
who compensate for the fuel consumption and benefit from such technologies (ICCT 2011)
Technical maturity This measure is available on the market (ICCT 2011) Payback time is short to
medium with an average of 5 years (IMO 2009 Crist 2009)
Applicability This measure is applicable to new and retrofit vessels It is applicable for tanker- bulk-
container- and Roro-ships (Crist 2009)
Auxiliary engines and systems
Based on our own estimation auxiliary engines improvement are not bringing gt2-4 energy savings
because auxiliary engines consume much less fuel than the main engine Similar measures as de-rating
for the main engines and common rail upgrade could be implemented for the auxiliary engine
Other options for improving auxiliary systems are speed control of pumps and fans control strategies
of cooling water systems room ventilation redesign of piping and instruments advanced computation
of airgas temperature distribution with reduced storage ventilation and with optimised ventilation
systems (DNV GL 2015)
Barriers There is a split incentive between vessel owners who are responsible for investing in these
technologies and vessel operators who are those who compensate for the fuel consumption and benefit
from such technologies (ICCT 2011)
Technical maturity This measure is available on the market (ICCT 2011) It is easy to apply and
uncomplicated in maintenance (DNV GL 2015) Payback time is short (DNV GL 2015)
Applicability This measure is applicable to all new and retrofit types of ships (DNV GL 2015)
Wind power
Wind power measures are available that can develop enough thrust to provide at least some supportive
propulsion Wind power can be utilised in various ways in shipping like traditional sails solid wing sails
Flettner-rotor and kits (see Figure 6) The techniques are currently used as supplementary power
(Brannigan et al 2009)
Figure 6 from left to right Kite (Cargill 2011) Flettner rotor (MIWB 2015) and solid sails (Wind Chellenger Project
HP 2015)
Solid wing sails are structured similar to aircraft wings which offer more thrust with less drag than
conventional sails Flettner rotors produce thrust from a rotating object in wind using the so-called
TRANL15371 7
Magnus effect The techniques have different characteristics with regards to how the thrust that is
produced relates to other factors such as wind strength wind angle wind stability and ship speed
(IMO 2009)
Towing kites vary from other concepts of wind power by having a small footprint during installation and
therefore being quite feasible to retrofit (Allenstroumlm 2013) Studies conducted at the Technical
University of Berlin indicated that the potential for sail energy has different prospective in the different
regions in the world Best scenarios exist in North Atlantic and North Pacific regions the South Pacific
seems a bit less potential The studies have shown that under normal circumstances the typical savings
using wind power may be 5 at 15 knots and up to 20 at 10 knots This study also revealed that
with optimal weather routing in the North Atlantic and given the best vessel with best sail type savings
can reach 15 percent at 15 knots and 44 at 10 knots (IMO 2009 Crist 2009) Nevertheless the
above figures should be considered indicative since practical experiences are limited Sail- and kite-
assisted power does seem to be a potential opportunity saving energy in the medium- and long-term
picture for shipping (IMO 2009) Christ estimates and average energy saving potential around 20
(2009)
Barriers There is a split incentive between vessel owners who are responsible for investing in these
technologies and vessel operators who are those who compensate for the fuel consumption and benefit
from such technologies (ICCT 2011) Although this technology can bring high energy savings the
investment is so high that there is not a short payback time
For solid wing sails complications could result in a need for masts to run down to the keel which can
be a bigger issue for retrofitting Additionally the presence of the mast and rigging could have significant
impacts on cargo handling (IMO 2009) Downside of the kite systems include the complex launch
recovery and control systems that are needed (IMO 2009)
Technical maturity This is still considered as experimental technology The technical barriers
identified above need to be tackled for this measure to be applied widely in the future Payback time is
estimated to be medium to long term (Allenstroumlm 2013 Crist 2009)
Applicability Wind power technologies are available and a number of cargo ships have been equipped
with wind engines to reduce demands from diesel engines (ICCT 2011) Kites can be used on ships
with a minimum length of 30m and works most energy efficient on ships with a typical speed not faster
than 16 knots Preferably tankers (crude oil product chemical LPG LNG other) and bulk carriers are
being considered as potential users due to this speed restriction (IMO 2011)
Control Systems Waste heat recovery
Waste heat recovery (WHR) technology can pass exhaust gases from a vessels engines through a heat
exchanger to generate steam for a turbine-driven generator The heat energy from the exhaust gas is
taken and transformed into electrical energy to reduce direct engine-fuel consumption for the
propulsion system or reduce auxiliary engine needs (ICCT 2011) Energy saving potential is estimated
between 6-10 on average 8 (Crist 2009 ICCT 2011)
TRANL15371 8
Figure 7 Efficiency of waste heat recover systems Sankey diagramme Even with high 50 efficiency of modern low-
speed engines there is still 50 of fuel input energy not being put to productive use The possibilities are illustrated
by this comparison of Sankey diagrammes for Waumlrtsilauml 12RT-flex96C engines without heat recovery (left) and with
high-efficiency waste heat recovery plant (right) showing in this case 114 gain in overall efficiency with WHR
(waste heat recovery) (WAumlRTSILAuml 2007)
Barriers Large capital investment requirements (around $5-6 million for a large container ship20) and
split incentive between ship owners and ship operators (ICCT 2011)
Technical maturity The technology is available on the market and has medium to long payback time
(WAumlRTSILAuml 2007 Crist 2009)
Applicability A WHR system is applied to vessels with a high production of waste heat and a high
intake of electricity WHR can be employed on ships with main engine average performance is higher
than 20000 kW and auxiliary engine average performance higher than 1000 kW This size
requirements limit the number of ships using this technology (IMO 2011) Generally it is applicable to
all ships types new and retrofit (Crist 2009)
Propellers and Rudders
Numerous devices have been designed for improving the energy consumption of vessels by recovering
as much as possible of this rotational energy in the flow from the propeller or to provide some pre-or
post-rotation of the in flow into and after the propeller to ensure best efficiency The most important
of these will be discussed in the following paragraphs (IMO 2009)
Ducted propeller (Kort Nozzle)
The accelerating ducted propeller consists of a screw propeller surrounded by a non-rotating duct
(nozzle) (Figure 8) Compared to the conventional propeller of the same diameter and thrust this
20 httpgcaptaincompower-exhaust-gas-paybacks-waste
TRANL15371 9
arrangement allows an increase inflow to the propeller improving the operating conditions around the
propeller and the ideal efficiency
Figure 8 Right photos of this Norwegian trawler (SetSail 2009)
The duct creates additional thrust load The potential for energy savings on relevant vessels range
between 1ndash20 (Crist 2009 IMO 2011 Barringhaus und Olds 1999 IMO 2009) whereupon 10 is a
good average value (IMO 2009 Crist 2009) The improvement of the combination of propeller and duct
overweigh negative effect of the increase water resistance caused by the duct
Barriers Since the duct has an optimal operational speed it does not work efficient at all speeds For
instance as drag increases with increasing speed eventually this will become larger than the added
thrust Therefore at high speeds ducts are typically not used (IMO 2009) The split incentive is a barrier
between ship owners (investor) and ship operators (gainer) as explained earlier (ICCT 2011)
Technical maturity Several standard designs are available on the market (IMO 2011) with a medium
payback time (IMO 2011)
Applicability Ducted propellers suits for vessels operating at high propeller loadings such as tankers
bulk carriers especially tugs and some offshore service ships The duct leads to increased friction but
at higher propeller loadings this is more than rewarded for by the positive effect of the combination of
propeller and duct (IMO 2009)
Contra-rotating propellers (CRP)
A rotating propeller induces a rotating motion in its backwash Normally this rotation energy of the
propeller gets lost The contra-rotating propeller is used in order to recover part of this energy (Figure
9) In a contra-rotating configuration two propellers are facing each other rotating in the opposite
direction with the aft propeller recuperating the turning energy in the wake from the forward propeller
(IMO 2011) To avoid complications with cavitation the aft propeller usually has a smaller diameter
than the front propeller Contra-rotating propeller arrangements involve a short shaft line and for that
reason primarily suitable for vessels with single-screw
TRANL15371 10
Figure 9 Left conventional propeller Right contra-rotating propeller The working principle is simple and effective
the power is split in a forward and aft propeller which through the different direction of rotation cancel out the
rotational energy losses behind the propeller (WAumlRTSILAuml 2009)
Potential savings of such measures are assessed to be in the order of 6ndash20 of the power consumption
with an average of 13 although higher figures may be presented by industry for specific cases Two
different full-scale measurements reported gains of 15 and 16 (IMO 2009 Crist 2009)
Barriers The mechanical installation of contra-rotating shafts is complicated and requires more
maintenance (IMO 2011) The split incentive between ship owners (investor) and ship operators
(gainer) is a barrier as explained above Although this technology can bring high energy savings the
investment is so high that there is not a short payback time
Technical maturity The technique is available on the market but problems with gearboxes for
contra-rotating propellers have been reported as well as operational problems with mounting (IMO
2009 IMO 2011) Payback time is reported as short (WAumlRTSILAuml 2009) but also as medium-long with
about ~15-20 years (Shuto 2010)
Applicability The technology is particularly beneficial for rather heavily loaded propellers as for
example very fast cargo vessels like Ro-Ro ships or for container ships (IMO 2011 Crist 2009) Contra-
rotating propellers need a short shaft line and hence mainly suited to single-screw ships (IMO 2011)
Contra-rotating propellers can be implemented as retrofit but it is more likely implemented in new
built ships due to the complicated mechanical installation (Crist 2009)
Post swirl devises
A number of different techniques belong to the post swirl category Several of them contain
modifications to the rudder or propeller (IMO 2009) Depending on vessel type and operational field
various power saving measures can be mounted to optimise water velocity distribution to the propeller
and to minimise slipstream losses due to swirl in the outflow of a propeller The most important among
these measures may be additional thrusting fins at the rudder twisted rudder (Figure 12) rudder-
bulb-systems with fins (Figure 13) and fins on the propeller fairwater also called post swirl fins or
boss cap fins (Figure 10)
Generally post swirl measures reported 1-8 energy efficiency (test models) Even 8-9 energy
efficiency from full-scale measurements for additional thrusting fins at the rudder Payback time is
estimated to be short to medium post swirl devices (DNV GL 2015 Crist 2009 ICCT 2011) Some of
CRP FOR BETTER PROPULSION EFFICIENCY
CONVENTIONAL PROPULSION
TRANL15371 11
the post swirl measure can be combined A good overview is given in Nielsen et al (Combined Kappel
propeller and rudder bulb system for improved propulsion efficiency not dated)
3431 Post swirl fins
The post swirl fins (Figure 10) can recover energy loss of propeller hub vortex in the propeller backward
flow and can lead to 3-5 energy saving on average 4 operating at the same speed (MOL 2011
Barringhaus und Olds 1999 Hansen Dinham-Peren und Nojiri 2011 ICCT 2011)
Figure 10 Example the post swirl fins or propeller boss cap fins (gcaptain 2012)
Barriers It is simple and straightforward measure requiring only the removal of the propeller boss
caps and replacement with the post swirl fins (no hull modification is needed) (Hansen Dinham-Peren
und Nojiri 2011 MOL 2011) However there is a split incentive between ship owners (investor) and
ship operators (gainer) as explained above
Technical maturity The technique is available on the market In 2013 post swirl fins were applied
to over 2500 ships worldwide (MOL 2011) Further advantages of the post swirl fins are reduction in
propeller torque reduced vibration in the stern and less underwater noise and reduced rudder erosion
(MOL 2011) A payback time of 6 months was estimated for 4 efficiency improvement at $600tonne
oil price (Hansen Dinham-Peren und Nojiri 2011) The investment is considered to be low21
Applicability The technique is effective for all screw propellers irrespective of the type or hull form
of the ship Has been tested on large-scale container vessels (MOL 2011 Hansen Dinham-Peren und
Nojiri 2011)
3432 Free rotating wheels
A vane wheel (Grim wheel) is a freely spinning propeller mounted behind the main smaller propeller
(see Figure 11 for example of use on retrofit Queen Elisabeth II in 1986) The vane wheel has a bigger
diameter than the main propeller and increases the propeller diameter The small propeller drives the
freely revolving vane wheel fitted on the wake The inner part of the vane wheel acts as a turbine and
the outer part as an ldquoadditionalrdquo propeller
21 httpgcaptaincompropeller-technology-ship-efficient
TRANL15371 12
Figure 11 Example for a grim vane wheel (Boat design 2007)
This leads to a substantial recovery of the rotational energy The energy saving potential is reported to
be 10 (Brannigan et al 2009) It is stated that the important benefit of the vane wheel is that a
smaller impulsion propeller can be installed which consumes less energy The vane wheel gives a
suitable energy improvement for cargo ships (IMO 2009 Schneekluth und Bertram 1998) and has short
payback time It is also stated that if there is room for a vane wheel in the aft there is also space for
an impulsion propeller of larger diameter leading about the same energy saving potential as the
combination of a small impulsion propeller and a vane wheel (IMO 2009)
Barriers A barrier is the split incentive between vessel owners who are responsible for investing in
these technologies and vessel operators who are those who compensate for the fuel consumption and
benefit from such technologies
Technical maturity Limited application Vane wheels are subjected to strong fluctuations in loading
Problems with the strength of the blades have been encountered frequently (for example the vane
wheels on the Queen Elisabeth II were short lived and not used after22)The payback time is estimated
to be short
Applicability The technique is effective for all screw propellers irrespective of the type or hull form
of the ship both for new and existing ships (Chen Reed und Kim 1989) Recommended for all ship
types except ferry and cruises because of their problem with strong fluctuations in loading as
mentioned above23 (IMO 2009)
3433 Twisted rudder
Rudders can play a significant role of extra frictional resistance Rudders are located in the backwash
of a propeller and rotational energy will act on the rudder Because of these effects the rudder gives
prospects of efficiency gains (Schulze 2007)
22 httpwwwroblightbodycomlinersqe-21987_Refitindexhtm 23 httpwwwroblightbodycomlinersqe-21987_Refitindexhtm
TRANL15371 13
Figure 12 Schematic capture of twisted rudder (Nakashima 2015)
Twisted leading edge technology provides multiple benefits for high-speed vessels compared to
conventional rudder designs Conventional rudders are located behind the propeller with the rudder
profile arranged symmetrically about the vertical rudder centre plane This arrangement does not
consider the fact that the propeller induces a strong rotational flow that strikes on the rudder blade
This consequences in areas of low force on the blade that induce cavitation and associated erosion
problems (Becker Marine System 2015 Schulze 2007)
The twisted rudder is horizontally twisted on the lower and upper side of the segment that is an
extension of the propeller shaft (Figure 12) This decreases cavitation rudder and improves
manoeuvrability of the vessel (Schulze 2007) Twisted rudder types lead to energy efficiency
improvements by approximately 2-4 on average 3 for large-size high-speed vessels (Hollenbach
und Friesch not dated Nakashima 2015)
Barriers Work needs to be done in the dry dock this is not regularly happening for existing ships
(Hochkirch und Bertram not dated) There is a split incentive between vessel owners who are
responsible for investing in these technologies and vessel operators who are those who compensate
for the fuel consumption and benefit from such technologies (ICCT 2011)
Technical maturity This rudder type is a commercially used technology and easy to apply if the ship
is in the dry dock (ICCT 2011)The payback time is estimated to be short to medium (Rolls-Royce 2014
Crist 2009)
Applicability Twisted rudder can used by container vessels reefers Ro-Pax ferries cruise ships and
naval vessels In South Korea this type of rudder is recognised as a standard rudder for large-size
high-speed container carriers (Nakashima 2015)
TRANL15371 14
3434 Rudder bulb
Figure 13 Example for a rudder bulb Kawasaki RBS-F rudder bulb systems with fins (Kawasaki 2015)
The rudder bulb brings smooth inflows from the propeller and can reduce the drag of the rudder The
rudder fins produce thrusts in the rotational flows generated by the propeller (Figure 13) Rudder bulb
measure can improve energy efficiency by 2-5 (Nielsen et al not dated Becker Marine System not
dated) on average 4 (Crist 2009)
Barriers The work needs to be done in the dry dock this is not regularly happening for existing ships
There is a split incentive between vessel owners who are responsible for investing in these technologies
and vessel operators who are those who compensate for the fuel consumption and benefit from such
technologies (ICCT 2011)
Technical maturity The technology is a commercially used technology and easy to apply while the
ship is in the dry dock (Kawasaki 2015) Payback time is estimated to be medium (Crist 2009)
Applicability For new and retrofit tanker- bulk- container- and Roro-ships with a propeller and
rudder (Crist 2009)
TRANL15371 15
Barriers to the transfer and uptake of energy
efficiency technologies for ships and possible
measures to overcome them
Although there are ways to reduce emissions (Chapter 3) and also drivers working towards the
implementation of such measures there are significant barriers to acting on cost-effective opportunities
in the maritime industry This is often referred to as barriers to energy or the energy efficiency gap
(Michele Acciaro 2013) (Sepideh Jafarzadeh 2014) (OECD 2014) Some barriers are shared with other
industries while others are unique to the maritime industry Furthermore many of these barriers are
not specific to the EEDI and the SEEMP but apply to any rule under MARPOL These barriers can exist
on both the supply and the demand side For example there could be barriers to the development and
implementation of measures that reduce CO2 emissions from ships and barriers to the expression of
demand for these measures (ECORYS 2012) Studies have however shown that there are relatively
few barriers related to the development of new technologies or access to related intellectual property
rights by the main shipbuilding nations and that the supply of measures exceeds the demand (ECORYS
2012) Existing studies on barriers to energy efficiency thus focus on what prevents the uptake of
available measures
This section presents an overview of the main barriers to the transfer and uptake of energy efficiency
technologies in the shipping industry and discusses potential ways of overcoming them
Preliminary assessments of technology transfer and financial needs by both workshop participants and
the IMO Ad Hoc Expert Working Group on Facilitation of Transfer of Technology for Ships (AHEWG-TT)
have suggested that the type of assistance needed by Port State and Flag State administrations will be
of a different nature than that required by shipbuilders and owners Our assessment above has shown
that the shipbuilding industry is expected to need less assistance than Port States and Flag States
In the next table we list a summary of the main barriers and the stakeholders concerned in the main
categories as identified by AHEWG-TT as well as the possible measures that could help overcome these
barriers The possible measures to overcome the barriers are further detailed in the sections below
Related costs are estimated in a separate section in order to minimise overlap
TRANL15371 16
Table 2 Summary of main barriers relevant stakeholders and possible measures to overcome them
Barrier Stakeholders Measures forward
Lack of awareness
(administrative and industry)
a MARPOL in general MARPOL Annex
VI EEDI and SEEMP in particular
b Available energy efficiency
technologies
Flag and Port
States
Ship owners
Capacity building
- Workshops
- Trainings
Model course for training
Inventory
Platform for information access and
sharing
Agreements between industry and
administrations
Technology concerns
a Lack of or limited technology supply
chain in some states
b Lack of technology base for RampD in
some states
c Lack of trust (in ability to reduce
emissions in ability to reduce
operational costs in compatibility
with other measures)
Ship owners
Investors
Increase cooperation in ship design
and building
Increased interaction between
industry and educationalRampD
institutes
Establish platform to share
expertiseexperience
Provide special investment or
guarantee funds
Institutional concerns
a Increased administrative burden
1Revision and amendment of existing legislation
2Implement Port and Flag State obligations
b Limited technical capacity in state institutions to implement
c Lack of financial resources for additional compliance and enforcement activities by maritime administrations
Flag States
Port States
Promote increased cooperation and
communication between
administrationswithin regional
administrations
Regional information workshops for
Port and Flag States
Establish platform to share regulatory
experience
Development aid
Commercial
a Increased costs for ship owners to
take up energy efficient technologies
b Lack of motivation of owners to take
up energy efficient technologies (split
incentive)
Ship owners
Financiers
Special EE funds
Smart contracts
TRANL15371 17
Awareness Raising
Barriers Lack of Awareness
The need to create awareness among Flag States Port States and ship owners of the requirements of
Annex VI in general and Chapter 4 in particular was highlighted by participants of the workshop and
emphasised by the AHEWG-TT The level of awareness in the various regions and even in the countries
within the regions differed considerably The AHEWG-TT further suggests it would be beneficial to
undertake an initial evaluation of knowledge needs (gap analysis) in order to ensure workshops and
other awareness-raising activities are appropriately tailored24
Furthermore ship-owners are not always aware of the energy efficiency technologies available on the
market or which operational measures can be implemented to save fuel Ship owners can be companies
people and investment funds Especially private equity groups tend to focus more on short term looking
for quick profit while traditional ship owners tend to hold the ship for at least 20 years25
Measures forward
Though Flag States and Port States should already have implemented measures to ensure that Energy
Efficiency Design Index (EEDI) and Ship Energy Efficiency Management Plan (SEEMP) requirements are
complied with both public administrations and industry representatives could benefit from additional
trainingcapacity building and platforms to share experiencesreceive information with regards the
practicalities of these regulations and available energy efficiency technologies The needs for each
group can be determined through a gap-analysis which we recommend to be carried out by an
independent consultant in cooperation with the flag and port states Once the specific needs for each
group have been determined they can be addressed through the following awareness raising
measures
Capacity Building (workshops trainings)
Workshopstrainings could be organised where formal training is combined with open discussions where
experiences could be shared just within one stakeholder group or between educational institutes
auditors operational managers of ships shipbuilders and authorities Such trainingsworkshops could
focus on just one or all aspects relating to the applicable rules available energy efficiency measures or
assessment methods of technologies (eg training in calculating and verifying EEDI and SEEMP
including development of tools to calculate EEDI and SEEMP) Trainingsworkshops can be local or
regional Sending people physically to regional workshops is generally more conductive to networking
and experience sharing but less adapted to the local situation and more costly
To reduce the costs of training and ensure a certain level of training the IMO or other qualified
international partners (eg WMU) could develop model courses for training In order to better
understand the rules and regulations in detail people use the help of trainers to better understand the
elements that are important for them and to gain experience in doing calculations and other required
24 Ad Hoc Expert Working Group on Facilitation of Transfer of Technology for Ships 2nd Meeting 25 httpwwwftcomcmss0dadcb240-3d97-11e3-b754-00144feab7dehtmlaxzz3aqC3tmNu
TRANL15371 18
activities by the regulations Trainers have to develop their courses and earn back their investments
via trainings Since the trainers are doing this simultaneous it would be more efficient if there would
be a model course available that can easily be tailored to the audience This would reduce the costs for
the development of trainings and would also ensure that the trainers provide the same level of depth
in their trainings Since the IMO is responsible for the rules and regulations it would be the logical
responsible for the efficient implementation and therefore could take the initiative for developing model
courses
Information Sharing
Inventory of energy-efficiency technologies (for example the IMO-GEF-UNDP project) Many
studies and overviews on the internet are available The quality and the scope is often
different
Improved access to information and information sharing with international recognised
organisations including relevant survey and certification training One example of
establishing information sharing between governments is the work of the OECD Council
Working Party on Shipbuilding (WP6)26 which organises regular workshops aimed at
facilitating the exchange of information on policy and industry developments
Note that many of these measures overlap with the measures required to overcome institutional
barriers as laid out in section 43
Agreements between industry and administrations could be envisaged to overcome the
barriers
In order to enhance the sharing of expertise for both administrations and industry technology transfer
and technology cooperation agreements could be formulated in order to strengthen the cooperation
As identified before the technology transfer to the ship building industry is not a mayor barrier so the
agreements should help the administrations to become more aware of the possibilities to further
promote the implementation of MARPOL Annex VI
Typical agreements between industry and administrations could be in the form of initiatives like the
Sustainable Shipping Initiative (SSI) SSI members have developed a vision for a sustainable shipping
industry in 2040 They commit to working towards this in all their own operations andor activities that
involve shipping and in all their dealings with and support for the shipping industry to make their vision
a global reality by 2040 SSI members of over 19 companies represent ship owners and charterers
shipbuilders engineers and service providers banking insurance and classification societies The SSI
explored for instance how to overcome barriers to the uptake of new technologies and techniques which
improve the operational efficiency of ships potentially delivering energy efficiency savings of 10 or
more and payback periods of less than 5 years They also produce case studies to show good examples
and also develop tools By involving administrations in these kind of initiatives (even free of charge)
they could be actively supported with knowledge about sustainable shipping
26 httpwwwoecdorgstiindworkshopongreengrowthinshipbuildinghtm
TRANL15371 19
Technology Concerns
Barriers Technology Concerns
One of key barriers to the implementation of energy efficient technologies (new and retrofit) relates to
the lack of or limited technology supply chain Furthermore the lack of a technology base for RampD in
some states is a barrier Also the existence of concerns relating to the ability of available energy
efficiency measures to reduce emissions and operational costs and their compatibility with other
measures of energy efficient technologies is a barrier This is typically the problem in very isolated ship
yards
Measures forward
Very successful shipyards (Japan and Korea) have already since many years a large number of
licencing technology transfer and similar agreements and continuously exchange information with
competitors in and outside their countries For instance US shipyards have adopted this methodology
since the 1980s (office of technology assessment 1983)
Further technology sharing could be stimulated through educationalRampD institutes locally regionally
or globally in ship design and building The technology will be transferred to the ship builders once the
students start working there or through cooperation between industry and university In order to
facilitate this we recommend the establishment of partnerships to share expertiseexperience
Typically individuals who know both worlds are the driving force behind successful partnerships (AISBL
2012) These partnerships are built around a shared long term research vision Many partners could
contribute (eg financially) in order to establish the responsible management and research programme
The target of the platform could be for example to provide verified information on real-world energy
efficiency improvements via a monitoring programme
For example in order to stimulate the deployment of energy efficient trucks the Dutch government
provides a website to share audited knowledge and data on about 15 energy efficiency technologies27
Additionally climate financing could be leveraged to reduce the investment risk in unproven
technologies For example IMO Member States could create a demonstration fund that can function as
a guarantee for investments in new and immature technologies28 Similarly investment guarantees
can be provided by funds in the same way governments provide export credits to their companies If
the technology does not deliver the expected fuel-savings the fund can cover the difference and hence
reduce investment uncertainty The main objective being to reduce investment risk
Institutional Concerns
Barriers
27 httpwwwtruckvandetoekomstnl 28 An example of a specific EE fund is httpwwweeefeueligible-investmentshtml
TRANL15371 20
For Flag and Port States complying with new regulations of IMO and EEDI and SEEMP particularly
represent and increased administrative burden It requires revisions and amendments of existing
legislation that need to be implemented at Port and Flag State functions There is currently limited
technical capacity in state institutions to implement these changes especially in developing countries
with a relatively low number of ships under their flag
The lack of financial resources is also a barrier for additional compliance and enforcement activities by
maritime administrations This is particularly an issue for least developed countries and small
developing island states Implementation costs are relatively higher for small Flag States because of
limited abilitycapacity to implement new technical regulations Note that this issue is not specific to
the EEDI and the SEEMP but to most regulatory measures (maritime or other)
Measures forward
Measures to assist states in implementing (existing and new) legislation include
Promote an increased cooperation and communication between administrationswithin
regional administrations of Port and Flag States similarly to what has been suggested in
sections 41 (Awareness raising through capacity building activities such as workshops) and
42 (Establish platform to share regulatory expertiseexperience) Platforms could be
managed by IMO in conjunction with industry and development funds in order to share the
costs as this has been done before for GloBallast for example In that case the IMO is in the
lead (executing agency) but the platform is supporting the collaboration with many
stakeholdersfunding partners The goal of the programme is to assist developing countries
eg via e-learning courses
In addition deterrents need to be put in place to discourage Flag States from performing
substandard inspections A system for detecting sub-standard inspections should be
implemented whereby mandatory Port State Control inspections are carried out in close
proximity to mandatory Flag State inspections (ie the Flag State inspection is carried out
prior to the ship leaving port and the Port State inspection is carried out upon arrival at port)
The two inspections should be carried out under a uniform mandatory checklist The IMO
should monitor inspections and investigate where discrepancies between inspections close in
proximity are detected If a Flag or Port State is found to have failed to meet the requisite
inspection standards penalties in the form of substantial fines should follow
In order to overcome the financial barriers financial assistance to states could help with
capacity building and implementation Financial resources are not only needed in the
implementation of the new regulations (training of government experts) but governments of
Flag States also need to be involved continuously in the ongoing discussion around
developments new EEDI targets for 2020 and beyond which requires continuous availability
of experts to represent the interests of the state (Metselaar 2015) Financial aid can therefore
be supplied in the following forms
Increased financial support for compliance and enforcement activities by maritime
administrations
Financial support could be provided to Flag States so that they have the resources to
properly carry out vessel inspections Consideration should be given to the introduction of
TRANL15371 21
an International Fund Convention set up for this purpose and contributed to by Port
States andor their major oil and other cargo exporters and importers
Commercial
Barriers
Private parties such as ship owners and investors are not always commercially incentivised to make
investments in energy efficiency measures This can be due to the split incentives between owner (who
should make the investment) and charterer (who reaps the cost savings) of a ship (see paragraph 25)
Furthermore access to finance can be problematic for smaller players who operate in niche markets
Measures
Bottlenecks in financing private investments and new financing mechanisms could be addressed during
regional or international workshops that include traditional and new financiers that could finance
investments in energy efficiency technologies
One solution that has been brought forward to address the problem of split incentives is the use of
lsquosmart contractsrsquo (Michele Acciaro 2013) The idea is to change charter contracts in a way that risks
and benefits are shared among charterers and ship owners In such contracts speed choice is more
flexible and the chartering cost of vessels is closer to fuel cost as such ship owners get motivated to
invest in energy-efficient technologies and charterers get stimulated to run vessels in an energy
conserving manner
With respect to the shipbuilding industry the following could facilitate the transfer of technology as
well
Financial assistance to shipyards to be provided at the national level or through other
arrangements
Foreign direct investment in software and hardware as an innovative way to support industry
in implementing the requirements
One type of incentive that governments can provide to enhance industry performance and technology
adoption is a competition for top performers Governments could contribute to a fund from which
money is distributed to the top 10 of best performers in a particular year
Cost estimates
Workshops and training
Capacity building workshops for administrations are estimated at euro 1000 per attendee for an
online workshop (1-2 days) Costs for the organisation of such workshops would include expert fees
and administrative costs These costs could be lower if the course material is already developed
(model workshops) Eg 2 attendees per Flag State for the ten most important Flag States
TRANL15371 22
(covering 74 of total fleet tonnage) comes down to euro 20000 or less in case the courseware is
already existent
A situation that is more conductive to networking and experience sharing is to send people physically
to regional workshops The costs of such workshops including participants travel and hotels for 50
participants would be between euro20000 - euro100000 per workshop based on our international
experience with organising workshops in the field of renewable energy and energy efficiency Costs
could be lower depending on the amount of preparation required cost of location (could be sponsored
by participating states)
Technical training
Trainings already exist for calculating and verifying EEDI including development of tools to calculate
EEDI For example MARIN offers 32h courses over 5 days in the Netherlands for euro 5000 per attendee
(excluding travel and accommodation)29 Lloyds offers similar trainings for similar costs30
Model courses for training may need to be updated depending on identified needs Ecofys estimates
the update of eg an existing EEDI model courses to cost in the order of euro 50000
Online platform for inventory of energy efficiency technologies
Inventories of energy-efficiency technologies already exist (for example in reports like (IMO 2009) and
on websites of for instance DNV-GL the efficiency finder31) but they could be further developed since
the websites are either not independent or incomplete
In order to facilitate information exchange a web-based platform could be established The role of the
platform would be for example to provide verified information on real-world energy efficiency
improvements via a monitoring programme For example in order to stimulate the deployment of
energy efficient trucks the Dutch government provides a website to share audited knowledge and data
on about 15 energy efficiency technologies32 The costs of such a website and corresponding
programme are estimated to be around euro 2 million for a 4 year period Furthermore a platform can be
used to inspire others by showing best practices and can be used for sharing of information regarding
network opportunities like conferences and seminars
Capacity building project
Currently the IMO-GEF-UNDP GloBallast project is a capacity building project it assists developing
countries and their maritime industries in implementing international regulations on ballast water
29 httpwwwmarinnlwebEventsCoursesSpecialist-Course-on-Ship-propulsion-model-tests-and-SpeedPower-trials-for-EEDI-Verifiers-
2731-October-2014htm 30 httpwwwlloydslistcomllsectorship-operationsarticle422262ece 31 httpswwwdnvglcommaritimeenergy-efficiencyefficiency-finderhtml 32 httpwwwtruckvandetoekomstnl
TRANL15371 23
management and preventing risks arising from the transfer of harmful aquatic organisms And has
several aspects that could also be used for knowledge transfer of energy efficiency measures
web-site
e-learning course
databasesdirectories
library collections
newsletter
Regional Task Force (RTFs) to support development and adoption of a regional approach
Develop and implement communication education awareness raising and outreach
programme
Develop introductory and more specialised training packages
Develop model legislations
The total budget for the 2008-2012 period was US$23 million out of which US$564 million represents
a GEF grant the rest being mostly in-kind contributions from the participating countries regional co-
ordinating organisations (RCO) and strategic partners including the private sector
Improved access to information and information sharing with international recognised organisations
including relevant survey and certification training would further promote the different technologies
TRANL15371 24
Conclusions
This study provides an overview of existing technologies which could drastically improve the energy
efficiency of ships Furthermore barriers to transfer and uptake of energy efficient technologies are
analysed and categorised and implications of these barriers are listed in order to facilitate the uptake
of energy efficiency technologies for ships
From this research it is clear that conventional technology is available that can cost-effectively (with a
payback time of less than 15 years) achieve high efficiency gains If the maximum gains per category
are added up (for all but ferry and cruise) this would mean a total efficiency improvement of 35
Even without taking two experimental technologies with potentially high efficiency gains into account
(wind power and air lubrication)
High investments like wind power and contra rotating propellers bring the highest savings (13 ndash 20)
The medium investments are in-between (5-10) and the low investments only bring relatively small
energy efficiency improvements (lt5)
When the ship owner has too few opportunities to share investment with charterers this leads to a split
incentive a ship owner may invest the up-front capital to put in energy-efficient technology but not
receive the benefits This is typically a problem for investments with a high payback time ie the wind
power and contra rotating propellers
The main barriers are related to the transfer of technology to Flag States Flag States are generally
third world and developing nations that often do not have the resources to enforce investigate or
prosecute breaches by their flagged vessels
Several ways to overcome the knowledge transfer barriers were presented that can be categorised as
follows
Workshops and trainings
o Capacity building workshops for administrations
o Regional workshops
Technical training
o Training in calculating and verifying the EEDI
o Development of model courses
Online platform
o Inventory of energy-efficiency technologies
o Creation of a website with all relevant information for the target audience
o Improved access to information and information sharing
o Provide verified information on real-world energy efficiency improvements via a
monitoring programme
TRANL15371 25
The most expensive of the capacity building actions is the capacity building project which takes all
aspects above into account If a project would be developed for knowledge transfer regarding energy
efficiency measures similar to GloBallast which assists developing countries and their maritime
industries in implementing international regulations on ballast water management and preventing risks
arising from the transfer of harmful aquatic organisms the total budget needed would be in the order
of US$23 million for a period of 5 years
TRANL15371 26
References
JFE Group 2013 ldquoJapan Marine Unitedrdquo JFE Group Overview JFE Group AISBL 2012 Making Industry-University partnerships work lessons from succesful collaborations
report Belgium AISBL
Allenstroumlm Bjoumlrn 2013 ldquoWind propulsionrdquo SSPA Sweden AB Gothenburg EffShip March
Aqorau T 2000 Illegal Unreported and Unregulated Fishing Considerations for Developing
Countries paper Honiara Solomon Islands South Pacific Forum Fisheries Agency
BALance 2014 Competitive position and future opportunities of the Euroean Marine Supplies
industry BALance Technology Consulting
Barringhaus David and Robert Olds 1999 OLDS ENGINEERING Maximizing Propulsion Efficiency
Marine Division Accessed Februrar 2015
httpwwwoldscomaumarinemaximizing_propulsion_efficiency
Becker Marine System not dated Becker Bulb Rudders httpwwwbecker-marine-
systemscom05_downloadszzpdfproduct_pdfBecker_Bulb_Rudderspdf Becker Marine
System
mdash 2015 Twisted Full Spade Rudder Accessed Feb 2015 httpbecker-marine-
systemscom03_productsproducts_twisted_full_spadehtml
Bloomberg 2014 China Loses Shipbuilding Crown to South Korea Chart of the Day 9th December
httpwwwbusinessweekcomnews2014-12-09china-loses-shipbuilding-crown-to-south-
korea-chart-of-the-day
Bluebird-Electric 2014 Sipbuilding post World War Two httpwwwbluebird-
electricnetship_boat_design_buildingshipbuilders_ship_repairers_associationhtm
Boat design 2007 Accessed Feb 2015
httpwwwboatdesignnetforumsattachmentspropulsion16743d1193341389-new-
propulsion-sytems-ships-grim-prop-1jpg
Brannigan Paschos Eyers and Wood 2009 Report on International avialtion and Mritime Emissions
in a Copenhagen (post 2012) Agreement Oxfordshire AEA Group
Chen Benjamin Arthur Reed and Ki-Han Kim 1989 A Vane-Wheel Propulsor for a Research and
Development Report Newport David Taylor Research Center
CNSS 2015 Clean North Sea Shipping - Clean Shipping Technology Accessed Februar 2015
httpcleantechcnssnoghg-technologiestechnical-measuresmeasures-related-to-the-hull
Crist Philippe 2009 Greenhouse gas emissions reduction potential from international shipping
Working paper OECD
Daily Times 2015 Nigeria Turkey seek collaboration on ships shipyards 5th January
httpwwwdailytimescomngarticlenigeria-turkey-seek-collaboration-ships-shipyards
Dillingham Gerald L 2000 Progress Made to Reduce Marine Pollution by Cruise Ships but Important
Issues Remain GAO report Washington United States General Accounting Office
DK Group 2015 Silverstream technologies January Accessed January 2015 httpdkgroupeu
DNV 2014 Encouraging Construction and Operation of Green Ships OECD
httpwwwoecdorgstiindC-WP6(2013)12-FINAL-ENGpdf
TRANL15371 27
DNV GL 2015 EFFICIENCY FINDER Accessed Feb 2015 httpwwwdnvglcommaritimeenhance-
performanceefficiency-finderaspx
Ecorys 2012 ldquoGreen growth opportunities in the EU shipbuilding sectorrdquo
ECOSPEED 2015 EUROPEAN MARINE amp MACHINERY AGENCIES LTD Accessed February 2015
httpwwweuropeanmarinecoukECOSPEEDhtm
gcaptain 2012 gcaptain - Propeller Technology to Make Your Ship More Efficient - Accessed Feb
2015 httpgcaptaincompropeller-technology-ship-efficient
Hansen Dinham-Peren and Nojiri 2011 Model and Full Scale Evaluation of a lsquoPropeller Boss Cap
FinsrsquoDevice Fitted to an Aframax Tanker Second International Symposium on Marine
Propulsors smprsquo11 Hamburg Germany June 2011
Hellenic Shipping News 2014 Korean ships sell at fuel-saving premium 22nd December
httpwwwhellenicshippingnewscomkorean-ships-sell-at-fuel-saving-premium
Hindawi 2015 Hindawi Puplishing Cooperation Accessed February 2015
httpwwwhindawicomjournalsijrm2012474785fig4
Hochkirch Karsten and Volker Bertram not dated ldquoSlow Steaming Bulbous Bow Optimization for a
Large Containershiprdquo Accessed Februar 2015 http2021148960resourcepdf5096pdf
Hollenbach Uwe and Juumlrgen Friesch not dated Efficient hull forms ndash What can be gained
Conference ship-efficiency Hamburg 2013 Hamburg HSVA Hamburgische Schiffbau-
Versuchsanstalt GmbH HamburgGermany
ICCT 2011 Reduce Greenhouse Gas Emissions from Ships - Cost Effectiveness of Available options -
white paper Washington DC International Council on Clean transportation (ICCT)
IMO 2011 REDUCTION OF GHG EMISSIONS FROM SHIPS Marginal Abatement Costs and Cost
Effectiveness of Energy-Efficiency Measures Submitted by the Institute of Marine Engineering
Science and Technology (IMarEST) MEPC 62INF7 International Maritime Organisation
IMO 2009 Second IMO GHG Study 2009 London International Maritime Organisation
JSEA 2006 ldquoImproved propulsive performance - Universal applies new energy-saving type Leadge
Bowrdquo Japan Ship Exports Association (JSEA) httpwwwjseaorjpVariableJSea318pdf
Kawasaki 2015 Energy-saving Technology Accessed Feb 2015
httpswwwkhicojpenglishshiptechconservationindexhtml
Leddy Fiona Jayne 2012 ldquoA critical legal analysis of International Shipping in Australian Waters and
the risk of ship-based oil pollutionrdquo Queensland Environmental Practice Reporter vol 17
Marinelog 2014 China white lists 51 shipyards 4 September
httpwwwmarinelogcomindexphpoption=com_k2ampview=itemampid=7667china-white-
lists-51-shipyardsampItemid=231
Metselaar Kees interview by Arno van den Bos 2015 Policy officer at directorate maritime affairs of
ministry of Intrastructure and Environment (February)
Michele Acciaro Peter Nyegaard Hoffmann Magnus Strandmyr Eide 2013 ldquoThe Energy Efficiency
Gap in the Maritime Transportrdquo Journal of Shipping and Ocean Engineering 1-9
MIWB 2015 Maritiem Instituut Willem Barentsz Accessed Feb 2015
httpsmijnmiwbnlnieuwsbriefindexphpdo=showampid_artikel=116
MOL 2011 Energy-Saving Propeller Boss Cap Fins System Reaches Major Milestone - Orders
Received for 2000 Vessels Accessed Feb 2015
httpwwwmolcojpenpr20111145html
TRANL15371 28
Motorship 2014 Gas fuelled ships into the future 31 10 httpwwwmotorshipcomnews101ships-
and-shipyardsgas-fuelled-ships-into-the-future
Nakashima 2015 Nakashima propeller CO LTD Accessed Feb 2015
httpwwwnakashimacojpengproductrudderhtml
Nielsen Shin Lundgren and Faghani not dated Combined Kappel propeller and rudder bulb system
for improved propulsion efficiency Frederikshavn MAN Diesel amp Turbo
OECD 2014 The OECD Council Working Party on Shipbuilding
httpwwwoecdorgindustryindshipbuildinghtm
OECD 2011 ldquoThe Shipbuilding Industry in Turkeyrdquo
office of technology assessment 1983 An Assessment of Maritime Technology and Trade report
Washington DC US Congress
Pakarinen Risto 2007 ldquoNothing common about common railrdquo Twentyfour7 (Twentyfour7) 64-65
Ports amp Ships 2015 Ports and Ships Accessed February 2015
httpportscozanewsarticle_2007_10_17_4038html
Rolls-Royce 2014 Propulsors - Moving your business in the right direction httpwwwrolls-
roycecom~mediaFilesRRolls-Roycedocumentscustomersmarinepropulsion-2014-
tcm92-8664pdf Aalesund Rolls-Royce Commercial Marine httpwwwrolls-
roycecom~mediaFilesRRolls-Roycedocumentscustomersmarinepromaspdf
Schneekluth H and V Bertram 1998 Ship Design for Efficiency and Economy Oxford
Butterworth-Heinemann
Schulze Reinhard 2007 Twisted Rudder - Extreme Design 14 SVA-Forum bdquo Ruder in Theorie und
Praxisldquo Potsdam 7 November 2007 Potsdam Schiffbau-Versuchsanstalt Potsdam GmbH
Selenetrawlers 2015 Selenetrawlers Accessed February 2015
httpwwwselenetrawlerscomcompanydesign-notes
Sepideh Jafarzadeh Ingrid Bouwer Utne 2014 ldquoA framework to bridge the energy efficiency gap in
shippinrdquo Energy 603-612
SetSail 2009 SetSail Accessed February 2015 httpwwwsetsailcomprop-nozzle-comments-by-
an-expert
Shuto Hideki 2010 Super Eco Inland Vessels httpwwwccr-
zkrorgtempwrshp120411Presentations2_04_HShuto_enpdf IHI Marine United Inc
Silberschmidt Noah 2014 ldquoGenerating efficiencies from thin airrdquo SMM Green shipping | Efficiency
httpwwwsilverstream-techcomwp-contentuploads201404HANSA-241112pdf
httpwwwsilverstream-techcomwp-contentuploads201404HANSA-241112pdf
Skinner Ian 2009 EU Tranport GHG Routes to 2050 Technical options for maritime and inland
shipping httpwwweutransportghg2050eucmsassetsTechnical-options-maritime-inland-
waterpdf Brussel European Commission
Statista 2015 ldquoLargest shipbuilding nations in 2013 based on completions in gross tonnagerdquo
httpwwwstatistacomstatistics263895shipbuilding-nations-worldwide-by-cgt
UK DfT 2014 ldquoDfT Port Statistics - World fleet registered trading vessels of 100 gross tons and over
gross tonnage on selected registers 1999-2013rdquo
httpswwwgovukgovernmentcollectionsmaritime-and-shipping-statisticsdata-tables-
associated-with-this-series
TRANL15371 29
Voorham 2013 Assessment of sustainable investment in shipping Master Thesis
Report SDPO13029m Delft 27 th November 2013 Delft Delft University of Technology
WAumlRTSILAuml 2009 ldquoEnergy Evironment Economyrdquo Helsinki Finland WAumlRTSILAuml
mdash 2007 ldquoWaste heat recoveryrdquo Waumlrtsilauml Corporation
Wettstein and Brown 2008 Derating a solution for high fuel savings and lower emissions
Winterthur Waumlrtsilauml Switzerland Ltd
Wind Chellenger Project HP 2015 Wind Chellenger Project HP Accessed Feb 2015 httpwindku-
tokyoacjpindex_enhtml
TRANL15371 30
Appendix I - World fleet registered trading vessels
Table 3 World fleet registered trading vessels of 100 gross tons and over 2009-2013 Source UK DfT 2014
Flag Country 2009 2010 2011 2012 2013
(World Total) 8448 9130 9831 10343 10725
Panama 1886 1979 2084 2158 2172
(European Union) 1900 1979 2074 2051 2106
Liberia 908 1037 1167 1238 1241
Marshall Islands 475 590 711 811 900
Hong Kong 449 553 678 785 854
Singapore 398 434 512 592 677
Malta 348 380 438 450 496
Bahamas 452 469 481 483 485
Greece 388 407 411 411 415
China 282 327 356 388 411
United Kingdom (inc IOM and CI) 258 273 294 300 288
Cyprus 201 205 207 197 203
Japan 138 156 167 178 192
Italy 150 169 181 180 176
Norway 152 145 143 144 145
Germany 152 155 153 137 123
Denmark 107 115 113 113 122
Korea South 120 124 116 111 112
Indonesia 69 82 91 101 111
Bermuda 94 100 106 109 105
Antigua amp Barbuda 100 107 111 106 100
United States of America 107 108 102 99 97
India 83 83 89 85 82
Netherlands 76 61 67 66 69
Turkey 54 58 62 64 59
Malaysia 69 72 71 62 57
France 63 63 64 56 53
Russia 47 49 49 51 52
Philippines 50 51 50 43 43
Cayman Islands 27 29 32 32 31
Taiwan 25 26 27 30 31
Iran 09 08 05 21 31
Thailand 25 26 22 26 29
Sweden 39 35 33 28 27
St Vincent amp the Grenadines 47 42 37 28 24
Canada 24 24 25 24 23
Spain 22 25 26 25 23
Kuwait 23 19 24 24 22
Brazil 20 20 19 19 20
Cambodia 18 17 13 13 12
TRANL15371 31
Appendix II - Most important shipbuilding
countries
China
China is an emerging shipbuilder that overtook South Korea during the 2008-2010 global financial crisis
as they won new orders for medium and small-sized container ships (Bloomberg 2014 Bluebird-Electric
2014)
Figure 14 delivery of vessels from Chinese and South Korean shipyards in million compensated gross tons a measure
of building time and human resources used per ton Source (Bloomberg 2014)
China has more than 1600 shipyards Analysts have predicted that about one third of them will fold
as the industry struggles with overcapacity Last year China laid out a three year plan for industry
restructuring that urged yards to concentrate on building higher quality vessels and local governments
to halt approvals for new projects (Bluebird-Electric 2014)
After two decades of a loan-fuelled boom Chinarsquos shipbuilding industry has become saddled with debt
and overcapacity prompting some private firms to seek financial assistance from the state In
September the government issued a list of 51 shipbuilders it deemed worthy of public support
(Marinelog 2014)
TRANL15371 32
New additions to the white list include subsidiaries of the China State Shipbuilding Corporation (CSSC)
and the China Shipbuilding Industry Corporation (CSIC) and the AVIC Weihai Shipyard owned by the
Aviation Industry Corporation of China (AVIC) (Marinelog 2014)
South Korea
By the end of 2014 it seemed South Korea has overtaken China again as the worlds largest
shipbuilding country with a global market share of about 30(see Figure 14) (Bloomberg 2014)
(Bluebird-Electric 2014) South Korea leads in the production of large vessels such as cruise liners
super tankers LNG carriers drill ships and large container ships
South Koreas shipyards are highly efficient with the worlds largest shipyard in Ulsan operated by
Hyundai Heavy Industries slipping a newly built $80 million vessel into the water every four working
days South Koreas big three shipbuilders Hyundai Heavy Industries Samsung Heavy Industries
and Daewoo Shipbuilding amp Marine Engineering dominate global shipbuilding with STX Shipbuilding
Hyundai Samho Heavy Industries Hanjin Heavy Industries and Sungdong Shipbuilding amp Marine
Engineering also ranking among the top ten shipbuilders in the world In 2007 STX Shipbuilding further
strengthened South Koreas leading position in the industry by acquiring Aker Yards the largest
shipbuilding group in Europe (The former Aker Yards was renamed STX Europe in 2008) In the first
half of 2011 South Korean shipbuilders won new orders to build 25 LNG carriers out of the total 29
orders placed worldwide during the period
To maintain their market position Korean yards also focus more and more on greening opportunities
The Korean government introduced a GHG emission reducing program in 2008 The program is aiming
at reducing GHG emissions throughout all economic sectors including the shipping and shipbuilding
industry Also the Japanese Shipbuilding Association (SAJ) is looking into the possibilities to reduce
GHG emissions so that the shipbuilding industry becomes greener and more competitive (Ecorys
2012)
Japan
Japan had been the dominant ship building country from the 1960s through to the end of 1990s but
gradually lost its competitive advantage to the emerging industry in South Korea which had the
advantages of much cheaper wages strong government backing and a cheaper currency South Korean
production overtook Japans in 2003 and Japanese market share has since fallen sharply
The Philippines
The Philippines has placed fourth among shipbuilding nations around the world producing more than
six million deadweight tonnes of ships built in 2012 The country is anchored by South Korean Hanjin
and Japans Tsuneishi shipbuilders The country has shipyards in Subic and Cebu
TRANL15371 33
Europe
For several decades European shipyards have been facing strong global competition from especially
Asian enterprises (Japanese yards in the 1950s and 60s Koreans from the 1970s and 80s and Chinese
since the 1990s) In Europe this has led to an almost complete exit from the mass production segments
of tankers bulkers and containerships Response of the EU industry has been to focus on the higher
value more complex ship types such as ferries and passenger ships non-cargo vessels and general
cargo ships In addition only limited numbers of vessels of the same type are being built (in contrast
with bulk vessels which are mass produced) Europe has a 77 percent market share in building
passenger vessels (including both cruise ships as well as ferries) and a 17 percent share in the
construction of non-cargo vessels (Ecorys 2012) These segments make up a relatively small share of
the world orderbook (in CGT) However in value they represent a much higher share due to their
relatively sophisticated characteristics The position of the European shipbuilding industry in the
manufacturing of specialised innovative vessels is still strong At the same time European equipment
manufacturers have acquired a leading role in quality products especially in complex high value
equipment components
Figure 15 World orderbook and CESA orderbook by ship type in 2010 (CGT x 1000) (Source Ecorys 2012)
Regarding the marine equipment sector the European industry is renowned for propulsion cargo
handling communication automation environmental and security systems This equipment is not only
destined for complex European-built ships but also exported to Asian yards whether or not requested
by their clients (Ecorys 2012)
Compared to the ship construction sector the marine equipment segment is highly heterogeneous and
consists of companies that are often also active in other business areas (ie automotive or aircraft
industry) A study by (BALance 2014) found that the European marine equipment industryrsquos
TRANL15371 34
competitiveness lies in a strong market position and technological leadership at least for globally active
European marine supply companies who build their position on a strong infrastructure and co-operative
partners skill of their employees and close relationship with their customer base Conversely identified
weaknesses are the cost level in Europe and the heterogeneous structure of the industry with many
SMEs which hinder in some cases attempts to follow the markets by globalisation strategies
Turkey
Shipbuilding in Turkey has evolved from an old traditional activity in Anatolia to an internationally
recognised industry especially since the early 1990s The industry has modern shipyards that can build
ships yachts mega-yachts and sailing boats as well as carrying out extensive repair and conversion
works Turkeyrsquos shipyards are mainly located in the Marmara Region namely Tuzla Yalova and İzmit
which have developed into dynamic shipbuilding centres Also in recent years the emerging Black Sea
and Mediterranean Regions have increasingly attracted shipyard investments
In the last decade in parallel with developments in the global market Turkish shipbuilding experienced
a several-fold increase in its shipbuilding and export capacity including a significant product
diversification According to order books this resulted in Turkey being regularly placed in the top ten
countries on the basis of its deadweight (dwt) production and in the top five countries by the number
of ships
In recent years Turkey has increasingly tapped into niche markets which in turn has led to a growing
participation by Turkish shipyards in the international trade in new ships In parallel there has also
been strong growth in the marine equipment manufacturing sector which could increasingly also tap
the export market These developments reflect in part the strategic location of the yards the
experienced workforce the quality of production and Turkeyrsquos significant role as a political cultural and
economic bridge between Europe and Central Asian and Middle Eastern economies (OECD 2011)
ECOFYS Netherlands BV | Kanaalweg 15G | 3526 KL Utrecht| T +31 (0)30 662-3300 | F +31 (0)30 662-3301 | E infoecofyscom | I wwwecofyscom
ECOFYS Netherlands BV
Kanaalweg 15G
3526 KL Utrecht
T +31 (0) 30 662-3300
F +31 (0) 30 662-3301
E infoecofyscom
I wwwecofyscom
HOW TO OBTAIN EU PUBLICATIONS
Free publications
bull one copy
via EU Bookshop (httpbookshopeuropaeu)
bull more than one copy or postersmaps
from the European Unionrsquos representations (httpeceuropaeurepresent_enhtm)
from the delegations in non-EU countries
(httpeeaseuropaeudelegationsindex_enhtm)
by contacting the Europe Direct service (httpeuropaeueuropedirectindex_enhtm)
or calling 00 800 6 7 8 9 10 11 (freephone number from anywhere in the EU) () () The information given is free as are most calls (though some operators phone boxes or hotels may charge you)
Priced publications
bull via EU Bookshop (httpbookshopeuropaeu)
Priced subscriptions
bull via one of the sales agents of the Publications Office of the European Union
(httppublicationseuropaeuothersagentsindex_enhtm)
doi 102834880780
ML-0
1-1
5-4
39-E
N-N
[Ca
talo
gu
e n
um
be
r]
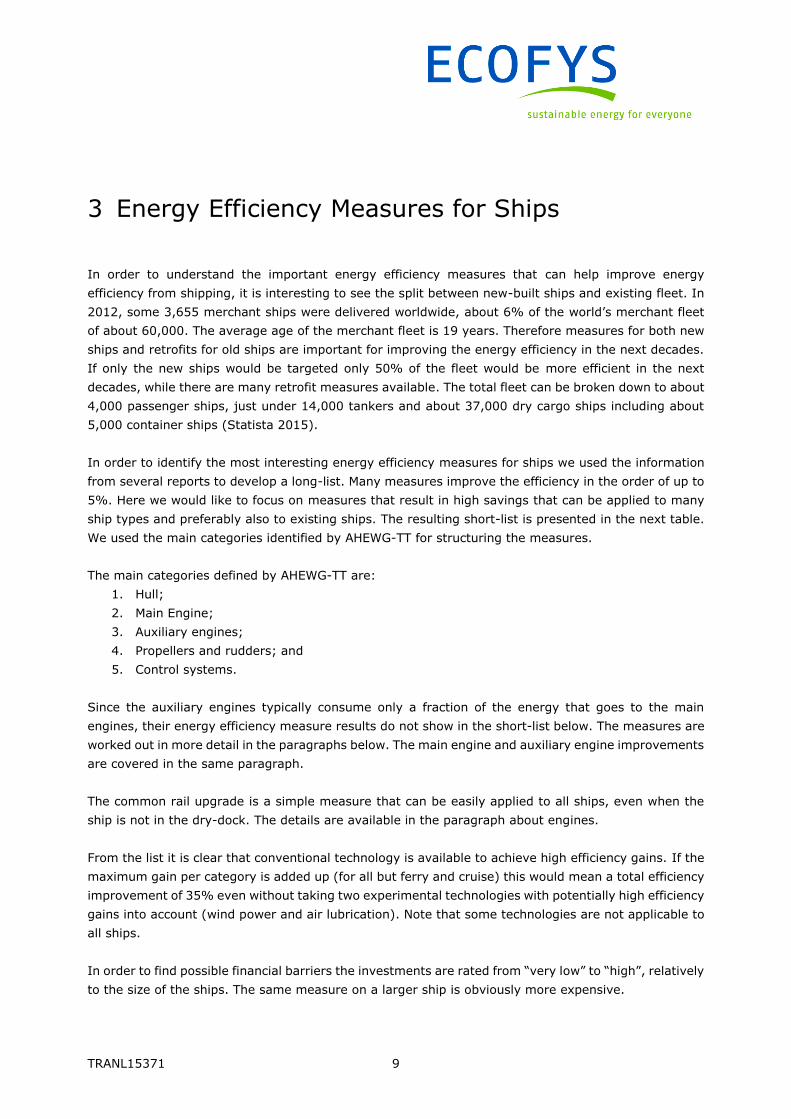
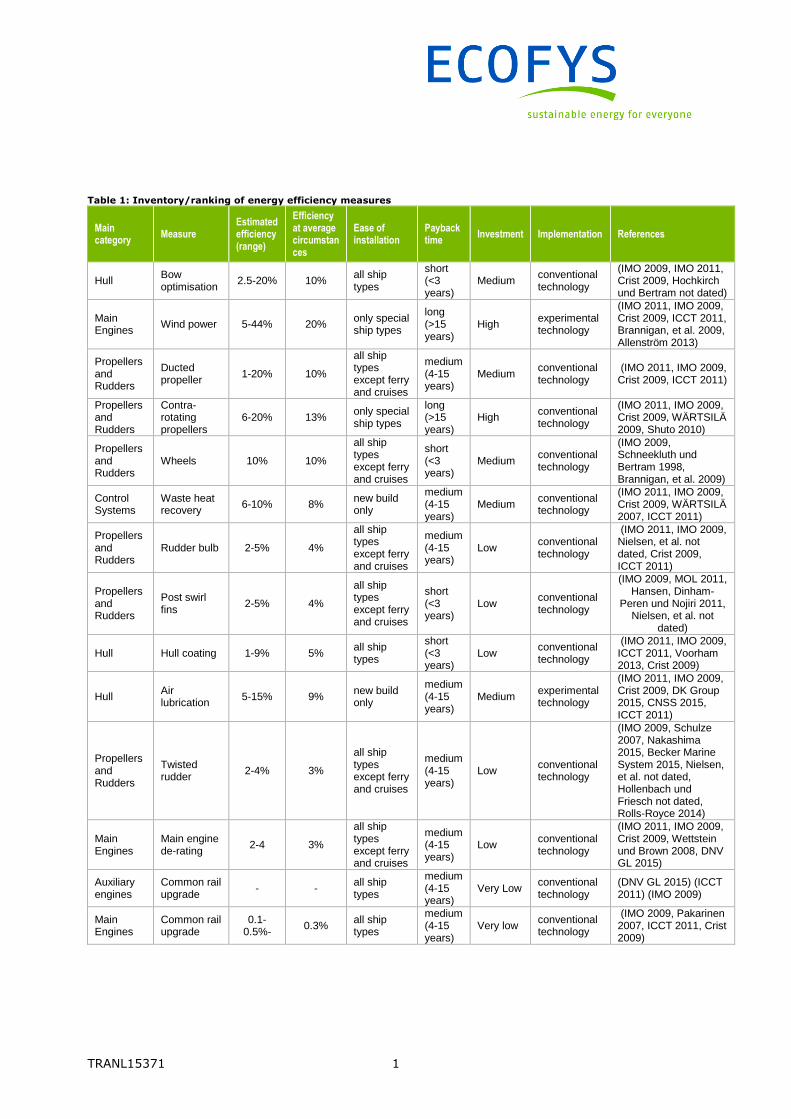
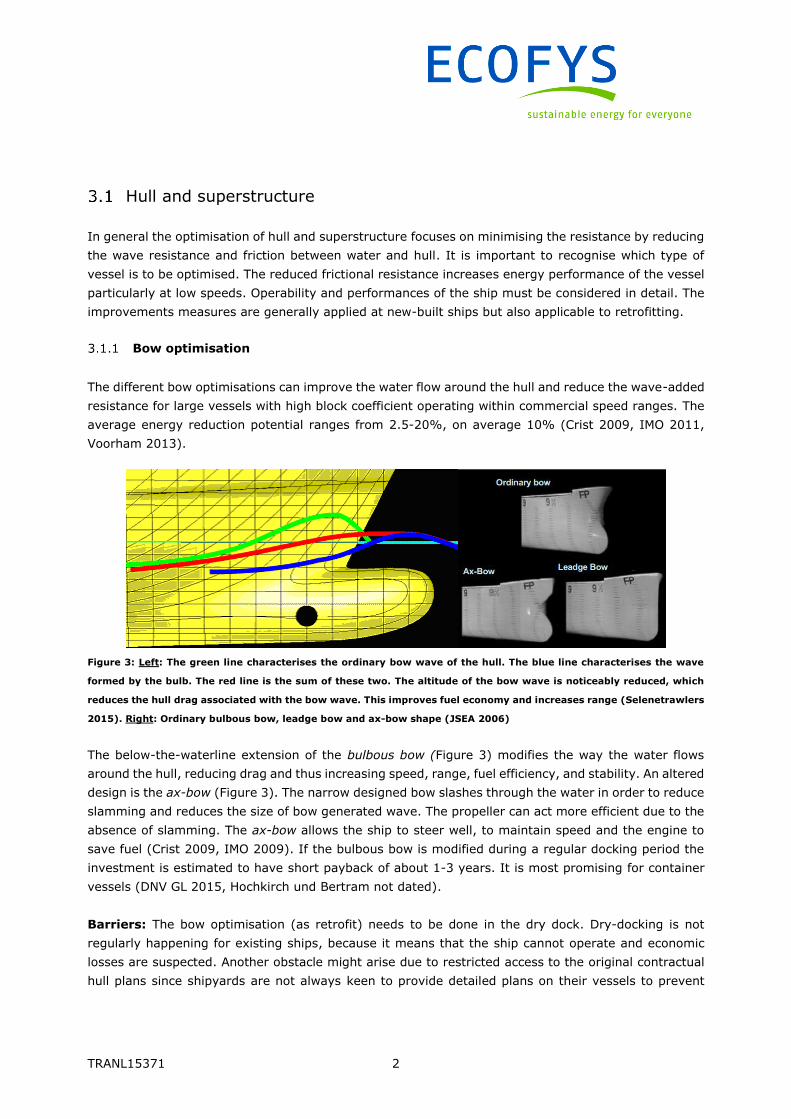
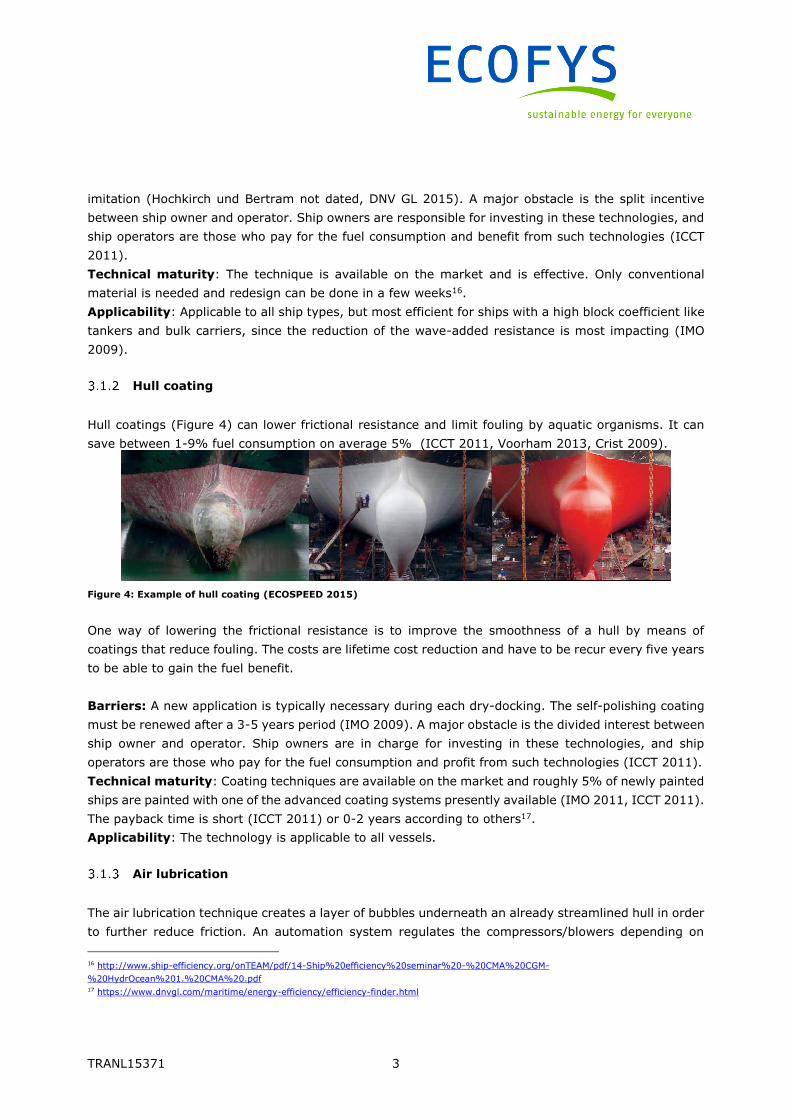
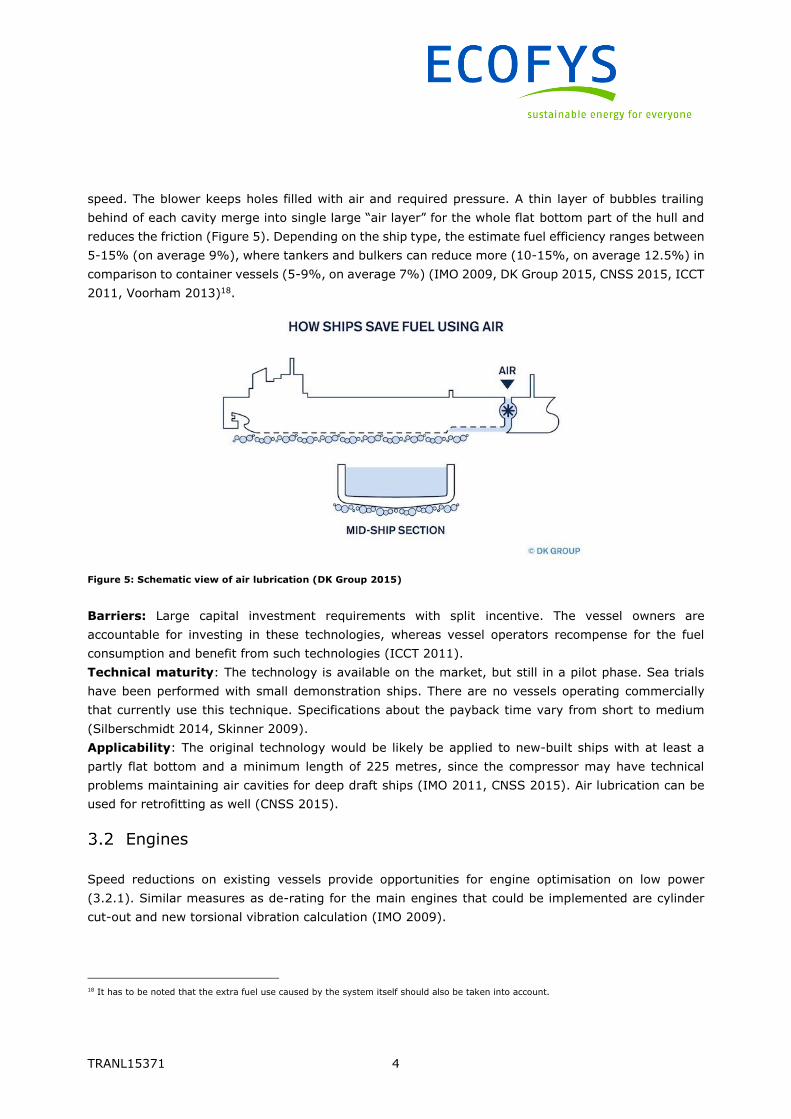
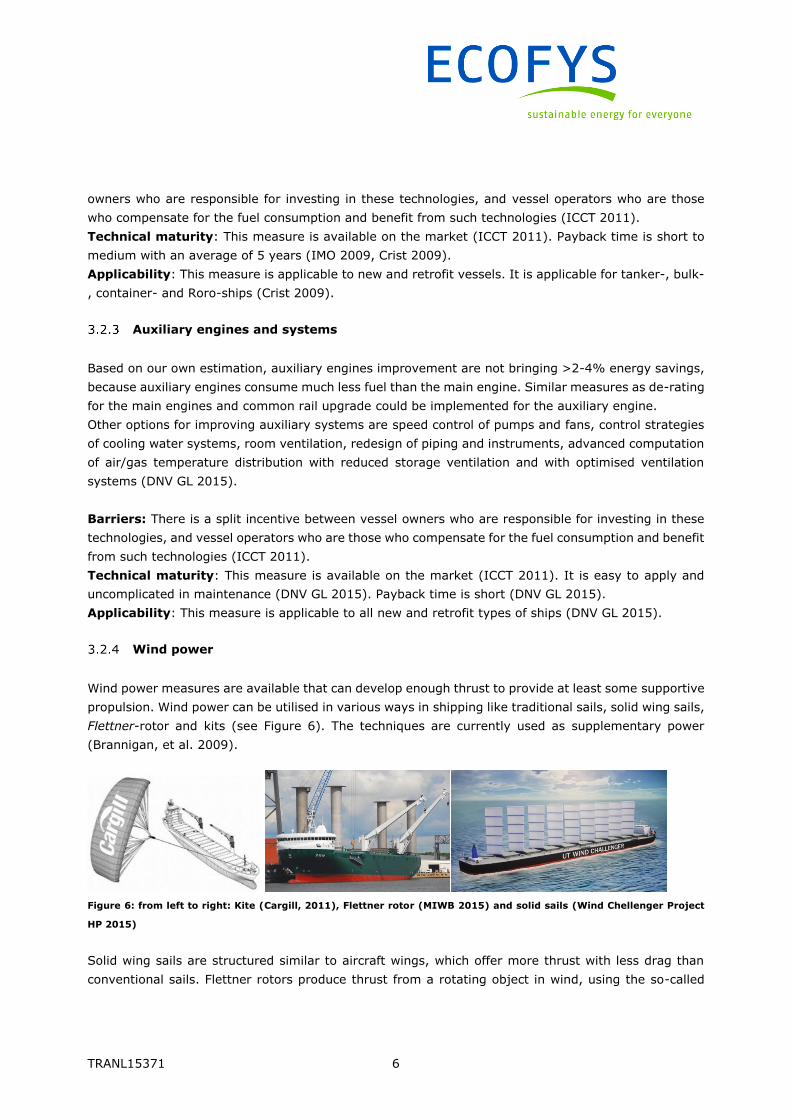
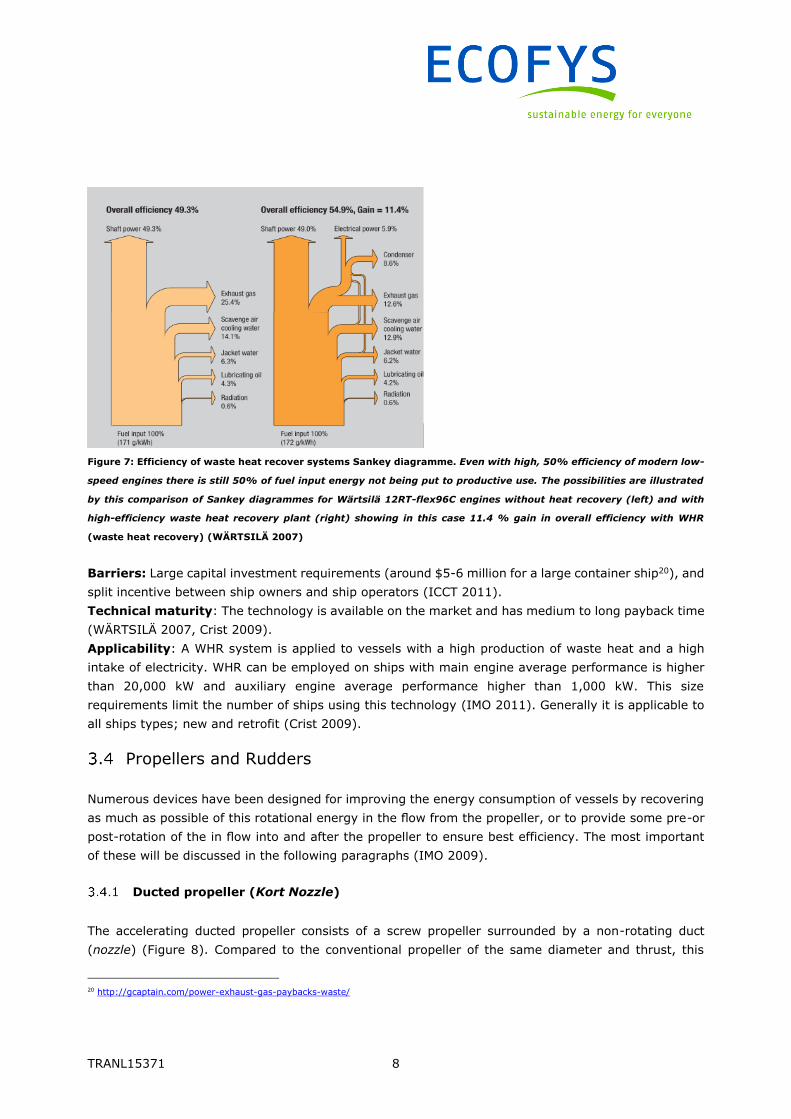
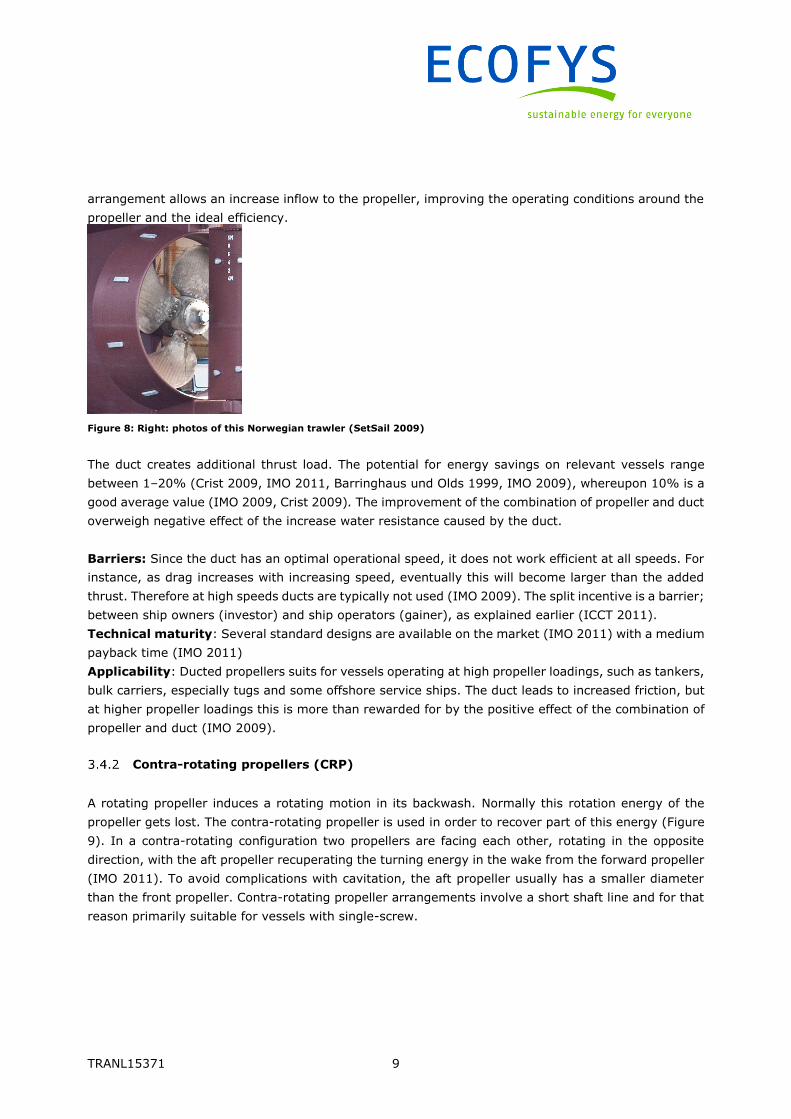
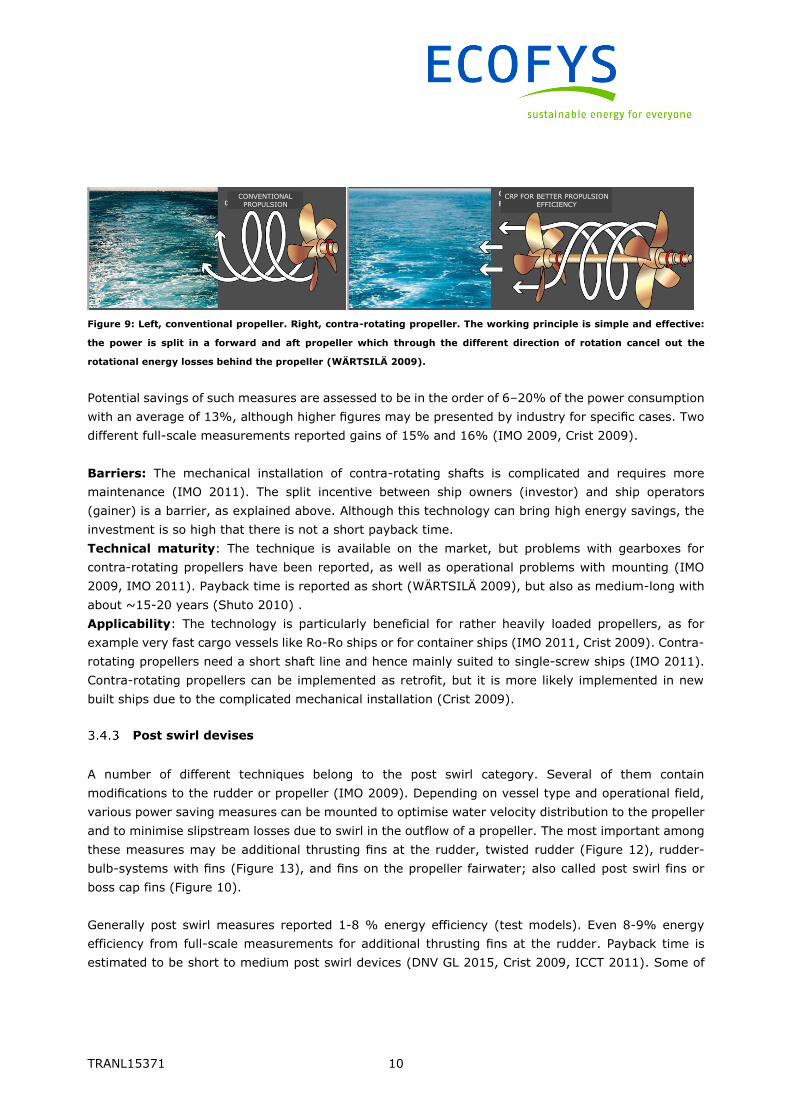
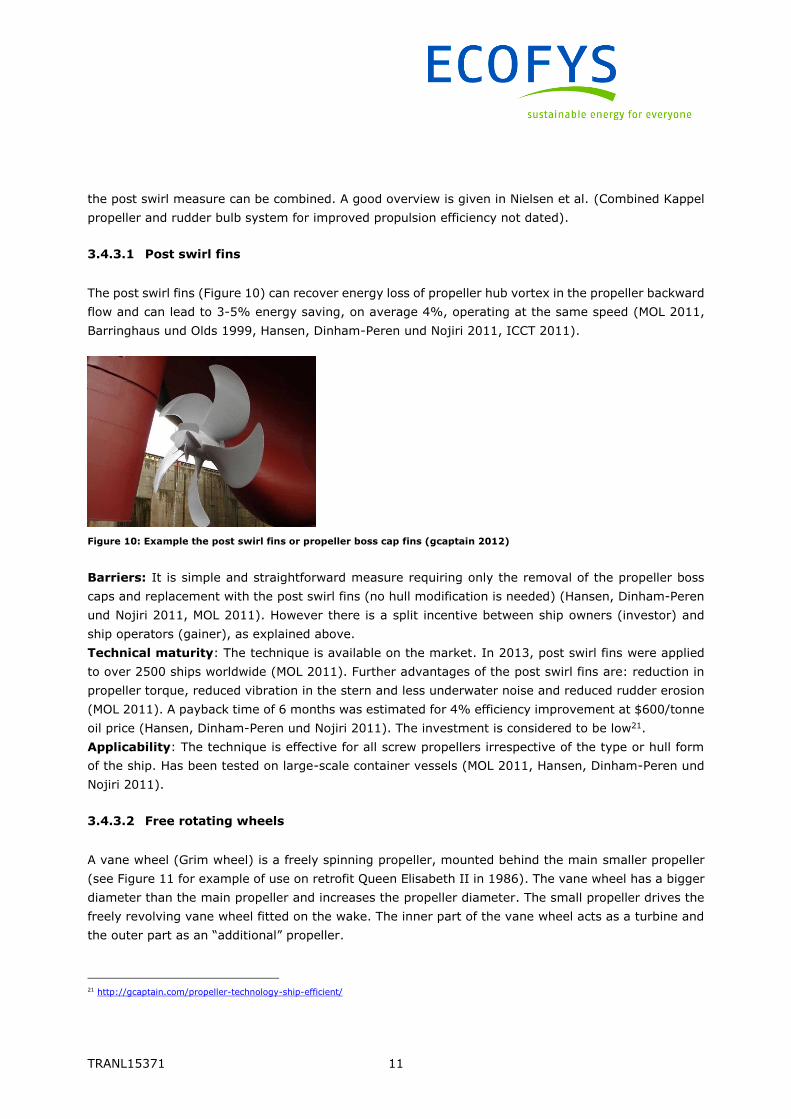
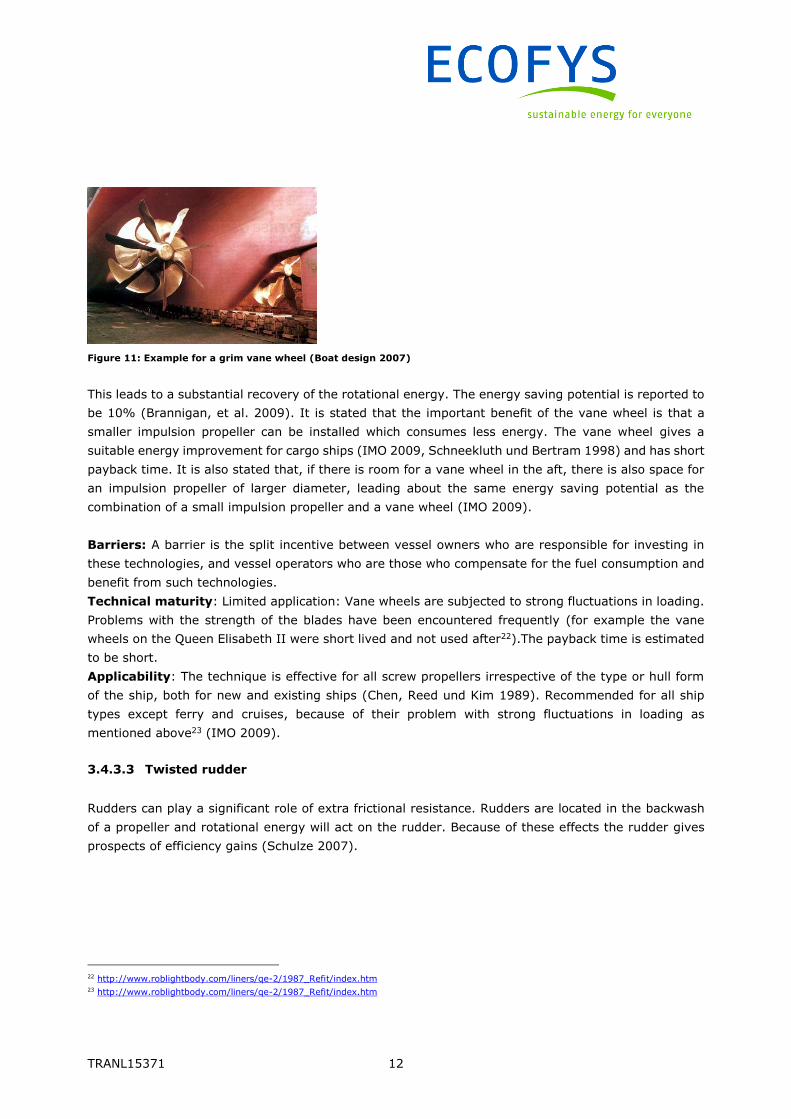

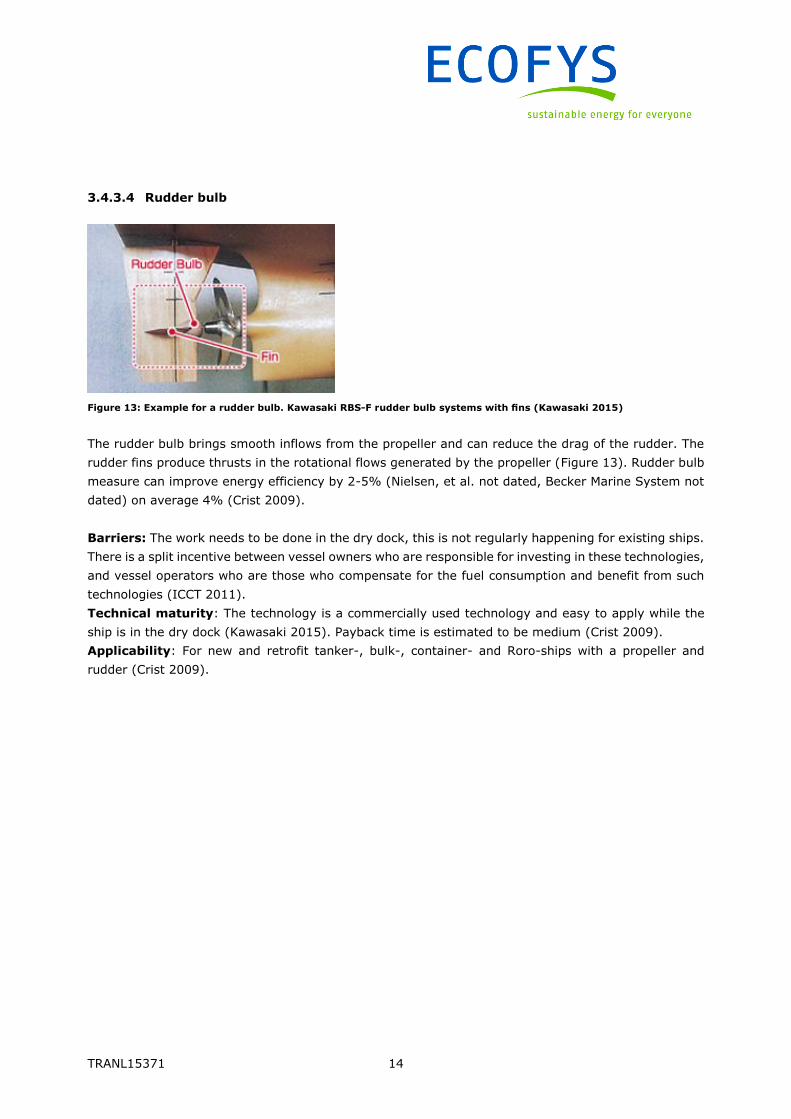
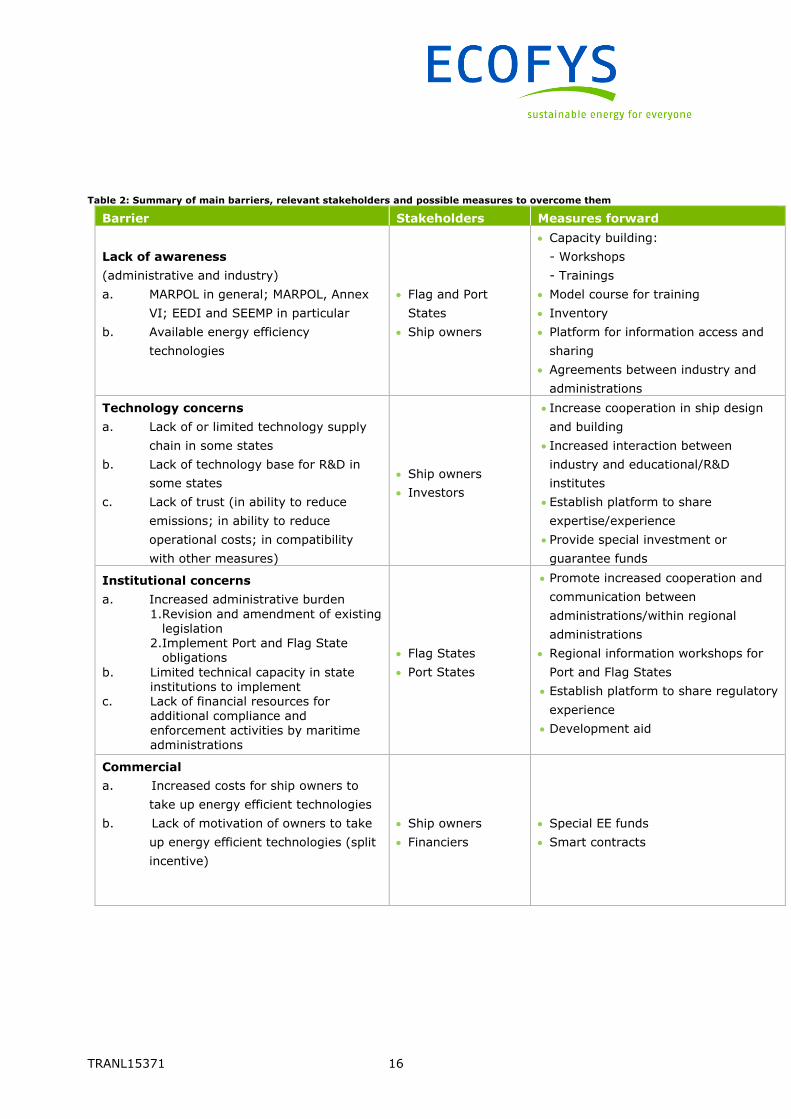


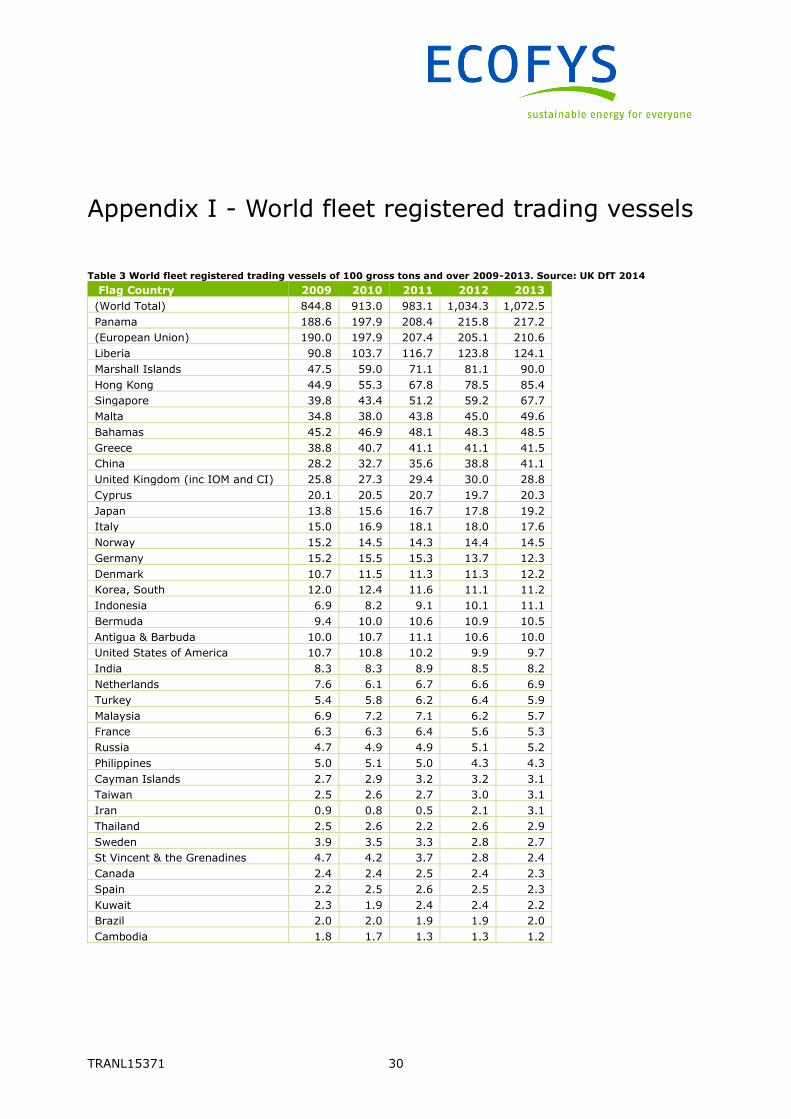
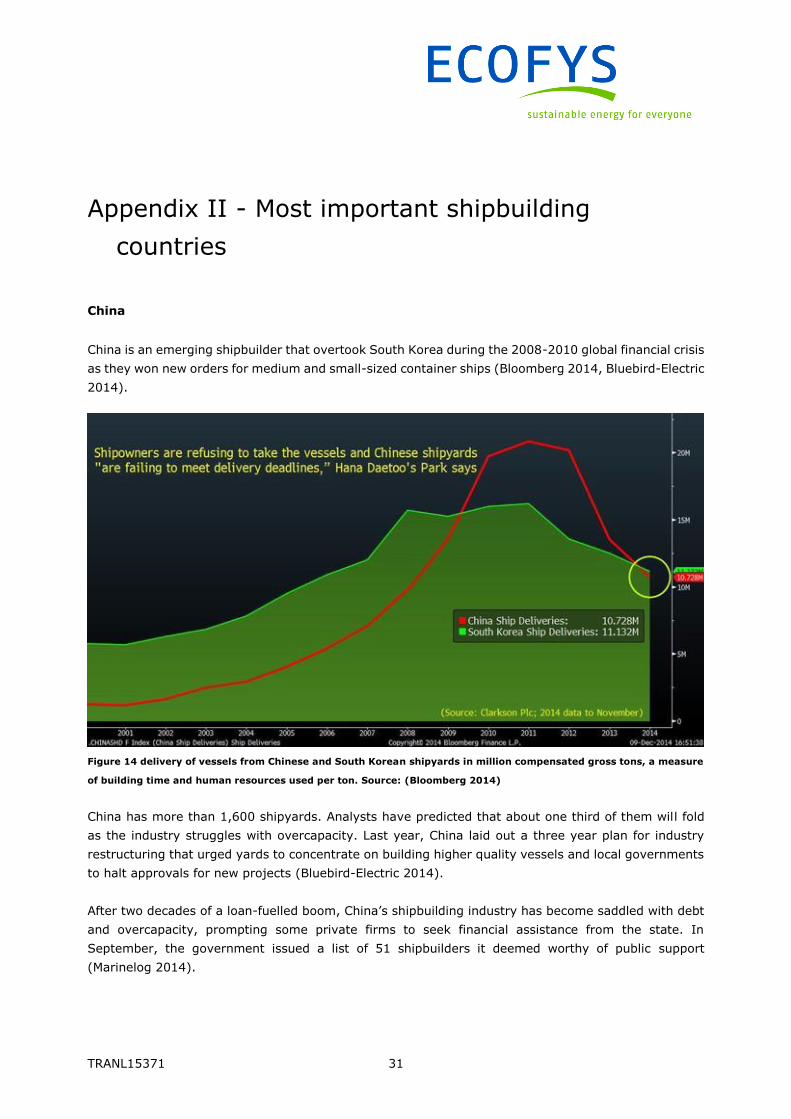
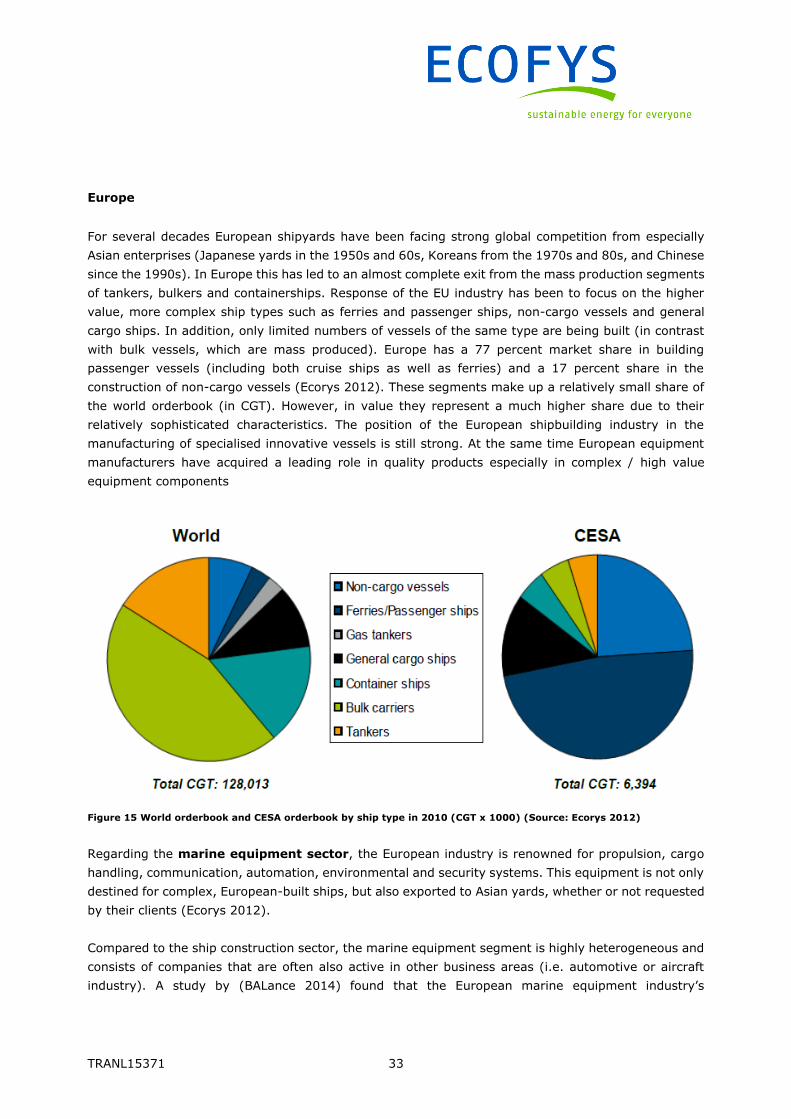


Recommended