TCOM 540
Session 3

Agenda
• Quiz
• Review Session 1 homework
• Address real-world data issues
• Start using DELITE
The Real World – Getting Data
• A network design is only as good as the data that supports it– Traffic data– Cost data
The Real World – Getting Data (2)
• Different types of information are needed and available for – Voice networks – Data networks

Voice Traffic Data
• Realistically, most large users acquire voice by a Virtual Private Network (VPN) approach– This may change in future - e.g., VoIP
• That is, user buys a service, not a network• Traffic rides on common user infrastructure
of IXC– Takes advantage of economies of scale

Voice VPN
IXC “cloud”IXC “cloud”
IXC POPCO
User Site AIXC = InterExchange CarrierPOP = Point of PresenceCO = Central Office (Local Exchange Carrier)
User Site B
User Site D
User Site C
User Site E
Access lines
Offnet

Voice Traffic Data Needs
• What data is needed to acquire a VPN?– Your sites (i.e., on-net locations)– Traffic matrix (i.e., point-to-point traffic file)
for on-net traffic– Site-to-offnet traffic– Optionally, time-of-day profiles– Features required and usage

Voice Traffic Data Sources
• Current carrier should provide Call Detail Records (CDR)– Originating #, terminating #, time of day, duration,
features used, charges
• CDR may require considerable manipulation to provide useful data– Format changes– Site identification– Large number of records (millions per month for a
large organization)

Call Detail Records – Additional Information
• http://www.cisco.com/univercd/cc/td/doc/product/voice/vpdd/cdd/3_1/cdr.htm
• http://www.qwest.com/wholesale/clecs/output.html
Voice Traffic Data Sources (2)
• If CDR not available, may have to estimate traffic based on site size (people) and assumed calling patterns

Voice VPN Costs
• Basic price structure is usually fairly simple– Postalized CONUS on-on, on-off, and off-off
rates– Off-net access (i.e., switched access) usually
included– On-net access (usually dedicated not switched)
is not included• May be available from carrier as pass-through from
LEC tariff

Voice VPN Costs (2)
• Reliable comparative price information not easily available– AT&T no longer dominant carrier– Best prices are in private contracts between
carrier and customer• Carriers supposed to post tariff-equivalent
information, but usually partial, obscure or missing
– Private services such as Valucom, CCMI provide some tariff/contract information
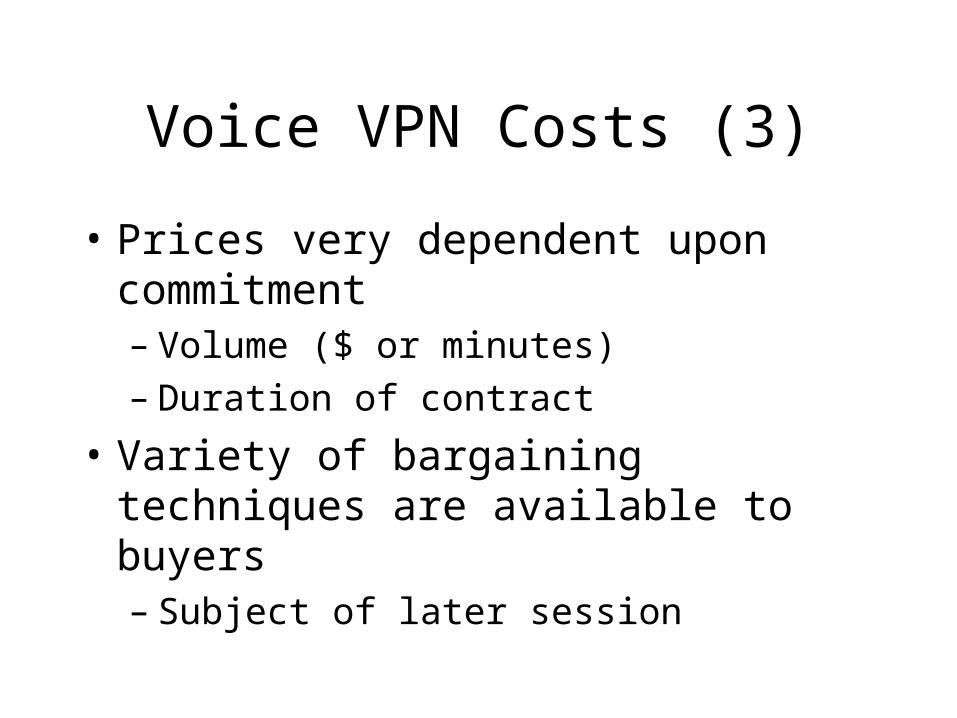
Voice VPN Costs (3)
• Prices very dependent upon commitment– Volume ($ or minutes)– Duration of contract
• Variety of bargaining techniques are available to buyers – Subject of later session

Data Traffic Data• Data is much more complicated than voice• Different types of traffic
– File transfer
– Database access
– Web browsing
– VoIP
– Streaming video
– Etc., etc.
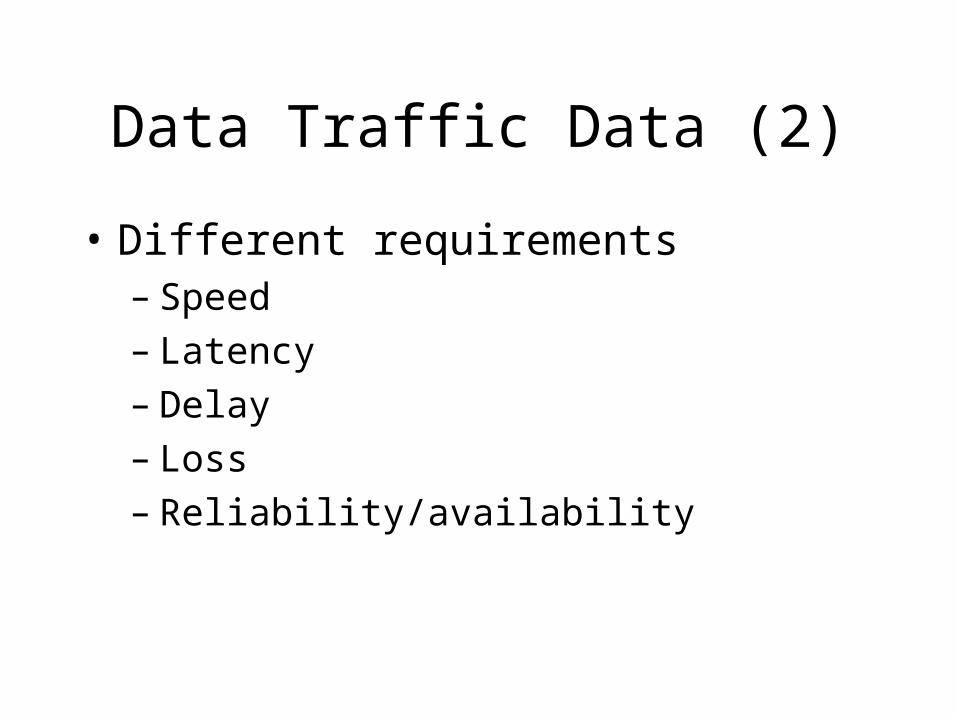
Data Traffic Data (2)
• Different requirements– Speed– Latency– Delay– Loss– Reliability/availability

Data Traffic Data (3)
• Information often less complete and more difficult to acquire than for voice– Exact traffic for applications riding on the network may
only be known to the “owner” of the application
– Telecom supplier will probably only provide information needed for billing
– Equipment such as routers and concentrators (e.g., Cisco MC3810) can be configured to collect traffic data, but usually aren’t …
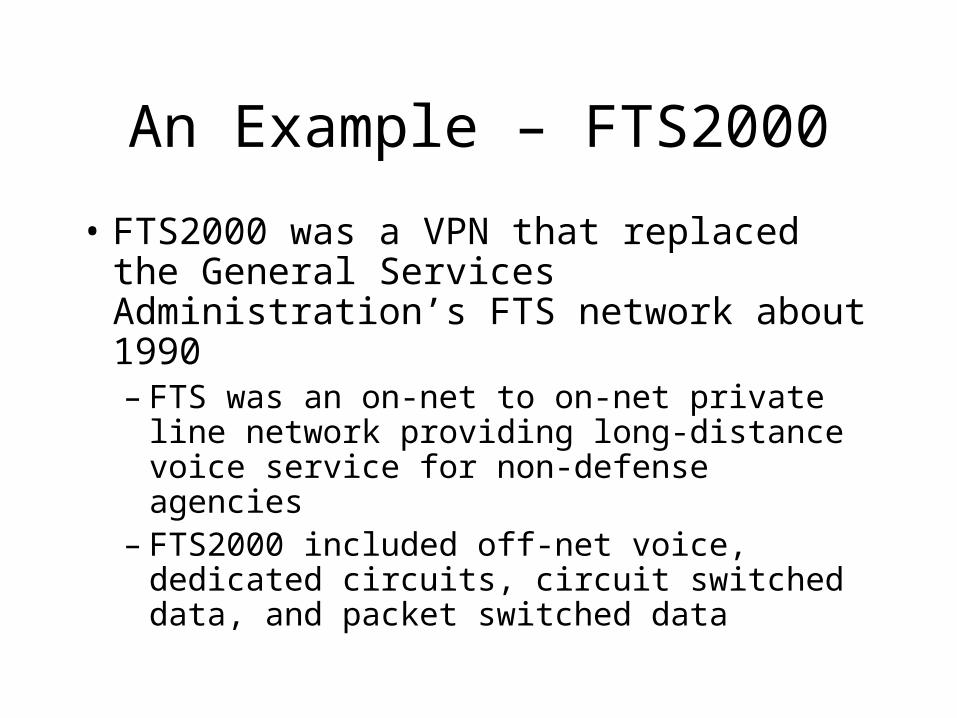
An Example – FTS2000
• FTS2000 was a VPN that replaced the General Services Administration’s FTS network about 1990– FTS was an on-net to on-net private line
network providing long-distance voice service for non-defense agencies
– FTS2000 included off-net voice, dedicated circuits, circuit switched data, and packet switched data

FTS2000 (2)
• Only on-net to on-net voice data available– Very limited response to surveys of customer agencies
• Projected data, off-net voice and inbound WATS requirements (i.e., 800 service) requirements as proportional to voice traffic
• Constant of proportionality for 800 service was chosen as 2.5%– Wanted to have some representation, but not enough to
unduly influence the selection

FTS2000 (3)
• Actual 800 service traffic was much higher– Approximately equal to on-net voice– Main sources were IRS and SSA
• Overall voice traffic was about three times the estimate– Because the prices declined with increasing
volume, network was significantly more cost-effective than projected

Traffic Generators
• The preceding example showed the use of a traffic generation algorithm– Which turned out to be not very accurate as a
predictor of actual traffic …– Cahn also gives a couple of examples of real
cases where traffic generators had to be used
• May need to generate both traffic and costs

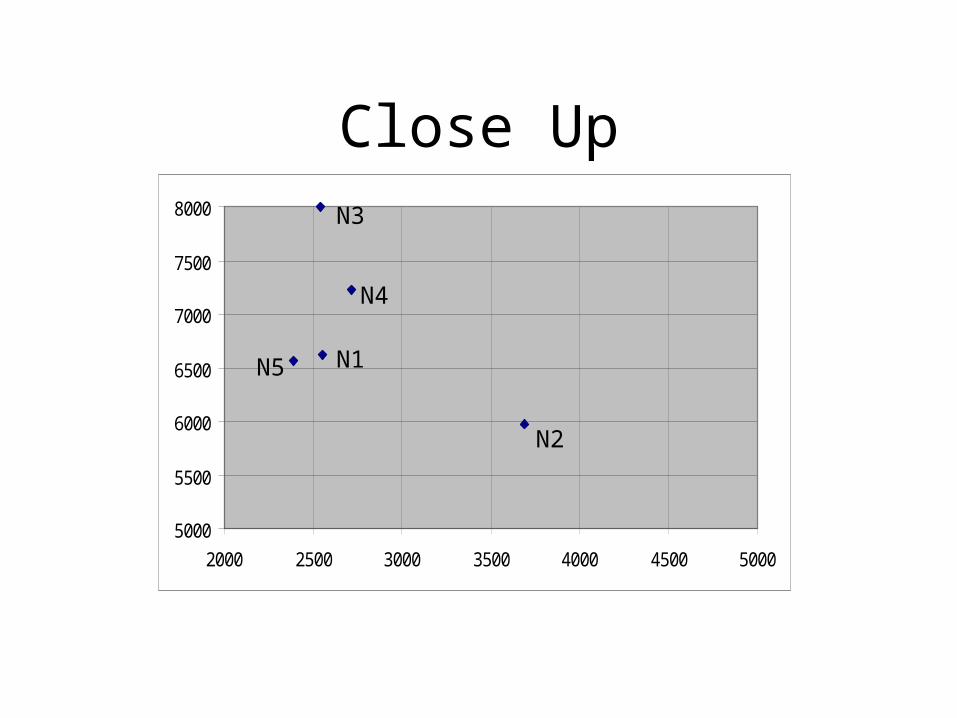
A Small Complete Design
• 5 nodes at specific locations (V&H)• Types of links available for use (capacities)
– Formula to convert bps on links to packets per second at nodes
• Traffic• Link costs• Switch capabilities• Other miscellaneous data
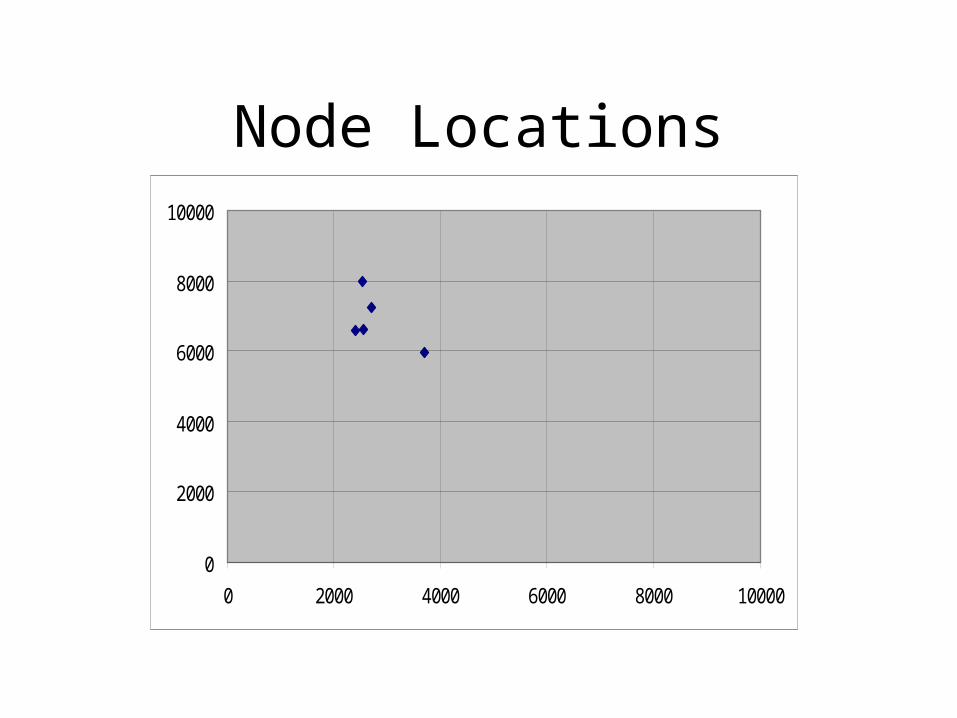
Node Locations
0
2000
4000
6000
8000
10000
0 2000 4000 6000 8000 10000
5000
5500
6000
6500
7000
7500
8000
2000 2500 3000 3500 4000 4500 5000
Close Up
N1
N2
N3
N4
N5

Lines and Traffic
• Line T1, speed = 1000000
• Traffic – each node sends 10000 to each other node– How many entries in traffic table?
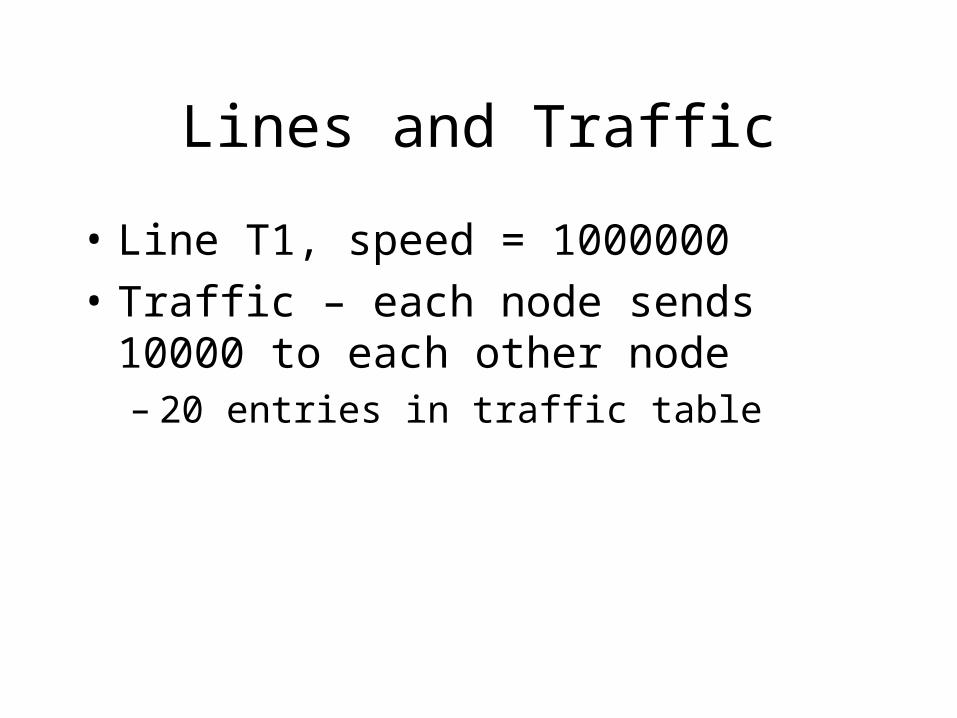
• Line T1, speed = 1000000
• Traffic – each node sends 10000 to each other node– 20 entries in traffic table
Lines and Traffic
Cost
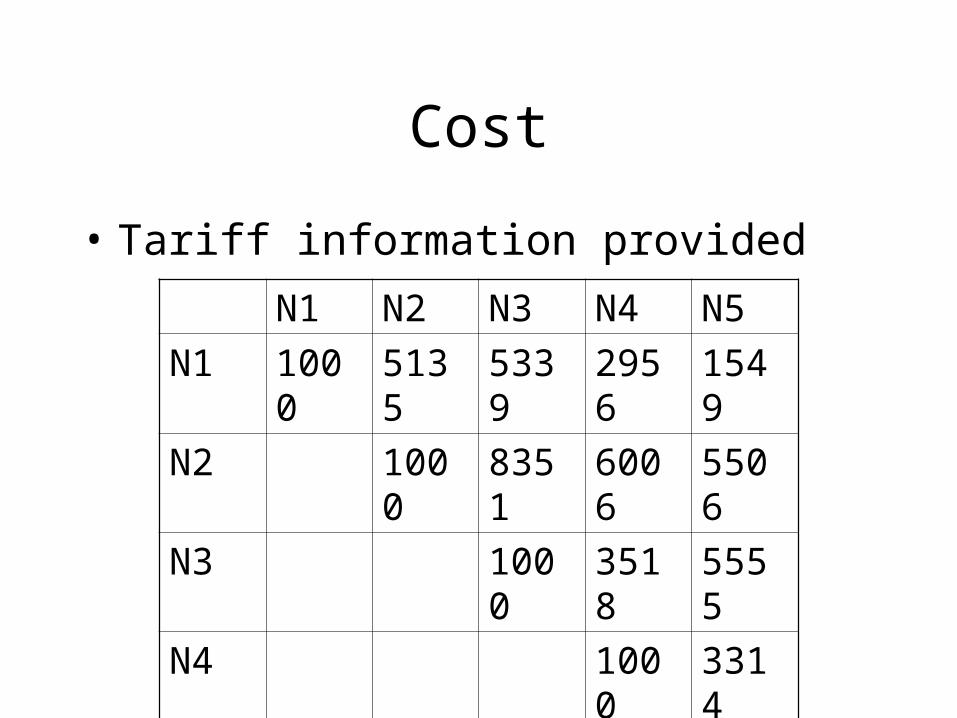
• Tariff information provided
N1 N2 N3 N4 N5
N1 1000 5135 5339 2956 1549
N2 1000 8351 6006 5506
N3 1000 3518 5555
N4 1000 3314
N5 1000

Comparison of Cost and Distance
N1 N2 N3 N4 N5
N1 1000 5135 5339 2956 1549
N2 1000 8351 6006 5506
N3 1000 3518 5555
N4 1000 3314
N5 1000
Cost Distance
N1 N2 N3 N4 N5N1 1307 1372 617 172N2 2324 1581 1424N3 795 1440N4 730N5

Cost as a Function of Distance
• Cost = 1000 + 3.2*distance
Equipment
• Costing site equipment is one of the more complex parts of the process in real life– Many suppliers, models, capabilities– Switches, routers, multiplexers, etc., all have
different characteristics
• The equipment table makes fairly gross simplifications to render the problem tractable
Equipment (2)
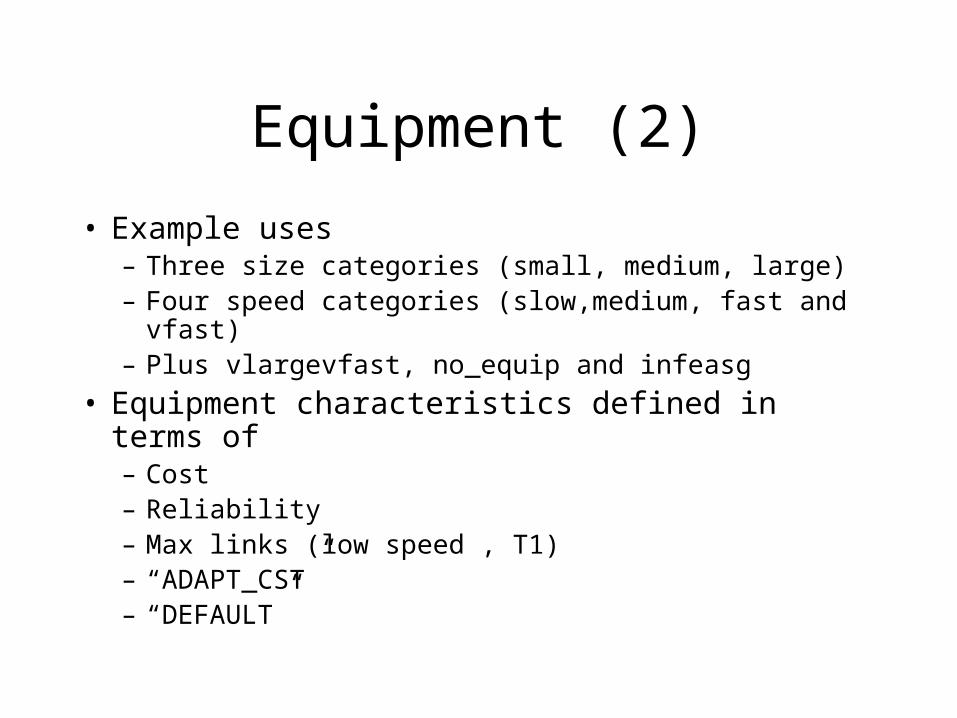
• Example uses – Three size categories (small, medium, large) – Four speed categories (slow,medium, fast and vfast)– Plus vlargevfast, no_equip and infeasg
• Equipment characteristics defined in terms of– Cost– Reliability– Max links (low speed , T1)– “ADAPT_CST” – “DEFAULT”

Scaling
• If we have a 100-node problem rather than a 5 node problem– Line types, equipment, and other parameters
tables may not change at all– Sites table grows to 100 rows– Traffic table could grow to 10,000 rows– Cost table could grow to 4,950 rows

Homework Session 3
• Read Cahn, Chapter 5
• Do exercises 4.3, 4.4
• Download and implement DELITE
• Read Soltys in the Telecommunications Review
Recommended