Telematics and Informatics 27 (2010) 418–432
Contents lists available at ScienceDirect
Telematics and Informatics
journal homepage: www.elsevier .com/locate / te le
Technological innovations and 3G mobile phone diffusion: Lessonslearned from Japan
Sheikh Taher Abu *
Graduate School of Applied Informatics, University of Hyogo, 1-3-3, Higashi-Kawasaki-cho, Chuo-ku, Kobe 650-0044, Japan
a r t i c l e i n f o a b s t r a c t
Article history:Received 29 September 2009Received in revised form 4 February 2010Accepted 11 March 2010
Keywords:3G mobile phoneTechnological innovationCompetition policyPanel data analysisValue-added servicesSmall gadget
0736-5853/$ - see front matter � 2010 Elsevier Ltddoi:10.1016/j.tele.2010.03.001
* Tel.: +81 80 3835 1977; fax: +81 78 367 8625.E-mail address: [email protected]
Technology and innovation become more important determinants of corporate competi-tiveness, and the telecommunications sector is no exception. A good example is found inthe development of the mobile phones. Technological development, embodied in innova-tive functions developed from the first (1G) to third generation (3G) systems, has playedsignificantly important roles in the growth and upheavals of the Japanese mobile phonemarket. In addition, development in contents, value-added services which are suppliedby related firms formed in the vertical structure, charging systems, handset development;all these have made this small gadget an increasingly important part of daily life.
This paper heuristically analyzes the effect of technological innovations and competitionpolicies on the diffusion of 3G mobile phones in Japan. In particular, this paper attempts toidentify what are factors to promote the Japanese 3G mobile phone by using panel dataanalysis. In constructing an estimation model, the number of subscribers to 3G mobilephone services is taken as a dependent variable, while the following three groups of vari-ables (1) GDP and charges, (2) competition policies, and (3) technological innovations areselected as independent variables. The study examines not only the 3G market as a wholebut also the three major individual carriers, namely NTT DOCOMO, au (KDDI) and Softbank.In particular, the latter focuses on the different strategies of the three carriers toward inno-vations and competition. Monthly data related to 3G mobile phones from October 2001 toDecember 2008 is used for the analysis.
� 2010 Elsevier Ltd. All rights reserved.
1. Introduction
The year 2001 was the first to adopt the 3G network among the world by Japanese mobile phone operators. NTT DOCOMOcommercially launched its 3G FOMA (Freedom of Mobile Multimedia Access) services in October 2001 for the first time. Fol-lowed by DOCOMO, au and SoftBank (previously J-Phone and then Vodafone) introduced the 3G services commercially inApril 2002 and in December 2002, respectively. Both DOCOMO and SoftBank use W-CDMA (Wideband Code Division Multi-ple Access) technology for 3G networks, while au uses cdma2000 1x technology. In addition, another mobile phone operatorentered into the market in June 2007 which is EMOBILE Ltd., offer only 3G services using W-CDMA technology.
The adoption of mobile phones in Japan started in 1979, when only wealthy customers could access this technologicaladvancement. For the time being, different policy measures from government, innovation in services and technologicaldevelopment from individual operators and content providers made the market play into full swing. Though there is a greatdeal of research on mobile phones around the world, we have found only a few empirical studies focusing on the effect oftechnology and innovation on the diffusion of 3G mobile phones, particularly in Japan.
. All rights reserved.
S.T. Abu / Telematics and Informatics 27 (2010) 418–432 419
In respect to mobile phone diffusion in the world, Ahn and Lee (1999) were first to undertake a cross-country modeling ofmobile services using ITU (International Telecommunication Union) data for 1 year. They found a complementary relation-ship between mobile and wireless services. Substitution effect between mobile and fixed-telephone was estimated by Mad-den and Coble-Neal (2004) using ITU data 1994–2000 in a lagged dependent variable model. They found that mobile phonescan be a substitute for fixed-telephones in many countries. Banerjee and Ros (2004) found that technological substitution insome countries and economic substitution in others can explain the differential patterns of development in global fixed andmobile telephony. Many of the diffusion studies are based on econometric, relying on aggregate measures of mobile phonepenetration, compared across countries. Some researches explained penetration rates using geography, market competitionand the income level, such as Baliamoune-Lutz (2003), market competition by Rouvinen (2006), socio-cultural attributes andthe Internet, telecommunications use by Kamssu (2005) or national industry structure, pricing schemes and feature avail-ability by Kshetri and Cheung (2002) and Minges (1999). Kim (2005) estimated the preferences of mobile phones in Koreafor IMT-2000 (International Mobile Telecommunication-2000) services by using the conjoint analysis. He identified threemajor players in the Korean mobile market attracted subscribers by providing services like video calling, global roamingand upgrade services via the mobile multimedia Internet.
In the case of the Japanese mobile phone market, Iimi (2005) focused on the demand for mobile phone services during1996–1999. A nested logit model was used to examine the influence of basic 2G services, including voice mail and specificdiscount packages offered by an individual carrier. He identified the effects of (a) price elasticity, (b) product differentiationof various carriers, and (c) network externalities increase the demand for mobile phones. Ida and Kuroda (2006) used amixed logit model to estimate demand for mobile phones services in Japan. They compared both 2G and 3G mobile phonesfor major carriers to find whether 3G can be a substitute for 2G by using survey data carried by MIC (The Ministry of InternalAffairs and Communications) and concluded that DOCOMO’s 2G services can be a substitute for its 3G. In case of au, 3G ser-vices were not substitute for DOCOMO’s 3G. Nelson (2004) analyzed the development of camera phone in Japan. She iden-tified technology, and social factors for the success of camera phone development.
Unlike the case with mobile phones, the diffusion of ADSL (Asynchronous Digital Subscriber Line) has been closely inves-tigated. Eisner and Waldon (2001), Kridel et al. (2001), and Crandall et al. (2002) utilized discrete choice methods to analyzecompetition of broadband market in the US. Tsuji and Tomizuka (2006) analyzed factors promoting Japanese ADSL by AHP(Analytical Hierarchical Process) analysis. They divided these factors into three types: deregulation, competition, and tech-nology, then calculated degrees of importance. Finally, they monetarily evaluated factors, in which competition mostly con-tributed the development of ADSL. Akematsu (2008) analyzed factors promoting ADSL based on the data of ADSL carriersusing the panel data analysis.
From the discussion above, this paper attempts to present a view of the effect of technological innovations for the diffu-sion of 3G mobile phone in Japan using panel data analysis. The research is based on monthly data collected from differentsources. In addition, the paper analyzes not only the whole market but also the three major carriers. Technology develop-ment related to services which have been developing rigorously involving music, electronic payment, digital TV, high speedInternet service, pricing strategy, taking all these services into consideration, this paper has conducted an empirical analysisto produce authentic results for the diffusion of 3G mobile phones which may serve as a model to upgrade services to 4G(fourth generation) mobile phones in near future.
2. Mobile telecommunication market
The mobile phone market in Japan, which is characterized by rapid technological development in different phases ofchanging market demand, induces carriers to harmonize their businesses according to needs of subscribers. As the sectoris highly services-intensive, technological innovations and new business models can play an increasingly important role.Operators under these circumstances are confronted with fierce competition due to short product life cycle and the pressureto differentiate their services.
2.1. Overview of the market
Three major carriers, DOCOMO, au, and SoftBank, have been dominating the market since the advent of the Internet inmobile phones in 1999. As of December 2008, the total number of subscribers amounted to 105.83 million, of whichDOCOMO alone holds 51.17% market share. In contrast, au and SoftBank holds 28.87 and 18.90% market share, respectively.
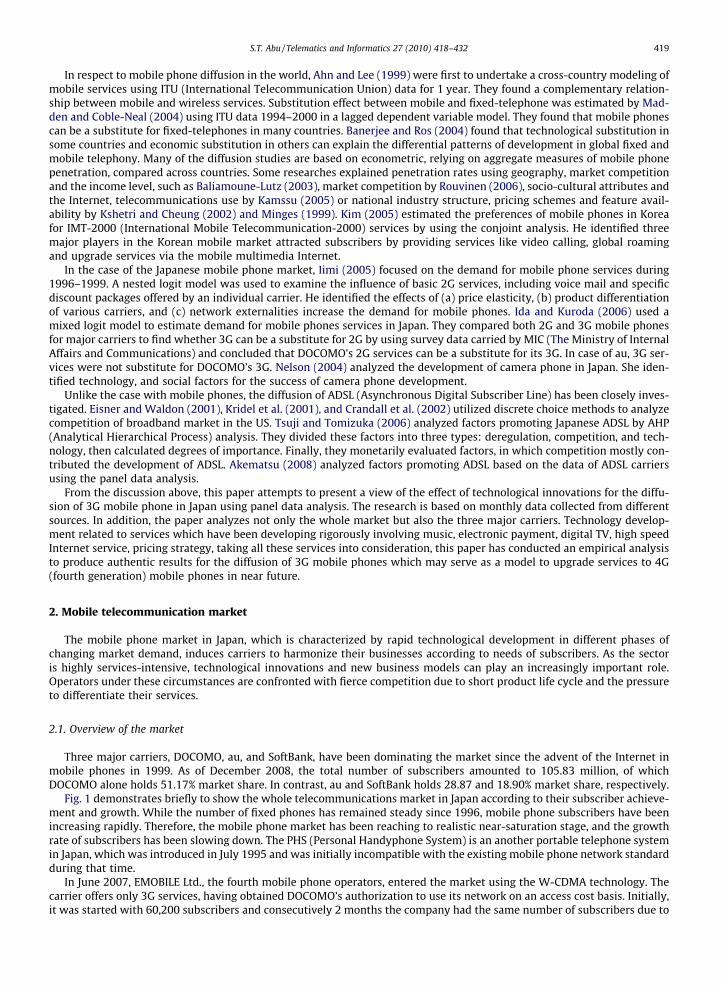
Fig. 1 demonstrates briefly to show the whole telecommunications market in Japan according to their subscriber achieve-ment and growth. While the number of fixed phones has remained steady since 1996, mobile phone subscribers have beenincreasing rapidly. Therefore, the mobile phone market has been reaching to realistic near-saturation stage, and the growthrate of subscribers has been slowing down. The PHS (Personal Handyphone System) is an another portable telephone systemin Japan, which was introduced in July 1995 and was initially incompatible with the existing mobile phone network standardduring that time.
In June 2007, EMOBILE Ltd., the fourth mobile phone operators, entered the market using the W-CDMA technology. Thecarrier offers only 3G services, having obtained DOCOMO’s authorization to use its network on an access cost basis. Initially,it was started with 60,200 subscribers and consecutively 2 months the company had the same number of subscribers due to
0.00
20.00
40.00
60.00
80.00
100.00
120.00
1996
1997
1998
1999
2000
2001
2002
2003
2004
2005
2006
2007
Mobile phoneFixed phone
PHS
Fig. 1. Transition in total number of subscribers (in millions). Source: White paper, MIC.
85.5%
50.0%50.6%50.8%46.8%
33.1%13.7% 31.8%34.6%39.8%
47.8%
65.5%
18.2%14.8%
9.4%5.4%
1.4%0.8%0%
20%
40%
60%
80%
100%
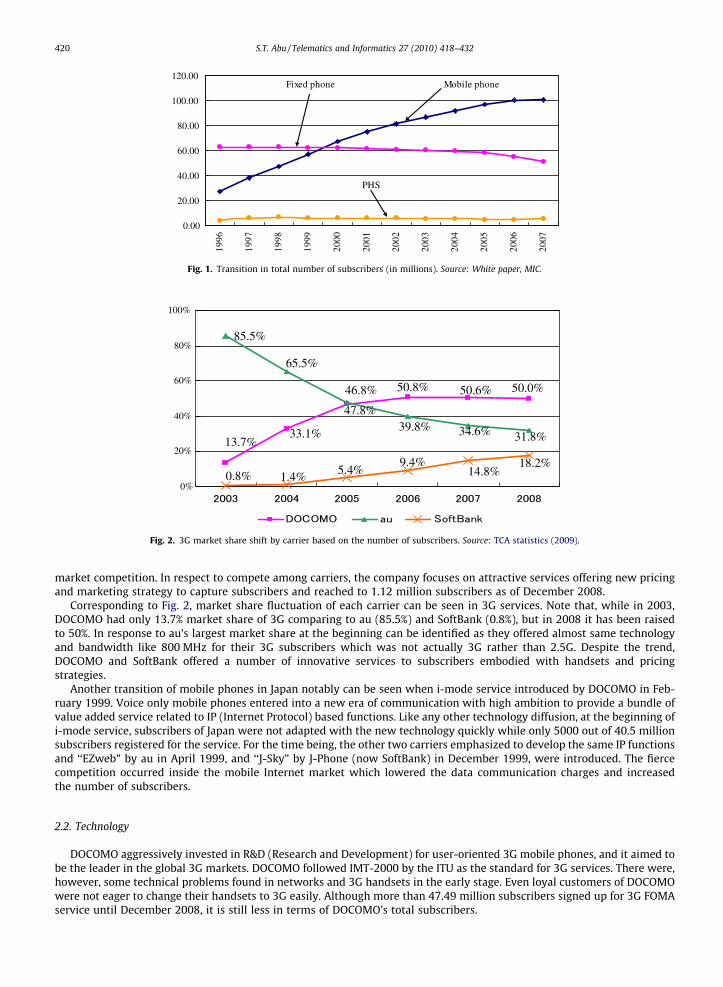
Fig. 2. 3G market share shift by carrier based on the number of subscribers. Source: TCA statistics (2009).
420 S.T. Abu / Telematics and Informatics 27 (2010) 418–432
market competition. In respect to compete among carriers, the company focuses on attractive services offering new pricingand marketing strategy to capture subscribers and reached to 1.12 million subscribers as of December 2008.
Corresponding to Fig. 2, market share fluctuation of each carrier can be seen in 3G services. Note that, while in 2003,DOCOMO had only 13.7% market share of 3G comparing to au (85.5%) and SoftBank (0.8%), but in 2008 it has been raisedto 50%. In response to au’s largest market share at the beginning can be identified as they offered almost same technologyand bandwidth like 800 MHz for their 3G subscribers which was not actually 3G rather than 2.5G. Despite the trend,DOCOMO and SoftBank offered a number of innovative services to subscribers embodied with handsets and pricingstrategies.
Another transition of mobile phones in Japan notably can be seen when i-mode service introduced by DOCOMO in Feb-ruary 1999. Voice only mobile phones entered into a new era of communication with high ambition to provide a bundle ofvalue added service related to IP (Internet Protocol) based functions. Like any other technology diffusion, at the beginning ofi-mode service, subscribers of Japan were not adapted with the new technology quickly while only 5000 out of 40.5 millionsubscribers registered for the service. For the time being, the other two carriers emphasized to develop the same IP functionsand ‘‘EZweb” by au in April 1999, and ‘‘J-Sky” by J-Phone (now SoftBank) in December 1999, were introduced. The fiercecompetition occurred inside the mobile Internet market which lowered the data communication charges and increasedthe number of subscribers.
2.2. Technology
DOCOMO aggressively invested in R&D (Research and Development) for user-oriented 3G mobile phones, and it aimed tobe the leader in the global 3G markets. DOCOMO followed IMT-2000 by the ITU as the standard for 3G services. There were,however, some technical problems found in networks and 3G handsets in the early stage. Even loyal customers of DOCOMOwere not eager to change their handsets to 3G easily. Although more than 47.49 million subscribers signed up for 3G FOMAservice until December 2008, it is still less in terms of DOCOMO’s total subscribers.
S.T. Abu / Telematics and Informatics 27 (2010) 418–432 421
DOCOMO believes that better technology may bring competitive advantages and customer satisfaction. In fact, i-modeincreasingly helped to attract subscribers for better services than before by providing different competitive services suchas email, browsing Internet comparing with its rivals. Although SMS (Short Message Service) was introduced to the marketin 1986, it ended shortly and pushed base email service by DOCOMO helped to achieve its market power because of i-modeinvention. To cope with changing trends, DOCOMO often emphasize on high speed Internet service such as HSPA (High SpeedPacket Access) and an updated new technology of FOMA, leading beyond 3G as well as 4G before 2010.
Table 1 illustrates the diversification of 3G technologies that have been frequently used by Japanese mobile phone oper-ators to provide the most sophisticated and user-oriented services among the world. au chose a US-developed 3G technol-ogy, cdma2000, which is different from the European technology, W-CDMA, which DOCOMO and SoftBank chose. au foundCDMA technology based on cdma2000 standards are capable of distinct carrier configurations, employing carriers with lowerbandwidth, could make a smooth transition from 2G to 3G, because of the backward compatibility to CDMA IS-95 (IntegratedStandard-95) systems within the CDMA technology family which requires lower data transmission rates compatible to 3Grequirements.
SoftBank is lagged behind in entering the 3G market, probably due to its global strategy. The company thus owns a min-imal share in this market.
The technological development from 2G to 3G such as W-CDMA and CDMA2000 was thus aimed at providing high speeddata communications. The maximum down load speeds of CDMA2000 and W-CDMA are 2.4 Mbps and 14.4 Mbps,respectively.
2.2.1. BandwidthWhile limited bandwidth was the main issue regarding proper spectrum allocation until 2000, the MIC initially appropri-
ated the 800 MHz and 1.5 GHz bands for second-generation mobile phones in 2000. As the number of mobile phone sub-scribers skyrocketed, however, the assigned frequencies became in such a heavy demand that it became impossible foradditional companies to enter the market without the allocation of new bandwidth. To correct this situation, and therebypromote the continuing development of ubiquitous connectivity in Japan, the ministry decided to allocate the 1.7 GHzand 2 GHz bands for new mobile carriers which are depicted in Table 2. For voice services, bandwidth shows little differencebetween 2G and 3G, but for data communications, 3G mobile requires more frequency because higher bandwidth was nec-essary. EMOBILE Ltd. entered into the market in 2007, resulted in intensifying competition.
2.3. Innovations and services
While DOCOMO has been successfully ahead of other carriers in the field of contents providing such as web browsing,email services instead of simple SMS with limited capacity and Java functions since the introduction of i-mode in 22 Febru-ary 1999, au and SoftBank also kept emphasizing on consumers satisfaction by providing Internet services to their subscrib-ers which is referred to as EZweb by au and Yahoo!Keitai by SoftBank.
At the introduction of IP to mobile phone networks, most of subscribers felt highly satisfied with capacity and unpredict-able functionality development. The applications in all respect were satisfactory and convenient to users and operators werehighly conscious of functional development based on new technology. Different kinds of actively utilized functions havebeen provided by carriers both in 3G and 2G mobile phones, including mail services (email, photo-mail, and video mail),web access, and download (music, movie and game). Moreover, carriers provide their customers more innovative functionssuch as video mail, video clips, video phone, broadcasting type video program, walk navigation, ringing tone songs, highspeed Internet connection, wallet phone, double phone numbers and email addresses in single handset and digital terrestrialTV broadcasting. In short, 3G services add multimedia facilities to 2G phones by allowing video, audio, and graphic applica-tions. In terms of increasing demand for diversification of data services, Table 3 illustrates the category of technological inno-vations and dummy variables selected in the analysis.
3. Empirical analysis
Since mobile phone services are not durable goods, the measure of quantity sold by each carrier is defined as the numberof subscribers who have mobile phones contract at a certain point in time, such as the end of the month, instead of the net
Table 1Types of 3G technologies in Japan.
Carrier Technology Service name Start of service Max. speed
DOCOMO W-CDMA FOMA October, 2001 384 Kbit/sauKDDI cdma2000 1x cdma2000 1x April, 2002 144 Kbit/sSoftBank W-CDMA VGS December, 2002 384 Kbit/sauKDDI EV-DO WIN November, 2003 2.4 Mbit/sDOCOMO HSDPA Hsdpa November, 2005 14.4 Mbit/s
Source: White paper of MIC.
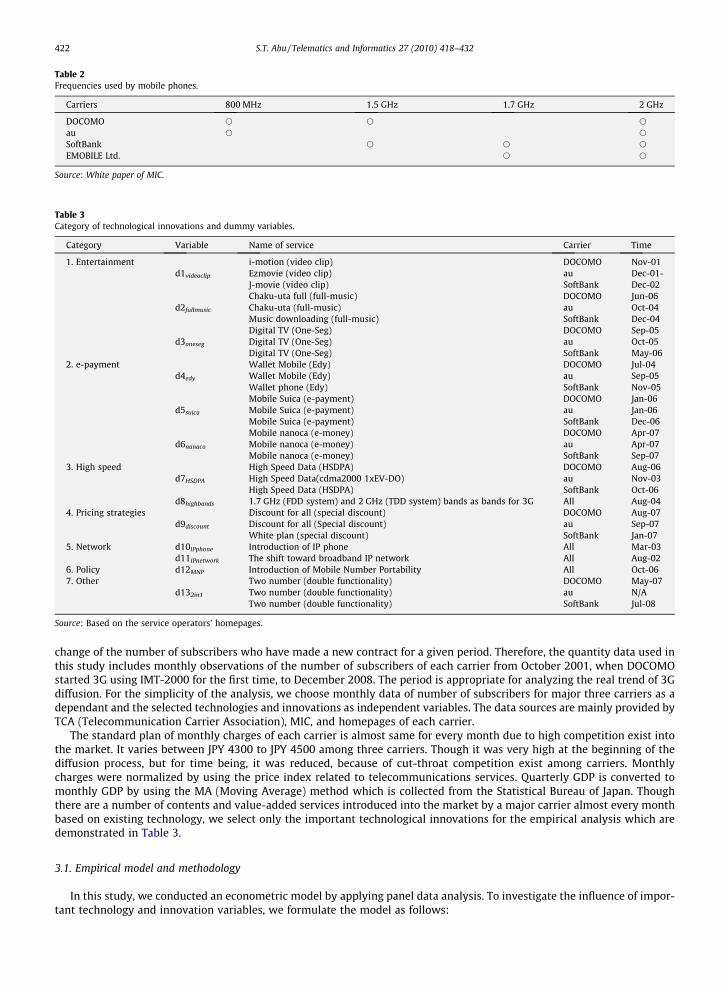
Table 2Frequencies used by mobile phones.
Carriers 800 MHz 1.5 GHz 1.7 GHz 2 GHz
DOCOMO s s s
au s s
SoftBank s s s
EMOBILE Ltd. s s
Source: White paper of MIC.
Table 3Category of technological innovations and dummy variables.
Category Variable Name of service Carrier Time
1. Entertainment i-motion (video clip) DOCOMO Nov-01d1videoclip Ezmovie (video clip) au Dec-01-
J-movie (video clip) SoftBank Dec-02Chaku-uta full (full-music) DOCOMO Jun-06
d2fullmusic Chaku-uta (full-music) au Oct-04Music downloading (full-music) SoftBank Dec-04Digital TV (One-Seg) DOCOMO Sep-05
d3oneseg Digital TV (One-Seg) au Oct-05Digital TV (One-Seg) SoftBank May-06
2. e-payment Wallet Mobile (Edy) DOCOMO Jul-04d4edy Wallet Mobile (Edy) au Sep-05
Wallet phone (Edy) SoftBank Nov-05Mobile Suica (e-payment) DOCOMO Jan-06
d5suica Mobile Suica (e-payment) au Jan-06Mobile Suica (e-payment) SoftBank Dec-06Mobile nanoca (e-money) DOCOMO Apr-07
d6nanaco Mobile nanoca (e-money) au Apr-07Mobile nanoca (e-money) SoftBank Sep-07
3. High speed High Speed Data (HSDPA) DOCOMO Aug-06d7HSDPA High Speed Data(cdma2000 1xEV-DO) au Nov-03
High Speed Data (HSDPA) SoftBank Oct-06d8highbands 1.7 GHz (FDD system) and 2 GHz (TDD system) bands as bands for 3G All Aug-04
4. Pricing strategies Discount for all (special discount) DOCOMO Aug-07d9discount Discount for all (Special discount) au Sep-07
White plan (special discount) SoftBank Jan-075. Network d10IPphone Introduction of IP phone All Mar-03
d11IPnetwork The shift toward broadband IP network All Aug-026. Policy d12MNP Introduction of Mobile Number Portability All Oct-067. Other Two number (double functionality) DOCOMO May-07
d132in1 Two number (double functionality) au N/ATwo number (double functionality) SoftBank Jul-08
Source: Based on the service operators’ homepages.
422 S.T. Abu / Telematics and Informatics 27 (2010) 418–432
change of the number of subscribers who have made a new contract for a given period. Therefore, the quantity data used inthis study includes monthly observations of the number of subscribers of each carrier from October 2001, when DOCOMOstarted 3G using IMT-2000 for the first time, to December 2008. The period is appropriate for analyzing the real trend of 3Gdiffusion. For the simplicity of the analysis, we choose monthly data of number of subscribers for major three carriers as adependant and the selected technologies and innovations as independent variables. The data sources are mainly provided byTCA (Telecommunication Carrier Association), MIC, and homepages of each carrier.
The standard plan of monthly charges of each carrier is almost same for every month due to high competition exist intothe market. It varies between JPY 4300 to JPY 4500 among three carriers. Though it was very high at the beginning of thediffusion process, but for time being, it was reduced, because of cut-throat competition exist among carriers. Monthlycharges were normalized by using the price index related to telecommunications services. Quarterly GDP is converted tomonthly GDP by using the MA (Moving Average) method which is collected from the Statistical Bureau of Japan. Thoughthere are a number of contents and value-added services introduced into the market by a major carrier almost every monthbased on existing technology, we select only the important technological innovations for the empirical analysis which aredemonstrated in Table 3.
3.1. Empirical model and methodology
In this study, we conducted an econometric model by applying panel data analysis. To investigate the influence of impor-tant technology and innovation variables, we formulate the model as follows:
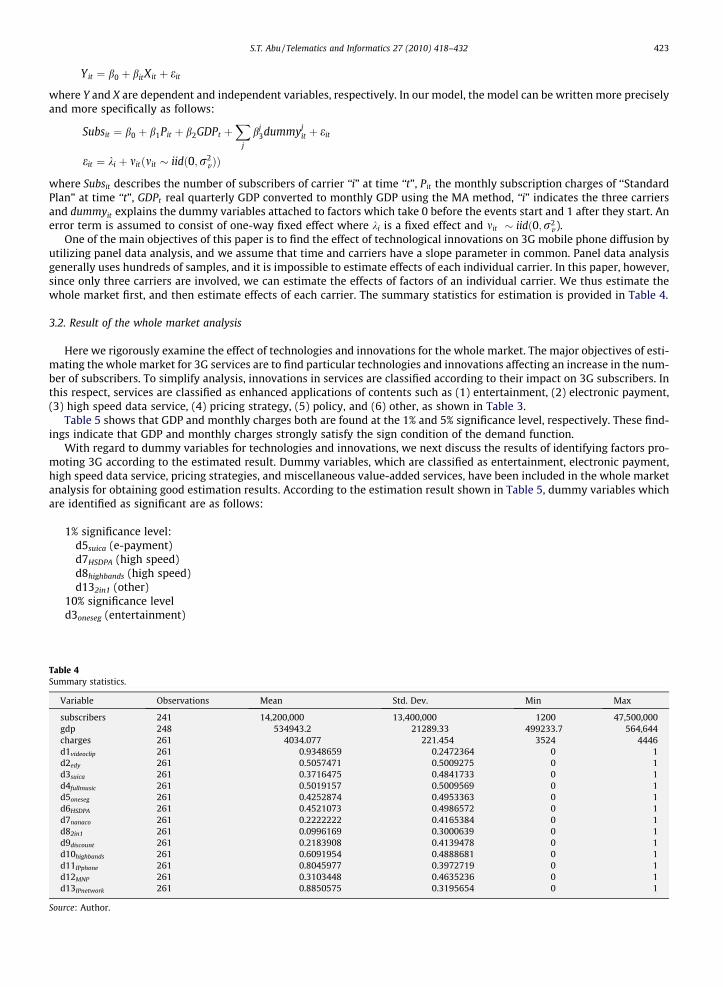
Table 4Summa
Varia
subsgdpchard1vid
d2edy
d3sui
d4ful
d5on
d6HS
d7na
d82in
d9dis
d10h
d11I
d12M
d13I
Source:
S.T. Abu / Telematics and Informatics 27 (2010) 418–432 423
Yit ¼ b0 þ bitXit þ eit
where Y and X are dependent and independent variables, respectively. In our model, the model can be written more preciselyand more specifically as follows:
Subsit ¼ b0 þ b1Pit þ b2GDPt þX
j
bj3dummyj
it þ eit
eit ¼ ki þ mitðmit � iidð0;r2vÞÞ
where Subsit describes the number of subscribers of carrier ‘‘i” at time ‘‘t”, Pit the monthly subscription charges of ‘‘StandardPlan” at time ‘‘t”, GDPt real quarterly GDP converted to monthly GDP using the MA method, ‘‘i” indicates the three carriersand dummyit explains the dummy variables attached to factors which take 0 before the events start and 1 after they start. Anerror term is assumed to consist of one-way fixed effect where ki is a fixed effect and mit � iidð0;r2
v ).One of the main objectives of this paper is to find the effect of technological innovations on 3G mobile phone diffusion by
utilizing panel data analysis, and we assume that time and carriers have a slope parameter in common. Panel data analysisgenerally uses hundreds of samples, and it is impossible to estimate effects of each individual carrier. In this paper, however,since only three carriers are involved, we can estimate the effects of factors of an individual carrier. We thus estimate thewhole market first, and then estimate effects of each carrier. The summary statistics for estimation is provided in Table 4.
3.2. Result of the whole market analysis
Here we rigorously examine the effect of technologies and innovations for the whole market. The major objectives of esti-mating the whole market for 3G services are to find particular technologies and innovations affecting an increase in the num-ber of subscribers. To simplify analysis, innovations in services are classified according to their impact on 3G subscribers. Inthis respect, services are classified as enhanced applications of contents such as (1) entertainment, (2) electronic payment,(3) high speed data service, (4) pricing strategy, (5) policy, and (6) other, as shown in Table 3.
Table 5 shows that GDP and monthly charges both are found at the 1% and 5% significance level, respectively. These find-ings indicate that GDP and monthly charges strongly satisfy the sign condition of the demand function.
With regard to dummy variables for technologies and innovations, we next discuss the results of identifying factors pro-moting 3G according to the estimated result. Dummy variables, which are classified as entertainment, electronic payment,high speed data service, pricing strategies, and miscellaneous value-added services, have been included in the whole marketanalysis for obtaining good estimation results. According to the estimation result shown in Table 5, dummy variables whichare identified as significant are as follows:
1% significance level:d5suica (e-payment)d7HSDPA (high speed)d8highbands (high speed)d132in1 (other)
10% significance leveld3oneseg (entertainment)
ry statistics.
ble Observations Mean Std. Dev. Min Max
cribers 241 14,200,000 13,400,000 1200 47,500,000248 534943.2 21289.33 499233.7 564,644
ges 261 4034.077 221.454 3524 4446eoclip 261 0.9348659 0.2472364 0 1
261 0.5057471 0.5009275 0 1ca 261 0.3716475 0.4841733 0 1lmusic 261 0.5019157 0.5009569 0 1eseg 261 0.4252874 0.4953363 0 1DPA 261 0.4521073 0.4986572 0 1naco 261 0.2222222 0.4165384 0 11 261 0.0996169 0.3000639 0 1count 261 0.2183908 0.4139478 0 1ighbands 261 0.6091954 0.4888681 0 1Pphone 261 0.8045977 0.3972719 0 1
NP 261 0.3103448 0.4635236 0 1Pnetwork 261 0.8850575 0.3195654 0 1
Author.
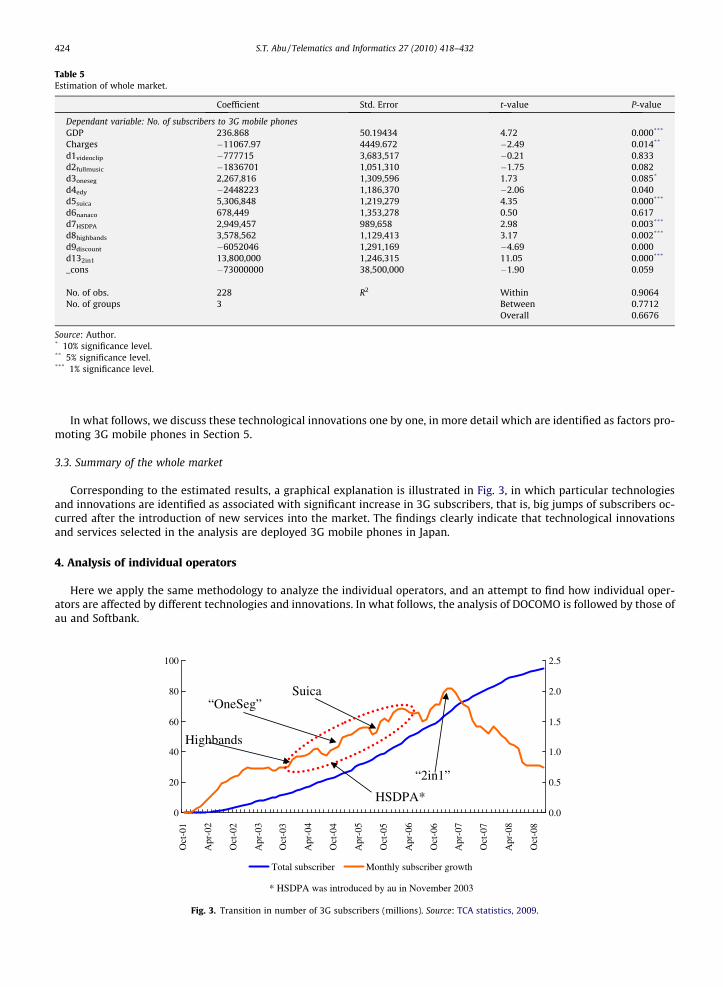
Table 5Estimation of whole market.
Coefficient Std. Error t-value P-value
Dependant variable: No. of subscribers to 3G mobile phonesGDP 236.868 50.19434 4.72 0.000***
Charges �11067.97 4449.672 �2.49 0.014**
d1videoclip �777715 3,683,517 �0.21 0.833d2fullmusic �1836701 1,051,310 �1.75 0.082d3oneseg 2,267,816 1,309,596 1.73 0.085*
d4edy �2448223 1,186,370 �2.06 0.040d5suica 5,306,848 1,219,279 4.35 0.000***
d6nanaco 678,449 1,353,278 0.50 0.617d7HSDPA 2,949,457 989,658 2.98 0.003***
d8highbands 3,578,562 1,129,413 3.17 0.002***
d9discount �6052046 1,291,169 �4.69 0.000d132in1 13,800,000 1,246,315 11.05 0.000***
_cons �73000000 38,500,000 �1.90 0.059
No. of obs. 228 R2 Within 0.9064No. of groups 3 Between 0.7712
Overall 0.6676
Source: Author.* 10% significance level.** 5% significance level.*** 1% significance level.
424 S.T. Abu / Telematics and Informatics 27 (2010) 418–432
In what follows, we discuss these technological innovations one by one, in more detail which are identified as factors pro-moting 3G mobile phones in Section 5.
3.3. Summary of the whole market
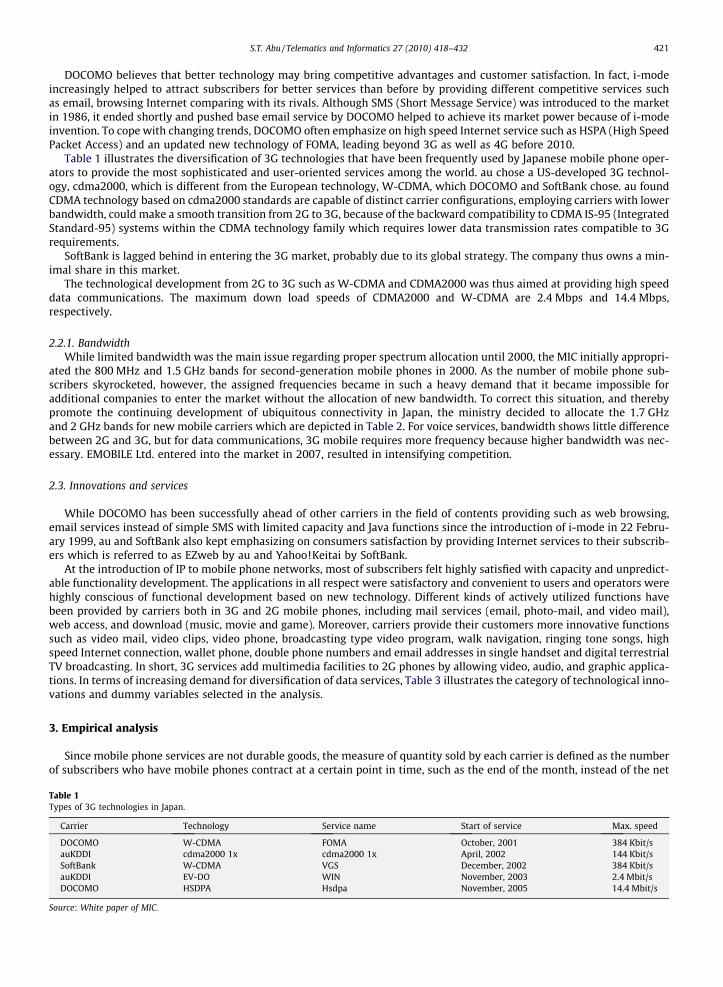
Corresponding to the estimated results, a graphical explanation is illustrated in Fig. 3, in which particular technologiesand innovations are identified as associated with significant increase in 3G subscribers, that is, big jumps of subscribers oc-curred after the introduction of new services into the market. The findings clearly indicate that technological innovationsand services selected in the analysis are deployed 3G mobile phones in Japan.
4. Analysis of individual operators
Here we apply the same methodology to analyze the individual operators, and an attempt to find how individual oper-ators are affected by different technologies and innovations. In what follows, the analysis of DOCOMO is followed by those ofau and Softbank.
0
20
40
60
80
100
Oct
-01
Apr
-02
Oct
-02
Apr
-03
Oct
-03
Apr
-04
Oct
-04
Apr
-05
Oct
-05
Apr
-06
Oct
-06
Apr
-07
Oct
-07
Apr
-08
Oct
-08
0.0
0.5
1.0
1.5
2.0
2.5
Total subscriber Monthly subscriber growth
* HSDPA was introduced by au in November 2003
Suica “OneSeg”
HSDPA*
“2in1”
Highbands
Fig. 3. Transition in number of 3G subscribers (millions). Source: TCA statistics, 2009.
S.T. Abu / Telematics and Informatics 27 (2010) 418–432 425
4.1. Analysis of DOCOMO
DOCOMO is characterized by sound network infrastructures and diversified value-added services. It was DOCOMO thatoffered PDC (Personal Digital Cellular) branded as 2G mova in March 1993 providing 2.4 kbps data speed and increasedto 9.6 kbps in April 1995 using both 800 MHz and 1.5 GHz bandwidth. 3G FOMA services were commercially launched inOctober 2001 for the first time all over the world embedded with 384 kbps data speed, 2 GHz bandwidth, and varieties ofservices meeting needs of subscribers.
Due to the shortage of infrastructure and network coverage, services were available only in Tokyo metropolitan and a partof Yokohama and Kawasaki areas at the time of service inauguration; area was however expanded in Osaka and Nagoya inDecember 2001 and to 99% of the nationwide population until March 2004. As part of the ongoing expansion, it emphasizedon FOMA base stations in existing service areas that helped to provide full access 3G services in high-rise buildings, under-ground shopping malls and subway stations. Note that, as a part of the giant NTT family, DOCOMO’s 3G FOMA maintainshigh quality of services ranging from communication to behavior assistance.
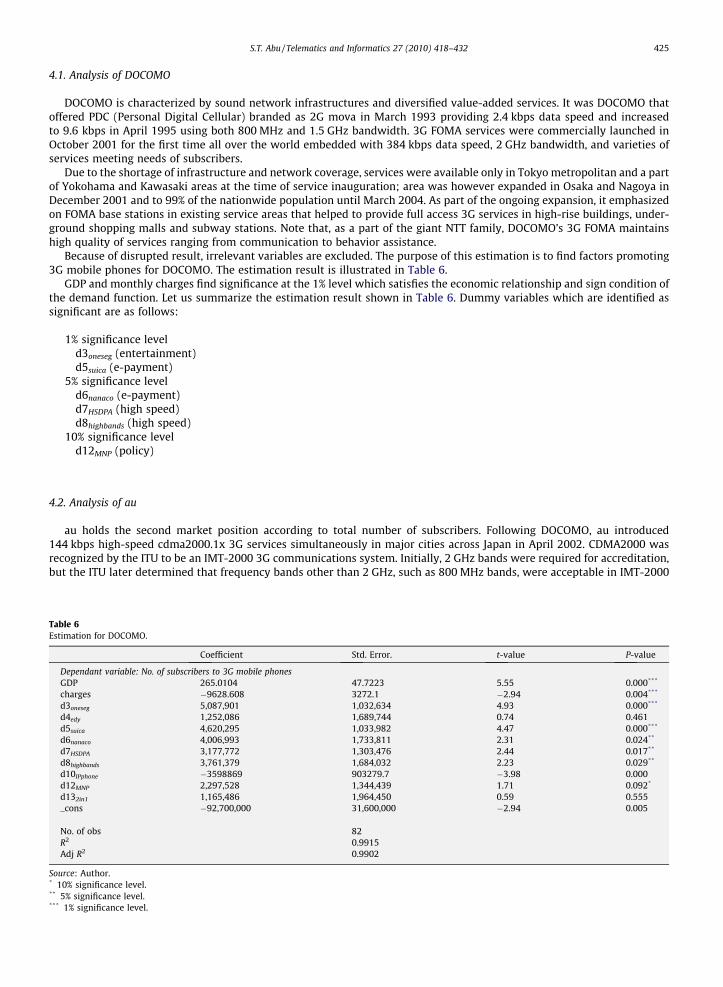
Because of disrupted result, irrelevant variables are excluded. The purpose of this estimation is to find factors promoting3G mobile phones for DOCOMO. The estimation result is illustrated in Table 6.
GDP and monthly charges find significance at the 1% level which satisfies the economic relationship and sign condition ofthe demand function. Let us summarize the estimation result shown in Table 6. Dummy variables which are identified assignificant are as follows:
1% significance leveld3oneseg (entertainment)d5suica (e-payment)
5% significance leveld6nanaco (e-payment)d7HSDPA (high speed)d8highbands (high speed)
10% significance leveld12MNP (policy)
4.2. Analysis of au
au holds the second market position according to total number of subscribers. Following DOCOMO, au introduced144 kbps high-speed cdma2000.1x 3G services simultaneously in major cities across Japan in April 2002. CDMA2000 wasrecognized by the ITU to be an IMT-2000 3G communications system. Initially, 2 GHz bands were required for accreditation,but the ITU later determined that frequency bands other than 2 GHz, such as 800 MHz bands, were acceptable in IMT-2000
Table 6Estimation for DOCOMO.
Coefficient Std. Error. t-value P-value
Dependant variable: No. of subscribers to 3G mobile phonesGDP 265.0104 47.7223 5.55 0.000***
charges �9628.608 3272.1 �2.94 0.004***
d3oneseg 5,087,901 1,032,634 4.93 0.000***
d4edy 1,252,086 1,689,744 0.74 0.461d5suica 4,620,295 1,033,982 4.47 0.000***
d6nanaco 4,006,993 1,733,811 2.31 0.024**
d7HSDPA 3,177,772 1,303,476 2.44 0.017**
d8highbands 3,761,379 1,684,032 2.23 0.029**
d10IPphone �3598869 903279.7 �3.98 0.000d12MNP 2,297,528 1,344,439 1.71 0.092*
d132in1 1,165,486 1,964,450 0.59 0.555_cons �92,700,000 31,600,000 �2.94 0.005
No. of obs 82R2 0.9915Adj R2 0.9902
Source: Author.* 10% significance level.** 5% significance level.*** 1% significance level.
426 S.T. Abu / Telematics and Informatics 27 (2010) 418–432
systems. au thus took the first initiative toward the development of 3G services using 800 MHz which caused its high marketshare compare to DOCOMO and SoftBank at the beginning which is demonstrated in Fig. 1.
In response to increasing demand for data transmission, au started cdma1xEV-DO technology, an IMT-2000 high-speed3G wireless data services that operated at a frequency of 2 GHz and offered transmit data economically at a speed of up to2.4 Mbps for the first time in Japan in November 2003. Thus, it is obvious that au’s introduction of cdma1xWIN, a new 3Gservices that enabled the full functionality of actual 3G.
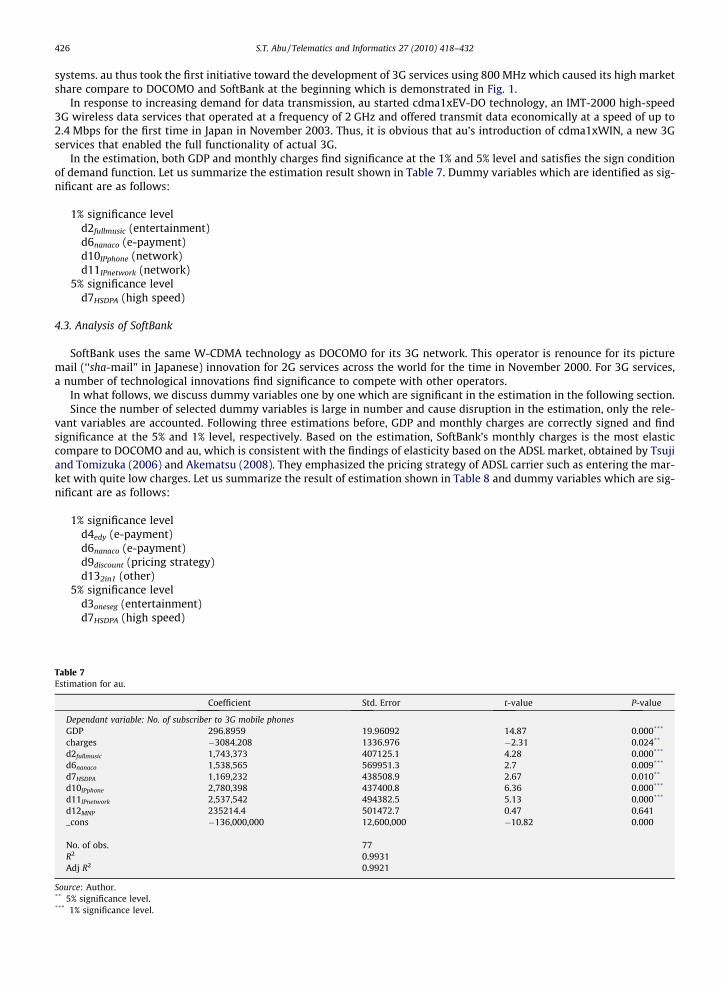
In the estimation, both GDP and monthly charges find significance at the 1% and 5% level and satisfies the sign conditionof demand function. Let us summarize the estimation result shown in Table 7. Dummy variables which are identified as sig-nificant are as follows:
1% significance leveld2fullmusic (entertainment)d6nanaco (e-payment)d10IPphone (network)d11IPnetwork (network)
5% significance leveld7HSDPA (high speed)
4.3. Analysis of SoftBank
SoftBank uses the same W-CDMA technology as DOCOMO for its 3G network. This operator is renounce for its picturemail (‘‘sha-mail” in Japanese) innovation for 2G services across the world for the time in November 2000. For 3G services,a number of technological innovations find significance to compete with other operators.
In what follows, we discuss dummy variables one by one which are significant in the estimation in the following section.Since the number of selected dummy variables is large in number and cause disruption in the estimation, only the rele-
vant variables are accounted. Following three estimations before, GDP and monthly charges are correctly signed and findsignificance at the 5% and 1% level, respectively. Based on the estimation, SoftBank’s monthly charges is the most elasticcompare to DOCOMO and au, which is consistent with the findings of elasticity based on the ADSL market, obtained by Tsujiand Tomizuka (2006) and Akematsu (2008). They emphasized the pricing strategy of ADSL carrier such as entering the mar-ket with quite low charges. Let us summarize the result of estimation shown in Table 8 and dummy variables which are sig-nificant are as follows:
1% significance leveld4edy (e-payment)d6nanaco (e-payment)d9discount (pricing strategy)d132in1 (other)
5% significance leveld3oneseg (entertainment)d7HSDPA (high speed)
Table 7Estimation for au.
Coefficient Std. Error t-value P-value
Dependant variable: No. of subscriber to 3G mobile phonesGDP 296.8959 19.96092 14.87 0.000***
charges �3084.208 1336.976 �2.31 0.024**
d2fullmusic 1,743,373 407125.1 4.28 0.000***
d6nanaco 1,538,565 569951.3 2.7 0.009***
d7HSDPA 1,169,232 438508.9 2.67 0.010**
d10IPphone 2,780,398 437400.8 6.36 0.000***
d11IPnetwork 2,537,542 494382.5 5.13 0.000***
d12MNP 235214.4 501472.7 0.47 0.641_cons �136,000,000 12,600,000 �10.82 0.000
No. of obs. 77R2 0.9931Adj R2 0.9921
Source: Author.** 5% significance level.*** 1% significance level.
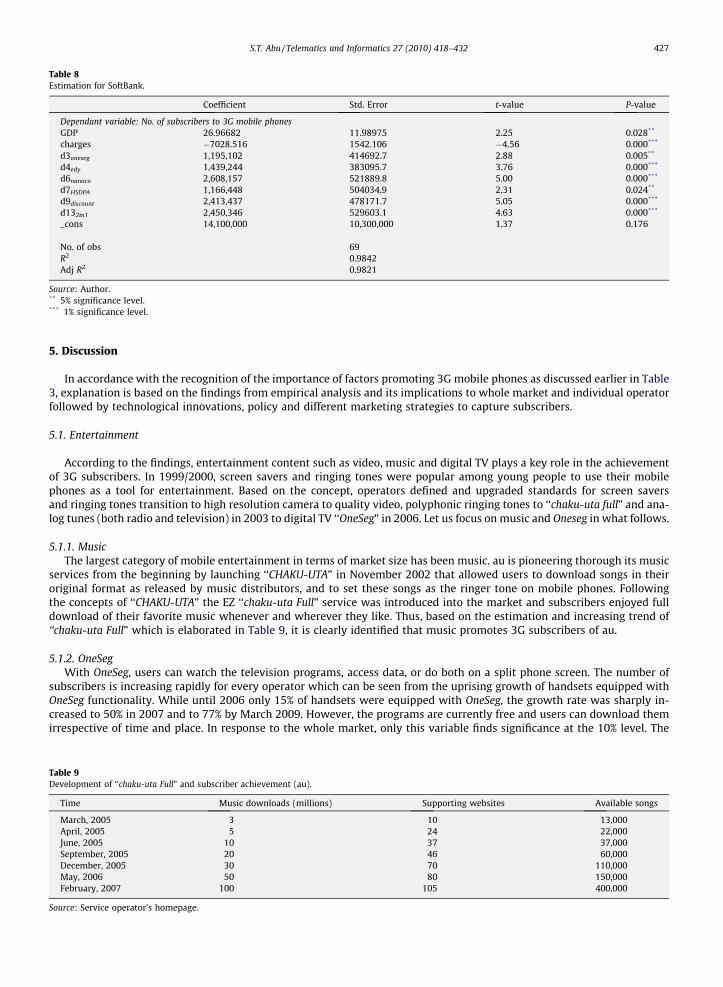
Table 8Estimation for SoftBank.
Coefficient Std. Error t-value P-value
Dependant variable: No. of subscribers to 3G mobile phonesGDP 26.96682 11.98975 2.25 0.028**
charges �7028.516 1542.106 �4.56 0.000***
d3oneseg 1,195,102 414692.7 2.88 0.005**
d4edy 1,439,244 383095.7 3.76 0.000***
d6nanaco 2,608,157 521889.8 5.00 0.000***
d7HSDPA 1,166,448 504034.9 2.31 0.024**
d9discount 2,413,437 478171.7 5.05 0.000***
d132in1 2,450,346 529603.1 4.63 0.000***
_cons 14,100,000 10,300,000 1.37 0.176
No. of obs 69R2 0.9842Adj R2 0.9821
Source: Author.** 5% significance level.*** 1% significance level.
S.T. Abu / Telematics and Informatics 27 (2010) 418–432 427
5. Discussion
In accordance with the recognition of the importance of factors promoting 3G mobile phones as discussed earlier in Table3, explanation is based on the findings from empirical analysis and its implications to whole market and individual operatorfollowed by technological innovations, policy and different marketing strategies to capture subscribers.
5.1. Entertainment
According to the findings, entertainment content such as video, music and digital TV plays a key role in the achievementof 3G subscribers. In 1999/2000, screen savers and ringing tones were popular among young people to use their mobilephones as a tool for entertainment. Based on the concept, operators defined and upgraded standards for screen saversand ringing tones transition to high resolution camera to quality video, polyphonic ringing tones to ‘‘chaku-uta full” and ana-log tunes (both radio and television) in 2003 to digital TV ‘‘OneSeg” in 2006. Let us focus on music and Oneseg in what follows.
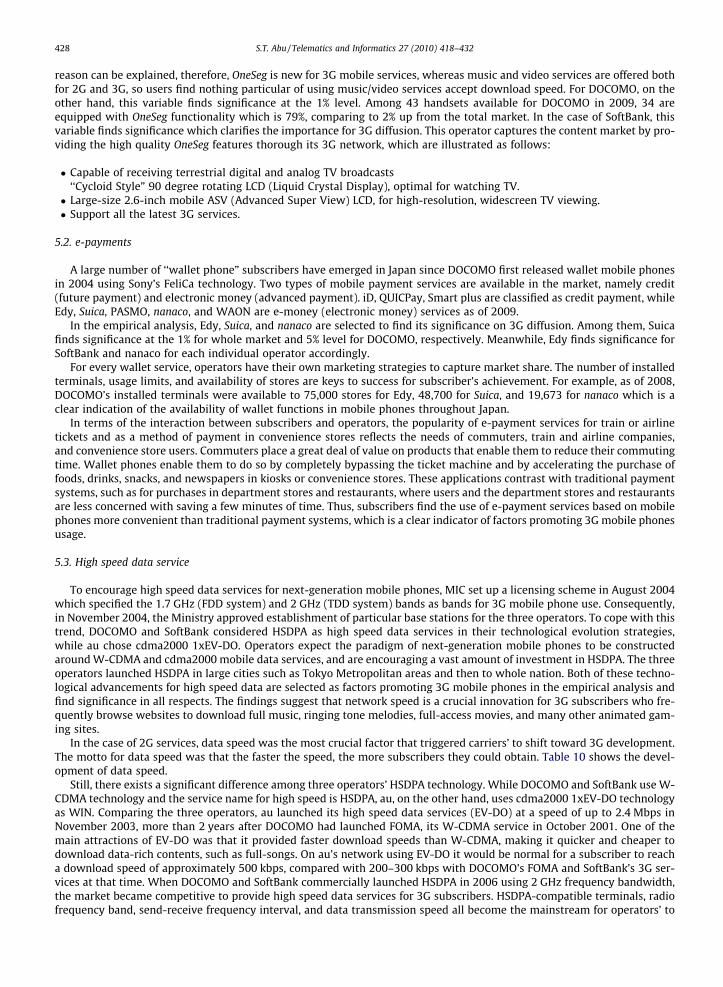
5.1.1. MusicThe largest category of mobile entertainment in terms of market size has been music. au is pioneering thorough its music
services from the beginning by launching ‘‘CHAKU-UTA” in November 2002 that allowed users to download songs in theiroriginal format as released by music distributors, and to set these songs as the ringer tone on mobile phones. Followingthe concepts of ‘‘CHAKU-UTA” the EZ ‘‘chaku-uta Full” service was introduced into the market and subscribers enjoyed fulldownload of their favorite music whenever and wherever they like. Thus, based on the estimation and increasing trend of‘‘chaku-uta Full” which is elaborated in Table 9, it is clearly identified that music promotes 3G subscribers of au.
5.1.2. OneSegWith OneSeg, users can watch the television programs, access data, or do both on a split phone screen. The number of
subscribers is increasing rapidly for every operator which can be seen from the uprising growth of handsets equipped withOneSeg functionality. While until 2006 only 15% of handsets were equipped with OneSeg, the growth rate was sharply in-creased to 50% in 2007 and to 77% by March 2009. However, the programs are currently free and users can download themirrespective of time and place. In response to the whole market, only this variable finds significance at the 10% level. The
Table 9Development of ‘‘chaku-uta Full” and subscriber achievement (au).
Time Music downloads (millions) Supporting websites Available songs
March, 2005 3 10 13,000April, 2005 5 24 22,000June, 2005 10 37 37,000September, 2005 20 46 60,000December, 2005 30 70 110,000May, 2006 50 80 150,000February, 2007 100 105 400,000
Source: Service operator’s homepage.
428 S.T. Abu / Telematics and Informatics 27 (2010) 418–432
reason can be explained, therefore, OneSeg is new for 3G mobile services, whereas music and video services are offered bothfor 2G and 3G, so users find nothing particular of using music/video services accept download speed. For DOCOMO, on theother hand, this variable finds significance at the 1% level. Among 43 handsets available for DOCOMO in 2009, 34 areequipped with OneSeg functionality which is 79%, comparing to 2% up from the total market. In the case of SoftBank, thisvariable finds significance which clarifies the importance for 3G diffusion. This operator captures the content market by pro-viding the high quality OneSeg features thorough its 3G network, which are illustrated as follows:
� Capable of receiving terrestrial digital and analog TV broadcasts‘‘Cycloid Style” 90 degree rotating LCD (Liquid Crystal Display), optimal for watching TV.� Large-size 2.6-inch mobile ASV (Advanced Super View) LCD, for high-resolution, widescreen TV viewing.� Support all the latest 3G services.
5.2. e-payments
A large number of ‘‘wallet phone” subscribers have emerged in Japan since DOCOMO first released wallet mobile phonesin 2004 using Sony’s FeliCa technology. Two types of mobile payment services are available in the market, namely credit(future payment) and electronic money (advanced payment). iD, QUICPay, Smart plus are classified as credit payment, whileEdy, Suica, PASMO, nanaco, and WAON are e-money (electronic money) services as of 2009.
In the empirical analysis, Edy, Suica, and nanaco are selected to find its significance on 3G diffusion. Among them, Suicafinds significance at the 1% for whole market and 5% level for DOCOMO, respectively. Meanwhile, Edy finds significance forSoftBank and nanaco for each individual operator accordingly.
For every wallet service, operators have their own marketing strategies to capture market share. The number of installedterminals, usage limits, and availability of stores are keys to success for subscriber’s achievement. For example, as of 2008,DOCOMO’s installed terminals were available to 75,000 stores for Edy, 48,700 for Suica, and 19,673 for nanaco which is aclear indication of the availability of wallet functions in mobile phones throughout Japan.
In terms of the interaction between subscribers and operators, the popularity of e-payment services for train or airlinetickets and as a method of payment in convenience stores reflects the needs of commuters, train and airline companies,and convenience store users. Commuters place a great deal of value on products that enable them to reduce their commutingtime. Wallet phones enable them to do so by completely bypassing the ticket machine and by accelerating the purchase offoods, drinks, snacks, and newspapers in kiosks or convenience stores. These applications contrast with traditional paymentsystems, such as for purchases in department stores and restaurants, where users and the department stores and restaurantsare less concerned with saving a few minutes of time. Thus, subscribers find the use of e-payment services based on mobilephones more convenient than traditional payment systems, which is a clear indicator of factors promoting 3G mobile phonesusage.
5.3. High speed data service
To encourage high speed data services for next-generation mobile phones, MIC set up a licensing scheme in August 2004which specified the 1.7 GHz (FDD system) and 2 GHz (TDD system) bands as bands for 3G mobile phone use. Consequently,in November 2004, the Ministry approved establishment of particular base stations for the three operators. To cope with thistrend, DOCOMO and SoftBank considered HSDPA as high speed data services in their technological evolution strategies,while au chose cdma2000 1xEV-DO. Operators expect the paradigm of next-generation mobile phones to be constructedaround W-CDMA and cdma2000 mobile data services, and are encouraging a vast amount of investment in HSDPA. The threeoperators launched HSDPA in large cities such as Tokyo Metropolitan areas and then to whole nation. Both of these techno-logical advancements for high speed data are selected as factors promoting 3G mobile phones in the empirical analysis andfind significance in all respects. The findings suggest that network speed is a crucial innovation for 3G subscribers who fre-quently browse websites to download full music, ringing tone melodies, full-access movies, and many other animated gam-ing sites.
In the case of 2G services, data speed was the most crucial factor that triggered carriers’ to shift toward 3G development.The motto for data speed was that the faster the speed, the more subscribers they could obtain. Table 10 shows the devel-opment of data speed.
Still, there exists a significant difference among three operators’ HSDPA technology. While DOCOMO and SoftBank use W-CDMA technology and the service name for high speed is HSDPA, au, on the other hand, uses cdma2000 1xEV-DO technologyas WIN. Comparing the three operators, au launched its high speed data services (EV-DO) at a speed of up to 2.4 Mbps inNovember 2003, more than 2 years after DOCOMO had launched FOMA, its W-CDMA service in October 2001. One of themain attractions of EV-DO was that it provided faster download speeds than W-CDMA, making it quicker and cheaper todownload data-rich contents, such as full-songs. On au’s network using EV-DO it would be normal for a subscriber to reacha download speed of approximately 500 kbps, compared with 200–300 kbps with DOCOMO’s FOMA and SoftBank’s 3G ser-vices at that time. When DOCOMO and SoftBank commercially launched HSDPA in 2006 using 2 GHz frequency bandwidth,the market became competitive to provide high speed data services for 3G subscribers. HSDPA-compatible terminals, radiofrequency band, send-receive frequency interval, and data transmission speed all become the mainstream for operators’ to
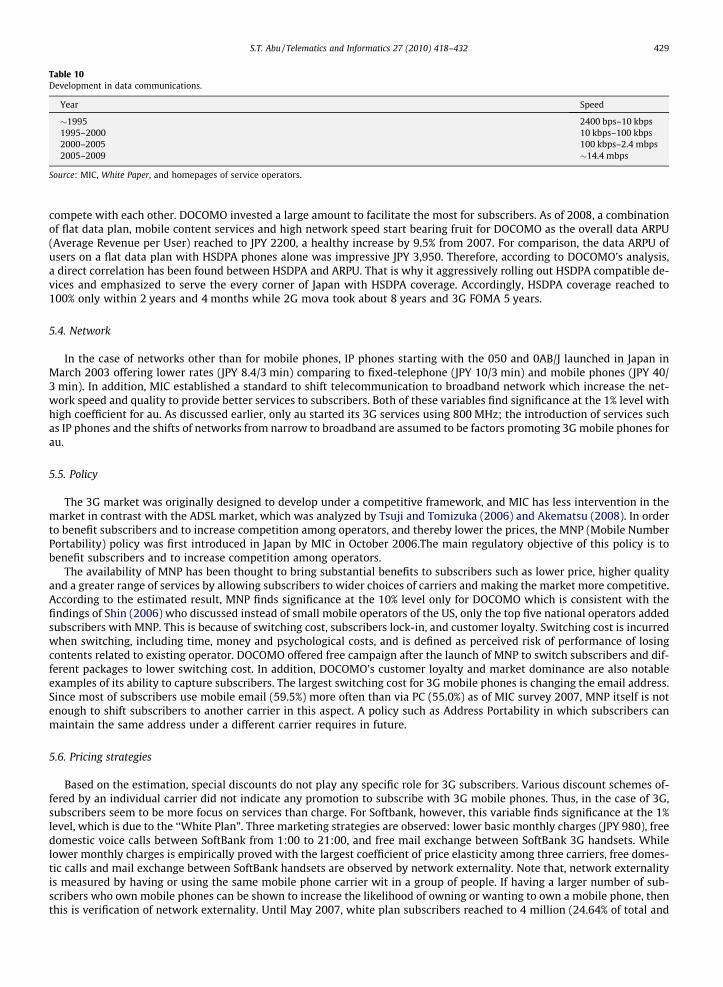
Table 10Development in data communications.
Year Speed
�1995 2400 bps–10 kbps1995–2000 10 kbps–100 kbps2000–2005 100 kbps–2.4 mbps2005–2009 �14.4 mbps
Source: MIC, White Paper, and homepages of service operators.
S.T. Abu / Telematics and Informatics 27 (2010) 418–432 429
compete with each other. DOCOMO invested a large amount to facilitate the most for subscribers. As of 2008, a combinationof flat data plan, mobile content services and high network speed start bearing fruit for DOCOMO as the overall data ARPU(Average Revenue per User) reached to JPY 2200, a healthy increase by 9.5% from 2007. For comparison, the data ARPU ofusers on a flat data plan with HSDPA phones alone was impressive JPY 3,950. Therefore, according to DOCOMO’s analysis,a direct correlation has been found between HSDPA and ARPU. That is why it aggressively rolling out HSDPA compatible de-vices and emphasized to serve the every corner of Japan with HSDPA coverage. Accordingly, HSDPA coverage reached to100% only within 2 years and 4 months while 2G mova took about 8 years and 3G FOMA 5 years.
5.4. Network
In the case of networks other than for mobile phones, IP phones starting with the 050 and 0AB/J launched in Japan inMarch 2003 offering lower rates (JPY 8.4/3 min) comparing to fixed-telephone (JPY 10/3 min) and mobile phones (JPY 40/3 min). In addition, MIC established a standard to shift telecommunication to broadband network which increase the net-work speed and quality to provide better services to subscribers. Both of these variables find significance at the 1% level withhigh coefficient for au. As discussed earlier, only au started its 3G services using 800 MHz; the introduction of services suchas IP phones and the shifts of networks from narrow to broadband are assumed to be factors promoting 3G mobile phones forau.
5.5. Policy
The 3G market was originally designed to develop under a competitive framework, and MIC has less intervention in themarket in contrast with the ADSL market, which was analyzed by Tsuji and Tomizuka (2006) and Akematsu (2008). In orderto benefit subscribers and to increase competition among operators, and thereby lower the prices, the MNP (Mobile NumberPortability) policy was first introduced in Japan by MIC in October 2006.The main regulatory objective of this policy is tobenefit subscribers and to increase competition among operators.
The availability of MNP has been thought to bring substantial benefits to subscribers such as lower price, higher qualityand a greater range of services by allowing subscribers to wider choices of carriers and making the market more competitive.According to the estimated result, MNP finds significance at the 10% level only for DOCOMO which is consistent with thefindings of Shin (2006) who discussed instead of small mobile operators of the US, only the top five national operators addedsubscribers with MNP. This is because of switching cost, subscribers lock-in, and customer loyalty. Switching cost is incurredwhen switching, including time, money and psychological costs, and is defined as perceived risk of performance of losingcontents related to existing operator. DOCOMO offered free campaign after the launch of MNP to switch subscribers and dif-ferent packages to lower switching cost. In addition, DOCOMO’s customer loyalty and market dominance are also notableexamples of its ability to capture subscribers. The largest switching cost for 3G mobile phones is changing the email address.Since most of subscribers use mobile email (59.5%) more often than via PC (55.0%) as of MIC survey 2007, MNP itself is notenough to shift subscribers to another carrier in this aspect. A policy such as Address Portability in which subscribers canmaintain the same address under a different carrier requires in future.
5.6. Pricing strategies
Based on the estimation, special discounts do not play any specific role for 3G subscribers. Various discount schemes of-fered by an individual carrier did not indicate any promotion to subscribe with 3G mobile phones. Thus, in the case of 3G,subscribers seem to be more focus on services than charge. For Softbank, however, this variable finds significance at the 1%level, which is due to the ‘‘White Plan”. Three marketing strategies are observed: lower basic monthly charges (JPY 980), freedomestic voice calls between SoftBank from 1:00 to 21:00, and free mail exchange between SoftBank 3G handsets. Whilelower monthly charges is empirically proved with the largest coefficient of price elasticity among three carriers, free domes-tic calls and mail exchange between SoftBank handsets are observed by network externality. Note that, network externalityis measured by having or using the same mobile phone carrier wit in a group of people. If having a larger number of sub-scribers who own mobile phones can be shown to increase the likelihood of owning or wanting to own a mobile phone, thenthis is verification of network externality. Until May 2007, white plan subscribers reached to 4 million (24.64% of total and
430 S.T. Abu / Telematics and Informatics 27 (2010) 418–432
46% of 3G) and in November 2008 it exceeded 15 million (75.51% of total and 88.71% of 3G) which clearly indicates theimportance of the White Plan for 3G diffusion.
5.7. Other 3G services
Substantial numbers of 3G services exist into the market as illustrated in Table 3. DOCOMO launched a service called‘‘Imadoco” (Japanese for ‘where are you now?’), a child security service in November 2005 followed by SoftBank with‘‘YOZAN” in July 2006. Both of these services require the child to have a 3G mobile phone and the parent to have any 2Gor 3G handset that supports wireless data service. Because of local government intervention, students were prohibited fromusing cell phones at the majority of public primary, middle and high schools from 2008, under a plan announced by OsakaGovernor Toru Hashimoto. In Saitama Prefecture just north of Tokyo, 96% of public middle schools do not allow students touse cell phones while at school. Meanwhile, PTT (push-to-talk), another notable service by DOCOMO and au, followed by theUS Nextel’s success with its PTT service running on Nextel’s proprietary iDen network in early 2000’s, launched in 2005.However, the concept never really took off in Japan. According to DOCOMO, about 100,000 users use the service on amonthly basis. As a result, both operators announced the pending retirement of PTT services which au shutting down itin August 2009, followed by DOCOMO with the plans to close the service in September 2010. Based on the argument as dis-cussed above, these services are excluded from the analysis.
In order to further differentiate the FOMA service from other operators, DOCOMO developed a system for 2in1 servicesthat makes it possible to assign two phone numbers and two mail addresses to one mobile terminal, and use them separatelythrough the collaboration of the mobile terminal and the network. The service launched in May 2007 followed by SoftBank inJuly 2008. To date, au does not have this service. As of December 2008, total number of 2in1 service was 469,700, in which461,000 for DOCOMO and 8700 for SoftBank. In the estimation, the variable does not find significant for DOCOMO, but itfinds significance at the 1% level both for whole market and Softbank, respectively. Meanwhile, it is also identified that afterthe introduction of 2in1 services in May 2007 by DOCOMO, the growth curve shows downward slope which is demonstratedin Fig. 3.
5.8. Implications to other countries
Based on the discussion, 3G mobile phone diffusion of Japan can be classified in terms of technological innovations, mar-keting strategies and competition policy of mobile phone operators. Findings from empirical analysis and its implications towhole market and individual operator suggest that technological innovations, policy and different marketing strategies canpromote 3G mobile phones to other countries in the world. But there is a huge gap among countries those who have adopted3G services or thinking to adopt because of skilled R&D, infrastructure and income. Besides, there are many countries in theworld still do not have full coverage of mobile network irrespective of full access to 3G services. For example, while Japan hasalready reached to 100% HSDPA coverage to support beyond 3G services, Myanmar on the other hand has only 10% mobilenetwork coverage (ITU, 2008). In this perspective, it is difficult to support all those features of 3G mobile phones such asentertainment, e-payment or high speed data for the countries which do not have minimum level of mobile networkinfrastructures.
The main highlight of 3G services is thus high speed data transmission, entertainment, and e-payment in terms of empir-ical findings, particularly relate to Internet access. In the world, very few countries have been successful with the mobileInternet both for 2G and 3G services due to lack of sound mobile network infrastructures like Japan. Wireless Access Protocol(WAP) in Europe has suffered from low transmission speeds, paucity of content and disenchanted users. Besides that, devel-oping countries in Asia and Africa or even some parts of the US suffer from infrastructure to support high speed Internet orhandsets to use e-payment and entertainment services. Moreover, income affordability, mobile network coverage, high
Table 11Summary of result.
Innovations Whole market Carrier
DOCOMO au SoftBank
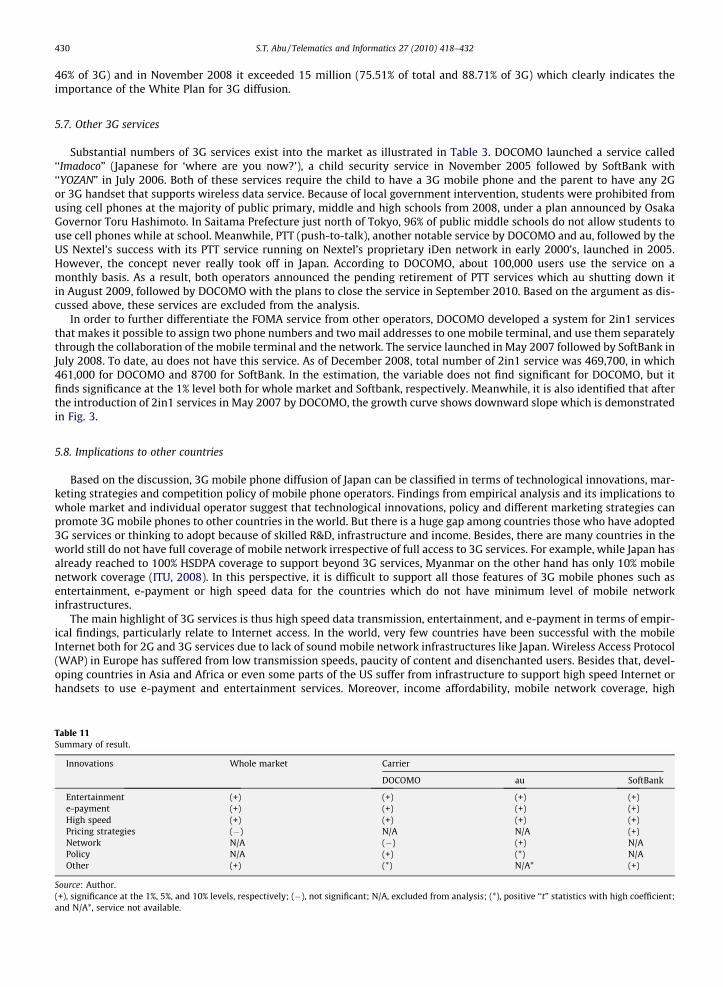
Entertainment (+) (+) (+) (+)e-payment (+) (+) (+) (+)High speed (+) (+) (+) (+)Pricing strategies (�) N/A N/A (+)Network N/A (�) (+) N/APolicy N/A (+) (*) N/AOther (+) (*) N/A* (+)
Source: Author.(+), significance at the 1%, 5%, and 10% levels, respectively; (�), not significant; N/A, excluded from analysis; (*), positive ‘‘t” statistics with high coefficient;and N/A*, service not available.
S.T. Abu / Telematics and Informatics 27 (2010) 418–432 431
subscription charges and telecommunication infrastructure to support all these services classified with regard to findings isdifficult for developing or even some developed countries in the world (Abu, 2010).
Japan, on the other hand, has introduced a wide array of mobile Internet services, and witnessed phenomenal growth inusage and subscribers. Operators invested a lot for infrastructure development and user-oriented R&D that supports highspeed mobile Internet or handsets to use e-payment and entertainment services anywhere at any time. Much can be learntfrom Japan’s experience with data services that can help guide the strategies, technological innovations and pricing ap-proaches of operators outside Japan. The paper identifies substantial opportunities are yet to be possible for Japanese oper-ators by elucidating high speed Internet services, entertainment and e-payment. The study also poses a new idea for thedeveloping and developed economies which are thinking to adopt 3G services or already have adopted in terms of their in-come level, mobile network infrastructure and skilled R&D.
6. Conclusion
Using rigorous panel data analysis, we heuristically identified the effect of technological innovations and policy on thediffusion of 3G mobile phones. This study identifies specific technological innovations which have been developing in theJapanese mobile phone market to betterment of services and advancing to 4G. In accordance with the estimated results,technological innovations in entertainment, e-payment, and high speed data services are crucial and are found significantin all aspect for the 3G diffusion. A brief summary of result is elaborated in Table 11. DOCOMO leads the market for everyfunctionality development until now. Following DOCOMO, other two carriers emphasize to develop the same technology orupgrade according to their skilled R&D.
A number of implications can be derived from analyzing and comparing technological innovations and policy for 3G, andlooking beyond mobile communication technologies in Japan, while focusing on the mobile TV, e-payment and high speeddata service such as HSDPA and EV-DO. Still, for now it is difficult to predict which technological innovations will be the finalwinner of the next-generation mobile phone market. Furthermore, aside from the currently commercialized technologies,new technologies like LTE (Long-Term-Evolution) are under development and expected to launch for 4G. Since this paperexamines Japan’s case from the technological innovations and policy impact on 3G mobile phone diffusion, it might serveas a guideline for other countries that are considering evolving into 3G standardization. This study, however, has its ownresearch limitations in that Japan has experienced different technological innovations and policy failure such as PTT andMNP for 3G diffusion. Further studies are required to perform a quantitative analysis on which technological innovationsand policies are valid, considering the country’s unique characteristics of geographical coverage, population, topography,and income level.
Acknowledgements
The author expresses his heartfelt gratitude to Professor M. Tsuji, Graduate School of Applied Informatics, University ofHyogo, for his support and encouragement throughout the course of this research, and to Dr. Y. Akematsu, researcher, TsujiLaboratory, for his help with the statistical analysis. The financial support of the Japanese Government is gratefullyacknowledged.
References
Abu, S.T., 2010. Empirical analysis of global diffusion of 3G mobile phones: a cross-cultural review. Discussion Paper No. AIDP0906. Graduate School ofApplied Informatics, University of Hyogo, Japan.
Ahn, H., Lee, M., 1999. An econometric analysis of the demand for access to mobile telephone networks. Information Economics and Policy 11 (3), 297–305.Akematsu, Y., 2008. A panel data analysis of the diffusion of ADSL based on the data of ADSL carriers. Annual Report of Japanese Society of Information
Communication Research, pp. 1–14 (in Japanese).Baliamoune-Lutz, M., 2003. An analysis of the determinants and effects of ICT diffusion in developing countries. Information Technology for Development
10 (3), 151–169.Banerjee, A., Ros, A.J., 2004. Patterns in global fixed and mobile telecommunications development: a cluster analysis. Telecommunications Policy 28 (2),
107–132.Crandall, R.W., Sidak, J.G., Singer, H.J., 2002. The empirical case against the regulation of broadband access. Berkeley Technology Law Journal 17 (3), 953–
987.Eisner, J., Waldon, T., 2001. The demand for bandwidth: second telephone lines and one-line services. Information Economics and Policy 13 (3), 301–309.Ida, T., Kuroda, T., 2006. Discrete choice analysis of demand for broadband in Japan. Journal of Regulatory Economics 29 (1), 5–22.Iimi, A., 2005. Estimating demand for cellular phone services in Japan. Telecommunications Policy 29 (1), 3–23.International Telecommunications Union (ITU), 2008. World Telecommunication/ICT Indicators (CD-ROM), 12th ed. Geneva, Switzerland.Kamssu, A.J., 2005. Global connectivity thorough wireless network technology: a possible solution for poor countries. International Journal of Mobile
Communications 3 (3), 249–262.Kim, Y., 2005. Estimation of consumer preferences on new telecommunications services: IMT-2000 service in Korea. Information Economics and Policy 17
(1), 73–84.Kridel, D.J. et al, 2001. An econometric model of the demand for access to the Internet by cable modem. In: Loomis, D.G., Taylor, L.D. (Eds.), Forecasting the
Internet: Understanding the Explosive Growth of Data Communications. Kluwer Academic Publishers, Boston.Kshetri, N., Cheung, M., 2002. What factors are driving China’s mobile diffusion? Electronic Markets—International Journal of Electronic Commerce and
Business Media 12 (1), 22–26.Madden, G., Coble-Neal, G., 2004. Economic determinants of global mobile telephony growth. Information Economics and Policy 16 (4), 519–537.Minges, M., 1999. Mobile cellular communications in the southern African region. Telecommunications Policy 23 (7–8), 585–593.Ministry of Internal Affairs and Communications (MIC), 1998–2008. White paper on Information and Communications, Tokyo, Japan.

432 S.T. Abu / Telematics and Informatics 27 (2010) 418–432
Nelson, P.A., 2004. The making of the camera phone: How Japan’s mobile and optics technologies are converging. JETS Research Paper. The Institute forJapanese-European Technology Studies (JETS), University of Edinburgh, UK. Electronic copy available at: <http://ssrn.com/abstract=985241>.
Rouvinen, P., 2006. Diffusion of digital mobile telephony: are developing countries different? Telecommunications Policy 30 (1), 46–63.Shin, D., 2006. A study of mobile number portability effects in the United States. Telematics and Informatics 24 (1), 1–14.TCA, 1999–2007. Preliminary statistics on telecommunications market in Japan. Telecommunications Carriers Association, Tokyo, Japan.Tsuji, M., Tomizuka, M., 2006. An empirical analysis of factors promoting Japanese broadband: case of ADSL. In: Proceedings of ITS Biennial Conference,
Beijing, China.
Recommended