1
Project SHA/UM/5-01 2nd Quarter MeetingThe Calibration of the AASHTO ASD and LRFD for
Maryland Sign and High Mast Lighting Structure Design
Chung C. Fu, Ph.D., P.E., Director(http: www.best.umd.edu)
@UMD College Park TVB conference roomAugust 15, 2019

Agenda• Stress range output from SABRE.
• Methodologies of fatigue checks in new standards.
• Missing fatigues checks:- Chord to splice plate stress range. Stress range for column and gusseted struts as well as diagonals on the
columns.
• U-bolts connection stress range for VAMS to truss chord and chord to post. (How to extract loads from sabre.)
• Values for the properties of cohesive and cohesionless soils (shear strengths, unit weights and friction angle) from the research summary.
• Status on the LRFD version. Any differences with respect to fatigue checks.
• For the overhead sign structure; is there a need to check for fatigue at the T-section that connects the truss to the post.

3. Task 3– Fatigue DesignCalibration (review)
Fatigue calibration with NJDOT Ex. 1
Overhead Cantilever Sign Structure –Flat Panel Sign Board
3
Example 1Fatigue II Sabre NJDOT Report Corrected Staad.Pro
Gallop 7.056 7.056 7.056Natural.W 3.779 4.146 3.2551 3.239
NW sign 2.534 3.6048 2.545NW chord 0.703 0.17
NW column 0.543 0.5401 0.5401Truck.W 0.408 1.438 0.469 0.408
TW sign 0.134 0.357 0.134 0.134TW chord 0.274 1.0811 0.335 0.274 % Diff
Gallop 167.8 141.6 169.34 169.3 0.89%Truck.W 13.7 49.9 14.51 13.87 1.23%
Torsion (k‐ft) Natural.W 63.6 81.9 57.65 61.92 ‐2.71%
Moment (K‐ft)
Joint load (kips)
(Revised 5/29/2019)
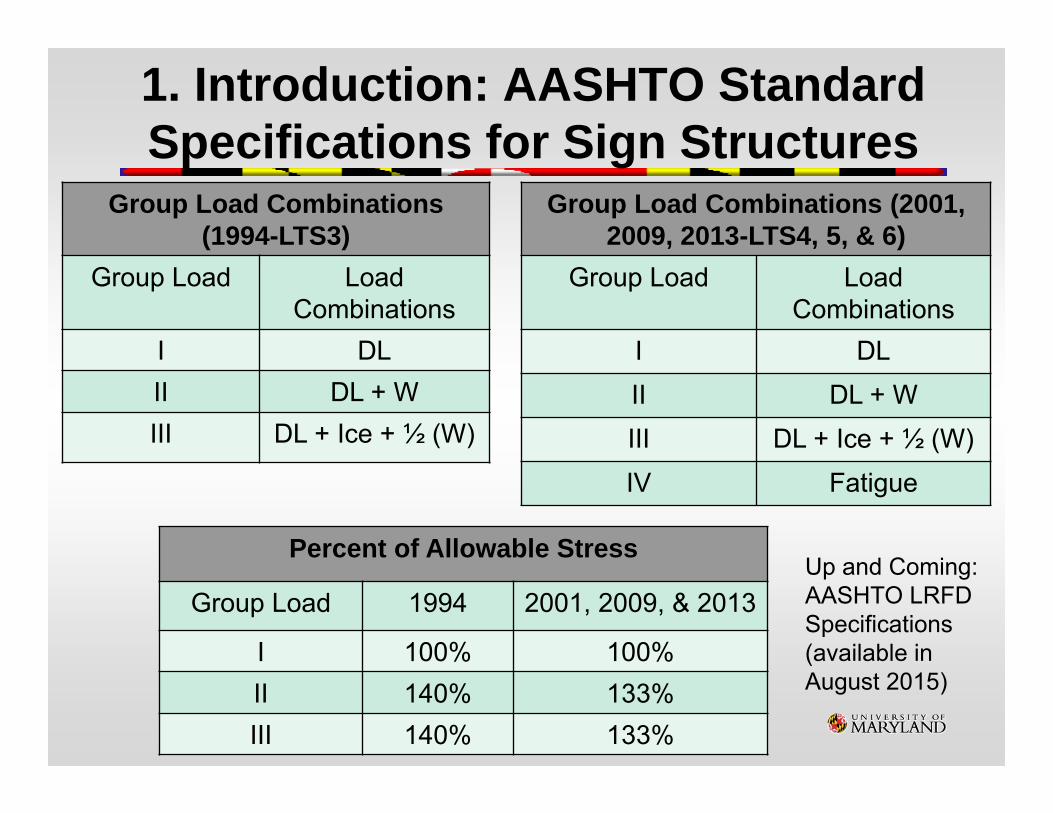
1. Introduction: AASHTO Standard Specifications for Sign Structures
Group Load Combinations (1994-LTS3)
Group Load Load Combinations
I DLII DL + WIII DL + Ice + ½ (W)
Group Load Combinations (2001, 2009, 2013-LTS4, 5, & 6)
Group Load Load Combinations
I DLII DL + WIII DL + Ice + ½ (W)IV Fatigue
Percent of Allowable Stress
Group Load 1994 2001, 2009, & 2013
I 100% 100%II 140% 133%III 140% 133%
Up and Coming: AASHTO LRFD Specifications (available in August 2015)

1. Introduction : Fatigue Design Loads

1. Introduction : Fatigue Design Loads - Galloping
https://www.youtube.com/watch?v=fRIUOXpfiyI
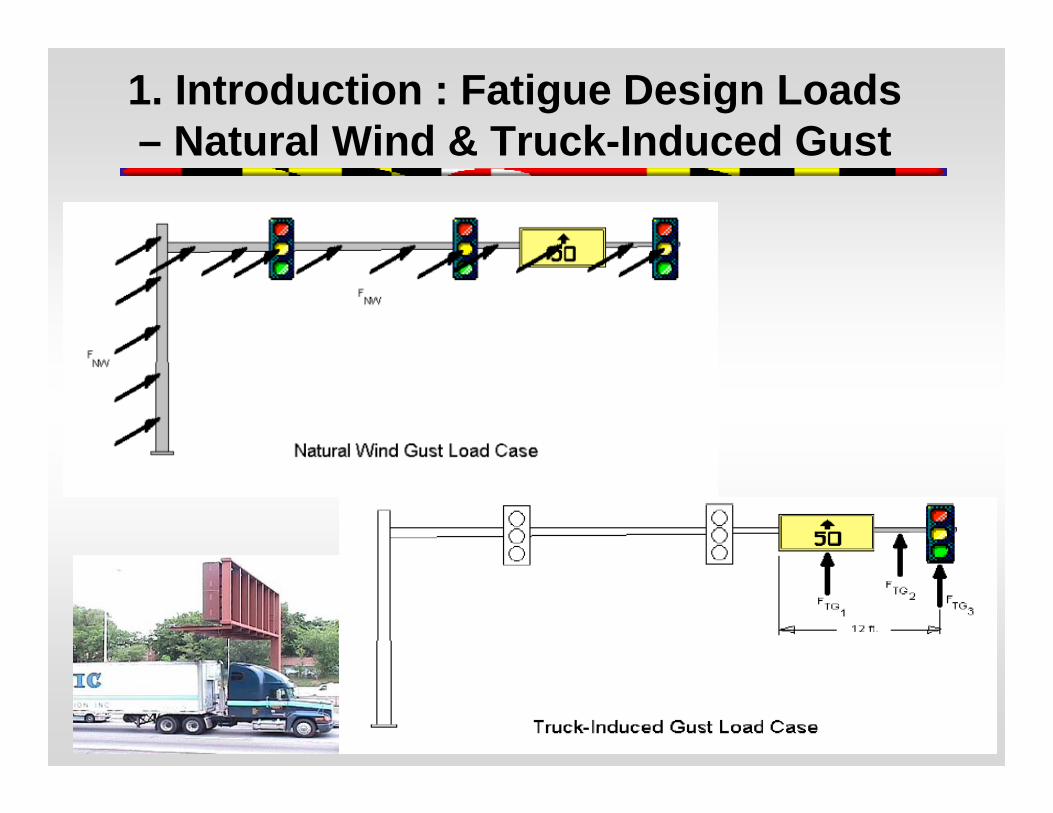
1. Introduction : Fatigue Design Loads – Natural Wind & Truck-Induced Gust

1. Introduction: Fatigue Importance Factors
Fatigue Importance Category Galloping Natural Wind Gusts
Truck-Induced Gusts
Can
tilev
ered
I SignTraffic Signal
1.01.0
1.01.0
1.01.0
II SignTraffic Signal
0.700.65
0.850.80
0.900.85
III SignTraffic Signal
0.400.30
0.700.55
0.800.70
Non
-C
antil
ever
ed
I SignTraffic Signal
xx
1.01.0
1.01.0
II SignTraffic Signal
xx
0.850.80
0.900.85
III SignTraffic Signal
xx
0.700.55
0.800.70
Cat. I - roadways with a speed limit in excess of 60 km/h (35 mph) and average daily traffic (ADT) exceeding 10,000 or average daily truck traffic (ADTT) exceeding 1000Cat. II - speed limits 60km/h (35 mph) or less

4. Task 3 - Fatigue Design and Fatigue Resisting Connections
Collected details of Maryland signal poles which need to be modified in order to increase the fatigue resistance have been identified and recommended by this University of Maryland Research Team. The recommended modifications of current design on the sign/signal pole structures include:a) Chord‐to‐pole connections b) Groove welds for both pole and arm connectionsc) Fillet‐welded end connections e) 6‐bolt/8‐bolt patterns for both arm and pole connections f) Stiffened tube‐to‐transverse‐plate connection

4. Task 3– Fatigue Design Details
10

4. Task 3– Fatigue Design Details
11
Left
Right

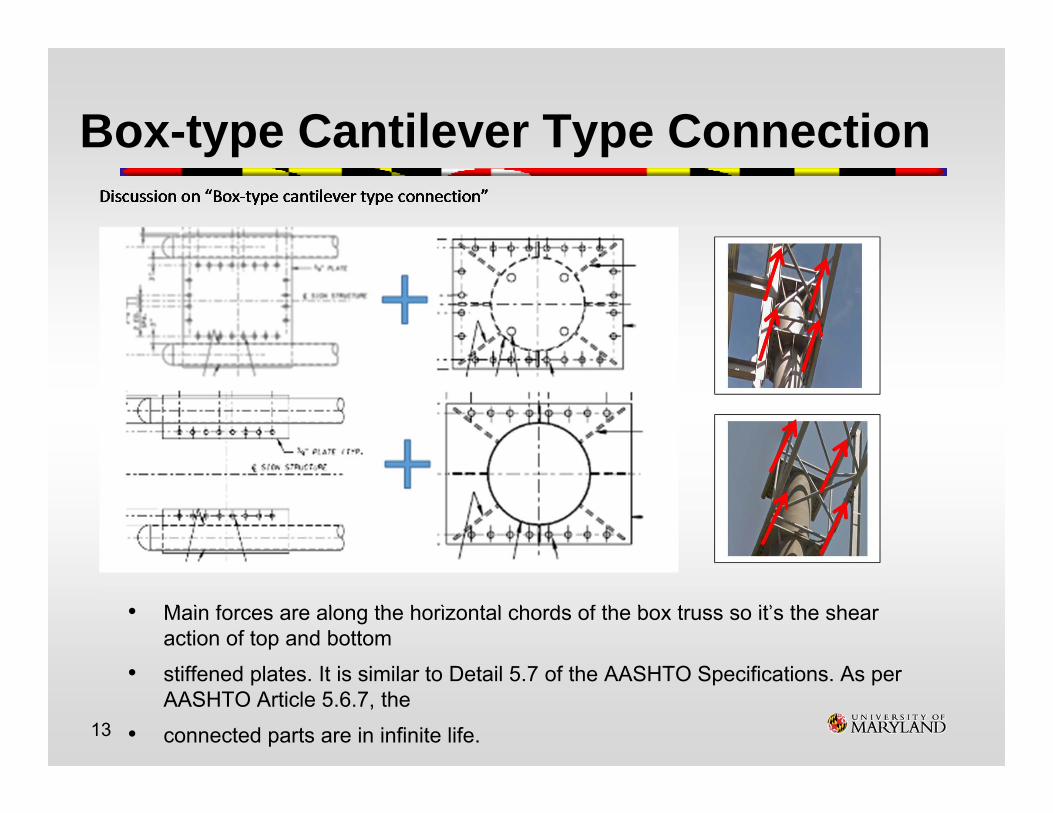
Box-type Cantilever Type Connection
• Main forces are along the horizontal chords of the box truss so it’s the shear action of top and bottom
• stiffened plates. It is similar to Detail 5.7 of the AASHTO Specifications. As per AASHTO Article 5.6.7, the
• connected parts are in infinite life.13
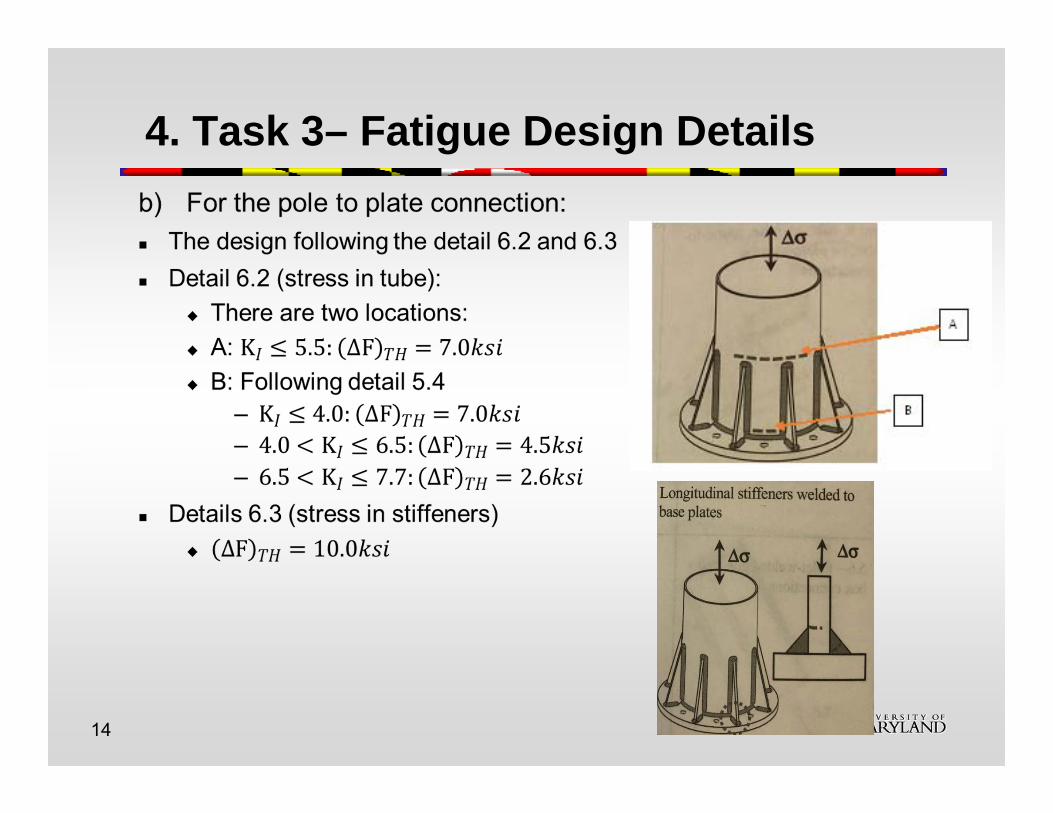
4. Task 3– Fatigue Design Details
14

4. Task 3– Fatigue Design Details
15
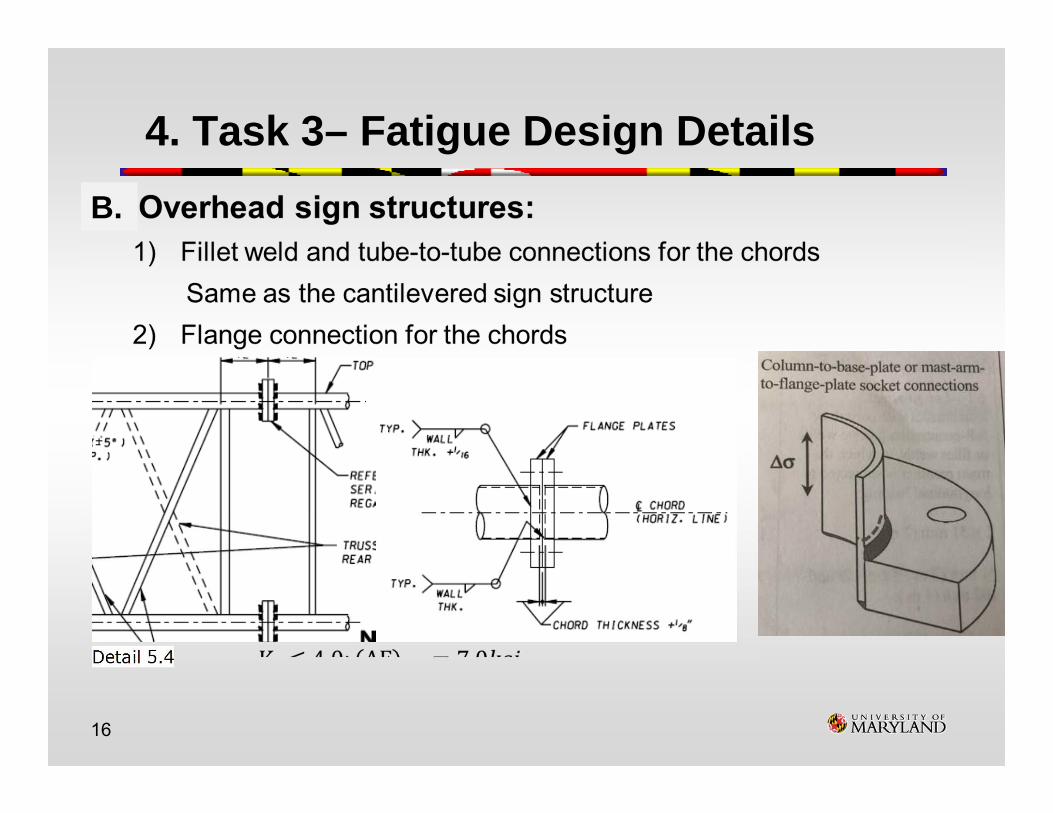
4. Task 3– Fatigue Design Details
16
B.

4. Task 3– Fatigue Design Details
17

4. Task 3– Fatigue Design Details
18

4. Task 3–Strength/Fatigue Design of U-Bolt
Tensile Capacity = 0.56 * (Tensile Strength) * πr2

4. Task 3–Strength/Fatigue Design of U-Bolt
20
Top friction force
Bottom friction force
U-bolt Tensile Force =friction coefficient (0.3) * tube axial force

6. Shaft Foundation Design Check
21

AASHTO LRFD for Cohesive Soils based on Brom’s Method
6. Shaft Foundation Design by LRFD
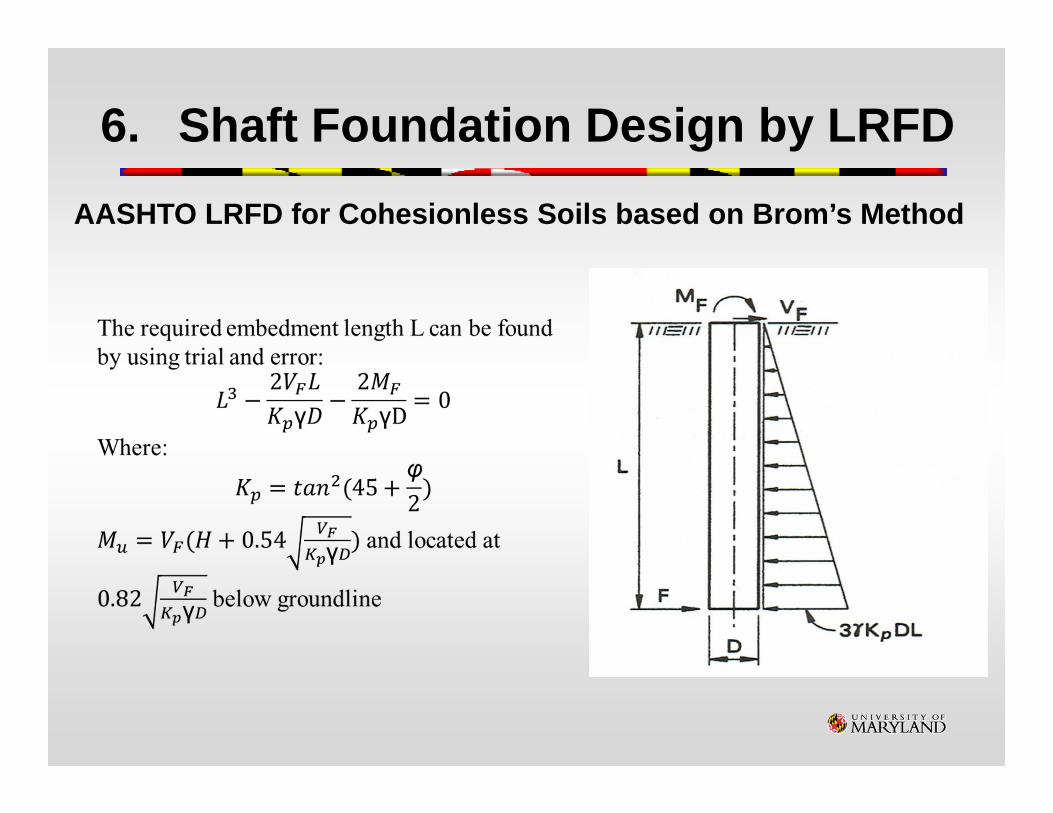
AASHTO LRFD for Cohesionless Soils based on Brom’s Method
6. Shaft Foundation Design by LRFD
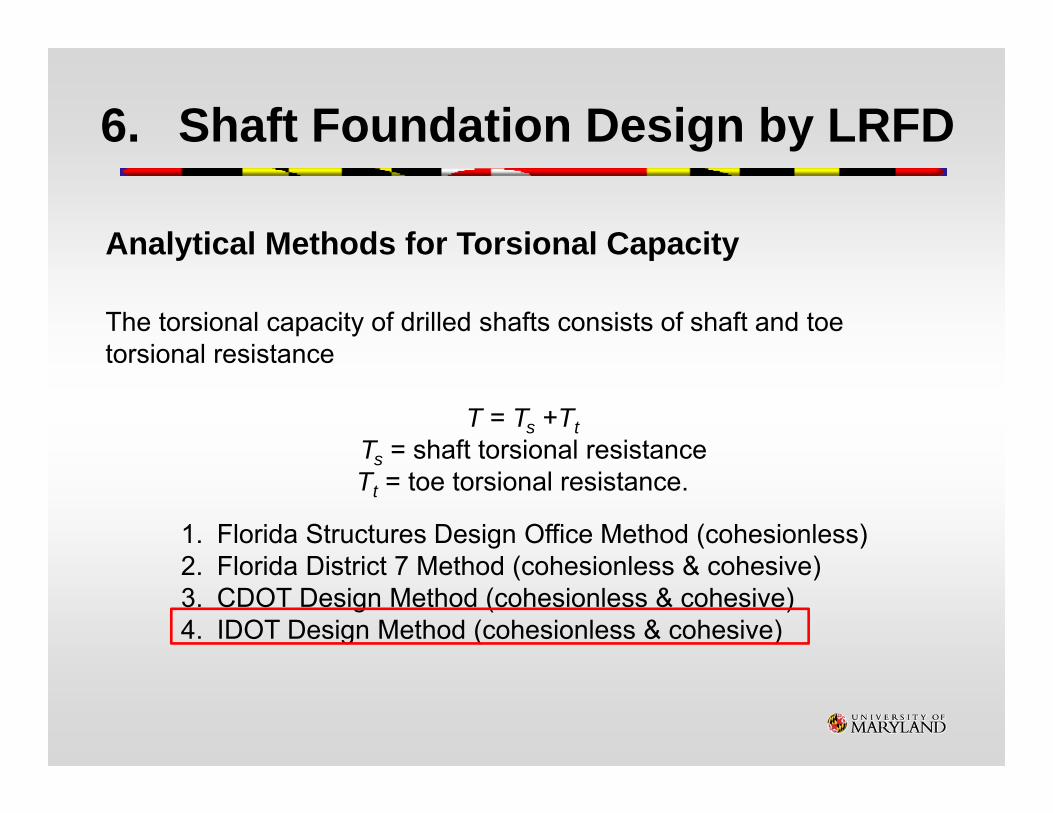
Analytical Methods for Torsional Capacity
The torsional capacity of drilled shafts consists of shaft and toe torsional resistance
T = Ts +TtTs = shaft torsional resistanceTt = toe torsional resistance.
1. Florida Structures Design Office Method (cohesionless)2. Florida District 7 Method (cohesionless & cohesive)3. CDOT Design Method (cohesionless & cohesive)4. IDOT Design Method (cohesionless & cohesive)
6. Shaft Foundation Design by LRFD

IDOT Design Method
Cohesive Cohesionless
c = cohesion (ksf)α = adhesion factor
Analytical Methods for Torsional Capacity
6. Shaft Foundation Design by LRFD

Assumed properties of soil for hypothetical cases
Soil Type Soil Category Cohesion Unit Weight Friction Angle
Cohesive Stiff clay 2.16 (ksf) N/A N/A
Cohesionless Clean gravel-sand N/A 0.12 (kcf) 30
Reference: FHWA-NHI-10-016 (2010). “Drilled Shaft: Construction Procedures and LRFD Design Methods”
AASHTO Load FactorM_factor = 1.6 (Load Combination Strength I)V_factor = 1.6 (Load Combination Strength I)
6. Shaft Foundation Design by LRFD

Case Study - MDSHA Design
6. Shaft Foundation Design by LRFD

Case: Arm length = 75 ftD= 4 ftRebar #: 8Rebar Size: 10(tension control, φ = 0.9Check vertical rebar capacity
0.00
0.20
0.40
0.60
0.80
1.00
1.20
0 0.05 0.1 0.15
Kn
Rn
M&P capacityφM&φP capacityMu&Pu
P-M Interaction diagram
Case Study Result – Rebar Check
6. Shaft Foundation Design by LRFD

Case Study Result – Torsional capacity check
Soil Type Torsional capacity (kip-ft) Max Torsion* (kip-ft)Cohesive 298.6 132Cohesionless 161.8 132
Based on IDOT Design Method
* Pole base of 75’ arm
6. Shaft Foundation Design by LRFD

6. Review: LRFD Shaft Foundation Design
Arm Length
Soil Type Load Type
Design Length(ft)
Required Length(ft)
Length Check
Rebar Check
50ft Cohesive W1 10 7.76 v vCohesionless W1 10 8.92 v v
60ft Cohesive W1 10 8.98 v vCohesionless W1 10 8.24 v v
70ft Cohesive W1 10 9.27 v vCohesionless W1 10 8.78 v v
75ft Cohesive W1 10 9.33 v vCohesionless W1 10 8.89 v v
Case Study Results
Recommended