Epidemiology and control profile of malaria in
Senegal

i
Acknowledgements
We acknowledge all those who have generously provided unpublished data, helped locate
information or the geo-coordinates of data necessary to complete the analyses of malaria risk
across Senegal, especially: Mady Ba, Christian Boudin, Badara Cisse, Feu Kaba Sylla, Mame
Birame Diouf, Bakary Sambou, Ibrahim Socé Fall, Florie Fillol, Florence Migot-Nabias, Julie
Thwing, Moussa Diagne, Malick Ndao Faye, Oumar Gaye, Ousmane Faye, Jean-Louis Ndiaye,
Babacar Faye, Sylvia Males, Libasse Gadiaga, Alioune Gueye, Amadou Niang, Mamadou Demba
Sy, , Rick Paul, Moussa Thior, Jean Francois Trape and Siaka Coulibaly.
In addition, we acknowledge the support of the following institutions: Abt AIRS, Abt Associates,
ADEMAS, Center of Ecological Surveillance (CSE), Child Fund, Institute of Research for
Development (IRD), IntraHealth, Islamic Development Bank, Ministry of Finance, Ministry of
Health and Social Welfare, National Agency of Statistics and Demography (ANSD), Pasteur
Institute of Dakar (IPD), PATH –MACEPA, PGIRE/WB, PMI/USAID/CDC, Speak Up Africa, UCAD,
UNICEF, WHO, RBM/WARN and GFATM.
The report was prepared by the LINK Programme Team at the London School of Hygiene and
Tropical Medicine (David Schellenberg, Cesaire Ahanhanzo, Caroline Lynch, Sarah Saleheen,
Debora Miranda and Dalia Iskander), the Information for Malaria (INFORM) team at the KEMRI-
Wellcome Trust programme, Nairobi (Abdisalan Mohamed Noor, Robert Snow Lukio Olweny,
David Kyalo, Peter Macharia, Paul Ouma, Ezekiel Gogo, Joseph Maina, Stephen Oloo, Thomas
Gachie and Fridah Karimi) who assembled the data and performed the analyses and modeling and
the National Malaria Control Programme of Senegal (Moustapha Cissé, Lamine Diouf, Médoune
Diop, Ibrahima Diallo, Racky Diagne).
The authors acknowledge the support and encouragement of Alastair Robb of the UK
government's Department for International Development (DFID).
This work was supported by funds provided by DFID‐UK to the LINK programme and by grants
from The Wellcome Trust, UK to Professor Bob Snow (#079080) and Prof Abdisalan Mohamed
Noor (#095127).
Suggested citation: PNLP, INFORM and LSHTM (2015). Senegal: A Profile of Malaria Control and
Epidemiology.
Publication
Senegal: A Profile of Malaria Control and Epidemiology – printed October 2015
Epidemiology and control profile of malaria in Senegal – reprinted April 2017
Table of Contents Acknowledgements ........................................................................................................................................................... i
Abbreviations .................................................................................................................................................................... iii
1. Introduction ................................................................................................................................................................... 1
2. Country context ............................................................................................................................................................ 2
2.1 Geography and population ............................................................................................................................... 2
2.2 Administration and policies ............................................................................................................................. 4
2.3 The health system ................................................................................................................................................ 4
2.3.1 Health system structure ............................................................................................................................ 4
2.3.2 Health context and priorities .................................................................................................................. 6
2.3.3 Progress with malaria control in Senegal .......................................................................................... 6
3. Structure and function of the national malaria control programme (NMCP) .................................... 8
3.1 Financing malaria control ................................................................................................................................. 8
3.2 Supply chain overview .....................................................................................................................................10
3.3 Drug and insecticide safety and efficacy monitoring ..........................................................................11
3.4 Data relevant for malaria control ................................................................................................................11
3.4.1 Routine health information system ....................................................................................................12
3.5 Local operational and implementation research ..................................................................................15
4. Mapping malaria risk ...............................................................................................................................................18
5. Malaria control in Senegal - Milestones ............................................................................................................22
6 Overview of technical methods .............................................................................................................................32
6.1 Mapping administrative divisions ...............................................................................................................32
6.2 Database of geolocated health facilities ....................................................................................................34
6.3 Mapping the population of Senegal ............................................................................................................36
6.3.1 Space-time geostatistical modelling ..................................................................................................37
6.3.2 Malaria prevalence survey data in Senegal .....................................................................................39
6.3.3 Malaria vector data in Senegal .............................................................................................................40
6.4.4 ITN/LLIN coverage mapping ................................................................................................................40
7. Mapping malaria risk ...............................................................................................................................................41
7.1 Malaria case and case incidence mapping ...............................................................................................44
8. Entomological profile ...............................................................................................................................................48
9. Intervention coverage ..............................................................................................................................................51
9.1 Insecticide treated mosquito nets (ITN) and long lasting ITN (LLIN) ...........................................51
9.2 Indoor residual spraying .................................................................................................................................55
10. Special considerations ..........................................................................................................................................56
iii
Abbreviations
ACT Artemisinin Combination Therapy ADB African Development Bank
AJOL African Journals Online
AL Artemether-Lumefantrine
AQ Amodiaquine
AS-AQ Artesunate-Amodiaquine
BIC Bayesian Inference Criteria
CAP Center of Poison Control (Centre Anti-poison)
CCPLP Consultation Framework of Partners against Malaria (Cadre de Concertation des
Partenaires de la Lutte contre le Paludisme)
CDC Centers for Disease Control and Prevention
CDMO Chief District Medical Officer (Médecin Chef de District, MCD)
CHW Community Health Worker (Agent de Santé Communautaire, ASC)
CME Medical Commission of the Health facility (Commission Médicale de
l’Etablissement)
CQ Chloroquine CRDT Constrained Refined Delaunay Triangulation
CRMO Chief Regional Medical Officer (Médecin Chef de Région, MCR)
CS Health Centre (Centre de Santé)
CSR Referral Health Centre (Centre de Santé de Référence)
CTE Technical Committee of the Facility (Comité Technique de l’Etablissement)
DCW Digital Chart of the World’s Populated Places
DDT Dichloro Diphenyltrichloroethane
DFID Department for International Development (UK)
DHA-PQ Dihydroartemisinine- Piperaquine
DHS Demographic and Health Surveys
DPM Directorate of Pharmacy and Drugs (Direction de la Pharmacie et des
Médicamens) DRC Democratic Republic of Congo
DSISS Division of Social and Health Information System (Division Système d'Informations
Sanitaires et Sociales)
DSDOM In-house malaria treatment provider (Dispensateur de Soins à Domicile) DVS Dominant Vector Species
ESIA Environmental and Social Impact Assessment
ETM+ Enhanced Thematic Mapper
EVI Enhanced Vegetation Index
FAO Food and Agriculture Organization
FDA Focal drug administration (Traitement focalisé de médicaments)
FEM Fine Element Method
FIND Foundation for Innovative New Diagnostics
GAUL Global Administrative Unit Layers
GDP Gross Domestic Product
GF Gaussian Field
GFATM Global Fund to fight AIDS, Tuberculosis and Malaria
GIS Geographic Information Systems
GLWD Global Lakes and Wetlands Database
iv
GMP Global Malaria Programme, WHO Geneva GMRF Gaussian Markov Random Field
GPS Global Positioning Systems
GRF Gaussian Random Field
GRUMP Global Rural Urban Mapping Project
HDI Human Development Indicators
HFDB Health facility database
INFORM Information for Malaria Project
INLA Integrated Nested Laplace Approximations
IPT Intermittent Presumptive Treatment
IPTp Intermittent Presumptive Treatment in pregnancy
IRS Indoor Residual Spraying
ITN Insecticide Treated Nets
LEVP Laboratory of Vectorial Ecology and Parasitic (Laboratoire d’Ecologie Vectorielle
et Parasitaire) LLINs Long Lasting Insecticidal Nets LNCM National Laboratory for Drugs Control (Laboratoire Nationale de Contrôle des
Médicaments)
MAPE Mean Absolute Prediction Error MARA/ARMA Mapping Malaria Risk in Africa
mASL Metres Above Sea Level
MBG Model Based Geo-Statistics
MDG Millennium Development Goals
MeSH Medical Subject Headings
MICS Malaria Indicator Cluster Survey
MIS Malaria Indicator Survey (Enquête Nationale sur le Paludisme)
MODIS MODerate-resolution Imaging Spectroradiometer
MPAC Malaria Policy Advisory Committee
MPE Mean Prediction Error
MPR Malaria Programme Review
MSAS Ministry of Health and Social Welfare (Ministère de la Santé et de l'Action Sociale)
NHDP-II National Health Development Plan-II (Plan National de Développement Sanitaire -
II) NMCP National Malaria Control Programme
NMSP National Malaria Strategic Plan
OA Open Access
ODA Overseas Development Assistance
PAPfPR2-10 Population adjusted PfPR2-10
PCR Polymerase Chain Reaction
PDP Product Development Partnership
PECADOM Prise En Charge A Domicile
PfPR2-10 Age-corrected Plasmodium falciparum parasite rate
PMI President's Malaria Initiative
PNA National Supply Pharmacy (Pharmacie Nationale d'Approvisionnement)
PPP Purchasing Power Parities
PRA Regional Supply Pharmacy (Pharmacie Régionale d'Approvisionnement)
PS Health post (Poste de Santé)
PSI Population Services International
v
QAMSA Quality of antimalarials in selected African countries
R&D Research and Development
RBM Roll Back Malaria
RDTs Rapid Diagnostic Tests
SD Standard Deviations
SMC Seasonal Malaria Chemoprevention
SNAME Système d'Approvisionnement en Médicaments Essentiels
SP Sulphadoxine-Pyrimethamine
SPDE Stochastic Partial Differential Equations
SRTM Shuttle Radar Topography Mission
TSI Temperature Suitability Index
UCAD University Cheikh Anta Diop of Dakar
UN United Nations
UNDP United Nations Development Programme
UNHCR United Nations High Commissioner for Refugees
UNICEF United Nations Children's Fund
UNOCHA United Nations Office for the Coordination of Humanitarian Affairs
USAID United States Agency for International Development
WHO World Health Organization
1
1. Introduction The use of malariometric data, maps and epidemiological intelligence was a routine feature of
control planning across most African countries during the Global Malaria Eradication
Programme (GMEP) era from the mid-1950s. Data included epidemiological descriptions of
transmission, vectors, topography and climate. More than 50 years ago the infection prevalence
among children aged 2-10 years (PfPR2-10) was recognised as one important source of
planning data and used to define categories of endemic risk designed. These were used to guide
and monitor progress toward malaria elimination targets.
The art and skills necessary to design malaria control based on an understanding of the spatial
epidemiology was lost during the 1970s when the agenda for malaria control fell under a less
specialised, integrated primary care mandate focused on managing fevers. In 1996, a plea was
made for better malaria cartography to guide malaria control in Africa1,2and over the last decade
there has been enormous growth in spatial data on malaria and populations which was not
available to malariologists or programme control managers 60 years ago. The growth in data has
been accompanied by the development of statistical approaches to model and map risk and
intervention access in space and in time using Model Based Geostatistics (MBG).3
At the launch of the Roll Back Malaria (RBM) partnership, calls for universal coverage of all
available interventions was probably an appropriate response to the epidemic that affected
most of sub-Saharan Africa during the mid-late 1990s.4,5 A decade on, the international donor
community is constrained by the global financial crisis; accessing overseas development
assistance (ODA) and using limited national domestic funding for malaria control now requires a
much stronger evidence-based business case. These future business cases must be grounded in
the best possible epidemiological evidence to predict the likely impact of future intervention,
assess the impact of current investment and, equally important, demonstrate what might happen
should funding and intervention coverage decline.
This epidemiological profile of malaria in Senegal attempts to assemble a brief history of
malaria control in Senegal and the epidemiological evidence base for a more targeted approach
to malaria control. It draws together data on parasite transmission risk from household surveys,
malaria cases from routine systems, the distribution of dominant vector species and coverage of
insecticide-treated mosquito nets (ITN). This information is described by health district, and
could inform the planning of targeted sub-national control efforts to accelerate progress
towards the targets specified in the national malaria strategic plan.
1 Snow RW, Marsh K, le Sueur D (1996). The need for maps of transmission intensity to guide malaria control in Africa. Parasitology Today, 12: 455–457. 2 Snow RW and Noor AM (2015). Malaria risk mapping in Africa: The historical context to the Information for Malaria (INFORM) project. Working Paper in support of the INFORM Project funded by the Department for International Development and the Wellcome Trust, Nairobi, Kenya June. http://www.inform-malaria.org/wp-content/uploads/2015/07/History-of-Malaria-Risk- Mapping-Version-1.pdf Accessed 30 March, 2017. 3 Diggle PJ and Ribeiro PJ (2007). Model-Based Geostatistics. New York: Springer. 4 World Health Organization (2000). The Abuja Declaration and the Plan of Action. An extract from the African Summit on Roll Back Malaria, Abuja, 25 April 2000 (WHO/CDS/RBM/2000.17). 5 Snow RW, Amratia P, Kabaria CW, Noor AM, Marsh K (2012). The changing limits and incidence of malaria in Africa: 1939- 2009. Advances in Parasitology, 78: 169–262.
2
2. Country context
2.1 Geography and population
Senegal is the western-most country in sub-Saharan Africa, situated in the northern hemisphere
(between 12° 30 and 16° 30 North, 1° 30 and 17° 30 West), with a land mass of 196,772 square
kilometres and a population of approximately 13 million. Senegal shares land borders with
Mauritania in the north, Mali in the east, Guinea and Guinea Bissau in the south, and is bounded
to the west by its 700 km coast along the Atlantic Ocean. Senegal almost completely envelops
The Gambia, between the regions of Kaolack, Kaffrine and Tambacounda on the north, and
Ziguinchor, Sedhiou and Kolda in the south, along the lower course of the River Gambia.
Senegal is a flat country, its altitude rarely over 100 m (Figure 2.1). The Assiriki Hill, in the
south-east, has a height of 381 m. The country is crossed from east to west by four rivers –
Senegal, Gambia, Casamance and Saloum. This network is complemented by temporary streams
and Lake Guiers in the north. The development of dams such as the Diama, Affiniam and Anambé
dams, as well as the micro-dams of the southern regions, support irrigation and prevent
saltwater intrusion. However, they also provide an ecological setting that encourages the year-
round emergence of malaria vectors.
From three million inhabitants in 1960, the population grew to 13.9 million in 2014. The total
population is growing by more than 260,000 people per year, (2.7%), although recent decades
have seen a net migratory flow of 20,000 departures per year. According to 2014 estimates,
55% of the population lives in rural settings and nearly two-thirds are under the age of 25.
The overall population density is 70 inhabitants per square kilometre, with lower densities in
the east and higher densities towards the coast (Figure 2.1). The highest populations are found
in the regions of Dakar, Thiès and Diourbel with, respectively 3,139,325 (23.2 % of the total
population), 1,789,923 (13.3 %) and 1,499,867 (11.1 %) inhabitants. Kedougou region has the
lowest population size with 151,715 inhabitants (1.1%). Tambacounda, which represents the
largest region (21.5% of the country’s land mass), accounts for only 5% of the population. The
country is divided into three climatic zones of high, medium and low rainfall, corresponding to the
forest in the south, the tree savannah in the centre and the desert area in the north, respectively.
The central region has a dry season from November to June and a rainy season from July to
October.
3
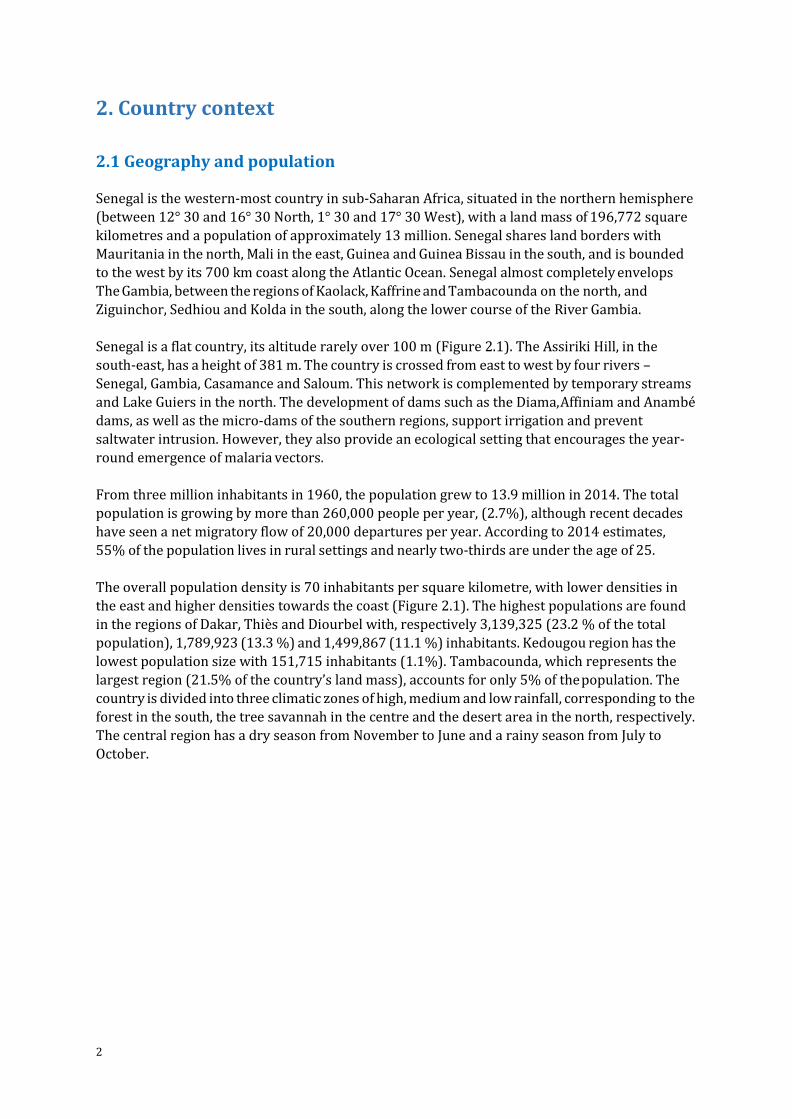
Figure 2.1 Extents of major Senegalese rivers, cities and towns, and their elevation
Population distribution predictions for the year 2010 were derived from the population
products shown in Figure 6.3 (see Section 6). The population distribution provided at 100 m
spatial resolution was resampled in ArcGIS (ver10.1 ESRI, USA) to obtain population density per
km2. A population density threshold of greater than 1000 persons per km2 was used to identify
urban settlements, a threshold found to significantly influence malaria prevalence (C Kabaria,
personal communication). Polygons covering an area greater than 5 km2 with population
density across the polygon of >= 1000 people per km2 were selected. These were then matched
to a place name gazetteer of Senegal (www.geonames.nga.mil/gns/) to identify 34 major urban
settlements shown in the figure. These include Bambey, Diourbel, Khombole, Mbacke, Sessene
(Diourbel region), Fatick, Gossas, Guinguineo, Sokone (Fatick region), Kaffrine, Kaolack,
Koungheul, Nioro du Rip (Kaolack region), Kolda and Medina Gounass (Kolda region), Dahra,
Darou Mousty, Kebemer, Linguere, Louga (Louga region), Dagana, Saint-Louis, Richard Toll
(Saint-Louis region), Kedougou (Tambacounda region), Joal-Fadiout, Mboro, Nguekokh, Thies,
Saly-Portudal, Thies, Tivaouane (Thies region), Bignona and Ziguinchor (Ziguinchor region),
Greater Dakar (Dakar, Pikine, Rufisque) and Sebikhoutane (Dakar region).
Digital elevation from sea level (light brown) to maximal elevation of 564 m above sea level
(dark brown).
Goree island is one of the 19 communes d'arrondissement of the city of Dakar located 2 km from
the main harbour of Dakar; its official population in 2005 was 1,056 inhabitants; Morfil (Ivory
Island) lies between the River Senegal and the Doué River in northern Senegal and has two main
towns, Podor and Salde.
References
30m ASTER DEM: www.asterweb.jpl.nasa.gov/gdem
Rivers from Global Lakes and Wetlands Database: GLWD; www.worldwildlife.org/ GLWD
4
2.2 Administration and policies
Senegal is a democratic country ruled by a president. The president appoints the prime minister
who is responsible for conducting the government’s action plan. The National Assembly
comprises 150 deputies elected for five year periods and is mandated to make laws and ensure
their enforcement.
In order to bring public services closer to the population, and to accelerate development
processes, the country adopted policies of decentralisation in the 1990s which increase political
and management authority in sub-national administrative levels such as regions, cities and
towns. Cities and towns are led by elected mayors who, together with their executive boards,
are able to generate and manage resources for the benefit of their territory.
The adoption of the Millennium Development Goals (MDGs) in 2000 catalysed serial reforms by
the government of Senegal. This led to radical shifts in policy vis-à-vis the social sectors. Policies
were developed in the context of the poverty reduction strategy to reduce the deleterious
effects of internal and external shocks on the economy, in particular for vulnerable groups.
Policies aimed to eradicate extreme poverty and hunger, promote universal access to basic
education, enhance the quality of primary care to reduce infant and maternal mortality,
promote gender equality, empower women, and improve access to safe drinking water.6
Monetary poverty – defined as the proportion of the population living on less than $1 (PPP) per
day7 – decreased from 55.2% to 48.7% between 2001-2002 and 2005-2006, and was 46.7% in
2011. Rural populations, where 57.1% live in monetary poverty, are generally worse off than
populations in Dakar (26.1% in poverty) and other cities (42.1%).
The government’s social and economic development model is articulated in its Emerging Plan for
Senegal (Plan Sénégal Emergeant - PSE) which sets targets for 2035. The emphasis is on jobs and
welfare creation, the strengthening of governance, the development of strategic sectors which
will improve population wellbeing, especially through the protection of vulnerable groups and by
ensuring access to essential services.8
2.3 The health system 2.3.1 Health system structure The Ministry of Health is responsible for health policy and prioritisation. It develops national
health guidance and policies and is responsible for their implementation and for monitoring
their progress. It is also responsible for providing the necessary materials, equipment and
training for health staff to fulfil their responsibilities.
The public health system is arranged as a three tiered structure: hospital level; health centre
(Centre de Santé) level and health post (Poste de Santé) level. Although the rural health
6 Diagne A, Cabral FJ, Cisse F (2011) Assessing Development Strategies to Achieve the MDGs in Senegal. UN Department of Economics and Social Affairs. March 7 International Development; Monetary Approach; http://internationaldevelopment.wikia.com/wiki/Monetary_Approach Accessed 30 March, 2017. 8 Ministry of Health (2014). National Strategic Framework for 2014–2018: 8
5
points/huts (Case de Santé) are not generally considered part of the formal heath system they are
nevertheless supported by it.
The central level is made up of two important directions of the MSAS: the General Directorate of
Health and the Directorate of Social Welfare. The National Malaria Control Programme (NMCP)
is under the General Directorate of Health, which in turn is under the direction of Disease Control.
There are 14 health regions, corresponding to the administrative regions. Each health region is
headed by a Chief Regional Medical Officer (CRMO or Médecin-Chef de Région, MCR) who
manages the regional health team made up of the supervisors of the various programs. The
health regions oversee implementation of the health programmes and the management of
public and private facilities in the region. Hospitals report to the regional authorities. In 2012, the
country had 35 hospitals, each with a board of trustees, a director and two advisory bodies: the
Medical Commission of the Facility (Commission Médicale de l’Etablissement - CME) and the
Technical Committee of the Facility (Comité Technique de l’Etablissement – CTE)9 The country
has two university hospitals (CHNUs) offering teaching facilities for doctors and referral
facilities for regional hospitals (CHRs).
Under the health regions are the 76 health districts, which may or may not match the
administrative districts. These are managed by a Chief District Medical Officer (CDMO, known
locally as Médecin Chef de District, MCD) and practice medicine in its four dimensions: treatment, prevention, social and educative. Each health district has at least one health centre
(89 in total). Health centres are the highest level of the rural healthcare system, staffed by one or
two medical doctors, and 15-20 health staff. District health centres provide first-level referrals
and limited hospitalisation services with between 10 to 20 beds.
Below the health centres is a network of health posts (1,247 in total). These typically have four
or five health workers with no medical doctor and provide both preventive and primary
curative services, such as care for chronic patients (tuberculosis patients), prenatal care, family
planning, and health promotion/education activities. Health posts supervise the health huts
(2,162 in total) and rural maternity homes (129). The provision of health care at the community
level has been developed during the last three decades and consolidated through the National
Strategic Plan for Community Health.10 Rural health huts are managed by local communities and
usually staffed by one or two trained Agent de Sante Communautaire or community health
workers (CHWs), matrons (trained birth attendants) and relais, who are health educators and
communicators. Malaria prevention activities, case management and other interventions for
child survival are delivered through the health huts.
In villages where there is no health hut or other health facility, the NMCP has trained home-
based health care providers (DSDOM) who are responsible for home-based malaria case
management. There were 1,992 DSDOM in 2015, of whom 515 were trained not only in malaria
case management but also to deal with Acute Respiratory Infections and diarrhoea in children
under 5 years old. Referral and counter- referral mechanisms have been established to facilitate
case management and to ensure the transfer of health information between the peripheral level
(including health centres and health posts) and hospitals and other facilities.
Health care provision is mainly carried out by the public sector but complemented by the private
sector, which is loosely integrated into the implementation of the national health programmes’ 9 Government of Senegal Decree No. 98-701. 10 Senegal: Ministere de la Sante et de l’Action Sociale (2014). Direction Generale de la Sante. Plan Strategique de Sante Communautaire 2014–2018
6
policies. In 2001, 58% of the population was estimated to live at less than 30 minutes away from
a health facility (health post or higher), but these figures vary across the country – 80% in urban
areas, 42% in rural settings. Approximately one-third of the population was living less than 5 km
away from a health post or higher facility.
2.3.2 Health context and priorities The priority objectives of the second National Health Development Plan (NHDP-II, 2009-2018)
and the operational plan for 2014-2018 include the reduction of maternal and child mortality,
the control of fertility and increased access to basic services for the poor.11 These are being
achieved by work to:
guarantee access to quality health care for the whole population, regardless of
socio- economic status
deepen decentralisation and local health governance
promote health insurance coverage
ensure the protection of vulnerable groups
strengthen private-public partnership
promote multi-sectorality in health
align external assistance and support to national health priorities
grow the results-based management mechanism
In 2011 the all-cause mortality rate in children under five years was 72 deaths per 1000 live-
births, and maternal mortality was 392 deaths per 100,000 live-births.12 The major causes of
morbidity in Senegal are infectious diseases. In 2011, malaria was estimated to account for 6.1%
of all morbidity and 11% of all mortality.13
The DHS-MICs 2010-2011 drew attention to other important causes of morbidity. In the week
before the surveys 5% of children under five were estimated to have suffered an Acute
Respiratory Infection (ARI), 21% a diarrheal disease and 18% were found to be underweight. In
2011, HIV prevalence in the general population was 0.7% and the incidence of tuberculosis was
85.7 new cases per 100,000 inhabitants.
2.3.3 Progress with malaria control in Senegal Malaria transmission occurs during the rainy season and the first month of the dry season,
when densities of the vector populations are high. Malaria is unequally distributed across the
country and according to socio-demographic as well as ecological determinants.
Overall malaria risk has declined in Senegal between 2008 and 2014. Large-scale household
surveys (e.g. Demographic and Health Surveys [DHS]14 Malaria Indicator Surveys [MIS]) found
5.9% of children under five years infected with P falciparum in 2008, falling to 1.2% in 2014.
The prevalence of infection varies across the regions, with higher figures (up to 5.9%) in
southern regions (Ziguinchor, Tamba, Sédhiou, Kolda, Kédougou), intermediate figures (0.3%)
11 Continuous Demographic and Health Survey (2012). http://dhsprogram.com/what-we-do/survey/survey-display-423.cfm Accessed 30 March, 2017. 12 Senegal: 2013 Annual Health Statistics. https://www.measureevaluation.org/his-strengthening-resource-center/resources/national-health-statistics-report-annual Accessed 30 March, 2017. 13 Senegal: Special NMCP Statistics Report for 2010-2013: 3–4 14 Demographic and Health Surveys. http://www.dhsprogram.com/data/available-datasets.cfm Accessed 15 March, 2017.
7
in central regions (Diourbel, Kaolack, Fatick, Kaffrine) and the lowest values in western (Dakar,
Thiès at 0.2%) and northern regions (0.1% in Louga, Saint Louis and Matam).
Progress with control is not expected to be homogeneous and it will become increasingly
important to understand variations in malaria epidemiology with greater spatial resolution. The
DHS and other nationally representative household surveys are designed to be representative at
the regional level. However, the operational unit for malaria control is the district and ensuring
the availability of key information on malaria risk at this level will become increasingly
important.
As disease risk falls the efficiency and utility of household surveys to monitor progress with
transmission reduction will also fall. At some levels of transmission, it will become important to
monitor case incidence, and then absolute case numbers. This will depend on the reliable
capture and forwarding of data on parasitologically confirmed malaria cases presenting to
health facilities.
8
3. Structure and function of the National Malaria Control Programme (NMCP)
The National Malaria Control Programme (NMCP) coordinates malaria control and ensures the
development and implementation of annual work plans. It ensures information sharing with
stakeholders and develops and disseminates reports on activities carried out in collaboration
with partners. The NMCP is responsible for resource mobilisation and advocacy.15 The NMCP is
made up of the programme manager and the deputy programme manager, assisted by a secretariat and supported by a number of officers heading units set up to deal with each type of
intervention and critical activity.
The NMCP performs its mission in collaboration with financial and technical partners, as well as
representatives from collaborating units in the Ministry of Health and Social Welfare (MSAS)
and other ministries, research and training institutes, regional and medical district personnel
and other stakeholders. The medical regions coordinate implementation and follow-up
activities and oversee health districts’ performance. The health district plans and implements
specific malaria control activities and supervises front-line staff.
To better involve and coordinate partners in the national fight against malaria, a consultation
framework for the partners’ fight against malaria (CCPLP) has been established16 Its mission is
to participate in progress monitoring through data analysis in order to identify bottlenecks and
suggest solutions; make suggestions on strategic directions, taking into account the new
changes occurring in the fight against malaria in the country; participate in the mobilisation of
resources for the implementation of activities; and participate in partners’ information updates
relevant to malaria control. The CCPLP also provides a decision making framework.
3.1 Financing malaria control
The share of the government budget allocated to health has steadily increased in recent years,
from XOF 36 billion (US$ 72 million) in 1998 to XOF 90.5 billion (US$ 181 million) in 2008, and
XOF 105.9 billion (US$ 212 million) in 2011 to XOF 110.5 billion (US$ 220 million) in 2012. This
figure represents 10.4% of the government’s operating budget.17
Domestic investment in malaria control averaged XOF 120.9 million per year between 2005 and
2013, equivalent to 0.12% of the total health budget. Absolute investments ranged from a low of
XOF 13.7 million in 2012 to XOF 357 million in 2009, an almost 30-fold variation. These figures
should be treated with caution: there is a need for greater clarity over investments in malaria
and, in particular, agreement on how the costs of the personnel and infrastructure required
for the supply and prescription of malaria - but also other, non-malaria conditions - at all levels
of the health system, should be apportioned to malaria control.
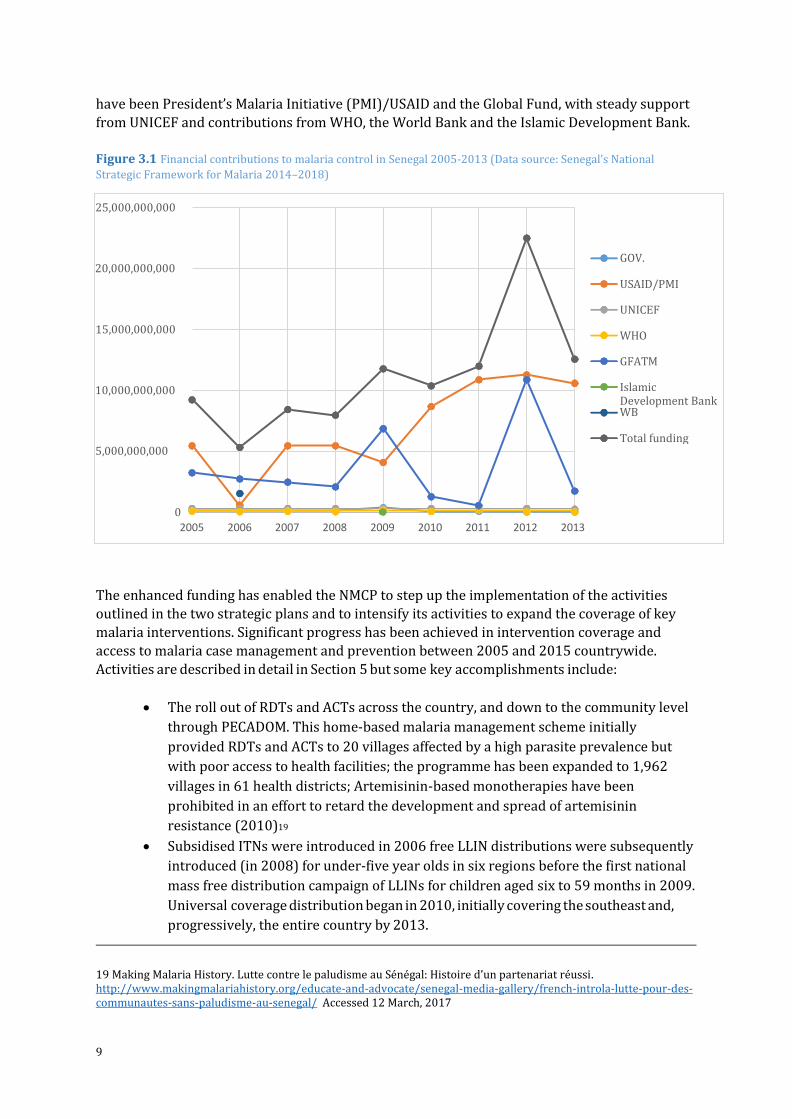
Total funding to Senegal’s NMCP rose from XOF 9.22 billion in 2005, through a high of XOF
22.51 billion in 2012 to XOF 12.57 billion in 201318 (Figure 3.1). The main external contributors
15 Making Malaria History. Lutte contre le paludisme au Sénégal: Histoire d’un partenariat réussi. http://www.makingmalariahistory.org/educate-and-advocate/senegal-media-gallery/french-introla-lutte-pour-des-communautes-sans-paludisme-au-senegal/ Accessed 12 March, 2017 16 Ibid. 17 Demographic and Health Survey (2012): p18 18 Average conversion rate used: USD/XOF = 500
9
have been President’s Malaria Initiative (PMI)/USAID and the Global Fund, with steady support
from UNICEF and contributions from WHO, the World Bank and the Islamic Development Bank.
Figure 3.1 Financial contributions to malaria control in Senegal 2005-2013 (Data source: Senegal’s National
Strategic Framework for Malaria 2014–2018)
The enhanced funding has enabled the NMCP to step up the implementation of the activities
outlined in the two strategic plans and to intensify its activities to expand the coverage of key
malaria interventions. Significant progress has been achieved in intervention coverage and
access to malaria case management and prevention between 2005 and 2015 countrywide.
Activities are described in detail in Section 5 but some key accomplishments include:
The roll out of RDTs and ACTs across the country, and down to the community level
through PECADOM. This home-based malaria management scheme initially
provided RDTs and ACTs to 20 villages affected by a high parasite prevalence but
with poor access to health facilities; the programme has been expanded to 1,962
villages in 61 health districts; Artemisinin-based monotherapies have been
prohibited in an effort to retard the development and spread of artemisinin
resistance (2010)19
Subsidised ITNs were introduced in 2006 free LLIN distributions were subsequently
introduced (in 2008) for under-five year olds in six regions before the first national
mass free distribution campaign of LLINs for children aged six to 59 months in 2009.
Universal coverage distribution began in 2010, initially covering the southeast and,
progressively, the entire country by 2013.
19 Making Malaria History. Lutte contre le paludisme au Sénégal: Histoire d’un partenariat réussi. http://www.makingmalariahistory.org/educate-and-advocate/senegal-media-gallery/french-introla-lutte-pour-des-communautes-sans-paludisme-au-senegal/ Accessed 12 March, 2017
25,000,000,000
GOV. 20,000,000,000
USAID/PMI
UNICEF
15,000,000,000 WHO
GFATM
10,000,000,000 Islamic Development Bank WB
Total funding 5,000,000,000
0
2005 2006 2007 2008 2009 2010 2011 2012 2013
10
IRS has been implemented in a total of seven health districts.
Sentinel sites were established to monitor progress with malaria control.
However, the strong dependency on external partner contributions represents a risk to
sustainability.
3.2 Supply chain overview
A major reform of the national supply chain management was initiated in 2010. The national
supply system for drugs and health products depends primarily on the National Supply
Pharmacy (PNA), which is responsible for the procurement of drugs and other health products
for the public sector. It is a non-clinical, parastatal public health establishment under the
supervision of the MSAS but with management autonomy. It is governed by the public contracts
code and uses international competitive tenders for drugs and supplies procurement.
The PNA distributes commodities through its regional warehouses – Regional Supply Pharmacy
(PRA) – and has recently set up mobile supply warehouses for regions without a PRA. The
central warehouse of the PNA distributes supplies to PRAs, which in turn supply peripheral
structures (health districts, regional hospital and other health structures). District warehouses
resupply from PRAs, and supply health posts, health huts and PECADOM sites. The PNA is
responsible for distribution of commodities from the national to regional level warehouses.
Health structures at the peripheral levels in the system, such as health posts, submit stock
requisitions to district health/stock personnel to express their commodity needs. Districts
aggregate health facility data and send those to the PRA. The PRA prepares supplies which,
when ready, are collected by the district. Each service delivery point is responsible for collecting
their respective supplies from the district stockists.
The NMCP has a memorandum of understanding with the PNA through which the storage and
distribution of malaria commodities (ACTs and RDTs) is managed. Due to the logistics of
managing very large quantities of LLINs, private transporters, and occasionally the army, assists
with storage and transport of nets. LLINs are distributed to the population through two main
approaches: (i) mass campaigns for their free distribution and (ii) routine distribution, based on
the demand of clients, through multiples channels. This includes free distribution for pregnant
women and with subsidised costs for the rest of the population, free distribution in schools, and
subsidised distribution through community based organisations, private pharmacies and
grocery stores. Private pharmacies also supply malaria drugs. In mid-2013, 963 private
pharmacies were recorded in Senegal but more than 62% of these were in the Dakar region.
Private outlets play a limited role in the supply of malaria commodities to the target population.
Since the reform of the PNA, the availability of ACTs has increased (pre-reform 14%, post
reform >90%).20 In 2014, Rapid Diagnostic Tests (RDTs) were estimated to be available in more
than 90% of health structures (excluding health huts), 98% of public sector facilities and 75% of
private sector facilities. First-line ACTs for children, adolescents and adults were available in
86%, 61% and 70% of public health facilities above health hut level. The ACTs for children were
available in just over half (53%) of the health huts. Availability of ACT in the private sector was
lower than for the public sector with ACTs available for child, adolescent and adults in 47%,
20 Service Provision Assessment, Senegal (2014) http://dhsprogram.com/pubs/pdf/OF25/OF25.pdf Accessed 15 March, 2017.
11
35% and 41% of facilities, respectively. Mosquito nets for continuous distribution were
available in nearly half of all facilities (47%).21
Quality assurance of products is the responsibility of the Directorate of Pharmacy and Drugs
(DPM), the National Laboratory for Drugs Control (LNCM), and the national commission in
charge of pesticides and chemical products management, located in the Ministry of Environment
and Wildlife Protection. These institutions collect samples of procured commodities, including
drugs, for quality assessments. While there is limited published research as to the quality of
antimalarials in Senegal, WHO/QAMSA reported that 43% of antimalarial samples from Senegal
did not meet requirements for visual inspection, identification, drug content or disintegration,
with sulphadoxine-pyrimethamine (SP) being the most likely antimalarial to fail (2009).22
3.3 Drug and insecticide safety and efficacy monitoring
Malaria drug safety is monitored through national pharmacovigilance plan in collaboration with
the DPM, started under a 2006 NMCP initiative. The safety of insecticides and LLINs is the
responsibility of the Centre of Poison Control (CAP) which works to strengthen clinical
toxicology.
A wide range of drug efficacy, tolerability and safety studies are carried out by the University
Cheikh Anta Diop of Dakar (UCAD), and other research institutions. Since 2008, insecticide
sensitivity testing has been undertaken by UCAD’s Laboratory of Vector and Parasitic Ecology
(LEVP)23, with financial support from PMI/USAID. Surveillance includes sites in 23 districts
across Senegal. Evaluations of the following insecticides have been carried out so far:
deltaméthrine 0.05%, lambdacyhalothrine 0.05%, perméthrine 0,75%, DDT 4%, bendiocarb 0,1%, fenitrothion 1% (2008-14); alphacypermethrin (2013-14); cyfluthrin (2011-14); dieldrin,
malathion 5% (2011-13) and primiphos-methyl (2012-13). While no resistance was recorded to
primiphos-methyl - 100% sensitive across all 23 districts where it was tested in 2013 and 2014
- malathion 5%, and fenitrothion 1%, were respectively found sensitive in 13 out of 15, and in
13 out of 19 sites where they were tested between 2008 and 201424
3.4 Data relevant for malaria control
Data used to inform malaria control in Senegal comes from four main sources: (i) routine health
information, which gathers data from the public health system and may be complemented by
other types of official data, such as socio-demographic information; (ii) data from sentinel
surveillance sites; (iii) large-scale household (DHS, MICS, MIS) and health facility surveys (SPA);
and (iv) operational research and intervention studies.
The analyses presented here are based largely on data from cross-sectional household surveys
and are described in detail in Section 4, overview of technical methods. Here we briefly describe
the routine health information system and sentinel sites, and give examples of data generated
through operational research.
21 Service Provision Assessment, Senegal (2014) http://dhsprogram.com/pubs/pdf/OF25/OF25.pdf Accessed 15 March, 2017. 22 WHO-USP (2009) Survey of the Quality of Selected Antimalarial Medicines Circulating in Madagascar, Senegal, and Uganda. 23 Laboratoire d’Ecologie Vectorielle et Parasitaire. 24 Insecticide resistance monitoring from 2008 to 2014. Excel sheet from PNLP.
12
3.4.1 Routine health information system Data are routinely reported from public health facilities on a monthly basis. These include all
health information – including that relevant to malaria – as well as information on human
resources and equipment allocated by the government to health facilities. Data from health
districts’ datasets are aggregated and collated in a national database. Malaria data are
collected from patients of all ages but analyses emphasise the most vulnerable groups: children
under-five years and pregnant women.
Malaria-relevant information reported through the health information system (HIS) includes
data on mortality, morbidity, intermittent preventive treatment in pregnancy (IPTp), ACT and
RDT stock management, and LLIN distribution. Though routine data are the most accessible,
their quality, completeness, timeliness and reliability are variable. The NMCP has a parallel
system that captures information on hospital mortality among children under five years and on
malaria morbidity. This is through a database updated regularly using data sent quarterly by
health officers from districts and hospitals. Members of district health management teams
gather quarterly with NMCP members to submit, review, and validate routine data. During the
quarterly reviews, data are submitted from all levels of the health system. On-site data
consistency checks are performed to identify discrepancies among information in the records of
health facilities and information in reports submitted to the intermediate and central levels.
In recent years, the MSAS and partners have made huge efforts to improve the availability and
quality of routine data through the adoption and deployment of DHIS2. Roll-out is complete but
work continues to ensure the quality of the information collected and the timeliness of data
reporting. The NMCP is working with the DSISS to merge the parallel systems and support the
roll-out of the DHIS2 for weekly malaria case reporting. Ten districts currently report data
weekly.
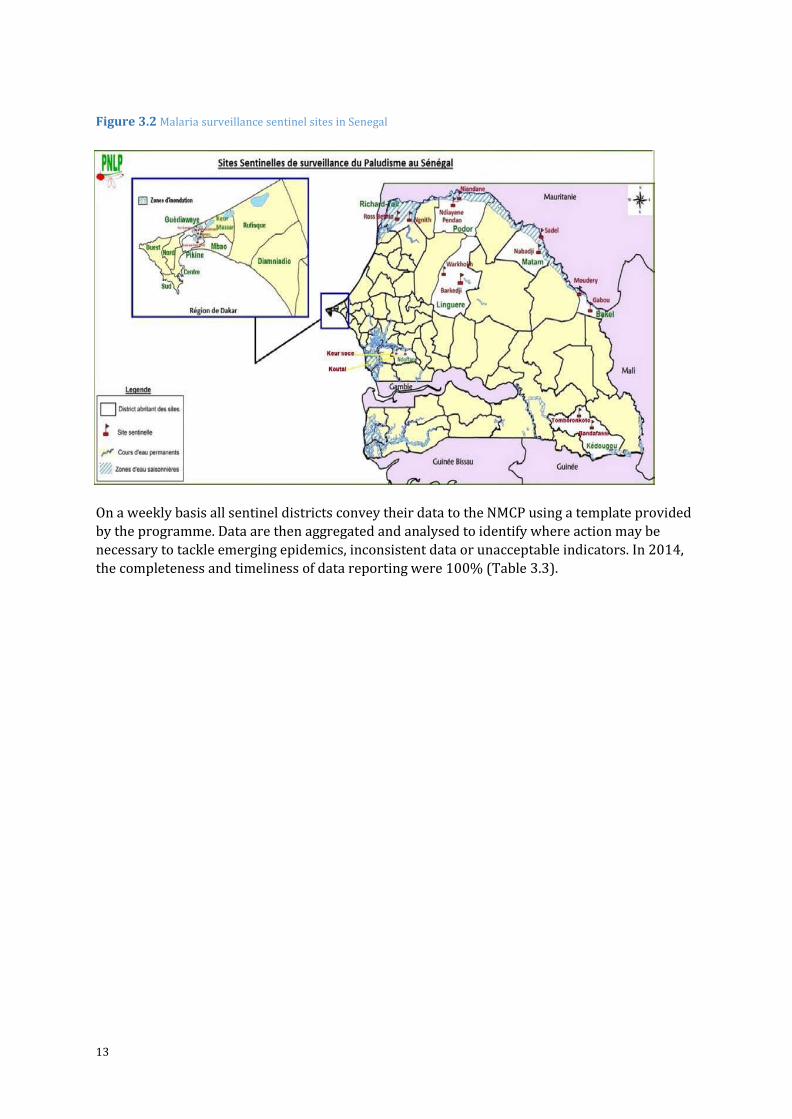
Sentinel sites
Sentinel sites for malaria surveillance started in 2008 with 10 sites in the north of the country.
After 2010, due to heavy flooding in the Dakar region, six sites were added in Dakar, bringing
the number of sites to 16 and then to 20 in October 2012 (Figure 3.2). The surveillance is
undertaken in 10 health districts spanning seven regions, corresponding to the various malaria
risk strata in the country. The sentinel sites generate data required for the assessment of
malaria trends, including parasitological, entomological and environmental parameters, drug
and insecticide resistance
13
Figure 3.2 Malaria surveillance sentinel sites in Senegal
On a weekly basis all sentinel districts convey their data to the NMCP using a template provided
by the programme. Data are then aggregated and analysed to identify where action may be
necessary to tackle emerging epidemics, inconsistent data or unacceptable indicators. In 2014,
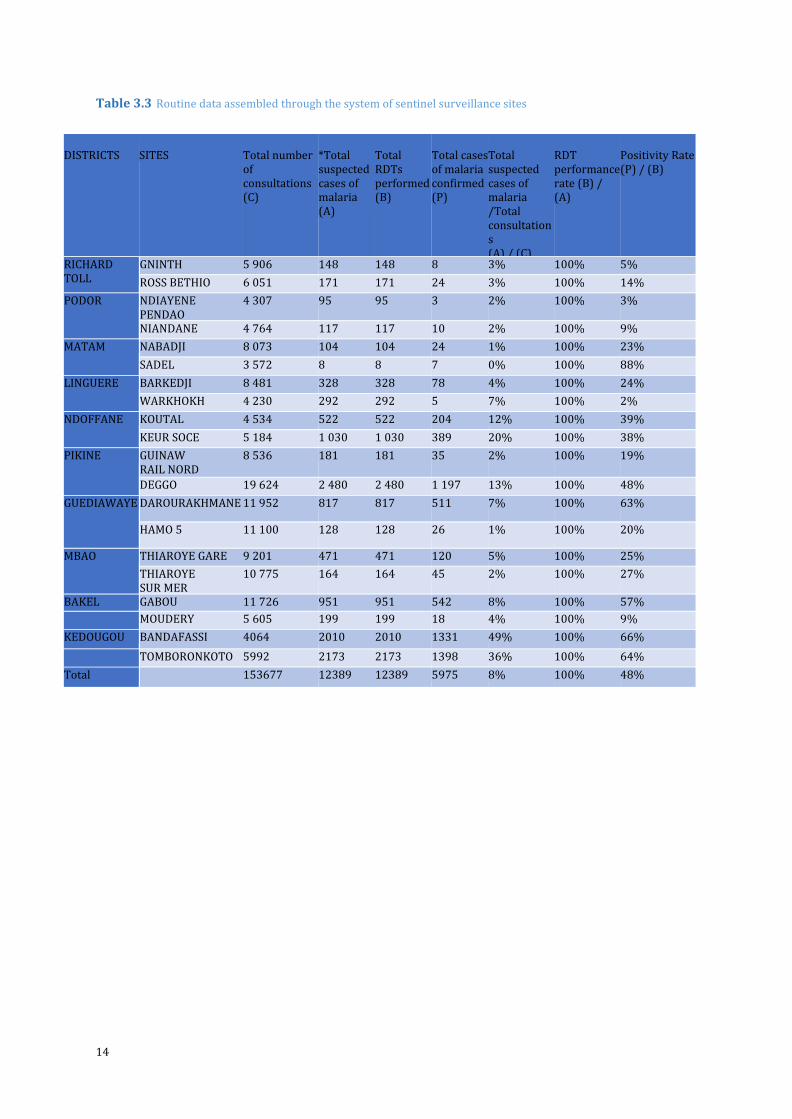
the completeness and timeliness of data reporting were 100% (Table 3.3).
14
Table 3.3 Routine data assembled through the system of sentinel surveillance sites
DISTRICTS
SITES
Total number of consultations (C)
*Total suspected cases of malaria (A)
Total RDTs performed (B)
Total cases of malaria confirmed (P)
Total suspected cases of malaria /Total consultations (A) / (C)
RDT performance rate (B) / (A)
Positivity Rate (P) / (B)
RICHARD TOLL
GNINTH 5 906 148 148 8 3% 100% 5%
ROSS BETHIO 6 051 171 171 24 3% 100% 14%
PODOR NDIAYENE PENDAO
4 307 95 95 3 2% 100% 3%
NIANDANE 4 764 117 117 10 2% 100% 9%
MATAM NABADJI 8 073 104 104 24 1% 100% 23%
SADEL 3 572 8 8 7 0% 100% 88%
LINGUERE BARKEDJI 8 481 328 328 78 4% 100% 24%
WARKHOKH 4 230 292 292 5 7% 100% 2%
NDOFFANE KOUTAL 4 534 522 522 204 12% 100% 39%
KEUR SOCE 5 184 1 030 1 030 389 20% 100% 38%
PIKINE GUINAW RAIL NORD
8 536 181 181 35 2% 100% 19%
DEGGO 19 624 2 480 2 480 1 197 13% 100% 48%
GUEDIAWAYE DAROURAKHMANE 11 952 817 817 511 7% 100% 63%
HAMO 5 11 100 128 128 26 1% 100% 20%
MBAO THIAROYE GARE 9 201 471 471 120 5% 100% 25%
THIAROYE SUR MER
10 775 164 164 45 2% 100% 27%
BAKEL GABOU 11 726 951 951 542 8% 100% 57%
MOUDERY 5 605 199 199 18 4% 100% 9%
KEDOUGOU BANDAFASSI 4064 2010 2010 1331 49% 100% 66%
TOMBORONKOTO 5992 2173 2173 1398 36% 100% 64%
Total 153677 12389 12389 5975 8% 100% 48%
15
The epidemiology of malaria in Senegal includes areas in the pre-elimination and control
phases. The surveillance system has been adapted to the level of endemicity. In the northern
sentinel sites, where transmission is low, all recorded cases are systematically documented in
line with the national surveillance guidelines. Surveillance aims to help interrupt local malaria
transmission through the identification and investigation of malaria cases. In these areas,
passive detection of confirmed malaria cases from health care providers (health centres,
DSDOM, health posts, health huts and hospital) is combined with reactive active detection of
cases in communities and households.
Since 2012, reactive active case detection was piloted in Richard Toll district for elimination
feasibility by PATH-MACEPA. Reactive case investigation is triggered when a patient has
malaria; this is called an index case. Following the identification of such an index case, the
investigation begins as soon as possible, but not later than seven days after becoming aware of
the case. Information about the index case (birth date, sex, single number TDR identification
(barcode), symptoms, history of fever, use a mosquito net, date of onset of symptoms etc.) is
entered into questionnaires using electronic touch phones. Treatment (Focal Drug
Administration, or FDA) with dihydroartémisinine (DHA)-pipéraquine (DHA-PQ) is given to all
household members of the index case, and they are also tested to document the rate of infection.
Households located within 100 m, or the five closest households if there are more than five, are
also visited and all members tested. In neighbouring households where there is at least one positive TDR, an FDA is conducted and all members receive DHA-PQ.
In moderate and high transmission areas, passive detection of malaria cases at health facilities
(health centre, DSDOM, health post, health huts and hospital) provides important information
for programme managers to track progress and enable them to target actions to control malaria
morbidity and mortality.
In order to assure the quality of data and to prevent biases in analyses, the NMCP has set up a
system to ensure close supervision of sentinel sites. Every month, a district data supervision
team is convened which includes representatives from the NMCP, the health region and the
District Chief Medical Officer. A biannual review is conducted with a central supervision team,
comprising representatives of the NMCP. supervision teams include specialists in malaria case
management, monitoring and evaluation and biological diagnosis.
After a year of surveillance, the steady decrease in malaria indicators in northern Senegal
(Richard Toll, Podor, Matam and Linguère) confirmed the disease was in decline in that part of
the country, with only 3% of all consultations being suspected malaria cases, and a test
positivity rate of 21%. These figures contrast with the situation in southeastern Senegal where suspected cases amounted to 43% of the total consultations in Tomboronkoto and Bandafassi,
where the average test positivity rate was 65%. At the centre of the country and in Dakar the
average positivity rate of RDTs was 35%. Since 2013, the NMCP has been releasing a web-based
malaria surveillance bulletin, available at www.pnlp.sn and also shared through the e-mailing to
more than 500 people.
3.5 Local operational and implementation research
Over the last decade, the NMCP and partners have increased operational research efforts to
maximise the impact of diagnostics, prevention and therapeutic strategies. Studies have covered
16
a number of areas including: the monitoring of malaria drug efficacy25,26and safety27 28 29 30 31;
monitoring the quality of diagnostics; approaches to prevent malaria (seasonal malaria
chemoprevention [SMC]32, IPTp33); vector control (indoor residual spraying34 35); drug and
insecticide resistance assessments; knowledge for performance enhancement; and intervention
coverage assessment. The evidence has contributed nationally and regionally to changes in
policy.
A special example relates to SMC. Following the first study of SMC, carried out in Niakhar,
Senegal, a series of studies involving seven additional West African countries, confirmed the
efficacy and safety of SMC. This led to its adoption in 2012 as a regional malaria prevention
strategy in children.36 Countries generally target children aged three to 59 months living in areas
with intensely seasonal malaria transmission. In Senegal the age range has been extended from
60 to 120 months on account of age pattern of malaria disease. Pilot implementation in 2014
achieved very high coverage, with 98.7% of the 624,139 targeted children from 16 districts of
four eastern Senegal regions receiving the three rounds of SMC.37 Pilot implementation has been
supported by UNICEF, USAID/PMI, World Vision, Child Fund, Africare, Plan and the Peace Corps.
While formal evaluation of the strategy is pending, reports from the field suggest a marked drop
in malaria cases and deaths associated with SMC.38
25 Faye B, Ndiaye JL, Tine R, Sylla K, Gueye A, Lô AC, Gaye O (2010). A randomized trial of artesunate mefloquine versus artemether lumefantrine for the treatment of uncomplicated Plasmodium falciparum malaria in Senegalese children. Am. J. Trop. Med. Hyg. 82 (1): 140–144. 26 Tine RC, Faye B, Sylla K, Ndiaye JL, Ndiaye M, Sow D, Lo AC, Abiola A, Ba MC, Gaye O. Efficacy and tolerability of a new formulation of artesunate-mefloquine for the treatment of uncomplicated malaria in adult in Senegal: open randomized trial. Malar. J, 11: 416. 27 Thiam S, Ndiaye JL, Diallo I, Gatonga P, Fall FB, Diallo NE, Faye B, Diouf ML, Ndiop M, Diouf MB, Gaye O, Thior M (2013). Safety monitoring of artemisinin combination therapy through a national pharmacovigilance system in an endemic malaria setting. Malar J. 12(1): 54. 28 de Sousa A, Rabarijaona LP, Tenkorang O, Inkoom E, Ravelomanantena HV, Njarasoa S, Whang JN, Ndiaye JL, Ndiaye Y, Ndiaye M, Sow D, Akadiri G, Hassan J, Dicko A, Sagara I, Kubalalika P, Mathanga D, Bizuneh K, Randriasamimanana JR, Recht J, Bjelic I, Dodoo A (2012) Pharmacovigilance of malaria intermittent preventive treatment in infants coupled with routine immunizations in 6 African countries. J. Infect Dis., 205 Suppl 1:S82-90. doi: 10.1093/infdis/jir799. 29 Ndiaye JL, Faye B, Gueye A, Tine R, Ndiaye D, Tchania C, Ndiaye I, Barry A, Cissé B, Lameyre V, Gaye O (2011). Repeated treatment of recurrent uncomplicated Plasmodium falciparum malaria in Senegal with fixed-dose artesunate plus amodiaquine versus fixed-dose artemether plus lumefantrine: a randomized, open-label trial. Malar J., 10: 237. 30 Ndiaye JL, Randrianarivelojosia M, Sagara I, Brasseur P, Ndiaye I, Faye B, Randrianasolo L, Ratsimbasoa A, Forlemu D, Moor VA, Traore A, Dicko Y, Dara N, Lameyre V, Diallo M, Djimde A, Same-Ekobo A, Gaye O (2009). Randomized, multicentre assessment of the efficacy and safety of ASAQ--a fixed-dose artesunate-amodiaquine combination therapy in the treatment of uncomplicated Plasmodium falciparum malaria.. Malar J., 8: 125. 31 Randomized, comparative study of the efficacy and safety of artesunate plus amodiaquine, administered as a single daily intake versus two daily intakes in the treatment of uncomplicated falciparum malaria. Ndiaye JL, Faye B, Diouf AM, Kuete T, Cisse M, Seck PA, Brasseur P, Same-Ekobo A, Lameyre V and Gaye O (2008). Malar J., 7:16. 32 Cisse et al (2006). Niakhar, Senegal 33 Newman RD, Moran AC, Kayentao K, Benga-De E, Yameogo M, Gaye O, Faye O, Lo Y, Moreira PM, Duombo O, Parise ME, Steketee RW (2006). Prevention of malaria during pregnancy in West Africa: policy change and the power of subregional action. Trop Med Int Health, 11(4): 462–469. 34 President’s Malaria Initiative (PMI) (2013). Senegal, End of Spray Report 2013. 1 November. Executive Summary 35 Evaluation de l’efficacite entomologique de l’aspersion intradomiciliaired’insecticide (aid) au senegal: campagne 2014 (an 8). 36 Report of the technical consultation on seasonal malaria chemoprevention (SMC); Geneva 4-6 May 2011: 1–2 37 The Seasonal Malaria Chemoprevention: Implementation Report for 2014 and 2015 Outlook: 3 38 Cairns M, Roca-Feltrer Arantxa, Garske T, Wilson AL, Diallo D, Milligan PJ, Ghani Azra C, Greenwood Brian M (2012). Estimating the potential public health impact of seasonal malaria chemoprevention in African children: 4–6.
17
Indoor residual spraying (IRS) has been accompanied by intensive entomological monitoring. In
2007, with the financial support of PMI, IRS was piloted in three health districts (Nioro, Richard-
Toll, and Vélingara). The districts of Guinguineo, Malem Hodar, and Koumpentoum were added
three years later, using the carbamate insecticide. Many partners39 were involved in the strategy
implementation through a framework named the IRS Steering Committee. Due to the low
malaria prevalence in Richard Toll district, the steering committee decided to stop spraying
there in 2011.
During the 2014 IRS campaign, the total number of structures spayed was 204,159 out of
209,603 (97.4%), and the population protected was 708,999.40 Monitoring of the effectiveness of
IRS in the carbamate-sprayed districts showed that although wall treatments recorded
mortality rates of 100% and 79.2% during the first month after spraying in the districts of
Koungheul and Malem Hodar, respectively, very low efficiency was observed with the local An.
Gambiae sl by two months after spraying. However, the districts using pyrimiphos methyl
(Actellic CS 300) reported that walls remained effective throughout the winter monitoring
period, five months post-spraying, with a mortality rate above 78% in Koumpentoum as well as
Vélingara.41
The NMCP and its key partners involved in research (UCAD, PMI/USAID, PATH MACEPA, IRD,
Pasteur Institute, etc.) have developed an ambitious research agenda in order to generate more evidence for planning and decision making. Topics include: the assessment of G6PD prevalence
in the north, centre, east and south epidemiological zones; factors associated with SMC
acceptability; impact assessment of SMC in high transmission areas; primaquine efficacy and
tolerability in children, adults and pregnant women; dosage, supply, the political and
sociological factors influencing the roll-out of primaquine.
39 National Malaria Control Program (NMCP), the Ministry of Health and Social Action (central and districts levels), University Cheikh Anta Diop (UCAD), Ministry of Agriculture (Directorate for Plant Protection), and Ministry of Environment (Directorate for the Environment and Classified Factories, or DEEC), Abt Associates. 40 President’s Malaria Initiative (PMI) (2014). Senegal End of Spray Report 2014. 17 October. 201:34. 41 Ndiaye JL, Faye B, Gueye A, Tine R, Ndiaye D, Tchania C, Ndiaye I, Barry A, Cissé B, Lameyre V, Gaye O (2011). Repeated treatment of recurrent uncomplicated Plasmodium falciparum malaria in Senegal with fixed-dose artesunate plus amodiaquine versus fixed-dose artemether plus lumefantrine: a randomized, open-label trial. Malar J. 10:237.
18
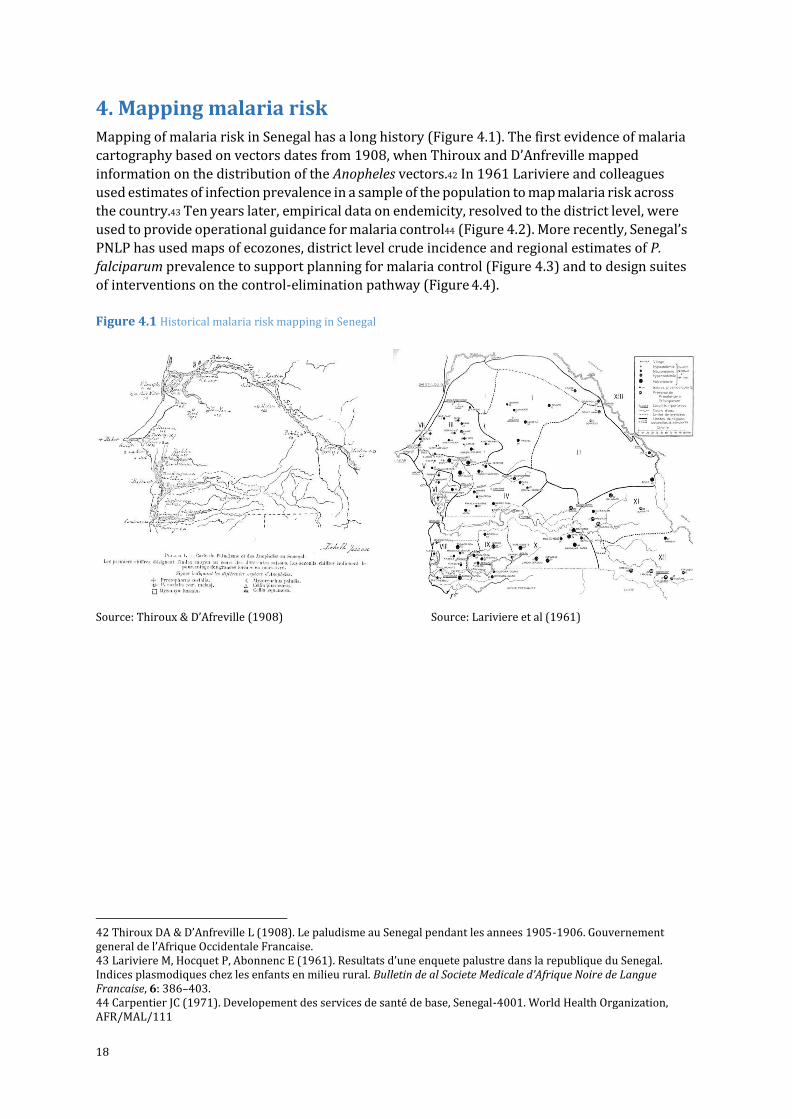
4. Mapping malaria risk Mapping of malaria risk in Senegal has a long history (Figure 4.1). The first evidence of malaria
cartography based on vectors dates from 1908, when Thiroux and D’Anfreville mapped
information on the distribution of the Anopheles vectors.42 In 1961 Lariviere and colleagues
used estimates of infection prevalence in a sample of the population to map malaria risk across
the country.43 Ten years later, empirical data on endemicity, resolved to the district level, were
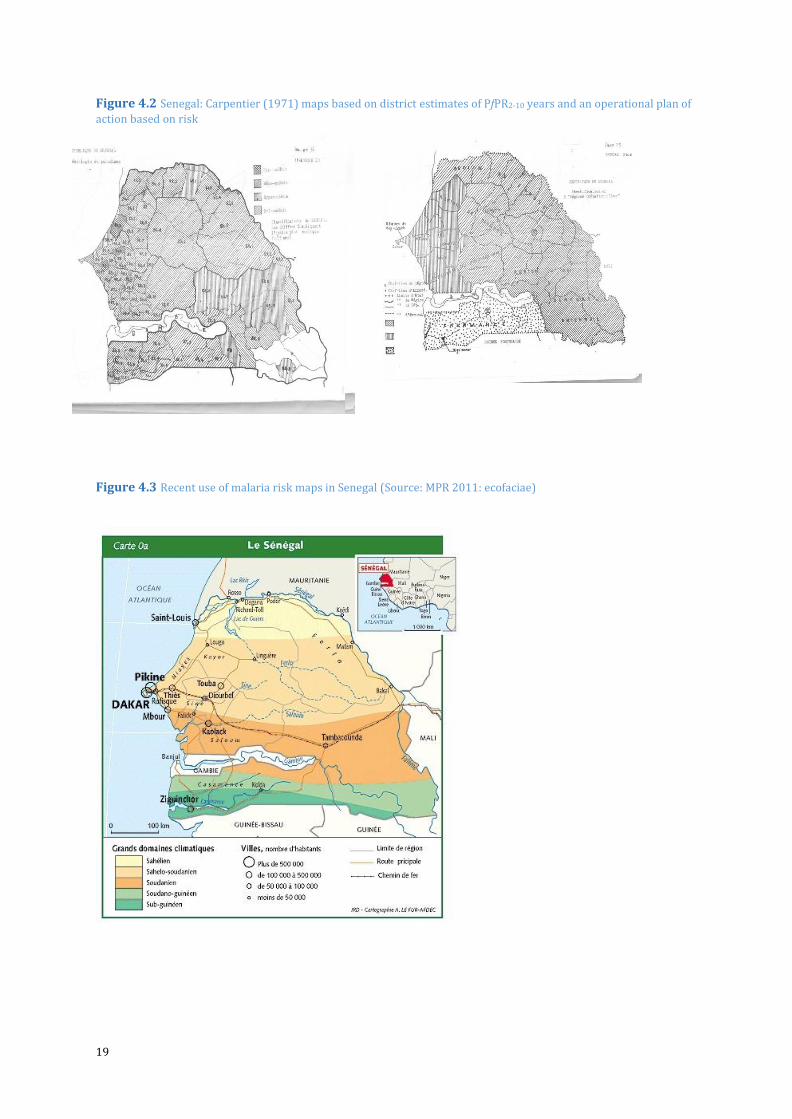
used to provide operational guidance for malaria control44 (Figure 4.2). More recently, Senegal’s
PNLP has used maps of ecozones, district level crude incidence and regional estimates of P.
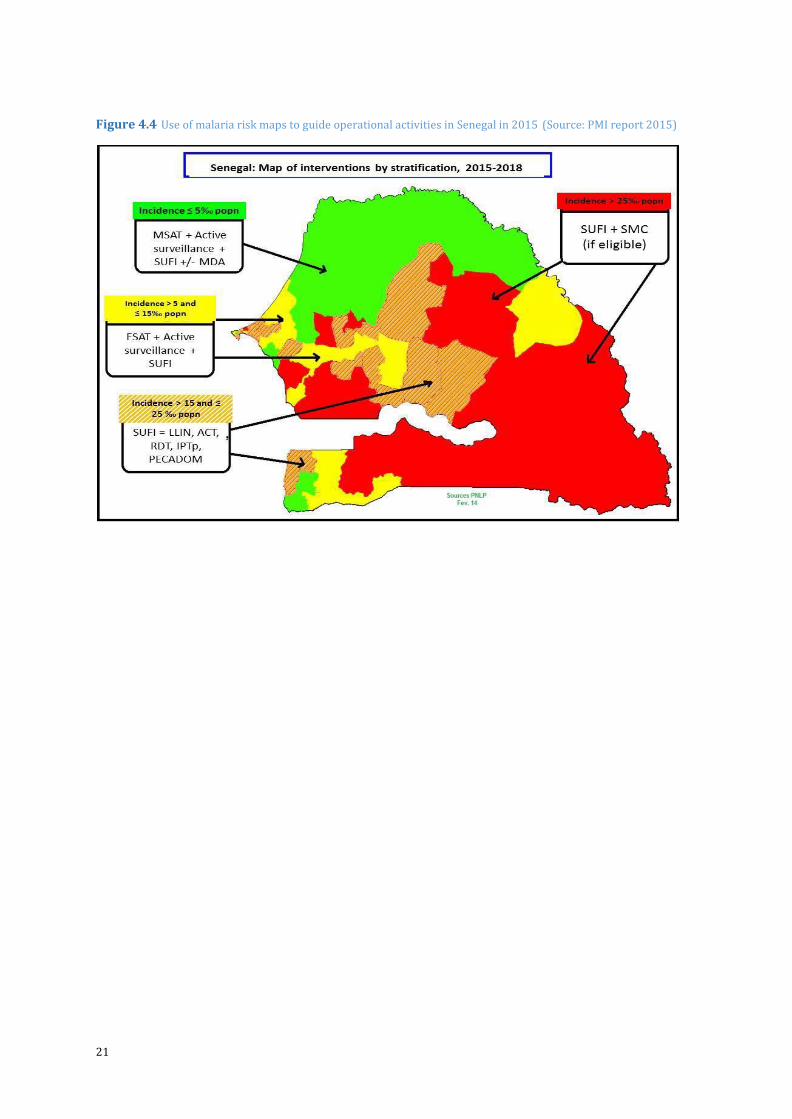
falciparum prevalence to support planning for malaria control (Figure 4.3) and to design suites
of interventions on the control-elimination pathway (Figure 4.4).
Figure 4.1 Historical malaria risk mapping in Senegal
Source: Thiroux & D’Afreville (1908) Source: Lariviere et al (1961)
42 Thiroux DA & D’Anfreville L (1908). Le paludisme au Senegal pendant les annees 1905-1906. Gouvernement general de l’Afrique Occidentale Francaise. 43 Lariviere M, Hocquet P, Abonnenc E (1961). Resultats d’une enquete palustre dans la republique du Senegal. Indices plasmodiques chez les enfants en milieu rural. Bulletin de al Societe Medicale d’Afrique Noire de Langue Francaise, 6: 386–403. 44 Carpentier JC (1971). Developement des services de santé de base, Senegal-4001. World Health Organization, AFR/MAL/111
19
Figure 4.2 Senegal: Carpentier (1971) maps based on district estimates of PfPR2-10 years and an operational plan of
action based on risk
Figure 4.3 Recent use of malaria risk maps in Senegal (Source: MPR 2011: ecofaciae)
20
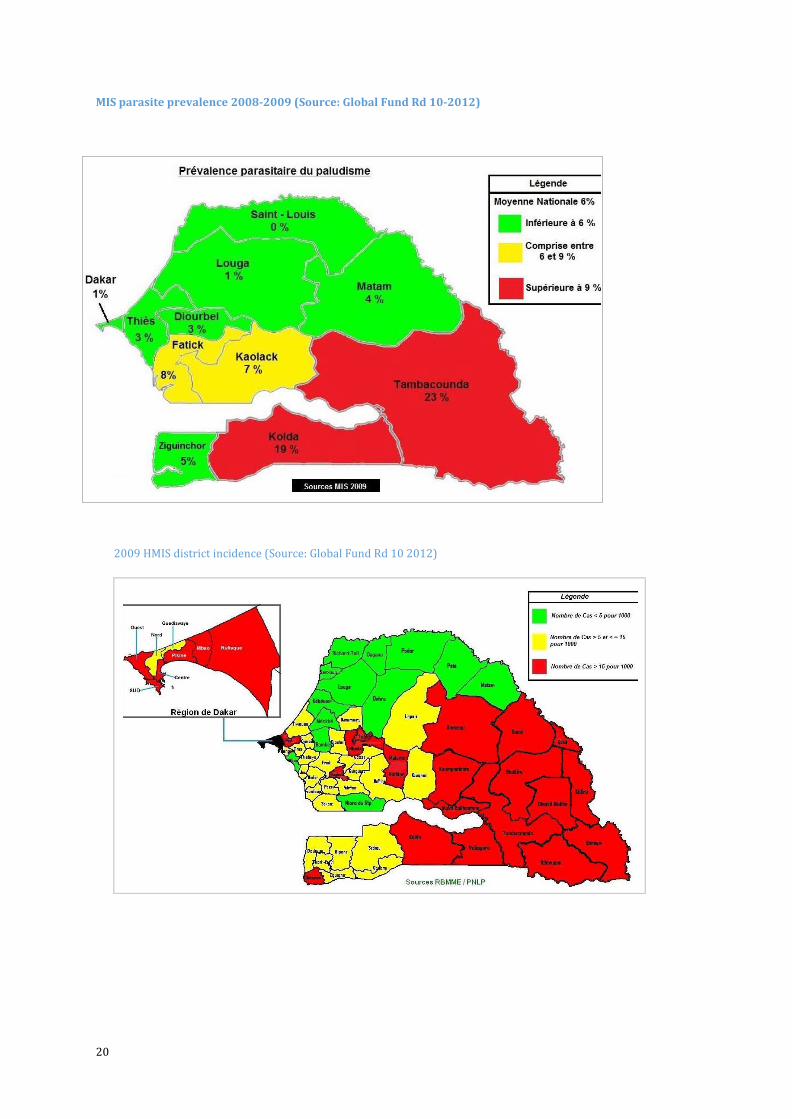
MIS parasite prevalence 2008-2009 (Source: Global Fund Rd 10-2012)
2009 HMIS district incidence (Source: Global Fund Rd 10 2012)
21
Figure 4.4 Use of malaria risk maps to guide operational activities in Senegal in 2015 (Source: PMI report 2015)
22
5. Malaria control in Senegal - Milestones
Important and decisive steps have been taken by the government of Senegal to control malaria
over the last 60 years. Efforts have intensified over the past 10 years as the government, its
internal and external partners, worked to achieve the MDGs. This section attempts to capture
the key initiatives across the main areas of intervention.
In 1953, the French colonial administration recognised the threat presented by malaria and, in
partnership with WHO and FISE (now UNICEF), established the Anti-Parasite Office, (Service de
lutte anti-parasitaire – SLAP). This was based in Thies, where many French, including military
personnel, were based. This programme dealt mostly with vector and larval control, including
the destruction of mosquitoes’ breeding sites.
The fight against malaria was set as a national agenda priority at the time of independence in
1960, with the goal of pre-eradication. WHO launched the malaria pre-eradication project called
WHO Senegal-13, which promoted weekly chloroquine prophylaxis during transmission
seasons (similar to the more recently recommended SMC) for children 0-14 years and for
pregnant women in Dakar and Thies, and later countrywide. The initiative lasted until 1969.
Indoor residual spraying was used sporadically, with a shift to fenitrothion and malathion in the
late 1980s following the identification of resistance to the first-generation insecticides (DDT,
HCH). Around the same time (1988) resistance was reported to chloroquine.
The situation was bleak until the government established the NMCP in 1995. Up to that point
the malaria fight had been led by the Office of Endemic Diseases of the Ministry of Health.
However, malaria was becoming increasingly complex – case management, diagnosis,
surveillance, vector control, chloroquine resistance, insecticide (DDT) resistance, training,
funding and changes in malaria epidemiology in parts of the country. The formation of the
NMCP reflected the political will to improve the malaria control. The NMCP was mandated to
coordinate all the interventions undertaken nationally to deal with the disease, to provide the
necessary guidance and strategies, as well as the appropriate means, to fight the disease. The
NMCP encouraged studies to generate evidence for new policies and strategy development. For
instance, a number of chemo-sensitivity tests to chloroquine and studies on sensitivity to
permethrin, were undertaken. Tests of impregnated mosquito nets were performed across the
country and regionally to generate evidence to guide action.
In 1996, with evidence of the progressive loss of chloroquine to resistance, the chloroquine
campaigns treating mainly children under-five years during the transmission season, were
given up in favour of presumptive malaria treatment. The use of insecticide treated nets (ITNs)
was also promoted as part of the implementation of the Malaria Accelerated Plan, established in
1999 with the support of WHO. Though these interventions proved useful, over time the issues
of drug and insecticide resistance would emerge again.
With the advent of the Roll Back Malaria (RBM) partnership in 1999, African heads of state
indicated their commitment to fight malaria, and its effects on the workforce and economies,
and to dedicate an appropriate share of their national budgets to health, and therefore to
malaria. In 2000, with support from WHO, UNICEF, World Bank and JICA, Senegal developed its
2001-2005 strategic plan. This was fully funded by the Global Fund (GFATM) in 2003 and
enabled implementation of the first subsidised ITN distribution in 2004, the introduction
of IPTp using two doses of sulfadoxine pyrimethamine (SP) and the adoption of the interim
23
first-line treatment policy of amodiaquine (AQ)+SP in 2005. The Demographic and Health
Survey (DHS) carried out in 2005 found that just 7.1% of children under five years old slept
under an ITN the night before the survey.
Evidence for the efficacy of ACTs was generated through studies carried out in Senegal – and
beyond – between 2000 and 2005. This led in 2006 to the introduction of ACTs, the combination
artesunate-amodiaquine (AS-AQ), in health facilities. This was followed soon after by the
introduction of RDTs to strengthen malaria diagnosis.
The 2006-2011 strategic plan built on lessons learned and envisioned the achievement of both
the sixth MDG and Senegal’s poverty reduction strategy (DSRP 2006-2010). Finance from the
Global Fund in 2006 and the newly formed US President’s Malaria Initiative (PMI) in 2007
enabled the implementation of the strategic plan and led to unprecedented accomplishments.
These included the shift in malaria diagnosis away from presumptive diagnosis to
parasitological confirmation using rapid diagnostic tests (RDTs), and treatment based on
artemisinin-combination treatment (ACTs). The RDTs and ACTs were rolled out countrywide in
2006 and 2007, respectively. Improvement in access to malaria treatment was initiated by the
pilot testing of home-based malaria management (PECADOM), which began in 20 villages in
2008. The first nation-wide campaign to distribute LLINs targeting children under five years of
age was conducted in 2009, with the distribution of 2.2 million LLINs. In 2010, LLIN distribution aimed to achieve universal coverage – targeting each sleeping place. This began in the four most
heavily burdened regions in the southeast and progressively covered the whole country. Indoor
residual spraying (IRS) was implemented in target districts from 2007. The sentinel site
surveillance system was launched in 2007. In 2010 the DHS Survey confirmed a marked
improvement in ITN coverage with 34.5% of under 5 year olds sleeping under an ITN the night
before the survey.
The Global Fund’s Round 7 grant in 2009 and building PMI financial and technical support
played a massive part in the implementation of this plan. A welcome diversification of funding
also began to emerge. For example, PGIRE was a World Bank project in the Senegal River Basin,
and the Islamic Development Bank provided support in 2009.
The 2011-2015 strategic plan was developed in the same spirit, with the intention of pursuing
strategies to deliver proven interventions, including free net distributions, IRS, malaria case
management with the use of ACTs and RDTs and surveillance. The plan also included malaria
pre-elimination activities in some locations. In 2012, USAID/PMI began directly funding some of
the NMCP’s activities. The ongoing financial and political support of the government was also
key to the implementation of this strategic plan and allowed the implementation of a number of
interventions. For example, PECADOM has been rolled out, integrating diarrhoea and
pneumonia management in children under 5 years and, importantly, introducing RDTs at this
level in 1,962 villages across 32 districts. Indoor residual spraying protected about 690,000
people in 2013 in six target districts; universal coverage net distribution campaigns delivered
more than 14.7 million nets across the country from 2010 to 2014, and SMC was implemented
in 2013 and 2014 among children of three to 120 months old in four regions.
24
These efforts have been associated with tangible improvements in disease burden and survival.
For example, the total number of deaths attributed to malaria dropped from 12.93 per 100,000
people in 2000 to 8.26 in 2013 and 4.0 in 2014.45,46
1904-1935
Breeding site reduction and legislation (1905) in Dakar
Reports of QN prophylaxis among young children in Dakar and St Louis
1945
School-based prophylaxis using rotations of quinacrine and rodoprequine in Dakar
1953
Service de lutte anti-parasitaire (SLAP) established by WHO, UNICEF and French government
1953-1957
Pilot eradication project initiated using DDT IRS in Thies Region protecting
about 500,000 people
1960
Independence from France
1960s
Periodic IRS and larval control in Dakar region
1963-1969
Pre-eradication project (WHO-Senegal 13), CQ prophylaxis weekly during transmission seasons
(SMC) for children 0-14 years and pregnant women in Dakar and Thies
1970
Start of prolonged drought that effectively removed An. funestus from northern provinces along
Senegal River; severe drought 1972
1971-1973
CQ prophylaxis among children 0-5 years in 65 villages near Niakhar
Early 1980s
Evidence of CQ prophylaxis among general population in some areas, notably Mlomp,
Zinginchor
1983
Severe drought in northern region
45 WHO (2014) World Malaria Report 2014. 9 Dec. http://www.who.int/malaria/publications/world_malaria_report_2014/report/en/ Accessed 23 March, 2017. 46 National Malaria Control Program (2014). Annual Report.
25
1987
Construction of Diama dam on Senegal River and artificial Lake Guiers alters epidemiology of
transmission
At four sites across country vectors sensitive to fenitrothion and malathion, but resistance
detected to DDT at Dakar and Kolda
1988
CQ resistance detected at Pikine, Dakar
The health region of Podor, through the regional office of major endemic based in Podor,
introduced nets treatment in its malaria programme, using deltamethrine and K-Othrine
insecticide
1988-1990
Trial of IRS using Fenitrothion at Pout, Thies region
1991-1992
Severe droughts
1995
Development of the first Antimalarial Plan, leading to the establishment of the National Malaria
Control Programme (NMCP)
Trial of permethrin treated bed nets at Wassadou, Tambacounda region NMCP established
1997
Development of the Accelerated Malaria Control Plan (PALP), covering 12 districts47 with the
support of WHO
An. funestus re-appears along Senegal River Basin
The first pan-African conference on malaria research, Multi-lateral Initiative on Malaria (MIM),
hosted in Dakar
2000
Situation analysis in Senegal and development of the first Roll Back Malaria Strategic Plan for
the period 2001 to 2005, with the financial support of the World Bank, UNICEF and Japan
government (JICA). The plan implementation was fully funded by the Global Fund in 2003
MICS survey carried out
2002
Trial of SP+AS SMC among children aged 2-59 months at Niakhar
47 Mbao, Dagana, Podor, Kébémer, Linguère, Goudiry, Nioro, Bignona, Guinguinéo, Popenguine, Dioffior, et Thiadiaye
26
2004
Interim first line treatment policy of AQ+SP
IPTp using two doses of SP after quickening policy introduced
2005
7.1% of children < 5 years old slept under an ITN
2006
First post-RBM launch National Malaria Strategy launched through to 2010 Round 4 Global Fund
financing awarded
MIS survey carried out
ACT first line treatment policy introduced
ITN free mass distribution
16.4% of children slept under an ITN
Beginning of decentralisation of malaria interventions with the advent of community-based
pilot initiatives e.g. malaria case management, using RDTs and ACTS; free distribution of LLINs
and the involvement of community health workers in malaria diagnostic and treatment with
RDTs and ACTs
2007
RDTs introduced nationwide to support malaria diagnosis PMI funding starts
2007-2009
IRS using lambda-cyhalothrin started in Richard-Toll, Nioro du Rip and Velingara Districts
protecting about 650,000 people per annum
2008
Catch-up mass ITN distribution campaigns, targeting children < 5: 1,057,835 nets in 58 districts
spanning the regions of Diourbel, Fatick, Kaolack, Thiès, Zinguinchor, St. Louis, Matam,
Tambacounda and Louga
ACTs and RDTs introduced nationwide in health huts (CHW)
Ivermectin MDA for onchocerchiasis shown to interrupt malaria transmission in Kédougou
region
IRS using alpha-cypermethrin started at mining concerns in Saraya district MIS 2008-09 survey
carried out
29.2% of < 5 years old children slept under an ITN
System of village malaria workers introduced to provide testing with RDTs and treatment with
ACTs through the Home-based Malaria management program - prise en charge à domicile
(PECADOM)- piloted in three districts in Kolda and Sedhiou regions (Mékhé, Ranérou et Dioffior)
27
2009
Round 7 Global Fund financing awarded
Nationwide mass ITN distribution campaign as part of integrated vitamin A and deworming
activities distributing 2.2 million nets
ITN sleeping space census and universal coverage distribution schemes piloted in two districts
(117,060 nets)
DDT and pyrethriod resistance reported across all IRS districts
The World Bank funded OMVS/PGIRE Health project in Senegal River basin established and first
malaria indicators survey (baseline) carried out in Senegal, as well as in the rest of member
states (Guinea, Mauritania and Mali)
UCAD tasked with insecticide sensitivity studies
2010
ITN sleeping space census and universal coverage distribution in 16 districts (621,481 nets)
PEDACOM expanded to Fatick, Kaolack, Kaffrine, Kédougou, Matam; IRS expanded to three new
districts (Guinguinéo, Malem Hoddar, Koumpentoum) bringing the total IRS districts to six,
including the previous three districts: Richard Toll, Velingara, and Nioro, with a switch toward
using deltamethrin, protecting about 1 million people
34.5% of children slept under an ITN; IRS coverage in last 12 months >73% in all target districts
Third situation analysis: Malaria review programme and development of the third Malaria
Strategic Plan for the period 2011-2015
2010-2011
Trials of SMC (AQ+SP) for children aged < 10 years in Saraya district and combined with home-
based management in Velingara district
DHS-MICS survey carried out
2011
Richard Toll district dropped as IRS district and Koungheul added; switch to Bendiocarb
(Carbamate): Total: 6 districts
Trial of IPTc in school children in Kédougou Region
National Strategic Plan launched with goal of reaching pre-elimination (less than one case per
1,000 population) in 9 districts (5 in the region of Saint Louis and 4 in the region of Matam) by
2015 and nationwide pre-elimination by 2018
ITN universal campaign of 2,465,770 nets in 27 districts
28
2012
Continuous DHS-SPA, Year 1 2012-13 46% of children slept under an ITN
Reactive case-detection piloted in Richard Toll District for elimination feasibility
ITN universal campaign of 983,696 nets in 13 districts
2013
SMC (AQ+SP) for children aged 3 months – 10 year policy introduced for Kédougou,
Tambacounda, Sédhiou and Kolda regions
IPTp 3 adopted
SMC (AQ+SP treatment for children in 3 months -10 years in 4 districts (Kédougou, Salemata,
Saraya and Dianké Makhan) spanning Kédougou and Tambacounda regions
IRS stopped in Guinguinéo and Nioro districts
IRS decreased to 4 districts (Malem Hoddar, Koungheul, Koumpentoum, and Velingara),
Bendiocarb used
DSDOM (home-based management - PECADOM) use RDTs and ACTs, scaled up to 841 villages
by 2010 and 1,962 in 61 districts by 2012, in 13 out of the 14 regions
ITN universal campaign of 3,285,254 nets in 25 districts – 19 Round 1, six for Round 2 initial
covered 2010)
2014
National Malaria Strategic Plan (the updated 2010 version) launched through to 2018 with
stratified suites of interventions based on current district malaria incidence and aiming for pre-
elimination by 2018
Continuous DHS-SPA, Year 2 2014 43% of children slept under an ITN
SMC (AQ+SP treatment for children in 3 months-10 years in 16 districts protecting 708,999
children
PEDACOM Plus, including diagnosis started in SE regions and 149 villages
ITN universal campaign (Round 2 distribution of 3,349,204 nets in 29 districts originally
covered in 2010-2011)
Resistance to all forms of pyrethroids insecticide, DDT and dieldrin recorded across 30 sentinel
sites nationwide; bendocarb resistance at 10/21 sites tested; fentithrion, malathion and
primiphos-methyl largely sensitive at sites tested
The World Bank funded project OMVS/ PGIRE purchased and distributed 775,000 LLINs during
the two phases of the health project in 23 health districts in five regions in the northern Senegal
(St. Louis, Louga, Matm, Tambacounda, Kedougou)
IRS (Bendiocarb) continued in Malem Hoddar and Koungheul, while Koumpentoum and
Velingara switch to organophosphate (pyrimiphos- methyl) protecting circa 650,000 people
29
2015
Global Fund financing awarded (New Funding Mechanism) Focal IRS adopted using pyrimiphos-
methy in four districts48
School-based distribution of LLIN targeted in Louga, Ziguinchor, Saint-Louis and Matam regions
Focal spraying in Malem Hoddar, Koungheul, Koumpentoum, and Nioro, using pyrimiphos-
methyl
Co-ordinators of the Senegalese National Malaria Control Programme
Dr Elisabeth SELLER DANSOKHO ; January 1995 to January 1997
Médecin Commandant Bakary SAMBOU ; January 1997 to August 2000
Dr Papa Amadou DIACK ; August 2000 to September 2004
Médecin Commandant Papa Moussa THIOR ; September 2004 to November 2011
Dr Cheikh Tacko DIOP ; November 2011 to June 2012
Médecin Commandant Mady BA ; June 2012 to date
References Agence Nationale de la Statistique et de la Démographie (ANSD) [Sénégal], et ICF International (2012). Enquête
Démographique et de Santé à Indicateurs Multiples au Sénégal (EDS-MICS) 2010-2011. Calverton, Maryland, USA:
ANSD et ICF International.
Agence Nationale de la Statistique et de la Démographie (ANSD) [Sénégal], and ICF International (2013). Continuous
Demographic and Health Survey in Senegal (Continuous DHS) 2012-2013. Calverton, Maryland, USA: ANSD and ICF
International.
Agence Nationale de la Statistique et de la Démographie (ANSD) [Sénégal], et ICF International (2015). Sénégal:
Enquête Démographique et de Santé Continue (EDS-Continue 2014). Rockville, Maryland, USA: ANSD et ICF
International.
Africa Indoor Residual Spraying (AIRS) Project (2014). Semi-annual Report: April – September 2014. Bethesda, MD.
AIRS, Abt Associates Inc: 38.
Ba H & Maffre E (1967). Le paludisme dans la région du Cap Vert au cours de l'hivernage 1966. Index d'infestation
palustre dans les populations de consultants. Médecine d'Afrique Noire, 6: 315–318.
Bourret G & Dufougere W (1912). Notes sur le paludisme a Saint-Louis, du Sénégal en 1910- 1911. Annales d'hygiène
et de médecine coloniales, 15: 46–55.
Carpentier JC (1967). Programme de pré-éradication du paludisme, Dakar and Thiès. Troisième trimestre, Septembre
1967. Sénégal 13. World Health Organisation Archive, Geneva.
Carpentier JC, Michel R, Gueye I (1971). Développement de services de sante de base: compte spécial pour
l'éradication du paludisme, Thiès, Sénégal 4001. AFR/MAL/111, 21st January 1971; World Health Organization
Archives, Geneva.
Cisse B, Sokhna C, Boulanger D, Milet J, Ba el H, Richardson K, Hallett R, Sutherland C, Simondon K, Simondon F,
Alexander N, Gaye O, Targett G, Lines J, Greenwood B, Trape JF (2006). Seasonal intermittent preventive treatment
with artesunate and sulfadoxine- pyrimethamine for prevention of malaria in Senegalese children: a randomised,
placebo- controlled, double-blind trial. Lancet, 367: 659–667.
48 Malem Hodar, Koungheul, Koumpentoum and Nioro
30
Diallo S, Coulibaly A, Konate M & Samba O (1977). Chimio prévention a la chloroquine et prévalence du paludisme.
Medicine D'Afrique Noire, 24: 117–125.
Faye O, Gaye O, Diallo S (1991). Evaluation de la sensibilité d’Anophèles gambiae s.l. au
Fenitrothion, au Malathion et au DDT au Sénégal. Dakar Medical, 36: 170–177.
Faye O, Diallo S, Gaye O, Mouchet J (1992). Evaluation de l'efficacité du Fenitrothion (Sumithion ® PM 40) sur la
densité du vecteur et la prévalence du paludisme à Pout (Thiès, Sénégal). Annales de la Société belge de Médecine
Tropicale, 72: 103–112.
Goriup S and Lacan (1967). Rapport Trimestriel du Projet de Pré-éradication du Paludisme, Senegal-0013 pour le
premier trimestre 1967. WHO Senegal 0013, World Health Organization archives, Geneva.
Guiguemdé TR, Gbary AR, Ouedraogo JB, Gayibor A, Lamizana L, Maiga AS, Boureima HS, Comlanvi CE, Faye O, Niang
SD (1991). Point actuel sur le chimioresistance du paludisme des sujets autochtones dans les états de l’OCCGE
(Afrique de l’ouest). Annales de la Société Belge de Médecine Tropicale, 71: 199–207.
Heckenroth F (1922). Mesures capable d'enrayer le paludisme a Dakar. Bulletin de la Société de pathologie exotique,
10: 1024–1032.
Kobylinski KC, Sylla M, Chapman PL, Sarr MD, Foy BD (2011). Ivermectin mass drug administration to humans
disrupts malaria parasite transmission in Senegalese villages. American Journal of Tropical Medicine & Hygiene, 85: 3–5.
Konaté L, Diop A, Sy N, Faye MN, Deng Y, Izri A, Faye O, Mouchet J (2001). Comeback of Anopheles funestus in
Sahelian Senegal. Lancet, 358: 336.
Laing AB (1984). The impact of malaria chemoprophylaxis in Africa with special reference to Madagascar, Cameroon
and Senegal. Bulletin of World Health Organization, 62: 41–48.
Leger M (1925). Le paludisme au Sénégal et en particulaire Dakar. Annales de médecine et de pharmacie coloniales, 23:
266–279.
Leger M, Bedier E, Baury A (1922). Dakar et ses environs: index du paludisme aux diverses saisons. Bulletin de la
Société de Pathologie Exotique, 15: 1006–1010.
Littrell M, Sow GD, Ngom A, Ba M, Mboup BM, Dieye Y, Mutombo B, Earle D, Steketee RW (2013). Case investigation
and reactive case detection for malaria elimination in northern Senegal. Malar J., 12: 331.
Miller MJ (1982). Parasites of man and arthropod disease vectors in communities of a water development program on
the Senegal river basin. In aspects of parasitology a Festschrift dedicated to the fifteenth anniversary of the Institute
of Parasitology, McGill University 1932-1982, edited by ED Meerovitch.
Ndiaye S and Ayad M (2006). Enquête Démographique et de Santé au Sénégal 2005. Calverton, Maryland, USA: Centre
de Recherche pour le Développement Humain [Sénégal] et ORC Macro.
Ndiaye S and Ayad M (2007). Enquête Nationale sur le Paludisme au Sénégal 2006. Calverton, Maryland, USA : Centre
de Recherche pour le Développement Humain [Sénégal] et Macro International Inc.
Ndiaye S & Ayad M (2009). Enquête Nationale sur le Paludisme au Sénégal 2008-2009.
Calverton, Maryland, USA : Centre de Recherche pour le Développement Humain [Sénégal] et ICF Macro.
Pison G, Trape J-F, Lefebvre F, Enel C (1993). Rapid decline in child mortality in a rural area of Senegal. International
Journal of Epidemiology, 22: 72–80.
President’s Malaria Initiative. http://www.pmi.gov/where-we-work/senegal Accessed 23 March, 2017.
Programme National de Lutte Contre le Paludisme (PNLP) [Sénégal] http://www.pnlp.sn/
31
Programme National de Lutte Contre le Paludisme (PNLP) [Sénégal] (2010). Evaluation de la campagne intégrée de
distribution de moustiquaires imprégnées à longue durée d’action, de vitamine A, et de mébendazole au Sénégal
2009. PNLP, Ministère de la Sante et de l'action Sociale, République du Sénégal.
Programme National de Lutte Conte le Paludisme (PNLP) [Sénégal] (2014). Cadre stratégique national de lutte contre le
paludisme au Sénégal, 2014-2018. PNLP, Ministère de la Sante et de l'action Sociale, République du Sénégal, Mars.
Riou M, Gourry N, Hussenet MS (1934). Le paludisme en milieu indigène à Dakar pendant les années 1932-1933.
Action comparée de divers médicaments. Bulletins de la Société de pathologie exotique et de ses filiales de l'Ouest
africain et de Madagascar, 27: 579–586.
Robin C & Brochen L (1946). Le paludisme a Dakar. Résultats d'une campagne curativo- preventative anti-palustre, a
l'aide des médicaments synthétiques, en milieu indigène. Bulletin Médical de L'Afrique Occidentale Française, 3: 97–108.
Thiam S, Thwing J, Diallo I, Fall FB, Diouf MB, Perry R, Ndiop M, Diouf ML, Cisse MM, Diaw MM,
Thior M (2012). Scale-up of home- based management of malaria based on rapid diagnostic tests and artemisinin
based combination therapy in a resource-poor country: results in Senegal. Malaria Journal, 11: 334
Thiroux A (1910). De l'emploi au Sénégal du tannante de quinine en poudre pour le prophylaxie du paludisme chez les
enfants. Bulletin de la Société de pathologie exotique, 3: 559–562.
Thwing JI, Perry R, Townes DA, Diouf MB, Ndiaye S, Thior M (2011). Success of Senegal’s first nationwide distribution
of long-lasting insecticide-treated nets to children under five- contribution toward universal coverage. Malar J., 10:
86.
Tine RC, Faye B, Ndour CT, Ndiaye JL, Ndiaye M, Bassene C, Magnussen P, Bygbjerg IC, Sylla K, Ndour JD, Gaye O
(2011). Impact of combining intermittent preventive treatment with home management of malaria in children less
than 10 years in a rural area of Senegal: a cluster randomized trial. Malar J., 10: 358.
Wone I & Michel R (1967). Bilan de la chimioprophylaxie systémique par chloroquine au Sénégal 1963-1966.
Médecine d'Afrique noire, 14: 267–269.
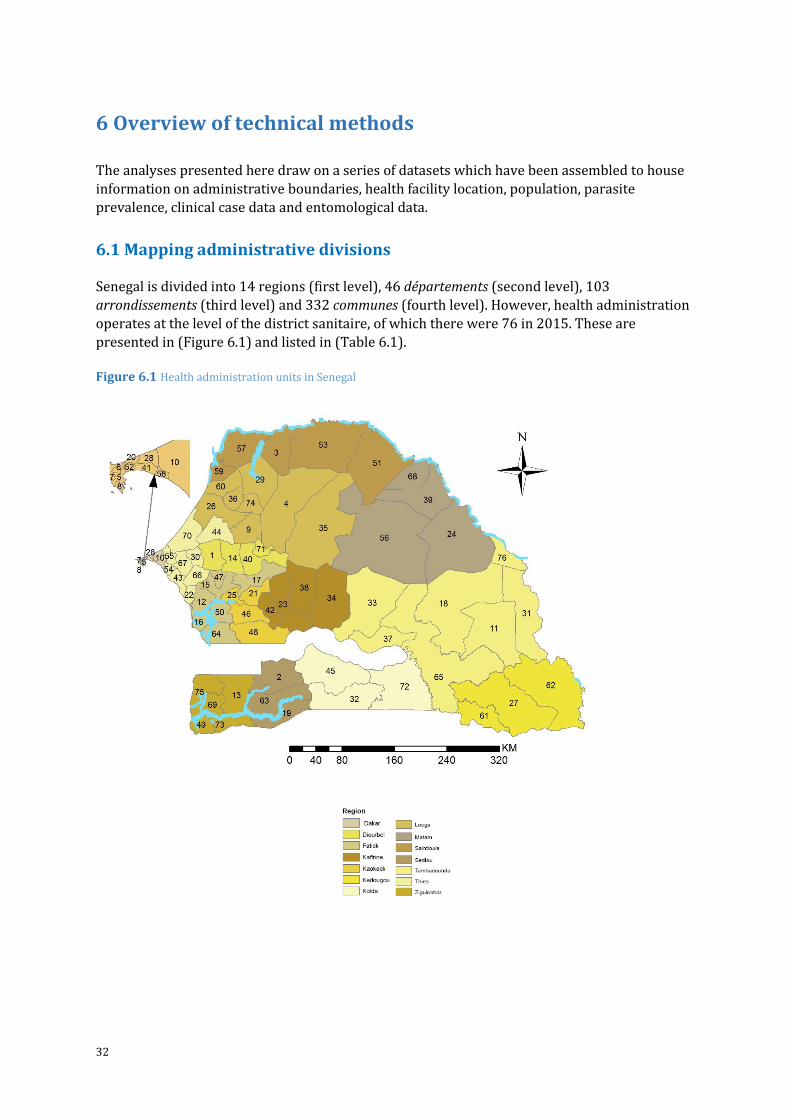
32
6 Overview of technical methods
The analyses presented here draw on a series of datasets which have been assembled to house
information on administrative boundaries, health facility location, population, parasite
prevalence, clinical case data and entomological data.
6.1 Mapping administrative divisions
Senegal is divided into 14 regions (first level), 46 départements (second level), 103
arrondissements (third level) and 332 communes (fourth level). However, health administration
operates at the level of the district sanitaire, of which there were 76 in 2015. These are
presented in (Figure 6.1) and listed in (Table 6.1).
Figure 6.1 Health administration units in Senegal
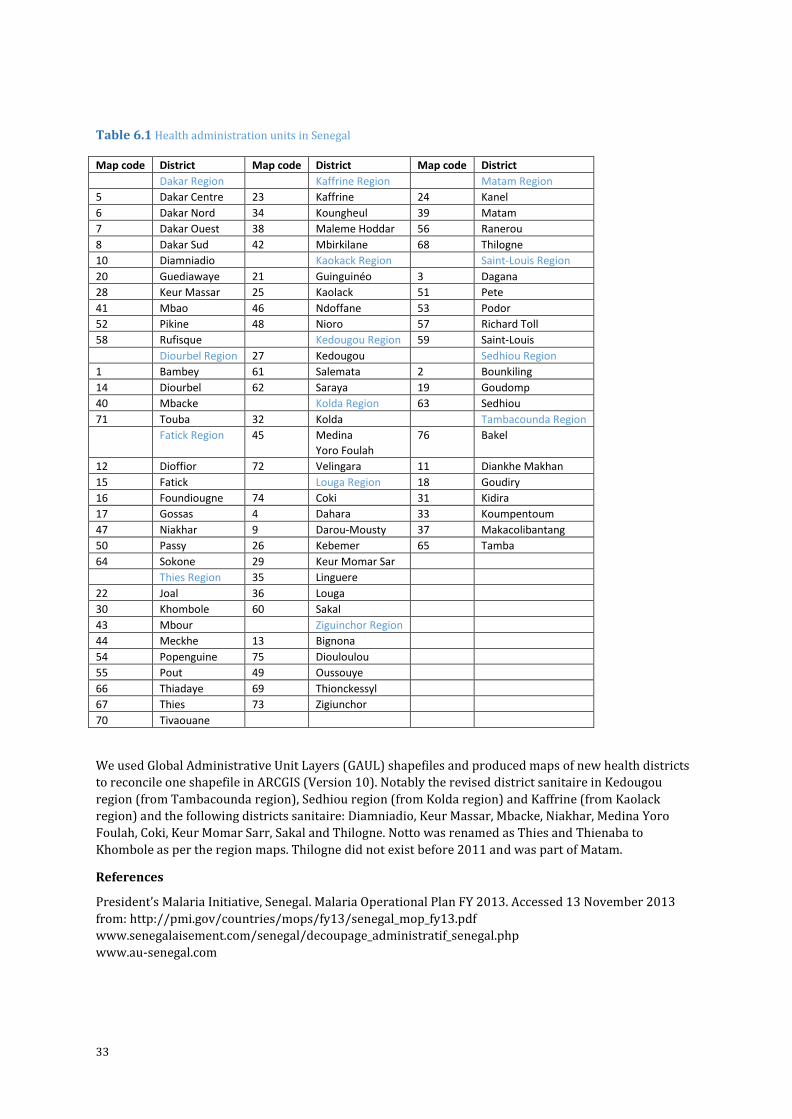
33
Table 6.1 Health administration units in Senegal
Map code District Map code District Map code District
Dakar Region Kaffrine Region Matam Region
5 Dakar Centre 23 Kaffrine 24 Kanel
6 Dakar Nord 34 Koungheul 39 Matam
7 Dakar Ouest 38 Maleme Hoddar 56 Ranerou
8 Dakar Sud 42 Mbirkilane 68 Thilogne
10 Diamniadio Kaokack Region Saint-Louis Region
20 Guediawaye 21 Guinguinéo 3 Dagana
28 Keur Massar 25 Kaolack 51 Pete
41 Mbao 46 Ndoffane 53 Podor
52 Pikine 48 Nioro 57 Richard Toll
58 Rufisque Kedougou Region 59 Saint-Louis
Diourbel Region 27 Kedougou Sedhiou Region
1 Bambey 61 Salemata 2 Bounkiling
14 Diourbel 62 Saraya 19 Goudomp
40 Mbacke Kolda Region 63 Sedhiou
71 Touba 32 Kolda Tambacounda Region
Fatick Region 45 Medina
Yoro Foulah
76 Bakel
12 Dioffior 72 Velingara 11 Diankhe Makhan
15 Fatick Louga Region 18 Goudiry
16 Foundiougne 74 Coki 31 Kidira
17 Gossas 4 Dahara 33 Koumpentoum
47 Niakhar 9 Darou-Mousty 37 Makacolibantang
50 Passy 26 Kebemer 65 Tamba
64 Sokone 29 Keur Momar Sar
Thies Region 35 Linguere
22 Joal 36 Louga
30 Khombole 60 Sakal
43 Mbour Ziguinchor Region
44 Meckhe 13 Bignona
54 Popenguine 75 Diouloulou
55 Pout 49 Oussouye
66 Thiadaye 69 Thionckessyl
67 Thies 73 Zigiunchor
70 Tivaouane
We used Global Administrative Unit Layers (GAUL) shapefiles and produced maps of new health districts
to reconcile one shapefile in ARCGIS (Version 10). Notably the revised district sanitaire in Kedougou
region (from Tambacounda region), Sedhiou region (from Kolda region) and Kaffrine (from Kaolack
region) and the following districts sanitaire: Diamniadio, Keur Massar, Mbacke, Niakhar, Medina Yoro
Foulah, Coki, Keur Momar Sarr, Sakal and Thilogne. Notto was renamed as Thies and Thienaba to
Khombole as per the region maps. Thilogne did not exist before 2011 and was part of Matam.
References
President’s Malaria Initiative, Senegal. Malaria Operational Plan FY 2013. Accessed 13 November 2013
from: http://pmi.gov/countries/mops/fy13/senegal_mop_fy13.pdf
www.senegalaisement.com/senegal/decoupage_administratif_senegal.php
www.au-senegal.com
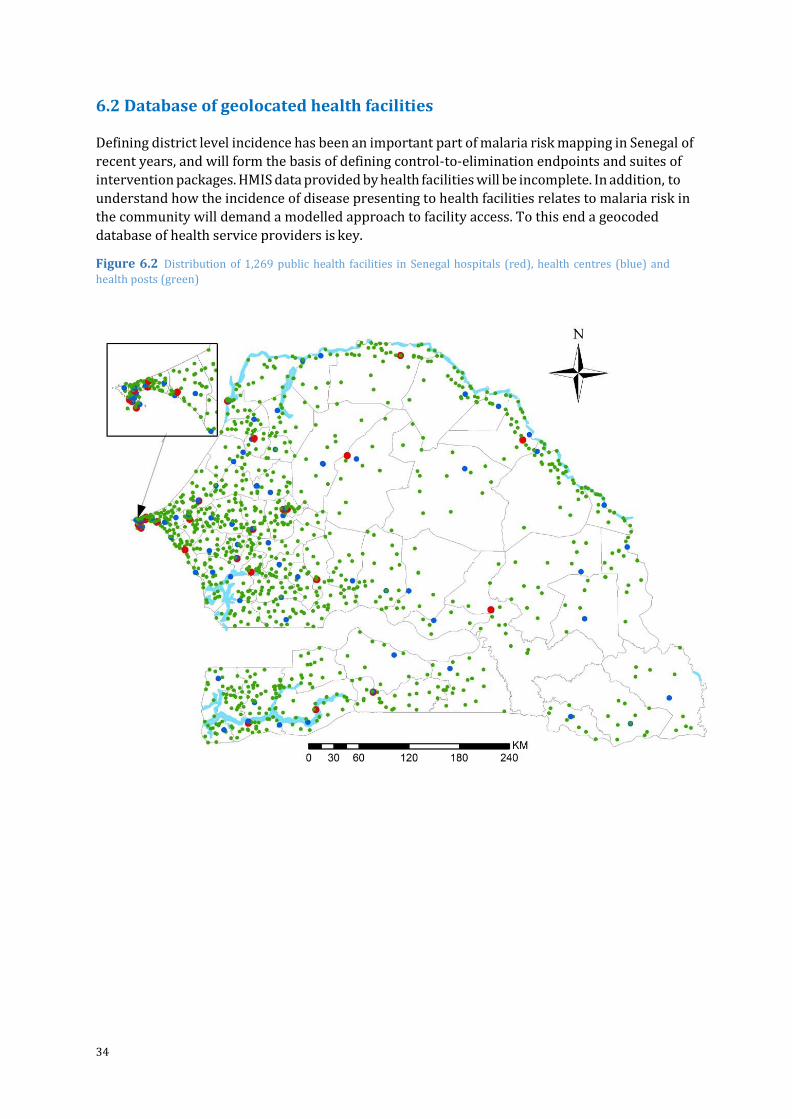
34
6.2 Database of geolocated health facilities
Defining district level incidence has been an important part of malaria risk mapping in Senegal of
recent years, and will form the basis of defining control-to-elimination endpoints and suites of
intervention packages. HMIS data provided by health facilities will be incomplete. In addition, to
understand how the incidence of disease presenting to health facilities relates to malaria risk in
the community will demand a modelled approach to facility access. To this end a geocoded
database of health service providers is key.
Figure 6.2 Distribution of 1,269 public health facilities in Senegal hospitals (red), health centres (blue) and
health posts (green)
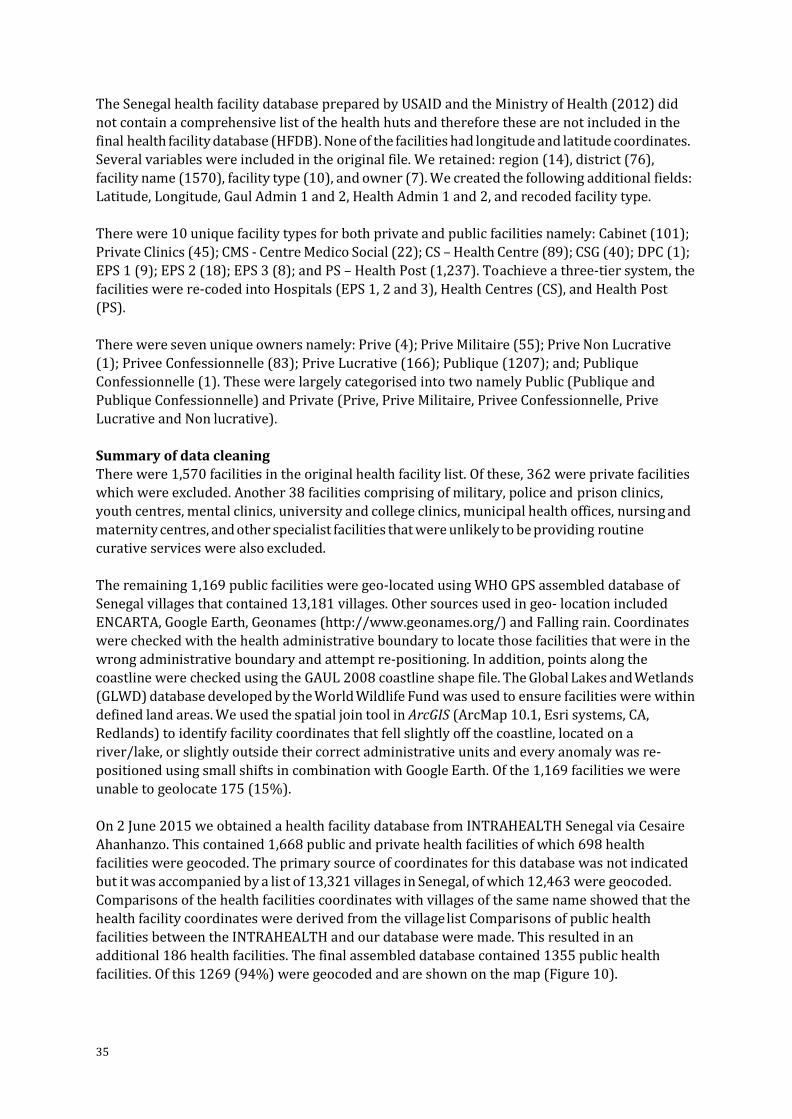
35
The Senegal health facility database prepared by USAID and the Ministry of Health (2012) did
not contain a comprehensive list of the health huts and therefore these are not included in the
final health facility database (HFDB). None of the facilities had longitude and latitude coordinates.
Several variables were included in the original file. We retained: region (14), district (76),
facility name (1570), facility type (10), and owner (7). We created the following additional fields:
Latitude, Longitude, Gaul Admin 1 and 2, Health Admin 1 and 2, and recoded facility type.
There were 10 unique facility types for both private and public facilities namely: Cabinet (101);
Private Clinics (45); CMS - Centre Medico Social (22); CS – Health Centre (89); CSG (40); DPC (1);
EPS 1 (9); EPS 2 (18); EPS 3 (8); and PS – Health Post (1,237). To achieve a three-tier system, the
facilities were re-coded into Hospitals (EPS 1, 2 and 3), Health Centres (CS), and Health Post
(PS).
There were seven unique owners namely: Prive (4); Prive Militaire (55); Prive Non Lucrative
(1); Privee Confessionnelle (83); Prive Lucrative (166); Publique (1207); and; Publique
Confessionnelle (1). These were largely categorised into two namely Public (Publique and
Publique Confessionnelle) and Private (Prive, Prive Militaire, Privee Confessionnelle, Prive
Lucrative and Non lucrative).
Summary of data cleaning There were 1,570 facilities in the original health facility list. Of these, 362 were private facilities
which were excluded. Another 38 facilities comprising of military, police and prison clinics,
youth centres, mental clinics, university and college clinics, municipal health offices, nursing and
maternity centres, and other specialist facilities that were unlikely to be providing routine
curative services were also excluded.
The remaining 1,169 public facilities were geo-located using WHO GPS assembled database of
Senegal villages that contained 13,181 villages. Other sources used in geo- location included
ENCARTA, Google Earth, Geonames (http://www.geonames.org/) and Falling rain. Coordinates
were checked with the health administrative boundary to locate those facilities that were in the
wrong administrative boundary and attempt re-positioning. In addition, points along the
coastline were checked using the GAUL 2008 coastline shape file. The Global Lakes and Wetlands
(GLWD) database developed by the World Wildlife Fund was used to ensure facilities were within
defined land areas. We used the spatial join tool in ArcGIS (ArcMap 10.1, Esri systems, CA,
Redlands) to identify facility coordinates that fell slightly off the coastline, located on a
river/lake, or slightly outside their correct administrative units and every anomaly was re-
positioned using small shifts in combination with Google Earth. Of the 1,169 facilities we were
unable to geolocate 175 (15%).
On 2 June 2015 we obtained a health facility database from INTRAHEALTH Senegal via Cesaire
Ahanhanzo. This contained 1,668 public and private health facilities of which 698 health
facilities were geocoded. The primary source of coordinates for this database was not indicated
but it was accompanied by a list of 13,321 villages in Senegal, of which 12,463 were geocoded.
Comparisons of the health facilities coordinates with villages of the same name showed that the
health facility coordinates were derived from the village list Comparisons of public health
facilities between the INTRAHEALTH and our database were made. This resulted in an
additional 186 health facilities. The final assembled database contained 1355 public health
facilities. Of this 1269 (94%) were geocoded and are shown on the map (Figure 10).
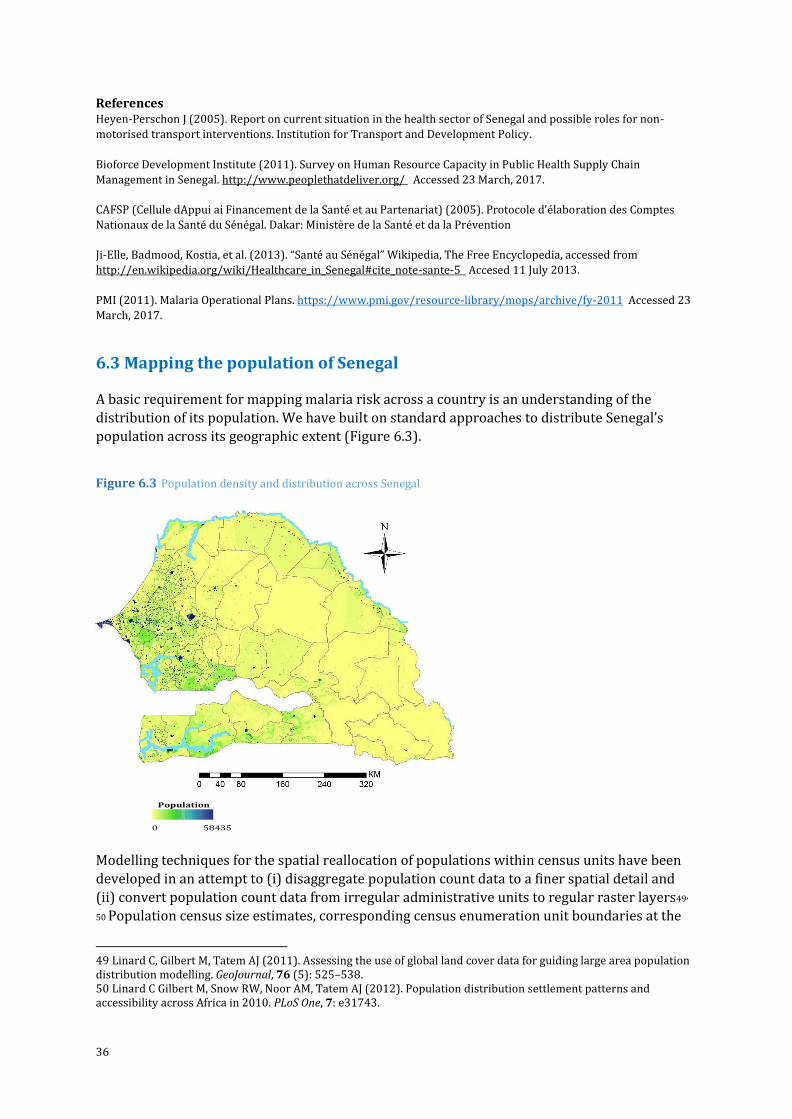
36
References Heyen-Perschon J (2005). Report on current situation in the health sector of Senegal and possible roles for non-
motorised transport interventions. Institution for Transport and Development Policy.
Bioforce Development Institute (2011). Survey on Human Resource Capacity in Public Health Supply Chain
Management in Senegal. http://www.peoplethatdeliver.org/ Accessed 23 March, 2017.
CAFSP (Cellule dAppui ai Financement de la Santé et au Partenariat) (2005). Protocole d’élaboration des Comptes
Nationaux de la Santé du Sénégal. Dakar: Ministère de la Santé et da la Prévention
Ji-Elle, Badmood, Kostia, et al. (2013). “Santé au Sénégal” Wikipedia, The Free Encyclopedia, accessed from
http://en.wikipedia.org/wiki/Healthcare_in_Senegal#cite_note-sante-5 Accesed 11 July 2013.
PMI (2011). Malaria Operational Plans. https://www.pmi.gov/resource-library/mops/archive/fy-2011 Accessed 23
March, 2017.
6.3 Mapping the population of Senegal A basic requirement for mapping malaria risk across a country is an understanding of the
distribution of its population. We have built on standard approaches to distribute Senegal’s
population across its geographic extent (Figure 6.3).
Figure 6.3 Population density and distribution across Senegal
Population
0 58435
Modelling techniques for the spatial reallocation of populations within census units have been
developed in an attempt to (i) disaggregate population count data to a finer spatial detail and
(ii) convert population count data from irregular administrative units to regular raster layers49,
50 Population census size estimates, corresponding census enumeration unit boundaries at the
49 Linard C, Gilbert M, Tatem AJ (2011). Assessing the use of global land cover data for guiding large area population distribution modelling. GeoJournal, 76 (5): 525–538. 50 Linard C Gilbert M, Snow RW, Noor AM, Tatem AJ (2012). Population distribution settlement patterns and accessibility across Africa in 2010. PLoS One, 7: e31743.
37
highest spatial resolution (332 communes) from the most recently publically available census
(2012) were acquired for Senegal. Typical regional per-land cover class population densities
were estimated from African countries for which very fine resolution population data were
available, following approaches outlined by Linard et al. These typical population densities were
then applied as weightings to redistribute census counts according to the land cover and to map
human population distributions at a finer spatial resolution using dasymetric modelling
techniques51 The modelling method distinguishes urban and rural populations in the
redistribution of populations.
6.3.1 Space-time geostatistical modelling Geostatistical methods were developed to interpolate from data at sampled locations in space
and time to provide predictions of quantities at locations and times where data do not exist. All
model-based geostatistical (MBG) methods operate under Tobler’s First Law of Geography
(Figure 6.4), which states that things which are closer in space and time are more similar than
those more spatially and temporally distal.52 When applied with a Bayesian inference
framework, these methods are referred to as model-based geostatistical (MBG) methods.
Bayesian inference allows for better use of sparse data and through the application of prior
knowledge of an outcome in an iterative process. MBG allows for robust estimation of
uncertainties around the estimates of the outcome.
Figure 6.4 Space-time geostatistical models of P. Falciparum transmission intensity
Each blue grid represents a geographic space at one of three time points. The red dots represent
positions and time for which P falciparum parasite prevalence data are available. The small orange square
represents a position and time of interest, but for which no data exists. The black arrows indicate that the
data points surrounding (in time and space) the square of interest are used to predict the likely parasite
prevalence in the orange square.
51 Mennis J (2009). Dasymetric mapping for estimating population in small areas. Geography Compass, 3(2):727–745.
52 Tobler W (1970). A computer movie simulating urban growth in the Detroit region. Economic Geography, 46: 234–240.
Longitude
Tim
e
38
The procedures used to assemble, geocode, archive, model and validate the transformation of
empirical P. falciparum parasite prevalence data to continuous predictions of age-corrected
mean prevalence in children aged 2-10 years (PfPR2-10) are provided by Noor53 and Snow.54,55In
brief, we used information from available age-corrected survey data (sample size and numbers
positive) at known locations (longitude and latitude) and times (year) with a minimal set of
conservative, long-term covariates traditionally used in vector- borne disease mapping. These
were brought together in a Bayesian hierarchical space-time model, implemented through an adapted stochastic partial differential equations (SPDE) approach using integrated nested
laplace approximations (INLA) for inference56,57to produce continuous maps of PfPR2-10 at 1 km
x 1 km spatial resolutions.
Estimating precision
A spatially and temporally de-clustered 10% of the PfPR2-10 data was held out for model
validation. Model accuracy was estimated by computing three variables based on the
observations and predictions of the holdout dataset: (i) the linear correlation, which quantifies
the strength of the linear relationship between the observed and predicted values for the 10%
validation data; (ii) the mean prediction error (MPE), a measure of the bias of predictions (the
overall tendency to over or under predict); and (iii) the mean absolute prediction error (MAPE),
a measure of overall precision (the average magnitude of error in individual predictions.
Covariates were not used in mapping PfPR2-10 in Senegal.
The coefficient of variation (CV) is defined as the ratio of the standard deviation to the mean.58 It
has no measurement units and is an indicator of the magnitude of variability in relation to the
mean or dispersion in data or estimates of a variable. One disadvantage of the CV is that where
the mean is equal to zero, it approaches infinity and is therefore sensitive to small changes in
the mean. In such a case, the standard deviation should be used to describe the uncertainty of
the model predictions
53 Noor AM, Kinyoki DK, Mundia CW, Kabaria CW, Wambua JM, Alegana VA, Fall IS, Snow RW (2014). The changing risk of Plasmodium falciparum malaria infection in Africa: 2000 to 2010. Lancet, 383: 1739-1747. 54 Snow RW, Amratia P, Mundia CW, Alegana VA, Kirui VC, Kabaria CW, Noor AM (2015). Assembling a geo-coded repository of malaria infection prevalence survey data in Africa 1900-2014. INFORM Working Paper, developed with support from the Department of International Development and Wellcome Trust, UK, June 2015; http://www.inform-malaria.org/wp- content/uploads/2015/07/Assembly-of-Parasite-Rate-Data-Version-1.pdf Accessed 1 March, 2017. 55 Snow RW & Noor AM (2015). Malaria risk mapping in Africa: The historical context to the Information for Malaria (INFORM) project. Working Paper in support of the INFORM Project funded by the Department for International Development and the Wellcome Trust, Nairobi, Kenya June 2015; http://www.inform-malaria.org/wp-content/uploads/2015/07/History-of-Malaria-Risk- Mapping-Version-1.pdf Accessed 1 March, 2017. 56 R-INLA project. http://www.r-inla.org/. Accessed 10 April 2012. 57 Rue H, Martino S, Chopin N (2009). Approximate Bayesian inference for latent Gaussian models by using integrated nested Laplace approximations. Journal of the Royal Statistical Society Series B, 71: 319–392. 58 Kirkwood BL (1979). Geometric means and measures of dispersion. Biometrics, 35: 908–909.
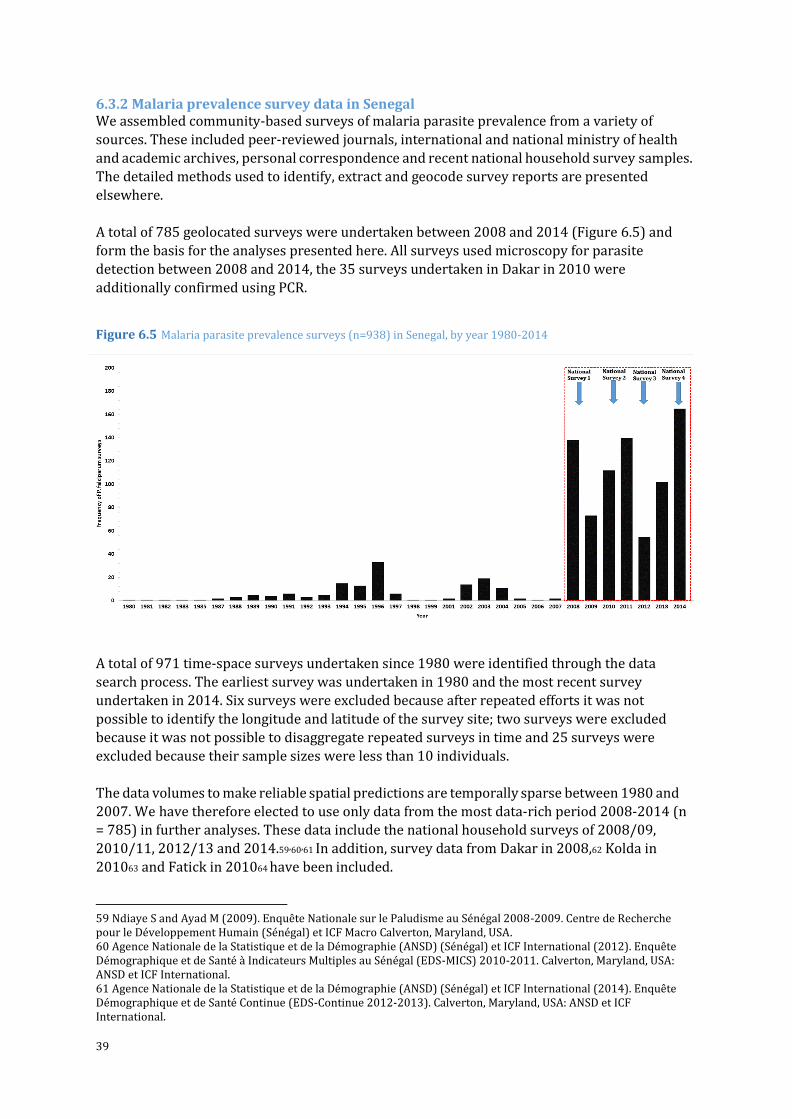
39
6.3.2 Malaria prevalence survey data in Senegal We assembled community-based surveys of malaria parasite prevalence from a variety of
sources. These included peer-reviewed journals, international and national ministry of health
and academic archives, personal correspondence and recent national household survey samples.
The detailed methods used to identify, extract and geocode survey reports are presented
elsewhere.
A total of 785 geolocated surveys were undertaken between 2008 and 2014 (Figure 6.5) and
form the basis for the analyses presented here. All surveys used microscopy for parasite
detection between 2008 and 2014, the 35 surveys undertaken in Dakar in 2010 were
additionally confirmed using PCR.
Figure 6.5 Malaria parasite prevalence surveys (n=938) in Senegal, by year 1980-2014
A total of 971 time-space surveys undertaken since 1980 were identified through the data
search process. The earliest survey was undertaken in 1980 and the most recent survey
undertaken in 2014. Six surveys were excluded because after repeated efforts it was not
possible to identify the longitude and latitude of the survey site; two surveys were excluded
because it was not possible to disaggregate repeated surveys in time and 25 surveys were
excluded because their sample sizes were less than 10 individuals.
The data volumes to make reliable spatial predictions are temporally sparse between 1980 and
2007. We have therefore elected to use only data from the most data-rich period 2008-2014 (n
= 785) in further analyses. These data include the national household surveys of 2008/09,
2010/11, 2012/13 and 2014.59,60,61 In addition, survey data from Dakar in 2008,62 Kolda in
201063 and Fatick in 201064 have been included.
59 Ndiaye S and Ayad M (2009). Enquête Nationale sur le Paludisme au Sénégal 2008-2009. Centre de Recherche pour le Développement Humain (Sénégal) et ICF Macro Calverton, Maryland, USA. 60 Agence Nationale de la Statistique et de la Démographie (ANSD) (Sénégal) et ICF International (2012). Enquête Démographique et de Santé à Indicateurs Multiples au Sénégal (EDS-MICS) 2010-2011. Calverton, Maryland, USA: ANSD et ICF International. 61 Agence Nationale de la Statistique et de la Démographie (ANSD) (Sénégal) et ICF International (2014). Enquête Démographique et de Santé Continue (EDS-Continue 2012-2013). Calverton, Maryland, USA: ANSD et ICF International.
40
6.3.3 Malaria vector data in Senegal We used historical archives and published sources, and sourced more recent unpublished data
from scientists and control agencies working in Senegal, to assemble a database of malaria
vectors in Senegal. Full details of the data assembly, geocoding methods and classifications of
species according to their role in malaria transmission are provided elsewhere.65 The database
has been arranged as a site-specific, referenced inventory to capture details of species identified
since the earliest surveys in 1902 through to the latest records in 2014. The full digital PDF
library, database and bibliography accompany this report.
From each identified report, data extraction included whether a species was identified at a given
site, methods used to capture adults or larvae and the methods used to speciate each anopheline
collection. “Y” was recorded if species was identified and “N” was only recorded when the
absence of the species was reported. The database is therefore one of species presence, not
absence or proportional presence of the different vectors.
6.4.4 ITN/LLIN coverage mapping Typically, national household surveys are designed to be precise at national and regional levels
and rarely at lower levels such as districts. Simply aggregating survey data to provide district
level estimates of an outcome of interest will lead to values of low precision. Small area
estimation (SAE) methods handle the problem of making reliable estimates of a variable at these
units under conditions where the information available for the variable, on its own, is not
sufficient to make valid estimates.66,67 We have used hierarchical Bayesian spatial and temporal
SAE techniques using a geo-additive regression approach68,69 to estimate the proportion of the
population in each health district sleeping under an insecticide treated net (ITN) the night
before the survey. This has been done by health district for the years 2005, 2008-2009 and
2010-20011 and 2012-2013. This method uses survey data from a health district and
neighbourhood information from adjacent districts to smooth values at the health district level.
Covariates were not used in this approach. However, if information on the month and year that
distributions of ITNs was available for each health district, this could improve the precision of
the estimates.
62 Diallo A et al. (2012). Asymptomatic carriage of Plasmodium in urban Dakar: the risk of malaria should not be under-estimated. PLoS One, 7: e31100. 63 Tine RC et al. (2011). Impact of combining intermittent preventive treatment with home management of malaria in children less than 10 years in a rural area of Senegal: a cluster randomized trial. Malar. J, 10: 358. 64 Roucher C et al. (2012). Changing malaria epidemiology and diagnostic criteria for Plasmodium falciparum clinical malaria. PLoS One, 7: e46188; JF Trape, personal communication. 13 October, 2012. 65 Snow RW, Kyalo D, Amratia P, Kabaria CW, Noor AM (2015). Developing a geo-coded repository of malaria vector species occurrence for Africa: methods and data summaries 1900-2014. Working Paper 2: Report prepared in support of the INFORM Project funded by the Department for International Development and the Wellcome Trust, April; http://www.inform-malaria.org/wp- content/uploads/2015/07/Assembly-of-Vector-Data-Version-1.pdf Accessed 1 March, 2017.
66 Rao JNK (2003). Small Area Estimation. John Wiley & Sons, Inc., Hoboken, New Jersey. 67 BIAS (2007). Introduction to Bayesian Small Area Estimation, January 2007. http://www.bias-project.org.uk/software/SAE.pdf Accessed 3 February, 2016. 68 Banerjee S, Carlin BP, Gelfand AE (2004). Hierarchical Modeling and Analysis for Spatial Data. New York: Chapman & Hall. 69 Best N, Richardson S, Thomson A (2005). A comparison of Bayesian spatial models for disease mapping. Statistical Methods in Medical Research, 14: 35–59.
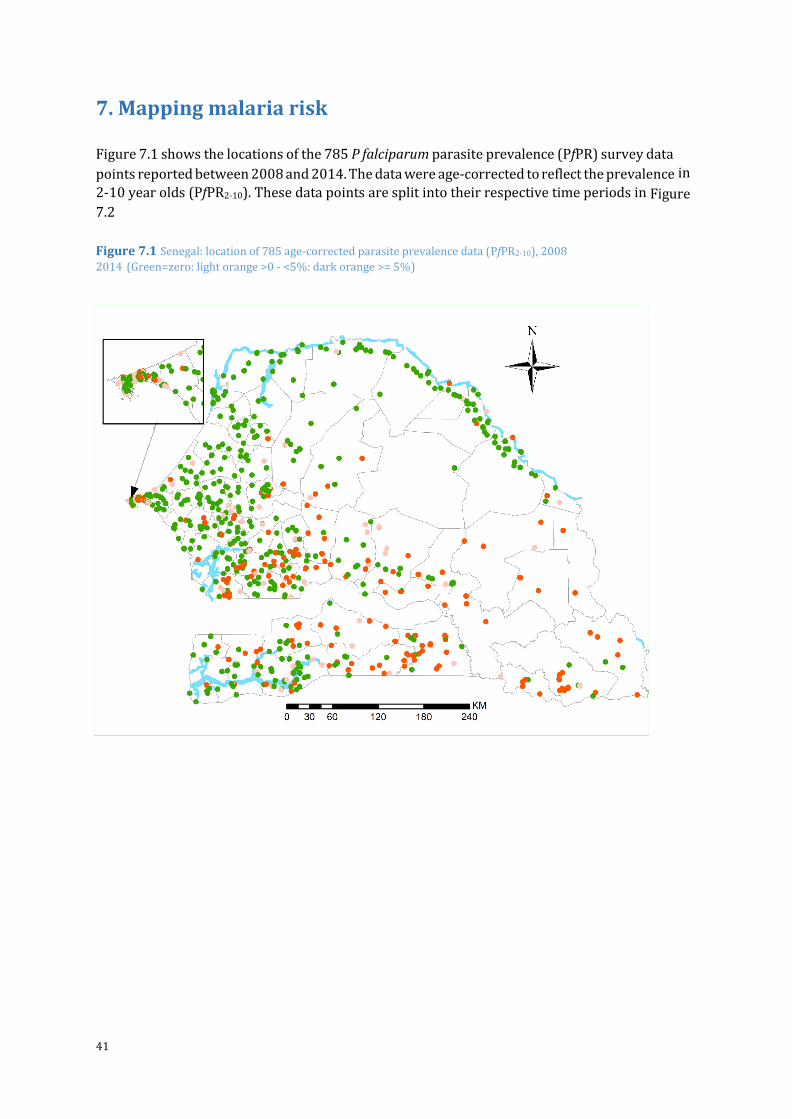
41
7. Mapping malaria risk
Figure 7.1 shows the locations of the 785 P falciparum parasite prevalence (PfPR) survey data
points reported between 2008 and 2014. The data were age-corrected to reflect the prevalence in
2-10 year olds (PfPR2-10). These data points are split into their respective time periods in Figure 7.2
Figure 7.1 Senegal: location of 785 age-corrected parasite prevalence data (PfPR2-10), 2008
2014 (Green=zero: light orange >0 - <5%: dark orange >= 5%)
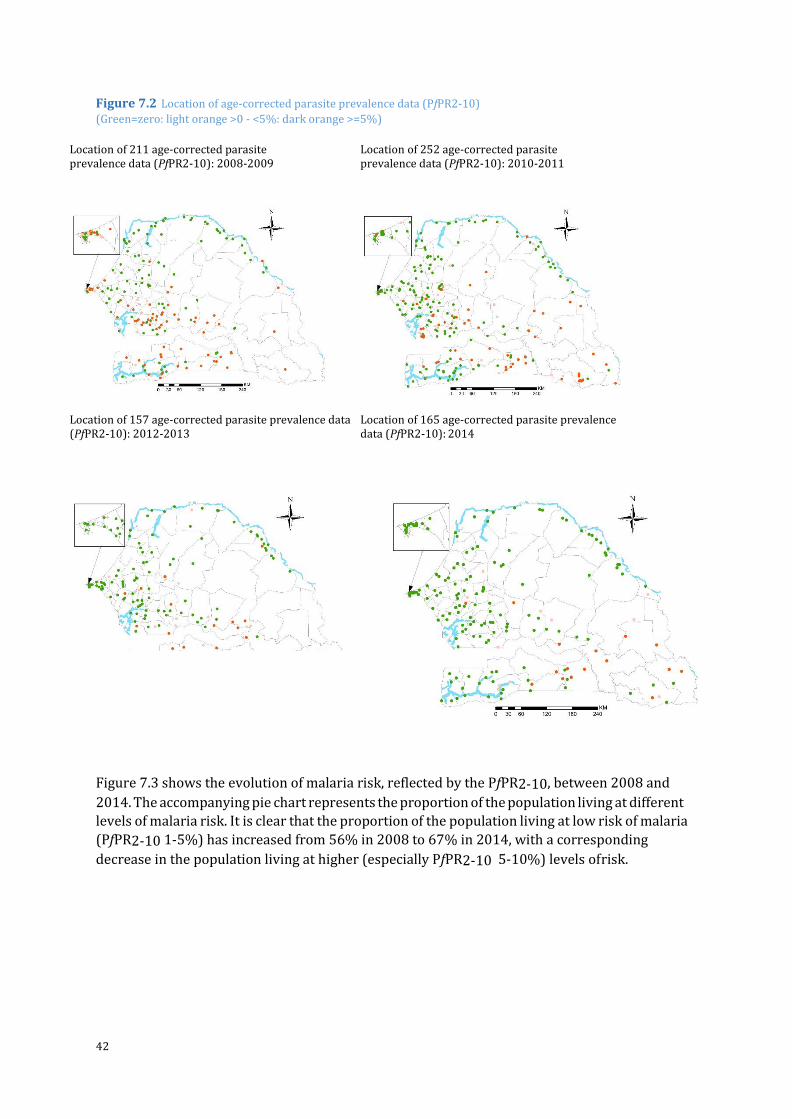
42
Figure 7.2 Location of age-corrected parasite prevalence data (PfPR2-10)
(Green=zero: light orange >0 - <5%: dark orange >=5%)
Figure 7.3 shows the evolution of malaria risk, reflected by the PfPR2-10, between 2008 and
2014. The accompanying pie chart represents the proportion of the population living at different
levels of malaria risk. It is clear that the proportion of the population living at low risk of malaria
(PfPR2-10 1-5%) has increased from 56% in 2008 to 67% in 2014, with a corresponding
decrease in the population living at higher (especially PfPR2-10 5-10%) levels of risk.
Location of 211 age-corrected parasite prevalence data (PfPR2-10): 2008-2009
Location of 252 age-corrected parasite prevalence data (PfPR2-10): 2010-2011
Location of 157 age-corrected parasite prevalence data (PfPR2-10): 2012-2013
Location of 165 age-corrected parasite prevalence data (PfPR2-10): 2014
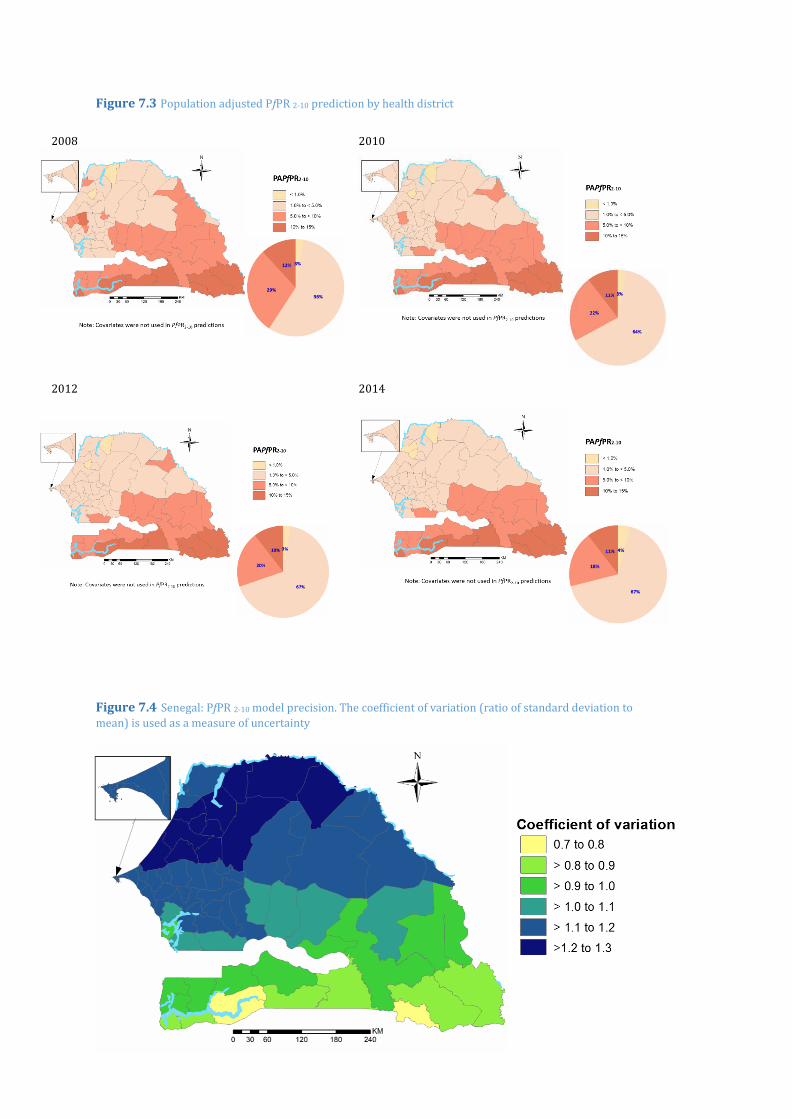
43
Figure 7.3 Population adjusted PfPR 2-10 prediction by health district
Figure 7.4 Senegal: PfPR 2-10 model precision. The coefficient of variation (ratio of standard deviation to
mean) is used as a measure of uncertainty
202008 2010
202012 2014
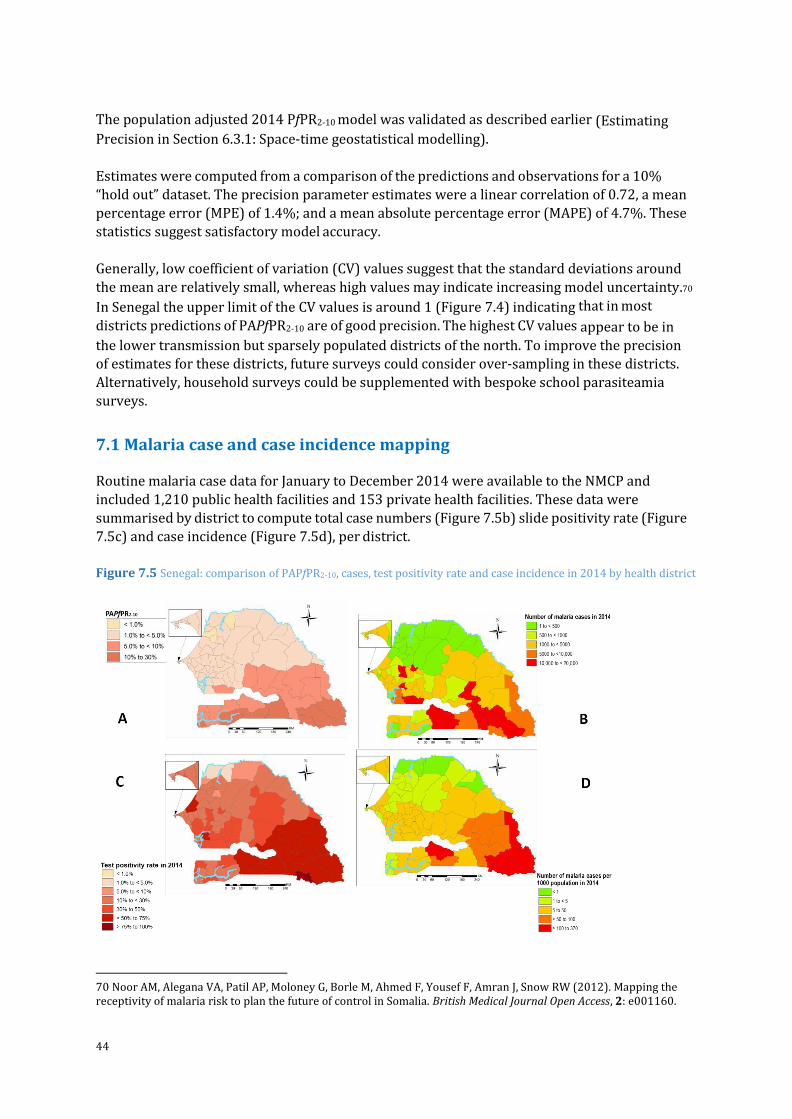
44
The population adjusted 2014 PfPR2-10 model was validated as described earlier (Estimating Precision in Section 6.3.1: Space-time geostatistical modelling).
Estimates were computed from a comparison of the predictions and observations for a 10%
“hold out” dataset. The precision parameter estimates were a linear correlation of 0.72, a mean
percentage error (MPE) of 1.4%; and a mean absolute percentage error (MAPE) of 4.7%. These
statistics suggest satisfactory model accuracy.
Generally, low coefficient of variation (CV) values suggest that the standard deviations around
the mean are relatively small, whereas high values may indicate increasing model uncertainty.70
In Senegal the upper limit of the CV values is around 1 (Figure 7.4) indicating that in most
districts predictions of PAPfPR2-10 are of good precision. The highest CV values appear to be in
the lower transmission but sparsely populated districts of the north. To improve the precision
of estimates for these districts, future surveys could consider over-sampling in these districts.
Alternatively, household surveys could be supplemented with bespoke school parasiteamia
surveys.
7.1 Malaria case and case incidence mapping Routine malaria case data for January to December 2014 were available to the NMCP and
included 1,210 public health facilities and 153 private health facilities. These data were
summarised by district to compute total case numbers (Figure 7.5b) slide positivity rate (Figure
7.5c) and case incidence (Figure 7.5d), per district.
Figure 7.5 Senegal: comparison of PAPfPR2-10, cases, test positivity rate and case incidence in 2014 by health district
70 Noor AM, Alegana VA, Patil AP, Moloney G, Borle M, Ahmed F, Yousef F, Amran J, Snow RW (2012). Mapping the receptivity of malaria risk to plan the future of control in Somalia. British Medical Journal Open Access, 2: e001160.
45
Comparisons of PAPfPR2-10, test positivity rate (TPR) and case incidence for 2014 present a
mixed and in some cases conflicting epidemiological profile. Some areas with low PAPfPR2-10
seem to have high TPR. Some districts with very low cases numbers and case incidences also
show high TPR. Geolocations were available for 1,116 (92%) of the public health facilities that
reported malaria cases in 2014. The reported case numbers and test positivity rates are
presented for each health facility, by region and health district in Figures 7.6-7.9.
The utility of these analyses could be enhanced by the following:
1. Establish an authenticated master list of health facilities to determine accurately the
proportion that report data (reporting rate).
2. Define health facility catchments areas to determine the actual catchment
population so that utilisation rate can be estimated when computing case incidence.
Undertake quality assurance of malaria case data in selected districts where the
different metrics do not reconcile.
3. It is important to assure the quality of reported data, the proportion of cases that are
likely to be imported and the prevalence of infection in the communities from which
the cases are drawn.
4. Agree on the metrics to track progress for each district.
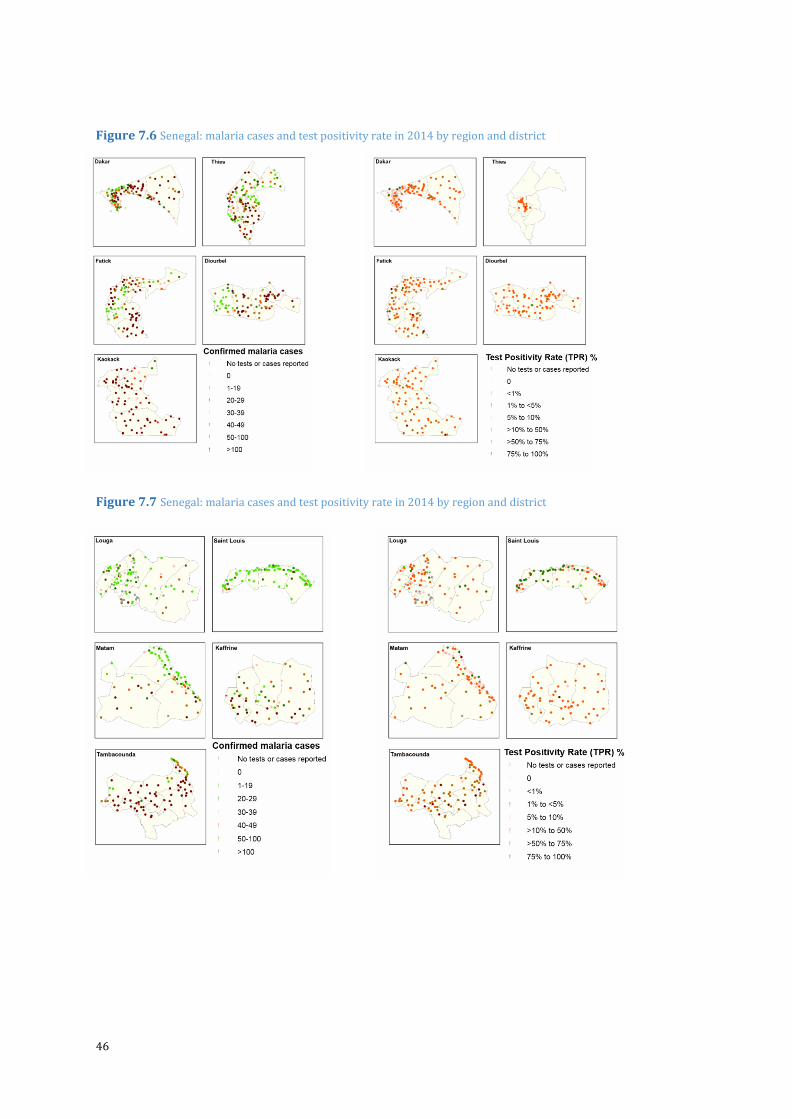
46
Figure 7.6 Senegal: malaria cases and test positivity rate in 2014 by region and district
Figure 7.7 Senegal: malaria cases and test positivity rate in 2014 by region and district
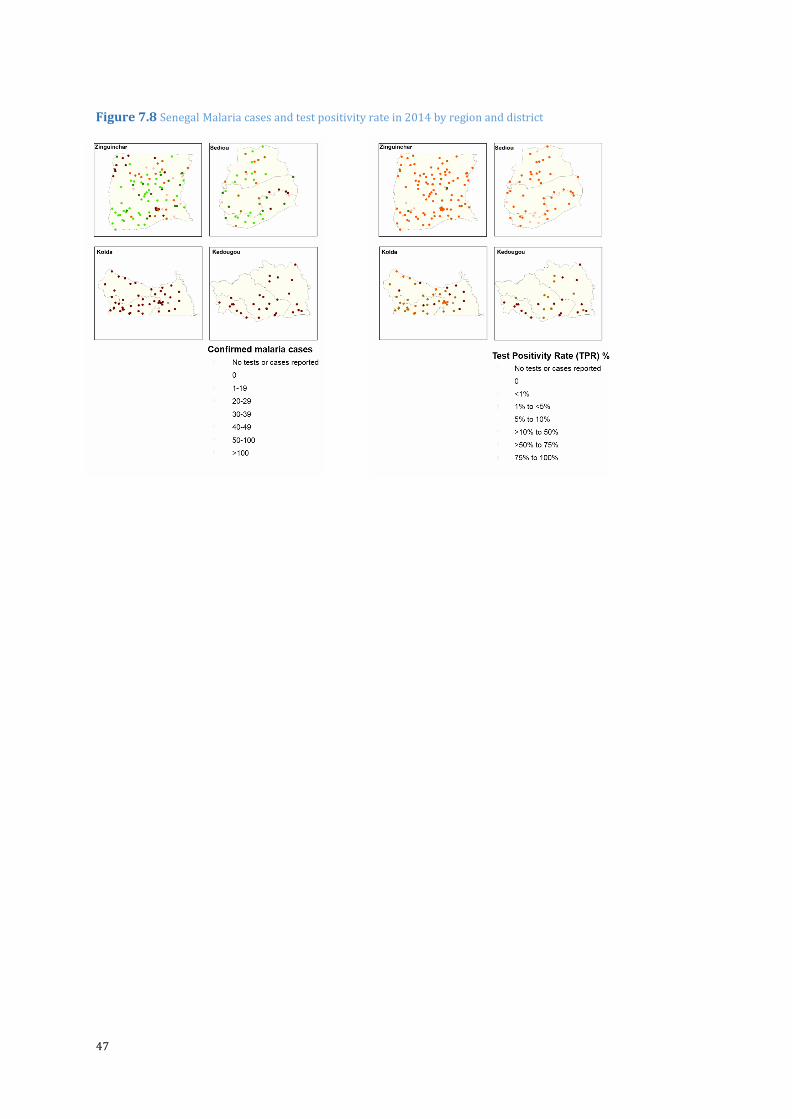
47
Figure 7.8 Senegal Malaria cases and test positivity rate in 2014 by region and district
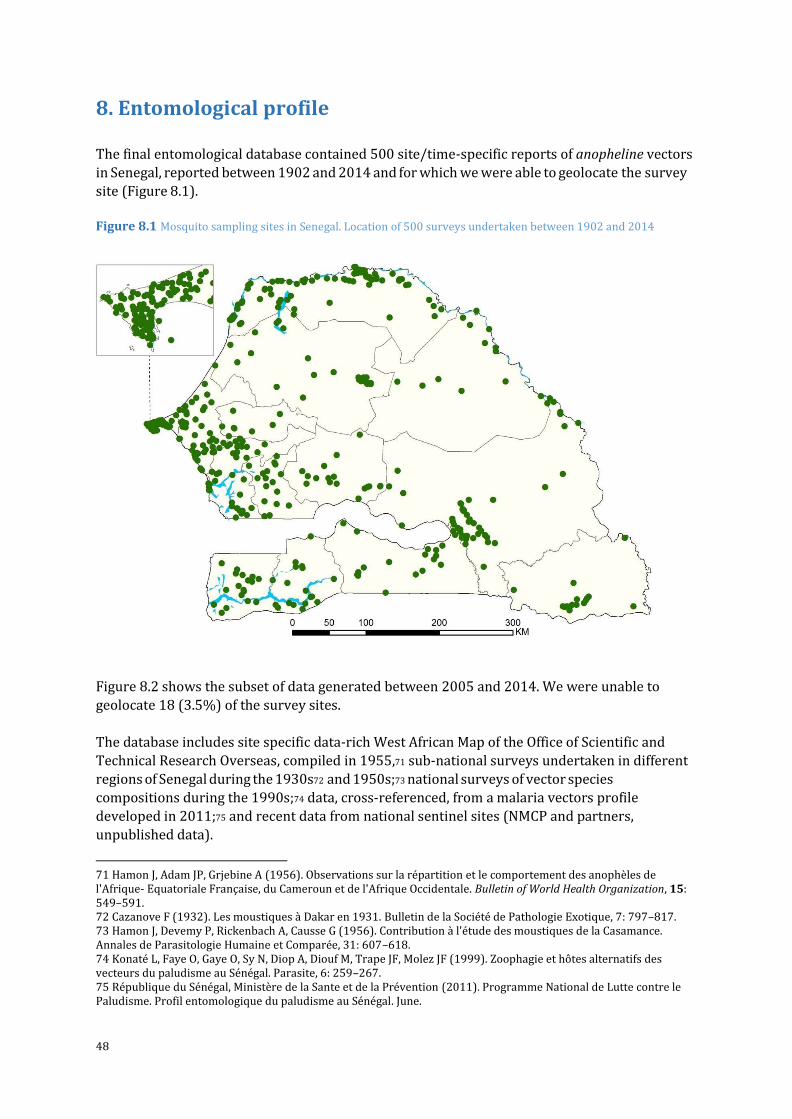
48
8. Entomological profile
The final entomological database contained 500 site/time-specific reports of anopheline vectors
in Senegal, reported between 1902 and 2014 and for which we were able to geolocate the survey
site (Figure 8.1).
Figure 8.1 Mosquito sampling sites in Senegal. Location of 500 surveys undertaken between 1902 and 2014
Figure 8.2 shows the subset of data generated between 2005 and 2014. We were unable to
geolocate 18 (3.5%) of the survey sites.
The database includes site specific data-rich West African Map of the Office of Scientific and
Technical Research Overseas, compiled in 1955,71 sub-national surveys undertaken in different
regions of Senegal during the 1930s72 and 1950s;73 national surveys of vector species
compositions during the 1990s;74 data, cross-referenced, from a malaria vectors profile
developed in 2011;75 and recent data from national sentinel sites (NMCP and partners,
unpublished data).
71 Hamon J, Adam JP, Grjebine A (1956). Observations sur la répartition et le comportement des anophèles de l'Afrique- Equatoriale Française, du Cameroun et de l'Afrique Occidentale. Bulletin of World Health Organization, 15: 549–591. 72 Cazanove F (1932). Les moustiques à Dakar en 1931. Bulletin de la Société de Pathologie Exotique, 7: 797–817. 73 Hamon J, Devemy P, Rickenbach A, Causse G (1956). Contribution à l'étude des moustiques de la Casamance. Annales de Parasitologie Humaine et Comparée, 31: 607–618. 74 Konaté L, Faye O, Gaye O, Sy N, Diop A, Diouf M, Trape JF, Molez JF (1999). Zoophagie et hôtes alternatifs des vecteurs du paludisme au Sénégal. Parasite, 6: 259–267. 75 République du Sénégal, Ministère de la Sante et de la Prévention (2011). Programme National de Lutte contre le Paludisme. Profil entomologique du paludisme au Sénégal. June.
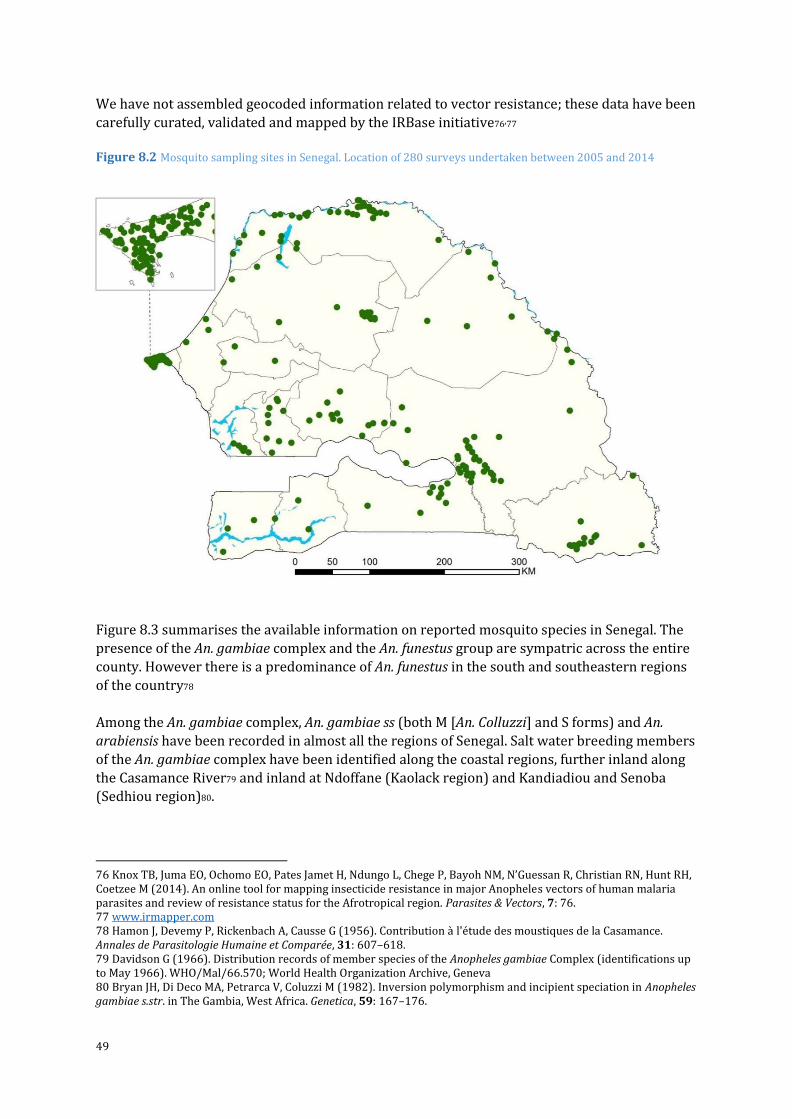
49
We have not assembled geocoded information related to vector resistance; these data have been
carefully curated, validated and mapped by the IRBase initiative76,77
Figure 8.2 Mosquito sampling sites in Senegal. Location of 280 surveys undertaken between 2005 and 2014
Figure 8.3 summarises the available information on reported mosquito species in Senegal. The
presence of the An. gambiae complex and the An. funestus group are sympatric across the entire
county. However there is a predominance of An. funestus in the south and southeastern regions
of the country78
Among the An. gambiae complex, An. gambiae ss (both M [An. Colluzzi] and S forms) and An.
arabiensis have been recorded in almost all the regions of Senegal. Salt water breeding members
of the An. gambiae complex have been identified along the coastal regions, further inland along
the Casamance River79 and inland at Ndoffane (Kaolack region) and Kandiadiou and Senoba
(Sedhiou region)80.
76 Knox TB, Juma EO, Ochomo EO, Pates Jamet H, Ndungo L, Chege P, Bayoh NM, N’Guessan R, Christian RN, Hunt RH, Coetzee M (2014). An online tool for mapping insecticide resistance in major Anopheles vectors of human malaria parasites and review of resistance status for the Afrotropical region. Parasites & Vectors, 7: 76. 77 www.irmapper.com 78 Hamon J, Devemy P, Rickenbach A, Causse G (1956). Contribution à l'étude des moustiques de la Casamance. Annales de Parasitologie Humaine et Comparée, 31: 607–618. 79 Davidson G (1966). Distribution records of member species of the Anopheles gambiae Complex (identifications up to May 1966). WHO/Mal/66.570; World Health Organization Archive, Geneva 80 Bryan JH, Di Deco MA, Petrarca V, Coluzzi M (1982). Inversion polymorphism and incipient speciation in Anopheles gambiae s.str. in The Gambia, West Africa. Genetica, 59: 167–176.
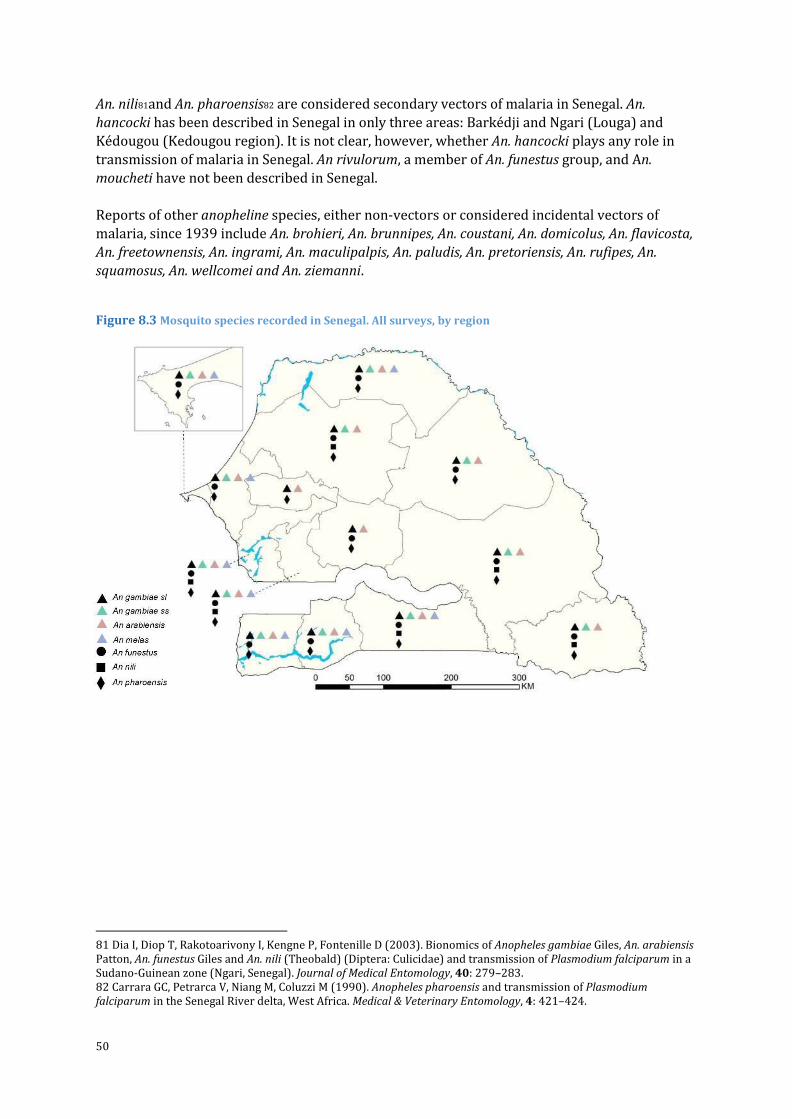
50
An. nili81and An. pharoensis82 are considered secondary vectors of malaria in Senegal. An.
hancocki has been described in Senegal in only three areas: Barkédji and Ngari (Louga) and
Kédougou (Kedougou region). It is not clear, however, whether An. hancocki plays any role in
transmission of malaria in Senegal. An rivulorum, a member of An. funestus group, and An.
moucheti have not been described in Senegal.
Reports of other anopheline species, either non-vectors or considered incidental vectors of
malaria, since 1939 include An. brohieri, An. brunnipes, An. coustani, An. domicolus, An. flavicosta,
An. freetownensis, An. ingrami, An. maculipalpis, An. paludis, An. pretoriensis, An. rufipes, An.
squamosus, An. wellcomei and An. ziemanni.
Figure 8.3 Mosquito species recorded in Senegal. All surveys, by region
81 Dia I, Diop T, Rakotoarivony I, Kengne P, Fontenille D (2003). Bionomics of Anopheles gambiae Giles, An. arabiensis Patton, An. funestus Giles and An. nili (Theobald) (Diptera: Culicidae) and transmission of Plasmodium falciparum in a Sudano-Guinean zone (Ngari, Senegal). Journal of Medical Entomology, 40: 279–283. 82 Carrara GC, Petrarca V, Niang M, Coluzzi M (1990). Anopheles pharoensis and transmission of Plasmodium falciparum in the Senegal River delta, West Africa. Medical & Veterinary Entomology, 4: 421–424.
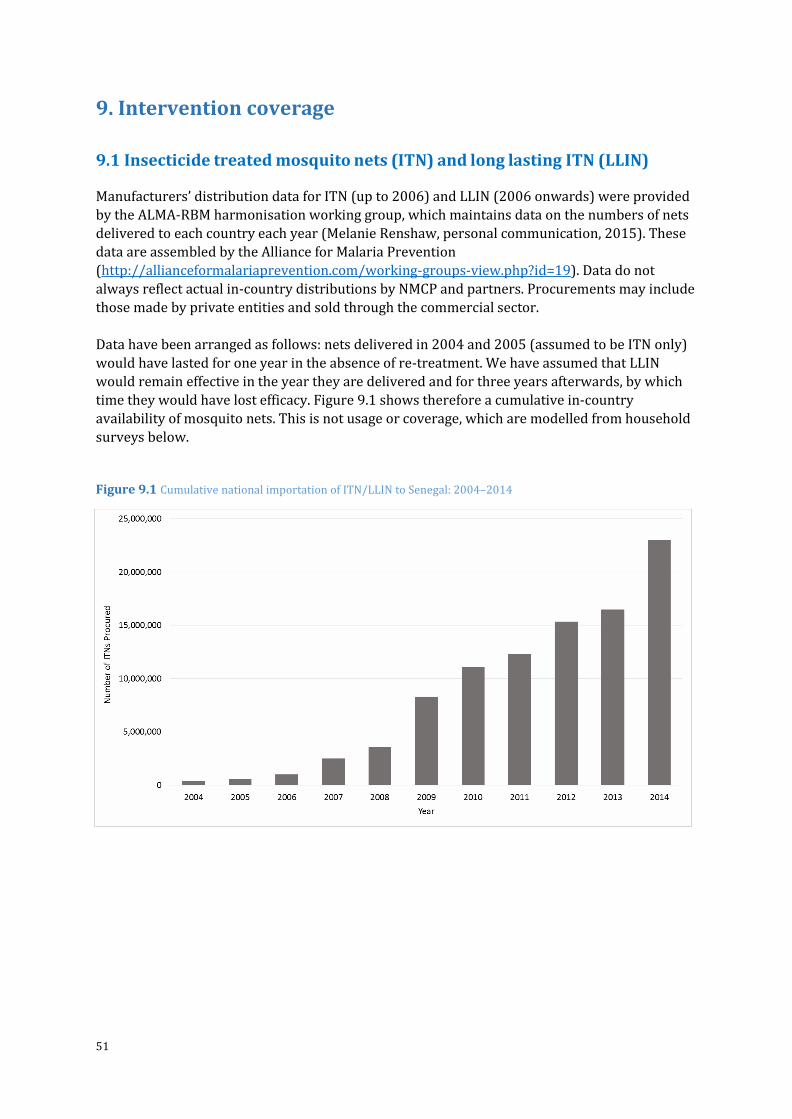
51
9. Intervention coverage
9.1 Insecticide treated mosquito nets (ITN) and long lasting ITN (LLIN) Manufacturers’ distribution data for ITN (up to 2006) and LLIN (2006 onwards) were provided
by the ALMA-RBM harmonisation working group, which maintains data on the numbers of nets
delivered to each country each year (Melanie Renshaw, personal communication, 2015). These
data are assembled by the Alliance for Malaria Prevention
(http://allianceformalariaprevention.com/working-groups-view.php?id=19). Data do not
always reflect actual in-country distributions by NMCP and partners. Procurements may include
those made by private entities and sold through the commercial sector.
Data have been arranged as follows: nets delivered in 2004 and 2005 (assumed to be ITN only)
would have lasted for one year in the absence of re-treatment. We have assumed that LLIN
would remain effective in the year they are delivered and for three years afterwards, by which
time they would have lost efficacy. Figure 9.1 shows therefore a cumulative in-country
availability of mosquito nets. This is not usage or coverage, which are modelled from household
surveys below.
Figure 9.1 Cumulative national importation of ITN/LLIN to Senegal: 2004–2014
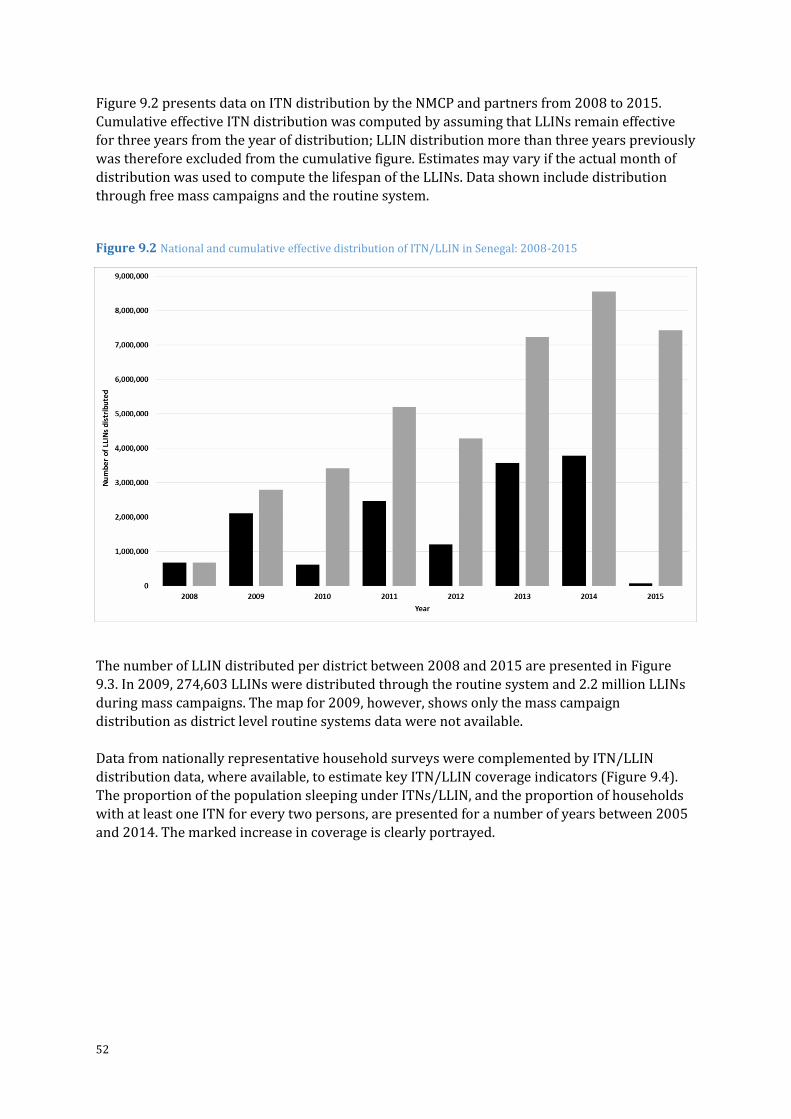
52
Figure 9.2 presents data on ITN distribution by the NMCP and partners from 2008 to 2015.
Cumulative effective ITN distribution was computed by assuming that LLINs remain effective
for three years from the year of distribution; LLIN distribution more than three years previously
was therefore excluded from the cumulative figure. Estimates may vary if the actual month of
distribution was used to compute the lifespan of the LLINs. Data shown include distribution
through free mass campaigns and the routine system.
Figure 9.2 National and cumulative effective distribution of ITN/LLIN in Senegal: 2008-2015
The number of LLIN distributed per district between 2008 and 2015 are presented in Figure
9.3. In 2009, 274,603 LLINs were distributed through the routine system and 2.2 million LLINs
during mass campaigns. The map for 2009, however, shows only the mass campaign
distribution as district level routine systems data were not available.
Data from nationally representative household surveys were complemented by ITN/LLIN
distribution data, where available, to estimate key ITN/LLIN coverage indicators (Figure 9.4).
The proportion of the population sleeping under ITNs/LLIN, and the proportion of households
with at least one ITN for every two persons, are presented for a number of years between 2005
and 2014. The marked increase in coverage is clearly portrayed.
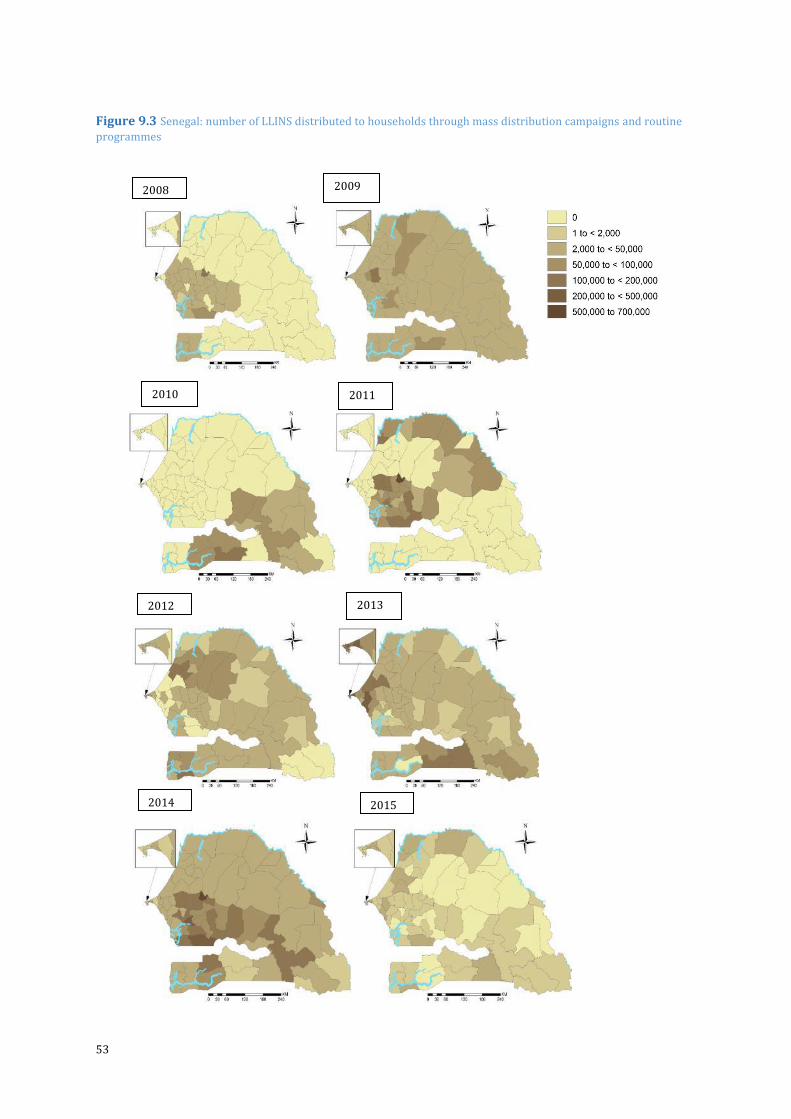
53
Figure 9.3 Senegal: number of LLINS distributed to households through mass distribution campaigns and routine
programmes
2010 2011
2012 2013
2014 2015
2008 2009
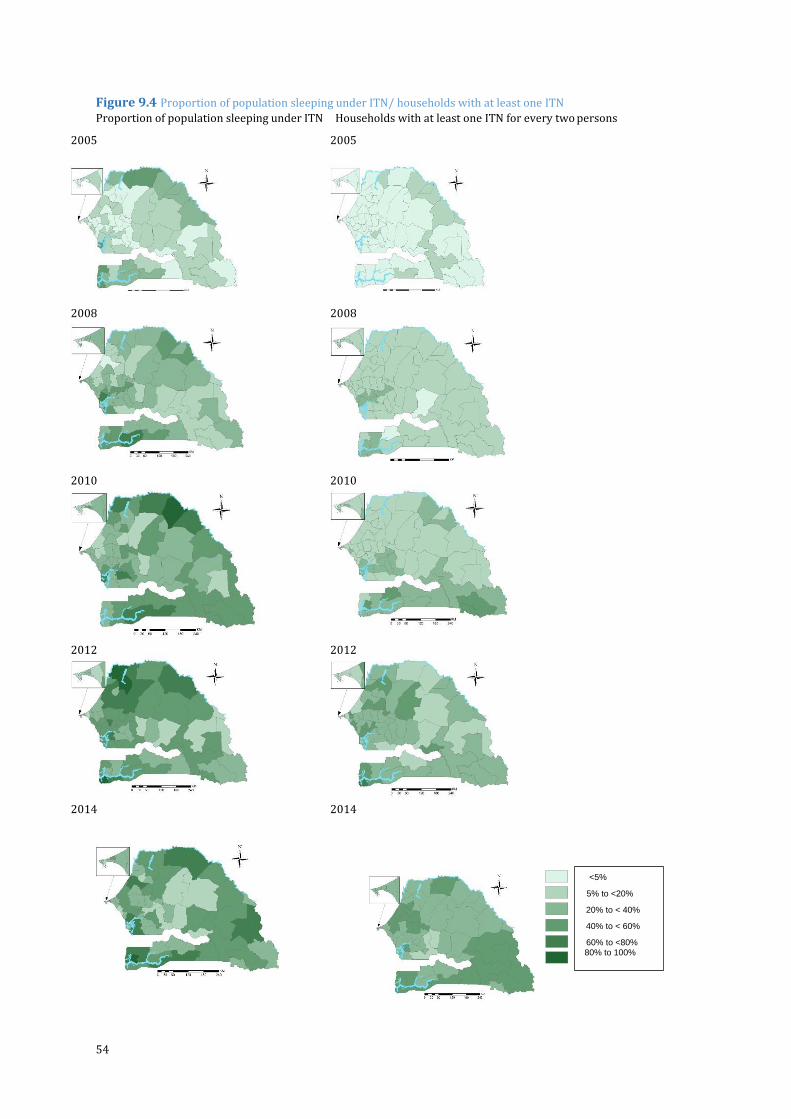
54
Figure 9.4 Proportion of population sleeping under ITN/ households with at least one ITN
Proportion of population sleeping under ITN Households with at least one ITN for every two persons
2005 2005
2008
2008
2010 2010
2012 2012
2014 2014
<5% 5% to <20% 20% to < 40% 40% to < 60% 60% to <80% 80% to 100%
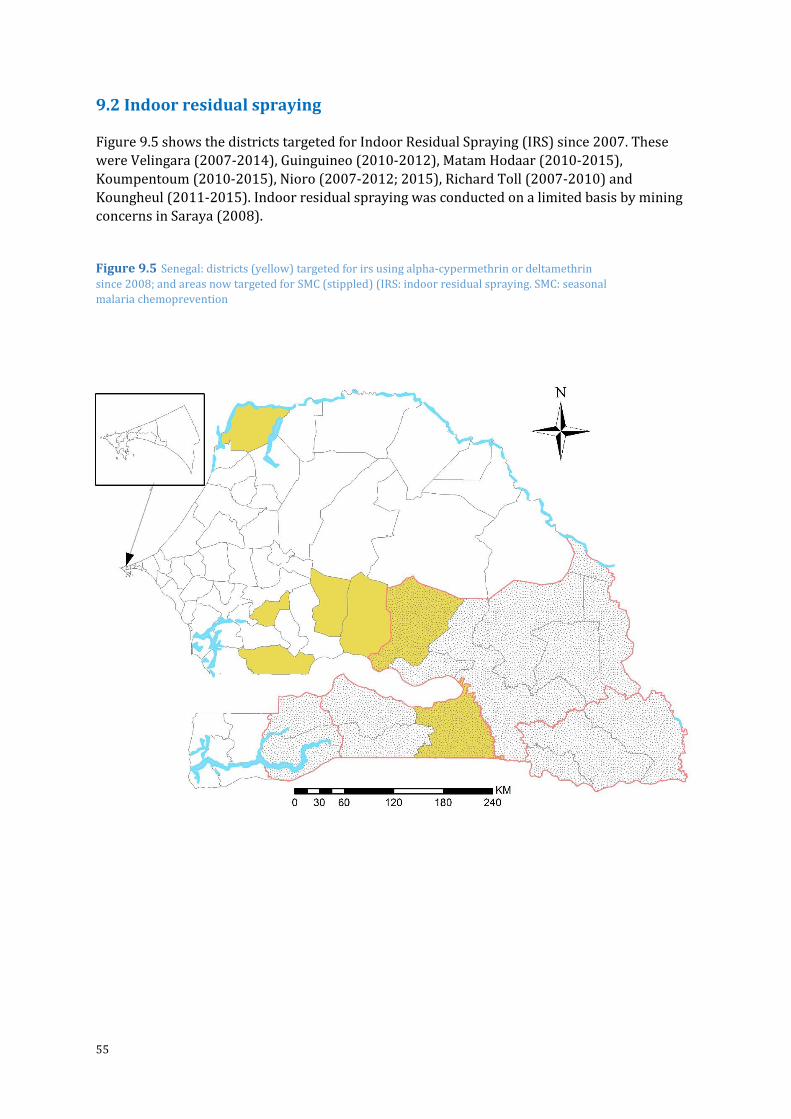
55
9.2 Indoor residual spraying
Figure 9.5 shows the districts targeted for Indoor Residual Spraying (IRS) since 2007. These
were Velingara (2007-2014), Guinguineo (2010-2012), Matam Hodaar (2010-2015),
Koumpentoum (2010-2015), Nioro (2007-2012; 2015), Richard Toll (2007-2010) and
Koungheul (2011-2015). Indoor residual spraying was conducted on a limited basis by mining
concerns in Saraya (2008).
Figure 9.5 Senegal: districts (yellow) targeted for irs using alpha-cypermethrin or deltamethrin
since 2008; and areas now targeted for SMC (stippled) (IRS: indoor residual spraying. SMC: seasonal
malaria chemoprevention
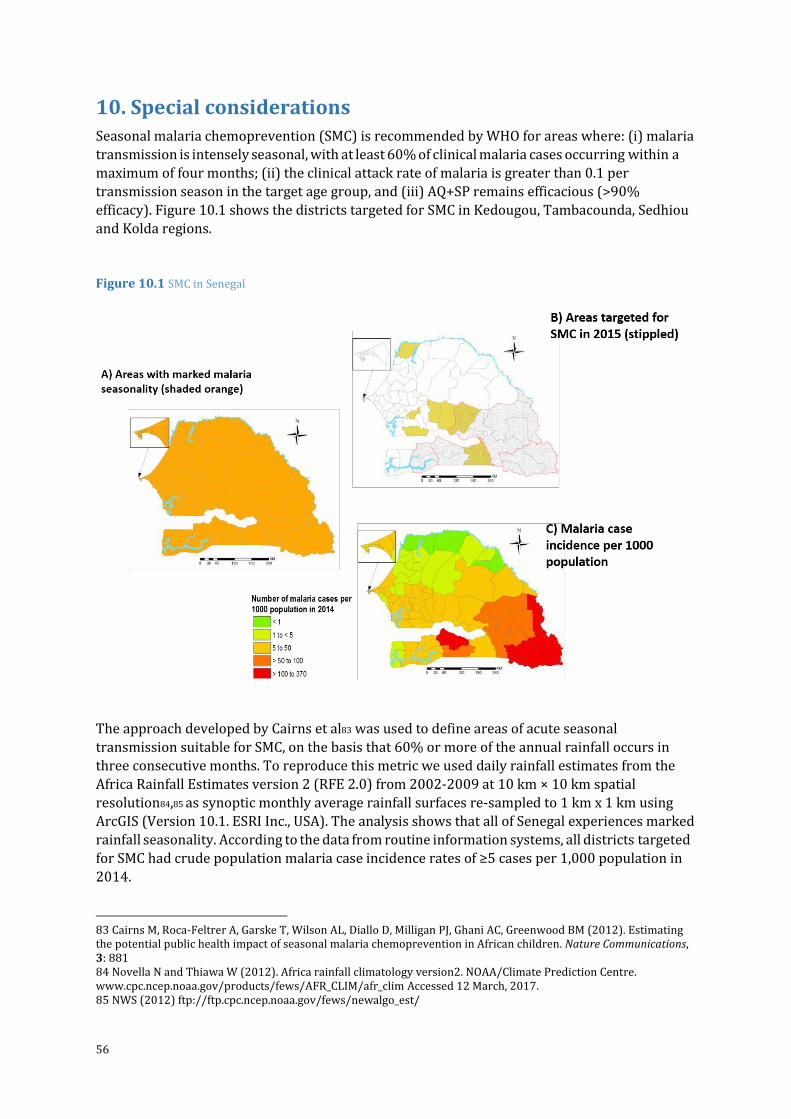
56
10. Special considerations Seasonal malaria chemoprevention (SMC) is recommended by WHO for areas where: (i) malaria
transmission is intensely seasonal, with at least 60% of clinical malaria cases occurring within a
maximum of four months; (ii) the clinical attack rate of malaria is greater than 0.1 per
transmission season in the target age group, and (iii) AQ+SP remains efficacious (>90%
efficacy). Figure 10.1 shows the districts targeted for SMC in Kedougou, Tambacounda, Sedhiou
and Kolda regions.
Figure 10.1 SMC in Senegal
The approach developed by Cairns et al83 was used to define areas of acute seasonal
transmission suitable for SMC, on the basis that 60% or more of the annual rainfall occurs in
three consecutive months. To reproduce this metric we used daily rainfall estimates from the
Africa Rainfall Estimates version 2 (RFE 2.0) from 2002-2009 at 10 km × 10 km spatial
resolution84,85 as synoptic monthly average rainfall surfaces re-sampled to 1 km x 1 km using
ArcGIS (Version 10.1. ESRI Inc., USA). The analysis shows that all of Senegal experiences marked
rainfall seasonality. According to the data from routine information systems, all districts targeted
for SMC had crude population malaria case incidence rates of ≥5 cases per 1,000 population in
2014.
83 Cairns M, Roca-Feltrer A, Garske T, Wilson AL, Diallo D, Milligan PJ, Ghani AC, Greenwood BM (2012). Estimating the potential public health impact of seasonal malaria chemoprevention in African children. Nature Communications, 3: 881 84 Novella N and Thiawa W (2012). Africa rainfall climatology version2. NOAA/Climate Prediction Centre. www.cpc.ncep.noaa.gov/products/fews/AFR_CLIM/afr_clim Accessed 12 March, 2017. 85 NWS (2012) ftp://ftp.cpc.ncep.noaa.gov/fews/newalgo_est/
Epidemiology and control profile of malaria in
Senegal
Recommended