The Global Financial Services Industry in transition
July 27, 2009
By: A V Vedpuriswar

Views of an expert
Interview with Lord Turner, Chairman UK Financial Services Authority.
Source: Financial Times

Day in September
The Global meltdown : The events of September 2008
Event
7 Fannie Mae, Freddie Mac nationalised
14
16
15
22
Bank of America acquires Merrill
Collapse of Reserve Primary, AIG bailout
Collapse of Lehman Brothers
Goldman, Morgan become bank holding companies
25 Washington Mutual placed in receivership

Where are we headed? The worst recessions in the US
Great Depression : 1929 – 1933
Severe recession : 1973 - 1975
Severe recession : 1981 - 1982
Long deflation : 1873 –1879
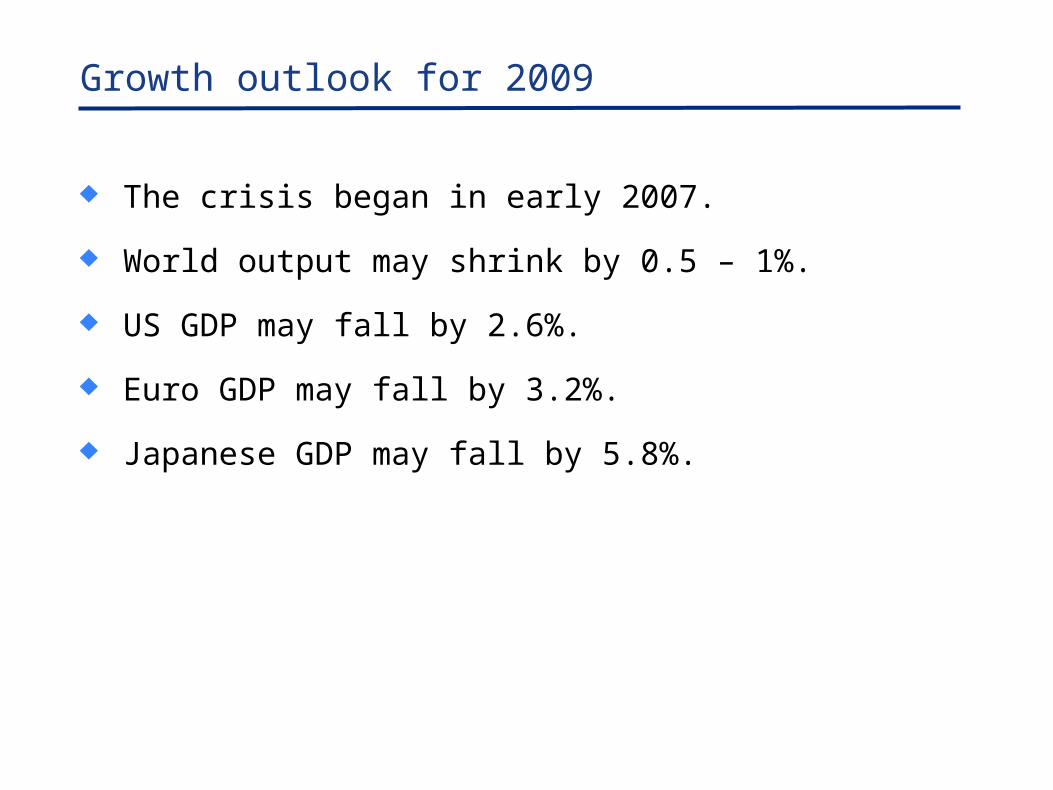
Growth outlook for 2009
The crisis began in early 2007.
World output may shrink by 0.5 – 1%.
US GDP may fall by 2.6%.
Euro GDP may fall by 3.2%.
Japanese GDP may fall by 5.8%.

Medium Term Unemployment Outlook

Philosophical views of the crisis(1) “The more risk we take because we believe the
environment is low risk in character, the less the environment continues to be low risk in character.”
- Peter Bernstein
“You cannot measure something and observe its movements at the same time because the act of measurement changes the character of motion.”
-Wener HeisenbergInterest rates remained too low for too long.
Between 2000 and mid 2008, the worldwide notional value of derivatives went up from $ 95 trillion to $ 684 trillion.

Philosophical views of the crisis(2)
“Every state nurtures forces that lead to its own destruction.”
- Hyman Minsky
“Stability inevitably leads to instability.”
- Hyman Minsky
“Instability leads inevitably to stability.”
- Peter Bernstein

10
Understanding Banking
What is special about banking?
Why is it such a regulated industry?
Channelise savings into productive investments.
Transform short term debt into long term loans.
Manage the risks involved.
Fragility
Government support
Regulation

The Strategic importance of Banking
The Economist July 11, 2009
12
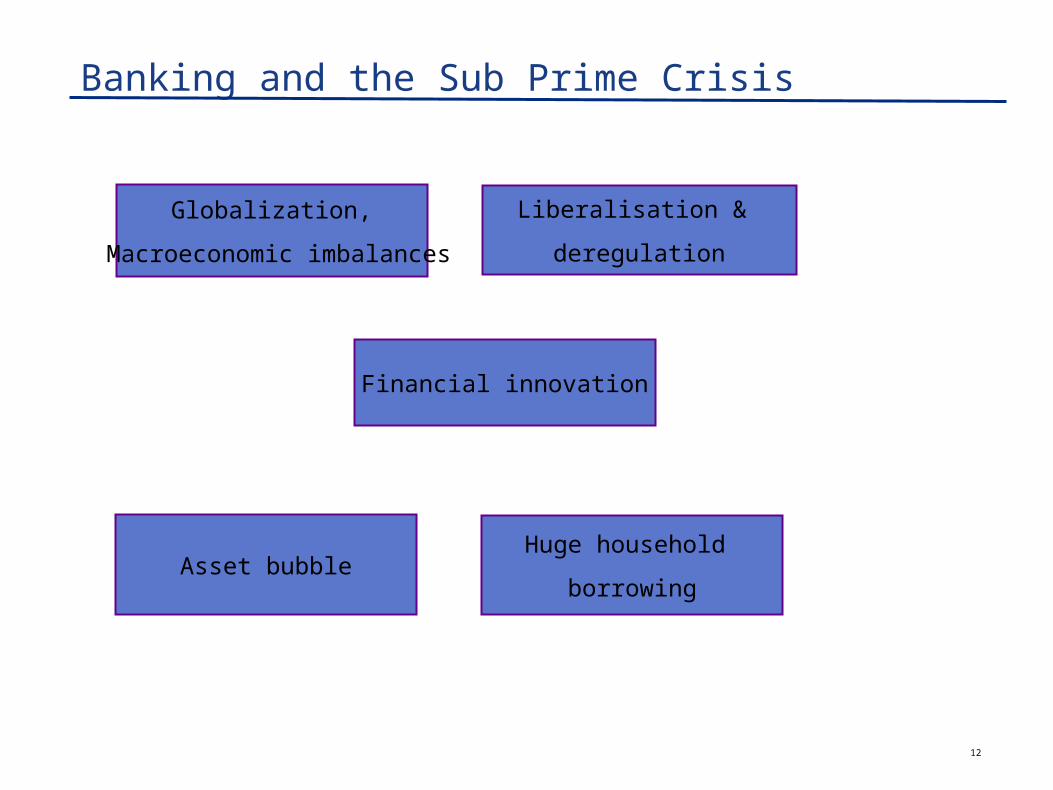
Banking and the Sub Prime Crisis
Globalization,
Macroeconomic imbalances
Liberalisation &
deregulation
Asset bubbleHuge household
borrowing
Financial innovation

13
The sub prime crisis at a glance
Rise in home prices Buyers priced out
Home sales rise Buyers can now afford
New affordable products

The housing bubble

15
The importance of US residential real estate (2007)
Real estate market $ 23 trillion
Mortgage debt $ 10.7 trillion
Homeowner equity $ 12.3 trillion
Securitised mortgage $ 6.3 trillion

Central Banking and Sub Prime :Federal Funds Rate movement (2000-2008)

17
Low inflation and interest rates- Explaining the Conundrum
In 2005 more than 800 million people of the world’s labour force were engaged in export oriented activities.
An increase of 500 million since the fall of the Berlin wall in 1989.
What were the implications?
This reduced world wages, inflation, inflation expectations and interest rates.
Emerging markets also ran big trade surpluses.
What were the implications?
Excess potential savings flooded global financial markets driving real interest rates lower.

The importance of emerging markets

Globalization of capital
Source: The Economist dt Oct 9, 2008

20
Rise of the Sovereign Wealth Funds
Value $m
Date
Target
Target Nationality
Acquirer
11,519 10/12/07 UBS (9%) Switzerland Government of Singapore Investment;
Undisclosed acquirer
7,500 27/11/07 Citigroup (4.9%)
US
Abu Dhabi Investment Authority, UAE
6,200 24/12/07 Merrill Lynch (Stake%) US Temasek Holdings; Domestic investors, Singapore
5,000 19/12/07 Morgan Stanley (9.9%)
US China Investment Corp, China
2,683 07/11/07 China Everbright Bank (70.92%)
China China Investment, Corp, China
2,005 13/07/07 Barclays (1.77%)
UK Temasek Holdings, Singapore
1,416 07/08/07 Standard Chartered (3.74%)
UK Temasek Holdings, Singapore
741 18/05/07 ICICI Bank Ltd (2.87%)
India Dubai International Capital, UAE
339 14/05/07 Pakistan Industrial Credit & Investment (63.38%)
Pakistan Temasek Holdings, Singapore
Top ten stake acquisitions in financial institutions, 2007

Financial innovation and the World of Derivatives
Type of Derivative
H1 2008 End 2007 H1 2001
Interest rate$464.7 trillion
$382.3 trillion
$ 57.305 trillion
Credit $54.6 trillion $62.2 trillion$ 631.497
billion
Equity $11.9 trillion $10 trillion

The Intoxicating world of Credit default swaps
23
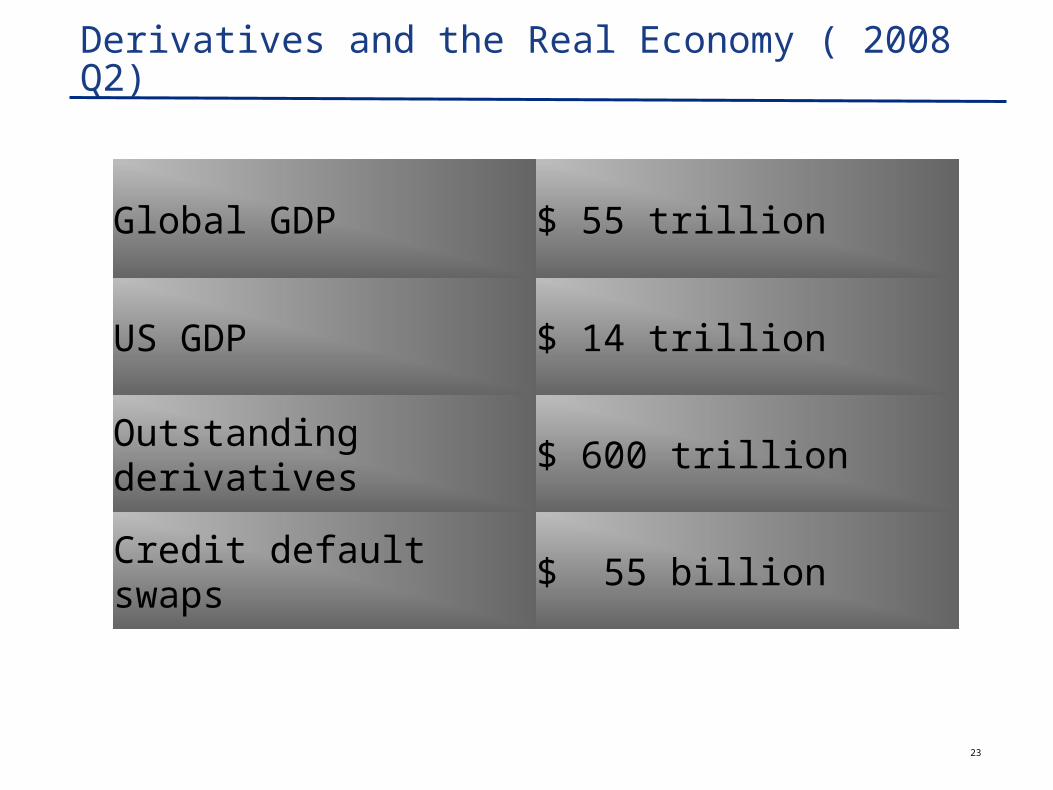
Derivatives and the Real Economy ( 2008 Q2)
Global GDP $ 55 trillion
US GDP $ 14 trillion
Outstanding derivatives
$ 600 trillion
Credit default swaps $ 55 billion

Long Term Outlook for US Government Finances

The looming debt crisis in developed countries

Government debt, % GDP across Western nations
*Forecast; † Difference between forecast primary budget balance in 2014 and primary balance needed for debt sustainability as calculated by the IMF.
Gross debt 2007
Net debt 2007
Gross debt
2014*
Fiscal adjustment required†
Australia
15.4 -6.0 16.6 1.2
Britain 46.9 30.2 87.8 5.7Canada 64.1 23.4 66.2 1.0France 70.1 34.4 89.7 4.5
Germany
65.5 44.5 91.0 1.8
Italy 113.2 87.6 129.4 4.8Japan 170.6 85.9 234.2 14.3Korea 28.9 -37.7 51.8 -0.7Spain 42.7 19.1 69.2 3.1
USA 62.9 43.0 106.7 3.5

The future of the Dollar

Long Term Inflation outlook
What does the rise in implied volatility in recent months mean ?
Ten-year Treasury bond yields have fluctuated between just over 2% and almost 4% since December.
Many countries are experiencing mild deflation.
But investors are worried about fiscal deficits and quantitative easing

Fortune Global 500 Banks - Shrinking Revenues (1)
RANK CORPORATIONS REVENUES
2008
2007
$ Millions
% change from 2007
21 20 HSBC HOLDINGS142,049.
0(3.0)
24 21 BNP PARIBAS136,096.
4(3.3)
35 58 BANCO SANTANDER117,803.
031.9
37 28 BANK OF AMERICA CORP.113,106.
0(5.1)
38 36 ROYAL BANK OF SCOTLAND113,087.
44.3
39 17 CITIGROUP112,372.
0(29.4)
43 43 SOCIETE GENERALE104,378.
30.9
49 32 J.P. MORGAN CHASE & CO.101,491.
0(12.8)
70 26 DEUTSCHE BANK 81,360.4 (33.7)

Fortune Global 500 Banks - Shrinking Revenues(2)
RANK CORPORATIONS REVENUES
2008
2007
$ Millions
% change from 2007
83 70 BARCLAYS75,135.
5(6.5)
92 133INDUSTRIAL AND COMMERCIAL BANK OF CHINA
108 62 MORGAN STANLEY62,262.
0(29.2)
113 134 BANCO BILBAO VIZCAYA ARGENTARIA61,183.
518.9
119 31 UBS59,881.
8(48.9)
125 171 CHINA CONSTRUCTION BANK57,976.
940.4
136 61 GOLDMAN SACHS GROUP53,579.
0(39.1)
141 126 WELLS FARGO51,652.
0(3.6)
164 74 CREDIT SUISSE45,296.
0(42.1)

Fortune Global 500 Banks - Shrinking Revenues(3)
RANK CORPORATIONS REVENUES
2008
2007
$ Millions
% change from 2007
171 175 ROCHE GROUP44,267.
59.8
174 282 BANCO BRASIL43,984.
253.8
211 194 ROYAL BANK OF CANADA36,615.
5(2.4
260 234 AMERICAN EXPRESS31,877.
0(1.4)
354 367 TORONTO-DOMINION BANK25,070.
29.5
363 380 STATE BANK OF INDIA24,577.
79.7
389 390 STANDARD CHARTERED GROUP23,738.
09.0
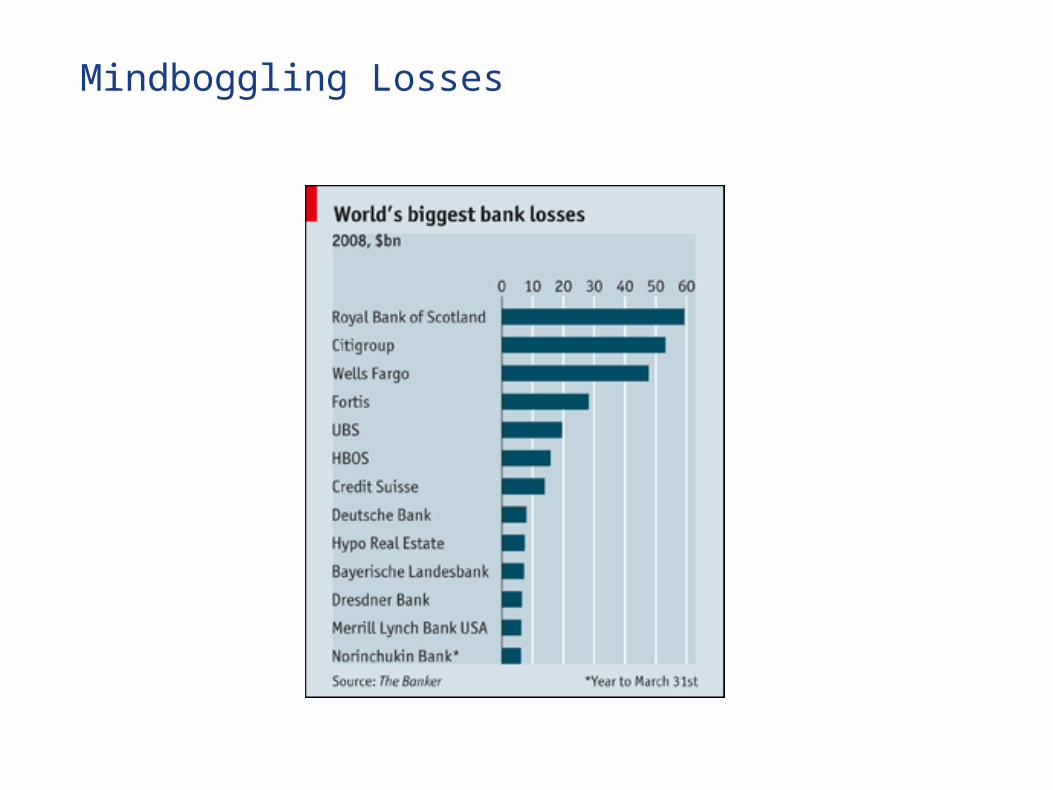
Mindboggling Losses

33
Banking industry market cap

USA
Global Banking : Average leverage ratios in 2008
12:1
Britain
France
Denmark
Switzerland
Germany
24:1
28:1
28:1
29:1
52:1
Source: Niall Ferguson, “The decent of finance,” HBR, Jul-Aug 2009.
100 years back, the leverage ratio was 4:1. In the 1970s, it was 10 – 12 : 1.
In 2006 it was Morgan- 33, Goldman-26, Merrill-32, Bear -34
35
Regulatory implications
Basle I
Basle II
Leverage ratio (Total assets / capital)
Regulation of liquidity
Macro prudential approach
New restrictions on derivatives / OTC trades
Controlling the shadow banking system
Revival of Glass Steagal Act?

36
From asset management to liability management
Quantity of capital
Duration & sources of funding
Lengthen the maturity of deposits
Dependence on more stable deposits

Tier 1 capital
Tier 1 only includes best-quality capital.
Absorbs losses, firm can continue as a going concern.
Is the core measure of a bank's financial strength.
Tier 2 capital
Includes mainly subordinated bonds.
Serves as capital buffer only in a case of bankruptcy.

39
Total assets of leading banks – 1Q09
Source: As reported by companies. Converted into USD, CHF at 1.14 and EUR at 1.32 at the end of Mar 09
1 UBS adjusted reflects PRVs based on Swiss GAAP netting (USD 153bn on 31 Mar 2009). DB adjusted represents US GAAP estimates as reported by company.
0
500
1'000
1'500
2'000
2'500
BoA JPM Citi DBadj.¹
UBSadj.¹
CS GS MS
(USD
bn)
Trading portfolio assets & PRVs Collateral trading Net loans All other assets

40
Source: As reported by companies. Converted into USD, CHF at 1.14 and EUR at 1.32 at the end of Mar 09
Net loans and allowances for loan losses – 1Q09
948
681 626
360 302209
70 31
29
2832
34
2
0
200
400
600
800
1'000
1'200
BoA JPM Citi DB UBS CS GS MS
(US
D b
n)
Net loans Allowance for loan losses

41
Risk weighted assets – end of 2008
Source: As reported by companies. Converted into USD, CHF at 1.07, EUR at 1.39 and GBP at 1.46 at the end of Dec 08
BoA, JPM and C did not disclose RWA by category (not a requirement under Basel I). At the end of 2008, MS and GS were regulated by the SEC as Consolidated Supervised Entities and disclosed capital ratios accordingly. Beginning in 1Q09, they report capital ratios in accordance with the capital adequacy standards for bank holding companies (Basel I)
Credit risk Market risk Operational risk Total RWA (Basel I)
USD bn
957 893
493346
216 152 176
7068
95
33
17726
80 37
184
1'3211'259
996
241279
400430
1'148
1'015
632
283
BoA JPM HSBC RBS Citi Barc DB GS UBS MS CS

42
Capital baseTier 1 ratios – 1Q09
14.1%
10.2% 10.1%
11.4%11.9%
13.7%2
16.7%2
10.5%
11.0%1
CS UBS DB MS GS Citi J PM BoA
Basel II Basel I
Source: Companies reporting. Updated on 15 May 2009
1 11.0% represents pro-forma Tier 1 ratio, taking into account the effects of the announced sale of UBS Pactual2 Beginning in 1Q09, MS and GS report Tier 1 ratio in accordance with the capital adequacy standards for bank holding companies

43
The emerging paradigm in Investment banking
Shift to less risky but profitable businesses.
And which need less capital
– Advisory services
– Providing trading platform
– Custody business
– Less proprietary trading

Global Merger Trends
The value of global mergers and acquisitions (M&A) fell by 35% in the first half of 2009 to $1,140 billion.
The number of deals collapsed by more than 15% in the three months to June.
Buy-outs by private-equity firms have fallen sharply by 82% to $24 billion in the six months to June.
Finance remains the centre of action , accounting for almost a fifth of deals by value, followed by health care and mining.

47
Towards Risk adjusted compensation

48
Emerging trends in Global Wealth Management
HNI lost $10 trillion (quarter of their wealth) during the crisis.
Global number of billionaires fell to 793 from 1125.
Clients highly dissatisfied with service.
Heightened client concerns because of Bernard Madoff.
Clients’ sense of financial security undermined by crisis.

49
Diminishing Trust
Move into “alternative” assets backfired for many clients.
Correlation increased, few diversification benefits.
Performance criteria for wealth managers vague.
Trust is critically important.
But trust is low today.

50
Future Outlook (Offshore banking)
There are doubts about the long term future of bank secrecy laws.
Off shore wealth is estimated at $5 - $7 trillion.
OECD has identified 40 tax havens.
49 agreements have been signed to exchange tax information since 2000.
UBS had to pay a fine of $780 million and disclose the names of 250 customers.
Germans have targeted bank accounts in Liechtenstein.
Swiss competitive advantage is under threat.

51
Future Outlook (Banking Business Models)
Standalone investment banks?
Pure retail banks?
Universal banks?

52
Future Outlook (Returns for shareholders)
Less leverage
More capital
Lower fees due to distrust of customers and government intervention
Higher barriers to entry
Overall lower return on equity

53
Conclusion : Revisiting Adam Smith
Markets as a self correcting mechanism
Smith did not advocate sufficiency of market economy
Values & institutions play a key role– Prudence
– Humanity
– Justice
– Generosity
– Public spirit
Reach & limits of market economy need to be understood carefully

54
Conclusion : Back to Keynesianism?
Human behavior is not completely rational.
Capitalism produces not only what people want but also what they think they want .
This can lead to bubbles.
Without government intervention, capitalist economies are inherently unstable.
Role of animal spirits must not be underestimated.
Recommended