THE IMPACT OF MICROFINANCE ON SMALL AND MEDIUM
ENTERPRISES GROWTH IN MOROGORO
MORIS MHIDINI MOMBA
A DISSERTATION SUBMITTED IN PARTIAL FULFILLMENT OF THE
REQUIREMENTS FOR THE DEGREE OF MASTER OF SCIENCE IN
ECONOMICS OF THE OPEN UNIVERSITY OF TANZANIA
2013
ii
CERTIFICATION
I, the undersigned, certify that I have read and hereby recommend for acceptance by
Open University of Tanzania, a dissertation entitled; The Impact of Microfinance on
Small and Medium Enterprises (SMEs) growth in Morogoro, in partial fulfillment of the
requirements for award of the degree of Master of Science in Economics of Open
University of Tanzania.
……………………………………..
Dr. Deus D. Ngaruko (PhD)
(Supervisor)
Date…………………………
.

iii
DECLARATION AND COPYRIGHT
I, Moris Mhidini Momba, do hereby declare that this Dissertation is my own work and
has not been submitted for a Degree award in any other University or Higher Learning
Institution.
Signature…………………………………………………………………
Date…………………………………………………………………………
No part of this dissertation may be reproduced, stored in any retrieval system, or
transmitted in any form by any means electronic, mechanical, photocopying, recording
or otherwise without prior written permission of the author or Open University of
Tanzania in that behalf.

iv
DEDICATION
This dissertation is honestly dedicated to my dearly loved mother Modesta Nyanzobe
Lubakiji who have been encouraging and supporting me in every step I made in my
education and my lovely wife Carolar Noracy Chuma for being good image of my
future.

v
ACKNOWLEDGEMENT
I am most grateful to God Almighty for his guidance and sustenance for the gift of all
whose encounter with me has made this life meaningful.
This study was made possible through cooperation, moral and financial support from
several individuals. First and foremost, I’m so much indebted to my dissertation
supervisor, Dr. Ngaruko, Deus (PhD) for his patience guidance, assistance, mentoring,
intellectual support and encouragement that went beyond the call of duty over the past
three months and throughout the process of writing this dissertation have been a driving
force in my success.
I also extend my sincere appreciation to my wife Carola N. Chuma, M/s Modesta N.
Lubakiji my Mother and other family members. It is my responsibility to express my
sincere gratitude to all my colleagues and friends who were willing to spare their time
and to offer their wisdom and suggestions in making this work a success. The same also
goes to the officers I interacted with at the various institutions and beneficiaries of micro
credit.
May God bless you all.
vi
ABSTRACT
This study examines the impact of the Microfinance on growth of the Small and
Medium Entrepreneurs (SMEs) in Morogoro Municipality. The specific objectives of
this study were as follows; to determine at what extent accessibility of microfinance lead
to increase the volume of gross sales of participants and to understand other factors that
enhancing SME’s growth. The study used cross-sectional research design in which 150
SMEs were used as a sample size: 75 clients from BRAC and 75 clients from FINCA.
Data were collected using questionnaires, direct observations and documentary reviews.
Descriptive statistical procedures including descriptive and frequency distributions from
the database template was used and then, running Linear Regression Model. The result
findings revealed that most of the respondents who were engaged in micro enterprises
were female. Indeed, they were also in the age of briskest and economical active
individuals of mean age 31.2 years, and the majority of them had primary level of
education. However, the statistical findings also revealed that the following null
hypothesis are statistically significant under t-test at 0.05 level of significance; There is
statistical significant on microfinance access on SMEs growth. While null hypothesis
stated that there is statistical significant relationship between SMEs growth and start-up
capital and the other which stated that there is no statistical significant that experience
on SME activities improves SME’s growth which reveals that it is not statistically
significant at t-statistic 0.05 level of significance.
vii
TABLE OF CONTENTS
CERTIFICATION ........................................................................................................... ii
DECLARATION AND COPYRIGHT .........................................................................iii
DEDICATION ................................................................................................................. iv
ACKNOWLEDGEMENT ............................................................................................... v
ABSTRACT ..................................................................................................................... vi
Contents .............................................................................. Error! Bookmark not defined.
LIST OF TABLES .......................................................................................................... xi
LIST OF FIGURES ....................................................................................................... xii
LIST OF ABBREVIATIONS AND ACRONYMS ....................................................xiii
CHAPTER ONE .............................................................................................................. 1
1.0 INTRODUCTION ...................................................................................................... 1
1.1. Overview ................................................................................................................. 1
1.2. Background of the Problem .................................................................................... 1
1.2.1. Historical Background of SME in Tanzania .................................................... 2
1.3. Problem Statement .................................................................................................. 6
1.4. Research Objectives ................................................................................................ 7
1.4.1. Overall Objective ............................................................................................. 7
1.4.2. Specific Objectives .......................................................................................... 7
1.5. Research Hypothesis ............................................................................................... 8
1.6. Significance of the Study ........................................................................................ 8
viii
1.7. Organisation of the Study ....................................................................................... 9
CHAPTER TWO ........................................................................................................... 10
2.0 LITERATURE REVIEW ....................................................................................... 10
2.1. Overview ............................................................................................................... 10
2.2. Theoretical Literature Review .............................................................................. 10
2.2.1. Conceptual Definitions .................................................................................. 10
2.3. Empirical Literature Review ................................................................................. 15
2.3.1. Role of Microfinance on SMEs Growth ........................................................ 15
2.3.2. Linkage Between Microfinance and SME ..................................................... 19
2.3.3. Microfinance Policy in Tanzania ................................................................... 21
2.3.4. Microfinance in the International Community............................................... 22
2.3.5 Tanzania Microfinance Review ...................................................................... 25
2.3.6. Microfinance and Income Generating Activities ........................................... 28
2.4 Research Gap ......................................................................................................... 29
CHAPTER THREE ....................................................................................................... 31
3.0 RESEARCH METHODOLOGY ........................................................................... 31
3.1. Overview ............................................................................................................... 31
3.2. Study Location and Rationale ............................................................................... 31
3.3. Research Design .................................................................................................... 32
ix
3.4. Sampling Techniques ............................................................................................ 32
3.4.1. Cluster Sampling Technique .......................................................................... 32
3.4.2. Data Collection Tools .................................................................................... 33
3.5. Data Processing, Analysis and Presentation ......................................................... 34
3.6 Empirical Framework of SME Growth .................................................................. 35
3.6.1 Dependent Variable......................................................................................... 35
3.6.2 Independent Variables..................................................................................... 36
3.7 Empirical Model .................................................................................................... 37
CHAPTER FOUR .......................................................................................................... 39
4.0 DATA ANALYSIS AND DISCUSSION ................................................................ 39
4.1 Overview ................................................................................................................ 39
4.2 Socio-economic and Demographic Characteristics of the Respondents ................ 39
4.2.2 Mean Age of Respondents .............................................................................. 41
4.2.3 Education Level of Respondents..................................................................... 42
4.2.4 Source of Initial Capital of the SME ............................................................... 43
4.2.5 Client’s Start-up Capital ................................................................................. 44
4.2.6 Amount of Loan Accessed .............................................................................. 45
4.2.7 Number of Years in Business ......................................................................... 46
4.2.8 The Business Type Operated by Respondents ................................................ 46
x
4.3 Model Estimation ................................................................................................... 47
4.4 Multiple Regression Analysis Results ................................................................... 49
4.4.1 To Determine at What Extent Accessibility of Microfinance Lead to Increase
the Volume of Gross Sales of Participant ................................................................ 50
4.4.2 To Examine Other Factors Enhancing SME’s Growth ................................... 51
4.5 Summary of Chapter Four ..................................................................................... 56
CHAPTER FIVE ........................................................................................................... 58
5.0 CONCLUSIONS AND RECOMMENDATIONS ................................................. 58
5.1 Overview ................................................................................................................ 58
5.2 Conclusion ............................................................................................................. 58
5.3 Policy Implications ................................................................................................ 60
5.4 Area for Further Studies ......................................................................................... 60
REFERENCES ............................................................................................................... 61
APPENDICES ................................................................................................................ 67
Appendix I: Questionnaire Respondents ..................................................................... 67
xi
LIST OF TABLES
Table 4.1 Number of Respondents Covered on the Stud.…………………………... 40
Table 4.2 Mean Age of Respondents………………………………………………... 42
Table 4.3 Mean Start-up Capital of Respondents (in Tsh)..…………………………. 44
Table 4.4 Mean Year of Respondents in SME……………….……………………… 46
Table 4.5 Correlation Matrix for Model Estimation………….……………………... 48
Table 4.6 Variables of the Research Model…………….…………………………… 50
xii
LIST OF FIGURES
Figure 4.1 Sex of Respondents………………………………………………………… 41
Figure 4.2 Respondent’s Education Level……………………....……………………... 43
Figure 4.3 Distribution for Source of Initial Capital (in Tsh)...……………………….. 44
Figure 4.4 Amount of Loan Accessed by Respondents (in Tsh)..………..……….…... 45
Figure 4.5 Distribution for Businesses Operated by Respondents….………….……... 47
xiii
LIST OF ABBREVIATIONS AND ACRONYMS
ACB Akiba Commercial Bank
ADBI Asian Development Bank Institute
BoT Bank of Tanzania
BPR Bank Perkreditan Rakyat
BRAC Building Resources Across Communities
CBO Community Based Organization
CRDB Co-operative and Rural Development Bank
DCB Dar es Salaam Community Bank
DFID Department for International Development (United
Kingdom)
FINCA Foundation for International Community Assistance
GB Grameen Bank
GDP Gross Domestic Product
IDRC International Development Research Centre
IFC International Finance Corporation
ILO International Labour Organization
IMF International Monetary Fund
LDC Least Developing Country
MDG Millennium Development Goal
MFI Micro-finance Institution
MSME Micro, Small and Medium Enterprises
xiv
NGO Non Government Organization
NMB National Microfinance Bank
ODA Official Development Assistance
OECD Organization for Economic Cooperation and Development
PTF Presidential Trust for self-Reliance Fund
REPOA Research on Poverty Alleviation
SACCOS Saving and Credit Co-operation society
SEDA Small Enterprises Development Agency
SIDO Small Industries Development Organization
SME Small and Medium Enterprise
SPSS Social Package for Statistical Science
TAMFI Tanzania Association of Microfinance Institutions
Tsh Tanzanian Shilling
UN United Nation
URT United Republic of Tanzania
WB World Bank
1
CHAPTER ONE
1.0 INTRODUCTION
1.1. Overview
This chapter gave attention to the background information to the problem, states the
statement of the problem. It also stipulates research objectives and research questions.
Finally, it provides the significance of the study. This chapter concentrates on the
introduction which is categorized into the background information to the problem,
statement of the problem, research objectives, and research questions. In the same vein,
the chapter contains significance of the study.
1.2. Background of the Problem
Small and Medium Enterprises (SMEs) all over in the world are known to play a major
role in social and economic development. This is apparently the case in Tanzania where
SMEs contribute significantly to employment creation, income generation and
stimulation of economic growth in both urban and rural areas. The SMEs nomenclature
issued to mean small and medium-sized enterprises (ILO, 1998).
SMEs cover non-farm economic mainly manufacturing, mining, commerce and
activities services. There is no universally accepted definition of SME. Different
countries use various measures of size depending on their level of development. The
commonly used yardsticks are total number of employees, total investment and sales
turnover. In the context of Tanzania, SMEs are those engaging up to 4 people with
2
capital investment from Tshs.5 million to Tshs.200 million (URT, 2002). About a third
of the Gross Domestic Product (GDP) of Tanzania originates from the SME sector.
1.2.1. Historical Background of SME in Tanzania
According to the informal Sector Survey of 1991, SMEs operating in the informal sector
alone consisted of more than 1.7 million businesses engaging about 3 million persons,
about 20% of the Tanzanian labour force. Though the data on SME sector are sketchy
and unreliable, it is reflected already in the above data that SME sector plays a crucial
role in the economy (URT, 2002). Since SMEs tend to be labour intensive, they create
employment at relatively low levels of investment per job created. At present,
unemployment is significant problem that Tanzania has to deal with. Estimates show
that there are about 700 000 new entrants into the labour forces every year. About 500
000 of these are school leavers with few marketable skills. The public sector employs
only about 40 000 of the new entrants into the labour market, leaving about 660 000 to
join the unemployed or the underemployed reserve (URT, 2002). Most of these persons
end up in the SME sector, and especially in the informal sector. Given that situation and
the fact that Tanzania is characterized by low rate of capital formation, SMEs are the
best option to address this problem. SMEs tend to be more effective in the utilization of
local resources using simple and affordable technology. SMEs play a fundamental role
in utilizing and adding value to local resources (URT, 2002).
In addition, development of SMEs facilitates distribution of economic activities within
the economy and thus fosters equitable income distribution. Furthermore, S M Es
3
technologies are easier to acquire, transfer and adopt. Also, SMEs are better positioned
to satisfy limited demands brought about by small and localized markets due to their
lower overheads and fixed costs. Moreover, SME owners tend to show greater
resilience in the face of recessions (URT, 2002). Through business linkages,
partnerships and subcontracting relationships, SMEs have great potential to complement
large industries requirements. A strong and productive industrial structure can only be
achieved where SMEs and large enterprises not only coexist but also function in a
symbiotic relationship. The SME sector in Tanzania is faced by many challenges such as
limited access to finance and lack of enterprise culture. To address these challenges, that
is where Microfinance Institutions (MFIs) come in. MFIs are the primary source of
finance to SMEs and are also contributing towards promotion of the enterprise culture
by offering various forms of training to SMEs. According to Chijoriga (2000), MFIs
help to promote enterprise culture among SMEs by providing various financial services
to SMEs. These services include; advancing loans and provision of credit management
training to SMEs and holding their deposits. These services together help to promote
enterprise culture which encompasses savings culture, investing culture and
entrepreneurial skills.
Despite of SMEs large contribution in countries development and economic growth,
their growth and development in developing countries were mainly inhibited by access
of finance, poor managerial skills, and lack of training opportunities and high cost of
inputs (Cook and Nixson, 2000). Further studies conducted suggest that finance is the
most important constraint for the SME sector (Green et al 2002). The SMEs have very
4
limited access to financial services from formal financial institutions to meet their
working and investment needs (Kessy and Temu, 2009).
However, the generation of self-employment in the SMEs requires investment in
working capital, at low levels of income, the accumulation of such capital may be
difficult. Under such circumstances, loans can help the poor to accumulate capital and
investment in employment generating activities (Hossain, 1988). According to Grade
(1984), loans enable the individual’s member or enterprises to enjoy the benefit of
economies of scale and new technology. Availability of credit to small business and low
income households could greatly enhance their economic strength and eventually break
the vicious circle of low income – low saving – low investment – low income (Yunus
1984).
In a study conducted by Rweyemamu et al. (2005) revealed that, formal financial
institutions have failed to serve the SMEs in both urban and rural communities.
Financial problem of most SMEs arise due to poor financial management; existence of
information asymmetry and bank credit rationing (Chijoriga and Cassimon, 1999).
Ogawa and Suzuki (2000) pointed out that bank do not want to offer loans to SMEs
because the nature of loans required is too small and those banks find it more expensive
to offer such loans. According to Chijoriga and Cassimon (1999), most formal
institutions regard low- income households as too poor to save, and are not personally
known to them , do not keep written accounts or business plans, they usually borrow
small and uneconomic sums.
5
Commercials banks, which were traditionally looked upon as powerful catalyst of
economic development through mobilization and the provision of credit to profitable
ventures do not offer credit to the rural poor or small business. Stringent lending policies
and collateral requirements, cumbersome procedures and their perception of small
business and the rural poor as risky, often leads to exclusion. Most formal financial
institutions regard low income households as too poor to save, and are not personally
known to them, they do not keep written accounts or business plans, they usually borrow
small sums, while administration and carrying costs are almost as high as for large loans
(Kuzilwa and Mushi, 1997).
According to Wangwe and Semboja (1997), SMEs in Tanzania contribute 12% and 34%
of rural and urban employment respectively as well as up to 32% of the country GDP.
Therefore the Government of Tanzania in recognizing the contribution of SMEs in
country economy developed the National Microfinance Policy which aims at enabling
low-income earners to access financial services (URT, 2000). Microfinance institutions
(MFI’s) provide a broad range of services including deposits, loans, payment services,
money transfer and insurance to the poor/low-income households and their enterprises
(Chijoriga, 2000).
The introduction of MFI’s in Tanzania is seen as the best alternative source of financial
services for low income earners and their SMEs as a means to raise their income, hence
reducing their poverty level and contributing in country economy (Kessy and Urio,
2006). Along this line the service of microfinance institution to majority of Tanzanians
6
who are low income earners have given them a number of possibilities including
managing scarce household and enterprises resources more efficiently, protection
against financial risks by taking advantages of investment opportunities and gaining
economic returns (Chijoriga, 2000). Micro finance enables clients to protect, diversify
and increase their incomes, as well as to accumulate assets, reducing their vulnerability
to income and consumption shocks (Robinson, 2002).
1.3. Problem Statement
Microfinance Institutions (MFIs) are set up to provide funding for the enterprising poor.
Through cycles of loans and repayments it is expected that the SMEs are increasingly
empowered and to grow. According to Mosley (2001), MFI are said to be a cheaper way
of source of finance to SMEs. Despite of MFI service been cheaper way of source of
finance to SMEs, very little is known on the actual cost for microfinance clients to
access these services, except interest rates. The interest rate is not the only cost of credit
incurred by SMEs, there are also other costs related to the process of obtaining
information about the services and the whole process of applying for the loan, cost of
getting transportation to make loan payments, time spent obtaining loan and tracking the
debt all these are referred as transaction costs.
This study therefore seeks to investigate the impact of microfinance service on the
growth of SMEs in Tanzania and to investigate the benefit received from microfinance
loans if they outweigh the cost incurred by SME’s when servicing the loan liability, and
the contribution of MFI in Tanzania on improvement of household welfare of SME’s.
7
Also there is no study that have been conducted in Tanzania which look on the cost and
benefit of MFI loans to SMEs and weather the MFI loan have helped the SMEs to grow
despite of the true cost incurred on the process, as a result industry never know if MFI
loans have truly helped SMEs to grow.
Although people have received micro-loan, information documented in Robert (2009)
indicates that most of SMEs whose secured loans have not yet managed to improve their
enterprise’s status. More specifically, the impact of micro-financing on SMEs growth
through the efforts made by the several microfinance institutions for residents of
Morogoro Municipality is still undetermined. Along with this, there is no statistical
information attesting the extent to which micro-loan has been helpful to beneficiaries
(Neeta and Diwan, 2010).
According to Sebstad et al, (1995) there is different range of indicators of growth of
SMEs. This study will use volume of gross sales, income of the SMEs, and size of
business production, business profit, and number of employee in the business and
revenue as indicator of growth for the enterprises.
1.4. Research Objectives
1.4.1. Overall Objective
The overall objective of this study was to analyse the contribution of microfinance on
the SME growth in Morogoro Municipality.
1.4.2. Specific Objectives
8
To achieve the overall objective the study pursued the following specific objectives:
i. To determine at what extent accessibility of microfinance lead to increase the
volume of gross sales of a participant.
ii. To examine other factors enhancing SME growth.
1.5. Research Hypothesis
In order to meet the above objectives and get answers to the subject matter under
investigation, this study will base on the following research hypothesis:
i. H0: There is no statistical significant relationship between microfinance access
and SMEs growth.
ii. H0: There is no statistical significant relationship between SMEs growth and
start-up capital.
iii. H0: There is no statistical significant that experience on SME activities improves
SME’s growth.
1.6. Significance of the Study
First, this study was intended to shed light on the relationship between microfinance
services and growth of SME particularly with the focus on their livelihoods for both
planners and policy makers in government, agencies and NGOs. This will help them to
come out with substantive possible alternative policy interventions which might help to
address problems and challenges which small and medium enterprises face. Second, this
9
study will offer empirical evidence on the impact of microfinance services on the growth
of small and medium enterprises for use in short term and long term interventions
especially in the fight against poverty. A study of this nature is equally very important
because it is going to enlighten the government and the public on the role of MFI in the
SMEs sector. Finally, the study will facilitate the researcher to be awarded of a Master’s
of Science Degree in Economics in Open University of Tanzania.
1.7. Organisation of the Study
This study is organised into five chapters. Chapter one provides information on the
background, statement, the general and specific objectives, the research questions, and
the significance of the study, limitation as well as delimitation and the organisation of
the study. Chapter two concentrates on issues related to micro finance institutions. The
chapter continues to present the theoretical and empirical literature review.
Additionally, the chapter three presents the description of the study area, research
design, sample size and sampling procedures, data collection methods and tools. The
chapter finally discloses data processing and analysis and conclusion. Chapter four
presents an analysis and discussion of the research findings of the study. In this context
the chapter analyzed data with reference to the research objectives, questions and
hypothesis. Lastly is chapter five, this chapter describes conclusions and
recommendations of the study with reference to the designed research objectives and
analysis made. The conclusions that have been made hereunder are based on the
research findings obtained from the field data.
10
CHAPTER TWO
2.0 LITERATURE REVIEW
2.1. Overview
This chapter presents the review of related literature that has been summarized from
different readings on the topic under study. It forms the literature of the study in two
major parts; namely: theoretical literature which focuses on: Definitions of key concepts
(microfinance and SME), relationship between microfinance and SMEs growth and the
empirical literature review that focuses on giving a review of relevant literature on the
following sub-sections: Role of microfinance in SME growth, Linkage between
Microfinance and SME, Micro-finance Policy in Tanzania, Review of studies done
outside of Tanzania.
2.2. Theoretical Literature Review
2.2.1. Conceptual Definitions
2.2.1.1. Micro-finance
Microfinance refers to financial services provided to low-income people, usually to
help support self-employment. Examples include: small loans, savings plans, insurance,
payment transfers, and other services that are provided in small increments that low-
income individuals can afford. These services help families to start and build “micro”
enterprises, the very small businesses that are important sources of employment, income,
and economic vitality in developing countries. As to REPOA (2006) Micro-finance
does not only cover financial services but also non-financial assistance such as training
and business advice.
11
According to MIFOS (2005) micro-finance is sometimes called “banking for the poor.”
It is an amazingly simple, proven idea that empowers very poor people around the world
to pull themselves out of poverty. Relying on their traditional skills and entrepreneurial
instincts, very poor people, mostly women, obtain small-unsecured loans, usually less
than $200, from local organizations called micro-finance institutions (MFIs).
Micro finance can be a critical element on effective poverty reduction strategy.
Improved access and efficient provision of savings, credits and insurance facilities in
particular can enable the poor to smooth their consumption, manage risk better; built
assets gradually develop micro enterprises, enhance their income earning capacity and
enjoy improved quality life (Rubambey, 2001). The main features of a microfinance
institution which differentiate it from other commercial institutions, are such that, it is a
substitute for formal credit; generally requires no collateral; have simple procedures and
less documentation; easy and flexible repayment schemes; financial assistance of
members of group in case of emergency; most deprived segments of population are
efficiently targeted; and, last but not least, is groups interaction.
2.2.1.2. Small and Medium Enterprises
The SME nomenclature is used to mean Small and Medium Enterprises. It is sometimes
referred to as micro, small and medium enterprises (MSMEs). The SMEs cover non-
farm economic activities mainly manufacturing, mining, commerce and services (URT,
2003). According to Kessy and Urio (2006), SMEs can be defined as a productive
activity either to produce or distribute goods and or services, mostly undertaken in the
12
informal sector The Tanzanian government defines SMEs according to sector,
employment size, and capital investment in machinery. A micro-enterprise is one with
fewer than five employees, a small enterprise with 5-49 employees, a medium enterprise
with 50-99 employees and a large enterprise with more than 100 employees. Capital
investments range from less than Tshs 5 million to over Tshs 800 million. This
definition would exclude a number of informal economy enterprises, peasant farmers,
and Tanzanians engaged in lower-level income-generating activities (URT, 2003).
2.2.1.3 Contribution of SMEs to the Economy
SMEs all over the world are known to play a major role in socio-economic development.
URT (2003) estimates that about of the GDP originates from SME sector; they tend
to be labor intensive thus creating jobs: the International Finance Company (IFC) of the
World Bank estimates that there are approximately 2.7 million enterprises in the
country. A large majority of these (98%) are micro enterprises (employing less than 5
people), effective in the utilization of local resources using simple and affordable
technology; and complementing large industrial requirements through business linkages,
partnerships and subcontracting relationships (Olomi, 2001; URT, 2003).
2.2.1.4 Microfinance Market in Tanzania
Demand: It is estimated that there are close to 8 million small and micro entrepreneurs
who need financial services and the number is growing by 4% annually, the majority of
whom are found in the rural areas. The SMEs are involved in a wide range of businesses

13
including trading, small 8 scale manufacturing, agriculture (crop farming and animal
husbandry) and services (food vending, transport, barber shops etc).
Supply: Microfinance institutions operating in Tanzania provide financial services to the
SMEs mainly in the form of micro credit with an exception of cooperative based
microfinance institutions, which are predominantly savings based. The credit based
institutions number between 80 and 100 out of which 42 are registered members of the
Tanzania Association of Microfinance Institutions (TAMFI), the local microfinance
network. The main microfinance institutions can be categorized as Non Governmental
Organizations (NGOs), Cooperative based institutions namely SACCOs and SACCAs
while the third category is banks. The major players in the NGOs category include
PRIDE Tanzania, FINCA (Tanzania), Small Enterprise Development Agency (SEDA)
and Presidential Trust for Self-Reliance (PTF). Others, which are relatively smaller in
size, include Small Industries Development Organization (SIDO) and BRAC (Tanzania).
There rest consists of very tiny programmes scattered throughout the country mainly in
the form of community based organizations (CBOs). Banks that are actively involved in
microfinance services delivery include the National Microfinance Bank (NMB), CRDB
bank, Akiba Commercial Bank (ACB) and a few Community/regional banks namely,
Dar es Salaam Community Bank, Kilimanjaro Cooperative Bank and Mkombozi Bank.
Urban versus Rural Distribution: The distribution with respect to the concentration of
microfinance activities in Tanzania is skewed in favor of the urban areas leaving rural
areas grossly under served. Most MFIs with an exception of tiny rural based SACCOs
14
are reluctant to extend their services to the rural areas due to poor infrastructure, high
risk and high cost of operation. The latter is brought about by the fact that rural areas in
Tanzania by nature are sparsely populated.
2.2.1.5 Development in the Theory of SME
The last 50 years have witnessed important developments in the conceptualisation of the
main issues relating to the SME sector and subsequent theoretical work. The main
theory, which goes back to the seminal work by Lewis (1955), is the labour surplus
theory. It is argued that the driving force behind SME development is excess labour
supply, which cannot be absorbed in the public sector or large private enterprises and is
forced into SMEs in spite of poor pay and low productivity. Arguably, the SME sector
develops in response to the growth in unemployment, functioning as a place of last
resort for people who are unable to find employment in the formal sector.
Various theoretical models have been developed which describe the growth of SMEs.
One class of theoretical models focuses on the learning process, either active or passive,
and the other models refer to the stochastic and deterministic approaches.
2.2.1.5.1 Passive Learning Model
In the Passive Learning Model (PLM) (Jovanic 1982 cited in Agaje 2004), a firm enters
a market without knowing its own potential growth. Only after entry does the firm start
to learn about the distribution of its own profitability based on information from realized
profits. By continually updating such learning, the firm decides to expand, contract, or to
exit. This learning model states that firms and managers of firms learn about their
15
efficiency once they are established in the industry. Firms expand their activities when
managers observe that their estimation of managerial efficiency has understated actual
levels of efficiency. As firm ages, the owner’s estimation of efficiency becomes more
accurate, decreasing the probability that the output will widely differ from one year to
another. The implication of this theoretical model is that smaller and younger firms
should have higher and more viable growth rates (Stranova, 2001, Cunningham and
Maloney 2001 and Goedhuys, 2002).
2.2.1.5.2 Stochastic and Deterministic Approaches
The other set of growth theories of firms include the Stochastic and Deterministic
Approaches The stochastic model, which is also known as the Gibrat's Law, argues that
all changes in size are due to chance. Thus, the size and age of firms has no effect on the
growth of SMEs. According to Becchetti and Trovato (2002) empirical of the law has
indicated that it only considers size and age as potential variables which may
significantly affect firm growth by neglecting other explanatory variables which may
significantly affect firm growth. The deterministic approach assumes, on the contrary,
that differences in the rates of growth across firms depend on a set of observable
industry and firm specific characteristics (Becchetti and Trovato, 2002 and Pier
Giovanni et al 2002).
2.3. Empirical Literature Review
2.3.1. Role of Microfinance on SMEs Growth
16
Since the World Summit for Social Development the priority given to poverty
eradication has grown. As stated in the previous report of the Secretary-General on the
eradication of poverty, it is now broadly accepted that robust economic growth that is
labour-intensive and equitable, combined with larger outlays of social expenditures,
especially directed towards the poor (now estimated at 1.3 billion people), are a winning
combination in the fight against poverty (Chaliand, 2003). Several factors have led to
increased interest in micro-credit in promoting growth with greater equity. There has
been a growth in the recognition of the importance of empowering all people by
increasing their access to all the factors of production, including credit. In addition, the
value of the role of Non-Governmental Organizations in development is receiving more
attention.
It is in that context that micro credit has recently assumed a certain degree of
prominence. It is based on the recognition that the latent capacity of the poor for
entrepreneurship would be encouraged with the availability of small-scale loans and
would introduce them to the small-enterprise sector. This could allow them to be more
self-reliant, create employment opportunities, and, not least, engage women in
economically productive activities. Currently, there are estimated to be about 3000
microfinance institutions in developing countries like in Kenya, Malawi, Nigeria, to
mention just a few. These institutions also help create deeper and more widespread.
They provide the rural population with access to savings within the local area and with a
certain cushion against economic fluctuations, and they encourage a cooperative and
community feeling (Department of Social Development, 2001). The groups formed
17
provide joint collateral and serve as instruments for spreading valuable information that
is useful for economic and social progress.
In many developing countries, many loan takers have been proven to have much benefit
as they get credits. Studies undertaken by Chaliand (2003) and Chijoriga (2000) on the
impact of micro-credit programmes on household income show that participants of such
programmes usually have higher and more stable incomes than they did before they
joined the programmes. Some practitioners still have reservations about the findings of
those studies. Moreover, not many micro credit programmes can afford to undertake
impact assessments because they are generally expensive and time-consuming. There
are serious disagreements among experts on the validity methodologies used in some of
the published studies. In some cases, even the more rigorous studies have produced
inconclusive results (Chaliand, 2003).
Chijoriga (2000) revealed that there are limits to the use of credit as an instrument for
poverty eradication, including difficulties in identifying the poor and targeting credit to
reach the poorest of the poor. Added to this is the fact that many people, especially the
poorest of the poor, are usually not in a position to undertake an economic activity,
partly because they lack business skills and even the motivation for business.
Furthermore, it is not clear if the extent to which micro credit has spread, or can
potentially spread, can make a major dent in global poverty. The actual use of this kind
of lending, so far at least, is rather modest: the overall portfolio of the World Bank, for
example, is only $218 million. In recent international meetings, it has been stated that a
18
target to reach 100 million families by the year 2005 would require an additional annual
outlay of about $2.5 billion. This should be compared to the total Gross Domestic
Product (GDP) of all developing countries, which is now about $6 trillion. A certain
sense of proportion regarding micro credit would seem to be in order.
In addition, the administrative structures governing these institutions are commonly
either fragile or rudimentary, and often involve large transaction costs. A study by the
Organization for Economic Cooperation and Development (OECD), for example, found
that many specialized agricultural institutions were not designed to serve as financial
intermediaries. The success of financial intermediation at any time depends
significantly on how efficiently the transaction is completed. If the transaction costs,
combined with high interest rates, require that the operation in question generate profit
margins of the order of 30% to 50%, it is not clear that this would be economically
beneficial (Chijoriga, 2000). It is not surprising that in many micro lending operations,
trading activity – with quick turnover and large profit margins – dominates.
In many cases, micro-credit programmes have been stand-alone operations. There is
now considerable consensus that lending to the poor can succeed provided it is
accompanied by other services, especially training, information and access to land.
According to the World Bank (2000) cited in Asian Development Bank Institute (2010)
credit needs to be supplemented with access to land and appropriate technology. But
such activities require strong support from the public sector. In some of the lowest-
income countries, lack of access to land is the most critical single cause of rural poverty,
19
which dominates the poverty situation in those countries. Yet, few countries have
substantial land reform programmes.
Moreover, in the proliferation of micro lending institutions, Non-Governmental
Organizations and foreign donors have played an increasing role. Non-Governmental
Organizations vary in quality and strength. The best results are produced, research
shows, when developing country Governments and Non-Governmental Organizations
work hand in hand. While donor participation can be positive, it should be noted that
total Official Development Assistance (ODA) has declined in recent years.
2.3.2. Linkage Between Microfinance and SME
Several objectives so conceived by the government of Tanzania influenced the initiation
of The IMFs schemes, among them, the most commonly mentioned ones include:
poverty alleviation and improved living standards, offering financing to the poor Harper
et al (1999), women’s empowerment Rahmn (1999), and the development of the
business sector as a means of achieving high standards and reducing market failure
(Chijoriga and Cassimon, 1999).
Microfinance and its impact go beyond just business loans. The poor use financial
services not only for business investment in the microenterprises but also to invest in
health and education, to manage household emergencies and to meet the variety of other
cash needs that they encounter.
20
In terms of understanding poverty Chaliand (2003) maintains that a simple distinction
can be drawn within the group ‘the poor’ between the long-term or ‘chronic poor’ and
those who temporarily fall into poverty as a result of adverse shocks, the ‘transitory
poor’. Within the chronic poor one can further distinguish between those who are either
so physically or socially disadvantaged that without welfare support they will always
remain in poverty (the ‘destitute’) and the larger group who are poor because of their
lack of assets and opportunities. Furthermore within the non-destitute category one may
distinguish by the depth of poverty (how far households are below the poverty line) with
those significantly below it representing the ‘core poor’, who are sometimes categorized
by the irregularity of their income (Chaliand, 2003).
In principle, micro finance can relate to the chronic (non-destitute) poor and to the
transitory poor in different ways. According to WB (2000) cited in Asian Development
Bank Institute (2010) the condition of poverty has been interpreted conventionally as a
lack of access by poor households to the assets necessary for a higher standard of
income or welfare, whether assets are thought of as human (access to education), natural
(access to land), physical (access to infrastructure), social (access to networks of
obligations) or financial (access to credit).
Lack of access to credit is readily understandable in terms of the absence of collateral
that the poor can offer conventional financial institutions, in addition to the various
complexities and high costs involved in dealing with large numbers of small, often
illiterate borrowers (Chestnut, 2010). The poor thus have to rely on loans from either
21
moneylenders, at high interest rates, or friends and family, whose supply of funds will be
limited. Microfinance institutions attempt to overcome these barriers through innovative
measures such as group lending and regular savings schemes, as well as the
establishment of close links between poor clients and staff of the institutions concerned.
Microfinance has consistently proven to be one of the most effective strategies in the
Growth of SME in developing countries. Today, microfinance institutions around the
world reach a little more than 100 million people (Asian Development Bank Institute,
2010). Thus most citizens earn their livings through self-employment, creating
and operating their own tiny enterprises. Without financial services to fuel their
productivity, the poor can never grow their micro enterprises into businesses that help
them escape poverty.
Therefore by providing very poor families with small loans to invest in their micro
enterprises, they become able to rescue themselves from poverty. They use these loans
to start, establish, sustain, or expand very small, self-sustaining businesses (Begu, et al
2000). For example, a woman may borrow 150 000 Tsh ($100) to buy chickens, so she
can sell eggs. As the chickens multiply, she will have more eggs to sell. Soon she can
sell the chicks.
2.3.3. Microfinance Policy in Tanzania
Microfinance in Tanzania is one of the approaches that the Government has focused its
attention in recent years in pursuit of its long term vision of providing sustainable
financial services to majority of Tanzania population especially the most disadvantaged
22
groups such as the rural population, the disabled and the women (Rubambey, 2000). The
government’s choice of microfinance was influenced by the conviction that given
adequate attention, microfinance has the potential to contribute considerably to the
economic development.
2.3.4. Microfinance in the International Community
Studies on MFIs have been conducted in various countries all over the world. The
findings from these studies are useful to new researches on microfinance. Some of the
studies, which had a significant contribution, include the study by (Mosley, 2001). In
his study on Microfinance and Poverty in Bolivia, Mosley assessed the impact of
microfinance on poverty. The study was conducted through small sample surveys of
four microfinance institutions, two urban and two rural, using a range of poverty
concepts such as income, asset holdings and diversity, and various measures of
vulnerability.
All the institutions studied had on balance, positive impacts on income and asset levels,
with income impacts correlating negatively with income on account of poor households
choosing to invest in low-risk and low-return assets. Mosley’s study revealed also that
in comparison with other anti-poverty measures, microfinance appears to be successful
and relatively cheap at reducing the poverty of those close to the poverty line. However
this was also revealed to be ineffective, by comparison with labour-market and
infrastructural measures, in reducing extreme poverty. The study by Mosley (2001)
further proposed actions that appear to be promising for the further reduction of poverty
23
in Bolivia which can also be useful for other developing countries. These actions
include stronger efforts to mobilize rural savings, removal of lower limits on loan size,
and the introduction of appropriate insurance mechanisms.
Hassan and Renteria-Guerrero (1997) made another empirical contribution in this area.
In their work “The experience of the Grameen Bank (GB) of Bangladesh in community
development”, they examined the GB experience with a purpose of understanding the
essential elements of its operations and the factors that enabled GB to reach the poor.
This study revealed that the GB has established its credentials as an institution that aims
at providing credit to the landless and asset less poor in rural areas. However, it was
observed the credit by itself is an insufficient factor to improve poverty conditions, and
thus the GB devotes a substantial amount of resources to the improvement of the social
wellbeing of its members.
Amin et al (2003) used a unique panel dataset from northern Bangladesh with monthly
consumption and income data for 229 households before they received loans. They find
that while microcredit is successful in reaching the poor, it is less successful in reaching
the vulnerable, especially the group most prone to destitution (the vulnerable poor).
Coleman (1999) also finds little evidence of an impact on the programme participants.
The results, Coleman further explains, are consistent with Adams and von Pischke’s
assertion that “debt is not an effective tool for helping most poor people enhance their
economic condition” and that the poor are poor because of reasons other than lack of
access to credit.
24
According to Mosley (1999), microfinance makes a considerable contribution to the
reduction of poverty through its impact on income and also has a positive impact on
asset level. But the mechanism through which poverty reduction works varies between
institutions. Generally, institutions that give, on average, smaller loans reduce poverty
much more by lifting borrowers above the poverty line, whilst institutions giving larger
loans reduce it much more by expanding the demand for labour amongst poor people.
Mosley and Hulme (1998) found evidence of a trade-off between reaching the very poor
and having substantial impact on household income. They found that programmes that
targeted higher-income households (those near the poverty level) had a greater impact
on household income. Those below the poverty line were not helped much and the very
poorest were somewhat negatively affected. The poorest tended to be more averse to
risk-taking. They also used their loans for working capital or to maintain consumption
levels rather than for fixed capital or improved technology. Since, microcredit
programmes typically require loan repayment on a weekly basis; some critics argue that
repayment comes from selling assets rather than from profits of micro-enterprises.
Fatchamps (1997) noted that with insufficient funds, farmers and fishers cannot invest in
new equipment and machinery, and it becomes difficult to reach out to new markets and
products. He further contends that without financial assistance, small farmers and
artisanal fishermen cannot cope with temporary cash flow problems, and are thus slowed
down in their desire to innovate and expand. The general perception is that access to
25
external finance is critical for poor entrepreneurs, who may never have funds
proportional to their ambitions.
Pitt and Khandker (1998) reasoned that given the small loan size and the type of
activities undertaken by micro-entrepreneurs, it is unlikely that capital intensity has
increased. Given that the labour and the capital intensity of rural non-farm production
are unchanged, increased microfinance implies that employment can be expected to rise.
However, if increased income as a result of microfinance programmes results in a
decrease in labour supply (income effect), it can negatively affect labour supply of
particular type, for example male labour supply. As a result employment may decline,
given the demand for labour. Therefore, the net impact cannot be determined a priori.
Microcredit programmes seem to reduce wage-employment and income, but raise self-
employment and corresponding income for programme- participating households. One
might expect that a reduction of employment in the wage market might increase wages,
but this may not happen because the wage-employment gap may be filled by previously
unemployed or underemployed wage workers.
2.3.5 Tanzania Microfinance Review
In Tanzania several studies has been done on microfinance institutions service, one of
the researcher who have done research on MFI service is Kuzilwa and Mushi (1997)
examined the role of credit in generating entrepreneurial activities. He used qualitative
case studies with a sample survey of business that gained access to credit from a
Tanzanian government financial source. The findings reveal that the output of
26
enterprises increased following the access to the credit. It was further observed that
those enterprises, whose owners received business training and advice, performed better
than those who did not receive training. He recommended that an environment should be
created where informal and quasi-informal financial institutions can continue to be
easily accessed by micro and small businesses.
Chijoriga (2000) evaluated the performance and financial sustainability of MFIs in
Tanzania, in terms of the overall institutional and organizational strength, client
outreach, and operational and financial performance 28 MFIs and 194 MSEs were
randomly selected and visited in Dar es Salaam, Arusha, Morogoro, Mbeya and
Zanzibar regions. The findings of this revealed that, the overall performance of MFIs in
Tanzania is poor and only few of them have clear objectives, or a strong organizational
structure. It was further observed that MFIs in Tanzania lack participatory ownership
and many is donor driven. Although client outreach is increasing, with branches opening
in almost all regions of the Tanzanian mainland, still MFIs activities remain in and
around urban areas. Their operational performance demonstrates low loan repayment
rates. In conclusion, the author pointed to low population density, poor infrastructures
and low house hold income levels as constraints to the MFIs’ performance.
Another study on microfinance in Tanzania were carried out by Rweyemanu et al
(2003), he evaluated the performance and constrains facing semi-formal microfinance
institutions in providing credit in Mbeya and Mwanza regions. The primary data were
collected through a formal survey of 222 farmers participating in the Agriculture
27
Development Programme in Mbozi and the Mwanza Women Development Association
in Ukerewe .In the analysis of their study the interest rates were found to be a significant
barrier to the borrowing decision. Also the borrowers cited other problems like lengthy
credit procurement procedures and the amount disbursed being inadequate. On the side
of institutions, Mbeya and Mwanza credit programme experienced poor repayment rates,
especially in the early years of operation, with farmers citing poor crop yields, low
producer prices and untimely acquisition of loans as reasons for non-repayment.
In a study conducted by Kessy and Urio (2006) on contribution of MFI on poverty
reduction in Tanzania, the researchers covered four regions of Tanzania which are Dar
es Salaam, Zanzibar, Arusha and Mwanza. Both primary and secondary data were
collected; primary data were collected from 352 MSE’s through questionnaires,
interviews were also conducted. PRIDE (T) Ltd which is a microfinance institutions
were used as a case study so as to get the insight of MFI operations. The study findings
pointed out that to large extent MFI operations in Tanzania has brought positive changes
in the standard of living of people who access their services, clients of MFI complained
about high interest rate charged, the weekly meeting was pointed out as barrier as the
time spent in weekly meeting could be used to other productive activities. The study
recommended MFI to lower its interest rate, increase grace period and provide proper
training to SMEs.
Kuzilwa (2002) conducted a study to examine the role of credit in generating
entrepreneurial activities. He used qualitative case studies with a sample survey of
28
businesses that gained access to credit from a Tanzanian government financial source.
The findings revealed that the output of enterprises increased following the access to the
credit. It was further observed that the enterprises whose owners received business
training and advice, performed better than those who did not receive training. He
recommended that an environment should be created where informal and quasi-informal
financial institutions can continue to be easily accessed by micro and small businesses.
2.3.6. Microfinance and Income Generating Activities
Microfinance has been a key instrument in improving social status of the micro-credit
members especially in developing countries. This can be seen in different domains such
as running small business like “Mama Lishe”, Retails shops, Grocery etc.
According to Chestnut (2010) borrowers use the loans to start businesses such as buying
goods wholesale to sell in markets, making and selling crafts, farming and other similar
activities. The profits they earn allow them to repay the loan, make a living, and
generally improve their living conditions and the conditions of the community. As
borrowers build credit, they qualify for larger loans. Most loans are made without
collateral. However, to establish creditability with microfinance institutions, borrowers
often form groups whose members guarantee one another’s loan payments.
As microfinance focuses on providing poor people with access to credit so they can
engage in income generating activities, there is cash flow which is used to increase
assets, including permanent houses or savings accounts, offering recourse during hard
times, and consumption, especially in food, nutrition, and education (Ohri 2004).
29
Sam (2002) in Vincent (2005) maintains that loans in less developed countries are made
for a variety of purposes. Loans are made for housing and for “start up” loans so
farmers can buy inputs to agricultural production: rice seeds, fertilizers and agricultural
tools. But loans are also used for a variety of non-crop activities such as: dairy cow
raising, cattle fattening, poultry farming, weaving, basket making, leasing farm and
other capital machinery and woodworking. Of course, funds may be used for a number
of other activities, such as crop and animal trading, cloth trading and pottery
manufacture. Credit is also issued to groups consisting of a number of borrowers for
collective enterprises, such as: irrigation pumps, building sanitary latrines, power looms,
leasing markets or leasing land for cooperative farming.
The potential for loan uses are virtually endless, and differ between villages and
countries. However, due to the fact that there is no such thing as a ‘typical’ developing
country, loans provide a source of income for diverse activities chosen specifically by
the borrower, to create their own life. Borrowers themselves make decisions on the uses
of the benefits of the loans they get. The uses consist of solving their household
problems such as children’s education, health and nutrition. Christopher (2002) in Ohri
(2004) noted that loans obtained from microfinance institutions play an instrumental role
in bringing health services to their clients.
2.4 Research Gap
However, many studies on impact of microfinance on the SME’s growth have been
conducted in other parts of the world especially in Southeast Asia such as Malaysia,
30
Bangladesh as well as Africa in the countries like Nigeria, Ghana, Cameroon, Kenya etc.
But rare studies have been conducted in the country to verify positive impact brought by
micro-loan accessibility to SME practitioners. This situation may be associated with
strangest of the sector in Tanzania. This study is in the right time to assess the impact of
small loans on the improvement of Small and Medium Enterprises. Conventionally,
economic indicators have been widely utilized in assessing the impact of micro finance
where analyzers are particularly interested in measuring changes in income, sales,
expenditure, consumption and assets.
An increase in net enterprise income of 93% was observed for borrowers of Indonesia's
Bank of Rakyat was conducted to see the impact of the banks micro financing scheme
(Fildler and Webster, 1996). In general, most impact assessment studies show
improvements in quality of life and the positive impact of micro finances in poverty
alleviation. However, even the famous Bank (the Grameen Bank) is currently facing an
increase in the number of dropouts that affect its contribution to poverty reduction and
the viability of the program and its borrowers in the future (Karim and Osada, 1998).
Furthermore, empirical literatures on impact analysis of micro credit in Tanzania
remained to be scanty. One of these few literatures is the study done by Selejio (2002)
who studied the impact of micro credit in Tanzania. The study revealed that micro credit
has high possibility of increasing the borrower’s income and maintaining the living
standards. Thus, it can turn back the future dream of the marginalized group of people
who are seeking to be alleviated from poverty.
31
CHAPTER THREE
3.0 RESEARCH METHODOLOGY
3.1. Overview
The arrangement of this Chapter gives various steps consisting of methods and
techniques that will be adopted by the researcher in studying the research problem along
with the logic behind them. Basically, the chapter discusses and presents the Research
design, Description of the study area and population, Sampling frame, Sample size,
Sampling techniques, Types and sources of data, Data collection methods, and Data
presentation and analysis.
3.2. Study Location and Rationale
The study was conducted in Morogoro Municipality. It is one of the six administrative
Districts in Morogoro region. The other districts are Morogoro rural, Kilosa, Mvomero,
Kilombero and Ulanga. The Municipality is sub divided into 19 wards and 275 streets
(URT, 2002). It was selected through simple random sampling. Also, it was selected
from stand point that the area had considerably numbers of Microfinance Institutions
such as FINCA, BRAC, PRIDE, SEDA, NMB, CRDB etc. It is the Regional
Headquarter of Morogoro and it is about 195 kilometres to the west of Dar es Salaam.
Morogoro region lies between latitudes 5o 58” and 0” South of the equator and between
longitudes 35o 25” and 38
o 30” East of the Greenwich. Morogoro Municipality had a
population of 294 467 of which 147 547 and 146 920 are male and women respectively
(Morogoro Municipality report, 2009).
32
3.3. Research Design
According to Kothari (2004) a research design is “the arrangement of conditions for
collection and analysis of data in a manner that aims to combine relevance to the
research purpose with economy in procedure”. It is the conceptual structure within
which research is conducted; it constitutes the blue print for collection, measurement and
analysis of data. The function of a research design is to provide a plan of how important
data can be amassed with smallest expenditure of time, efforts and money. The research
design as a structure of an enquiry of data; therefore, this study used a cross-sectional
design because it allows data and results to be obtained speedier. According to Babbie
(1990); Bailey (1994), a cross sectional design allows data to be collected roughly at a
single point in time without repetition from the representative population. The design
was chosen because of economical point.
3.4. Sampling Techniques
3.4.1. Cluster Sampling Technique
Cluster sampling technique involves the selection of an entire group from a list of
groups (Adam and Kamuzora, 2008). The total population is divided into a number of
relatively small subdivisions which themselves are clusters of small units. Some of
these clusters are then randomly selected for inclusion in the overall sample. In this
case, the researcher selected clusters/groups of respondents as sampling frame.
The researcher selected respondents from their clusters/groups receiving financial
services from these micro credit programs. Under this sampling technique, one hundred
33
and fifty (150) respondents were selected from their groups to constitute the sample.
This technique was very helpful in the sense that it helped to save time for data
collection because the researcher tend to contact them in groups.
3.4.2. Data Collection Tools
In order to collect the data needed, the researcher used questionnaire, and interview for
collecting primary data and documentary method for collecting secondary data. This
study was involving the application of quantitative approach.
3.4.2.1. Questionnaire
The researcher used this method to collect primary data from respondents. They were at
first pre-tested by a small number of respondents and then after they distributed to
clients of these micro-credit programs for collecting the data needed. Structured
Questionnaires: This used to collect information from households. Questionnaires were
developed to obtain survey data that allows an understanding of the impact of micro
financing services on the growth of micro and small entrepreneurs. The question was
formulated in English and translated into Swahili to make them understandable to
respondents. They were distributed to collect quantitative data from one hundred and
fifty (150) respondents receiving financial services.
3.4.2.2. Interview
The researcher used this tool to supplement the questionnaire method of data collection
to obtain the qualitative data. The interview was arranged to allow respondents to freely
provide their views related to the problem that was being investigated. The interview
34
was semi-structured; i.e. some of the questions and topics were predetermined. Other
questions were expected to arise during the interview and thus the method appeared to
be informal and conversational, but carefully controlled and structured.
3.4.2.3. Documentary Review
Under this method, the researcher tried to examine whether the data collected were
reliable, suitable and adequate. This method helped the researcher to get supportive
information that was being complemented data obtained through use of questionnaire
and interview techniques. The method was therefore being helpful to understand the
contribution made by these micro-credit programs in different areas and epochs, seeking
to explore the magnitude of the problem as documented by other researchers. Different
books, journals, newsletters, electronic information and other forms of documented
materials will be perused.
3.5. Data Processing, Analysis and Presentation
Once the questionnaire or other measuring instruments have been administered, the mass
of raw data collected must be systematically organized in a manner that facilitates
analysis (Mugenda and Mugenda, 1999). In order to facilitate the analysis of data from
questionnaires, interviews and documentary sources, findings was being extracted and
presented to answer the research questions.
Statistical Package for Social Sciences (SPSS) computer software for storage, processing
and analysis of data so as to obtain answers to the research questions. SPSS computer
software was used for data processing before data analysis. The data analysis was
35
important since it distil crude data into clear and interpretable ones (Kerlinger, 1986).
Descriptive statistical analysis procedures including cross-tabulations and frequency
distributions from the database template was used to determine the relations between
pairs of variables. The inferential statistical analysis, namely t-test was used. The t-test
was employed to test the research hypothesis. Qualitative data (unstructured questions)
were analysed through content analysis method. Content analysis is the systematic,
quantitative analysis of communication content, including verbal, visual, print, and
electronic communication. Under this method, a researcher applies objective and
systematic counting and recording procedures to create a quantitative description of the
symbolic content in a text (Neuman, 2003).
3.6 Empirical Framework of SME Growth
3.6.1 Dependent Variable
There is little agreement in the existing literature on how to measure growth, and
scholars have used a variety of different measures. These measures include, for example,
growth of sales, employees, assets, profit, equity, and others (Davidsson, & Wiklund,
2000). The study used Small and Medium Enterprises Growth (SME_G) as a dependant
variable; in this study a researcher uses volume of gross sales (in Tsh) per annual as a
measure of SME growth. In this phenomenon, a researcher takes unit price of the
commodity multiplied by the total quantity sold of each individual respondent.
GS=P x ∑QS (1)

36
Where; GS denotes Volume of gross sales (in Tsh) per annual, P denotes unit price of a
commodity and QS denotes Quantity of goods and services sold per annual.
3.6.2 Independent Variables
3.6.2.1 Amount of Loan (AMOL)
Amount of loan in Tsh, the researcher used this variable as an independent variable to
measure the access of fund on SME. Here, the study used to measure the total amount of
loan that SME practitioners acquired from MFI in a given period of time.
AMOL=∑Lo + R (2)
Where; AMOL denotes total amount of loan in Tsh. acquired by SME participant, Lo
denotes micro-loan in Tsh. and R denotes Rate of interest in Tsh. for such micro-loan.
3.6.2.2 Experience of SME Members (EXPp)
The study also used Experience of SME participants in particular business; here a
researcher measures the experience of SME member by taking the total number of years
in business since its operation to the time when this research conducted.
EXPp=Tt-1 - Tt (3)
Where; EXPp denotes experience of SME members, Tt-1 denotes initial year of business
operation while Tt denotes present year when research conducted.
3.6.2.3 SME Member’s Start-up Capital
37
Star-up capital in Tsh. was another independent variable that used by a researcher in its
model to analyse the growth of SME. Star-up capital was measured through summing up
all sources of capital that SME member accumulated for the purpose of initiating the
firm.
STCA = OS + FC + GR + Lo (4)
Where; STCA denotes Star-up capital in Tsh, OS denotes own saving, FC denotes funds
from family, friends, relatives and spouse, GR denotes funds from donors and Lo
denotes loan from commercial and non-commercial banks.
3.6.2.4 Education Level
Education level is another independent variable that measured the SMEs growth, a
researcher takes the general level of education that a member completed in term of
Tanzania education system. Level of education included are, primary education,
secondary education, and higher education. A value of 1 was given to entrepreneur
whose completed primary education and value 0 to those who have other level of
education.
3.6.2.5 Number of Employees
Number of employees (EMPLY) – is another independent variable in order to test for
scale effects in the relation to growth SME.
3.7. Empirical Model
38
This study used cross-sectional data regression model in empirical test, and tests whether
MFI improves SME growth. In empirical test, individuals of cross-sectional data are
SME practitioners from BRAC and FINCA in Morogoro Municipality. The researcher
used the following econometric model to estimate through single equation linear
regression model. This is the multiple regression model of the form
SME_Gi = β0 + β1AMOL1i + β2EDU2i + β3EXPp3i + β4STCA 4i + β5EMPLY 5i + ei (5)
Where,
SME_G = SMEs growth,
AMOL = the total amount of micro-loan to the participant,
EXPp = Number of years being in the business (Age of the business),
EDUC = Level of education of the SME’s member
STCA = Start-up capital in Tsh,
EMPLY = Number of employee
β’s = are multiple regression coefficients estimated
e = the error term.
i = 1...... n, where n is the number of SME
The Ordinary Least Squares (OLS) technique was used in estimating the specified
econometric model. Apart from its simplicity, it gives reliable estimates. The estimation
software was SPSS version 16
39
CHAPTER FOUR
4.0 DATA ANALYSIS AND DISCUSSION
4.1 Overview
This chapter presents an analysis and discussion of the research findings of the study. In
this context the chapter analyzed data with reference to the research objectives,
questions and hypothesis. The study provides description of the socio-economic and
demographic characteristics of the respondents namely age, sex, and education level.
Also the main occupation and years in business (experience) were discussed.
4.2. Socio-economic and Demographic Characteristics of the Respondents
For that matter, socio-economic and demographic characteristics provide a foundation
for understanding the differences and similarities in the human resource base at the
household levels. Also, they acts as factors that may influence participation in micro
credit’s program that again leads to huge impacts to the credit users. On the other hand,
the physical resource base of a household indicates its stock of wealth, life standards and
wealth or poverty level (Barnes and Keogh, 1999).
The primary research data from SME’s practitioners in BRAC and FINCA were by the
use of structured questionnaires which in turn get analyzed for different significance
levels after being employed in the regression model. A total of 150 questionnaires were
randomly distributed to SMEs taking loan from BRAC and FINCA as shown on table
4.1, therefore considered as adequate to the subsequent data analysis. The demographic
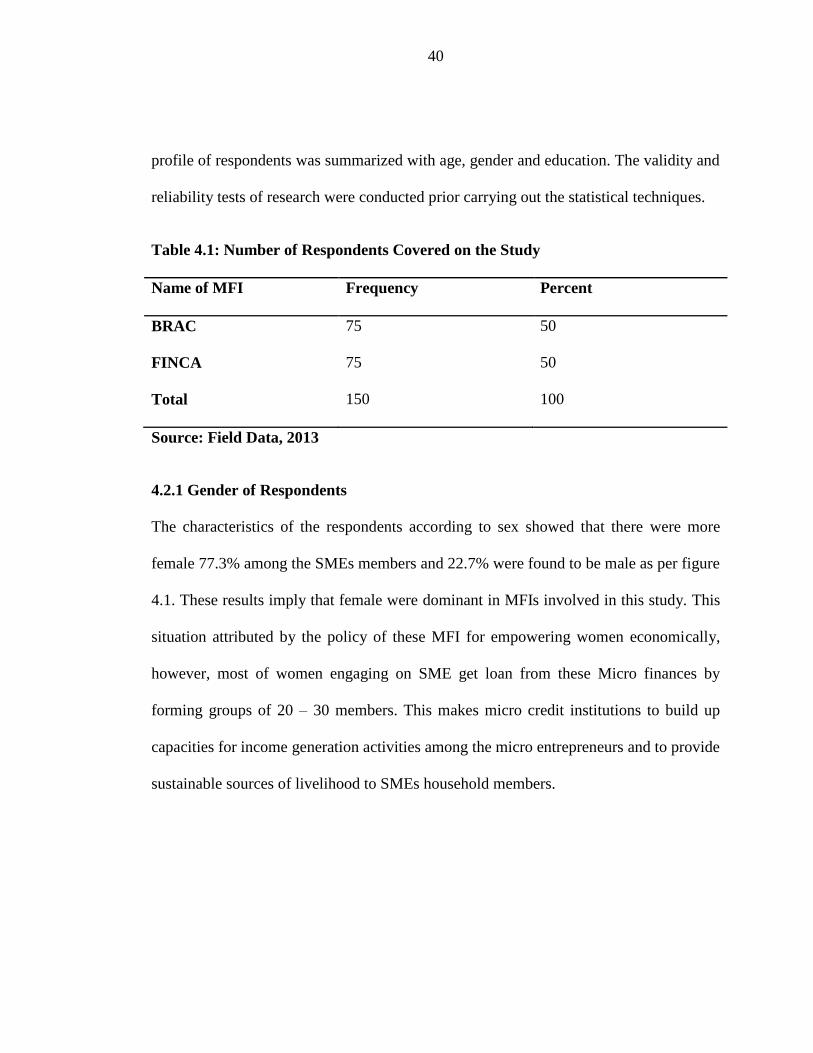
40
profile of respondents was summarized with age, gender and education. The validity and
reliability tests of research were conducted prior carrying out the statistical techniques.
Table 4.1: Number of Respondents Covered on the Study
Name of MFI Frequency Percent
BRAC 75 50
FINCA 75 50
Total 150 100
Source: Field Data, 2013
4.2.1 Gender of Respondents
The characteristics of the respondents according to sex showed that there were more
female 77.3% among the SMEs members and 22.7% were found to be male as per figure
4.1. These results imply that female were dominant in MFIs involved in this study. This
situation attributed by the policy of these MFI for empowering women economically,
however, most of women engaging on SME get loan from these Micro finances by
forming groups of 20 – 30 members. This makes micro credit institutions to build up
capacities for income generation activities among the micro entrepreneurs and to provide
sustainable sources of livelihood to SMEs household members.
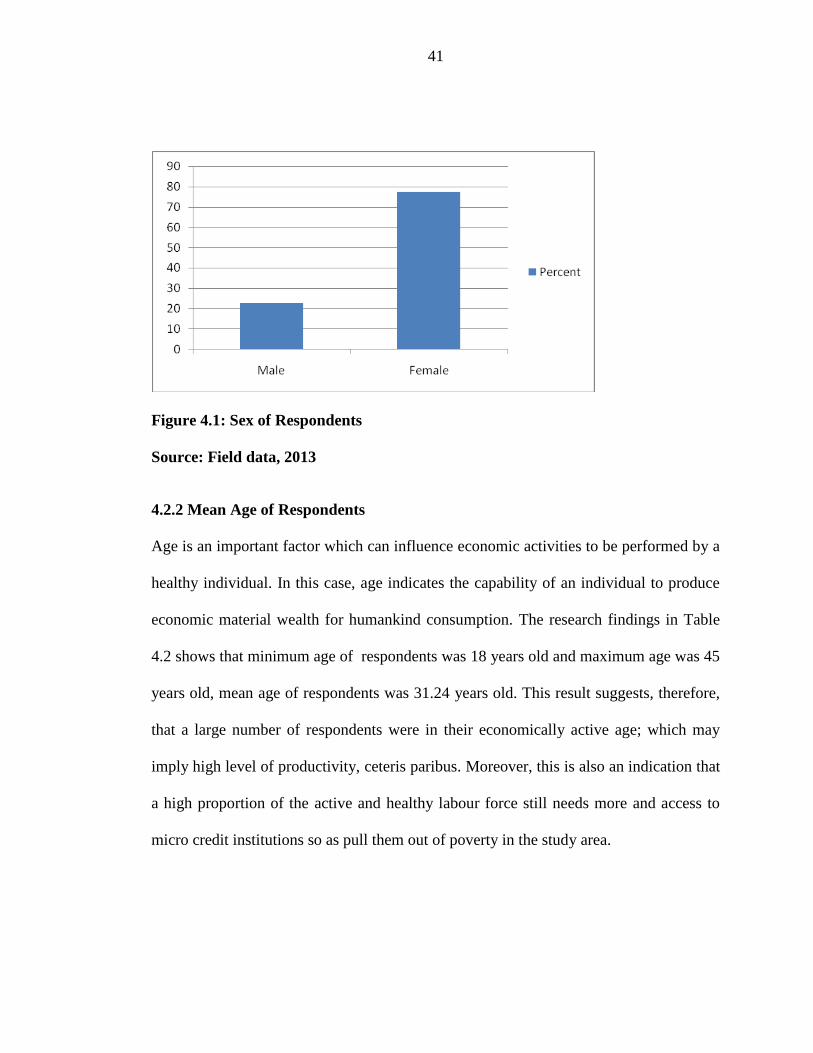
41
Figure 4.1: Sex of Respondents
Source: Field data, 2013
4.2.2 Mean Age of Respondents
Age is an important factor which can influence economic activities to be performed by a
healthy individual. In this case, age indicates the capability of an individual to produce
economic material wealth for humankind consumption. The research findings in Table
4.2 shows that minimum age of respondents was 18 years old and maximum age was 45
years old, mean age of respondents was 31.24 years old. This result suggests, therefore,
that a large number of respondents were in their economically active age; which may
imply high level of productivity, ceteris paribus. Moreover, this is also an indication that
a high proportion of the active and healthy labour force still needs more and access to
micro credit institutions so as pull them out of poverty in the study area.
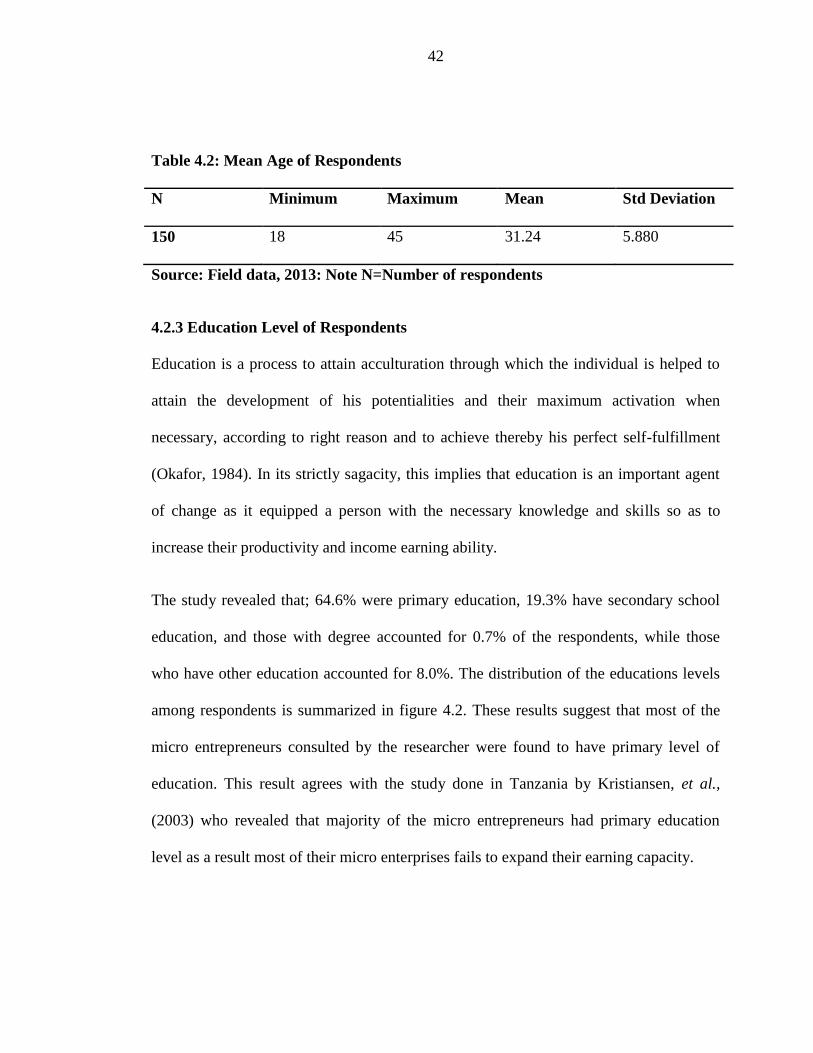
42
Table 4.2: Mean Age of Respondents
N Minimum Maximum Mean Std Deviation
150 18 45 31.24 5.880
Source: Field data, 2013: Note N=Number of respondents
4.2.3 Education Level of Respondents
Education is a process to attain acculturation through which the individual is helped to
attain the development of his potentialities and their maximum activation when
necessary, according to right reason and to achieve thereby his perfect self-fulfillment
(Okafor, 1984). In its strictly sagacity, this implies that education is an important agent
of change as it equipped a person with the necessary knowledge and skills so as to
increase their productivity and income earning ability.
The study revealed that; 64.6% were primary education, 19.3% have secondary school
education, and those with degree accounted for 0.7% of the respondents, while those
who have other education accounted for 8.0%. The distribution of the educations levels
among respondents is summarized in figure 4.2. These results suggest that most of the
micro entrepreneurs consulted by the researcher were found to have primary level of
education. This result agrees with the study done in Tanzania by Kristiansen, et al.,
(2003) who revealed that majority of the micro entrepreneurs had primary education
level as a result most of their micro enterprises fails to expand their earning capacity.
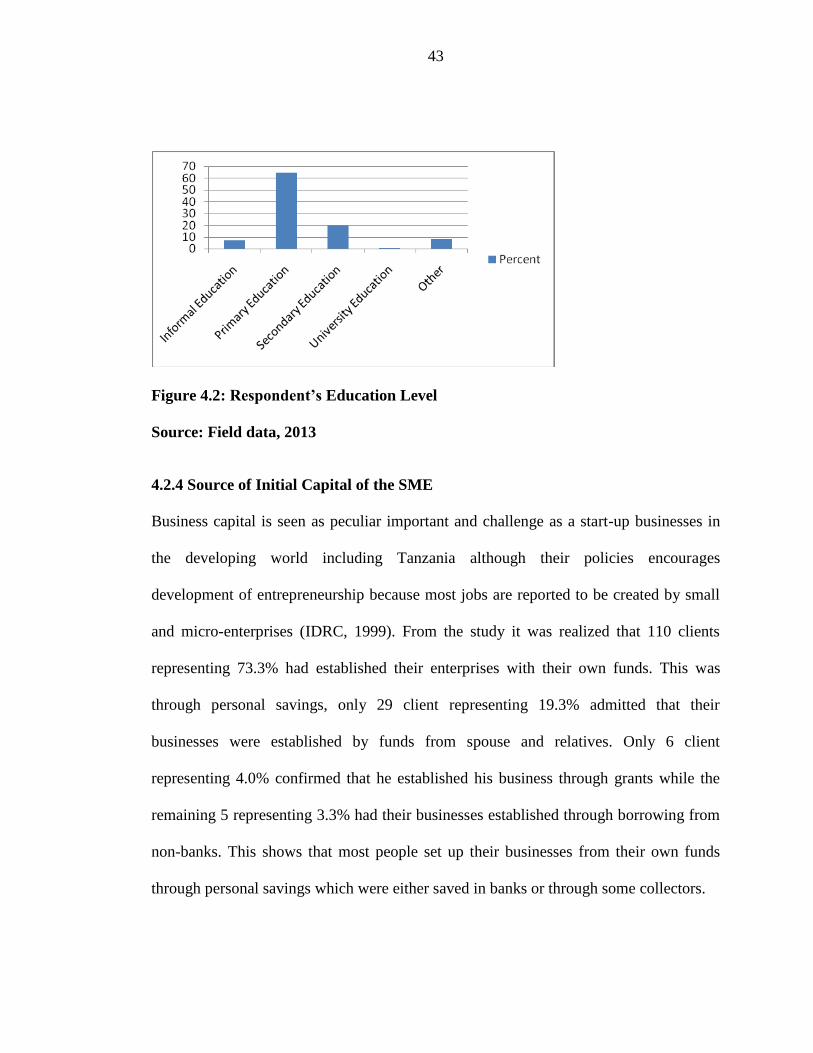
43
Figure 4.2: Respondent’s Education Level
Source: Field data, 2013
4.2.4 Source of Initial Capital of the SME
Business capital is seen as peculiar important and challenge as a start-up businesses in
the developing world including Tanzania although their policies encourages
development of entrepreneurship because most jobs are reported to be created by small
and micro-enterprises (IDRC, 1999). From the study it was realized that 110 clients
representing 73.3% had established their enterprises with their own funds. This was
through personal savings, only 29 client representing 19.3% admitted that their
businesses were established by funds from spouse and relatives. Only 6 client
representing 4.0% confirmed that he established his business through grants while the
remaining 5 representing 3.3% had their businesses established through borrowing from
non-banks. This shows that most people set up their businesses from their own funds
through personal savings which were either saved in banks or through some collectors.
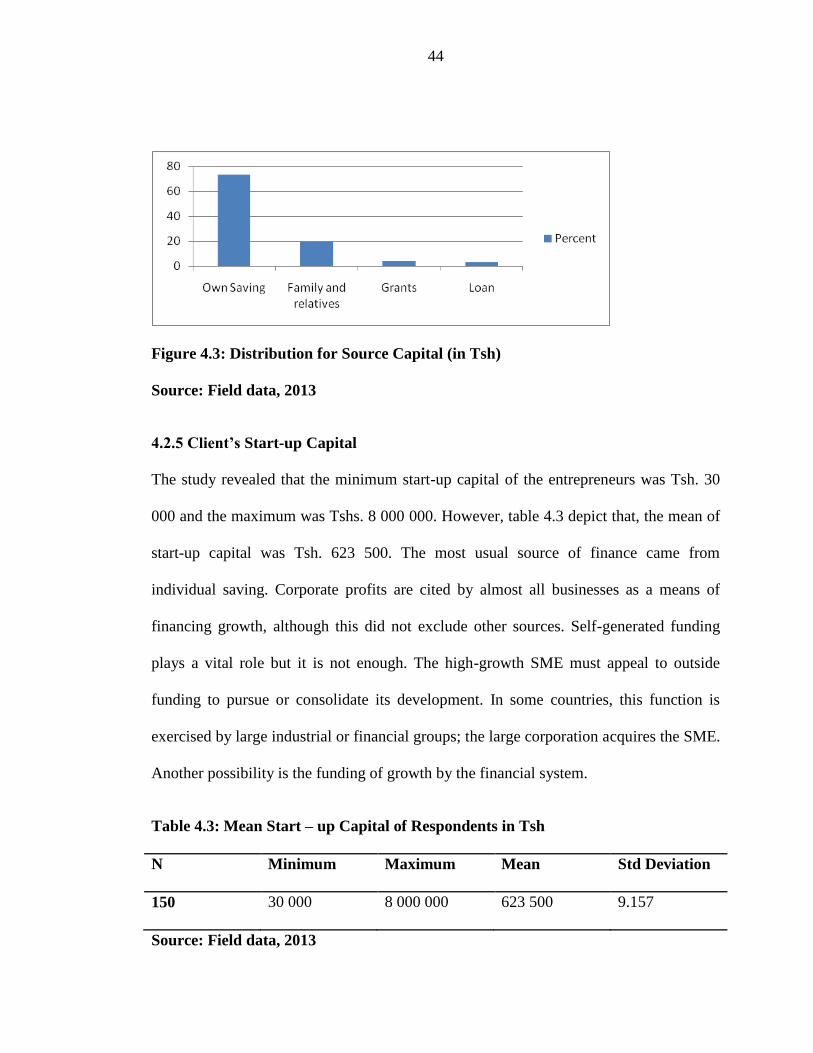
44
Figure 4.3: Distribution for Source Capital (in Tsh)
Source: Field data, 2013
4.2.5 Client’s Start-up Capital
The study revealed that the minimum start-up capital of the entrepreneurs was Tsh. 30
000 and the maximum was Tshs. 8 000 000. However, table 4.3 depict that, the mean of
start-up capital was Tsh. 623 500. The most usual source of finance came from
individual saving. Corporate profits are cited by almost all businesses as a means of
financing growth, although this did not exclude other sources. Self-generated funding
plays a vital role but it is not enough. The high-growth SME must appeal to outside
funding to pursue or consolidate its development. In some countries, this function is
exercised by large industrial or financial groups; the large corporation acquires the SME.
Another possibility is the funding of growth by the financial system.
Table 4.3: Mean Start – up Capital of Respondents in Tsh
N Minimum Maximum Mean Std Deviation
150 30 000 8 000 000 623 500 9.157
Source: Field data, 2013
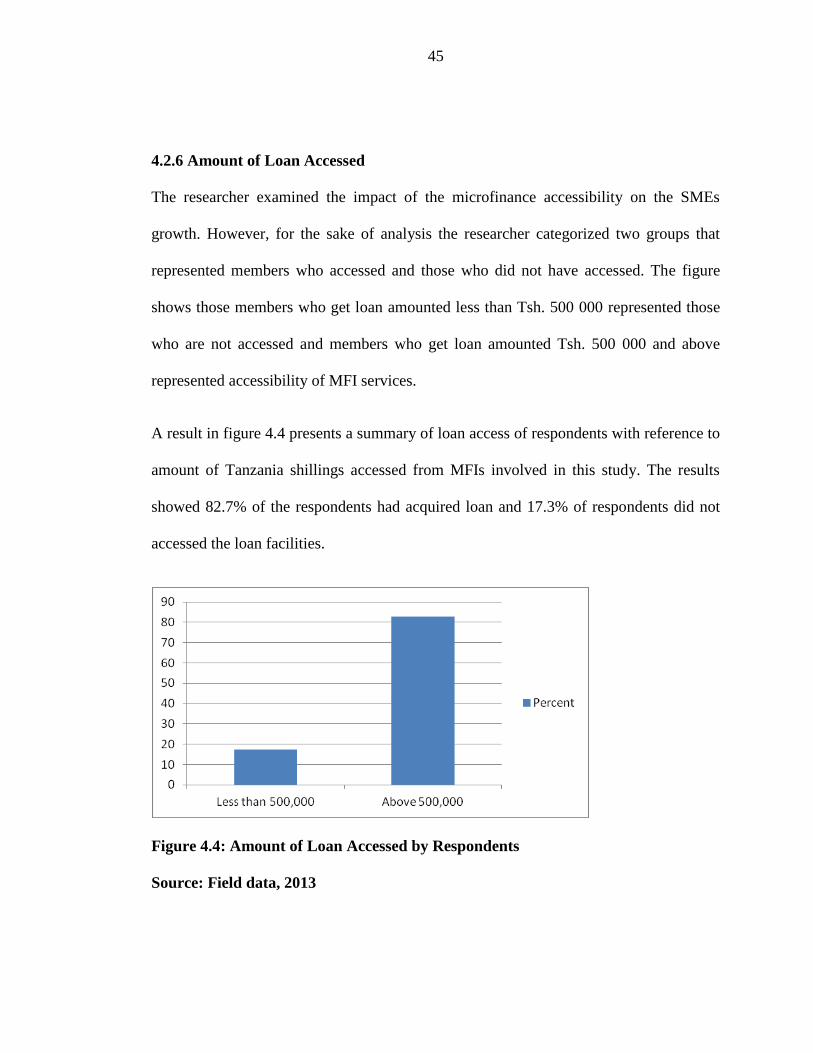
45
4.2.6 Amount of Loan Accessed
The researcher examined the impact of the microfinance accessibility on the SMEs
growth. However, for the sake of analysis the researcher categorized two groups that
represented members who accessed and those who did not have accessed. The figure
shows those members who get loan amounted less than Tsh. 500 000 represented those
who are not accessed and members who get loan amounted Tsh. 500 000 and above
represented accessibility of MFI services.
A result in figure 4.4 presents a summary of loan access of respondents with reference to
amount of Tanzania shillings accessed from MFIs involved in this study. The results
showed 82.7% of the respondents had acquired loan and 17.3% of respondents did not
accessed the loan facilities.
Figure 4.4: Amount of Loan Accessed by Respondents
Source: Field data, 2013
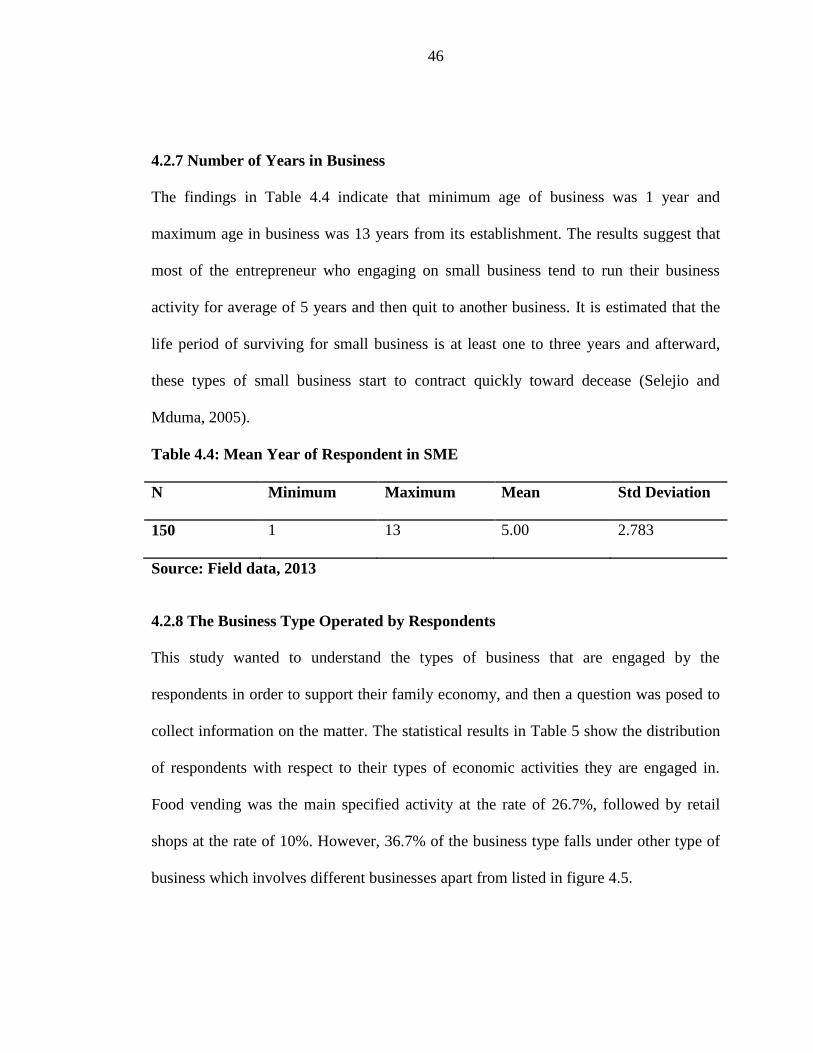
46
4.2.7 Number of Years in Business
The findings in Table 4.4 indicate that minimum age of business was 1 year and
maximum age in business was 13 years from its establishment. The results suggest that
most of the entrepreneur who engaging on small business tend to run their business
activity for average of 5 years and then quit to another business. It is estimated that the
life period of surviving for small business is at least one to three years and afterward,
these types of small business start to contract quickly toward decease (Selejio and
Mduma, 2005).
Table 4.4: Mean Year of Respondent in SME
N Minimum Maximum Mean Std Deviation
150 1 13 5.00 2.783
Source: Field data, 2013
4.2.8 The Business Type Operated by Respondents
This study wanted to understand the types of business that are engaged by the
respondents in order to support their family economy, and then a question was posed to
collect information on the matter. The statistical results in Table 5 show the distribution
of respondents with respect to their types of economic activities they are engaged in.
Food vending was the main specified activity at the rate of 26.7%, followed by retail
shops at the rate of 10%. However, 36.7% of the business type falls under other type of
business which involves different businesses apart from listed in figure 4.5.
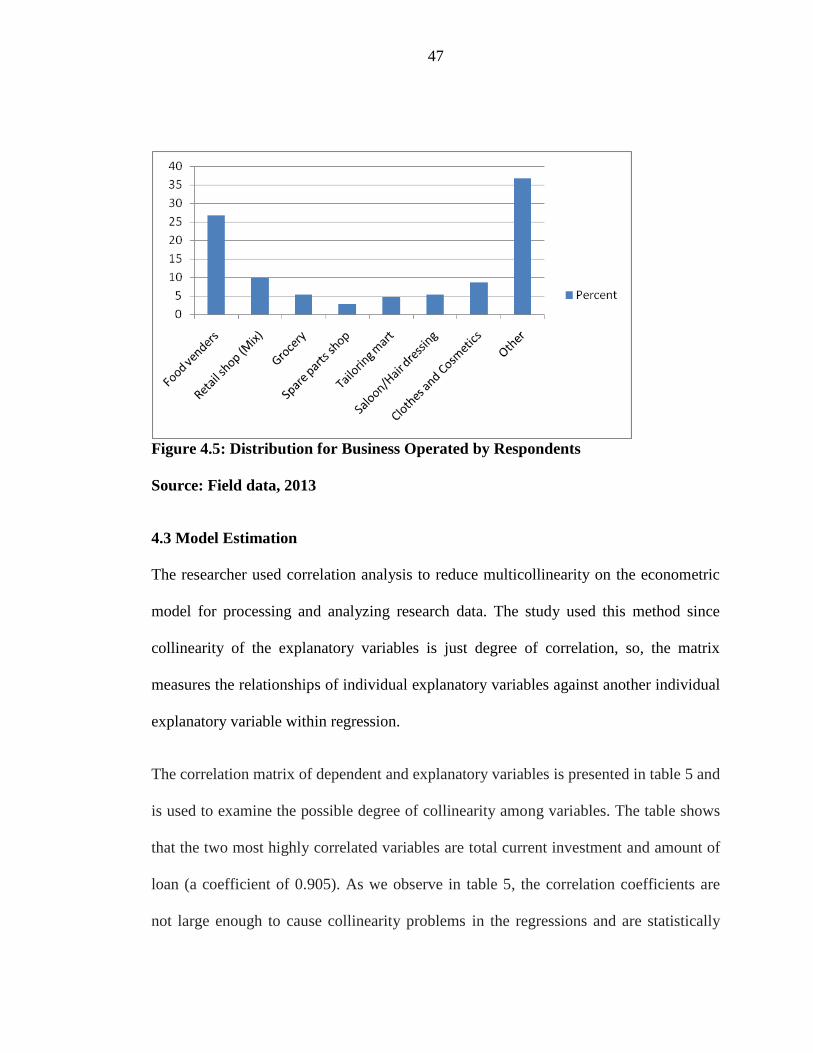
47
Figure 4.5: Distribution for Business Operated by Respondents
Source: Field data, 2013
4.3 Model Estimation
The researcher used correlation analysis to reduce multicollinearity on the econometric
model for processing and analyzing research data. The study used this method since
collinearity of the explanatory variables is just degree of correlation, so, the matrix
measures the relationships of individual explanatory variables against another individual
explanatory variable within regression.
The correlation matrix of dependent and explanatory variables is presented in table 5 and
is used to examine the possible degree of collinearity among variables. The table shows
that the two most highly correlated variables are total current investment and amount of
loan (a coefficient of 0.905). As we observe in table 5, the correlation coefficients are
not large enough to cause collinearity problems in the regressions and are statistically
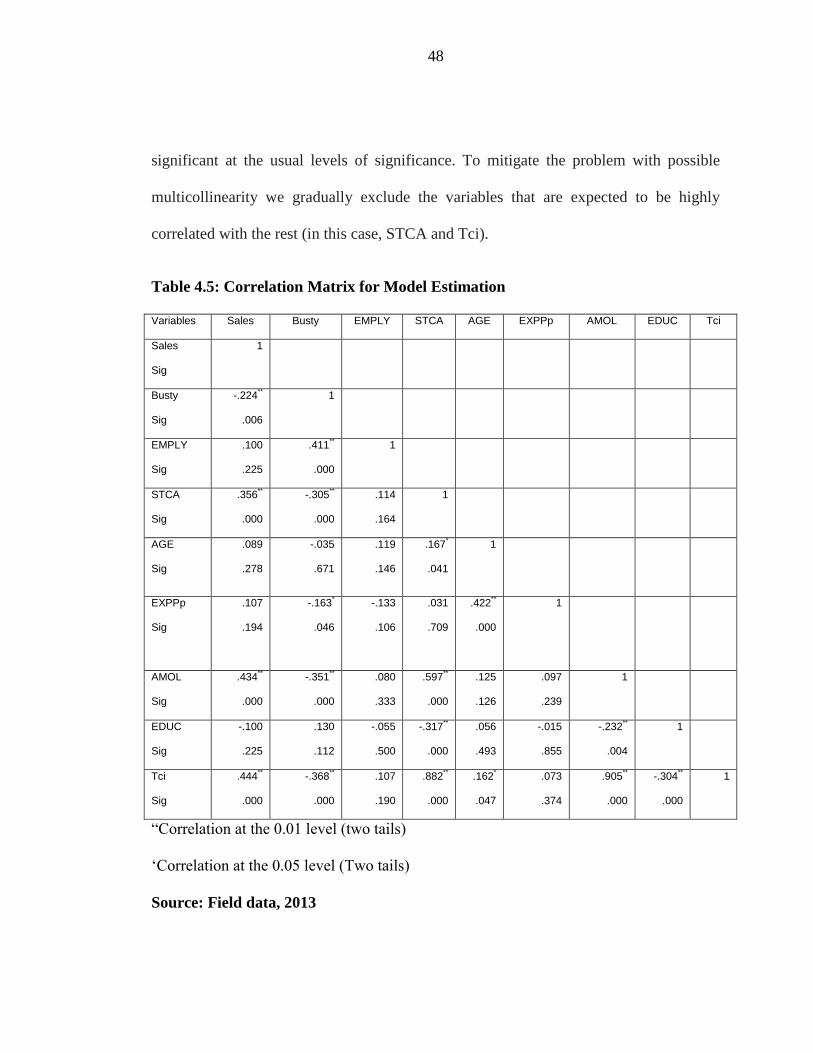
48
significant at the usual levels of significance. To mitigate the problem with possible
multicollinearity we gradually exclude the variables that are expected to be highly
correlated with the rest (in this case, STCA and Tci).
Table 4.5: Correlation Matrix for Model Estimation
Variables Sales Busty EMPLY STCA AGE EXPPp AMOL EDUC Tci
Sales
Sig
1
Busty
Sig
-.224**
.006
1
EMPLY
Sig
.100
.225
.411**
.000
1
STCA
Sig
.356**
.000
-.305**
.000
.114
.164
1
AGE
Sig
.089
.278
-.035
.671
.119
.146
.167*
.041
1
EXPPp
Sig
.107
.194
-.163*
.046
-.133
.106
.031
.709
.422**
.000
1
AMOL
Sig
.434**
.000
-.351**
.000
.080
.333
.597**
.000
.125
.126
.097
.239
1
EDUC
Sig
-.100
.225
.130
.112
-.055
.500
-.317**
.000
.056
.493
-.015
.855
-.232**
.004
1
Tci
Sig
.444**
.000
-.368**
.000
.107
.190
.882**
.000
.162*
.047
.073
.374
.905**
.000
-.304**
.000
1
“Correlation at the 0.01 level (two tails)
‘Correlation at the 0.05 level (Two tails)
Source: Field data, 2013
49
4.4 Multiple Regression Analysis Results
The complete data set based on 150 observations on the chosen variables. Table 4.6
reports the multiple regression analysis on selected variables. The amount of loan (in
Tsh) was 0.371 with p - value of 0.002 for the study sample. On number of years in
business (Firm’s age) was 0.083 with p - value of 0.328, level of education represented
0.040 with p - value of 0.613. Similarly other variables like, respondent’s age
representing -0.009, types of business operated by respondents represented -0.142 and
Number of employee represented 0.140 with their p - values 0.912, 0.119 and 0.108
respectively.
The estimated result showed R- Squared of 0.223. This indicates that 22% of the
variations in the growth of SMEs are explained by the independent variables. The F-
Statistic which is a key statistic in this cross-section study is 5.810 (0.000) and is
significant at 95% confident level. This implies that almost all the independent variables
in the model have jointly contributed to the growth of the SMEs in the Morogoro
Municipality.
Durbin Watson (DW) – Statistics is 2.008. This figure indicates that successive error
terms are not correlated.
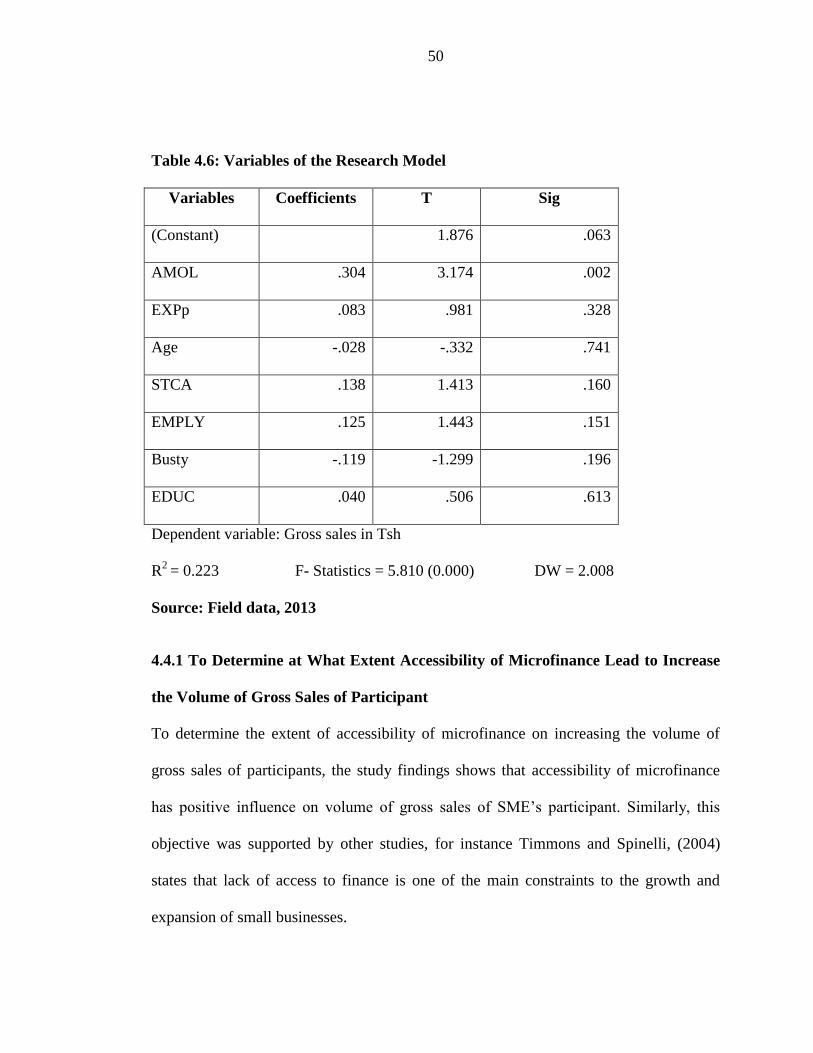
50
Table 4.6: Variables of the Research Model
Variables Coefficients T Sig
(Constant) 1.876 .063
AMOL .304 3.174 .002
EXPp .083 .981 .328
Age -.028 -.332 .741
STCA .138 1.413 .160
EMPLY .125 1.443 .151
Busty -.119 -1.299 .196
EDUC .040 .506 .613
Dependent variable: Gross sales in Tsh
R2
= 0.223 F- Statistics = 5.810 (0.000) DW = 2.008
Source: Field data, 2013
4.4.1 To Determine at What Extent Accessibility of Microfinance Lead to Increase
the Volume of Gross Sales of Participant
To determine the extent of accessibility of microfinance on increasing the volume of
gross sales of participants, the study findings shows that accessibility of microfinance
has positive influence on volume of gross sales of SME’s participant. Similarly, this
objective was supported by other studies, for instance Timmons and Spinelli, (2004)
states that lack of access to finance is one of the main constraints to the growth and
expansion of small businesses.
51
4.4.1.1 Amount of Loan Accessed
The additional Tsh 1 000 amount of loan on average, then SME growth increase by 304
units per annum ceteris paribus. The higher the access the amount of loan the higher the
volume of gross sales per annum. The main interest is in the signs and magnitudes of the
variables measuring the impact of accessibility of microloan (amount of loan) because
they represent the sensitivity of SME growth to amount of loan in Tsh. Theoretically,
microfinance accessibility enables poor to smooth their consumption, gradually develop
micro enterprises and enhance income capacity (Rubambey, 2001). Similarly, lack of
broad access to financial services limits opportunities for agribusiness enterprises and
small holders to adopt efficient technologies and efficient resource allocation (Peer,
2010). In fact the entrepreneur who accessed high loan is able to improve his/her
business environment which can attract and monopolize the market through improving
the quality and increase quantity of product, setting competitive price, increasing
advertising budget and to improve business premise. The coefficients on amount of
loans in Tsh are statistically significant under t-test at 5% level of significance. The
magnitude of these coefficients is consistent with the hypothesis stated that; there is no
statistical significant relationship between microfinance access and SMEs growth. The
study suggest that, the null hypothesis was rejected hence there is statistical significant
relationship.
4.4.2 To Examine Other Factors Enhancing SME’s Growth
The study aimed to understand other factors rather than loan accessibility that enhancing
SME’s growth, in this point of view the researcher analysed variables of start-up capital
52
in Tsh and experience of SME practitioners to measure the SME’s growth. The study
reveals that these variables were not statistically significant at t statistic 0.05 level of
significance.
4.4.2.1 Number of Employees
The additional 1 worker on average, then SME growth goes up about by 125 units per
annum ceteris paribus. The main interest is in the signs and magnitudes of the variables
measuring the impact of number of employee on SMEs growth, because they represent
the sensitivity of SME growth to number of employee. Ceteris paribus the higher the
number of employees the higher the volume of gross sales per annum, on the study
shows that firms have 1 to 5 employees, this due to the nature of their business as well as
small capital they have. The empirical evidence shows that the larger the firm (in terms
of assets or number of employees) the greater its potential to grow (Wiklund and
Shepherd, 2005). The coefficients on number of employees are statistically insignificant
under t-test at 5% level of significance.
4.4.2.2 Experience in Business
The experience of an entrepreneur in his/her business increases by a year on average,
then SME growth increase by 0.083 units per annum. The main interest is in the signs
and magnitudes of the variables measuring the impact of experience of years in business
on SMEs growth, because they represent the sensitivity of SME growth to experience of
years in business. Ceteris paribus, the more experience within the business the higher the
SME growth. Theory states that SME practitioners with more managerial, sector
53
experience or prior SME experience as owner/manager tend to correlate with greater
growth (Storey et al, 1989). On the study shows that the mean years experience of
entrepreneurs was 5 years while the maximum experience years was 13 and minimum
experience years was 1 year. The study reveals that there is no necessity for being in
business for long term to influence enterprise’s growth; the reason could be low demand
on the product or low production on the product with high competition. On the other
hand, most of the entrepreneurs quit from one business to another after five years for
searching more profitable business with high volume of gross sales. The coefficients on
experience of years in business are statistically insignificant under t-test at 5% level of
significance. The magnitude of these coefficients are inconsistent with the hypothesis
that; There is no statistical significant that experience on SME activities improves
SME’s growth. The study result suggests that the null hypothesis was accepted hence
there is no statistical significant relationship.
4.4.2.3 Education of the SME Member
The education level of an entrepreneur possessed increases by a stage on average, and
then SME growth goes up about by 0.040 units per annum. The main interest is in the
signs and magnitudes of the variables measuring the impact of education on SMEs
growth, because they represent sensitivity of SME growth to education. Ceteris paribus,
the fact that basic education enhances the overall quality of the owner/manager by
providing him/her with basic numeric and literacy skills thus increases the chance of
survival. Theory states that the fact that a manager has a higher education degree or even
a postgraduate degree seems to stimulate the growth of the firm, thus having an impact
54
on both survival and growth. On the study shows the majority of the respondents were in
primary education level fall under 64.6% while owners who undergone university
degree were 0.7%. The study shows those owners who having primary education level
have average volume of gross sales per annum, the reason could be they have small
initial capital hence they get little amount of loan from MFIs. The coefficients on
education of respondents are statistically insignificant under t-test at 5% level of
significance.
4.4.2.4 Age of Respondents
An extra age of an entrepreneur in a year on average, then SME growth goes down about
by 0.028 units per annum. The main interest is in the signs and magnitudes of the
variables measuring the impact of age of respondent on SMEs growth, because they
represent less sensitivity of SME growth to age of respondents. Theory states that age
is an important factor which can influence economic activities to be performed by a
healthy and energetic individual. In this case, age indicates the capability of an
individual to produce economic material wealth for humankind consumption. Available
discussion explaining the influence of the age of the owner/manager advocates for the
younger owner/manager; the argument here rests on the fact that the younger
owner/manager has the necessary motivation, energy and commitment to work and is
more inclined to take risks (Storey, 1994). The logic is that the older owner/manager is
likely to have reached his/her initial aspiration. On the study shows that mean age of
entrepreneurs was 31.24 years while the maximum age was 45 years and minimum age
was 18 years, in the study area most of the people belonging to this age are running
55
businesses which have low returns. This could be because of lack of enough capital, low
level of business skills and unfavourable business location. The coefficients on age of
respondents are statistically insignificant under t-test at 5% level of significance.
4.4.2.5 Start-up Capital
The additional Tsh 1 000 start-up capitals on average, then SME growth goes up about
by 138 units per annum ceteris paribus. The main interest is in the signs and magnitudes
of the variables measuring the impact of start-up capital in Tsh on SMEs growth,
because they represent the sensitivity of SME growth to start-up capital. Ceteris paribus
the higher the start-up capital the higher the volume of gross sales per month, on the
study shows that those people having enough capital during their venture experienced
higher volume of gross sales per month. In fact the entrepreneur who have large initial
capital may improve his/her business environment which can attract and monopolize the
market through improving the product, setting competitive price, advertising as well as
good location for the business. The coefficients on start-up capital are statistically
insignificant under t-test at 5% level of significance. The magnitude of these coefficients
is inconsistent with the hypothesis that; there is no statistical significant relationship
between SMEs growth and start-up capital. The study suggests that the null hypothesis
was accepted hence there is no statistical significant relationship.
4.4.2.6 Business Type Operated by Entrepreneurs
Moving to food vending decreases by a unit on average, then SME growth goes down
about by 0.119 units per annum. The main interest is in the signs and magnitudes of the
56
variables measuring the impact of food vending on SMEs growth, because they
represent less sensitivity of SME growth to business type operated by entrepreneur.
Available theories explaining the sector in which a firm operates is considered an
influential factor on the growth processes in small firms but the extent to which it is a
significant factor is less clear-cut. Although the level of industrial disaggregation can be
expected to influence the results of sector analysis, empirical studies Smallbone et al
(1995) usually find that there are significant differences amongst sectors in terms of the
typical firm growth rates. On the study shows that most of the people were operating
food vending, this business operated mostly by female and these are the majority of
respondents in this study. Similarly this type of business taking large part of SME, this
could be because the business need small amount of capital to operate the sector. The
coefficients on business type are statistically insignificant under t-test at 5% level of
significance.
4.5 Summary of Chapter Four
The data analysis in this chapter used descriptive analysis in terms of frequency and
descriptive as well as regression analysis. The study findings reveal that all three
specific objectives were captured under the field data gathered by a researcher. The three
research hypothesis were tested at sig 0.05 level of significance, one research hypothesis
out of three was revealed that null hypothesis has statistically significant; which are (1)
H0: There is no significant statistical relationship between microfinance access and SME
growth. While the rest research hypothesis tested and the study findings reveal that the
null hypothesis was not statistically significant, which are; H0: There is no statistical

57
significant that experience on SME activities improves SME’s growth and H0: There is
no statistical significant relationship between SME growth and start-up capital.
58
CHAPTER FIVE
5.0 CONCLUSIONS AND RECOMMENDATIONS
5.1 Overview
This chapter describes conclusions and recommendations of the study with reference to
the designed research objectives and analysis made. The conclusions that have been
made hereunder are based on the research findings obtained from the field data.
Consequently, the opinions suggested were compared with the previous results done by
other academicians/intellectuals and key informants. With this respect, this chapter
concentrates on conclusions, policy implications and finally, proposes the area for
further studies.
5.2 Conclusion
This study uses the financial accessibility approach to study the impact of microfinance
on SMEs growth in Morogoro Municipality. It uses data collected from a field survey
from two MFIs located on Morogoro municipality. Linear regression was used to assess
the impact of microfinance on SMEs growth on the likelihood that respondents would
increase the volume of gross sales, to assess the respondents’ sensitivity to accessibility.
The model contained seven independent variables (amount of loan, years in business,
start-up capital, number of employees, age of respondents, education level and business
type). The data and method employed here produce results consistent with more
traditional impact study in Tanzania for the same period.
59
The study findings reveal that MFIs played its role of providing funds for the SME, the
total number of 150 SMEs involved in this study achieved to secure loan from two MFIs
in the study area which were BRAC and FINCA branches in Morogoro Municipality.
These MFIs provided different amount of loans to the SMEs with the lowest amount of
Tsh 200 000 and the highest amount of Tsh 7 000 000 during this period of the study. It
also aimed to investigate the impact of microfinance services on the growth of SMEs in
Morogoro Municipality. The study used the volume of gross sales in Tsh per annum to
measure the SME’s growth. The study findings demonstrated that MFIs has positive
impact on SMEs growth in the study area, since the variable amount of loan to the client
presenting microfinance accessibility to SME has positive relation with volume of gross
sales in Tsh per annum. Its coefficient was 0.304 and its p-value 0.002 sig two sided tail
which is statistically significant at 5% level of significance.
The research findings are in conformity with the reviewed literature under chapter two
whereby studies done in other parts of the world including developed, and Least
Developing Countries (LDCs) indicated that; access to loan, start-up capital, number of
employees and experience of SME in years has positive influence to their growth. The
contribution of SMEs to economic growth and creation of employment is very evident
worldwide.
60
5.3. Policy Implications
The main policy implication of the study is that the government of Tanzania should try
hard to meet the credit needs of the SMEs in the country for an immediate economic
growth of the nation. This the government may achieve through the following ways:
i. Easy accessibility to credit through specialized or development oriented banking
or financial institutions should be encouraged. This fund should be made
available to the SMEs at reduced interest rate.
ii. Establishment of a well funded National Credit Guarantee fund that will assist
for micro-loan facilities from the banks and other financial institutions. This will
help reduce the excessive demand for collateral security.
5.4. Area for Further Studies
i. Many scholars concentrated their studies on micro credit impact on abled
individuals and fewer studies have been directed to analyze on the same aspect to
the disabled individuals.
ii. An analytical and detailed study is required to determine the real causes for the
failure of many entrepreneurs in Tanzania, despite the legal regulatory and policy
reforms that are being undertaken since 1980s.
iii. The study to investigate the contribution of cultural and gender aspects to SME
growth. The study should attempt to establish linkage with enterprise growth
with culture and gender of the entrepreneur.
61
REFERENCES
Adam, J. and Kamuzora, F. (2008). Research methods for business and social studies.
Mzumbe book project, Mzumbe Morogoro, Tanzania
Ahiawodzi, K. A and Adade, T. C, (2012). Access to Credit and Growth of Small and
Medium Scale Enterprises in the Ho Municipality of Ghana, Britain, British Journal of
Economics, Finance and Management Science, Vol. 6 (2), pp 37 - 47
Amin, S. Rai, S. A. and Topa, G. (2001). Does microcredit reach the poor and
vulnerable? Evidence from northern Bangladesh, Centre for International Development,
WP No. 28, pp 9-20, Harvard University
Azhar, D. (2001). The History of Microfinance, [http://www.globalenvision.org/library],
site visited on 23/01/2012
Barnes, C. and Keogh, E. (1999). An assessment of the impact of Zambuko’s micro
enterprise program in Zimbabwe. Management Systems International. Washington, D.C.
– USA
Chaliand, G. (2003). Role of microfinance in poverty reduction.
[http://www.gdrc.org/icm/], visited on 23/01/2012
Chestnut, D. (2010). Role of Microfinance Institutions. [http://www.ehow.com/], visited
on 23/01/2012
62
Chijoriga, M. M. (2000). The Performance and Sustainability of Micro Finance
Institution in Tanzania. Working Paper, pp 20-40, Dar es Salaam
Cunningham, W. V. & Maloney, W. F. (2001). Heterogeneity among Mexico’s micro-
enterprises, an application of factor and cluster analysis, Economic Development and
Cultural Change. Vol. 50, pp. 131-156.
Daniels, L. (1994). Changes in the Small-scale Enterprise Sector from 1991 to 1993.
Results of a second nationwide survey in Zimbabwe. GEMINI Technical Report No. 71,
Development Alternatives Inc: Bethesda MD.
Davidsson, P., & Wiklund, J. (2000). Conceptual and empirical challenges in the study
of firm growth, in D. Sexton & H. Landström (ed.), The Blackwell handbook of
entrepreneurship, Oxford, MA: Blackwell, 26–44.
Esmail, Z. (2008). Neo-liberal Development: The Impact of Microfinance on Poverty
Alleviation. [http://cjog.ca/CJOG_files/cjog_esmailv1n1.pdf], visited on 23/01/2012
Fatchamp, M. (1997). Trade Credit in Zimbabwean Manufacturing. World Development,
Vol. 25, No. 5, pp 5-34.
Goedhuys, Michelin (2002). Employment creation and employment quality in African
Seed Working Paper, No 26 International Labour Office
Grade, O. T. (1984). The Role of Rural Credit Projects in Reaching the Poor: IFAD’s
Experience. ILO, Geneva.
63
Hossain, M. (1988). Credit for the Alleviation of Rural Poverty: The Grameen Bank in
Bangladesh. Washington, D.C.: IFPRI, Research Report No. 65
IMF, (2002). IMF, proceedings of World Bank Conclude Joint Poverty Reduction
Strategy Conference. 700 19th Street, NW Washington, D.C. 20431
Kamuzora, F. (2002). An evaluation of rural development during Mwalimu Nyerere’s
government using sustainable livelihood approach. Mzumbe University, Morogoro.
Kayunze, K. A. (2002). Poverty, ignorance and disease in Tanzania: reflection upon
Mwalimu Julius K. Nyerere’s attacks on the problems. Sokoine University of
Agriculture, Morogoro.
Kessy, S. A. and Temu, S. S. (2010). The Impact of Training on Performance of Micro
and Small Enterprises Served by Microfinance Institutions in Tanzania. REPOA, Dar es
Salaam.
Kessy, S. A. and Urio, F. (2006). The Contribution of Microfinance Institutions to
Poverty Reduction in Tanzania, REPOA, No. 06.3, Dar es Salaam.
Kjekshus, H. (1977). The Tanzanian villagization policy, implementational lessons and
ecological dimensions. Canadian Journal of African Studies, 1977; 11(2):269-82
Kothari, C. R. (2004). Research Methodology, methods and techniques. (2nd
revised Ed),
K.K. Gupta for New Age International (P) Ltd., New Delhi
64
Kuzilwa, J. A. (2002). The Role of Credit for Small Business Success: A Study of the
National Entrepreneurship Development Fund in Tanzania. In; of ICAESB conference,
White Sand Hotel, Dar es Salaam.
Lois, S. and Annette, S. (2005). Support for Growth-oriented Women Entrepreneurs in
Tanzania, ILO, Geneva, Switzerland
MIFOS, (2005). What is Microfinance? [http://www.mifos.org/about/what-is-
microfinance], visited on 20/11/2011
Mosley, P. (2001). Microfinance and Poverty in Bolivia. Journal of Development
Studies, Vol. 37, No. 4, pp101-132(32)
Mugenda, A. and Mugenda, O. (1999). Research Methods, Quantitative and qualitative
approaches. African centre for technology studies (ACTS) Nairobi, Kenya
Mwaiselage, A. A. and Mponzi, T. (1999). Poverty eradication program in Tanzania,
Ohri, C. G. (2004). Microfinance & health, a case for Integrated Service Delivery.
University of Washington, Paper No. 4
Peer, S. (2010). Access to finance. International Finance Corporation Annual Report,
pp. 10-50,
Pier Giovanni, R. (et al) (2002). Gibrat’s law and the firm size/ firm growth
relationshipin Italian services. Tinbergon Institute Discussion Paper-080/3. The
Netherlands, Amsterdam
65
Robert, K. M. (2009). An assessment of microcredit schemes in Kilombero District,
Morogoro. Unpublished MBA Dissertation at Sokoine University of Agriculture.
Rubambey, G. (2001), Tanzania National Microfinance Paper. In; proceedings of
Entrepreneurship and Small Business Development, 5th
, pp. 10-34
Rweyemamu, D. C., Kimaro, M. P. and Urassa, O. M. (2005). Assessing Micro-Finance
Services in Agricultural Sector Development: A Case Study of Semi-Formal Financial
Institutions in Tanzania Economic and Social Research Foundation
Smallbone, D., Leigh, R. and North, D. (1995). The characteristics and strategies of
high growth SMEs. Int. J. Entrepreneurial Behavior, pp45-62.
Sogorb-Mira, (2005). Sogorb Mira, F., 2005, 'How SME Uniqueness Affects Capital
Structure: Evidence From a 1994-1998 Spanish Data Panel', Small Business Economics
25, 447- 457.
Storey, D., Reynolds, P., and Westhead, P. (1989). Cross-national comparison of the
Variation in New Firm Formation Rates, University of Warwick, SME Centre
Storey, D.J. (1994). Understanding the small business sector, London: International
Thomson Business Press
Timmons, J. and Spinelli, S. (2004). New Venture Creation. Entrepreneurship for the
21st century, (6
th edn). McGraw Hill Companies.
66
United Nations Population Fund, (2006). From Microfinance to Macro Change:
Integrating Health Education and Microfinance to Empower Women and Reduce
Poverty.
URT, (2000). National Micro Finance Policy, Dar es Salaam.
URT, (2003). Small and Medium Enterprise (SMEs) Policy, Dar es Salaam
Vincent, G. (2005). Sustainable Micro entrepreneurship: The Roles of microfinance,
Entrepreneurship and Sustainability in Reducing Poverty in Developing Countries,
[http://www.gdrc.org/icm/micro/guy_sust-micro.pdf], visited on 10/12/2011
Wangwe, S. and Charle, P. (2005). Macroeconomic policy choices for growth and
poverty reduction, The Case of Tanzania, Economic and Social Research Foundation,
Dar es Salaam.
Wangwe, S. and Semboja, H. (1997). Establishing Micro and Small Enterprise (MSEs)
Research Programme, preceedings of Micro and Small Enterprise Research, November,
Dar es Salaam.
Wiklund, J., & Shepherd, D. A., (2005). Entrepreneurial orientation and small business
performance: a configurational approach, Journal of Business Venturing 20(1), 71–91.
World Bank, (1990). Development in practice, Taking action to reduce poverty in Sub-
Saharan Africa, A World Bank Publication, Washington DC

67
APPENDICES
Appendix I: Questionnaire Respondents
Dear respondents,
I am sending this questionnaire to you in order that I may request for your collaboration
in my academic research project through answering to questions herein. The purpose is
to collect data on “Research Proposal on the Impact of microfinance on the SME’s
Growth in Morogoro Municipality.” Any information you provide in this sheet is for
academic purposes and will be treated just between you and me.
Thanks in advance.
A. Personal particulars
1. Age: [ ] Years
2. Gender (Please indicate by check mark)
a. Male[ ], b. Female [ ]
3. Highest Level of education (i) Informal Education (ii) Primary school (iii) Secondary
school (iv) University (v) others …( )
4. Where did you get your initial capital for starting business? Please
specify……………
5. Where do you get the money to run your business?

68
MFI Amount of loan –Tsh per year Total amount –
Tsh 2011 2010 2009
FINCA
BRAC
6. When did you start business? (Please specify a year)...................................
7. What forms of business do you do? (Please specify)...................................
8. How much was your start-up capital?...........................................................
9. What is your production yield/revenue earned?
Before loan facilities After loan facilities
Little Moderate High Little Moderate High
10. Before getting loan facilities how much were getting as your average net
profit?...............
11. After getting loan facility how much are you now getting as your average net
profit?.........
12. Please state your gross sales volume per month at present …… Tshs.
13. How many employees do you have? Before loan facility [ ], at present [ ]
Recommended