The The International Association of Independent Tanker OwnersInternational Association of Independent Tanker Owners
January 2005

Vision for the tanker industry:
“ A responsible, sustainable and respected industry able to influence its own destiny.”
- representing responsible oil and chemical representing responsible oil and chemical tanker owners worldwidetanker owners worldwide
- promoting Safer Ships, Cleaner Seas, Free promoting Safer Ships, Cleaner Seas, Free Competition and Effective RegulationCompetition and Effective Regulation
- strict membership criteria based on quality strict membership criteria based on quality and performance (Class, P&I, PSC)and performance (Class, P&I, PSC)
INTERTANKOINTERTANKO
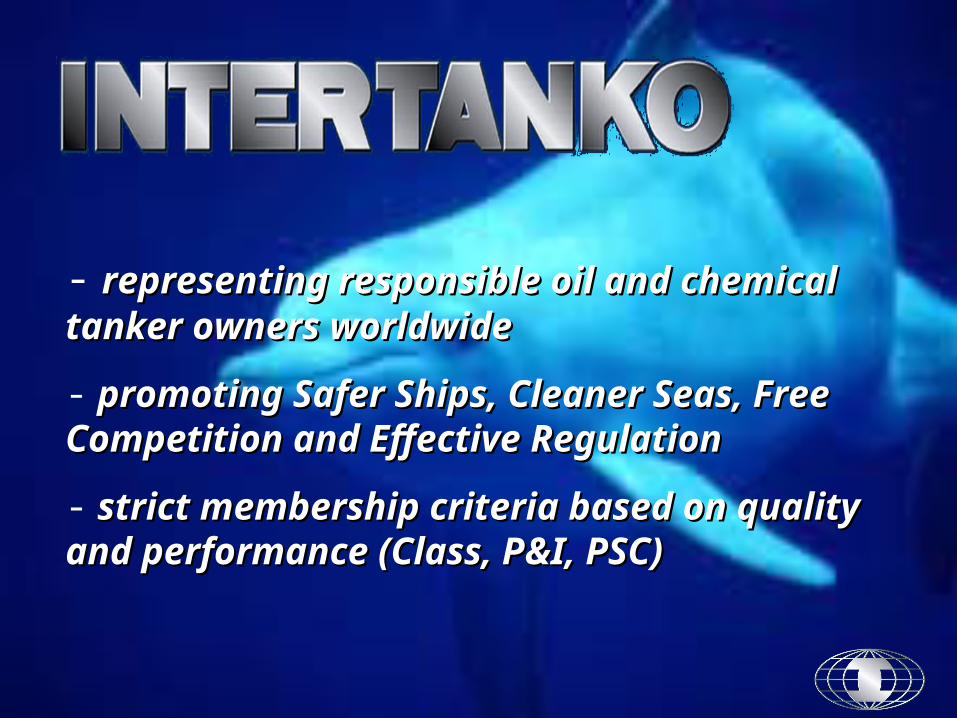
• 230 (+/-)230 (+/-) Members Members
2,200 (+/-) tankers2,200 (+/-) tankers165 million dwt165 million dwt Average age: 11.3 yearsAverage age: 11.3 years
• 270 (+/-) 270 (+/-) Associate MembersAssociate Members
• 25 Staff / 8 Consultants25 Staff / 8 Consultants
• IMO NGO status• EU representative office• Partnership agreement with USCG
Oslo
London
Washington
Singapore

The The International Association of Independent Tanker OwnersInternational Association of Independent Tanker Owners
INTERTANKOINTERTANKO
14 Committees - 4 Regional Panels
• Safety & Environment• Technical – incldg. Bunkers, IT • Chemicals, Short Sea, Offshore• Insurance & Legal, Documentary• Vetting, WorldScale• Communications and Public Relations

Principal Issues for Tanker Owners
• Regional versus International governance- ratification and implementation of existing conventions and legislation
• Challenges to liability regimes & Criminalisation for pollution incidents
• Zero tolerance of accidents – meeting society’s expectations
• Role of partners in lifting standards
• Class common structural rules for tankers• Maritime Security
• EU Competition rules ?

INDUSTRY GOVERNANCE
International vs. local, national and regional
• Liability – EU Penal Sanctions vs. International Conventions
• Safety & Environment – EU (Post Erika & Prestige) vs. IMO/Marpol & SOLAS
• Sulphur Levels – EU, USA vs. IMO
• Security – MTSA vs. ISPS
• Ballast Water Management – US et al vs. IMO
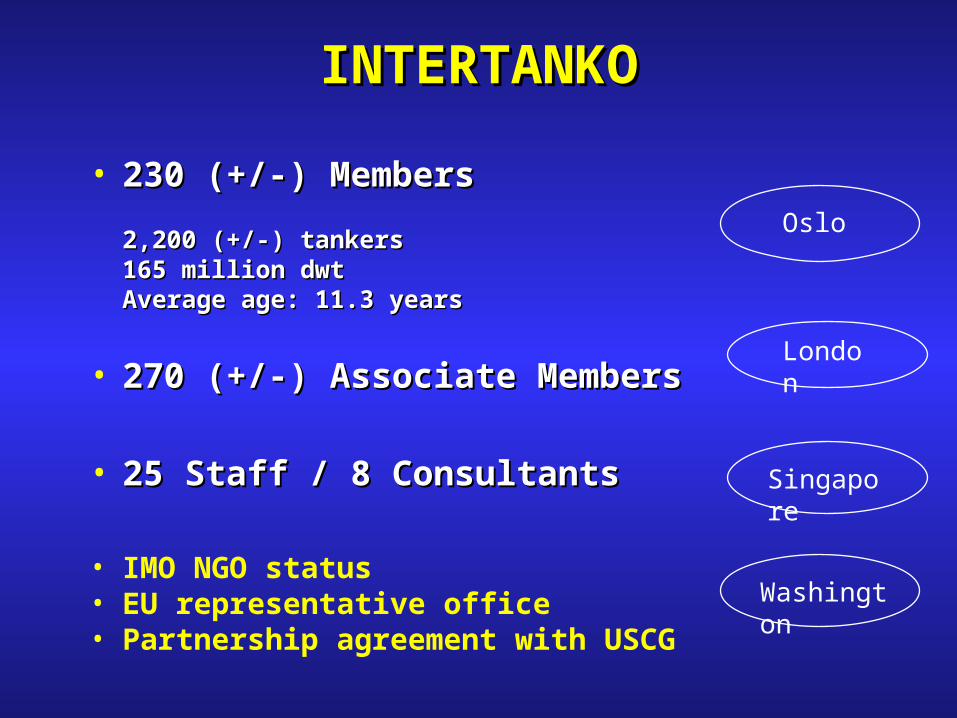
Convention Ratification:• AFS Convention (2001)• HNS Convention (1996)• OPRC-HNS Protocol (2000)• Bunkers Convention (2001)
Places of Refuge
Reception Facilities
Port and infrastructure security
The importance of implementation

Environmental Challenges
Waste reception facilities
VOC Recovery (in port and at sea)
Sulphur Levels (in Fuel) / Air emissions
Ship Recycling (Voluntary vs. Regulatory)
Water Ballast Management (Practical solutions)
Anti-Foulings (Convention – consistent standards)

Examples of Round Table cooperation:
• Improved dialogue with IACS
• Tripartite meetings of owners, builders and class
• Flag State guidelines
• Industry guidelines on Recycling
• The “image” of shipping

STEPS FOR A BETTER INDUSTRY

Oil into the Sea Annual Releases, best estimates
Average 1990-1999, '1000 ts
Natural seeps
Extraction of oil
Tanker accidents
Tanker operation
Other transportation
River and run-offs
Other shipping
Other consumption related
Source: National Academy of Science
47%
21%
11%
8%
3%
3%
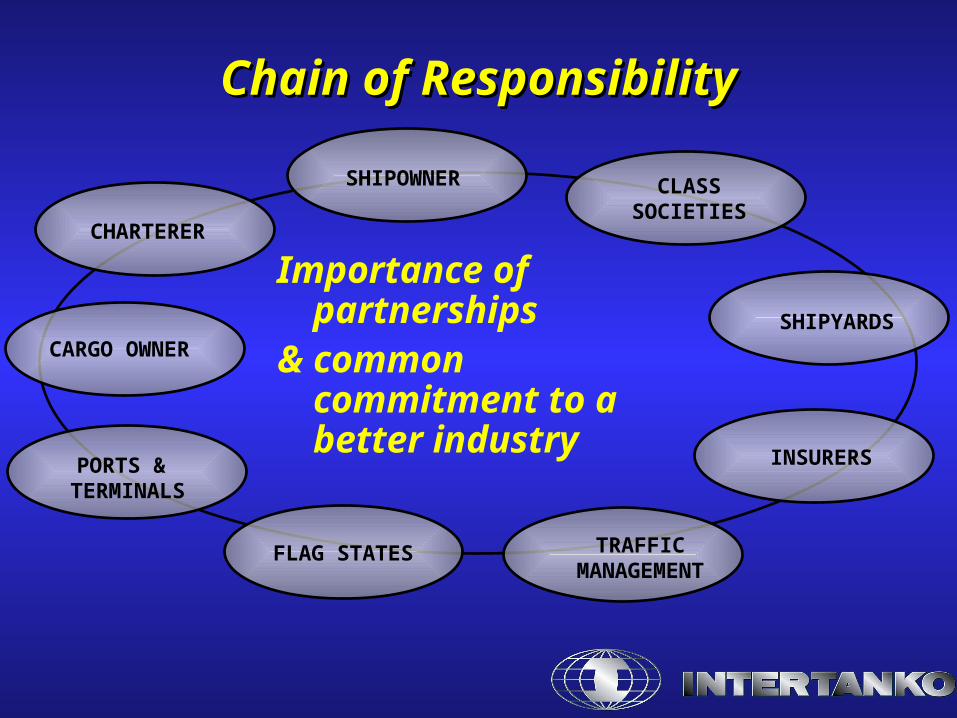
Chain of ResponsibilityChain of Responsibility
Importance of partnerships
& common commitment to a better industry
SHIPOWNER
SHIPYARDS
INSURERS
TRAFFICMANAGEMENT
CARGO OWNER
CHARTERER
PORTS & TERMINALS
CLASSSOCIETIES
FLAG STATES
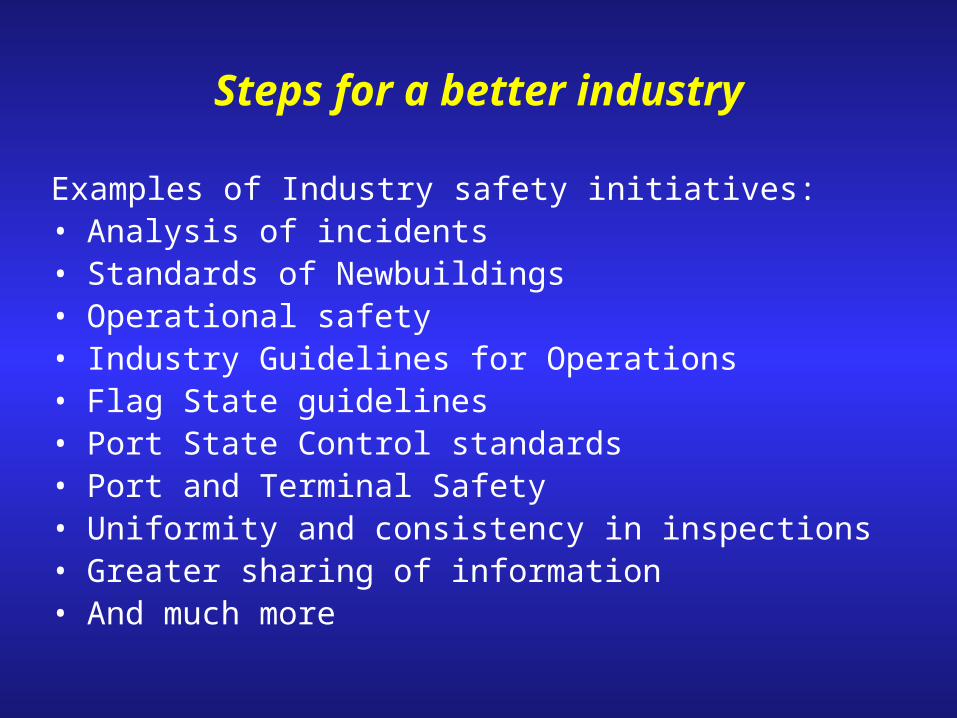
Steps for a better industry
Examples of Industry safety initiatives:• Analysis of incidents• Standards of Newbuildings • Operational safety• Industry Guidelines for Operations• Flag State guidelines • Port State Control standards• Port and Terminal Safety• Uniformity and consistency in inspections• Greater sharing of information• And much more
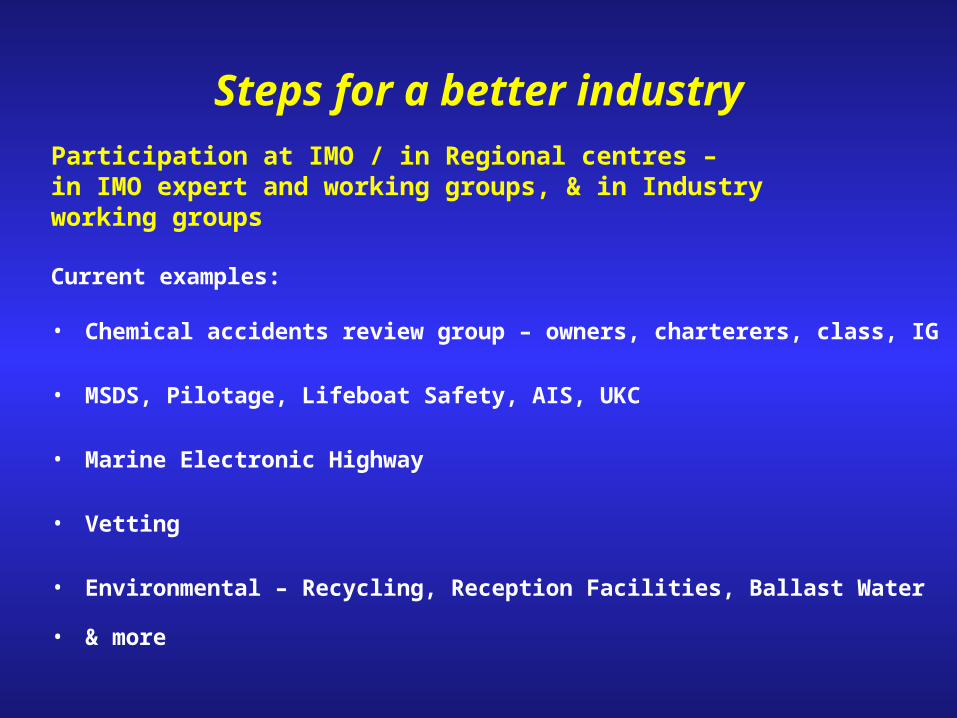
Steps for a better industryParticipation at IMO / in Regional centres –in IMO expert and working groups, & in Industryworking groups
Current examples:
• Chemical accidents review group – owners, charterers, class, IG
• MSDS, Pilotage, Lifeboat Safety, AIS, UKC
• Marine Electronic Highway
• Vetting
• Environmental – Recycling, Reception Facilities, Ballast Water
• & more

Tanker incidents1978-03
0
200
400
600
800
1000
78 80 82 84 86 88 90 92 94 96 98 00 02
Grounded
War
Misc
Hull&Machinery
Fire/Expl
Collision
Source: LMIS, Informa, press, INTERTANKO
Number

Tanker incidents 2003 - 130
12%
25%
24%25%
14%
Collision
Groundings
Hull&machinery: 28
13 engine,6 steer/prop/rudder5 hull5 other
Fire&Expl.
Misc.
.
dw t. Tankers involved
36 below 10,00038 10-29,999 dw t35 30-99,999 dw t17 > 100,000 dw t
Age tankers involved :
24 built 1970s or earlier48 built 1980s43 built 1990s12 built 2000s, 3 unknow n
7 involving pollution of
which Tasman Spirit most serious

INVESTMENT IN NEW SHIPSTanker fleet by hull type
622
5159 67 71 74 78 82
9478
4941 33 29 26 22 18
0
20
40
60
80
100
1991
1997
End 0
2
End 0
3
End 0
4
End 0
5
End 0
6
End 0
7
End 1
0*
SH/DB/DS share (%)
DH share (%)
* Assumes deliveries of 60 m dwt 2008-2010 and 30 m dwt phase out (MARPOL min is 16 m dwt)
%

Steps for a better industry
Standards for Newbuilding and Ships in Service
• Drive for Common Structural Rules• Tripartite meetings of Class and Builders• Development of Condition Assessment
Scheme• Active participation with EMSA on “High
level” double hull panel• Industry wide working groups on corrosion
and coatings
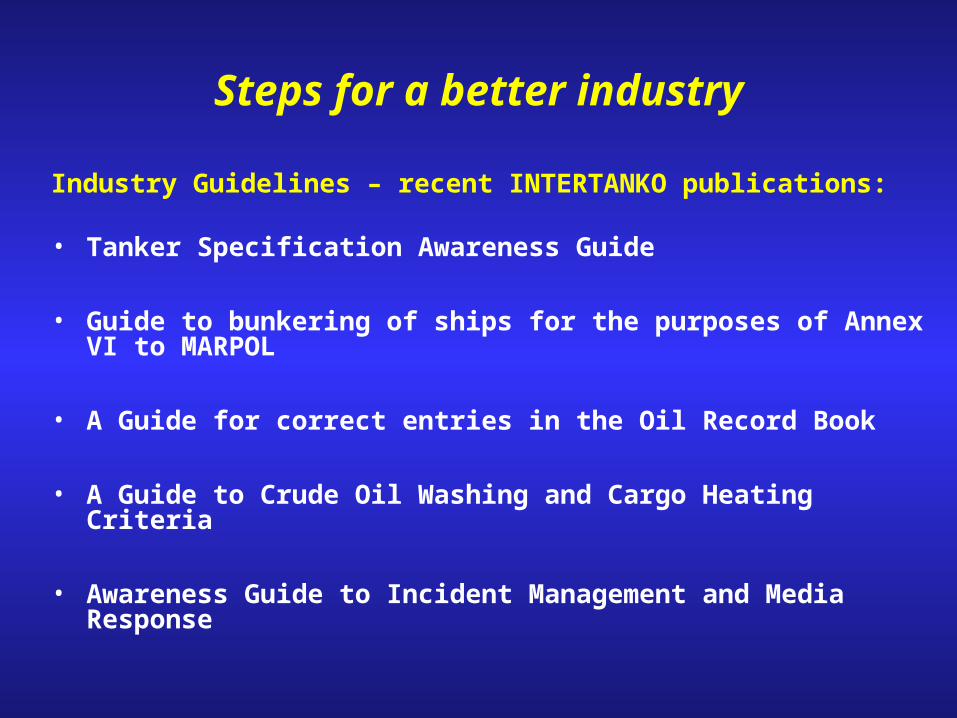
Steps for a better industry
Industry Guidelines – recent INTERTANKO publications:
• Tanker Specification Awareness Guide
• Guide to bunkering of ships for the purposes of Annex VI to MARPOL
• A Guide for correct entries in the Oil Record Book
• A Guide to Crude Oil Washing and Cargo Heating Criteria
• Awareness Guide to Incident Management and Media Response

Port State Control – the industry perspective
Summary:
PSC is actively supported by industry More needs to be done to ensure harmonised standards Greater sharing of inspection records would be beneficial It is an imperative that the integrity of PSC is maintained Better targeting would result from additional analysis of PSC
records Important lessons can be learned by analysing PSC
performance

Port State ControlPercentage of inspected ships detained
0%
2%
4%
6%
8%
10%
12%
14%
200410m
2003200220012000199919981997
0%
2%
4%
6%
8%
10%
12%
14%
of which tankers
All ships
2004 10 months: Paris and Tokyo MoU only

Port State Control – detentions by ship size
Tanker detentions 2002-03 by size of ship
133
26
43
10
22
6 4
44
168
18
60
13 179
1
40
0
20
40
60
80
100
120
140
160
180
<10,000 10,000-19,999
20,000-59,999
60,000-79,999
80,000-119,999
120,000-199,999
>200,000 Dw t notfound
Nu
mb
er o
f sh
ips
2002
2003
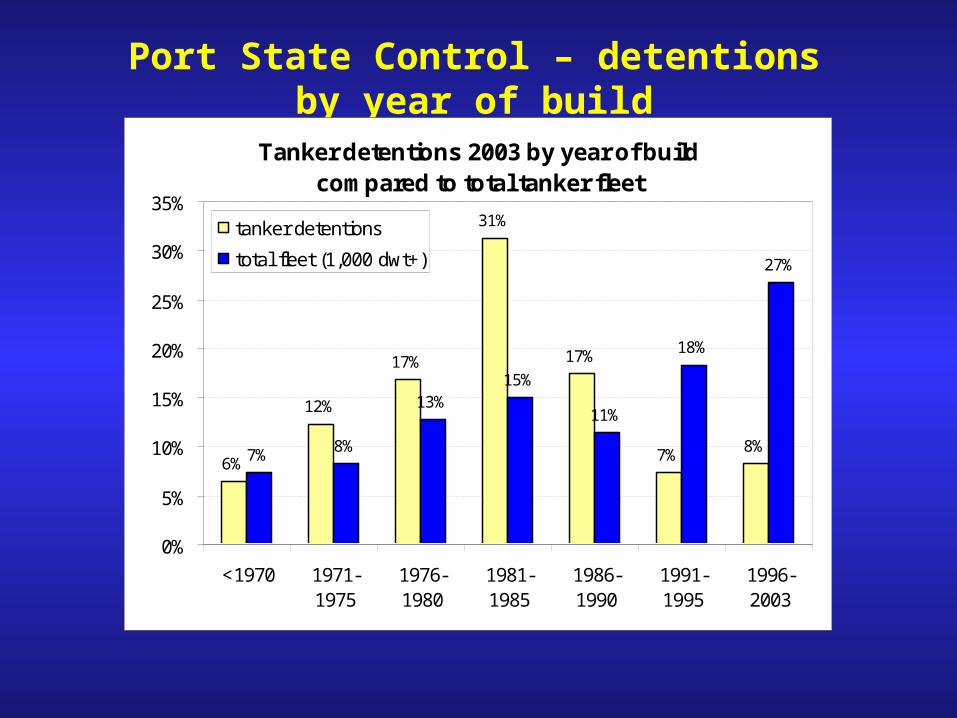
Port State Control – detentions by year of build
Tanker detentions 2003 by year of buildcompared to total tanker fleet
6%
12%
17%
31%
17%
7% 8%7% 8%
13%15%
11%
18%
27%
0%
5%
10%
15%
20%
25%
30%
35%
<1970 1971-1975
1976-1980
1981-1985
1986-1990
1991-1995
1996-2003
tanker detentions
total fleet (1,000 dwt+)
Industry Leadership - Flag State Guidelines
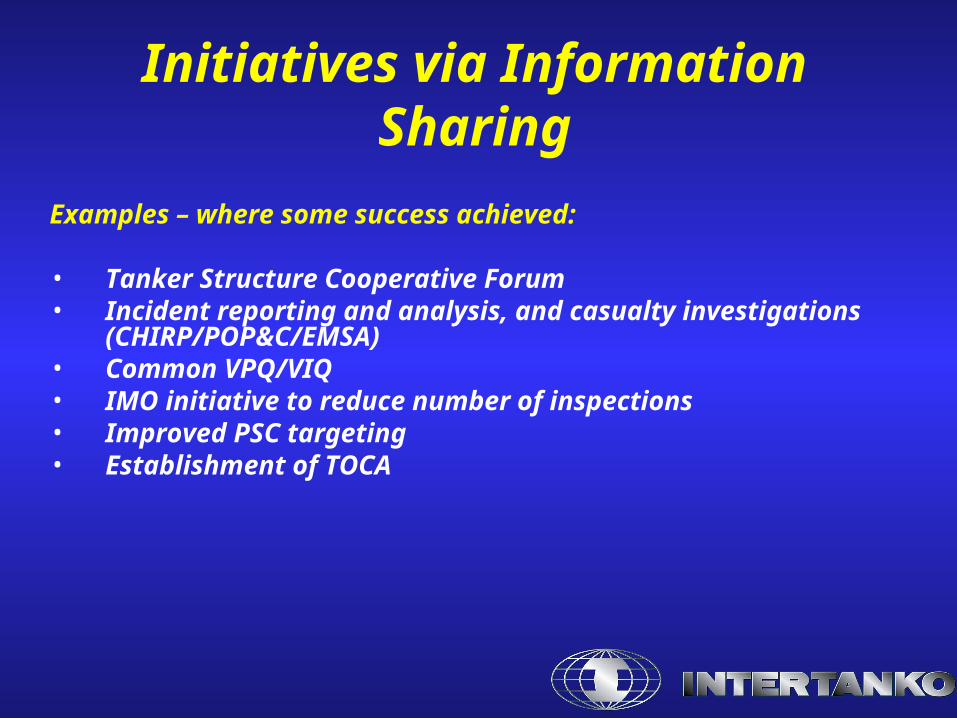
Examples – where some success achieved:
• Tanker Structure Cooperative Forum• Incident reporting and analysis, and casualty
investigations (CHIRP/POP&C/EMSA)• Common VPQ/VIQ• IMO initiative to reduce number of inspections• Improved PSC targeting• Establishment of TOCA
Initiatives via Information Sharing

Steps for a better industry
Are they working ?
Yes ?

Accidental pollution from tankers 1,000 ts
0
50
100
150
200
250
300
350
400
450
90 91 92 93 94 95 96 97 98 99 00 01 02 03 P'04
Largest spills since 1990
1991 ABT Summer 260,000 ts
1991 Kirki 17,700 "
1991 Haven 144000 "
1992 Agean Sea 74,000 ”
1992 Katina P 72,000 ”
1993 Braer 85,000 ”
1994 Seki 19,000 "
1996 Sea Empress 72,000 ”
1997 Nakhodka 17,500 "
1999 Erika 20,000 ”
2002 Prestige 77,000 ”
2003 Tasman Spirit 30,000 ”
Source: ITOPF
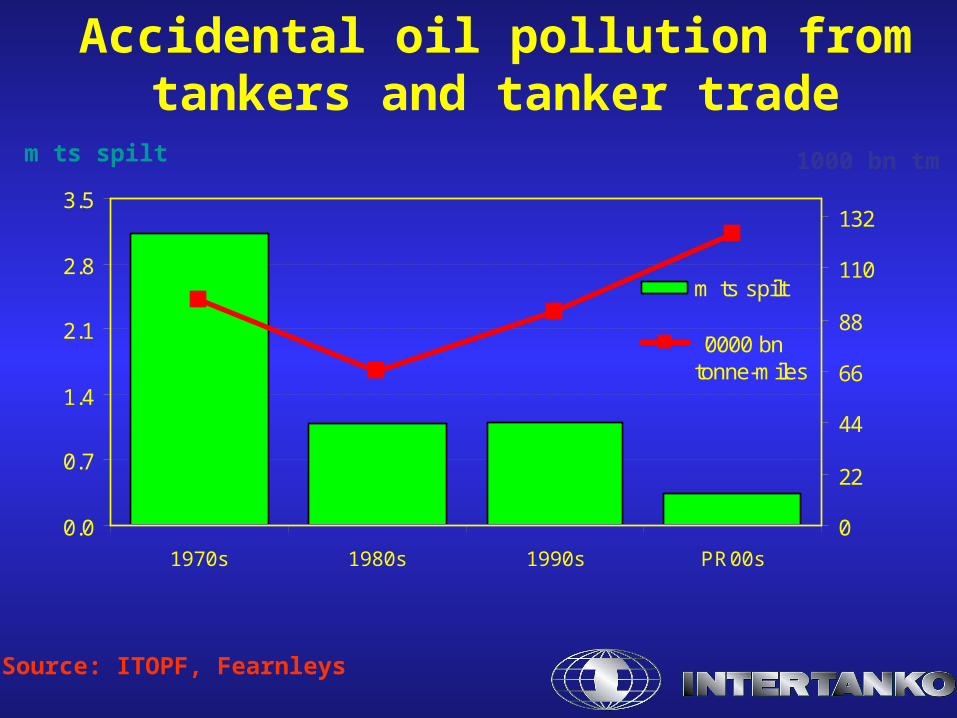
Accidental oil pollution from tankers and tanker trade
0.0
0.7
1.4
2.1
2.8
3.5
1970s 1980s 1990s PR00s
0
22
44
66
88
110
132
m ts spilt
'0000 bntonne-miles
Source: ITOPF, Fearnleys
1000 bn tmm ts spilt

Thank you
www.intertanko.com www.shippingfacts.com
Recommended