Trade Agreements as a Tool to Access Markets
Saman Kelegama, Institute of Policy Studies of Sri Lanka
Sri Lanka Economic Summit, Ceylon Chamber of Commerce, 9-11 July 2013
Outline
Background Trade agreements:
Asia
Sri Lanka
Preferential Market Access for SL Reasons for low impact Positive developments Conclusion & Way forward
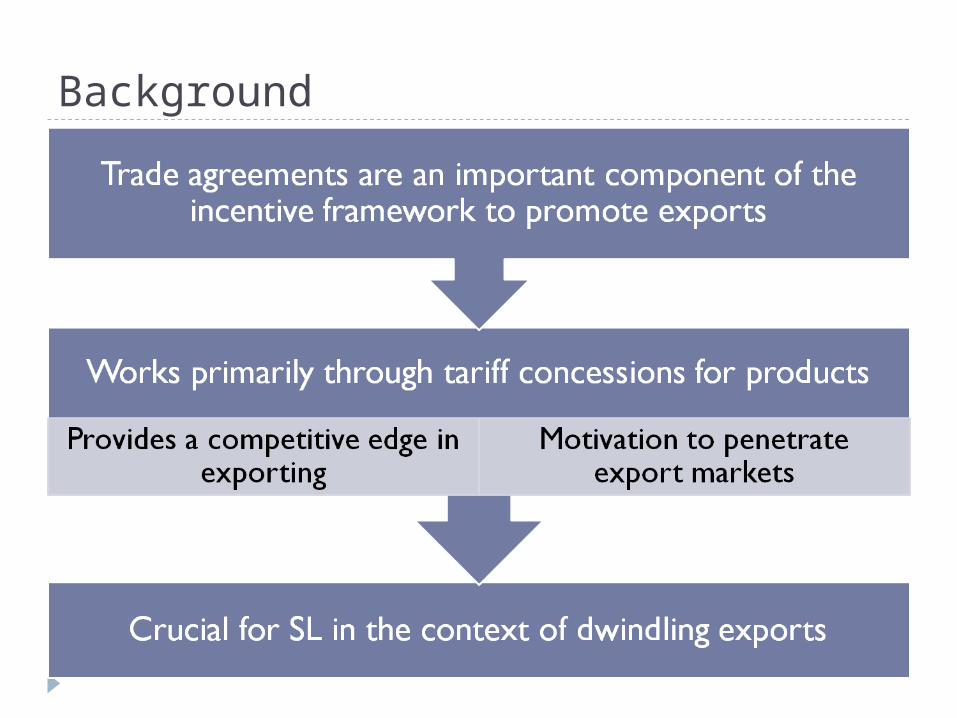
Background
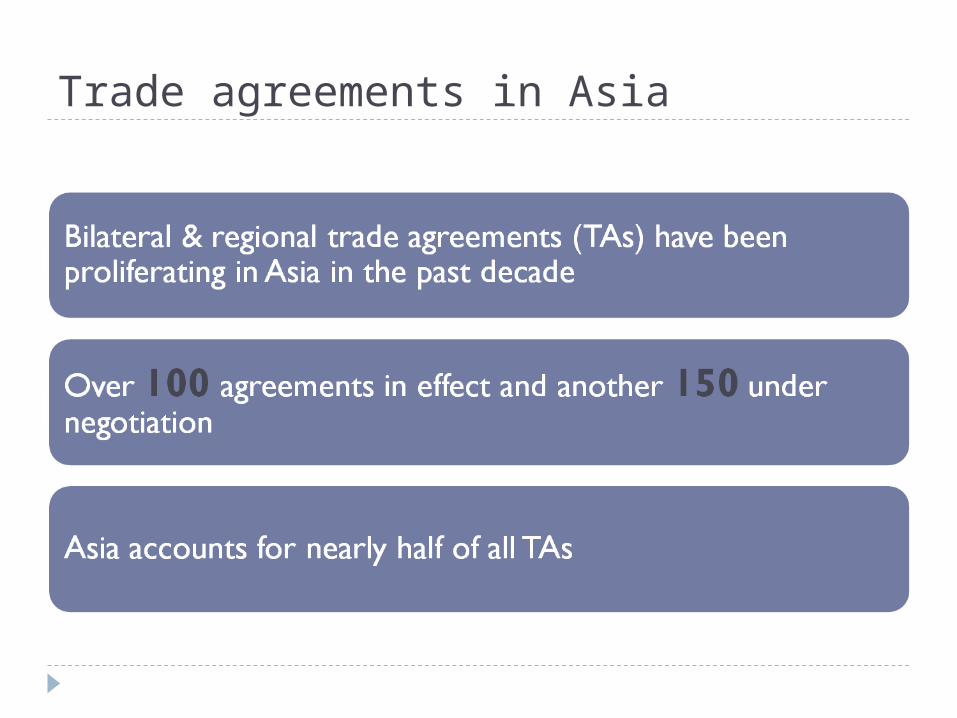
Trade agreements in Asia
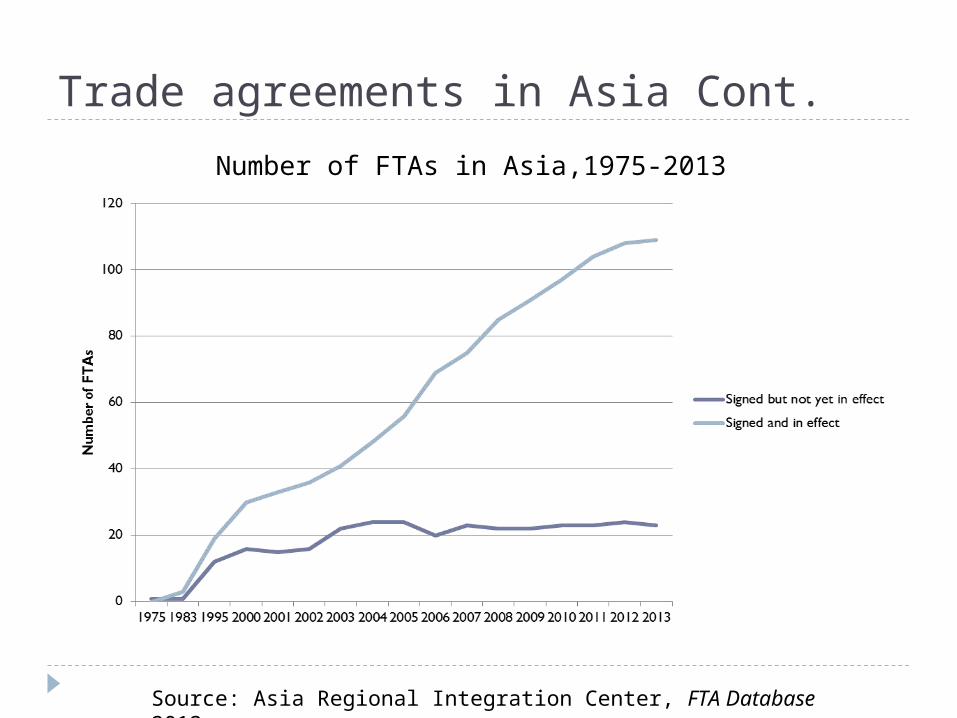
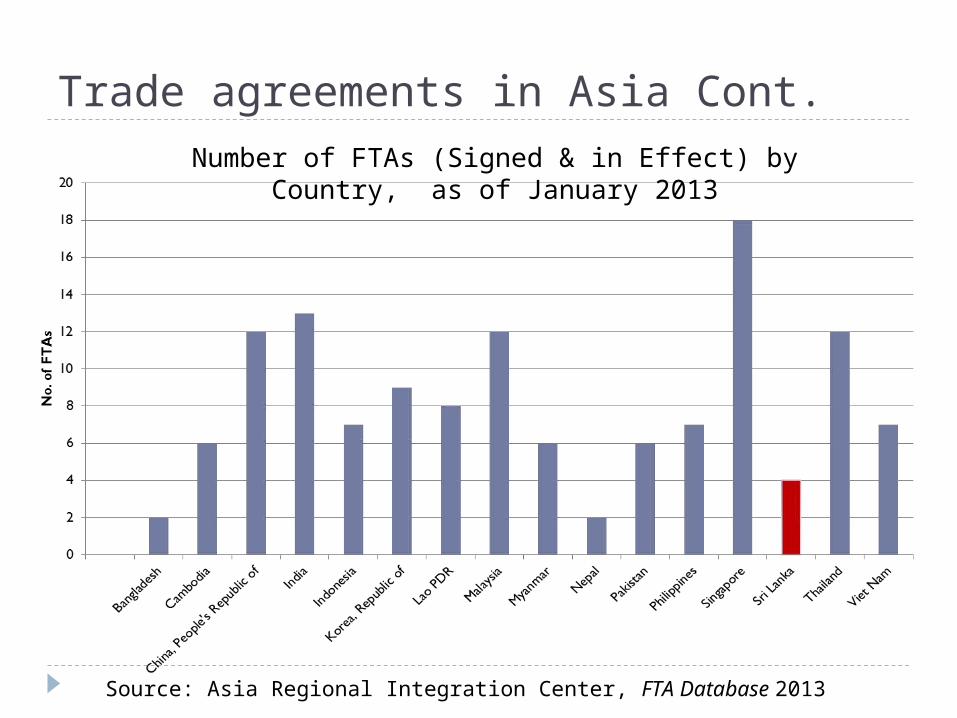
Trade agreements in Asia Cont.
Number of FTAs in Asia,1975-2013
Source: Asia Regional Integration Center, FTA Database 2013
Trade agreements in Asia Cont.
Source: Asia Regional Integration Center, FTA Database 2013
Number of FTAs (Signed & in Effect) by Country, as of January 2013
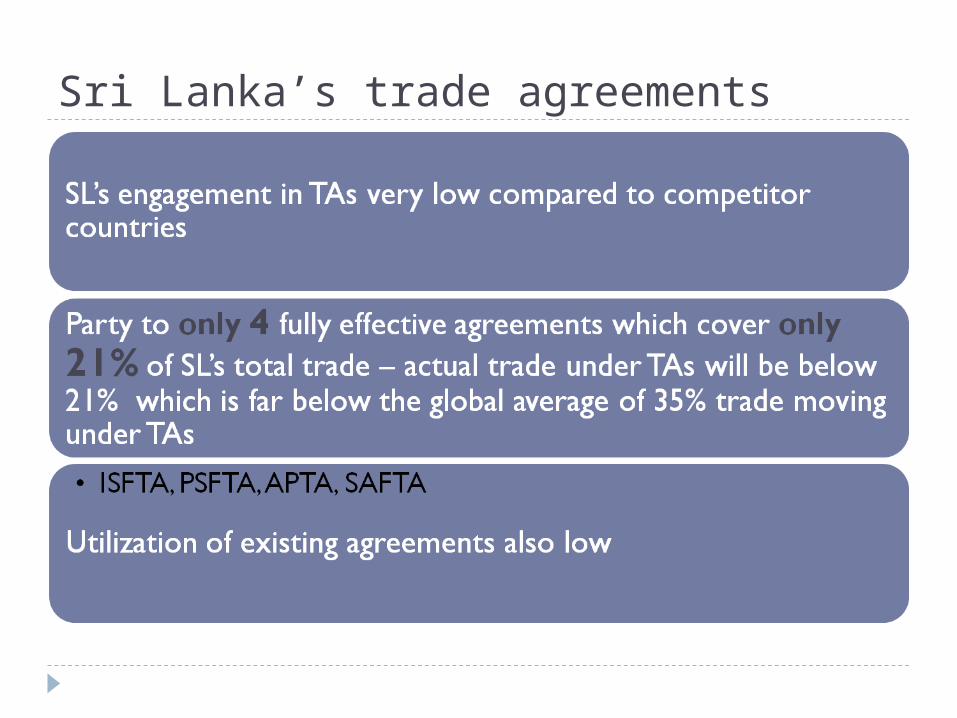
Sri Lanka’s trade agreements
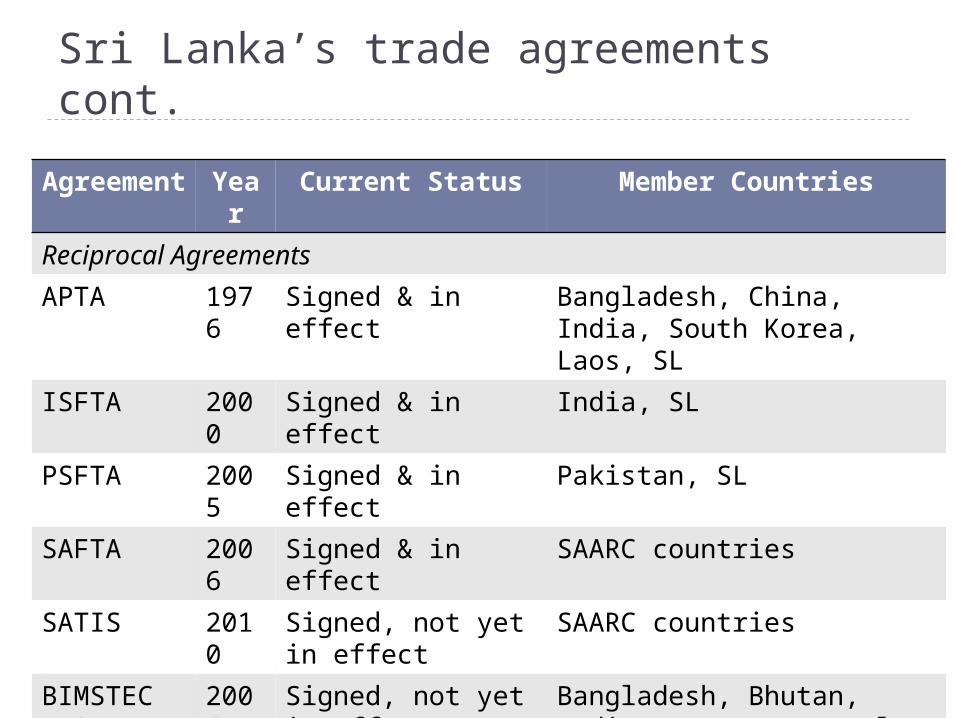
Sri Lanka’s trade agreements cont.
Agreement
Year
Current Status Member Countries
Reciprocal Agreements
APTA 1976
Signed & in effect Bangladesh, China, India, South Korea, Laos, SL
ISFTA 2000
Signed & in effect India, SL
PSFTA 2005
Signed & in effect Pakistan, SL
SAFTA 2006
Signed & in effect SAARC countries
SATIS 2010
Signed, not yet in effect
SAARC countries
BIMSTEC FTA
2004
Signed, not yet in effect
Bangladesh, Bhutan, India, Myanmar, Nepal, SL, Thailand
Iran-SL PTA
2004
Signed, not yet in effect
Iran, SL
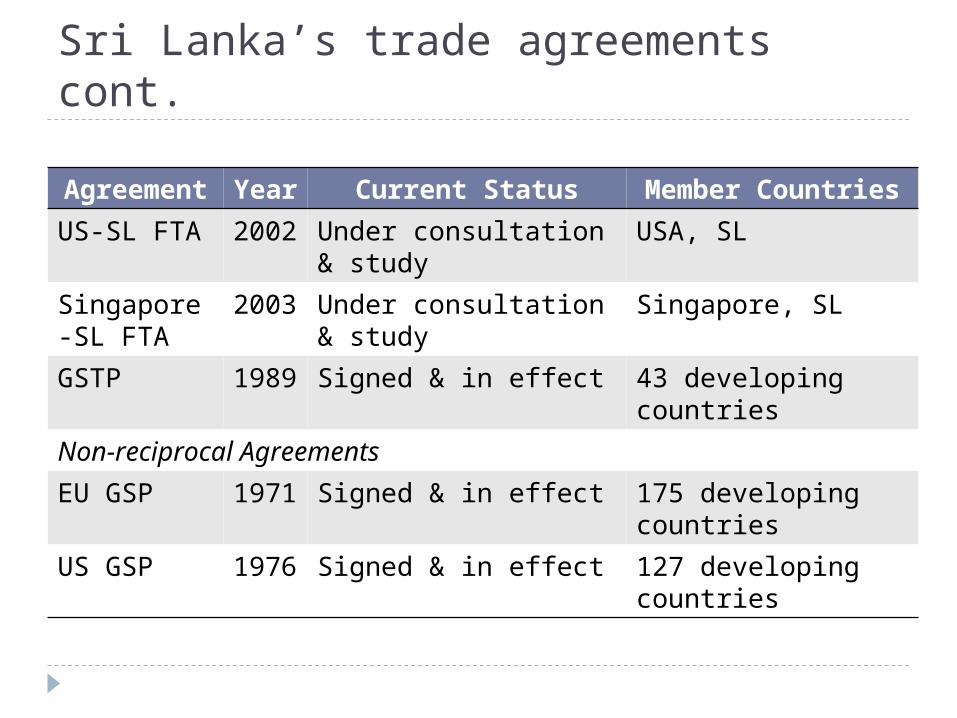
Sri Lanka’s trade agreements cont.
Agreement
Year
Current Status Member Countries
US-SL FTA 2002
Under consultation & study
USA, SL
Singapore-SL FTA
2003
Under consultation & study
Singapore, SL
GSTP 1989
Signed & in effect 43 developing countries
Non-reciprocal Agreements
EU GSP 1971
Signed & in effect 175 developing countries
US GSP 1976
Signed & in effect 127 developing countries
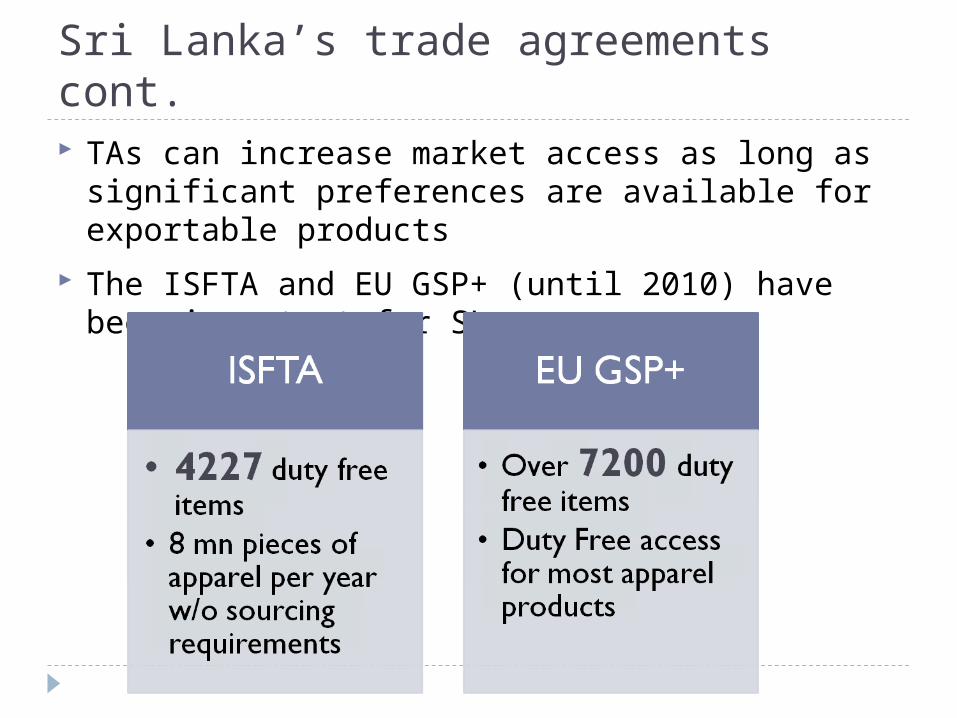
Sri Lanka’s trade agreements cont. TAs can increase market access as long as
significant preferences are available for exportable products
The ISFTA and EU GSP+ (until 2010) have been important for SL
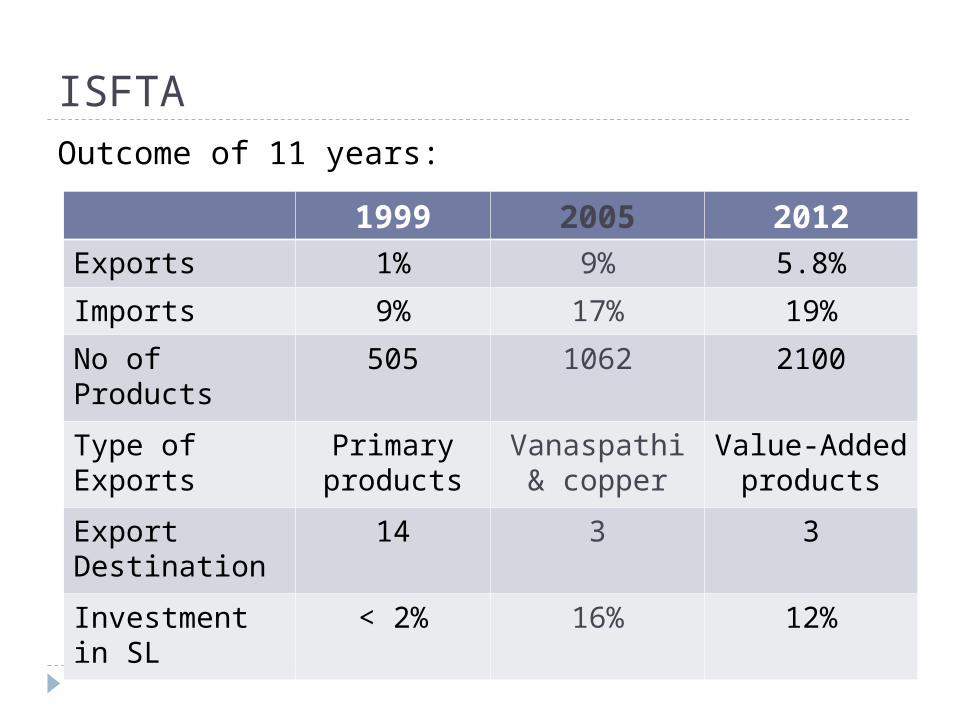
ISFTAOutcome of 11 years:
1999 2005 2012Exports 1% 9% 5.8%
Imports 9% 17% 19%
No of Products
505 1062 2100
Type of Exports
Primary products
Vanaspathi & copper
Value-Added products
Export Destination
14 3 3
Investment in SL
< 2% 16% 12%
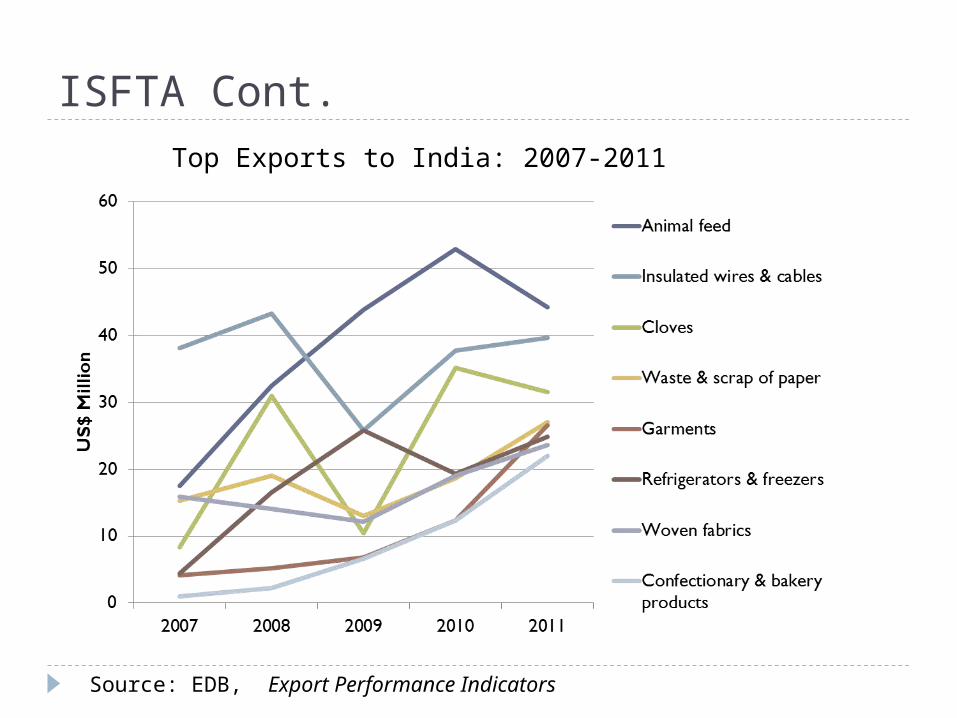
ISFTA Cont.
Source: EDB, Export Performance Indicators
Top Exports to India: 2007-2011
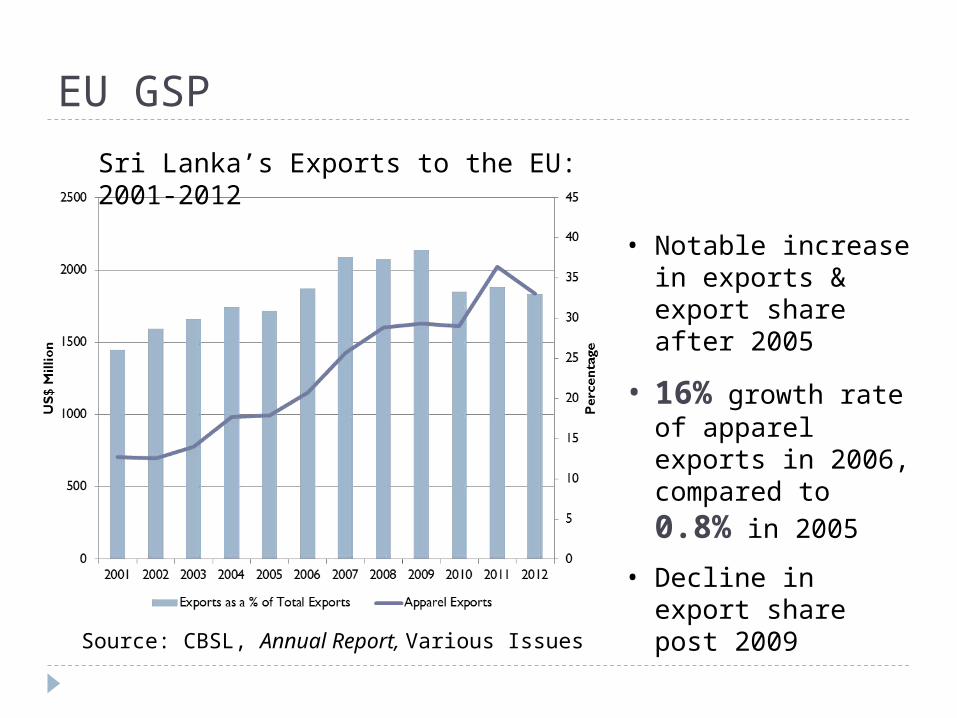
EU GSP
• Notable increase in exports & export share after 2005
• 16% growth rate of apparel exports in 2006, compared to 0.8% in 2005
• Decline in export share post 2009
Source: CBSL, Annual Report, Various Issues
Sri Lanka’s Exports to the EU: 2001-2012
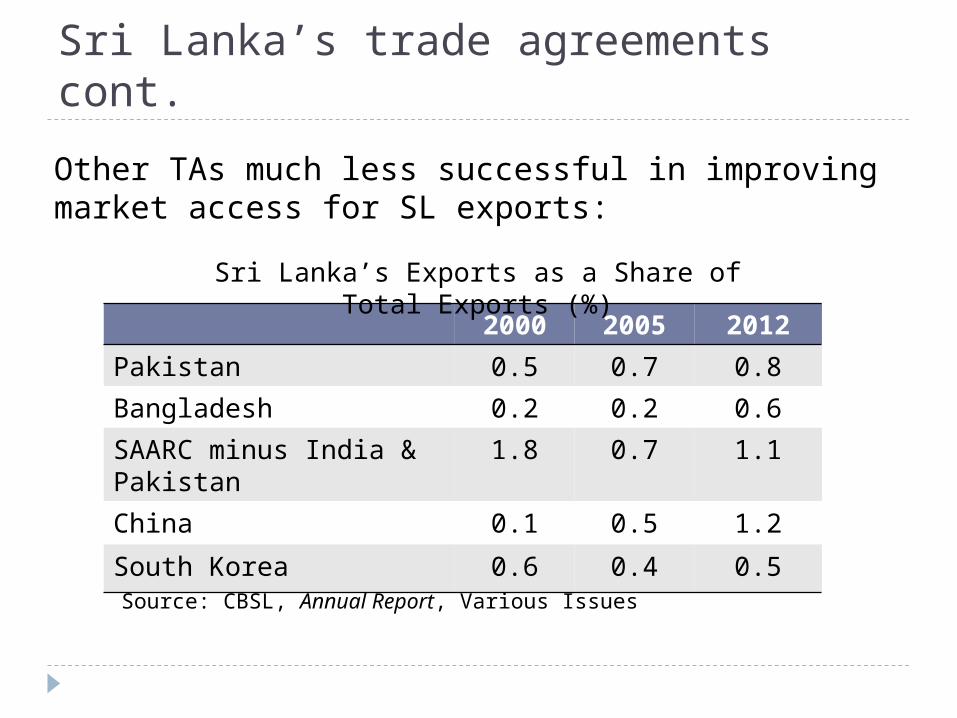
Sri Lanka’s trade agreements cont.
Other TAs much less successful in improving market access for SL exports:
2000 2005 2012
Pakistan 0.5 0.7 0.8
Bangladesh 0.2 0.2 0.6
SAARC minus India & Pakistan
1.8 0.7 1.1
China 0.1 0.5 1.2
South Korea 0.6 0.4 0.5
Sri Lanka’s Exports as a Share of Total Exports (%)
Source: CBSL, Annual Report, Various Issues
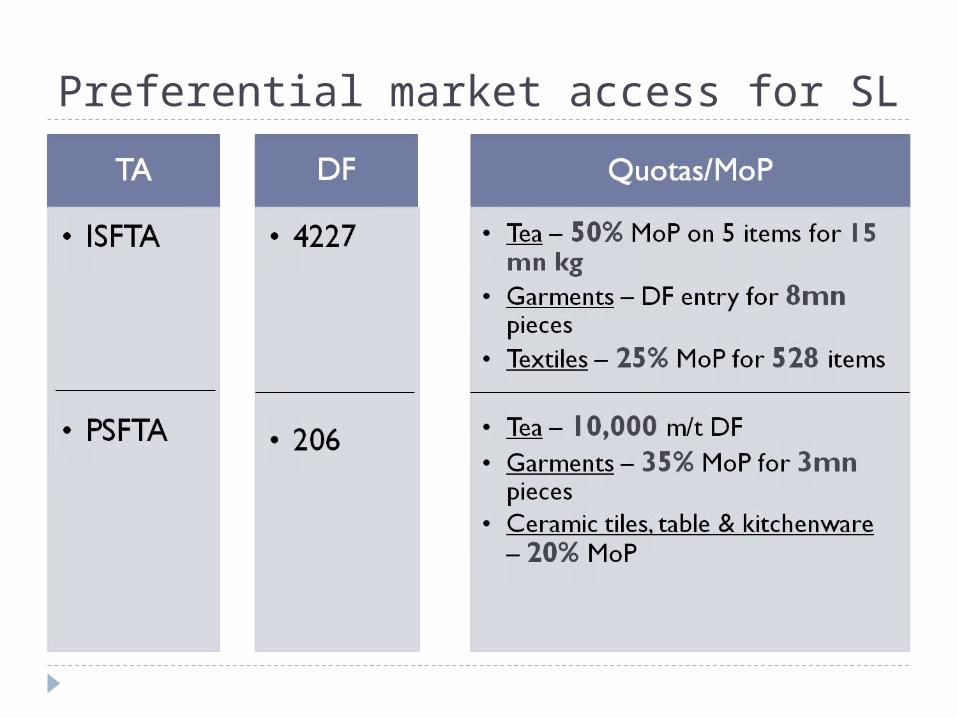
Preferential market access for SL
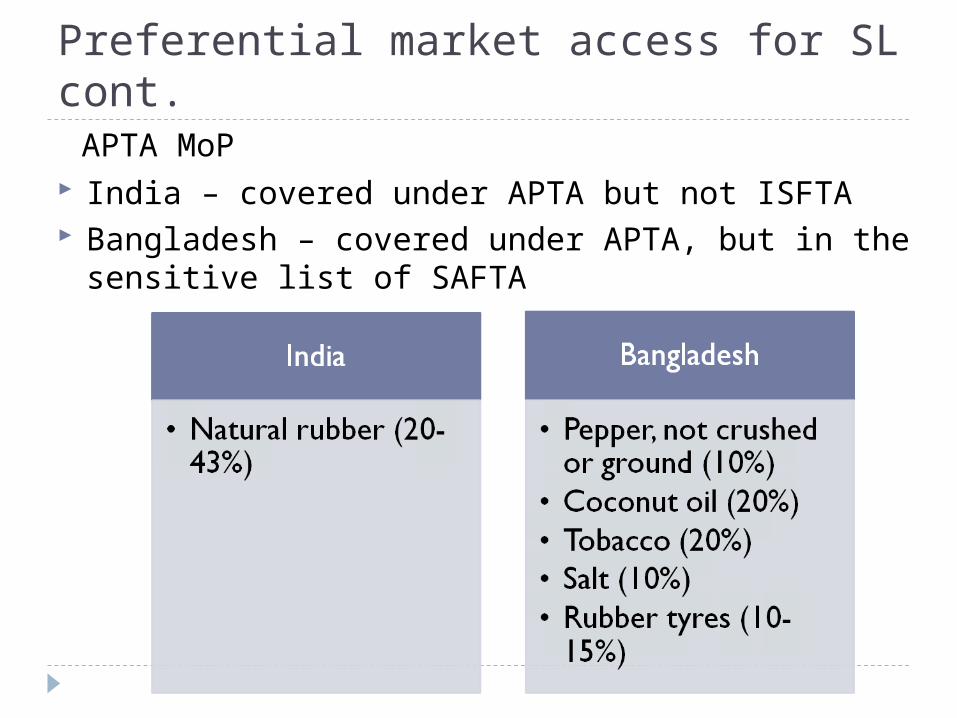
Preferential market access for SL cont.
India – covered under APTA but not ISFTA Bangladesh – covered under APTA, but in the
sensitive list of SAFTA
APTA MoP
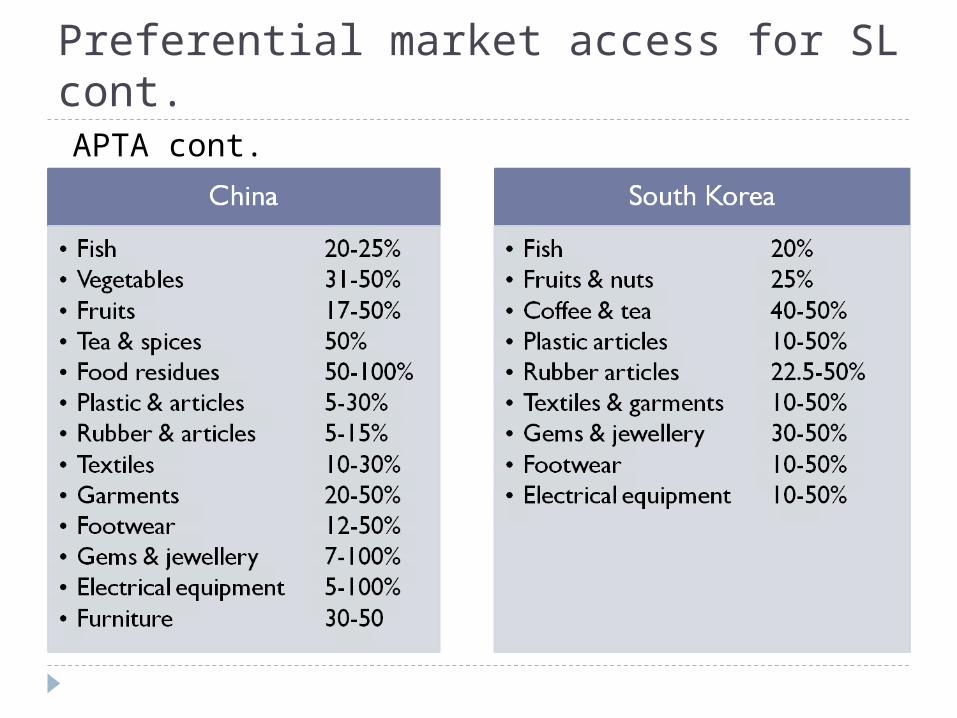
Preferential market access for SL cont.APTA cont.
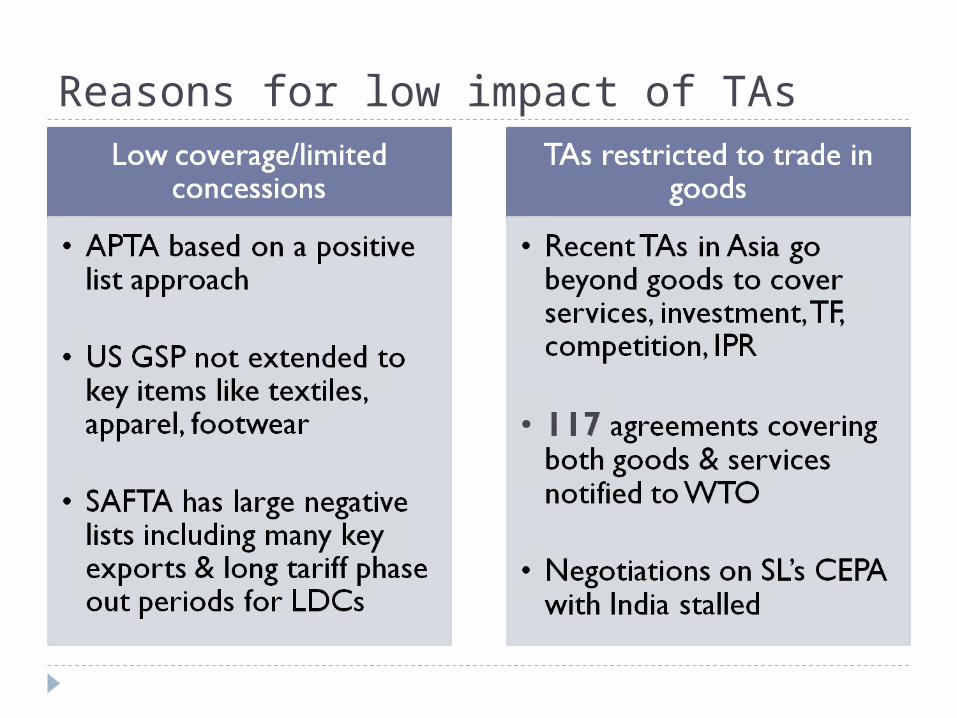
Reasons for low impact of TAs

Reasons for low impact of TAs Cont.• Non-tariff
barriers
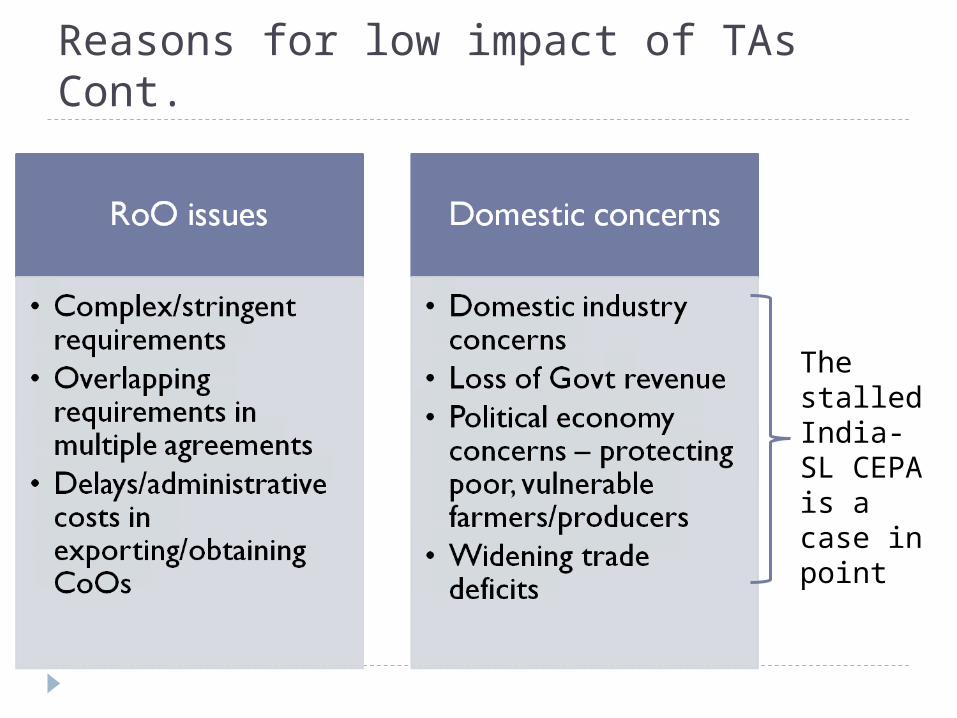
Reasons for low impact of TAs Cont.
The stalled India-SL CEPA is a case in point
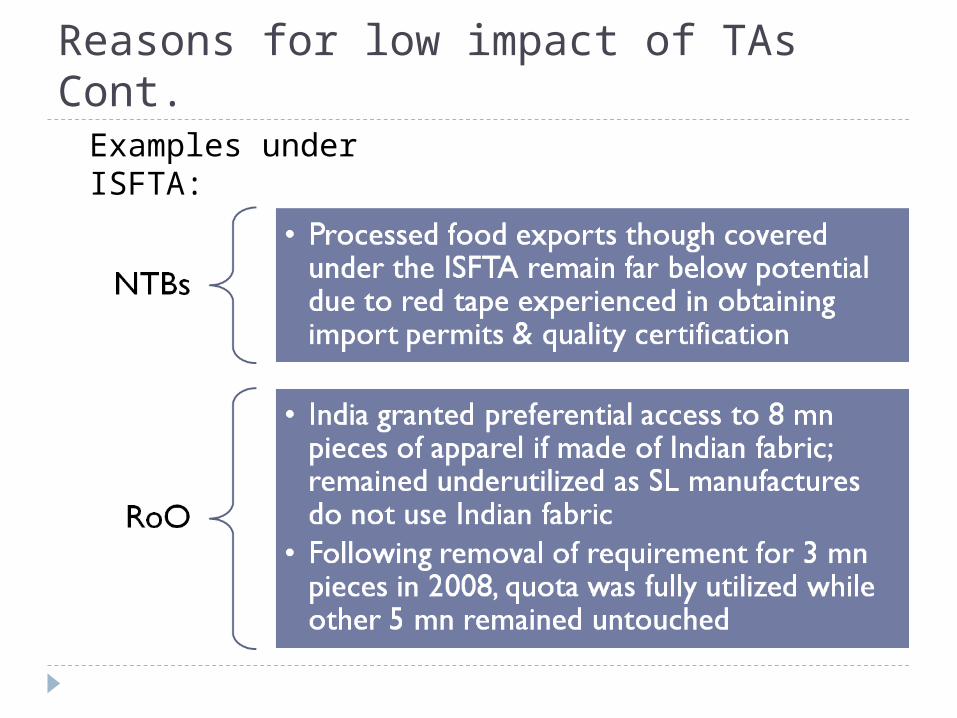
Reasons for low impact of TAs Cont.Examples under ISFTA:
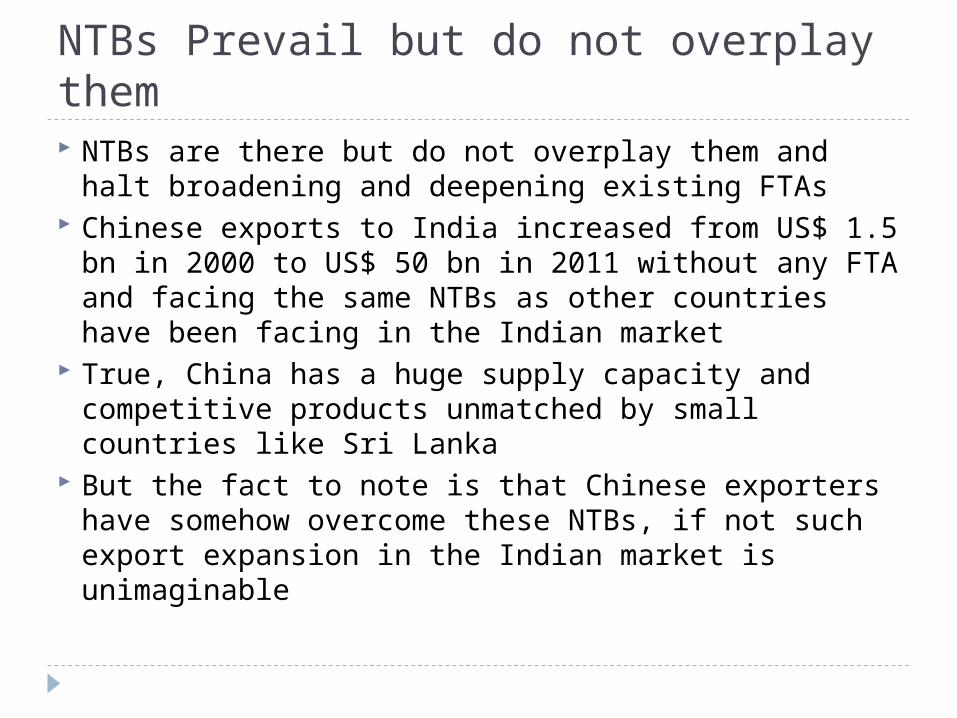
NTBs Prevail but do not overplay them NTBs are there but do not overplay them and halt
broadening and deepening existing FTAs Chinese exports to India increased from US$ 1.5
bn in 2000 to US$ 50 bn in 2011 without any FTA and facing the same NTBs as other countries have been facing in the Indian market
True, China has a huge supply capacity and competitive products unmatched by small countries like Sri Lanka
But the fact to note is that Chinese exporters have somehow overcome these NTBs, if not such export expansion in the Indian market is unimaginable
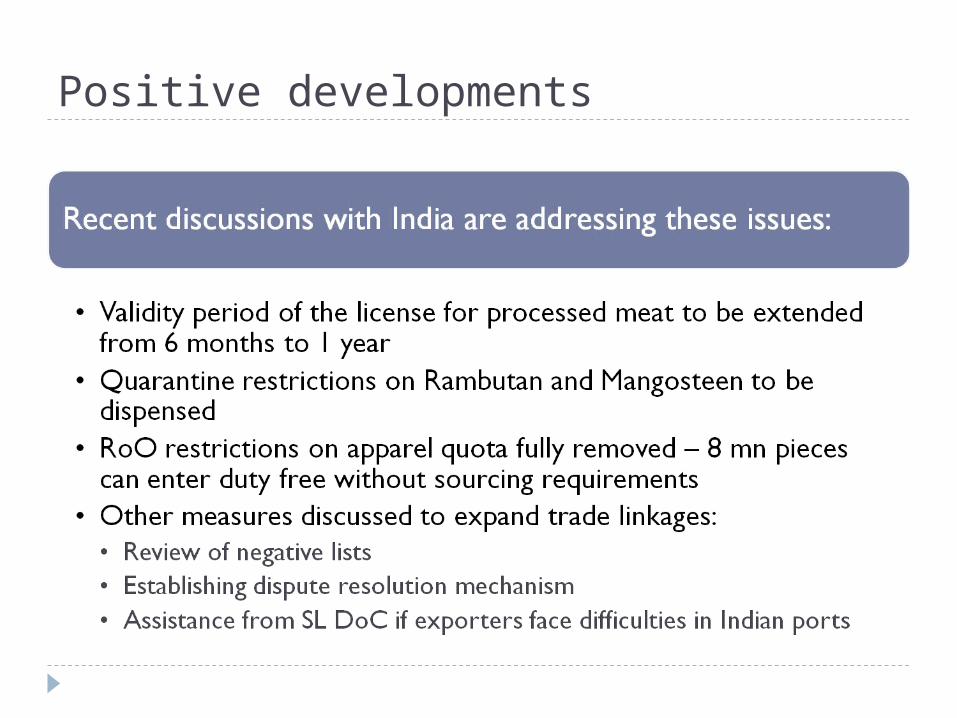
Positive developments
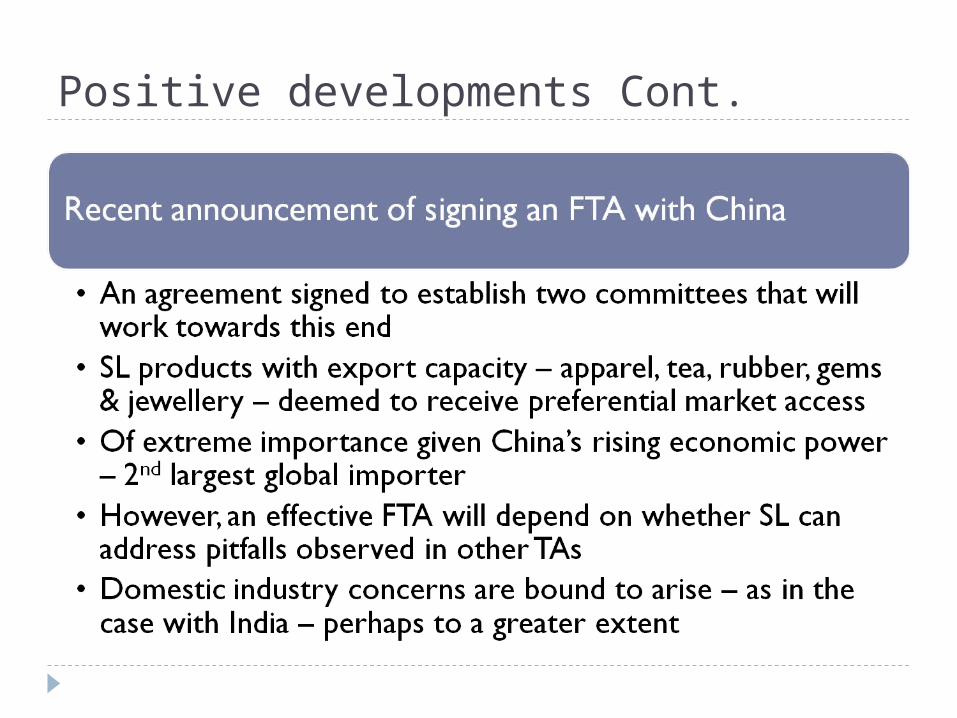
Positive developments Cont.
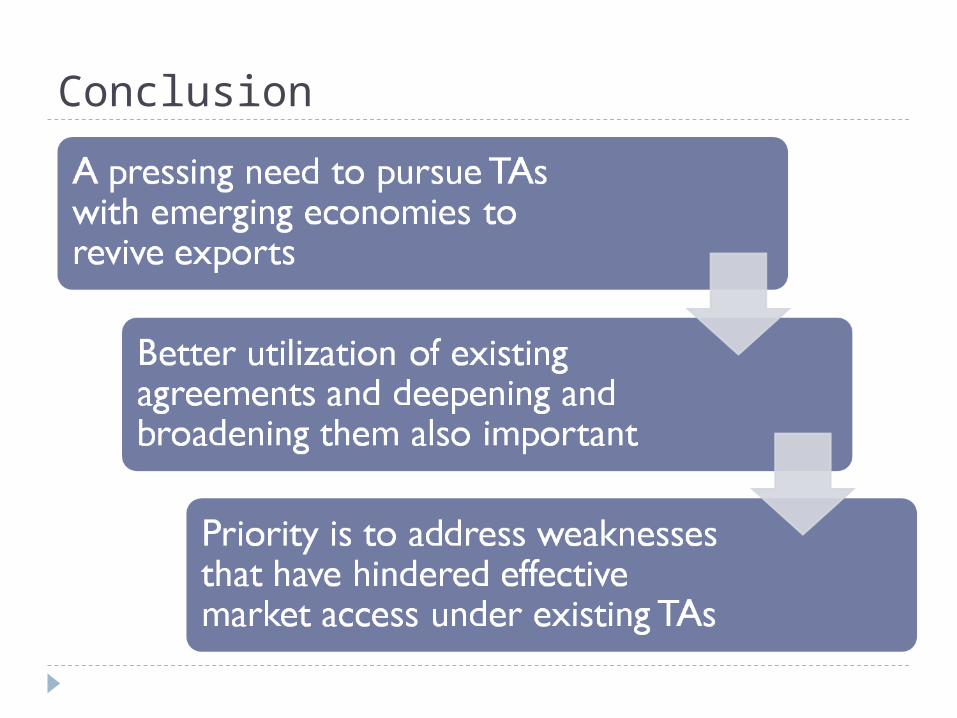
Conclusion
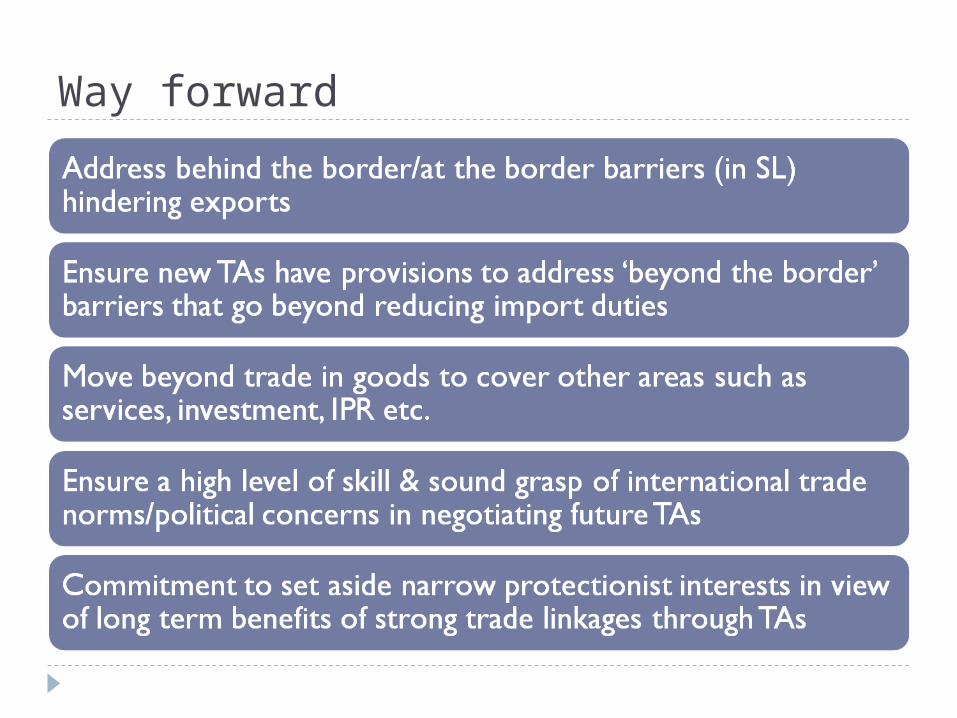
Way forward

Thank you
Recommended