TransformatioTransformationsns
of Functionsof Functions
TransformatioTransformationsns
of Functionsof FunctionsViviana C. CastellónViviana C. CastellónEast Los Angeles College East Los Angeles College
MEnTeMEnTe
Mathematics EnrichmentMathematics Enrichment
through Technologythrough Technology

Since the ln1 = 0, a goodreference point when graphing
y = lnx is (1,0)
Notice, when graphing y=lnx,the x-intercept is 1

Given the following function,
If: a > 0, then shift the graph “a” units
up, using the reference point (1,0)If: a < 0, then shift the graph “a” units
down, using the reference point (1,0)
+ln y xa

Given the following function,
Since a > 0, then shift the
graph “3” units up, using the reference point (1,0)
ln3 +y x

Let’s Graph
3 lny x

5 lny x
How will the graph look?

Let’s Graph
5 lny x

2 lny x
How will the graph look?

Let’s Graph
2 lny x

4 lny x
How will the graph look?

Let’s Graph
4 lny x

Given the following function,
We get the expression (x - b) and equal it to zero
x - b = 0x = b
If: b > 0, then shift the graph “b” units to the right, using the reference point
(1,0)If: b < 0, then shift the graph “b” units to the left, using the reference point (1,0)
lny bx

Given the following function,
x – 1 = 0x = 1
Since 1 > 0, then shift the graph “1” unit right, using the
reference point (1,0)
n 1ly x

Let’s Graph
ln 1y x

ln 6y x
How will the graph look?

Let’s Graph
ln 6y x

ln 3y x
How will the graph look?

Let’s Graph
ln 3y x

ln 7y x
How will the graph look?

Let’s Graph
ln 7y x

Graphing
3 ln 1y x
Recall: Shift “3” units up since 3 > 0then we use the expression x + 1,
and equal it to zerox + 1 = 0
x = -1Since –1 < 0, then we shift
“1” unit to the left

Let’s Graph
3 ln 1y x

2 ln 3y x
How will the graph look?

Let’s Graph
2 ln 3y x

4 ln 2y x
How will the graph look?

Let’s Graph
4 ln 2y x

1 ln 5y x
How will the graph look?
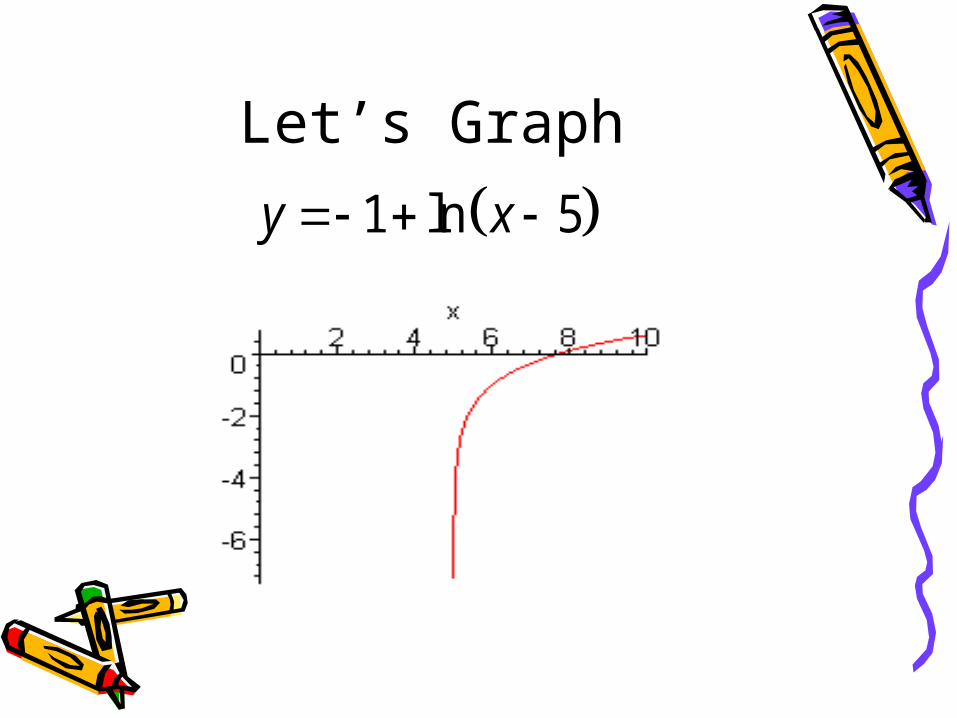
Let’s Graph
1 ln 5y x

Given the following function,
For this equation, c determines how wide or thin it will be.
if: |c|>1, then the graph is closer to the y-axisif: |c|=1, then the graph remains the same
if: 0<|c|<1, then the graph is further from the y-axis
if c is a negative number, then the graph will reflect on the x-axis
lny xc

Given the following function,
Since |5| > 0, then the
graph is closer to the y-axis
ln5y x

Let’s Graph
5 n
ln
ly x
y x

4lny x
How will the graph look?

Let’s Graph
4 n
ln
ly x
y x

1ln
2y x
How will the graph look?

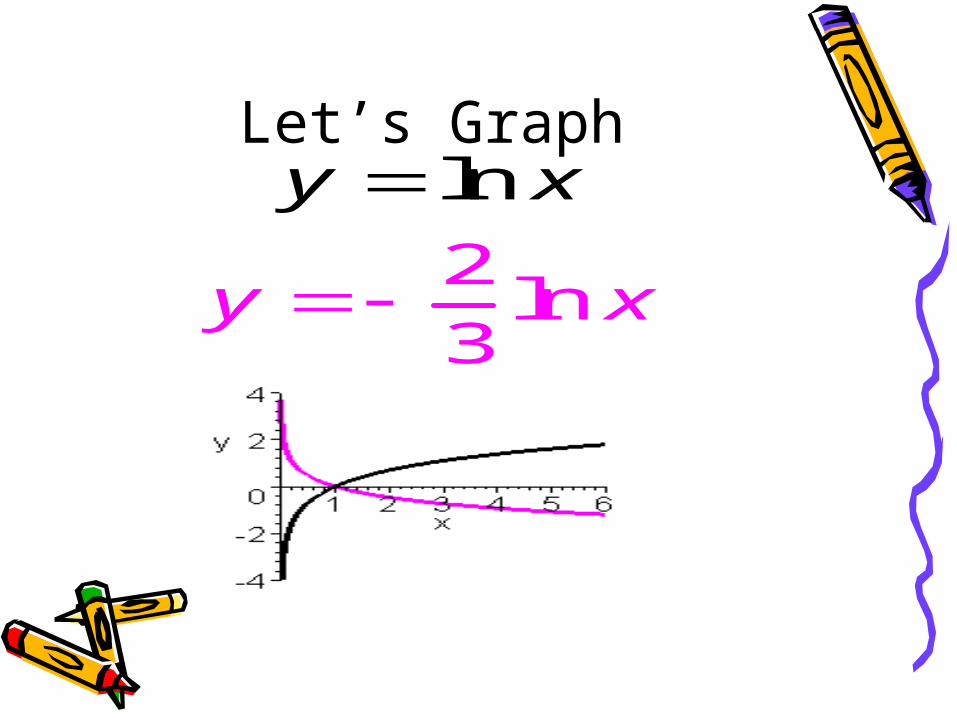
Let’s Graph
1l
ln
n2
y
y x
x

2ln
3y x
How will the graph look?
Let’s Graph
n3
ln
2ly
y x
x

5ln
4y x
How will the graph look?

Let’s Graph
5l
ln
n4
y
y x
x

Given the following function,
Since 4 > 0, shift the graph “4” units up, using the reference point (1,0)
x – 1 = 0x = 1
Since 1 > 0, then shift the graph “1” unit to the right, using the reference point (1,0).
Since |5| > 0 shift the graph closer to the y-axis.
ln4 15y x

Let’s Graph
4 5ln 1y x
2 3ln 5y x
How will the graph look?

Let’s Graph
2 3ln 5y x

3 2ln 4y x
How will the graph look?

Let’s Graph
3 2ln 4y x

16 ln 3
2y x
How will the graph look?

Let’s Graph
16 ln 3
2y x

52 ln 4
4y x
How will the graph look?

Let’s Graph
52 ln 4
4y x

94 ln 2
4y x
How will the graph look?
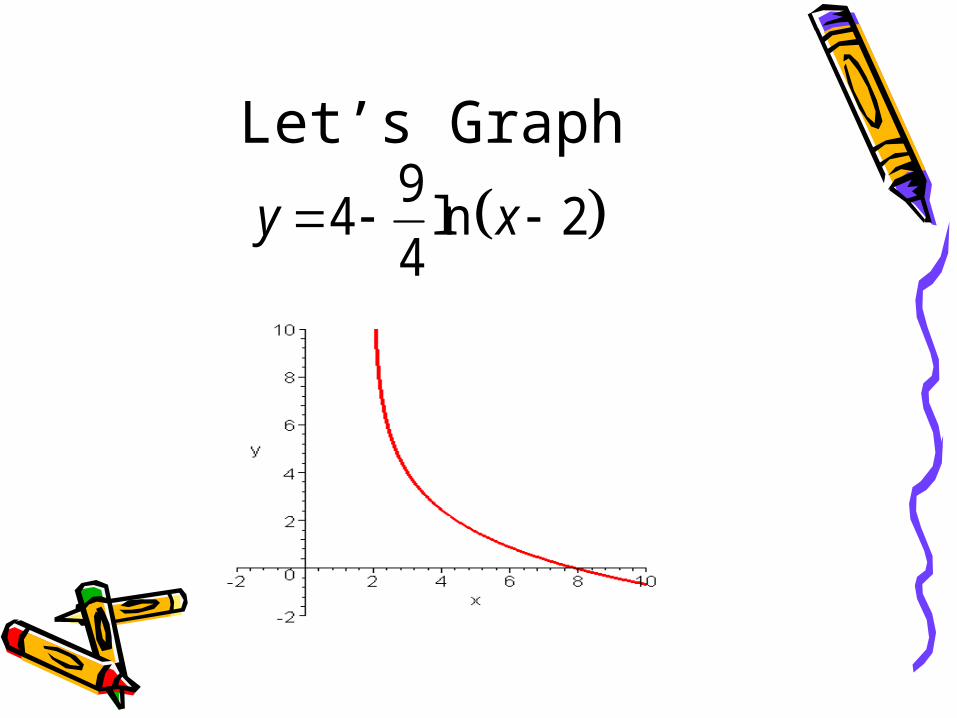
Let’s Graph
94 ln 2
4y x

23 ln 5
3y x
How will the graph look?

Let’s Graph
23 ln 5
3y x

45 ln 1
3y x
How will the graph look?

Let’s Graph
45 ln 1
3y x

Congratulations!!You just completed the
transformation of
ln( )y x
Recommended