Embed Size (px)
Citation preview
TransformatioTransformationsns
of Functionsof Functions
TransformatioTransformationsns
of Functionsof FunctionsViviana C. CastellónViviana C. CastellónEast Los Angeles College East Los Angeles College
MEnTeMEnTe
Mathematics EnrichmentMathematics Enrichment
through Technologythrough Technology

Since the ln1 = 0, a goodreference point when graphing
y = lnx is (1,0)
Notice, when graphing y=lnx,the x-intercept is 1

Given the following function,
If: a > 0, then shift the graph “a” units
up, using the reference point (1,0)If: a < 0, then shift the graph “a” units
down, using the reference point (1,0)
+ln y xa

Given the following function,
Since a > 0, then shift the
graph “3” units up, using the reference point (1,0)
ln3 +y x

Let’s Graph
3 lny x

5 lny x
How will the graph look?

Let’s Graph
5 lny x

2 lny x
How will the graph look?

Let’s Graph
2 lny x

4 lny x
How will the graph look?

Let’s Graph
4 lny x

Given the following function,
We get the expression (x - b) and equal it to zero
x - b = 0x = b
If: b > 0, then shift the graph “b” units to the right, using the reference point
(1,0)If: b < 0, then shift the graph “b” units to the left, using the reference point (1,0)
lny bx

Given the following function,
x – 1 = 0x = 1
Since 1 > 0, then shift the graph “1” unit right, using the
reference point (1,0)
n 1ly x

Let’s Graph
ln 1y x

ln 6y x
How will the graph look?

Let’s Graph
ln 6y x

ln 3y x
How will the graph look?

Let’s Graph
ln 3y x

ln 7y x
How will the graph look?

Let’s Graph
ln 7y x

Graphing
3 ln 1y x
Recall: Shift “3” units up since 3 > 0then we use the expression x + 1,
and equal it to zerox + 1 = 0
x = -1Since –1 < 0, then we shift
“1” unit to the left

Let’s Graph
3 ln 1y x

2 ln 3y x
How will the graph look?

Let’s Graph
2 ln 3y x

4 ln 2y x
How will the graph look?

Let’s Graph
4 ln 2y x

1 ln 5y x
How will the graph look?
Let’s Graph
1 ln 5y x

Given the following function,
For this equation, c determines how wide or thin it will be.
if: |c|>1, then the graph is closer to the y-axisif: |c|=1, then the graph remains the same
if: 0<|c|<1, then the graph is further from the y-axis
if c is a negative number, then the graph will reflect on the x-axis
lny xc

Given the following function,
Since |5| > 0, then the
graph is closer to the y-axis
ln5y x

Let’s Graph
5 n
ln
ly x
y x

4lny x
How will the graph look?

Let’s Graph
4 n
ln
ly x
y x

1ln
2y x
How will the graph look?

Let’s Graph
1l
ln
n2
y
y x
x

2ln
3y x
How will the graph look?
Let’s Graph
n3
ln
2ly
y x
x

5ln
4y x
How will the graph look?

Let’s Graph
5l
ln
n4
y
y x
x

Given the following function,
Since 4 > 0, shift the graph “4” units up, using the reference point (1,0)
x – 1 = 0x = 1
Since 1 > 0, then shift the graph “1” unit to the right, using the reference point (1,0).
Since |5| > 0 shift the graph closer to the y-axis.
ln4 15y x

Let’s Graph
4 5ln 1y x
2 3ln 5y x
How will the graph look?

Let’s Graph
2 3ln 5y x

3 2ln 4y x
How will the graph look?

Let’s Graph
3 2ln 4y x

16 ln 3
2y x
How will the graph look?

Let’s Graph
16 ln 3
2y x

52 ln 4
4y x
How will the graph look?

Let’s Graph
52 ln 4
4y x

94 ln 2
4y x
How will the graph look?
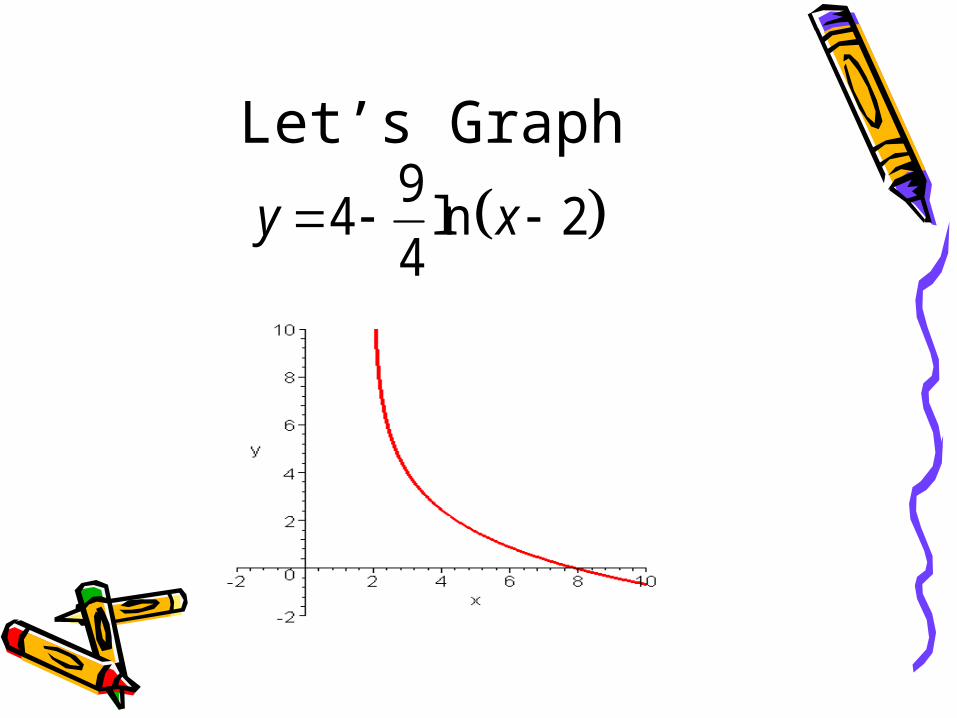
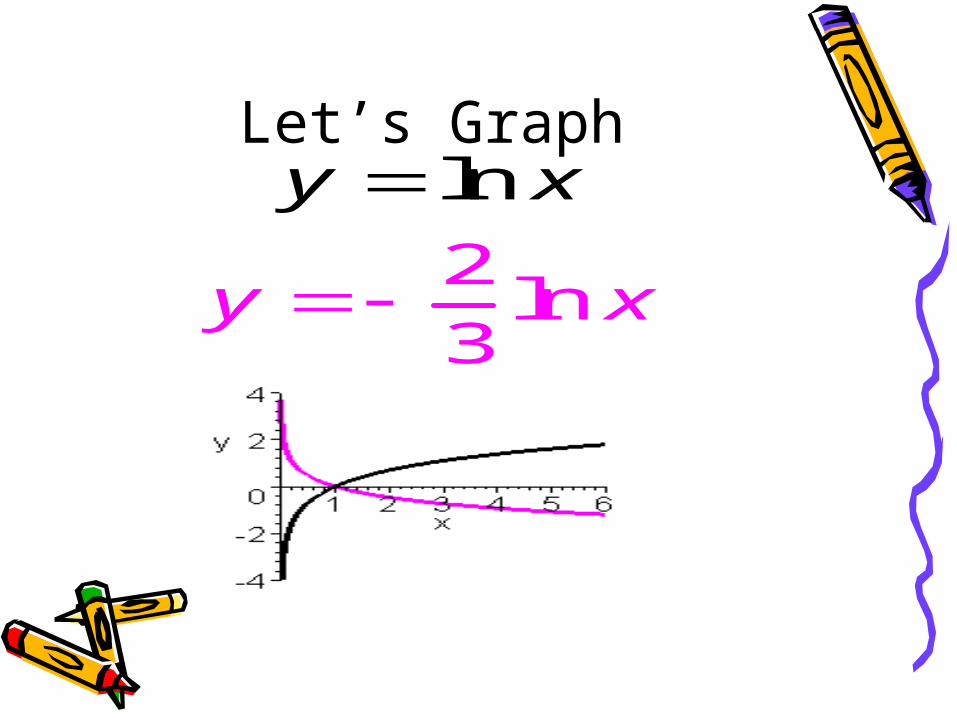
Let’s Graph
94 ln 2
4y x

23 ln 5
3y x
How will the graph look?

Let’s Graph
23 ln 5
3y x

45 ln 1
3y x
How will the graph look?

Let’s Graph
45 ln 1
3y x

Congratulations!!You just completed the
transformation of
ln( )y x