Moving forward togetherScorecards II
14th January 2021
Contents
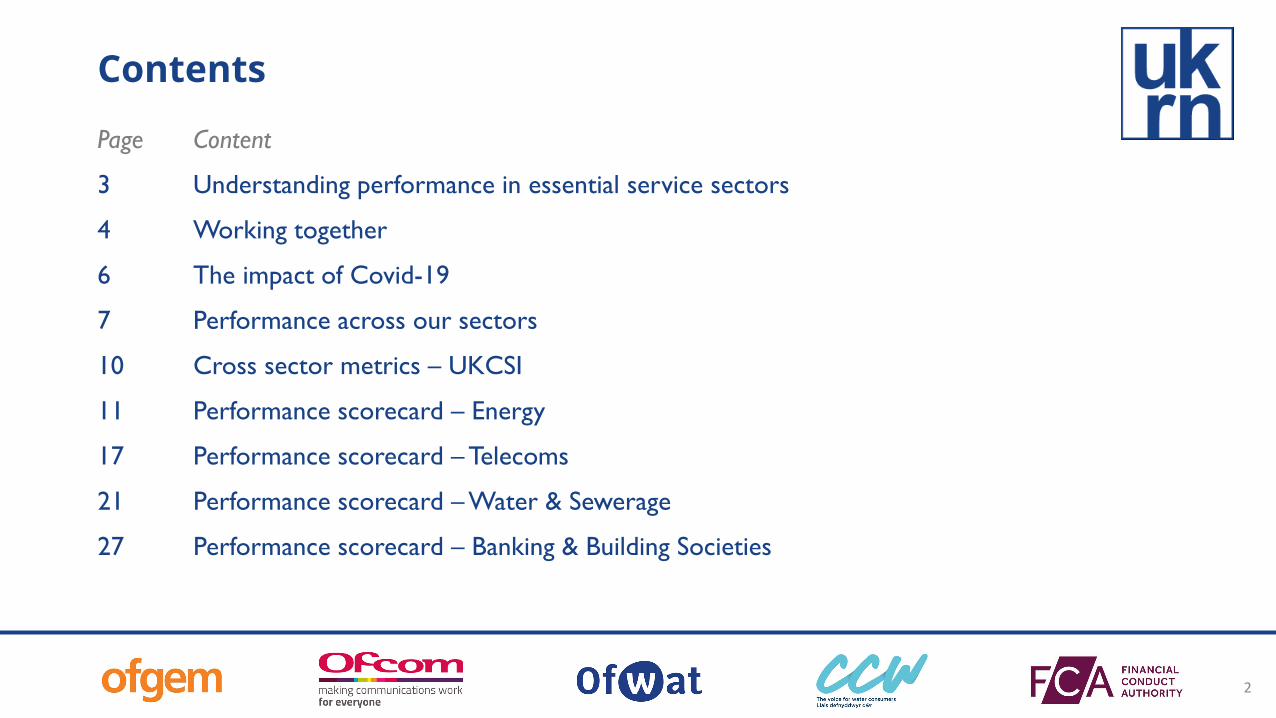
Page Content
3 Understanding performance in essential service sectors
4 Working together
6 The impact of Covid-19
7 Performance across our sectors
10 Cross sector metrics ndash UKCSI
11 Performance scorecard ndash Energy
17 Performance scorecard ndash Telecoms
21 Performance scorecard ndash Water amp Sewerage
27 Performance scorecard ndash Banking amp Building Societies
2
Understanding performance in essential service sectorsUnderstanding and monitoring the performance of the sectors we regulate is an important tool for improving consumer outcomes This document provides insight into how effectively companies in water energy telecoms and essential financial services aredelivering for their consumers Working with Ofgem Ofcom Ofwat CCW and the FCA the UK Regulators Network (UKRN) have brought together key consumer metrics covering service quality price differentials and satisfaction levels In January 2020 we published the first iteration of the performance scorecards Moving forward together
These metrics draw on the extensive research and data collected within each of these sectors providing a high level view as well as a signposting users to those more detailed metrics More information from each of the regulators and CCW on the metrics that they collect in their sector can be found by clicking on their logos below
We intend that these performance scorecards willbull Help regulators and regulated companies determine where to focus actionbull Increase the incentives for suppliers to improve performance bull Provide regulators and policymakers with indicators that will help identify and address any common challenges across
sectors
3
Working togetherCollaboration has remained at the heart of this project with regulators and UKRN working together to build a picture of the consumer experience across the sectors they regulate Collaboration has continued to play an important role in understanding the performance of and consumer experience in our sectors
Consumer Minister Paul Scully said ldquoI am very grateful to the UK Regulators Network and the regulators for compiling this second edition of performance scorecards Using performance scorecards consumers can find out which providers are likely to give them the services they need This enables companies to compete on aspects of service that really matter to their customers I will continue to work with the UK Regulators Network to support them in this work and I will encourage the further development of making this information available to consumers I look forward to this and future editions being a valuable aid to consumer decision-making and to driving healthy competitionrdquo
Rachel Fletcher CEO of UKRN said ldquoUnderstanding the experience of consumers across our sectors especially during this most challenging of years remains an important aspect of improving consumer outcomes I am very pleased at the way in which our members have continued to work together building on their extensive sectoral knowledge to create this shared insight To be able to share this cross sector information in one place for the second year is testimony to the regulatorsefforts in recognising the important role they can play I hope this project is helpful to consumer groups and other interestedparties in recognising where consumer needs can be best servedrdquo
4
Philippa Pickford Director of Retail at Ofgem said ldquoDuring COVID-19 we have worked closely with other regulators via the UKRN to share knowledge on the impacts on consumers in different sectors and the actions we took to address Covid-19 challenges We will continue this knowledge sharing and take joint action where this is possible and there are clear consumer benefits We continue to work closely with other regulators through the UKRN to further improve collaborationrdquo
Lindsey Fussell Networks and Communications Group Director from Ofcom said ldquoEnsuring people have access to clear information about the price and quality of communications services is really important These scorecards help people to easily compare how different providers perform so they can choose the right service for themrdquo
John Russell Senior Director of Strategy and Planning from Ofwat said ldquoHaving access to up to date information on the performance of regulated companies can help customers and stakeholders build their understanding of our sectors Having updated the scorecards with the latest available data I hope they will provide an accessible summary of the wide variety of performance information held across our sectorsrdquo
Emma Clancy Chief Executive of CCW said ldquoThe scorecards continue to provide an invaluable snapshot of the experiences of consumers across multiple utilities and where we need to focus our efforts in improving services for households It underlines the enormous value of regulators and consumer bodies like CCW working together particularly as we face down the immediate and long-term challenges presented by COVID-19rdquo
Sheldon Mills Executive Director Consumers and Competition from the FCA said ldquoI am pleased the FCA continues to work closely with the other UKRN regulators and has contributed to this update to the scorecards The data presented here will help consumers to make informed decisions when choosing a service provider It should also provide an incentive for firms to compete and improve their offering to deliver the best possible outcome for their customersrdquo
5
The impact of COVID-19Since the first UKRN performance scorecards were published in January 2020 the COVID-19 pandemic has had a huge impact on the way that households and individuals consume the services we regulate It has also changed the way many regulated companies have delivered their services
Here we set out the extent to which these developments may have impacted the data in our scorecards for each of our sectors
6
The information in the scorecard was collected in Q3 2020 and Q4 2020 between the COVID-19 lockdowns Compared to the same time in 2019 the total volume of complaints received by suppliers decreased Nationally overall satisfaction scores are consistent year on year while net promoter score has improved
Ofcomrsquos scorecard includes metrics (satisfaction NPS and value for money) that are based on fieldwork that took place from 2 January to 11 February 2020 prior to the Covid-19 pandemic Face to face interviews were carried out and followed up with a selection of online interviews See here for detailed methodology Value for money is only reported for mobile providers
In water fieldwork was completed between 2 September 2019 and 30 March 2020 before the effects of the COVID-19 lockdown would have been fully felt by households and therefore reflects lsquobusiness as usualrsquo views Complaints data was recorded between April 2019 and March 2020 also before the effects of the COVID-19 lockdown would have been fully felt by customers
FCA complaints data covers the first half (H1) of 2020 (1 January to 30 June 2020) Given the impact of coronavirus (COVID-19) FCA allowed firms flexibility in the submission deadlines of this data
Performance across our sectorsWithin the performance scorecards we have included a range of metrics we believe will be of interest and that will help to identify where consumers are being well-served and where performance need to improve We have summarised some of the key takeaways here around satisfaction service quality value for money and complaints However it is important to note that the metrics all use different methodology and cannot therefore be directly compared across sectors These slides also include other metrics that may help stakeholders including net promoter score (NPS) and price differentials in the energy sector
Satisfactionservice quality The level of customer satisfaction is generally high there are gaps in all sectors between the stronger performers and those in need of further improvement For example customer satisfaction levels in telecoms vary from 97 for the top performing provider in the mobile sector to a 77 satisfaction level for the lowest performer a landline provider In energy customer satisfaction levels with suppliers range between 75-80 with an average score of 76
When looking at Overall Service Quality in water and sewerage an average of 44 of customers say they would be verylikely to recommend their supplier (represented by a score of 9 or 10 on a 1-10 scale) When we look at the top performing company in this sector this increases to 71 of customers
7
For personal current accounts survey results published in August 2020 show that that the proportion of customers who are either very or extremely likely to recommend their personal current account provider to friends and family varies considerably from 86 for the highest performing provider to 44 for the lowest In Online and Mobile Banking it is 89 for the highest performing provider and 59 for the lowest
Net Promoter ScoreWe have also included the NPS in the water energy and telecom sectors NPS is calculated as the proportion of consumers who are promoters of their supplierprovider minus those who are detractors Consumers are asked On a scale of 0 to 10 how likely are you to recommended your supplierprovider to a friend family member or colleague Responses are grouped as follows Promoters (score 9-10) Passives (score 7-8) Detractors (score 0-6) The score can range from a low of -100 (if every customer is a Detractor) to a high of 100 (if every customer is a Promoter) Based on the global NPS standards any score above 0 is considered ldquogoodrdquo a score of 50 and above is considered ldquoexcellentrdquoIn water 16 of the 21 companies (76) received a positive NPS with scores ranging from an NPS of -9 to 62 (16 average NPS) In energy the average NPS is 4 meaning there are more brand advocates than detractors Medium suppliers achieved the highest score (11) followed by small suppliers (6) and large suppliers (3) In telecoms of the suppliers listed the range in NPSis -5 to 52 The supplier with an NPS of 62 in water is the highest NPS seen across the 3 sectors
Sector Water Energy(LargeMediumSmall)
TelecomsLandline
Telecoms Broadband
Telecoms Mobile
Average NPS 16 4 12 12 25
8
Value for moneyThe scorecards also capture some metrics on perceptions of value for money These include perceptions of the value for money among mobile customers where between 84 and 97 of customers are satisfied with the value for money they receive from their supplier For water the range is between 65 and 85 of customers who believe they get good value for money and for sewerage it is between 66 and 84
ComplaintsComplaints are not comparable across sectors because of the different ways complaints processes are structured and information is collected and reported to the regulatorsIn energy the complaints are reported by suppliers for large and medium size (per 100000 accounts) and smaller suppliers (per 10000 accounts) The number of complaints varies between 2297 to 0147 for large and medium suppliers to 229 to 006 for the smaller suppliers In water written complaints are reported per 10000 properties and the average percentage of complaints is less than 1 (022) across the 21 water companies in the scorecard with the highest figure being 058 In telecoms people typically raise their complaint with their provider in the first instance and to an Alternative Dispute Resolution (ADR) scheme if these arenrsquot resolved Some consumers choose to complain to Ofcom and Ofcom report on these complaints To compare the performance of providers all complaint volumes are displayed per 100000 customers The figures across mobile landline and broadband are also all below 1 with the highest figure being 0115 In banking firms report to the regulator complaints opened per 1000 accounts In the latest figures reported the highest complaints recorded the total was 13
9
Cross-sector metrics - UKCSIIn addition to the detailed metrics from each individual sector we have also included the sector scores from the UKCSI survey published by The Institute of Customer Service UKCSI is a national benchmark of customer satisfaction published twice a year The sector scores provide a high level view of how each sector performs based on five dimensions experiences with the organisations complaint handling and perceptions of an organisationrsquos customer ethos emotional connection and ethical behaviour
UKCSI scores are expressed as an index score out of 100 UKCSI covers 13 sectors and is based on 45000 responses 259 named organisations received a UKCSI rating in the July 2020 survey Each UKCSI incorporates two sets of data to create a rolling measure of customer satisfaction The July 2020 UKCSI includes responses from surveys conducted between 10 September to 7 October 2019 and 16 March to 13 April 2020 Further information about The Institute of Customer Service can be found here
Sector UKCSI score ExperienceComplaint handling
Customer Ethos
Emotional Connection
Ethics
UKCSI (13 sectors) average 77 78 588 765 762 752
Banks amp Building Societies 791 805 62 782 782 771
Telecoms amp Media 742 755 576 735 725 72
Energy 717 733 487 706 695 692
Water 74 752 598 732 732 721
10
v
Performance scorecard
Energy
11
v
Changes in the retail energy market in 2020
Change in definitionsIn Q3 2020 Ofgem revised its definition of small medium and large energy suppliers Definitions are now based on market share rather than historic footprint The category lsquolargersquo refers to those suppliers whose market share exceeds 5 in at least one fuel lsquomediumrsquo is for those exceeding 1 in at least one fuel but remaining below 5 in both fuels and lsquosmallrsquo for suppliers with market share below 1 in both fuels
Consolidation of suppliersIn 2020 the number of energy suppliers operating in the energy market in Great Britain fell due to market exits and brand acquisitions This means that the brand list in the current scorecard is different from that shown in the previous one
Default tariff price capThe level of the default tariff price gap in October 2020 is lower compared to this time a year ago
12
v
1 Satisfied with their supplier overall is the proportion of domestic energy consumers who are satisfied or very satisfied with their energy supplier overall This data comes from the quarterly lsquoConsumer Perceptions of the Energy Market Surveyrsquo commissioned by Ofgem in conjunction with Citizens Advice Data was collected in Q3 2020
2 Net Promoter Score is calculated as the proportion of domestic energy consumers who are promoters of their energy supplier minus those who are detractors Consumers are asked On a scale of 0 to 10 how likely are you to recommended your energy company to a friend of colleague Responses are grouped as follows Promoters (score 9-10) Passives (score 7-8) Detractors (score 0-6) Data comes from the quarterly lsquoConsumer Perceptions of the Energy Market Survey commissioned by Ofgem in conjunction with Citizens Advice Data was collected in Q4 2020
How are suppliers groupedAs at June 2020 56 licensed domestic suppliers were active in the retail energy market Ofgem groups them as follows
bull Large suppliers Bulb British Gas EON EDF Energy npower Octopus Scottish Power SSE Ovobull Medium suppliers Avro Energy Green Network Energy Shell Energy Utility Warehouse Utilitabull Small suppliers all other suppliers
As of Q2 2020 the large suppliers together accounted for around 83 of the market the medium suppliers together accounted for 10 of the market and small suppliers accounted for 7 of the electricity market You can access supplier market share data on the Ofgem data portal
Customer satisfaction and likelihood to recommend
13
v
3 A Standard Variable Tariff (SVT) is a supply contract with an indefinite length that does not have a fixed-term applying to the terms and conditions Itrsquos an energy supplierrsquos basic offer If a customer does not choose a specific energy plan for example after their fixed tariff ends they are moved to an SVT until they choose a new one A customer can also make an active choice to select an SVT Tariffs are calculated for a typical dual fuel customer paying by direct debit This is a customer who takes gas and electricity from the same supplier and consumes 12000kWhyear for gas and 2900kWhyear for electricity
4 Ofgem uses weekly prices across the relevant quarter to calculate the average SVT price and the average cheapest tariff price for each supplier as well as the average market cheapest tariff price When calculating the cheapest tariff at both individual supplier and market level Ofgem excludes tariffs restricted to certain regions This is to give a representative picture of tariffs generally available to all customers across Great Britain When calculating the cheapest tariff at individual supplier level tariffs only available to existing customers (also known as lsquoretention tariffs) are included Tariffs only available to new customers (also known as lsquoacquisitionrsquo tariffs) are excluded
This information is available and regularly updated on Ofgems data portal
Energy prices September 2020For a typical dual fuel customer paying by direct debit
The relevant default tariff cap during this period was pound 1127 Visit Ofgemrsquos website to learn more about the default tariff price cap The cheapest in market was pound790
Large and medium suppliers
14
v
Complaints data refers to complaints directly received by suppliers This information is available and regularly updated on Ofgems data portal
Customer complaints Q3 2020
Large and medium suppliers
15
v
Note as many small suppliers have fewer than 100000 (one hundred thousand) customers complaints data is reported as number of complaints per 10000 (ten thousand) customersComplaints data refers to complaints directly received by suppliers This information is available and regularly updated on Ofgems data portal
Energy provider Igloo Energy Nabuh Energy Orbit Energy PFP Pure Planet SimplicityEnergy So Energy
Number of complaints received per 10K gas and electricity accounts 30 373 229 37 80 24 30
Energy provider Social Energy TogetherEnergy Utility Point Yorkshire
Energy Zog Energy Zebra Power
Number of complaints received per 10K gas and electricity accounts 184 195 29 112 11 7
Energy provider Affect Energy Bristol Energy Daligas E ESB Energy Ecotricity Entice Energy
Number of complaints received per 10K gas and electricity accounts 65 163 27 87 31 114 33
Energy provider EnstrogaEnergy Foxglove Good Energy Green Green Energy
UK GoTo Energy Gulf Gas ampPower
Number of complaints received per 10K gas and electricity accounts 154 17 97 12 6 19 40
Selection of small suppliers
Customer complaints Q3 2020
16
v v
Performance scorecard
Telecoms
17
v v
1 Source Ofcom Customer Satisfaction Tracker 2020 2 Source Ofcom CCT data Notes All figures are rounded to the nearest whole number the overall average relates only to the providers included in the analysis Annualised for 2019 Visit Ofcomrsquos website to see
the latest quarterly telecoms complaints data 3 Source Ofcom Customer Satisfaction Tracker 2020 Notes the industry average relates only to the providers included in the analysis Satisfaction with value for money data only asked among those with a
standalone service so does not include those who purchase their mobile service as part of a bundle No data for satisfaction with value for money for BT and Virgin Mobile due to insufficient base size
Mobile providersOverallaverage
Satisfaction1 93 NA 93 95 NA 93 NA 97 89 93 90
NPS1 25 NA 17 52 NA 30 NA 44 10 26 27
Complaints to Ofcomper 100k subscribers2 13 21 7 NA 10 9 11 3 15 27 26
Satisfaction with value for money3 87 NA 84 96 NA 87 NA 97 87 NA 83
significantly higher or lower than previous year at the 99 confidence level for market research results
X
significantly higher or lower than the overall sector average at the 95 confidence level for market research results
X
significantly higher or lower than the overall sector average at the 95 confidence level for market research results
18
v v
Broadband providers Overallaverage
Satisfaction1 85 86 88 NA 93 NA 86 78 85 NA
NPS1 12 12 17 NA 15 NA 9 -5 19 NA
Complaints to Ofcomper 100k subscribers2 52 50 22 NA 100 37 21 87 60 115
Landline providers
Satisfaction1 85 90 82 NA 83 NA 88 83 77 NA
NPS1 12 19 11 NA 27 NA 10 9 5 NA
Complaints to Ofcomper 100k subscribers2 38 31 17 NA 78 34 18 69 49 65
1 Source Ofcom Customer Satisfaction Tracker 2020 Note the overall average relates only to the providers included in the analysis (inclusion criteria providers with a 4 more market share) No data for KCOM or Post Office due to not meeting the inclusion criteria for this study
2 Source Ofcom CCT data Notes All figures are rounded to the nearest whole number the overall average relates only to the providers included in the analysis Annualised for 2019 Visit Ofcomrsquos website to see the latest quarterly telecoms complaints data Note Satisfaction with value for money data is not available for landline and broadband because the question was only asked among those with a standalone service
significantly higher or lower than previous year at the 99 confidence level for market research results
X
significantly higher or lower than the overall sector average at the 95 confidence level for market research results
X
significantly higher or lower than the overall sector average at the 95 confidence level for market research results
19
v v
Notes Based on September 2019 pricing information Ofcom monitors and reports separately on the extent to which broadband providers differentiate their prices for different groups of customers The latest broadband pricing data we have can be found atPricing trends in communication services 2019 Helping consumers get better deals A review of pricing practices in fixed broadband and Affordability of communications services A summary of initial findings
Monitoring headline customer outcomes
20
v v
Performance scorecard
Water and sewage
21
v v
Water Company Affinity Water Anglian Bournemouth Bristol Cambridge Dwr Cymru Essex amp Suffolk
Likelihood to Recommend 35 40 49 48 41 53 41
Likelihood to RecommendCustomers were asked how likely they would be to recommend their water company (0-10 scale)Percentage who scored their provider with 9 or 10 ratingrsquo shown
Latest Results - August 2020
Water Company HafrenDyfrdwy Hartlepool Northumbrian Portsmouth Severn Trent South East South
Staffordshire
Likelihood to Recommend 44 71 56 50 45 33 48
Water Company South West Southern Sutton amp East Surrey Thames United
Utilities Wessex Yorkshire
Likelihood to Recommend 30 29 34 25 44 51 50
22
v v
Water Company Affinity Water Anglian Bournemouth Bristol Cambridge Dwr Cymru Essex amp
Suffolk
Satisfaction with Service Water 90 88 94 94 96 94 91
Satisfaction with Service Sewage 87 85 89 92 87 85 87
Satisfaction Water (W) amp Sewerage (S)Customers were asked lsquowhen thinking about satisfaction with water services and satisfaction with sewerage services how satisfied or dissatisfied are with your servicersquo (0-5 scale) -Percentage who scored their provider with a 4 or 5 ratingrsquo shown
Water Company HafrenDyfrdwy Hartlepool Northumbrian Portsmouth Severn Trent South East South
Staffordshire
Satisfaction with Service Water 92 93 93 96 94 86 93
Satisfaction with Service Sewage 89 89 91 80 91 80 90
Water Company South West Southern Sutton amp East Surrey Thames United
Utilities Wessex Yorkshire
Satisfaction with Service Water 93 89 95 87 93 93 94
Satisfaction with Service Sewage 85 83 82 79 87 93 90
23
v v
Water Company Affinity Water Anglian Bournemouth Bristol Cambridge Dwr Cymru Essex amp Suffolk
Net Promoter Score NA 18 33 29 17 38 19
Net Promoter Score (NPS)Respondents are grouped as follows-Promoters (score 9-10) are loyal enthusiasts -Passives (score 7-8) are satisfied but unenthusiastic customers -Detractors (score 0-6) are unhappy customers
Latest Results - August 2020
Water Company HafrenDyfrdwy Hartlepool Northumbrian Portsmouth Severn Trent South East South
Staffordshire
Net Promoter Score 37 62 22 35 -6 -1 24
Water Company South West Southern Sutton amp East Surrey Thames United
Utilities Wessex Yorkshire
Net Promoter Score -4 -9 7 21 33 33 23
The NPS is calculated by subtracting the of Detractors from the of Promoters
24
v v
Water Company Affinity Water Anglian Bournemouth Bristol Cambridge Dwr Cymru Essex amp Suffolk
Value For Money Water 77 74 85 80 78 77 76
Value For Money Sewage 78 75 83 83 79 79 74
Value For Money (VFM) Water (W) amp Sewerage (S)Customers were asked lsquowhen thinking about value for money how satisfied or dissatisfied are you with the VFM of your servicersquo (0-5 scale) - Percentage who scored their provider with a 4 or 5 ratingrsquo shown
Water Company HafrenDyfrdwy Hartlepool Northumbrian Portsmouth Severn Trent South East South
Staffordshire
Value For Money Water 77 82 79 77 78 70 76
Value For Money Sewage 81 84 84 65 80 69 75
Water Company South West Southern Sutton amp East Surrey Thames United
Utilities Wessex Yorkshire
Value For Money Water 65 67 75 75 76 79 79
Value For Money Sewage 66 74 76 75 79 83 80
25
v v
Water Company Affinity Water Anglian Bournemouth Bristol Cambridge Dwr Cymru Essex amp Suffolk
Complaints ndash Writtenper 10000 Properties 156 247 101 172 273 146 316
Complaints ndash Written per 10000 PropertiesLatest Results - September 2020
Water Company HafrenDyfrdwy Hartlepool Northumbrian Portsmouth Severn Trent South East South
Staffordshire
Complaints ndash Writtenper 10000 Properties 345 206 314 109 225 13 168
Water Company South West Southern Sutton amp East Surrey Thames United
Utilities Wessex Yorkshire
Complaints ndash Writtenper 10000 Properties 19 278 113 583 182 118 176
26
v
Performance scorecard
Personal Current Accounts
27
v
BankBuilding Society Monzo Starling Bank First Direct Metro Bank Nationwide Barclays Halifax
Overall Service Quality 86 84 83 81 71 62 62
Overall Service QualityCustomers were asked how likely they would be to recommend their provider to friends and family1
Latest results published in August 2020
These results show the proportion of customers of each provider who said they were lsquoextremely likelyrsquo or lsquovery likelyrsquo to recommend each service1
Access to the full Ipsos Mori Banking metrics surveys published every six months is available here
BankBuilding Society Santander Lloyds Bank Virgin Money HSBC NatWest Bank of
Scotland
Overall Service Quality 61 60 60 59 58 58
Current Account Service QualityBased on the 19 largest personal current account providers in Great Britain
BankBuilding Society
The Co-operative Bank Yorkshire Bank TSB Clydesdale Bank Royal Bank of
Scotland Tesco Bank
Overall Service Quality 57 56 51 51 46 44
28
v
BankBuilding Society Monzo Starling Bank Metro Bank First Direct Nationwide Barclays Halifax
Overall Service Quality 89 88 85 83 81 81 81
Online and Mobile Banking ServicesCustomers were asked how likely they would be to recommend their providerrsquos online and mobile banking services to friends andfamily1
Latest results published in August 2020
These results show the proportion of customers of each provider who said they were lsquoextremely likelyrsquo or lsquovery likelyrsquo to recommend each service1
Access to the full Ipsos Mori Banking metrics surveys published every six months is available here
BankBuilding Society Lloyds Bank Bank of
Scotland Santander NatWest Virgin Money HSBC
Overall Service Quality 78 77 76 75 75 72
Current Account Service QualityBased on the 19 largest personal current account providers in Great Britain
BankBuilding Society Yorkshire Bank Royal Bank of
ScotlandThe Co-
operative Bank Clydesdale Bank TSB Tesco Bank
Overall Service Quality 71 71 67 66 65 59
29
v
Firms offering personal current accounts with most Banking and credit card complaints (per 1000 accounts) H1 2020The data we collect includes complaints on credit cards current accounts packaged accounts savings unregulated loans and overdrafts and other banking For the purpose of accurately displaying data more specific to personal current accounts firms who do not offer personal current accounts have been excluded
A link to the latest FCA complaints data published on 15 December 2020 can be found hereThe figures are complaint numbers opened during the period January 1st 2020 - June 30th 2020 (H1)
Current Account Service QualityBased on the 10 firms offering personal current accounts with most complaints in H1 2020
0
2
4
6
8
10
12
14
Al Rayan Bank PLC Cynergy BankLimited
Barclays Bank Plc Bank of Ireland(UK) Plc
HSBC UK Bank Plc Monzo Bank Ltd Investec Bank PLC Secure Trust BankPlc
Marks amp SpencerFinancial Services
Plc
Tesco PersonalFinance PLC
Com
plai
nts
Firms
Number of complaints on banking and credit cards per 1000 accounts Average complaints per 1000 banking and credit card accounts all firms
Contents
Page Content
3 Understanding performance in essential service sectors
4 Working together
6 The impact of Covid-19
7 Performance across our sectors
10 Cross sector metrics ndash UKCSI
11 Performance scorecard ndash Energy
17 Performance scorecard ndash Telecoms
21 Performance scorecard ndash Water amp Sewerage
27 Performance scorecard ndash Banking amp Building Societies
2
Understanding performance in essential service sectorsUnderstanding and monitoring the performance of the sectors we regulate is an important tool for improving consumer outcomes This document provides insight into how effectively companies in water energy telecoms and essential financial services aredelivering for their consumers Working with Ofgem Ofcom Ofwat CCW and the FCA the UK Regulators Network (UKRN) have brought together key consumer metrics covering service quality price differentials and satisfaction levels In January 2020 we published the first iteration of the performance scorecards Moving forward together
These metrics draw on the extensive research and data collected within each of these sectors providing a high level view as well as a signposting users to those more detailed metrics More information from each of the regulators and CCW on the metrics that they collect in their sector can be found by clicking on their logos below
We intend that these performance scorecards willbull Help regulators and regulated companies determine where to focus actionbull Increase the incentives for suppliers to improve performance bull Provide regulators and policymakers with indicators that will help identify and address any common challenges across
sectors
3
Working togetherCollaboration has remained at the heart of this project with regulators and UKRN working together to build a picture of the consumer experience across the sectors they regulate Collaboration has continued to play an important role in understanding the performance of and consumer experience in our sectors
Consumer Minister Paul Scully said ldquoI am very grateful to the UK Regulators Network and the regulators for compiling this second edition of performance scorecards Using performance scorecards consumers can find out which providers are likely to give them the services they need This enables companies to compete on aspects of service that really matter to their customers I will continue to work with the UK Regulators Network to support them in this work and I will encourage the further development of making this information available to consumers I look forward to this and future editions being a valuable aid to consumer decision-making and to driving healthy competitionrdquo
Rachel Fletcher CEO of UKRN said ldquoUnderstanding the experience of consumers across our sectors especially during this most challenging of years remains an important aspect of improving consumer outcomes I am very pleased at the way in which our members have continued to work together building on their extensive sectoral knowledge to create this shared insight To be able to share this cross sector information in one place for the second year is testimony to the regulatorsefforts in recognising the important role they can play I hope this project is helpful to consumer groups and other interestedparties in recognising where consumer needs can be best servedrdquo
4
Philippa Pickford Director of Retail at Ofgem said ldquoDuring COVID-19 we have worked closely with other regulators via the UKRN to share knowledge on the impacts on consumers in different sectors and the actions we took to address Covid-19 challenges We will continue this knowledge sharing and take joint action where this is possible and there are clear consumer benefits We continue to work closely with other regulators through the UKRN to further improve collaborationrdquo
Lindsey Fussell Networks and Communications Group Director from Ofcom said ldquoEnsuring people have access to clear information about the price and quality of communications services is really important These scorecards help people to easily compare how different providers perform so they can choose the right service for themrdquo
John Russell Senior Director of Strategy and Planning from Ofwat said ldquoHaving access to up to date information on the performance of regulated companies can help customers and stakeholders build their understanding of our sectors Having updated the scorecards with the latest available data I hope they will provide an accessible summary of the wide variety of performance information held across our sectorsrdquo
Emma Clancy Chief Executive of CCW said ldquoThe scorecards continue to provide an invaluable snapshot of the experiences of consumers across multiple utilities and where we need to focus our efforts in improving services for households It underlines the enormous value of regulators and consumer bodies like CCW working together particularly as we face down the immediate and long-term challenges presented by COVID-19rdquo
Sheldon Mills Executive Director Consumers and Competition from the FCA said ldquoI am pleased the FCA continues to work closely with the other UKRN regulators and has contributed to this update to the scorecards The data presented here will help consumers to make informed decisions when choosing a service provider It should also provide an incentive for firms to compete and improve their offering to deliver the best possible outcome for their customersrdquo
5
The impact of COVID-19Since the first UKRN performance scorecards were published in January 2020 the COVID-19 pandemic has had a huge impact on the way that households and individuals consume the services we regulate It has also changed the way many regulated companies have delivered their services
Here we set out the extent to which these developments may have impacted the data in our scorecards for each of our sectors
6
The information in the scorecard was collected in Q3 2020 and Q4 2020 between the COVID-19 lockdowns Compared to the same time in 2019 the total volume of complaints received by suppliers decreased Nationally overall satisfaction scores are consistent year on year while net promoter score has improved
Ofcomrsquos scorecard includes metrics (satisfaction NPS and value for money) that are based on fieldwork that took place from 2 January to 11 February 2020 prior to the Covid-19 pandemic Face to face interviews were carried out and followed up with a selection of online interviews See here for detailed methodology Value for money is only reported for mobile providers
In water fieldwork was completed between 2 September 2019 and 30 March 2020 before the effects of the COVID-19 lockdown would have been fully felt by households and therefore reflects lsquobusiness as usualrsquo views Complaints data was recorded between April 2019 and March 2020 also before the effects of the COVID-19 lockdown would have been fully felt by customers
FCA complaints data covers the first half (H1) of 2020 (1 January to 30 June 2020) Given the impact of coronavirus (COVID-19) FCA allowed firms flexibility in the submission deadlines of this data
Performance across our sectorsWithin the performance scorecards we have included a range of metrics we believe will be of interest and that will help to identify where consumers are being well-served and where performance need to improve We have summarised some of the key takeaways here around satisfaction service quality value for money and complaints However it is important to note that the metrics all use different methodology and cannot therefore be directly compared across sectors These slides also include other metrics that may help stakeholders including net promoter score (NPS) and price differentials in the energy sector
Satisfactionservice quality The level of customer satisfaction is generally high there are gaps in all sectors between the stronger performers and those in need of further improvement For example customer satisfaction levels in telecoms vary from 97 for the top performing provider in the mobile sector to a 77 satisfaction level for the lowest performer a landline provider In energy customer satisfaction levels with suppliers range between 75-80 with an average score of 76
When looking at Overall Service Quality in water and sewerage an average of 44 of customers say they would be verylikely to recommend their supplier (represented by a score of 9 or 10 on a 1-10 scale) When we look at the top performing company in this sector this increases to 71 of customers
7
For personal current accounts survey results published in August 2020 show that that the proportion of customers who are either very or extremely likely to recommend their personal current account provider to friends and family varies considerably from 86 for the highest performing provider to 44 for the lowest In Online and Mobile Banking it is 89 for the highest performing provider and 59 for the lowest
Net Promoter ScoreWe have also included the NPS in the water energy and telecom sectors NPS is calculated as the proportion of consumers who are promoters of their supplierprovider minus those who are detractors Consumers are asked On a scale of 0 to 10 how likely are you to recommended your supplierprovider to a friend family member or colleague Responses are grouped as follows Promoters (score 9-10) Passives (score 7-8) Detractors (score 0-6) The score can range from a low of -100 (if every customer is a Detractor) to a high of 100 (if every customer is a Promoter) Based on the global NPS standards any score above 0 is considered ldquogoodrdquo a score of 50 and above is considered ldquoexcellentrdquoIn water 16 of the 21 companies (76) received a positive NPS with scores ranging from an NPS of -9 to 62 (16 average NPS) In energy the average NPS is 4 meaning there are more brand advocates than detractors Medium suppliers achieved the highest score (11) followed by small suppliers (6) and large suppliers (3) In telecoms of the suppliers listed the range in NPSis -5 to 52 The supplier with an NPS of 62 in water is the highest NPS seen across the 3 sectors
Sector Water Energy(LargeMediumSmall)
TelecomsLandline
Telecoms Broadband
Telecoms Mobile
Average NPS 16 4 12 12 25
8
Value for moneyThe scorecards also capture some metrics on perceptions of value for money These include perceptions of the value for money among mobile customers where between 84 and 97 of customers are satisfied with the value for money they receive from their supplier For water the range is between 65 and 85 of customers who believe they get good value for money and for sewerage it is between 66 and 84
ComplaintsComplaints are not comparable across sectors because of the different ways complaints processes are structured and information is collected and reported to the regulatorsIn energy the complaints are reported by suppliers for large and medium size (per 100000 accounts) and smaller suppliers (per 10000 accounts) The number of complaints varies between 2297 to 0147 for large and medium suppliers to 229 to 006 for the smaller suppliers In water written complaints are reported per 10000 properties and the average percentage of complaints is less than 1 (022) across the 21 water companies in the scorecard with the highest figure being 058 In telecoms people typically raise their complaint with their provider in the first instance and to an Alternative Dispute Resolution (ADR) scheme if these arenrsquot resolved Some consumers choose to complain to Ofcom and Ofcom report on these complaints To compare the performance of providers all complaint volumes are displayed per 100000 customers The figures across mobile landline and broadband are also all below 1 with the highest figure being 0115 In banking firms report to the regulator complaints opened per 1000 accounts In the latest figures reported the highest complaints recorded the total was 13
9
Cross-sector metrics - UKCSIIn addition to the detailed metrics from each individual sector we have also included the sector scores from the UKCSI survey published by The Institute of Customer Service UKCSI is a national benchmark of customer satisfaction published twice a year The sector scores provide a high level view of how each sector performs based on five dimensions experiences with the organisations complaint handling and perceptions of an organisationrsquos customer ethos emotional connection and ethical behaviour
UKCSI scores are expressed as an index score out of 100 UKCSI covers 13 sectors and is based on 45000 responses 259 named organisations received a UKCSI rating in the July 2020 survey Each UKCSI incorporates two sets of data to create a rolling measure of customer satisfaction The July 2020 UKCSI includes responses from surveys conducted between 10 September to 7 October 2019 and 16 March to 13 April 2020 Further information about The Institute of Customer Service can be found here
Sector UKCSI score ExperienceComplaint handling
Customer Ethos
Emotional Connection
Ethics
UKCSI (13 sectors) average 77 78 588 765 762 752
Banks amp Building Societies 791 805 62 782 782 771
Telecoms amp Media 742 755 576 735 725 72
Energy 717 733 487 706 695 692
Water 74 752 598 732 732 721
10
v
Performance scorecard
Energy
11
v
Changes in the retail energy market in 2020
Change in definitionsIn Q3 2020 Ofgem revised its definition of small medium and large energy suppliers Definitions are now based on market share rather than historic footprint The category lsquolargersquo refers to those suppliers whose market share exceeds 5 in at least one fuel lsquomediumrsquo is for those exceeding 1 in at least one fuel but remaining below 5 in both fuels and lsquosmallrsquo for suppliers with market share below 1 in both fuels
Consolidation of suppliersIn 2020 the number of energy suppliers operating in the energy market in Great Britain fell due to market exits and brand acquisitions This means that the brand list in the current scorecard is different from that shown in the previous one
Default tariff price capThe level of the default tariff price gap in October 2020 is lower compared to this time a year ago
12
v
1 Satisfied with their supplier overall is the proportion of domestic energy consumers who are satisfied or very satisfied with their energy supplier overall This data comes from the quarterly lsquoConsumer Perceptions of the Energy Market Surveyrsquo commissioned by Ofgem in conjunction with Citizens Advice Data was collected in Q3 2020
2 Net Promoter Score is calculated as the proportion of domestic energy consumers who are promoters of their energy supplier minus those who are detractors Consumers are asked On a scale of 0 to 10 how likely are you to recommended your energy company to a friend of colleague Responses are grouped as follows Promoters (score 9-10) Passives (score 7-8) Detractors (score 0-6) Data comes from the quarterly lsquoConsumer Perceptions of the Energy Market Survey commissioned by Ofgem in conjunction with Citizens Advice Data was collected in Q4 2020
How are suppliers groupedAs at June 2020 56 licensed domestic suppliers were active in the retail energy market Ofgem groups them as follows
bull Large suppliers Bulb British Gas EON EDF Energy npower Octopus Scottish Power SSE Ovobull Medium suppliers Avro Energy Green Network Energy Shell Energy Utility Warehouse Utilitabull Small suppliers all other suppliers
As of Q2 2020 the large suppliers together accounted for around 83 of the market the medium suppliers together accounted for 10 of the market and small suppliers accounted for 7 of the electricity market You can access supplier market share data on the Ofgem data portal
Customer satisfaction and likelihood to recommend
13
v
3 A Standard Variable Tariff (SVT) is a supply contract with an indefinite length that does not have a fixed-term applying to the terms and conditions Itrsquos an energy supplierrsquos basic offer If a customer does not choose a specific energy plan for example after their fixed tariff ends they are moved to an SVT until they choose a new one A customer can also make an active choice to select an SVT Tariffs are calculated for a typical dual fuel customer paying by direct debit This is a customer who takes gas and electricity from the same supplier and consumes 12000kWhyear for gas and 2900kWhyear for electricity
4 Ofgem uses weekly prices across the relevant quarter to calculate the average SVT price and the average cheapest tariff price for each supplier as well as the average market cheapest tariff price When calculating the cheapest tariff at both individual supplier and market level Ofgem excludes tariffs restricted to certain regions This is to give a representative picture of tariffs generally available to all customers across Great Britain When calculating the cheapest tariff at individual supplier level tariffs only available to existing customers (also known as lsquoretention tariffs) are included Tariffs only available to new customers (also known as lsquoacquisitionrsquo tariffs) are excluded
This information is available and regularly updated on Ofgems data portal
Energy prices September 2020For a typical dual fuel customer paying by direct debit
The relevant default tariff cap during this period was pound 1127 Visit Ofgemrsquos website to learn more about the default tariff price cap The cheapest in market was pound790
Large and medium suppliers
14
v
Complaints data refers to complaints directly received by suppliers This information is available and regularly updated on Ofgems data portal
Customer complaints Q3 2020
Large and medium suppliers
15
v
Note as many small suppliers have fewer than 100000 (one hundred thousand) customers complaints data is reported as number of complaints per 10000 (ten thousand) customersComplaints data refers to complaints directly received by suppliers This information is available and regularly updated on Ofgems data portal
Energy provider Igloo Energy Nabuh Energy Orbit Energy PFP Pure Planet SimplicityEnergy So Energy
Number of complaints received per 10K gas and electricity accounts 30 373 229 37 80 24 30
Energy provider Social Energy TogetherEnergy Utility Point Yorkshire
Energy Zog Energy Zebra Power
Number of complaints received per 10K gas and electricity accounts 184 195 29 112 11 7
Energy provider Affect Energy Bristol Energy Daligas E ESB Energy Ecotricity Entice Energy
Number of complaints received per 10K gas and electricity accounts 65 163 27 87 31 114 33
Energy provider EnstrogaEnergy Foxglove Good Energy Green Green Energy
UK GoTo Energy Gulf Gas ampPower
Number of complaints received per 10K gas and electricity accounts 154 17 97 12 6 19 40
Selection of small suppliers
Customer complaints Q3 2020
16
v v
Performance scorecard
Telecoms
17
v v
1 Source Ofcom Customer Satisfaction Tracker 2020 2 Source Ofcom CCT data Notes All figures are rounded to the nearest whole number the overall average relates only to the providers included in the analysis Annualised for 2019 Visit Ofcomrsquos website to see
the latest quarterly telecoms complaints data 3 Source Ofcom Customer Satisfaction Tracker 2020 Notes the industry average relates only to the providers included in the analysis Satisfaction with value for money data only asked among those with a
standalone service so does not include those who purchase their mobile service as part of a bundle No data for satisfaction with value for money for BT and Virgin Mobile due to insufficient base size
Mobile providersOverallaverage
Satisfaction1 93 NA 93 95 NA 93 NA 97 89 93 90
NPS1 25 NA 17 52 NA 30 NA 44 10 26 27
Complaints to Ofcomper 100k subscribers2 13 21 7 NA 10 9 11 3 15 27 26
Satisfaction with value for money3 87 NA 84 96 NA 87 NA 97 87 NA 83
significantly higher or lower than previous year at the 99 confidence level for market research results
X
significantly higher or lower than the overall sector average at the 95 confidence level for market research results
X
significantly higher or lower than the overall sector average at the 95 confidence level for market research results
18
v v
Broadband providers Overallaverage
Satisfaction1 85 86 88 NA 93 NA 86 78 85 NA
NPS1 12 12 17 NA 15 NA 9 -5 19 NA
Complaints to Ofcomper 100k subscribers2 52 50 22 NA 100 37 21 87 60 115
Landline providers
Satisfaction1 85 90 82 NA 83 NA 88 83 77 NA
NPS1 12 19 11 NA 27 NA 10 9 5 NA
Complaints to Ofcomper 100k subscribers2 38 31 17 NA 78 34 18 69 49 65
1 Source Ofcom Customer Satisfaction Tracker 2020 Note the overall average relates only to the providers included in the analysis (inclusion criteria providers with a 4 more market share) No data for KCOM or Post Office due to not meeting the inclusion criteria for this study
2 Source Ofcom CCT data Notes All figures are rounded to the nearest whole number the overall average relates only to the providers included in the analysis Annualised for 2019 Visit Ofcomrsquos website to see the latest quarterly telecoms complaints data Note Satisfaction with value for money data is not available for landline and broadband because the question was only asked among those with a standalone service
significantly higher or lower than previous year at the 99 confidence level for market research results
X
significantly higher or lower than the overall sector average at the 95 confidence level for market research results
X
significantly higher or lower than the overall sector average at the 95 confidence level for market research results
19
v v
Notes Based on September 2019 pricing information Ofcom monitors and reports separately on the extent to which broadband providers differentiate their prices for different groups of customers The latest broadband pricing data we have can be found atPricing trends in communication services 2019 Helping consumers get better deals A review of pricing practices in fixed broadband and Affordability of communications services A summary of initial findings
Monitoring headline customer outcomes
20
v v
Performance scorecard
Water and sewage
21
v v
Water Company Affinity Water Anglian Bournemouth Bristol Cambridge Dwr Cymru Essex amp Suffolk
Likelihood to Recommend 35 40 49 48 41 53 41
Likelihood to RecommendCustomers were asked how likely they would be to recommend their water company (0-10 scale)Percentage who scored their provider with 9 or 10 ratingrsquo shown
Latest Results - August 2020
Water Company HafrenDyfrdwy Hartlepool Northumbrian Portsmouth Severn Trent South East South
Staffordshire
Likelihood to Recommend 44 71 56 50 45 33 48
Water Company South West Southern Sutton amp East Surrey Thames United
Utilities Wessex Yorkshire
Likelihood to Recommend 30 29 34 25 44 51 50
22
v v
Water Company Affinity Water Anglian Bournemouth Bristol Cambridge Dwr Cymru Essex amp
Suffolk
Satisfaction with Service Water 90 88 94 94 96 94 91
Satisfaction with Service Sewage 87 85 89 92 87 85 87
Satisfaction Water (W) amp Sewerage (S)Customers were asked lsquowhen thinking about satisfaction with water services and satisfaction with sewerage services how satisfied or dissatisfied are with your servicersquo (0-5 scale) -Percentage who scored their provider with a 4 or 5 ratingrsquo shown
Water Company HafrenDyfrdwy Hartlepool Northumbrian Portsmouth Severn Trent South East South
Staffordshire
Satisfaction with Service Water 92 93 93 96 94 86 93
Satisfaction with Service Sewage 89 89 91 80 91 80 90
Water Company South West Southern Sutton amp East Surrey Thames United
Utilities Wessex Yorkshire
Satisfaction with Service Water 93 89 95 87 93 93 94
Satisfaction with Service Sewage 85 83 82 79 87 93 90
23
v v
Water Company Affinity Water Anglian Bournemouth Bristol Cambridge Dwr Cymru Essex amp Suffolk
Net Promoter Score NA 18 33 29 17 38 19
Net Promoter Score (NPS)Respondents are grouped as follows-Promoters (score 9-10) are loyal enthusiasts -Passives (score 7-8) are satisfied but unenthusiastic customers -Detractors (score 0-6) are unhappy customers
Latest Results - August 2020
Water Company HafrenDyfrdwy Hartlepool Northumbrian Portsmouth Severn Trent South East South
Staffordshire
Net Promoter Score 37 62 22 35 -6 -1 24
Water Company South West Southern Sutton amp East Surrey Thames United
Utilities Wessex Yorkshire
Net Promoter Score -4 -9 7 21 33 33 23
The NPS is calculated by subtracting the of Detractors from the of Promoters
24
v v
Water Company Affinity Water Anglian Bournemouth Bristol Cambridge Dwr Cymru Essex amp Suffolk
Value For Money Water 77 74 85 80 78 77 76
Value For Money Sewage 78 75 83 83 79 79 74
Value For Money (VFM) Water (W) amp Sewerage (S)Customers were asked lsquowhen thinking about value for money how satisfied or dissatisfied are you with the VFM of your servicersquo (0-5 scale) - Percentage who scored their provider with a 4 or 5 ratingrsquo shown
Water Company HafrenDyfrdwy Hartlepool Northumbrian Portsmouth Severn Trent South East South
Staffordshire
Value For Money Water 77 82 79 77 78 70 76
Value For Money Sewage 81 84 84 65 80 69 75
Water Company South West Southern Sutton amp East Surrey Thames United
Utilities Wessex Yorkshire
Value For Money Water 65 67 75 75 76 79 79
Value For Money Sewage 66 74 76 75 79 83 80
25
v v
Water Company Affinity Water Anglian Bournemouth Bristol Cambridge Dwr Cymru Essex amp Suffolk
Complaints ndash Writtenper 10000 Properties 156 247 101 172 273 146 316
Complaints ndash Written per 10000 PropertiesLatest Results - September 2020
Water Company HafrenDyfrdwy Hartlepool Northumbrian Portsmouth Severn Trent South East South
Staffordshire
Complaints ndash Writtenper 10000 Properties 345 206 314 109 225 13 168
Water Company South West Southern Sutton amp East Surrey Thames United
Utilities Wessex Yorkshire
Complaints ndash Writtenper 10000 Properties 19 278 113 583 182 118 176
26
v
Performance scorecard
Personal Current Accounts
27
v
BankBuilding Society Monzo Starling Bank First Direct Metro Bank Nationwide Barclays Halifax
Overall Service Quality 86 84 83 81 71 62 62
Overall Service QualityCustomers were asked how likely they would be to recommend their provider to friends and family1
Latest results published in August 2020
These results show the proportion of customers of each provider who said they were lsquoextremely likelyrsquo or lsquovery likelyrsquo to recommend each service1
Access to the full Ipsos Mori Banking metrics surveys published every six months is available here
BankBuilding Society Santander Lloyds Bank Virgin Money HSBC NatWest Bank of
Scotland
Overall Service Quality 61 60 60 59 58 58
Current Account Service QualityBased on the 19 largest personal current account providers in Great Britain
BankBuilding Society
The Co-operative Bank Yorkshire Bank TSB Clydesdale Bank Royal Bank of
Scotland Tesco Bank
Overall Service Quality 57 56 51 51 46 44
28
v
BankBuilding Society Monzo Starling Bank Metro Bank First Direct Nationwide Barclays Halifax
Overall Service Quality 89 88 85 83 81 81 81
Online and Mobile Banking ServicesCustomers were asked how likely they would be to recommend their providerrsquos online and mobile banking services to friends andfamily1
Latest results published in August 2020
These results show the proportion of customers of each provider who said they were lsquoextremely likelyrsquo or lsquovery likelyrsquo to recommend each service1
Access to the full Ipsos Mori Banking metrics surveys published every six months is available here
BankBuilding Society Lloyds Bank Bank of
Scotland Santander NatWest Virgin Money HSBC
Overall Service Quality 78 77 76 75 75 72
Current Account Service QualityBased on the 19 largest personal current account providers in Great Britain
BankBuilding Society Yorkshire Bank Royal Bank of
ScotlandThe Co-
operative Bank Clydesdale Bank TSB Tesco Bank
Overall Service Quality 71 71 67 66 65 59
29
v
Firms offering personal current accounts with most Banking and credit card complaints (per 1000 accounts) H1 2020The data we collect includes complaints on credit cards current accounts packaged accounts savings unregulated loans and overdrafts and other banking For the purpose of accurately displaying data more specific to personal current accounts firms who do not offer personal current accounts have been excluded
A link to the latest FCA complaints data published on 15 December 2020 can be found hereThe figures are complaint numbers opened during the period January 1st 2020 - June 30th 2020 (H1)
Current Account Service QualityBased on the 10 firms offering personal current accounts with most complaints in H1 2020
0
2
4
6
8
10
12
14
Al Rayan Bank PLC Cynergy BankLimited
Barclays Bank Plc Bank of Ireland(UK) Plc
HSBC UK Bank Plc Monzo Bank Ltd Investec Bank PLC Secure Trust BankPlc
Marks amp SpencerFinancial Services
Plc
Tesco PersonalFinance PLC
Com
plai
nts
Firms
Number of complaints on banking and credit cards per 1000 accounts Average complaints per 1000 banking and credit card accounts all firms
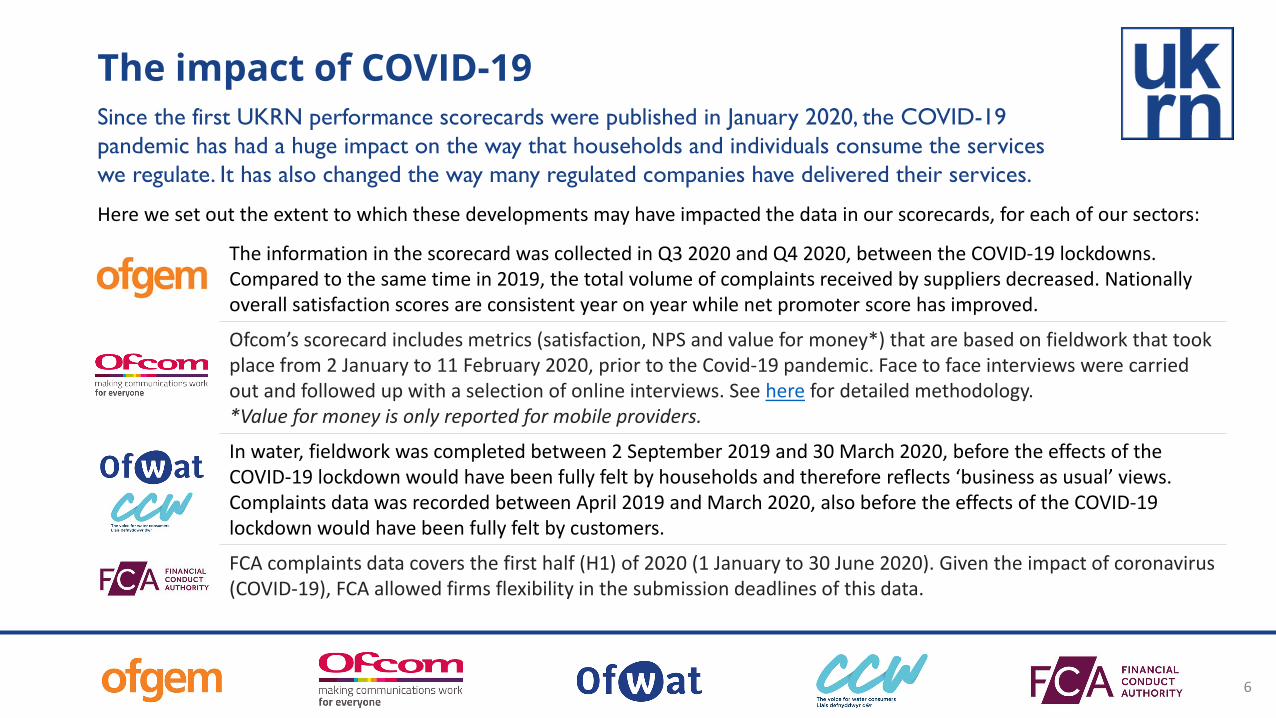
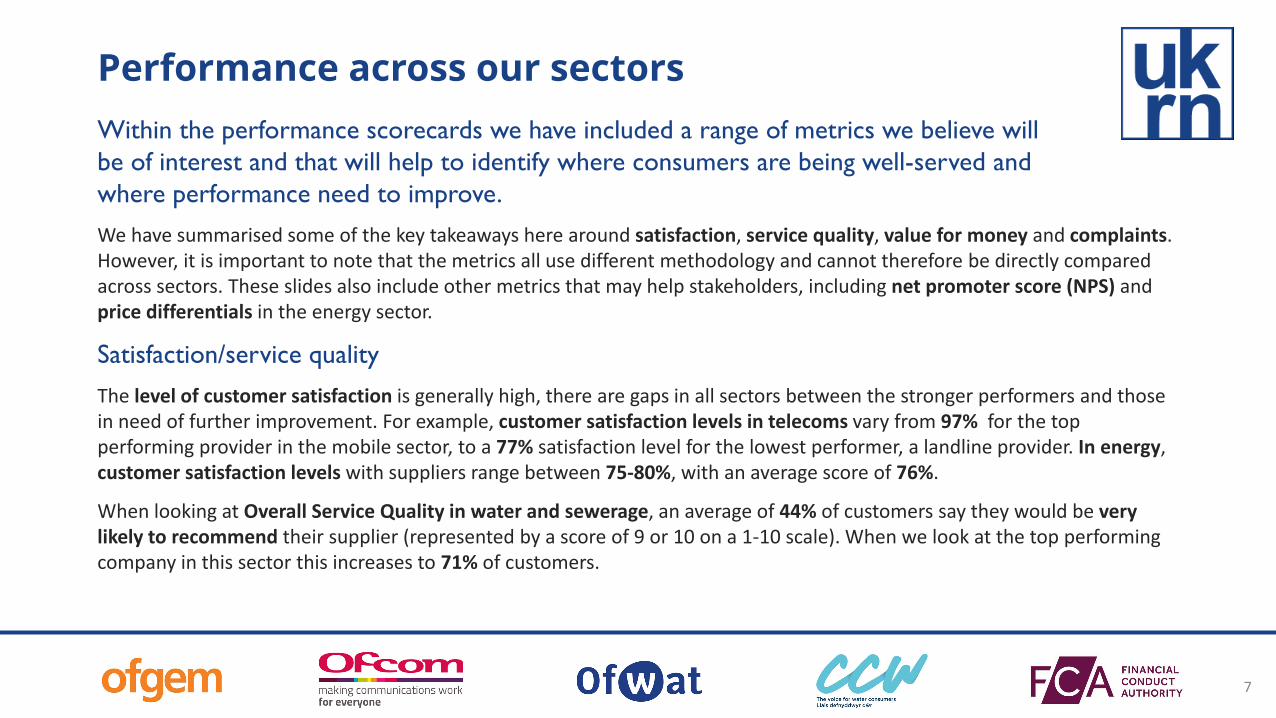
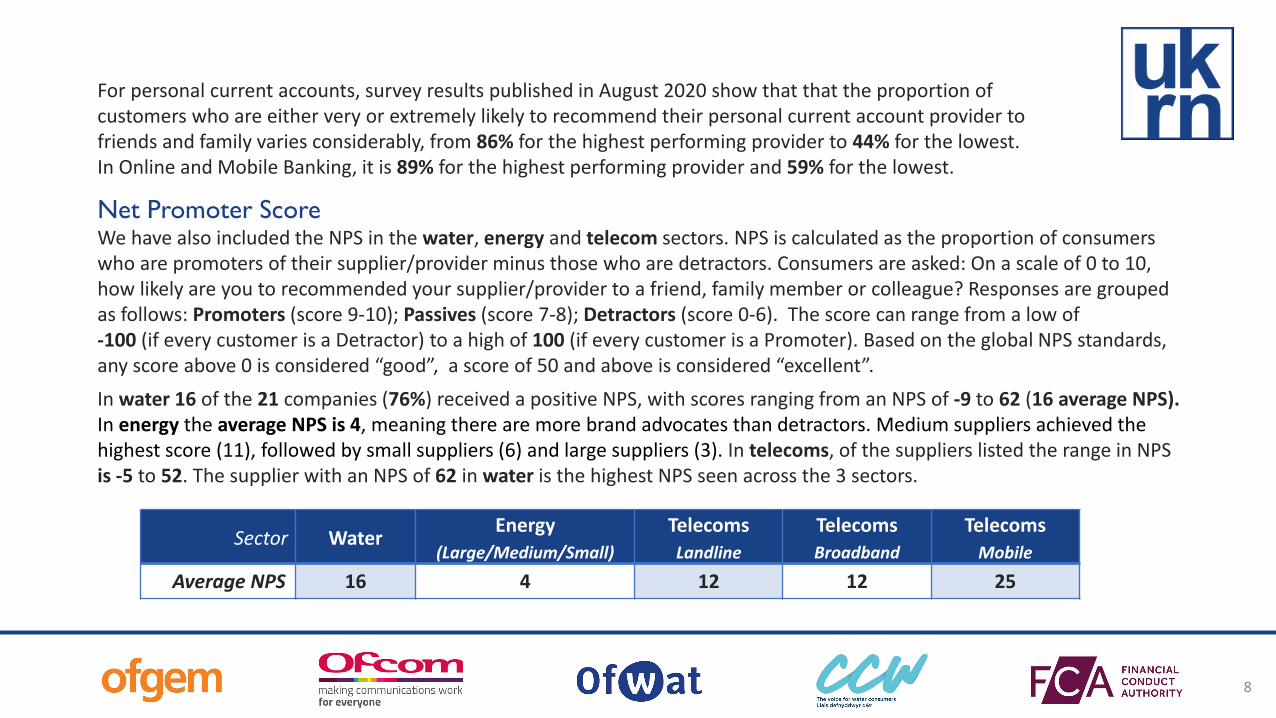
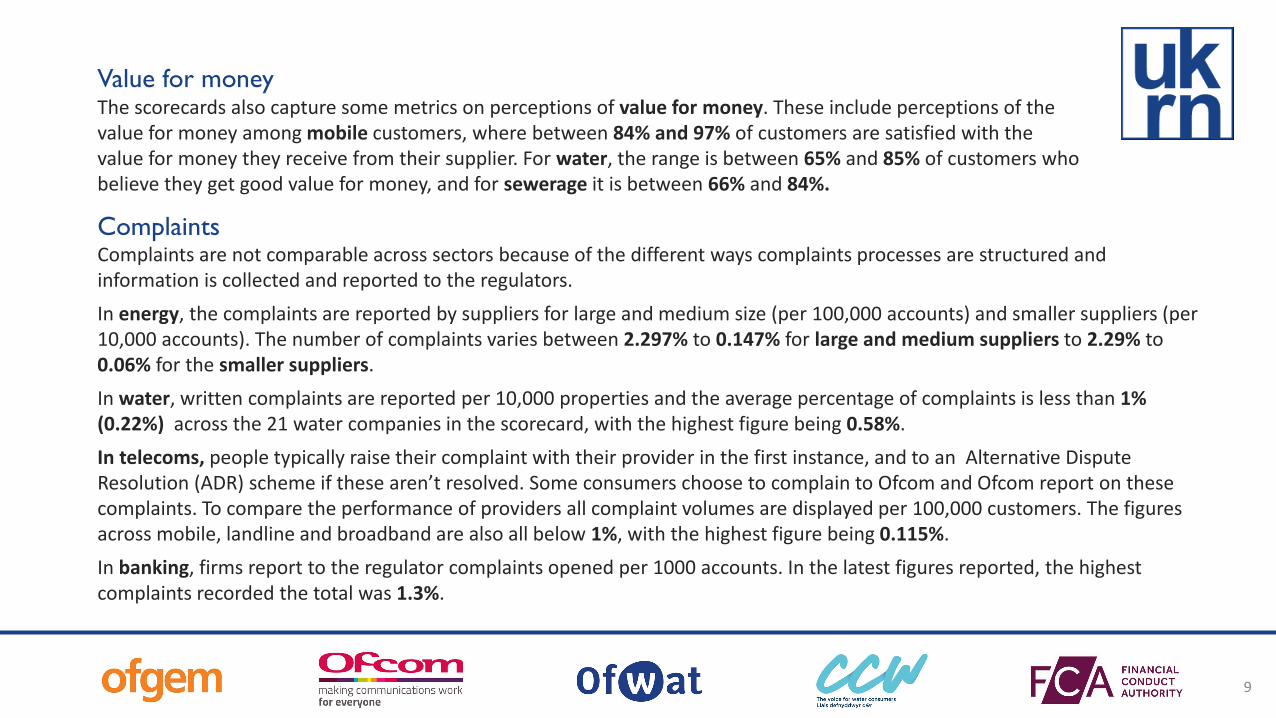
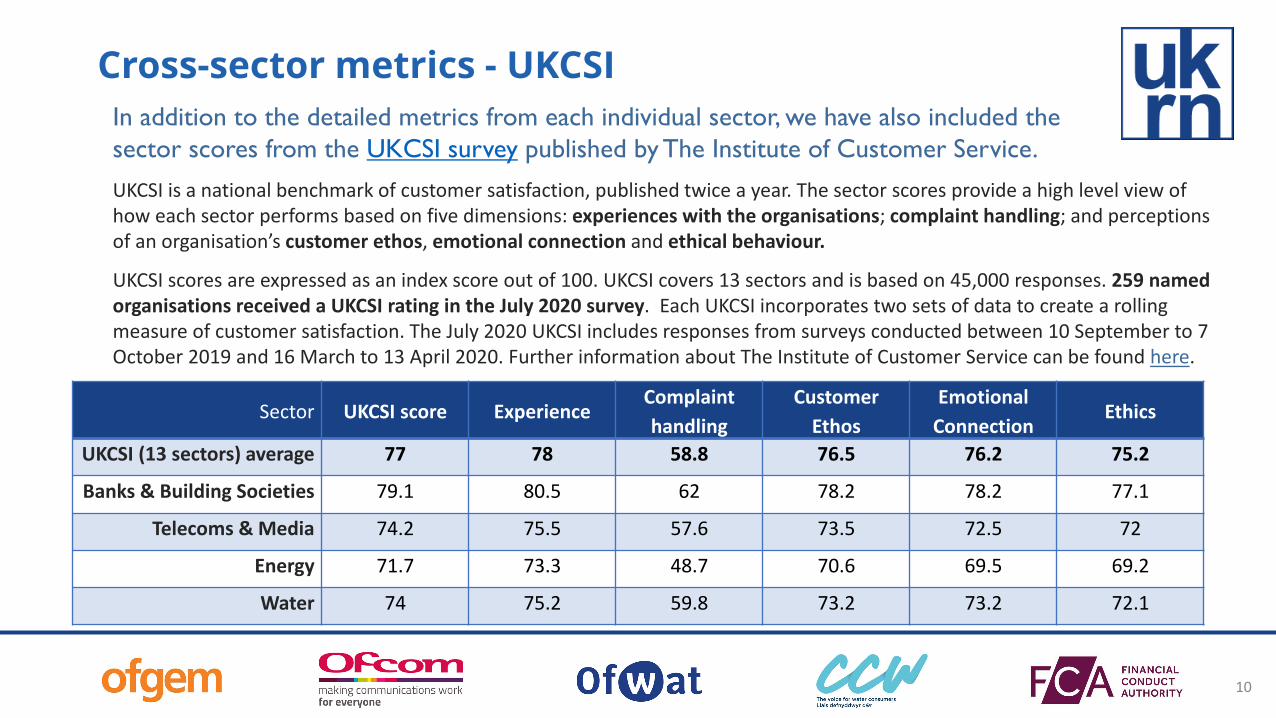
v
Performance scorecard
Energy
11
v
Changes in the retail energy market in 2020
Change in definitionsIn Q3 2020 Ofgem revised its definition of small medium and large energy suppliers Definitions are now based on market share rather than historic footprint The category lsquolargersquo refers to those suppliers whose market share exceeds 5 in at least one fuel lsquomediumrsquo is for those exceeding 1 in at least one fuel but remaining below 5 in both fuels and lsquosmallrsquo for suppliers with market share below 1 in both fuels
Consolidation of suppliersIn 2020 the number of energy suppliers operating in the energy market in Great Britain fell due to market exits and brand acquisitions This means that the brand list in the current scorecard is different from that shown in the previous one
Default tariff price capThe level of the default tariff price gap in October 2020 is lower compared to this time a year ago
12
v
1 Satisfied with their supplier overall is the proportion of domestic energy consumers who are satisfied or very satisfied with their energy supplier overall This data comes from the quarterly lsquoConsumer Perceptions of the Energy Market Surveyrsquo commissioned by Ofgem in conjunction with Citizens Advice Data was collected in Q3 2020
2 Net Promoter Score is calculated as the proportion of domestic energy consumers who are promoters of their energy supplier minus those who are detractors Consumers are asked On a scale of 0 to 10 how likely are you to recommended your energy company to a friend of colleague Responses are grouped as follows Promoters (score 9-10) Passives (score 7-8) Detractors (score 0-6) Data comes from the quarterly lsquoConsumer Perceptions of the Energy Market Survey commissioned by Ofgem in conjunction with Citizens Advice Data was collected in Q4 2020
How are suppliers groupedAs at June 2020 56 licensed domestic suppliers were active in the retail energy market Ofgem groups them as follows
bull Large suppliers Bulb British Gas EON EDF Energy npower Octopus Scottish Power SSE Ovobull Medium suppliers Avro Energy Green Network Energy Shell Energy Utility Warehouse Utilitabull Small suppliers all other suppliers
As of Q2 2020 the large suppliers together accounted for around 83 of the market the medium suppliers together accounted for 10 of the market and small suppliers accounted for 7 of the electricity market You can access supplier market share data on the Ofgem data portal
Customer satisfaction and likelihood to recommend
13
v
3 A Standard Variable Tariff (SVT) is a supply contract with an indefinite length that does not have a fixed-term applying to the terms and conditions Itrsquos an energy supplierrsquos basic offer If a customer does not choose a specific energy plan for example after their fixed tariff ends they are moved to an SVT until they choose a new one A customer can also make an active choice to select an SVT Tariffs are calculated for a typical dual fuel customer paying by direct debit This is a customer who takes gas and electricity from the same supplier and consumes 12000kWhyear for gas and 2900kWhyear for electricity
4 Ofgem uses weekly prices across the relevant quarter to calculate the average SVT price and the average cheapest tariff price for each supplier as well as the average market cheapest tariff price When calculating the cheapest tariff at both individual supplier and market level Ofgem excludes tariffs restricted to certain regions This is to give a representative picture of tariffs generally available to all customers across Great Britain When calculating the cheapest tariff at individual supplier level tariffs only available to existing customers (also known as lsquoretention tariffs) are included Tariffs only available to new customers (also known as lsquoacquisitionrsquo tariffs) are excluded
This information is available and regularly updated on Ofgems data portal
Energy prices September 2020For a typical dual fuel customer paying by direct debit
The relevant default tariff cap during this period was pound 1127 Visit Ofgemrsquos website to learn more about the default tariff price cap The cheapest in market was pound790
Large and medium suppliers
14
v
Complaints data refers to complaints directly received by suppliers This information is available and regularly updated on Ofgems data portal
Customer complaints Q3 2020
Large and medium suppliers
15
v
Note as many small suppliers have fewer than 100000 (one hundred thousand) customers complaints data is reported as number of complaints per 10000 (ten thousand) customersComplaints data refers to complaints directly received by suppliers This information is available and regularly updated on Ofgems data portal
Energy provider Igloo Energy Nabuh Energy Orbit Energy PFP Pure Planet SimplicityEnergy So Energy
Number of complaints received per 10K gas and electricity accounts 30 373 229 37 80 24 30
Energy provider Social Energy TogetherEnergy Utility Point Yorkshire
Energy Zog Energy Zebra Power
Number of complaints received per 10K gas and electricity accounts 184 195 29 112 11 7
Energy provider Affect Energy Bristol Energy Daligas E ESB Energy Ecotricity Entice Energy
Number of complaints received per 10K gas and electricity accounts 65 163 27 87 31 114 33
Energy provider EnstrogaEnergy Foxglove Good Energy Green Green Energy
UK GoTo Energy Gulf Gas ampPower
Number of complaints received per 10K gas and electricity accounts 154 17 97 12 6 19 40
Selection of small suppliers
Customer complaints Q3 2020
16
v v
Performance scorecard
Telecoms
17
v v
1 Source Ofcom Customer Satisfaction Tracker 2020 2 Source Ofcom CCT data Notes All figures are rounded to the nearest whole number the overall average relates only to the providers included in the analysis Annualised for 2019 Visit Ofcomrsquos website to see
the latest quarterly telecoms complaints data 3 Source Ofcom Customer Satisfaction Tracker 2020 Notes the industry average relates only to the providers included in the analysis Satisfaction with value for money data only asked among those with a
standalone service so does not include those who purchase their mobile service as part of a bundle No data for satisfaction with value for money for BT and Virgin Mobile due to insufficient base size
Mobile providersOverallaverage
Satisfaction1 93 NA 93 95 NA 93 NA 97 89 93 90
NPS1 25 NA 17 52 NA 30 NA 44 10 26 27
Complaints to Ofcomper 100k subscribers2 13 21 7 NA 10 9 11 3 15 27 26
Satisfaction with value for money3 87 NA 84 96 NA 87 NA 97 87 NA 83
significantly higher or lower than previous year at the 99 confidence level for market research results
X
significantly higher or lower than the overall sector average at the 95 confidence level for market research results
X
significantly higher or lower than the overall sector average at the 95 confidence level for market research results
18
v v
Broadband providers Overallaverage
Satisfaction1 85 86 88 NA 93 NA 86 78 85 NA
NPS1 12 12 17 NA 15 NA 9 -5 19 NA
Complaints to Ofcomper 100k subscribers2 52 50 22 NA 100 37 21 87 60 115
Landline providers
Satisfaction1 85 90 82 NA 83 NA 88 83 77 NA
NPS1 12 19 11 NA 27 NA 10 9 5 NA
Complaints to Ofcomper 100k subscribers2 38 31 17 NA 78 34 18 69 49 65
1 Source Ofcom Customer Satisfaction Tracker 2020 Note the overall average relates only to the providers included in the analysis (inclusion criteria providers with a 4 more market share) No data for KCOM or Post Office due to not meeting the inclusion criteria for this study
2 Source Ofcom CCT data Notes All figures are rounded to the nearest whole number the overall average relates only to the providers included in the analysis Annualised for 2019 Visit Ofcomrsquos website to see the latest quarterly telecoms complaints data Note Satisfaction with value for money data is not available for landline and broadband because the question was only asked among those with a standalone service
significantly higher or lower than previous year at the 99 confidence level for market research results
X
significantly higher or lower than the overall sector average at the 95 confidence level for market research results
X
significantly higher or lower than the overall sector average at the 95 confidence level for market research results
19
v v
Notes Based on September 2019 pricing information Ofcom monitors and reports separately on the extent to which broadband providers differentiate their prices for different groups of customers The latest broadband pricing data we have can be found atPricing trends in communication services 2019 Helping consumers get better deals A review of pricing practices in fixed broadband and Affordability of communications services A summary of initial findings
Monitoring headline customer outcomes
20
v v
Performance scorecard
Water and sewage
21
v v
Water Company Affinity Water Anglian Bournemouth Bristol Cambridge Dwr Cymru Essex amp Suffolk
Likelihood to Recommend 35 40 49 48 41 53 41
Likelihood to RecommendCustomers were asked how likely they would be to recommend their water company (0-10 scale)Percentage who scored their provider with 9 or 10 ratingrsquo shown
Latest Results - August 2020
Water Company HafrenDyfrdwy Hartlepool Northumbrian Portsmouth Severn Trent South East South
Staffordshire
Likelihood to Recommend 44 71 56 50 45 33 48
Water Company South West Southern Sutton amp East Surrey Thames United
Utilities Wessex Yorkshire
Likelihood to Recommend 30 29 34 25 44 51 50
22
v v
Water Company Affinity Water Anglian Bournemouth Bristol Cambridge Dwr Cymru Essex amp
Suffolk
Satisfaction with Service Water 90 88 94 94 96 94 91
Satisfaction with Service Sewage 87 85 89 92 87 85 87
Satisfaction Water (W) amp Sewerage (S)Customers were asked lsquowhen thinking about satisfaction with water services and satisfaction with sewerage services how satisfied or dissatisfied are with your servicersquo (0-5 scale) -Percentage who scored their provider with a 4 or 5 ratingrsquo shown
Water Company HafrenDyfrdwy Hartlepool Northumbrian Portsmouth Severn Trent South East South
Staffordshire
Satisfaction with Service Water 92 93 93 96 94 86 93
Satisfaction with Service Sewage 89 89 91 80 91 80 90
Water Company South West Southern Sutton amp East Surrey Thames United
Utilities Wessex Yorkshire
Satisfaction with Service Water 93 89 95 87 93 93 94
Satisfaction with Service Sewage 85 83 82 79 87 93 90
23
v v
Water Company Affinity Water Anglian Bournemouth Bristol Cambridge Dwr Cymru Essex amp Suffolk
Net Promoter Score NA 18 33 29 17 38 19
Net Promoter Score (NPS)Respondents are grouped as follows-Promoters (score 9-10) are loyal enthusiasts -Passives (score 7-8) are satisfied but unenthusiastic customers -Detractors (score 0-6) are unhappy customers
Latest Results - August 2020
Water Company HafrenDyfrdwy Hartlepool Northumbrian Portsmouth Severn Trent South East South
Staffordshire
Net Promoter Score 37 62 22 35 -6 -1 24
Water Company South West Southern Sutton amp East Surrey Thames United
Utilities Wessex Yorkshire
Net Promoter Score -4 -9 7 21 33 33 23
The NPS is calculated by subtracting the of Detractors from the of Promoters
24
v v
Water Company Affinity Water Anglian Bournemouth Bristol Cambridge Dwr Cymru Essex amp Suffolk
Value For Money Water 77 74 85 80 78 77 76
Value For Money Sewage 78 75 83 83 79 79 74
Value For Money (VFM) Water (W) amp Sewerage (S)Customers were asked lsquowhen thinking about value for money how satisfied or dissatisfied are you with the VFM of your servicersquo (0-5 scale) - Percentage who scored their provider with a 4 or 5 ratingrsquo shown
Water Company HafrenDyfrdwy Hartlepool Northumbrian Portsmouth Severn Trent South East South
Staffordshire
Value For Money Water 77 82 79 77 78 70 76
Value For Money Sewage 81 84 84 65 80 69 75
Water Company South West Southern Sutton amp East Surrey Thames United
Utilities Wessex Yorkshire
Value For Money Water 65 67 75 75 76 79 79
Value For Money Sewage 66 74 76 75 79 83 80
25
v v
Water Company Affinity Water Anglian Bournemouth Bristol Cambridge Dwr Cymru Essex amp Suffolk
Complaints ndash Writtenper 10000 Properties 156 247 101 172 273 146 316
Complaints ndash Written per 10000 PropertiesLatest Results - September 2020
Water Company HafrenDyfrdwy Hartlepool Northumbrian Portsmouth Severn Trent South East South
Staffordshire
Complaints ndash Writtenper 10000 Properties 345 206 314 109 225 13 168
Water Company South West Southern Sutton amp East Surrey Thames United
Utilities Wessex Yorkshire
Complaints ndash Writtenper 10000 Properties 19 278 113 583 182 118 176
26
v
Performance scorecard
Personal Current Accounts
27
v
BankBuilding Society Monzo Starling Bank First Direct Metro Bank Nationwide Barclays Halifax
Overall Service Quality 86 84 83 81 71 62 62
Overall Service QualityCustomers were asked how likely they would be to recommend their provider to friends and family1
Latest results published in August 2020
These results show the proportion of customers of each provider who said they were lsquoextremely likelyrsquo or lsquovery likelyrsquo to recommend each service1
Access to the full Ipsos Mori Banking metrics surveys published every six months is available here
BankBuilding Society Santander Lloyds Bank Virgin Money HSBC NatWest Bank of
Scotland
Overall Service Quality 61 60 60 59 58 58
Current Account Service QualityBased on the 19 largest personal current account providers in Great Britain
BankBuilding Society
The Co-operative Bank Yorkshire Bank TSB Clydesdale Bank Royal Bank of
Scotland Tesco Bank
Overall Service Quality 57 56 51 51 46 44
28
v
BankBuilding Society Monzo Starling Bank Metro Bank First Direct Nationwide Barclays Halifax
Overall Service Quality 89 88 85 83 81 81 81
Online and Mobile Banking ServicesCustomers were asked how likely they would be to recommend their providerrsquos online and mobile banking services to friends andfamily1
Latest results published in August 2020
These results show the proportion of customers of each provider who said they were lsquoextremely likelyrsquo or lsquovery likelyrsquo to recommend each service1
Access to the full Ipsos Mori Banking metrics surveys published every six months is available here
BankBuilding Society Lloyds Bank Bank of
Scotland Santander NatWest Virgin Money HSBC
Overall Service Quality 78 77 76 75 75 72
Current Account Service QualityBased on the 19 largest personal current account providers in Great Britain
BankBuilding Society Yorkshire Bank Royal Bank of
ScotlandThe Co-
operative Bank Clydesdale Bank TSB Tesco Bank
Overall Service Quality 71 71 67 66 65 59
29
v
Firms offering personal current accounts with most Banking and credit card complaints (per 1000 accounts) H1 2020The data we collect includes complaints on credit cards current accounts packaged accounts savings unregulated loans and overdrafts and other banking For the purpose of accurately displaying data more specific to personal current accounts firms who do not offer personal current accounts have been excluded
A link to the latest FCA complaints data published on 15 December 2020 can be found hereThe figures are complaint numbers opened during the period January 1st 2020 - June 30th 2020 (H1)
Current Account Service QualityBased on the 10 firms offering personal current accounts with most complaints in H1 2020
0
2
4
6
8
10
12
14
Al Rayan Bank PLC Cynergy BankLimited
Barclays Bank Plc Bank of Ireland(UK) Plc
HSBC UK Bank Plc Monzo Bank Ltd Investec Bank PLC Secure Trust BankPlc
Marks amp SpencerFinancial Services
Plc
Tesco PersonalFinance PLC
Com
plai
nts
Firms
Number of complaints on banking and credit cards per 1000 accounts Average complaints per 1000 banking and credit card accounts all firms
v
Changes in the retail energy market in 2020
Change in definitionsIn Q3 2020 Ofgem revised its definition of small medium and large energy suppliers Definitions are now based on market share rather than historic footprint The category lsquolargersquo refers to those suppliers whose market share exceeds 5 in at least one fuel lsquomediumrsquo is for those exceeding 1 in at least one fuel but remaining below 5 in both fuels and lsquosmallrsquo for suppliers with market share below 1 in both fuels
Consolidation of suppliersIn 2020 the number of energy suppliers operating in the energy market in Great Britain fell due to market exits and brand acquisitions This means that the brand list in the current scorecard is different from that shown in the previous one
Default tariff price capThe level of the default tariff price gap in October 2020 is lower compared to this time a year ago
12
v
1 Satisfied with their supplier overall is the proportion of domestic energy consumers who are satisfied or very satisfied with their energy supplier overall This data comes from the quarterly lsquoConsumer Perceptions of the Energy Market Surveyrsquo commissioned by Ofgem in conjunction with Citizens Advice Data was collected in Q3 2020
2 Net Promoter Score is calculated as the proportion of domestic energy consumers who are promoters of their energy supplier minus those who are detractors Consumers are asked On a scale of 0 to 10 how likely are you to recommended your energy company to a friend of colleague Responses are grouped as follows Promoters (score 9-10) Passives (score 7-8) Detractors (score 0-6) Data comes from the quarterly lsquoConsumer Perceptions of the Energy Market Survey commissioned by Ofgem in conjunction with Citizens Advice Data was collected in Q4 2020
How are suppliers groupedAs at June 2020 56 licensed domestic suppliers were active in the retail energy market Ofgem groups them as follows
bull Large suppliers Bulb British Gas EON EDF Energy npower Octopus Scottish Power SSE Ovobull Medium suppliers Avro Energy Green Network Energy Shell Energy Utility Warehouse Utilitabull Small suppliers all other suppliers
As of Q2 2020 the large suppliers together accounted for around 83 of the market the medium suppliers together accounted for 10 of the market and small suppliers accounted for 7 of the electricity market You can access supplier market share data on the Ofgem data portal
Customer satisfaction and likelihood to recommend
13
v
3 A Standard Variable Tariff (SVT) is a supply contract with an indefinite length that does not have a fixed-term applying to the terms and conditions Itrsquos an energy supplierrsquos basic offer If a customer does not choose a specific energy plan for example after their fixed tariff ends they are moved to an SVT until they choose a new one A customer can also make an active choice to select an SVT Tariffs are calculated for a typical dual fuel customer paying by direct debit This is a customer who takes gas and electricity from the same supplier and consumes 12000kWhyear for gas and 2900kWhyear for electricity
4 Ofgem uses weekly prices across the relevant quarter to calculate the average SVT price and the average cheapest tariff price for each supplier as well as the average market cheapest tariff price When calculating the cheapest tariff at both individual supplier and market level Ofgem excludes tariffs restricted to certain regions This is to give a representative picture of tariffs generally available to all customers across Great Britain When calculating the cheapest tariff at individual supplier level tariffs only available to existing customers (also known as lsquoretention tariffs) are included Tariffs only available to new customers (also known as lsquoacquisitionrsquo tariffs) are excluded
This information is available and regularly updated on Ofgems data portal
Energy prices September 2020For a typical dual fuel customer paying by direct debit
The relevant default tariff cap during this period was pound 1127 Visit Ofgemrsquos website to learn more about the default tariff price cap The cheapest in market was pound790
Large and medium suppliers
14
v
Complaints data refers to complaints directly received by suppliers This information is available and regularly updated on Ofgems data portal
Customer complaints Q3 2020
Large and medium suppliers
15
v
Note as many small suppliers have fewer than 100000 (one hundred thousand) customers complaints data is reported as number of complaints per 10000 (ten thousand) customersComplaints data refers to complaints directly received by suppliers This information is available and regularly updated on Ofgems data portal
Energy provider Igloo Energy Nabuh Energy Orbit Energy PFP Pure Planet SimplicityEnergy So Energy
Number of complaints received per 10K gas and electricity accounts 30 373 229 37 80 24 30
Energy provider Social Energy TogetherEnergy Utility Point Yorkshire
Energy Zog Energy Zebra Power
Number of complaints received per 10K gas and electricity accounts 184 195 29 112 11 7
Energy provider Affect Energy Bristol Energy Daligas E ESB Energy Ecotricity Entice Energy
Number of complaints received per 10K gas and electricity accounts 65 163 27 87 31 114 33
Energy provider EnstrogaEnergy Foxglove Good Energy Green Green Energy
UK GoTo Energy Gulf Gas ampPower
Number of complaints received per 10K gas and electricity accounts 154 17 97 12 6 19 40
Selection of small suppliers
Customer complaints Q3 2020
16
v v
Performance scorecard
Telecoms
17
v v
1 Source Ofcom Customer Satisfaction Tracker 2020 2 Source Ofcom CCT data Notes All figures are rounded to the nearest whole number the overall average relates only to the providers included in the analysis Annualised for 2019 Visit Ofcomrsquos website to see
the latest quarterly telecoms complaints data 3 Source Ofcom Customer Satisfaction Tracker 2020 Notes the industry average relates only to the providers included in the analysis Satisfaction with value for money data only asked among those with a
standalone service so does not include those who purchase their mobile service as part of a bundle No data for satisfaction with value for money for BT and Virgin Mobile due to insufficient base size
Mobile providersOverallaverage
Satisfaction1 93 NA 93 95 NA 93 NA 97 89 93 90
NPS1 25 NA 17 52 NA 30 NA 44 10 26 27
Complaints to Ofcomper 100k subscribers2 13 21 7 NA 10 9 11 3 15 27 26
Satisfaction with value for money3 87 NA 84 96 NA 87 NA 97 87 NA 83
significantly higher or lower than previous year at the 99 confidence level for market research results
X
significantly higher or lower than the overall sector average at the 95 confidence level for market research results
X
significantly higher or lower than the overall sector average at the 95 confidence level for market research results
18
v v
Broadband providers Overallaverage
Satisfaction1 85 86 88 NA 93 NA 86 78 85 NA
NPS1 12 12 17 NA 15 NA 9 -5 19 NA
Complaints to Ofcomper 100k subscribers2 52 50 22 NA 100 37 21 87 60 115
Landline providers
Satisfaction1 85 90 82 NA 83 NA 88 83 77 NA
NPS1 12 19 11 NA 27 NA 10 9 5 NA
Complaints to Ofcomper 100k subscribers2 38 31 17 NA 78 34 18 69 49 65
1 Source Ofcom Customer Satisfaction Tracker 2020 Note the overall average relates only to the providers included in the analysis (inclusion criteria providers with a 4 more market share) No data for KCOM or Post Office due to not meeting the inclusion criteria for this study
2 Source Ofcom CCT data Notes All figures are rounded to the nearest whole number the overall average relates only to the providers included in the analysis Annualised for 2019 Visit Ofcomrsquos website to see the latest quarterly telecoms complaints data Note Satisfaction with value for money data is not available for landline and broadband because the question was only asked among those with a standalone service
significantly higher or lower than previous year at the 99 confidence level for market research results
X
significantly higher or lower than the overall sector average at the 95 confidence level for market research results
X
significantly higher or lower than the overall sector average at the 95 confidence level for market research results
19
v v
Notes Based on September 2019 pricing information Ofcom monitors and reports separately on the extent to which broadband providers differentiate their prices for different groups of customers The latest broadband pricing data we have can be found atPricing trends in communication services 2019 Helping consumers get better deals A review of pricing practices in fixed broadband and Affordability of communications services A summary of initial findings
Monitoring headline customer outcomes
20
v v
Performance scorecard
Water and sewage
21
v v
Water Company Affinity Water Anglian Bournemouth Bristol Cambridge Dwr Cymru Essex amp Suffolk
Likelihood to Recommend 35 40 49 48 41 53 41
Likelihood to RecommendCustomers were asked how likely they would be to recommend their water company (0-10 scale)Percentage who scored their provider with 9 or 10 ratingrsquo shown
Latest Results - August 2020
Water Company HafrenDyfrdwy Hartlepool Northumbrian Portsmouth Severn Trent South East South
Staffordshire
Likelihood to Recommend 44 71 56 50 45 33 48
Water Company South West Southern Sutton amp East Surrey Thames United
Utilities Wessex Yorkshire
Likelihood to Recommend 30 29 34 25 44 51 50
22
v v
Water Company Affinity Water Anglian Bournemouth Bristol Cambridge Dwr Cymru Essex amp
Suffolk
Satisfaction with Service Water 90 88 94 94 96 94 91
Satisfaction with Service Sewage 87 85 89 92 87 85 87
Satisfaction Water (W) amp Sewerage (S)Customers were asked lsquowhen thinking about satisfaction with water services and satisfaction with sewerage services how satisfied or dissatisfied are with your servicersquo (0-5 scale) -Percentage who scored their provider with a 4 or 5 ratingrsquo shown
Water Company HafrenDyfrdwy Hartlepool Northumbrian Portsmouth Severn Trent South East South
Staffordshire
Satisfaction with Service Water 92 93 93 96 94 86 93
Satisfaction with Service Sewage 89 89 91 80 91 80 90
Water Company South West Southern Sutton amp East Surrey Thames United
Utilities Wessex Yorkshire
Satisfaction with Service Water 93 89 95 87 93 93 94
Satisfaction with Service Sewage 85 83 82 79 87 93 90
23
v v
Water Company Affinity Water Anglian Bournemouth Bristol Cambridge Dwr Cymru Essex amp Suffolk
Net Promoter Score NA 18 33 29 17 38 19
Net Promoter Score (NPS)Respondents are grouped as follows-Promoters (score 9-10) are loyal enthusiasts -Passives (score 7-8) are satisfied but unenthusiastic customers -Detractors (score 0-6) are unhappy customers
Latest Results - August 2020
Water Company HafrenDyfrdwy Hartlepool Northumbrian Portsmouth Severn Trent South East South
Staffordshire
Net Promoter Score 37 62 22 35 -6 -1 24
Water Company South West Southern Sutton amp East Surrey Thames United
Utilities Wessex Yorkshire
Net Promoter Score -4 -9 7 21 33 33 23
The NPS is calculated by subtracting the of Detractors from the of Promoters
24
v v
Water Company Affinity Water Anglian Bournemouth Bristol Cambridge Dwr Cymru Essex amp Suffolk
Value For Money Water 77 74 85 80 78 77 76
Value For Money Sewage 78 75 83 83 79 79 74
Value For Money (VFM) Water (W) amp Sewerage (S)Customers were asked lsquowhen thinking about value for money how satisfied or dissatisfied are you with the VFM of your servicersquo (0-5 scale) - Percentage who scored their provider with a 4 or 5 ratingrsquo shown
Water Company HafrenDyfrdwy Hartlepool Northumbrian Portsmouth Severn Trent South East South
Staffordshire
Value For Money Water 77 82 79 77 78 70 76
Value For Money Sewage 81 84 84 65 80 69 75
Water Company South West Southern Sutton amp East Surrey Thames United
Utilities Wessex Yorkshire
Value For Money Water 65 67 75 75 76 79 79
Value For Money Sewage 66 74 76 75 79 83 80
25
v v
Water Company Affinity Water Anglian Bournemouth Bristol Cambridge Dwr Cymru Essex amp Suffolk
Complaints ndash Writtenper 10000 Properties 156 247 101 172 273 146 316
Complaints ndash Written per 10000 PropertiesLatest Results - September 2020
Water Company HafrenDyfrdwy Hartlepool Northumbrian Portsmouth Severn Trent South East South
Staffordshire
Complaints ndash Writtenper 10000 Properties 345 206 314 109 225 13 168
Water Company South West Southern Sutton amp East Surrey Thames United
Utilities Wessex Yorkshire
Complaints ndash Writtenper 10000 Properties 19 278 113 583 182 118 176
26
v
Performance scorecard
Personal Current Accounts
27
v
BankBuilding Society Monzo Starling Bank First Direct Metro Bank Nationwide Barclays Halifax
Overall Service Quality 86 84 83 81 71 62 62
Overall Service QualityCustomers were asked how likely they would be to recommend their provider to friends and family1
Latest results published in August 2020
These results show the proportion of customers of each provider who said they were lsquoextremely likelyrsquo or lsquovery likelyrsquo to recommend each service1
Access to the full Ipsos Mori Banking metrics surveys published every six months is available here
BankBuilding Society Santander Lloyds Bank Virgin Money HSBC NatWest Bank of
Scotland
Overall Service Quality 61 60 60 59 58 58
Current Account Service QualityBased on the 19 largest personal current account providers in Great Britain
BankBuilding Society
The Co-operative Bank Yorkshire Bank TSB Clydesdale Bank Royal Bank of
Scotland Tesco Bank
Overall Service Quality 57 56 51 51 46 44
28
v
BankBuilding Society Monzo Starling Bank Metro Bank First Direct Nationwide Barclays Halifax
Overall Service Quality 89 88 85 83 81 81 81
Online and Mobile Banking ServicesCustomers were asked how likely they would be to recommend their providerrsquos online and mobile banking services to friends andfamily1
Latest results published in August 2020
These results show the proportion of customers of each provider who said they were lsquoextremely likelyrsquo or lsquovery likelyrsquo to recommend each service1
Access to the full Ipsos Mori Banking metrics surveys published every six months is available here
BankBuilding Society Lloyds Bank Bank of
Scotland Santander NatWest Virgin Money HSBC
Overall Service Quality 78 77 76 75 75 72
Current Account Service QualityBased on the 19 largest personal current account providers in Great Britain
BankBuilding Society Yorkshire Bank Royal Bank of
ScotlandThe Co-
operative Bank Clydesdale Bank TSB Tesco Bank
Overall Service Quality 71 71 67 66 65 59
29
v
Firms offering personal current accounts with most Banking and credit card complaints (per 1000 accounts) H1 2020The data we collect includes complaints on credit cards current accounts packaged accounts savings unregulated loans and overdrafts and other banking For the purpose of accurately displaying data more specific to personal current accounts firms who do not offer personal current accounts have been excluded
A link to the latest FCA complaints data published on 15 December 2020 can be found hereThe figures are complaint numbers opened during the period January 1st 2020 - June 30th 2020 (H1)
Current Account Service QualityBased on the 10 firms offering personal current accounts with most complaints in H1 2020
0
2
4
6
8
10
12
14
Al Rayan Bank PLC Cynergy BankLimited
Barclays Bank Plc Bank of Ireland(UK) Plc
HSBC UK Bank Plc Monzo Bank Ltd Investec Bank PLC Secure Trust BankPlc
Marks amp SpencerFinancial Services
Plc
Tesco PersonalFinance PLC
Com
plai
nts
Firms
Number of complaints on banking and credit cards per 1000 accounts Average complaints per 1000 banking and credit card accounts all firms
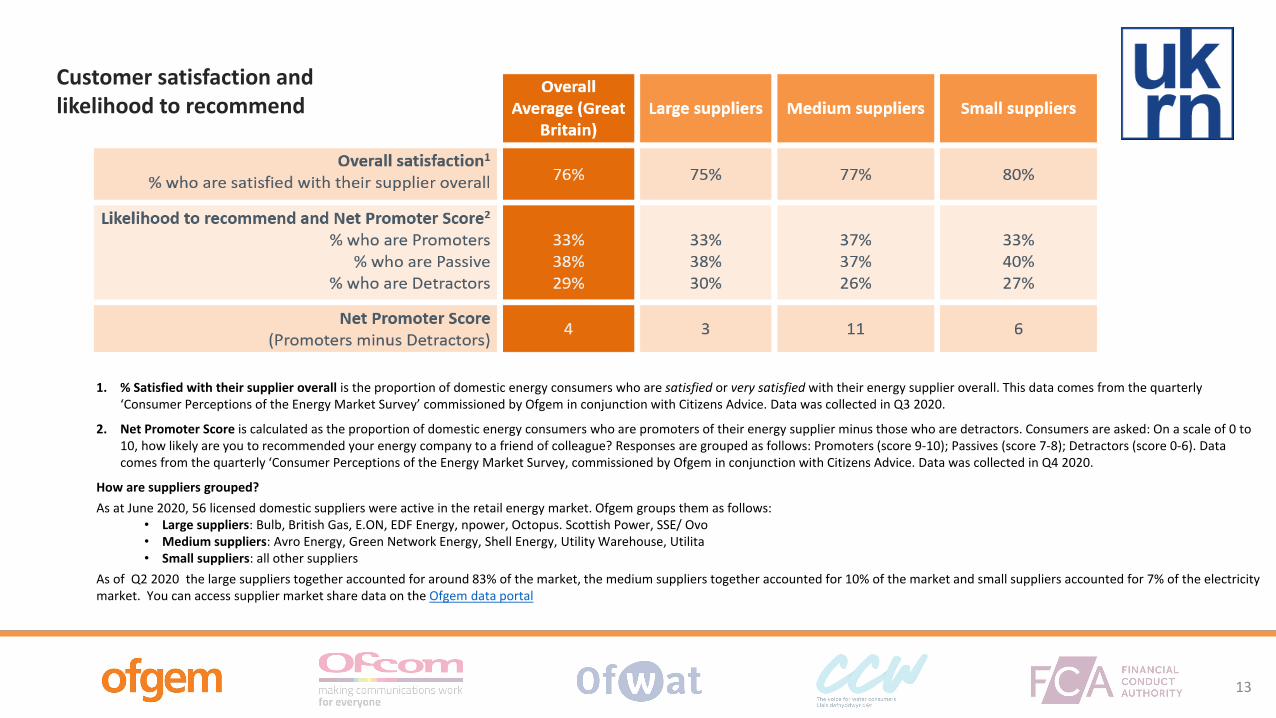
v
1 Satisfied with their supplier overall is the proportion of domestic energy consumers who are satisfied or very satisfied with their energy supplier overall This data comes from the quarterly lsquoConsumer Perceptions of the Energy Market Surveyrsquo commissioned by Ofgem in conjunction with Citizens Advice Data was collected in Q3 2020
2 Net Promoter Score is calculated as the proportion of domestic energy consumers who are promoters of their energy supplier minus those who are detractors Consumers are asked On a scale of 0 to 10 how likely are you to recommended your energy company to a friend of colleague Responses are grouped as follows Promoters (score 9-10) Passives (score 7-8) Detractors (score 0-6) Data comes from the quarterly lsquoConsumer Perceptions of the Energy Market Survey commissioned by Ofgem in conjunction with Citizens Advice Data was collected in Q4 2020
How are suppliers groupedAs at June 2020 56 licensed domestic suppliers were active in the retail energy market Ofgem groups them as follows
bull Large suppliers Bulb British Gas EON EDF Energy npower Octopus Scottish Power SSE Ovobull Medium suppliers Avro Energy Green Network Energy Shell Energy Utility Warehouse Utilitabull Small suppliers all other suppliers
As of Q2 2020 the large suppliers together accounted for around 83 of the market the medium suppliers together accounted for 10 of the market and small suppliers accounted for 7 of the electricity market You can access supplier market share data on the Ofgem data portal
Customer satisfaction and likelihood to recommend
13
v
3 A Standard Variable Tariff (SVT) is a supply contract with an indefinite length that does not have a fixed-term applying to the terms and conditions Itrsquos an energy supplierrsquos basic offer If a customer does not choose a specific energy plan for example after their fixed tariff ends they are moved to an SVT until they choose a new one A customer can also make an active choice to select an SVT Tariffs are calculated for a typical dual fuel customer paying by direct debit This is a customer who takes gas and electricity from the same supplier and consumes 12000kWhyear for gas and 2900kWhyear for electricity
4 Ofgem uses weekly prices across the relevant quarter to calculate the average SVT price and the average cheapest tariff price for each supplier as well as the average market cheapest tariff price When calculating the cheapest tariff at both individual supplier and market level Ofgem excludes tariffs restricted to certain regions This is to give a representative picture of tariffs generally available to all customers across Great Britain When calculating the cheapest tariff at individual supplier level tariffs only available to existing customers (also known as lsquoretention tariffs) are included Tariffs only available to new customers (also known as lsquoacquisitionrsquo tariffs) are excluded
This information is available and regularly updated on Ofgems data portal
Energy prices September 2020For a typical dual fuel customer paying by direct debit
The relevant default tariff cap during this period was pound 1127 Visit Ofgemrsquos website to learn more about the default tariff price cap The cheapest in market was pound790
Large and medium suppliers
14
v
Complaints data refers to complaints directly received by suppliers This information is available and regularly updated on Ofgems data portal
Customer complaints Q3 2020
Large and medium suppliers
15
v
Note as many small suppliers have fewer than 100000 (one hundred thousand) customers complaints data is reported as number of complaints per 10000 (ten thousand) customersComplaints data refers to complaints directly received by suppliers This information is available and regularly updated on Ofgems data portal
Energy provider Igloo Energy Nabuh Energy Orbit Energy PFP Pure Planet SimplicityEnergy So Energy
Number of complaints received per 10K gas and electricity accounts 30 373 229 37 80 24 30
Energy provider Social Energy TogetherEnergy Utility Point Yorkshire
Energy Zog Energy Zebra Power
Number of complaints received per 10K gas and electricity accounts 184 195 29 112 11 7
Energy provider Affect Energy Bristol Energy Daligas E ESB Energy Ecotricity Entice Energy
Number of complaints received per 10K gas and electricity accounts 65 163 27 87 31 114 33
Energy provider EnstrogaEnergy Foxglove Good Energy Green Green Energy
UK GoTo Energy Gulf Gas ampPower
Number of complaints received per 10K gas and electricity accounts 154 17 97 12 6 19 40
Selection of small suppliers
Customer complaints Q3 2020
16
v v
Performance scorecard
Telecoms
17
v v
1 Source Ofcom Customer Satisfaction Tracker 2020 2 Source Ofcom CCT data Notes All figures are rounded to the nearest whole number the overall average relates only to the providers included in the analysis Annualised for 2019 Visit Ofcomrsquos website to see
the latest quarterly telecoms complaints data 3 Source Ofcom Customer Satisfaction Tracker 2020 Notes the industry average relates only to the providers included in the analysis Satisfaction with value for money data only asked among those with a
standalone service so does not include those who purchase their mobile service as part of a bundle No data for satisfaction with value for money for BT and Virgin Mobile due to insufficient base size
Mobile providersOverallaverage
Satisfaction1 93 NA 93 95 NA 93 NA 97 89 93 90
NPS1 25 NA 17 52 NA 30 NA 44 10 26 27
Complaints to Ofcomper 100k subscribers2 13 21 7 NA 10 9 11 3 15 27 26
Satisfaction with value for money3 87 NA 84 96 NA 87 NA 97 87 NA 83
significantly higher or lower than previous year at the 99 confidence level for market research results
X
significantly higher or lower than the overall sector average at the 95 confidence level for market research results
X
significantly higher or lower than the overall sector average at the 95 confidence level for market research results
18
v v
Broadband providers Overallaverage
Satisfaction1 85 86 88 NA 93 NA 86 78 85 NA
NPS1 12 12 17 NA 15 NA 9 -5 19 NA
Complaints to Ofcomper 100k subscribers2 52 50 22 NA 100 37 21 87 60 115
Landline providers
Satisfaction1 85 90 82 NA 83 NA 88 83 77 NA
NPS1 12 19 11 NA 27 NA 10 9 5 NA
Complaints to Ofcomper 100k subscribers2 38 31 17 NA 78 34 18 69 49 65
1 Source Ofcom Customer Satisfaction Tracker 2020 Note the overall average relates only to the providers included in the analysis (inclusion criteria providers with a 4 more market share) No data for KCOM or Post Office due to not meeting the inclusion criteria for this study
2 Source Ofcom CCT data Notes All figures are rounded to the nearest whole number the overall average relates only to the providers included in the analysis Annualised for 2019 Visit Ofcomrsquos website to see the latest quarterly telecoms complaints data Note Satisfaction with value for money data is not available for landline and broadband because the question was only asked among those with a standalone service
significantly higher or lower than previous year at the 99 confidence level for market research results
X
significantly higher or lower than the overall sector average at the 95 confidence level for market research results
X
significantly higher or lower than the overall sector average at the 95 confidence level for market research results
19
v v
Notes Based on September 2019 pricing information Ofcom monitors and reports separately on the extent to which broadband providers differentiate their prices for different groups of customers The latest broadband pricing data we have can be found atPricing trends in communication services 2019 Helping consumers get better deals A review of pricing practices in fixed broadband and Affordability of communications services A summary of initial findings
Monitoring headline customer outcomes
20
v v
Performance scorecard
Water and sewage
21
v v
Water Company Affinity Water Anglian Bournemouth Bristol Cambridge Dwr Cymru Essex amp Suffolk
Likelihood to Recommend 35 40 49 48 41 53 41
Likelihood to RecommendCustomers were asked how likely they would be to recommend their water company (0-10 scale)Percentage who scored their provider with 9 or 10 ratingrsquo shown
Latest Results - August 2020
Water Company HafrenDyfrdwy Hartlepool Northumbrian Portsmouth Severn Trent South East South
Staffordshire
Likelihood to Recommend 44 71 56 50 45 33 48
Water Company South West Southern Sutton amp East Surrey Thames United
Utilities Wessex Yorkshire
Likelihood to Recommend 30 29 34 25 44 51 50
22
v v
Water Company Affinity Water Anglian Bournemouth Bristol Cambridge Dwr Cymru Essex amp
Suffolk
Satisfaction with Service Water 90 88 94 94 96 94 91
Satisfaction with Service Sewage 87 85 89 92 87 85 87
Satisfaction Water (W) amp Sewerage (S)Customers were asked lsquowhen thinking about satisfaction with water services and satisfaction with sewerage services how satisfied or dissatisfied are with your servicersquo (0-5 scale) -Percentage who scored their provider with a 4 or 5 ratingrsquo shown
Water Company HafrenDyfrdwy Hartlepool Northumbrian Portsmouth Severn Trent South East South
Staffordshire
Satisfaction with Service Water 92 93 93 96 94 86 93
Satisfaction with Service Sewage 89 89 91 80 91 80 90
Water Company South West Southern Sutton amp East Surrey Thames United
Utilities Wessex Yorkshire
Satisfaction with Service Water 93 89 95 87 93 93 94
Satisfaction with Service Sewage 85 83 82 79 87 93 90
23
v v
Water Company Affinity Water Anglian Bournemouth Bristol Cambridge Dwr Cymru Essex amp Suffolk
Net Promoter Score NA 18 33 29 17 38 19
Net Promoter Score (NPS)Respondents are grouped as follows-Promoters (score 9-10) are loyal enthusiasts -Passives (score 7-8) are satisfied but unenthusiastic customers -Detractors (score 0-6) are unhappy customers
Latest Results - August 2020
Water Company HafrenDyfrdwy Hartlepool Northumbrian Portsmouth Severn Trent South East South
Staffordshire
Net Promoter Score 37 62 22 35 -6 -1 24
Water Company South West Southern Sutton amp East Surrey Thames United
Utilities Wessex Yorkshire
Net Promoter Score -4 -9 7 21 33 33 23
The NPS is calculated by subtracting the of Detractors from the of Promoters
24
v v
Water Company Affinity Water Anglian Bournemouth Bristol Cambridge Dwr Cymru Essex amp Suffolk
Value For Money Water 77 74 85 80 78 77 76
Value For Money Sewage 78 75 83 83 79 79 74
Value For Money (VFM) Water (W) amp Sewerage (S)Customers were asked lsquowhen thinking about value for money how satisfied or dissatisfied are you with the VFM of your servicersquo (0-5 scale) - Percentage who scored their provider with a 4 or 5 ratingrsquo shown
Water Company HafrenDyfrdwy Hartlepool Northumbrian Portsmouth Severn Trent South East South
Staffordshire
Value For Money Water 77 82 79 77 78 70 76
Value For Money Sewage 81 84 84 65 80 69 75
Water Company South West Southern Sutton amp East Surrey Thames United
Utilities Wessex Yorkshire
Value For Money Water 65 67 75 75 76 79 79
Value For Money Sewage 66 74 76 75 79 83 80
25
v v
Water Company Affinity Water Anglian Bournemouth Bristol Cambridge Dwr Cymru Essex amp Suffolk
Complaints ndash Writtenper 10000 Properties 156 247 101 172 273 146 316
Complaints ndash Written per 10000 PropertiesLatest Results - September 2020
Water Company HafrenDyfrdwy Hartlepool Northumbrian Portsmouth Severn Trent South East South
Staffordshire
Complaints ndash Writtenper 10000 Properties 345 206 314 109 225 13 168
Water Company South West Southern Sutton amp East Surrey Thames United
Utilities Wessex Yorkshire
Complaints ndash Writtenper 10000 Properties 19 278 113 583 182 118 176
26
v
Performance scorecard
Personal Current Accounts
27
v
BankBuilding Society Monzo Starling Bank First Direct Metro Bank Nationwide Barclays Halifax
Overall Service Quality 86 84 83 81 71 62 62
Overall Service QualityCustomers were asked how likely they would be to recommend their provider to friends and family1
Latest results published in August 2020
These results show the proportion of customers of each provider who said they were lsquoextremely likelyrsquo or lsquovery likelyrsquo to recommend each service1
Access to the full Ipsos Mori Banking metrics surveys published every six months is available here
BankBuilding Society Santander Lloyds Bank Virgin Money HSBC NatWest Bank of
Scotland
Overall Service Quality 61 60 60 59 58 58
Current Account Service QualityBased on the 19 largest personal current account providers in Great Britain
BankBuilding Society
The Co-operative Bank Yorkshire Bank TSB Clydesdale Bank Royal Bank of
Scotland Tesco Bank
Overall Service Quality 57 56 51 51 46 44
28
v
BankBuilding Society Monzo Starling Bank Metro Bank First Direct Nationwide Barclays Halifax
Overall Service Quality 89 88 85 83 81 81 81
Online and Mobile Banking ServicesCustomers were asked how likely they would be to recommend their providerrsquos online and mobile banking services to friends andfamily1
Latest results published in August 2020
These results show the proportion of customers of each provider who said they were lsquoextremely likelyrsquo or lsquovery likelyrsquo to recommend each service1
Access to the full Ipsos Mori Banking metrics surveys published every six months is available here
BankBuilding Society Lloyds Bank Bank of
Scotland Santander NatWest Virgin Money HSBC
Overall Service Quality 78 77 76 75 75 72
Current Account Service QualityBased on the 19 largest personal current account providers in Great Britain
BankBuilding Society Yorkshire Bank Royal Bank of
ScotlandThe Co-
operative Bank Clydesdale Bank TSB Tesco Bank
Overall Service Quality 71 71 67 66 65 59
29
v
Firms offering personal current accounts with most Banking and credit card complaints (per 1000 accounts) H1 2020The data we collect includes complaints on credit cards current accounts packaged accounts savings unregulated loans and overdrafts and other banking For the purpose of accurately displaying data more specific to personal current accounts firms who do not offer personal current accounts have been excluded
A link to the latest FCA complaints data published on 15 December 2020 can be found hereThe figures are complaint numbers opened during the period January 1st 2020 - June 30th 2020 (H1)
Current Account Service QualityBased on the 10 firms offering personal current accounts with most complaints in H1 2020
0
2
4
6
8
10
12
14
Al Rayan Bank PLC Cynergy BankLimited
Barclays Bank Plc Bank of Ireland(UK) Plc
HSBC UK Bank Plc Monzo Bank Ltd Investec Bank PLC Secure Trust BankPlc
Marks amp SpencerFinancial Services
Plc
Tesco PersonalFinance PLC
Com
plai
nts
Firms
Number of complaints on banking and credit cards per 1000 accounts Average complaints per 1000 banking and credit card accounts all firms
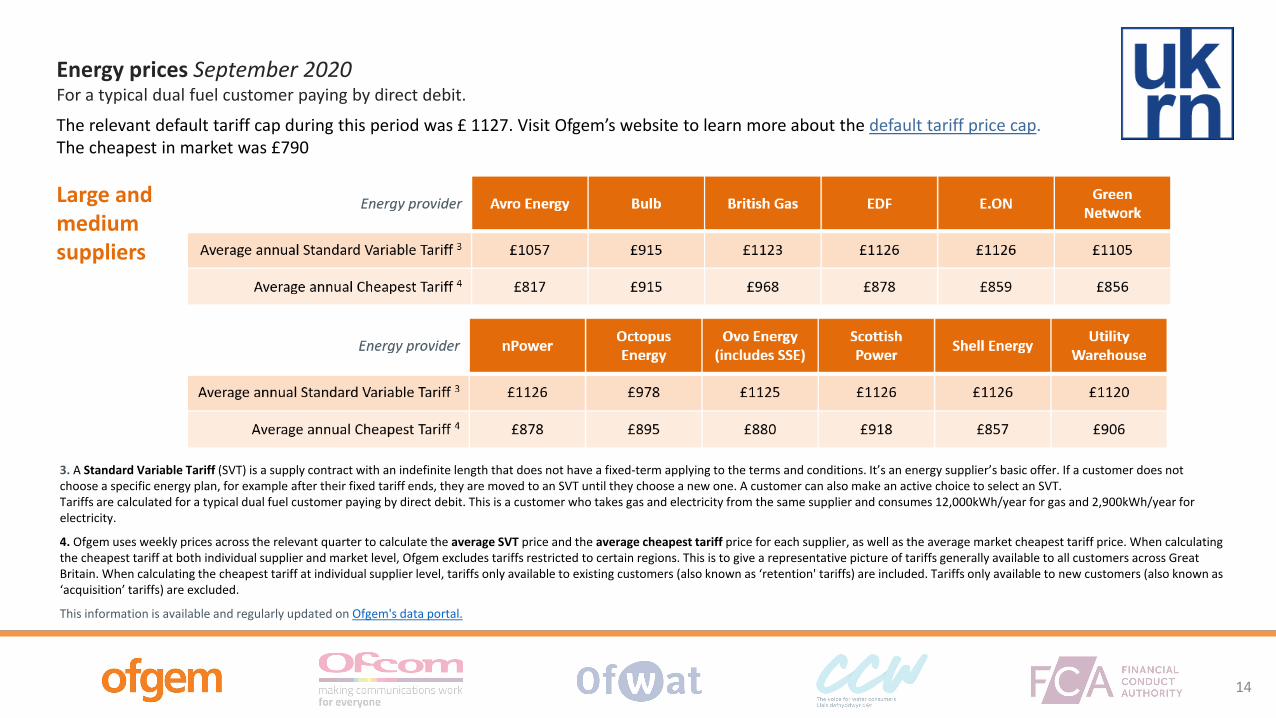
v
3 A Standard Variable Tariff (SVT) is a supply contract with an indefinite length that does not have a fixed-term applying to the terms and conditions Itrsquos an energy supplierrsquos basic offer If a customer does not choose a specific energy plan for example after their fixed tariff ends they are moved to an SVT until they choose a new one A customer can also make an active choice to select an SVT Tariffs are calculated for a typical dual fuel customer paying by direct debit This is a customer who takes gas and electricity from the same supplier and consumes 12000kWhyear for gas and 2900kWhyear for electricity
4 Ofgem uses weekly prices across the relevant quarter to calculate the average SVT price and the average cheapest tariff price for each supplier as well as the average market cheapest tariff price When calculating the cheapest tariff at both individual supplier and market level Ofgem excludes tariffs restricted to certain regions This is to give a representative picture of tariffs generally available to all customers across Great Britain When calculating the cheapest tariff at individual supplier level tariffs only available to existing customers (also known as lsquoretention tariffs) are included Tariffs only available to new customers (also known as lsquoacquisitionrsquo tariffs) are excluded
This information is available and regularly updated on Ofgems data portal
Energy prices September 2020For a typical dual fuel customer paying by direct debit
The relevant default tariff cap during this period was pound 1127 Visit Ofgemrsquos website to learn more about the default tariff price cap The cheapest in market was pound790
Large and medium suppliers
14
v
Complaints data refers to complaints directly received by suppliers This information is available and regularly updated on Ofgems data portal
Customer complaints Q3 2020
Large and medium suppliers
15
v
Note as many small suppliers have fewer than 100000 (one hundred thousand) customers complaints data is reported as number of complaints per 10000 (ten thousand) customersComplaints data refers to complaints directly received by suppliers This information is available and regularly updated on Ofgems data portal
Energy provider Igloo Energy Nabuh Energy Orbit Energy PFP Pure Planet SimplicityEnergy So Energy
Number of complaints received per 10K gas and electricity accounts 30 373 229 37 80 24 30
Energy provider Social Energy TogetherEnergy Utility Point Yorkshire
Energy Zog Energy Zebra Power
Number of complaints received per 10K gas and electricity accounts 184 195 29 112 11 7
Energy provider Affect Energy Bristol Energy Daligas E ESB Energy Ecotricity Entice Energy
Number of complaints received per 10K gas and electricity accounts 65 163 27 87 31 114 33
Energy provider EnstrogaEnergy Foxglove Good Energy Green Green Energy
UK GoTo Energy Gulf Gas ampPower
Number of complaints received per 10K gas and electricity accounts 154 17 97 12 6 19 40
Selection of small suppliers
Customer complaints Q3 2020
16
v v
Performance scorecard
Telecoms
17
v v
1 Source Ofcom Customer Satisfaction Tracker 2020 2 Source Ofcom CCT data Notes All figures are rounded to the nearest whole number the overall average relates only to the providers included in the analysis Annualised for 2019 Visit Ofcomrsquos website to see
the latest quarterly telecoms complaints data 3 Source Ofcom Customer Satisfaction Tracker 2020 Notes the industry average relates only to the providers included in the analysis Satisfaction with value for money data only asked among those with a
standalone service so does not include those who purchase their mobile service as part of a bundle No data for satisfaction with value for money for BT and Virgin Mobile due to insufficient base size
Mobile providersOverallaverage
Satisfaction1 93 NA 93 95 NA 93 NA 97 89 93 90
NPS1 25 NA 17 52 NA 30 NA 44 10 26 27
Complaints to Ofcomper 100k subscribers2 13 21 7 NA 10 9 11 3 15 27 26
Satisfaction with value for money3 87 NA 84 96 NA 87 NA 97 87 NA 83
significantly higher or lower than previous year at the 99 confidence level for market research results
X
significantly higher or lower than the overall sector average at the 95 confidence level for market research results
X
significantly higher or lower than the overall sector average at the 95 confidence level for market research results
18
v v
Broadband providers Overallaverage
Satisfaction1 85 86 88 NA 93 NA 86 78 85 NA
NPS1 12 12 17 NA 15 NA 9 -5 19 NA
Complaints to Ofcomper 100k subscribers2 52 50 22 NA 100 37 21 87 60 115
Landline providers
Satisfaction1 85 90 82 NA 83 NA 88 83 77 NA
NPS1 12 19 11 NA 27 NA 10 9 5 NA
Complaints to Ofcomper 100k subscribers2 38 31 17 NA 78 34 18 69 49 65
1 Source Ofcom Customer Satisfaction Tracker 2020 Note the overall average relates only to the providers included in the analysis (inclusion criteria providers with a 4 more market share) No data for KCOM or Post Office due to not meeting the inclusion criteria for this study
2 Source Ofcom CCT data Notes All figures are rounded to the nearest whole number the overall average relates only to the providers included in the analysis Annualised for 2019 Visit Ofcomrsquos website to see the latest quarterly telecoms complaints data Note Satisfaction with value for money data is not available for landline and broadband because the question was only asked among those with a standalone service
significantly higher or lower than previous year at the 99 confidence level for market research results
X
significantly higher or lower than the overall sector average at the 95 confidence level for market research results
X
significantly higher or lower than the overall sector average at the 95 confidence level for market research results
19
v v
Notes Based on September 2019 pricing information Ofcom monitors and reports separately on the extent to which broadband providers differentiate their prices for different groups of customers The latest broadband pricing data we have can be found atPricing trends in communication services 2019 Helping consumers get better deals A review of pricing practices in fixed broadband and Affordability of communications services A summary of initial findings
Monitoring headline customer outcomes
20
v v
Performance scorecard
Water and sewage
21
v v
Water Company Affinity Water Anglian Bournemouth Bristol Cambridge Dwr Cymru Essex amp Suffolk
Likelihood to Recommend 35 40 49 48 41 53 41
Likelihood to RecommendCustomers were asked how likely they would be to recommend their water company (0-10 scale)Percentage who scored their provider with 9 or 10 ratingrsquo shown
Latest Results - August 2020
Water Company HafrenDyfrdwy Hartlepool Northumbrian Portsmouth Severn Trent South East South
Staffordshire
Likelihood to Recommend 44 71 56 50 45 33 48
Water Company South West Southern Sutton amp East Surrey Thames United
Utilities Wessex Yorkshire
Likelihood to Recommend 30 29 34 25 44 51 50
22
v v
Water Company Affinity Water Anglian Bournemouth Bristol Cambridge Dwr Cymru Essex amp
Suffolk
Satisfaction with Service Water 90 88 94 94 96 94 91
Satisfaction with Service Sewage 87 85 89 92 87 85 87
Satisfaction Water (W) amp Sewerage (S)Customers were asked lsquowhen thinking about satisfaction with water services and satisfaction with sewerage services how satisfied or dissatisfied are with your servicersquo (0-5 scale) -Percentage who scored their provider with a 4 or 5 ratingrsquo shown
Water Company HafrenDyfrdwy Hartlepool Northumbrian Portsmouth Severn Trent South East South
Staffordshire
Satisfaction with Service Water 92 93 93 96 94 86 93
Satisfaction with Service Sewage 89 89 91 80 91 80 90
Water Company South West Southern Sutton amp East Surrey Thames United
Utilities Wessex Yorkshire
Satisfaction with Service Water 93 89 95 87 93 93 94
Satisfaction with Service Sewage 85 83 82 79 87 93 90
23
v v
Water Company Affinity Water Anglian Bournemouth Bristol Cambridge Dwr Cymru Essex amp Suffolk
Net Promoter Score NA 18 33 29 17 38 19
Net Promoter Score (NPS)Respondents are grouped as follows-Promoters (score 9-10) are loyal enthusiasts -Passives (score 7-8) are satisfied but unenthusiastic customers -Detractors (score 0-6) are unhappy customers
Latest Results - August 2020
Water Company HafrenDyfrdwy Hartlepool Northumbrian Portsmouth Severn Trent South East South
Staffordshire
Net Promoter Score 37 62 22 35 -6 -1 24
Water Company South West Southern Sutton amp East Surrey Thames United
Utilities Wessex Yorkshire
Net Promoter Score -4 -9 7 21 33 33 23
The NPS is calculated by subtracting the of Detractors from the of Promoters
24
v v
Water Company Affinity Water Anglian Bournemouth Bristol Cambridge Dwr Cymru Essex amp Suffolk
Value For Money Water 77 74 85 80 78 77 76
Value For Money Sewage 78 75 83 83 79 79 74
Value For Money (VFM) Water (W) amp Sewerage (S)Customers were asked lsquowhen thinking about value for money how satisfied or dissatisfied are you with the VFM of your servicersquo (0-5 scale) - Percentage who scored their provider with a 4 or 5 ratingrsquo shown
Water Company HafrenDyfrdwy Hartlepool Northumbrian Portsmouth Severn Trent South East South
Staffordshire
Value For Money Water 77 82 79 77 78 70 76
Value For Money Sewage 81 84 84 65 80 69 75
Water Company South West Southern Sutton amp East Surrey Thames United
Utilities Wessex Yorkshire
Value For Money Water 65 67 75 75 76 79 79
Value For Money Sewage 66 74 76 75 79 83 80
25
v v
Water Company Affinity Water Anglian Bournemouth Bristol Cambridge Dwr Cymru Essex amp Suffolk
Complaints ndash Writtenper 10000 Properties 156 247 101 172 273 146 316
Complaints ndash Written per 10000 PropertiesLatest Results - September 2020
Water Company HafrenDyfrdwy Hartlepool Northumbrian Portsmouth Severn Trent South East South
Staffordshire
Complaints ndash Writtenper 10000 Properties 345 206 314 109 225 13 168
Water Company South West Southern Sutton amp East Surrey Thames United
Utilities Wessex Yorkshire
Complaints ndash Writtenper 10000 Properties 19 278 113 583 182 118 176
26
v
Performance scorecard
Personal Current Accounts
27
v
BankBuilding Society Monzo Starling Bank First Direct Metro Bank Nationwide Barclays Halifax
Overall Service Quality 86 84 83 81 71 62 62
Overall Service QualityCustomers were asked how likely they would be to recommend their provider to friends and family1
Latest results published in August 2020
These results show the proportion of customers of each provider who said they were lsquoextremely likelyrsquo or lsquovery likelyrsquo to recommend each service1
Access to the full Ipsos Mori Banking metrics surveys published every six months is available here
BankBuilding Society Santander Lloyds Bank Virgin Money HSBC NatWest Bank of
Scotland
Overall Service Quality 61 60 60 59 58 58
Current Account Service QualityBased on the 19 largest personal current account providers in Great Britain
BankBuilding Society
The Co-operative Bank Yorkshire Bank TSB Clydesdale Bank Royal Bank of
Scotland Tesco Bank
Overall Service Quality 57 56 51 51 46 44
28
v
BankBuilding Society Monzo Starling Bank Metro Bank First Direct Nationwide Barclays Halifax
Overall Service Quality 89 88 85 83 81 81 81
Online and Mobile Banking ServicesCustomers were asked how likely they would be to recommend their providerrsquos online and mobile banking services to friends andfamily1
Latest results published in August 2020
These results show the proportion of customers of each provider who said they were lsquoextremely likelyrsquo or lsquovery likelyrsquo to recommend each service1
Access to the full Ipsos Mori Banking metrics surveys published every six months is available here
BankBuilding Society Lloyds Bank Bank of
Scotland Santander NatWest Virgin Money HSBC
Overall Service Quality 78 77 76 75 75 72
Current Account Service QualityBased on the 19 largest personal current account providers in Great Britain
BankBuilding Society Yorkshire Bank Royal Bank of
ScotlandThe Co-
operative Bank Clydesdale Bank TSB Tesco Bank
Overall Service Quality 71 71 67 66 65 59
29
v
Firms offering personal current accounts with most Banking and credit card complaints (per 1000 accounts) H1 2020The data we collect includes complaints on credit cards current accounts packaged accounts savings unregulated loans and overdrafts and other banking For the purpose of accurately displaying data more specific to personal current accounts firms who do not offer personal current accounts have been excluded
A link to the latest FCA complaints data published on 15 December 2020 can be found hereThe figures are complaint numbers opened during the period January 1st 2020 - June 30th 2020 (H1)
Current Account Service QualityBased on the 10 firms offering personal current accounts with most complaints in H1 2020
0
2
4
6
8
10
12
14
Al Rayan Bank PLC Cynergy BankLimited
Barclays Bank Plc Bank of Ireland(UK) Plc
HSBC UK Bank Plc Monzo Bank Ltd Investec Bank PLC Secure Trust BankPlc
Marks amp SpencerFinancial Services
Plc
Tesco PersonalFinance PLC
Com
plai
nts
Firms
Number of complaints on banking and credit cards per 1000 accounts Average complaints per 1000 banking and credit card accounts all firms
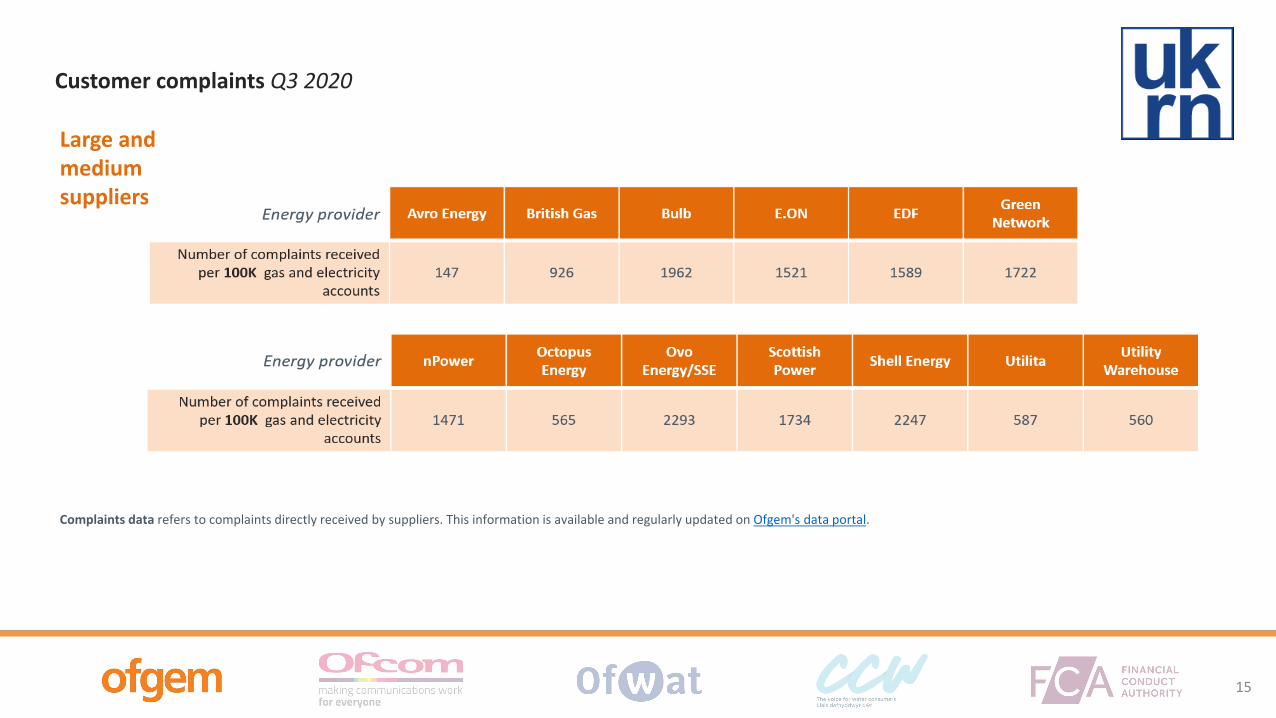
v
Complaints data refers to complaints directly received by suppliers This information is available and regularly updated on Ofgems data portal
Customer complaints Q3 2020
Large and medium suppliers
15
v
Note as many small suppliers have fewer than 100000 (one hundred thousand) customers complaints data is reported as number of complaints per 10000 (ten thousand) customersComplaints data refers to complaints directly received by suppliers This information is available and regularly updated on Ofgems data portal
Energy provider Igloo Energy Nabuh Energy Orbit Energy PFP Pure Planet SimplicityEnergy So Energy
Number of complaints received per 10K gas and electricity accounts 30 373 229 37 80 24 30
Energy provider Social Energy TogetherEnergy Utility Point Yorkshire
Energy Zog Energy Zebra Power
Number of complaints received per 10K gas and electricity accounts 184 195 29 112 11 7
Energy provider Affect Energy Bristol Energy Daligas E ESB Energy Ecotricity Entice Energy
Number of complaints received per 10K gas and electricity accounts 65 163 27 87 31 114 33
Energy provider EnstrogaEnergy Foxglove Good Energy Green Green Energy
UK GoTo Energy Gulf Gas ampPower
Number of complaints received per 10K gas and electricity accounts 154 17 97 12 6 19 40
Selection of small suppliers
Customer complaints Q3 2020
16
v v
Performance scorecard
Telecoms
17
v v
1 Source Ofcom Customer Satisfaction Tracker 2020 2 Source Ofcom CCT data Notes All figures are rounded to the nearest whole number the overall average relates only to the providers included in the analysis Annualised for 2019 Visit Ofcomrsquos website to see
the latest quarterly telecoms complaints data 3 Source Ofcom Customer Satisfaction Tracker 2020 Notes the industry average relates only to the providers included in the analysis Satisfaction with value for money data only asked among those with a
standalone service so does not include those who purchase their mobile service as part of a bundle No data for satisfaction with value for money for BT and Virgin Mobile due to insufficient base size
Mobile providersOverallaverage
Satisfaction1 93 NA 93 95 NA 93 NA 97 89 93 90
NPS1 25 NA 17 52 NA 30 NA 44 10 26 27
Complaints to Ofcomper 100k subscribers2 13 21 7 NA 10 9 11 3 15 27 26
Satisfaction with value for money3 87 NA 84 96 NA 87 NA 97 87 NA 83
significantly higher or lower than previous year at the 99 confidence level for market research results
X
significantly higher or lower than the overall sector average at the 95 confidence level for market research results
X
significantly higher or lower than the overall sector average at the 95 confidence level for market research results
18
v v
Broadband providers Overallaverage
Satisfaction1 85 86 88 NA 93 NA 86 78 85 NA
NPS1 12 12 17 NA 15 NA 9 -5 19 NA
Complaints to Ofcomper 100k subscribers2 52 50 22 NA 100 37 21 87 60 115
Landline providers
Satisfaction1 85 90 82 NA 83 NA 88 83 77 NA
NPS1 12 19 11 NA 27 NA 10 9 5 NA
Complaints to Ofcomper 100k subscribers2 38 31 17 NA 78 34 18 69 49 65
1 Source Ofcom Customer Satisfaction Tracker 2020 Note the overall average relates only to the providers included in the analysis (inclusion criteria providers with a 4 more market share) No data for KCOM or Post Office due to not meeting the inclusion criteria for this study
2 Source Ofcom CCT data Notes All figures are rounded to the nearest whole number the overall average relates only to the providers included in the analysis Annualised for 2019 Visit Ofcomrsquos website to see the latest quarterly telecoms complaints data Note Satisfaction with value for money data is not available for landline and broadband because the question was only asked among those with a standalone service
significantly higher or lower than previous year at the 99 confidence level for market research results
X
significantly higher or lower than the overall sector average at the 95 confidence level for market research results
X
significantly higher or lower than the overall sector average at the 95 confidence level for market research results
19
v v
Notes Based on September 2019 pricing information Ofcom monitors and reports separately on the extent to which broadband providers differentiate their prices for different groups of customers The latest broadband pricing data we have can be found atPricing trends in communication services 2019 Helping consumers get better deals A review of pricing practices in fixed broadband and Affordability of communications services A summary of initial findings
Monitoring headline customer outcomes
20
v v
Performance scorecard
Water and sewage
21
v v
Water Company Affinity Water Anglian Bournemouth Bristol Cambridge Dwr Cymru Essex amp Suffolk
Likelihood to Recommend 35 40 49 48 41 53 41
Likelihood to RecommendCustomers were asked how likely they would be to recommend their water company (0-10 scale)Percentage who scored their provider with 9 or 10 ratingrsquo shown
Latest Results - August 2020
Water Company HafrenDyfrdwy Hartlepool Northumbrian Portsmouth Severn Trent South East South
Staffordshire
Likelihood to Recommend 44 71 56 50 45 33 48
Water Company South West Southern Sutton amp East Surrey Thames United
Utilities Wessex Yorkshire
Likelihood to Recommend 30 29 34 25 44 51 50
22
v v
Water Company Affinity Water Anglian Bournemouth Bristol Cambridge Dwr Cymru Essex amp
Suffolk
Satisfaction with Service Water 90 88 94 94 96 94 91
Satisfaction with Service Sewage 87 85 89 92 87 85 87
Satisfaction Water (W) amp Sewerage (S)Customers were asked lsquowhen thinking about satisfaction with water services and satisfaction with sewerage services how satisfied or dissatisfied are with your servicersquo (0-5 scale) -Percentage who scored their provider with a 4 or 5 ratingrsquo shown
Water Company HafrenDyfrdwy Hartlepool Northumbrian Portsmouth Severn Trent South East South
Staffordshire
Satisfaction with Service Water 92 93 93 96 94 86 93
Satisfaction with Service Sewage 89 89 91 80 91 80 90
Water Company South West Southern Sutton amp East Surrey Thames United
Utilities Wessex Yorkshire
Satisfaction with Service Water 93 89 95 87 93 93 94
Satisfaction with Service Sewage 85 83 82 79 87 93 90
23
v v
Water Company Affinity Water Anglian Bournemouth Bristol Cambridge Dwr Cymru Essex amp Suffolk
Net Promoter Score NA 18 33 29 17 38 19
Net Promoter Score (NPS)Respondents are grouped as follows-Promoters (score 9-10) are loyal enthusiasts -Passives (score 7-8) are satisfied but unenthusiastic customers -Detractors (score 0-6) are unhappy customers
Latest Results - August 2020
Water Company HafrenDyfrdwy Hartlepool Northumbrian Portsmouth Severn Trent South East South
Staffordshire
Net Promoter Score 37 62 22 35 -6 -1 24
Water Company South West Southern Sutton amp East Surrey Thames United
Utilities Wessex Yorkshire
Net Promoter Score -4 -9 7 21 33 33 23
The NPS is calculated by subtracting the of Detractors from the of Promoters
24
v v
Water Company Affinity Water Anglian Bournemouth Bristol Cambridge Dwr Cymru Essex amp Suffolk
Value For Money Water 77 74 85 80 78 77 76
Value For Money Sewage 78 75 83 83 79 79 74
Value For Money (VFM) Water (W) amp Sewerage (S)Customers were asked lsquowhen thinking about value for money how satisfied or dissatisfied are you with the VFM of your servicersquo (0-5 scale) - Percentage who scored their provider with a 4 or 5 ratingrsquo shown
Water Company HafrenDyfrdwy Hartlepool Northumbrian Portsmouth Severn Trent South East South
Staffordshire
Value For Money Water 77 82 79 77 78 70 76
Value For Money Sewage 81 84 84 65 80 69 75
Water Company South West Southern Sutton amp East Surrey Thames United
Utilities Wessex Yorkshire
Value For Money Water 65 67 75 75 76 79 79
Value For Money Sewage 66 74 76 75 79 83 80
25
v v
Water Company Affinity Water Anglian Bournemouth Bristol Cambridge Dwr Cymru Essex amp Suffolk
Complaints ndash Writtenper 10000 Properties 156 247 101 172 273 146 316
Complaints ndash Written per 10000 PropertiesLatest Results - September 2020
Water Company HafrenDyfrdwy Hartlepool Northumbrian Portsmouth Severn Trent South East South
Staffordshire
Complaints ndash Writtenper 10000 Properties 345 206 314 109 225 13 168
Water Company South West Southern Sutton amp East Surrey Thames United
Utilities Wessex Yorkshire
Complaints ndash Writtenper 10000 Properties 19 278 113 583 182 118 176
26
v
Performance scorecard
Personal Current Accounts
27
v
BankBuilding Society Monzo Starling Bank First Direct Metro Bank Nationwide Barclays Halifax
Overall Service Quality 86 84 83 81 71 62 62
Overall Service QualityCustomers were asked how likely they would be to recommend their provider to friends and family1
Latest results published in August 2020
These results show the proportion of customers of each provider who said they were lsquoextremely likelyrsquo or lsquovery likelyrsquo to recommend each service1
Access to the full Ipsos Mori Banking metrics surveys published every six months is available here
BankBuilding Society Santander Lloyds Bank Virgin Money HSBC NatWest Bank of
Scotland
Overall Service Quality 61 60 60 59 58 58
Current Account Service QualityBased on the 19 largest personal current account providers in Great Britain
BankBuilding Society
The Co-operative Bank Yorkshire Bank TSB Clydesdale Bank Royal Bank of
Scotland Tesco Bank
Overall Service Quality 57 56 51 51 46 44
28
v
BankBuilding Society Monzo Starling Bank Metro Bank First Direct Nationwide Barclays Halifax
Overall Service Quality 89 88 85 83 81 81 81
Online and Mobile Banking ServicesCustomers were asked how likely they would be to recommend their providerrsquos online and mobile banking services to friends andfamily1
Latest results published in August 2020
These results show the proportion of customers of each provider who said they were lsquoextremely likelyrsquo or lsquovery likelyrsquo to recommend each service1
Access to the full Ipsos Mori Banking metrics surveys published every six months is available here
BankBuilding Society Lloyds Bank Bank of
Scotland Santander NatWest Virgin Money HSBC
Overall Service Quality 78 77 76 75 75 72
Current Account Service QualityBased on the 19 largest personal current account providers in Great Britain
BankBuilding Society Yorkshire Bank Royal Bank of
ScotlandThe Co-
operative Bank Clydesdale Bank TSB Tesco Bank
Overall Service Quality 71 71 67 66 65 59
29
v
Firms offering personal current accounts with most Banking and credit card complaints (per 1000 accounts) H1 2020The data we collect includes complaints on credit cards current accounts packaged accounts savings unregulated loans and overdrafts and other banking For the purpose of accurately displaying data more specific to personal current accounts firms who do not offer personal current accounts have been excluded
A link to the latest FCA complaints data published on 15 December 2020 can be found hereThe figures are complaint numbers opened during the period January 1st 2020 - June 30th 2020 (H1)
Current Account Service QualityBased on the 10 firms offering personal current accounts with most complaints in H1 2020
0
2
4
6
8
10
12
14
Al Rayan Bank PLC Cynergy BankLimited
Barclays Bank Plc Bank of Ireland(UK) Plc
HSBC UK Bank Plc Monzo Bank Ltd Investec Bank PLC Secure Trust BankPlc
Marks amp SpencerFinancial Services
Plc
Tesco PersonalFinance PLC
Com
plai
nts
Firms
Number of complaints on banking and credit cards per 1000 accounts Average complaints per 1000 banking and credit card accounts all firms
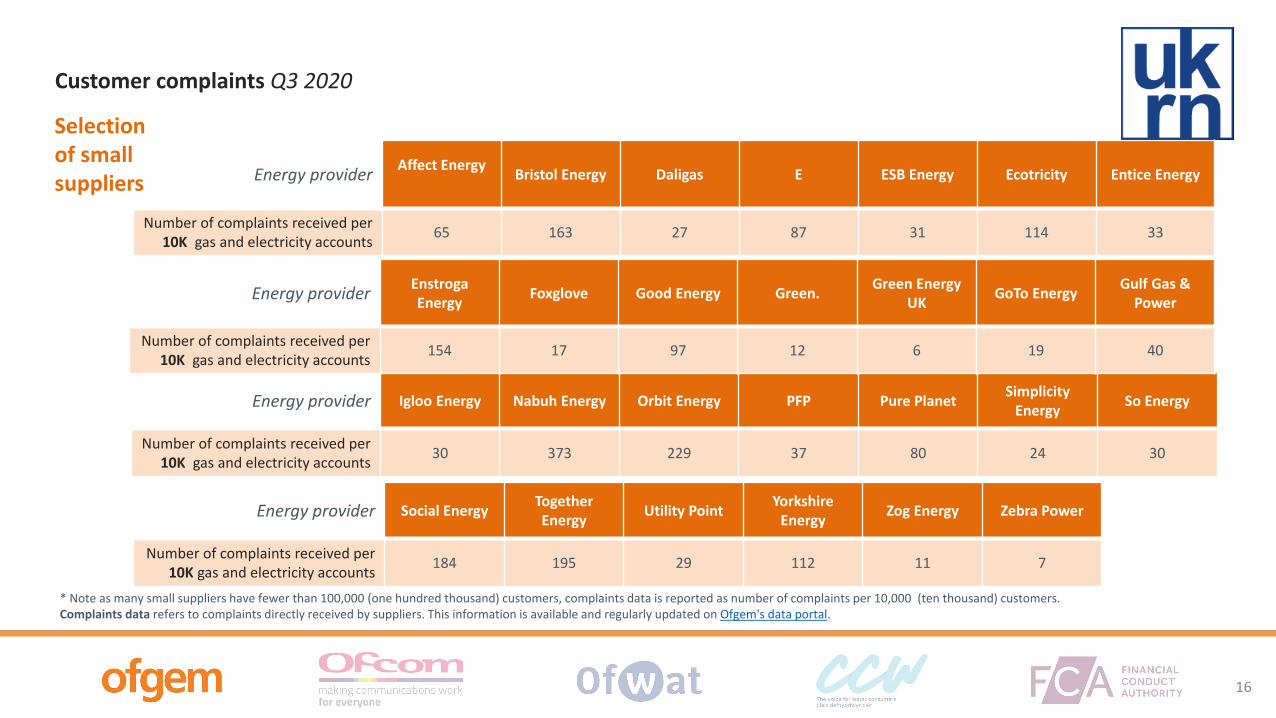
v
Note as many small suppliers have fewer than 100000 (one hundred thousand) customers complaints data is reported as number of complaints per 10000 (ten thousand) customersComplaints data refers to complaints directly received by suppliers This information is available and regularly updated on Ofgems data portal
Energy provider Igloo Energy Nabuh Energy Orbit Energy PFP Pure Planet SimplicityEnergy So Energy
Number of complaints received per 10K gas and electricity accounts 30 373 229 37 80 24 30
Energy provider Social Energy TogetherEnergy Utility Point Yorkshire
Energy Zog Energy Zebra Power
Number of complaints received per 10K gas and electricity accounts 184 195 29 112 11 7
Energy provider Affect Energy Bristol Energy Daligas E ESB Energy Ecotricity Entice Energy
Number of complaints received per 10K gas and electricity accounts 65 163 27 87 31 114 33
Energy provider EnstrogaEnergy Foxglove Good Energy Green Green Energy
UK GoTo Energy Gulf Gas ampPower
Number of complaints received per 10K gas and electricity accounts 154 17 97 12 6 19 40
Selection of small suppliers
Customer complaints Q3 2020
16
v v
Performance scorecard
Telecoms
17
v v
1 Source Ofcom Customer Satisfaction Tracker 2020 2 Source Ofcom CCT data Notes All figures are rounded to the nearest whole number the overall average relates only to the providers included in the analysis Annualised for 2019 Visit Ofcomrsquos website to see
the latest quarterly telecoms complaints data 3 Source Ofcom Customer Satisfaction Tracker 2020 Notes the industry average relates only to the providers included in the analysis Satisfaction with value for money data only asked among those with a
standalone service so does not include those who purchase their mobile service as part of a bundle No data for satisfaction with value for money for BT and Virgin Mobile due to insufficient base size
Mobile providersOverallaverage
Satisfaction1 93 NA 93 95 NA 93 NA 97 89 93 90
NPS1 25 NA 17 52 NA 30 NA 44 10 26 27
Complaints to Ofcomper 100k subscribers2 13 21 7 NA 10 9 11 3 15 27 26
Satisfaction with value for money3 87 NA 84 96 NA 87 NA 97 87 NA 83
significantly higher or lower than previous year at the 99 confidence level for market research results
X
significantly higher or lower than the overall sector average at the 95 confidence level for market research results
X
significantly higher or lower than the overall sector average at the 95 confidence level for market research results
18
v v
Broadband providers Overallaverage
Satisfaction1 85 86 88 NA 93 NA 86 78 85 NA
NPS1 12 12 17 NA 15 NA 9 -5 19 NA
Complaints to Ofcomper 100k subscribers2 52 50 22 NA 100 37 21 87 60 115
Landline providers
Satisfaction1 85 90 82 NA 83 NA 88 83 77 NA
NPS1 12 19 11 NA 27 NA 10 9 5 NA
Complaints to Ofcomper 100k subscribers2 38 31 17 NA 78 34 18 69 49 65
1 Source Ofcom Customer Satisfaction Tracker 2020 Note the overall average relates only to the providers included in the analysis (inclusion criteria providers with a 4 more market share) No data for KCOM or Post Office due to not meeting the inclusion criteria for this study
2 Source Ofcom CCT data Notes All figures are rounded to the nearest whole number the overall average relates only to the providers included in the analysis Annualised for 2019 Visit Ofcomrsquos website to see the latest quarterly telecoms complaints data Note Satisfaction with value for money data is not available for landline and broadband because the question was only asked among those with a standalone service
significantly higher or lower than previous year at the 99 confidence level for market research results
X
significantly higher or lower than the overall sector average at the 95 confidence level for market research results
X
significantly higher or lower than the overall sector average at the 95 confidence level for market research results
19
v v
Notes Based on September 2019 pricing information Ofcom monitors and reports separately on the extent to which broadband providers differentiate their prices for different groups of customers The latest broadband pricing data we have can be found atPricing trends in communication services 2019 Helping consumers get better deals A review of pricing practices in fixed broadband and Affordability of communications services A summary of initial findings
Monitoring headline customer outcomes
20
v v
Performance scorecard
Water and sewage
21
v v
Water Company Affinity Water Anglian Bournemouth Bristol Cambridge Dwr Cymru Essex amp Suffolk
Likelihood to Recommend 35 40 49 48 41 53 41
Likelihood to RecommendCustomers were asked how likely they would be to recommend their water company (0-10 scale)Percentage who scored their provider with 9 or 10 ratingrsquo shown
Latest Results - August 2020
Water Company HafrenDyfrdwy Hartlepool Northumbrian Portsmouth Severn Trent South East South
Staffordshire
Likelihood to Recommend 44 71 56 50 45 33 48
Water Company South West Southern Sutton amp East Surrey Thames United
Utilities Wessex Yorkshire
Likelihood to Recommend 30 29 34 25 44 51 50
22
v v
Water Company Affinity Water Anglian Bournemouth Bristol Cambridge Dwr Cymru Essex amp
Suffolk
Satisfaction with Service Water 90 88 94 94 96 94 91
Satisfaction with Service Sewage 87 85 89 92 87 85 87
Satisfaction Water (W) amp Sewerage (S)Customers were asked lsquowhen thinking about satisfaction with water services and satisfaction with sewerage services how satisfied or dissatisfied are with your servicersquo (0-5 scale) -Percentage who scored their provider with a 4 or 5 ratingrsquo shown
Water Company HafrenDyfrdwy Hartlepool Northumbrian Portsmouth Severn Trent South East South
Staffordshire
Satisfaction with Service Water 92 93 93 96 94 86 93
Satisfaction with Service Sewage 89 89 91 80 91 80 90
Water Company South West Southern Sutton amp East Surrey Thames United
Utilities Wessex Yorkshire
Satisfaction with Service Water 93 89 95 87 93 93 94
Satisfaction with Service Sewage 85 83 82 79 87 93 90
23
v v
Water Company Affinity Water Anglian Bournemouth Bristol Cambridge Dwr Cymru Essex amp Suffolk
Net Promoter Score NA 18 33 29 17 38 19
Net Promoter Score (NPS)Respondents are grouped as follows-Promoters (score 9-10) are loyal enthusiasts -Passives (score 7-8) are satisfied but unenthusiastic customers -Detractors (score 0-6) are unhappy customers
Latest Results - August 2020
Water Company HafrenDyfrdwy Hartlepool Northumbrian Portsmouth Severn Trent South East South
Staffordshire
Net Promoter Score 37 62 22 35 -6 -1 24
Water Company South West Southern Sutton amp East Surrey Thames United
Utilities Wessex Yorkshire
Net Promoter Score -4 -9 7 21 33 33 23
The NPS is calculated by subtracting the of Detractors from the of Promoters
24
v v
Water Company Affinity Water Anglian Bournemouth Bristol Cambridge Dwr Cymru Essex amp Suffolk
Value For Money Water 77 74 85 80 78 77 76
Value For Money Sewage 78 75 83 83 79 79 74
Value For Money (VFM) Water (W) amp Sewerage (S)Customers were asked lsquowhen thinking about value for money how satisfied or dissatisfied are you with the VFM of your servicersquo (0-5 scale) - Percentage who scored their provider with a 4 or 5 ratingrsquo shown
Water Company HafrenDyfrdwy Hartlepool Northumbrian Portsmouth Severn Trent South East South
Staffordshire
Value For Money Water 77 82 79 77 78 70 76
Value For Money Sewage 81 84 84 65 80 69 75
Water Company South West Southern Sutton amp East Surrey Thames United
Utilities Wessex Yorkshire
Value For Money Water 65 67 75 75 76 79 79
Value For Money Sewage 66 74 76 75 79 83 80
25
v v
Water Company Affinity Water Anglian Bournemouth Bristol Cambridge Dwr Cymru Essex amp Suffolk
Complaints ndash Writtenper 10000 Properties 156 247 101 172 273 146 316
Complaints ndash Written per 10000 PropertiesLatest Results - September 2020
Water Company HafrenDyfrdwy Hartlepool Northumbrian Portsmouth Severn Trent South East South
Staffordshire
Complaints ndash Writtenper 10000 Properties 345 206 314 109 225 13 168
Water Company South West Southern Sutton amp East Surrey Thames United
Utilities Wessex Yorkshire
Complaints ndash Writtenper 10000 Properties 19 278 113 583 182 118 176
26
v
Performance scorecard
Personal Current Accounts
27
v
BankBuilding Society Monzo Starling Bank First Direct Metro Bank Nationwide Barclays Halifax
Overall Service Quality 86 84 83 81 71 62 62
Overall Service QualityCustomers were asked how likely they would be to recommend their provider to friends and family1
Latest results published in August 2020
These results show the proportion of customers of each provider who said they were lsquoextremely likelyrsquo or lsquovery likelyrsquo to recommend each service1
Access to the full Ipsos Mori Banking metrics surveys published every six months is available here
BankBuilding Society Santander Lloyds Bank Virgin Money HSBC NatWest Bank of
Scotland
Overall Service Quality 61 60 60 59 58 58
Current Account Service QualityBased on the 19 largest personal current account providers in Great Britain
BankBuilding Society
The Co-operative Bank Yorkshire Bank TSB Clydesdale Bank Royal Bank of
Scotland Tesco Bank
Overall Service Quality 57 56 51 51 46 44
28
v
BankBuilding Society Monzo Starling Bank Metro Bank First Direct Nationwide Barclays Halifax
Overall Service Quality 89 88 85 83 81 81 81
Online and Mobile Banking ServicesCustomers were asked how likely they would be to recommend their providerrsquos online and mobile banking services to friends andfamily1
Latest results published in August 2020
These results show the proportion of customers of each provider who said they were lsquoextremely likelyrsquo or lsquovery likelyrsquo to recommend each service1
Access to the full Ipsos Mori Banking metrics surveys published every six months is available here
BankBuilding Society Lloyds Bank Bank of
Scotland Santander NatWest Virgin Money HSBC
Overall Service Quality 78 77 76 75 75 72
Current Account Service QualityBased on the 19 largest personal current account providers in Great Britain
BankBuilding Society Yorkshire Bank Royal Bank of
ScotlandThe Co-
operative Bank Clydesdale Bank TSB Tesco Bank
Overall Service Quality 71 71 67 66 65 59
29
v
Firms offering personal current accounts with most Banking and credit card complaints (per 1000 accounts) H1 2020The data we collect includes complaints on credit cards current accounts packaged accounts savings unregulated loans and overdrafts and other banking For the purpose of accurately displaying data more specific to personal current accounts firms who do not offer personal current accounts have been excluded
A link to the latest FCA complaints data published on 15 December 2020 can be found hereThe figures are complaint numbers opened during the period January 1st 2020 - June 30th 2020 (H1)
Current Account Service QualityBased on the 10 firms offering personal current accounts with most complaints in H1 2020
0
2
4
6
8
10
12
14
Al Rayan Bank PLC Cynergy BankLimited
Barclays Bank Plc Bank of Ireland(UK) Plc
HSBC UK Bank Plc Monzo Bank Ltd Investec Bank PLC Secure Trust BankPlc
Marks amp SpencerFinancial Services
Plc
Tesco PersonalFinance PLC
Com
plai
nts
Firms
Number of complaints on banking and credit cards per 1000 accounts Average complaints per 1000 banking and credit card accounts all firms
v v
Performance scorecard
Telecoms
17
v v
1 Source Ofcom Customer Satisfaction Tracker 2020 2 Source Ofcom CCT data Notes All figures are rounded to the nearest whole number the overall average relates only to the providers included in the analysis Annualised for 2019 Visit Ofcomrsquos website to see
the latest quarterly telecoms complaints data 3 Source Ofcom Customer Satisfaction Tracker 2020 Notes the industry average relates only to the providers included in the analysis Satisfaction with value for money data only asked among those with a
standalone service so does not include those who purchase their mobile service as part of a bundle No data for satisfaction with value for money for BT and Virgin Mobile due to insufficient base size
Mobile providersOverallaverage
Satisfaction1 93 NA 93 95 NA 93 NA 97 89 93 90
NPS1 25 NA 17 52 NA 30 NA 44 10 26 27
Complaints to Ofcomper 100k subscribers2 13 21 7 NA 10 9 11 3 15 27 26
Satisfaction with value for money3 87 NA 84 96 NA 87 NA 97 87 NA 83
significantly higher or lower than previous year at the 99 confidence level for market research results
X
significantly higher or lower than the overall sector average at the 95 confidence level for market research results
X
significantly higher or lower than the overall sector average at the 95 confidence level for market research results
18
v v
Broadband providers Overallaverage
Satisfaction1 85 86 88 NA 93 NA 86 78 85 NA
NPS1 12 12 17 NA 15 NA 9 -5 19 NA
Complaints to Ofcomper 100k subscribers2 52 50 22 NA 100 37 21 87 60 115
Landline providers
Satisfaction1 85 90 82 NA 83 NA 88 83 77 NA
NPS1 12 19 11 NA 27 NA 10 9 5 NA
Complaints to Ofcomper 100k subscribers2 38 31 17 NA 78 34 18 69 49 65
1 Source Ofcom Customer Satisfaction Tracker 2020 Note the overall average relates only to the providers included in the analysis (inclusion criteria providers with a 4 more market share) No data for KCOM or Post Office due to not meeting the inclusion criteria for this study
2 Source Ofcom CCT data Notes All figures are rounded to the nearest whole number the overall average relates only to the providers included in the analysis Annualised for 2019 Visit Ofcomrsquos website to see the latest quarterly telecoms complaints data Note Satisfaction with value for money data is not available for landline and broadband because the question was only asked among those with a standalone service
significantly higher or lower than previous year at the 99 confidence level for market research results
X
significantly higher or lower than the overall sector average at the 95 confidence level for market research results
X
significantly higher or lower than the overall sector average at the 95 confidence level for market research results
19
v v
Notes Based on September 2019 pricing information Ofcom monitors and reports separately on the extent to which broadband providers differentiate their prices for different groups of customers The latest broadband pricing data we have can be found atPricing trends in communication services 2019 Helping consumers get better deals A review of pricing practices in fixed broadband and Affordability of communications services A summary of initial findings
Monitoring headline customer outcomes
20
v v
Performance scorecard
Water and sewage
21
v v
Water Company Affinity Water Anglian Bournemouth Bristol Cambridge Dwr Cymru Essex amp Suffolk
Likelihood to Recommend 35 40 49 48 41 53 41
Likelihood to RecommendCustomers were asked how likely they would be to recommend their water company (0-10 scale)Percentage who scored their provider with 9 or 10 ratingrsquo shown
Latest Results - August 2020
Water Company HafrenDyfrdwy Hartlepool Northumbrian Portsmouth Severn Trent South East South
Staffordshire
Likelihood to Recommend 44 71 56 50 45 33 48
Water Company South West Southern Sutton amp East Surrey Thames United
Utilities Wessex Yorkshire
Likelihood to Recommend 30 29 34 25 44 51 50
22
v v
Water Company Affinity Water Anglian Bournemouth Bristol Cambridge Dwr Cymru Essex amp
Suffolk
Satisfaction with Service Water 90 88 94 94 96 94 91
Satisfaction with Service Sewage 87 85 89 92 87 85 87
Satisfaction Water (W) amp Sewerage (S)Customers were asked lsquowhen thinking about satisfaction with water services and satisfaction with sewerage services how satisfied or dissatisfied are with your servicersquo (0-5 scale) -Percentage who scored their provider with a 4 or 5 ratingrsquo shown
Water Company HafrenDyfrdwy Hartlepool Northumbrian Portsmouth Severn Trent South East South
Staffordshire
Satisfaction with Service Water 92 93 93 96 94 86 93
Satisfaction with Service Sewage 89 89 91 80 91 80 90
Water Company South West Southern Sutton amp East Surrey Thames United
Utilities Wessex Yorkshire
Satisfaction with Service Water 93 89 95 87 93 93 94
Satisfaction with Service Sewage 85 83 82 79 87 93 90
23
v v
Water Company Affinity Water Anglian Bournemouth Bristol Cambridge Dwr Cymru Essex amp Suffolk
Net Promoter Score NA 18 33 29 17 38 19
Net Promoter Score (NPS)Respondents are grouped as follows-Promoters (score 9-10) are loyal enthusiasts -Passives (score 7-8) are satisfied but unenthusiastic customers -Detractors (score 0-6) are unhappy customers
Latest Results - August 2020
Water Company HafrenDyfrdwy Hartlepool Northumbrian Portsmouth Severn Trent South East South
Staffordshire
Net Promoter Score 37 62 22 35 -6 -1 24
Water Company South West Southern Sutton amp East Surrey Thames United
Utilities Wessex Yorkshire
Net Promoter Score -4 -9 7 21 33 33 23
The NPS is calculated by subtracting the of Detractors from the of Promoters
24
v v
Water Company Affinity Water Anglian Bournemouth Bristol Cambridge Dwr Cymru Essex amp Suffolk
Value For Money Water 77 74 85 80 78 77 76
Value For Money Sewage 78 75 83 83 79 79 74
Value For Money (VFM) Water (W) amp Sewerage (S)Customers were asked lsquowhen thinking about value for money how satisfied or dissatisfied are you with the VFM of your servicersquo (0-5 scale) - Percentage who scored their provider with a 4 or 5 ratingrsquo shown
Water Company HafrenDyfrdwy Hartlepool Northumbrian Portsmouth Severn Trent South East South
Staffordshire
Value For Money Water 77 82 79 77 78 70 76
Value For Money Sewage 81 84 84 65 80 69 75
Water Company South West Southern Sutton amp East Surrey Thames United
Utilities Wessex Yorkshire
Value For Money Water 65 67 75 75 76 79 79
Value For Money Sewage 66 74 76 75 79 83 80
25
v v
Water Company Affinity Water Anglian Bournemouth Bristol Cambridge Dwr Cymru Essex amp Suffolk
Complaints ndash Writtenper 10000 Properties 156 247 101 172 273 146 316
Complaints ndash Written per 10000 PropertiesLatest Results - September 2020
Water Company HafrenDyfrdwy Hartlepool Northumbrian Portsmouth Severn Trent South East South
Staffordshire
Complaints ndash Writtenper 10000 Properties 345 206 314 109 225 13 168
Water Company South West Southern Sutton amp East Surrey Thames United
Utilities Wessex Yorkshire
Complaints ndash Writtenper 10000 Properties 19 278 113 583 182 118 176
26
v
Performance scorecard
Personal Current Accounts
27
v
BankBuilding Society Monzo Starling Bank First Direct Metro Bank Nationwide Barclays Halifax
Overall Service Quality 86 84 83 81 71 62 62
Overall Service QualityCustomers were asked how likely they would be to recommend their provider to friends and family1
Latest results published in August 2020
These results show the proportion of customers of each provider who said they were lsquoextremely likelyrsquo or lsquovery likelyrsquo to recommend each service1
Access to the full Ipsos Mori Banking metrics surveys published every six months is available here
BankBuilding Society Santander Lloyds Bank Virgin Money HSBC NatWest Bank of
Scotland
Overall Service Quality 61 60 60 59 58 58
Current Account Service QualityBased on the 19 largest personal current account providers in Great Britain
BankBuilding Society
The Co-operative Bank Yorkshire Bank TSB Clydesdale Bank Royal Bank of
Scotland Tesco Bank
Overall Service Quality 57 56 51 51 46 44
28
v
BankBuilding Society Monzo Starling Bank Metro Bank First Direct Nationwide Barclays Halifax
Overall Service Quality 89 88 85 83 81 81 81
Online and Mobile Banking ServicesCustomers were asked how likely they would be to recommend their providerrsquos online and mobile banking services to friends andfamily1
Latest results published in August 2020
These results show the proportion of customers of each provider who said they were lsquoextremely likelyrsquo or lsquovery likelyrsquo to recommend each service1
Access to the full Ipsos Mori Banking metrics surveys published every six months is available here
BankBuilding Society Lloyds Bank Bank of
Scotland Santander NatWest Virgin Money HSBC
Overall Service Quality 78 77 76 75 75 72
Current Account Service QualityBased on the 19 largest personal current account providers in Great Britain
BankBuilding Society Yorkshire Bank Royal Bank of
ScotlandThe Co-
operative Bank Clydesdale Bank TSB Tesco Bank
Overall Service Quality 71 71 67 66 65 59
29
v
Firms offering personal current accounts with most Banking and credit card complaints (per 1000 accounts) H1 2020The data we collect includes complaints on credit cards current accounts packaged accounts savings unregulated loans and overdrafts and other banking For the purpose of accurately displaying data more specific to personal current accounts firms who do not offer personal current accounts have been excluded
A link to the latest FCA complaints data published on 15 December 2020 can be found hereThe figures are complaint numbers opened during the period January 1st 2020 - June 30th 2020 (H1)
Current Account Service QualityBased on the 10 firms offering personal current accounts with most complaints in H1 2020
0
2
4
6
8
10
12
14
Al Rayan Bank PLC Cynergy BankLimited
Barclays Bank Plc Bank of Ireland(UK) Plc
HSBC UK Bank Plc Monzo Bank Ltd Investec Bank PLC Secure Trust BankPlc
Marks amp SpencerFinancial Services
Plc
Tesco PersonalFinance PLC
Com
plai
nts
Firms
Number of complaints on banking and credit cards per 1000 accounts Average complaints per 1000 banking and credit card accounts all firms
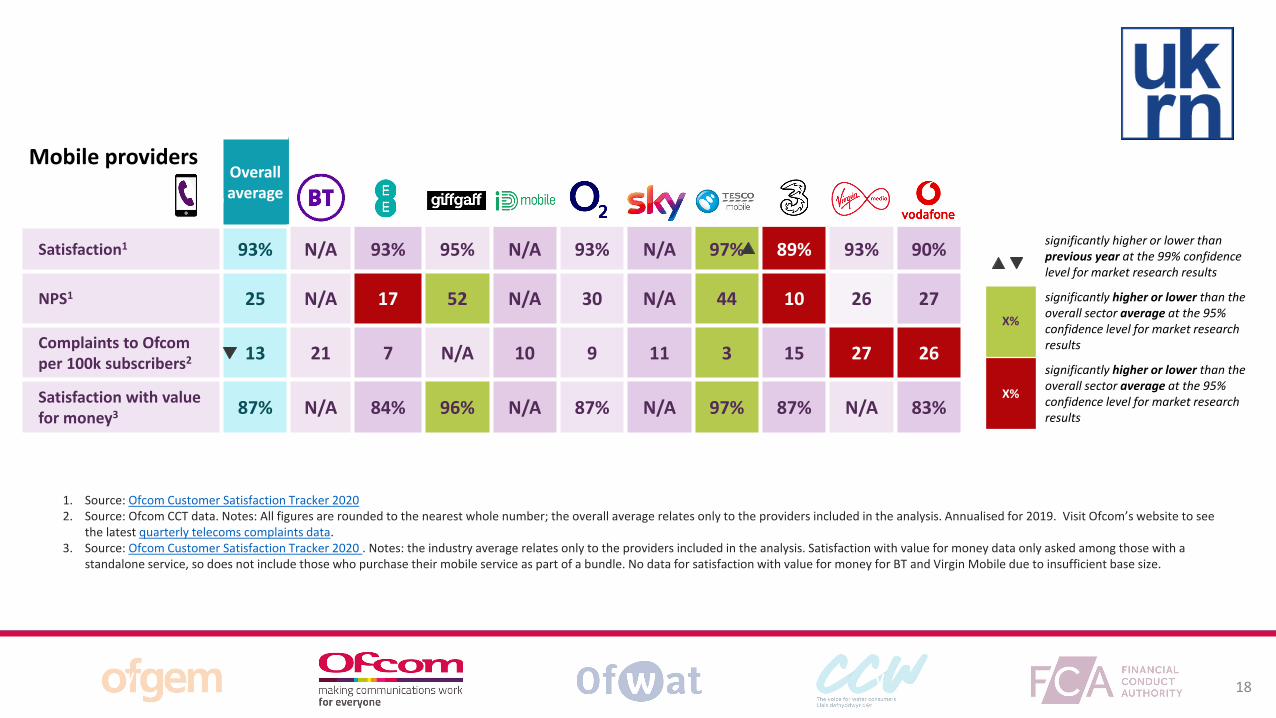
v v
1 Source Ofcom Customer Satisfaction Tracker 2020 2 Source Ofcom CCT data Notes All figures are rounded to the nearest whole number the overall average relates only to the providers included in the analysis Annualised for 2019 Visit Ofcomrsquos website to see
the latest quarterly telecoms complaints data 3 Source Ofcom Customer Satisfaction Tracker 2020 Notes the industry average relates only to the providers included in the analysis Satisfaction with value for money data only asked among those with a
standalone service so does not include those who purchase their mobile service as part of a bundle No data for satisfaction with value for money for BT and Virgin Mobile due to insufficient base size
Mobile providersOverallaverage
Satisfaction1 93 NA 93 95 NA 93 NA 97 89 93 90
NPS1 25 NA 17 52 NA 30 NA 44 10 26 27
Complaints to Ofcomper 100k subscribers2 13 21 7 NA 10 9 11 3 15 27 26
Satisfaction with value for money3 87 NA 84 96 NA 87 NA 97 87 NA 83
significantly higher or lower than previous year at the 99 confidence level for market research results
X
significantly higher or lower than the overall sector average at the 95 confidence level for market research results
X
significantly higher or lower than the overall sector average at the 95 confidence level for market research results
18
v v
Broadband providers Overallaverage
Satisfaction1 85 86 88 NA 93 NA 86 78 85 NA
NPS1 12 12 17 NA 15 NA 9 -5 19 NA
Complaints to Ofcomper 100k subscribers2 52 50 22 NA 100 37 21 87 60 115
Landline providers
Satisfaction1 85 90 82 NA 83 NA 88 83 77 NA
NPS1 12 19 11 NA 27 NA 10 9 5 NA
Complaints to Ofcomper 100k subscribers2 38 31 17 NA 78 34 18 69 49 65
1 Source Ofcom Customer Satisfaction Tracker 2020 Note the overall average relates only to the providers included in the analysis (inclusion criteria providers with a 4 more market share) No data for KCOM or Post Office due to not meeting the inclusion criteria for this study
2 Source Ofcom CCT data Notes All figures are rounded to the nearest whole number the overall average relates only to the providers included in the analysis Annualised for 2019 Visit Ofcomrsquos website to see the latest quarterly telecoms complaints data Note Satisfaction with value for money data is not available for landline and broadband because the question was only asked among those with a standalone service
significantly higher or lower than previous year at the 99 confidence level for market research results
X
significantly higher or lower than the overall sector average at the 95 confidence level for market research results
X
significantly higher or lower than the overall sector average at the 95 confidence level for market research results
19
v v
Notes Based on September 2019 pricing information Ofcom monitors and reports separately on the extent to which broadband providers differentiate their prices for different groups of customers The latest broadband pricing data we have can be found atPricing trends in communication services 2019 Helping consumers get better deals A review of pricing practices in fixed broadband and Affordability of communications services A summary of initial findings
Monitoring headline customer outcomes
20
v v
Performance scorecard
Water and sewage
21
v v
Water Company Affinity Water Anglian Bournemouth Bristol Cambridge Dwr Cymru Essex amp Suffolk
Likelihood to Recommend 35 40 49 48 41 53 41
Likelihood to RecommendCustomers were asked how likely they would be to recommend their water company (0-10 scale)Percentage who scored their provider with 9 or 10 ratingrsquo shown
Latest Results - August 2020
Water Company HafrenDyfrdwy Hartlepool Northumbrian Portsmouth Severn Trent South East South
Staffordshire
Likelihood to Recommend 44 71 56 50 45 33 48
Water Company South West Southern Sutton amp East Surrey Thames United
Utilities Wessex Yorkshire
Likelihood to Recommend 30 29 34 25 44 51 50
22
v v
Water Company Affinity Water Anglian Bournemouth Bristol Cambridge Dwr Cymru Essex amp
Suffolk
Satisfaction with Service Water 90 88 94 94 96 94 91
Satisfaction with Service Sewage 87 85 89 92 87 85 87
Satisfaction Water (W) amp Sewerage (S)Customers were asked lsquowhen thinking about satisfaction with water services and satisfaction with sewerage services how satisfied or dissatisfied are with your servicersquo (0-5 scale) -Percentage who scored their provider with a 4 or 5 ratingrsquo shown
Water Company HafrenDyfrdwy Hartlepool Northumbrian Portsmouth Severn Trent South East South
Staffordshire
Satisfaction with Service Water 92 93 93 96 94 86 93
Satisfaction with Service Sewage 89 89 91 80 91 80 90
Water Company South West Southern Sutton amp East Surrey Thames United
Utilities Wessex Yorkshire
Satisfaction with Service Water 93 89 95 87 93 93 94
Satisfaction with Service Sewage 85 83 82 79 87 93 90
23
v v
Water Company Affinity Water Anglian Bournemouth Bristol Cambridge Dwr Cymru Essex amp Suffolk
Net Promoter Score NA 18 33 29 17 38 19
Net Promoter Score (NPS)Respondents are grouped as follows-Promoters (score 9-10) are loyal enthusiasts -Passives (score 7-8) are satisfied but unenthusiastic customers -Detractors (score 0-6) are unhappy customers
Latest Results - August 2020
Water Company HafrenDyfrdwy Hartlepool Northumbrian Portsmouth Severn Trent South East South
Staffordshire
Net Promoter Score 37 62 22 35 -6 -1 24
Water Company South West Southern Sutton amp East Surrey Thames United
Utilities Wessex Yorkshire
Net Promoter Score -4 -9 7 21 33 33 23
The NPS is calculated by subtracting the of Detractors from the of Promoters
24
v v
Water Company Affinity Water Anglian Bournemouth Bristol Cambridge Dwr Cymru Essex amp Suffolk
Value For Money Water 77 74 85 80 78 77 76
Value For Money Sewage 78 75 83 83 79 79 74
Value For Money (VFM) Water (W) amp Sewerage (S)Customers were asked lsquowhen thinking about value for money how satisfied or dissatisfied are you with the VFM of your servicersquo (0-5 scale) - Percentage who scored their provider with a 4 or 5 ratingrsquo shown
Water Company HafrenDyfrdwy Hartlepool Northumbrian Portsmouth Severn Trent South East South
Staffordshire
Value For Money Water 77 82 79 77 78 70 76
Value For Money Sewage 81 84 84 65 80 69 75
Water Company South West Southern Sutton amp East Surrey Thames United
Utilities Wessex Yorkshire
Value For Money Water 65 67 75 75 76 79 79
Value For Money Sewage 66 74 76 75 79 83 80
25
v v
Water Company Affinity Water Anglian Bournemouth Bristol Cambridge Dwr Cymru Essex amp Suffolk
Complaints ndash Writtenper 10000 Properties 156 247 101 172 273 146 316
Complaints ndash Written per 10000 PropertiesLatest Results - September 2020
Water Company HafrenDyfrdwy Hartlepool Northumbrian Portsmouth Severn Trent South East South
Staffordshire
Complaints ndash Writtenper 10000 Properties 345 206 314 109 225 13 168
Water Company South West Southern Sutton amp East Surrey Thames United
Utilities Wessex Yorkshire
Complaints ndash Writtenper 10000 Properties 19 278 113 583 182 118 176
26
v
Performance scorecard
Personal Current Accounts
27
v
BankBuilding Society Monzo Starling Bank First Direct Metro Bank Nationwide Barclays Halifax
Overall Service Quality 86 84 83 81 71 62 62
Overall Service QualityCustomers were asked how likely they would be to recommend their provider to friends and family1
Latest results published in August 2020
These results show the proportion of customers of each provider who said they were lsquoextremely likelyrsquo or lsquovery likelyrsquo to recommend each service1
Access to the full Ipsos Mori Banking metrics surveys published every six months is available here
BankBuilding Society Santander Lloyds Bank Virgin Money HSBC NatWest Bank of
Scotland
Overall Service Quality 61 60 60 59 58 58
Current Account Service QualityBased on the 19 largest personal current account providers in Great Britain
BankBuilding Society
The Co-operative Bank Yorkshire Bank TSB Clydesdale Bank Royal Bank of
Scotland Tesco Bank
Overall Service Quality 57 56 51 51 46 44
28
v
BankBuilding Society Monzo Starling Bank Metro Bank First Direct Nationwide Barclays Halifax
Overall Service Quality 89 88 85 83 81 81 81
Online and Mobile Banking ServicesCustomers were asked how likely they would be to recommend their providerrsquos online and mobile banking services to friends andfamily1
Latest results published in August 2020
These results show the proportion of customers of each provider who said they were lsquoextremely likelyrsquo or lsquovery likelyrsquo to recommend each service1
Access to the full Ipsos Mori Banking metrics surveys published every six months is available here
BankBuilding Society Lloyds Bank Bank of
Scotland Santander NatWest Virgin Money HSBC
Overall Service Quality 78 77 76 75 75 72
Current Account Service QualityBased on the 19 largest personal current account providers in Great Britain
BankBuilding Society Yorkshire Bank Royal Bank of
ScotlandThe Co-
operative Bank Clydesdale Bank TSB Tesco Bank
Overall Service Quality 71 71 67 66 65 59
29
v
Firms offering personal current accounts with most Banking and credit card complaints (per 1000 accounts) H1 2020The data we collect includes complaints on credit cards current accounts packaged accounts savings unregulated loans and overdrafts and other banking For the purpose of accurately displaying data more specific to personal current accounts firms who do not offer personal current accounts have been excluded
A link to the latest FCA complaints data published on 15 December 2020 can be found hereThe figures are complaint numbers opened during the period January 1st 2020 - June 30th 2020 (H1)
Current Account Service QualityBased on the 10 firms offering personal current accounts with most complaints in H1 2020
0
2
4
6
8
10
12
14
Al Rayan Bank PLC Cynergy BankLimited
Barclays Bank Plc Bank of Ireland(UK) Plc
HSBC UK Bank Plc Monzo Bank Ltd Investec Bank PLC Secure Trust BankPlc
Marks amp SpencerFinancial Services
Plc
Tesco PersonalFinance PLC
Com
plai
nts
Firms
Number of complaints on banking and credit cards per 1000 accounts Average complaints per 1000 banking and credit card accounts all firms
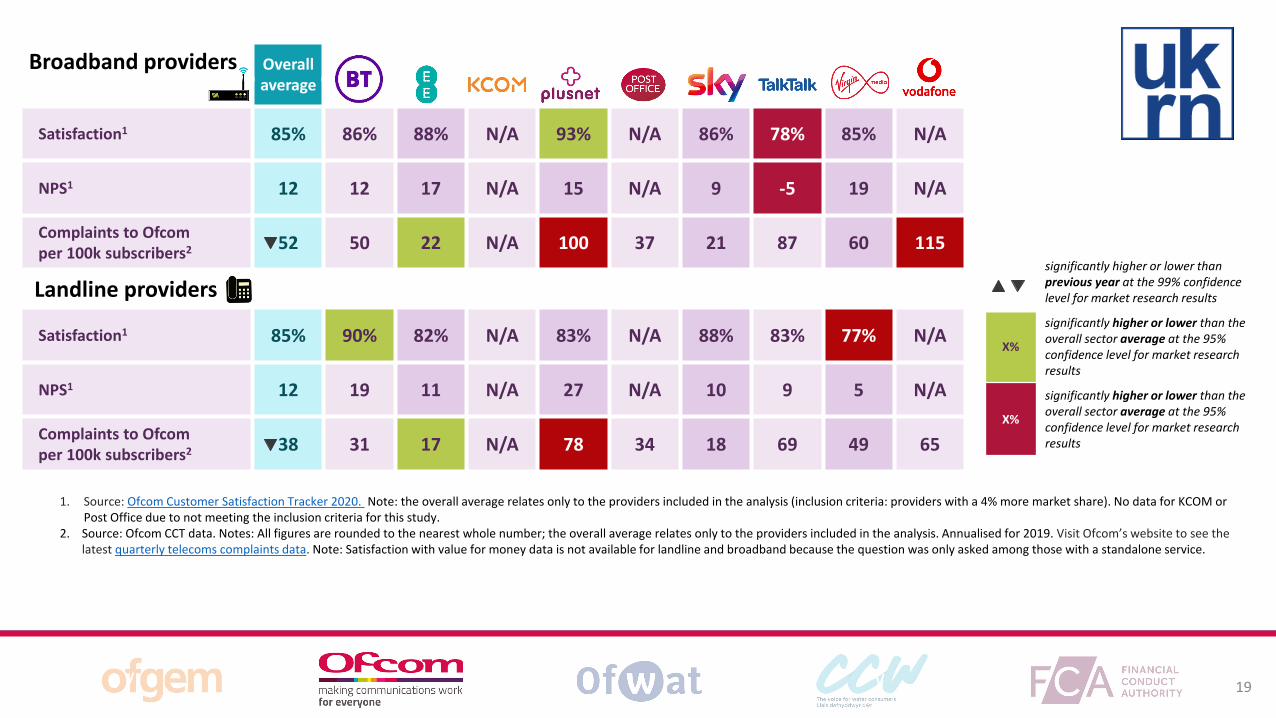
v v
Broadband providers Overallaverage
Satisfaction1 85 86 88 NA 93 NA 86 78 85 NA
NPS1 12 12 17 NA 15 NA 9 -5 19 NA
Complaints to Ofcomper 100k subscribers2 52 50 22 NA 100 37 21 87 60 115
Landline providers
Satisfaction1 85 90 82 NA 83 NA 88 83 77 NA
NPS1 12 19 11 NA 27 NA 10 9 5 NA
Complaints to Ofcomper 100k subscribers2 38 31 17 NA 78 34 18 69 49 65
1 Source Ofcom Customer Satisfaction Tracker 2020 Note the overall average relates only to the providers included in the analysis (inclusion criteria providers with a 4 more market share) No data for KCOM or Post Office due to not meeting the inclusion criteria for this study
2 Source Ofcom CCT data Notes All figures are rounded to the nearest whole number the overall average relates only to the providers included in the analysis Annualised for 2019 Visit Ofcomrsquos website to see the latest quarterly telecoms complaints data Note Satisfaction with value for money data is not available for landline and broadband because the question was only asked among those with a standalone service
significantly higher or lower than previous year at the 99 confidence level for market research results
X
significantly higher or lower than the overall sector average at the 95 confidence level for market research results
X
significantly higher or lower than the overall sector average at the 95 confidence level for market research results
19
v v
Notes Based on September 2019 pricing information Ofcom monitors and reports separately on the extent to which broadband providers differentiate their prices for different groups of customers The latest broadband pricing data we have can be found atPricing trends in communication services 2019 Helping consumers get better deals A review of pricing practices in fixed broadband and Affordability of communications services A summary of initial findings
Monitoring headline customer outcomes
20
v v
Performance scorecard
Water and sewage
21
v v
Water Company Affinity Water Anglian Bournemouth Bristol Cambridge Dwr Cymru Essex amp Suffolk
Likelihood to Recommend 35 40 49 48 41 53 41
Likelihood to RecommendCustomers were asked how likely they would be to recommend their water company (0-10 scale)Percentage who scored their provider with 9 or 10 ratingrsquo shown
Latest Results - August 2020
Water Company HafrenDyfrdwy Hartlepool Northumbrian Portsmouth Severn Trent South East South
Staffordshire
Likelihood to Recommend 44 71 56 50 45 33 48
Water Company South West Southern Sutton amp East Surrey Thames United
Utilities Wessex Yorkshire
Likelihood to Recommend 30 29 34 25 44 51 50
22
v v
Water Company Affinity Water Anglian Bournemouth Bristol Cambridge Dwr Cymru Essex amp
Suffolk
Satisfaction with Service Water 90 88 94 94 96 94 91
Satisfaction with Service Sewage 87 85 89 92 87 85 87
Satisfaction Water (W) amp Sewerage (S)Customers were asked lsquowhen thinking about satisfaction with water services and satisfaction with sewerage services how satisfied or dissatisfied are with your servicersquo (0-5 scale) -Percentage who scored their provider with a 4 or 5 ratingrsquo shown
Water Company HafrenDyfrdwy Hartlepool Northumbrian Portsmouth Severn Trent South East South
Staffordshire
Satisfaction with Service Water 92 93 93 96 94 86 93
Satisfaction with Service Sewage 89 89 91 80 91 80 90
Water Company South West Southern Sutton amp East Surrey Thames United
Utilities Wessex Yorkshire
Satisfaction with Service Water 93 89 95 87 93 93 94
Satisfaction with Service Sewage 85 83 82 79 87 93 90
23
v v
Water Company Affinity Water Anglian Bournemouth Bristol Cambridge Dwr Cymru Essex amp Suffolk
Net Promoter Score NA 18 33 29 17 38 19
Net Promoter Score (NPS)Respondents are grouped as follows-Promoters (score 9-10) are loyal enthusiasts -Passives (score 7-8) are satisfied but unenthusiastic customers -Detractors (score 0-6) are unhappy customers
Latest Results - August 2020
Water Company HafrenDyfrdwy Hartlepool Northumbrian Portsmouth Severn Trent South East South
Staffordshire
Net Promoter Score 37 62 22 35 -6 -1 24
Water Company South West Southern Sutton amp East Surrey Thames United
Utilities Wessex Yorkshire
Net Promoter Score -4 -9 7 21 33 33 23
The NPS is calculated by subtracting the of Detractors from the of Promoters
24
v v
Water Company Affinity Water Anglian Bournemouth Bristol Cambridge Dwr Cymru Essex amp Suffolk
Value For Money Water 77 74 85 80 78 77 76
Value For Money Sewage 78 75 83 83 79 79 74
Value For Money (VFM) Water (W) amp Sewerage (S)Customers were asked lsquowhen thinking about value for money how satisfied or dissatisfied are you with the VFM of your servicersquo (0-5 scale) - Percentage who scored their provider with a 4 or 5 ratingrsquo shown
Water Company HafrenDyfrdwy Hartlepool Northumbrian Portsmouth Severn Trent South East South
Staffordshire
Value For Money Water 77 82 79 77 78 70 76
Value For Money Sewage 81 84 84 65 80 69 75
Water Company South West Southern Sutton amp East Surrey Thames United
Utilities Wessex Yorkshire
Value For Money Water 65 67 75 75 76 79 79
Value For Money Sewage 66 74 76 75 79 83 80
25
v v
Water Company Affinity Water Anglian Bournemouth Bristol Cambridge Dwr Cymru Essex amp Suffolk
Complaints ndash Writtenper 10000 Properties 156 247 101 172 273 146 316
Complaints ndash Written per 10000 PropertiesLatest Results - September 2020
Water Company HafrenDyfrdwy Hartlepool Northumbrian Portsmouth Severn Trent South East South
Staffordshire
Complaints ndash Writtenper 10000 Properties 345 206 314 109 225 13 168
Water Company South West Southern Sutton amp East Surrey Thames United
Utilities Wessex Yorkshire
Complaints ndash Writtenper 10000 Properties 19 278 113 583 182 118 176
26
v
Performance scorecard
Personal Current Accounts
27
v
BankBuilding Society Monzo Starling Bank First Direct Metro Bank Nationwide Barclays Halifax
Overall Service Quality 86 84 83 81 71 62 62
Overall Service QualityCustomers were asked how likely they would be to recommend their provider to friends and family1
Latest results published in August 2020
These results show the proportion of customers of each provider who said they were lsquoextremely likelyrsquo or lsquovery likelyrsquo to recommend each service1
Access to the full Ipsos Mori Banking metrics surveys published every six months is available here
BankBuilding Society Santander Lloyds Bank Virgin Money HSBC NatWest Bank of
Scotland
Overall Service Quality 61 60 60 59 58 58
Current Account Service QualityBased on the 19 largest personal current account providers in Great Britain
BankBuilding Society
The Co-operative Bank Yorkshire Bank TSB Clydesdale Bank Royal Bank of
Scotland Tesco Bank
Overall Service Quality 57 56 51 51 46 44
28
v
BankBuilding Society Monzo Starling Bank Metro Bank First Direct Nationwide Barclays Halifax
Overall Service Quality 89 88 85 83 81 81 81
Online and Mobile Banking ServicesCustomers were asked how likely they would be to recommend their providerrsquos online and mobile banking services to friends andfamily1
Latest results published in August 2020
These results show the proportion of customers of each provider who said they were lsquoextremely likelyrsquo or lsquovery likelyrsquo to recommend each service1
Access to the full Ipsos Mori Banking metrics surveys published every six months is available here
BankBuilding Society Lloyds Bank Bank of
Scotland Santander NatWest Virgin Money HSBC
Overall Service Quality 78 77 76 75 75 72
Current Account Service QualityBased on the 19 largest personal current account providers in Great Britain
BankBuilding Society Yorkshire Bank Royal Bank of
ScotlandThe Co-
operative Bank Clydesdale Bank TSB Tesco Bank
Overall Service Quality 71 71 67 66 65 59
29
v
Firms offering personal current accounts with most Banking and credit card complaints (per 1000 accounts) H1 2020The data we collect includes complaints on credit cards current accounts packaged accounts savings unregulated loans and overdrafts and other banking For the purpose of accurately displaying data more specific to personal current accounts firms who do not offer personal current accounts have been excluded
A link to the latest FCA complaints data published on 15 December 2020 can be found hereThe figures are complaint numbers opened during the period January 1st 2020 - June 30th 2020 (H1)
Current Account Service QualityBased on the 10 firms offering personal current accounts with most complaints in H1 2020
0
2
4
6
8
10
12
14
Al Rayan Bank PLC Cynergy BankLimited
Barclays Bank Plc Bank of Ireland(UK) Plc
HSBC UK Bank Plc Monzo Bank Ltd Investec Bank PLC Secure Trust BankPlc
Marks amp SpencerFinancial Services
Plc
Tesco PersonalFinance PLC
Com
plai
nts
Firms
Number of complaints on banking and credit cards per 1000 accounts Average complaints per 1000 banking and credit card accounts all firms
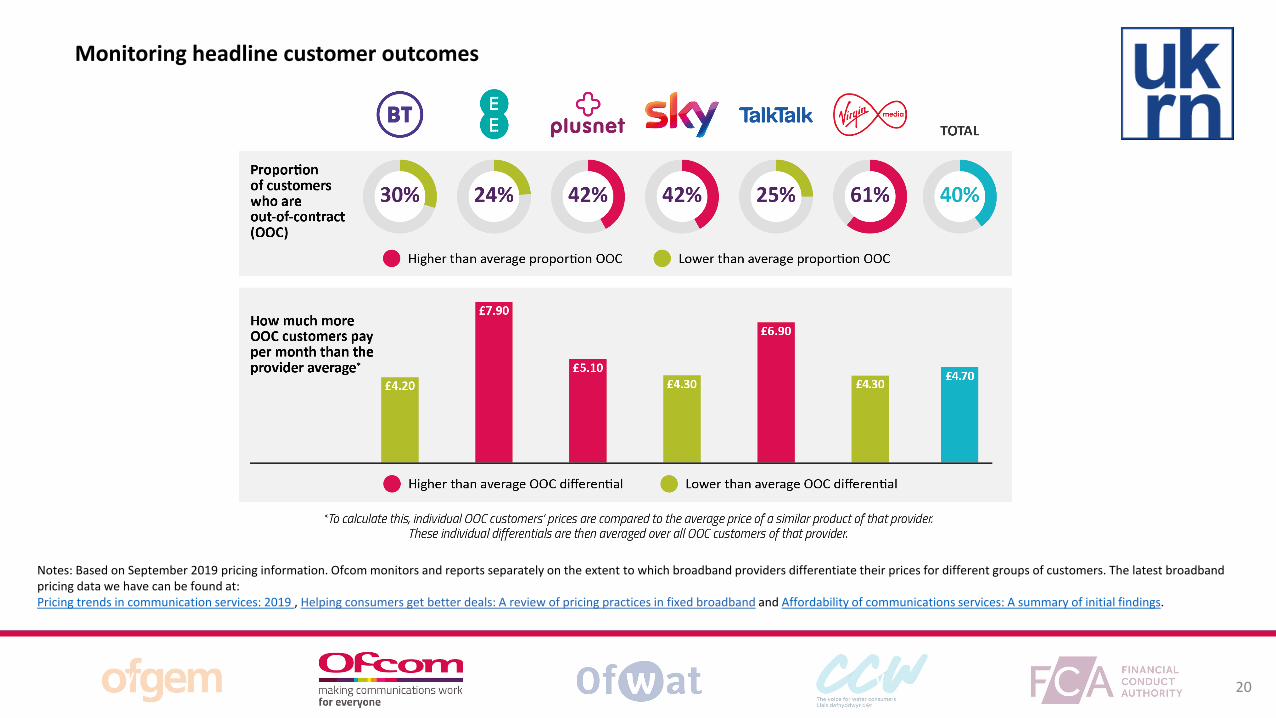
v v
Notes Based on September 2019 pricing information Ofcom monitors and reports separately on the extent to which broadband providers differentiate their prices for different groups of customers The latest broadband pricing data we have can be found atPricing trends in communication services 2019 Helping consumers get better deals A review of pricing practices in fixed broadband and Affordability of communications services A summary of initial findings
Monitoring headline customer outcomes
20
v v
Performance scorecard
Water and sewage
21
v v
Water Company Affinity Water Anglian Bournemouth Bristol Cambridge Dwr Cymru Essex amp Suffolk
Likelihood to Recommend 35 40 49 48 41 53 41
Likelihood to RecommendCustomers were asked how likely they would be to recommend their water company (0-10 scale)Percentage who scored their provider with 9 or 10 ratingrsquo shown
Latest Results - August 2020
Water Company HafrenDyfrdwy Hartlepool Northumbrian Portsmouth Severn Trent South East South
Staffordshire
Likelihood to Recommend 44 71 56 50 45 33 48
Water Company South West Southern Sutton amp East Surrey Thames United
Utilities Wessex Yorkshire
Likelihood to Recommend 30 29 34 25 44 51 50
22
v v
Water Company Affinity Water Anglian Bournemouth Bristol Cambridge Dwr Cymru Essex amp
Suffolk
Satisfaction with Service Water 90 88 94 94 96 94 91
Satisfaction with Service Sewage 87 85 89 92 87 85 87
Satisfaction Water (W) amp Sewerage (S)Customers were asked lsquowhen thinking about satisfaction with water services and satisfaction with sewerage services how satisfied or dissatisfied are with your servicersquo (0-5 scale) -Percentage who scored their provider with a 4 or 5 ratingrsquo shown
Water Company HafrenDyfrdwy Hartlepool Northumbrian Portsmouth Severn Trent South East South
Staffordshire
Satisfaction with Service Water 92 93 93 96 94 86 93
Satisfaction with Service Sewage 89 89 91 80 91 80 90
Water Company South West Southern Sutton amp East Surrey Thames United
Utilities Wessex Yorkshire
Satisfaction with Service Water 93 89 95 87 93 93 94
Satisfaction with Service Sewage 85 83 82 79 87 93 90
23
v v
Water Company Affinity Water Anglian Bournemouth Bristol Cambridge Dwr Cymru Essex amp Suffolk
Net Promoter Score NA 18 33 29 17 38 19
Net Promoter Score (NPS)Respondents are grouped as follows-Promoters (score 9-10) are loyal enthusiasts -Passives (score 7-8) are satisfied but unenthusiastic customers -Detractors (score 0-6) are unhappy customers
Latest Results - August 2020
Water Company HafrenDyfrdwy Hartlepool Northumbrian Portsmouth Severn Trent South East South
Staffordshire
Net Promoter Score 37 62 22 35 -6 -1 24
Water Company South West Southern Sutton amp East Surrey Thames United
Utilities Wessex Yorkshire
Net Promoter Score -4 -9 7 21 33 33 23
The NPS is calculated by subtracting the of Detractors from the of Promoters
24
v v
Water Company Affinity Water Anglian Bournemouth Bristol Cambridge Dwr Cymru Essex amp Suffolk
Value For Money Water 77 74 85 80 78 77 76
Value For Money Sewage 78 75 83 83 79 79 74
Value For Money (VFM) Water (W) amp Sewerage (S)Customers were asked lsquowhen thinking about value for money how satisfied or dissatisfied are you with the VFM of your servicersquo (0-5 scale) - Percentage who scored their provider with a 4 or 5 ratingrsquo shown
Water Company HafrenDyfrdwy Hartlepool Northumbrian Portsmouth Severn Trent South East South
Staffordshire
Value For Money Water 77 82 79 77 78 70 76
Value For Money Sewage 81 84 84 65 80 69 75
Water Company South West Southern Sutton amp East Surrey Thames United
Utilities Wessex Yorkshire
Value For Money Water 65 67 75 75 76 79 79
Value For Money Sewage 66 74 76 75 79 83 80
25
v v
Water Company Affinity Water Anglian Bournemouth Bristol Cambridge Dwr Cymru Essex amp Suffolk
Complaints ndash Writtenper 10000 Properties 156 247 101 172 273 146 316
Complaints ndash Written per 10000 PropertiesLatest Results - September 2020
Water Company HafrenDyfrdwy Hartlepool Northumbrian Portsmouth Severn Trent South East South
Staffordshire
Complaints ndash Writtenper 10000 Properties 345 206 314 109 225 13 168
Water Company South West Southern Sutton amp East Surrey Thames United
Utilities Wessex Yorkshire
Complaints ndash Writtenper 10000 Properties 19 278 113 583 182 118 176
26
v
Performance scorecard
Personal Current Accounts
27
v
BankBuilding Society Monzo Starling Bank First Direct Metro Bank Nationwide Barclays Halifax
Overall Service Quality 86 84 83 81 71 62 62
Overall Service QualityCustomers were asked how likely they would be to recommend their provider to friends and family1
Latest results published in August 2020
These results show the proportion of customers of each provider who said they were lsquoextremely likelyrsquo or lsquovery likelyrsquo to recommend each service1
Access to the full Ipsos Mori Banking metrics surveys published every six months is available here
BankBuilding Society Santander Lloyds Bank Virgin Money HSBC NatWest Bank of
Scotland
Overall Service Quality 61 60 60 59 58 58
Current Account Service QualityBased on the 19 largest personal current account providers in Great Britain
BankBuilding Society
The Co-operative Bank Yorkshire Bank TSB Clydesdale Bank Royal Bank of
Scotland Tesco Bank
Overall Service Quality 57 56 51 51 46 44
28
v
BankBuilding Society Monzo Starling Bank Metro Bank First Direct Nationwide Barclays Halifax
Overall Service Quality 89 88 85 83 81 81 81
Online and Mobile Banking ServicesCustomers were asked how likely they would be to recommend their providerrsquos online and mobile banking services to friends andfamily1
Latest results published in August 2020
These results show the proportion of customers of each provider who said they were lsquoextremely likelyrsquo or lsquovery likelyrsquo to recommend each service1
Access to the full Ipsos Mori Banking metrics surveys published every six months is available here
BankBuilding Society Lloyds Bank Bank of
Scotland Santander NatWest Virgin Money HSBC
Overall Service Quality 78 77 76 75 75 72
Current Account Service QualityBased on the 19 largest personal current account providers in Great Britain
BankBuilding Society Yorkshire Bank Royal Bank of
ScotlandThe Co-
operative Bank Clydesdale Bank TSB Tesco Bank
Overall Service Quality 71 71 67 66 65 59
29
v
Firms offering personal current accounts with most Banking and credit card complaints (per 1000 accounts) H1 2020The data we collect includes complaints on credit cards current accounts packaged accounts savings unregulated loans and overdrafts and other banking For the purpose of accurately displaying data more specific to personal current accounts firms who do not offer personal current accounts have been excluded
A link to the latest FCA complaints data published on 15 December 2020 can be found hereThe figures are complaint numbers opened during the period January 1st 2020 - June 30th 2020 (H1)
Current Account Service QualityBased on the 10 firms offering personal current accounts with most complaints in H1 2020
0
2
4
6
8
10
12
14
Al Rayan Bank PLC Cynergy BankLimited
Barclays Bank Plc Bank of Ireland(UK) Plc
HSBC UK Bank Plc Monzo Bank Ltd Investec Bank PLC Secure Trust BankPlc
Marks amp SpencerFinancial Services
Plc
Tesco PersonalFinance PLC
Com
plai
nts
Firms
Number of complaints on banking and credit cards per 1000 accounts Average complaints per 1000 banking and credit card accounts all firms
v v
Performance scorecard
Water and sewage
21
v v
Water Company Affinity Water Anglian Bournemouth Bristol Cambridge Dwr Cymru Essex amp Suffolk
Likelihood to Recommend 35 40 49 48 41 53 41
Likelihood to RecommendCustomers were asked how likely they would be to recommend their water company (0-10 scale)Percentage who scored their provider with 9 or 10 ratingrsquo shown
Latest Results - August 2020
Water Company HafrenDyfrdwy Hartlepool Northumbrian Portsmouth Severn Trent South East South
Staffordshire
Likelihood to Recommend 44 71 56 50 45 33 48
Water Company South West Southern Sutton amp East Surrey Thames United
Utilities Wessex Yorkshire
Likelihood to Recommend 30 29 34 25 44 51 50
22
v v
Water Company Affinity Water Anglian Bournemouth Bristol Cambridge Dwr Cymru Essex amp
Suffolk
Satisfaction with Service Water 90 88 94 94 96 94 91
Satisfaction with Service Sewage 87 85 89 92 87 85 87
Satisfaction Water (W) amp Sewerage (S)Customers were asked lsquowhen thinking about satisfaction with water services and satisfaction with sewerage services how satisfied or dissatisfied are with your servicersquo (0-5 scale) -Percentage who scored their provider with a 4 or 5 ratingrsquo shown
Water Company HafrenDyfrdwy Hartlepool Northumbrian Portsmouth Severn Trent South East South
Staffordshire
Satisfaction with Service Water 92 93 93 96 94 86 93
Satisfaction with Service Sewage 89 89 91 80 91 80 90
Water Company South West Southern Sutton amp East Surrey Thames United
Utilities Wessex Yorkshire
Satisfaction with Service Water 93 89 95 87 93 93 94
Satisfaction with Service Sewage 85 83 82 79 87 93 90
23
v v
Water Company Affinity Water Anglian Bournemouth Bristol Cambridge Dwr Cymru Essex amp Suffolk
Net Promoter Score NA 18 33 29 17 38 19
Net Promoter Score (NPS)Respondents are grouped as follows-Promoters (score 9-10) are loyal enthusiasts -Passives (score 7-8) are satisfied but unenthusiastic customers -Detractors (score 0-6) are unhappy customers
Latest Results - August 2020
Water Company HafrenDyfrdwy Hartlepool Northumbrian Portsmouth Severn Trent South East South
Staffordshire
Net Promoter Score 37 62 22 35 -6 -1 24
Water Company South West Southern Sutton amp East Surrey Thames United
Utilities Wessex Yorkshire
Net Promoter Score -4 -9 7 21 33 33 23
The NPS is calculated by subtracting the of Detractors from the of Promoters
24
v v
Water Company Affinity Water Anglian Bournemouth Bristol Cambridge Dwr Cymru Essex amp Suffolk
Value For Money Water 77 74 85 80 78 77 76
Value For Money Sewage 78 75 83 83 79 79 74
Value For Money (VFM) Water (W) amp Sewerage (S)Customers were asked lsquowhen thinking about value for money how satisfied or dissatisfied are you with the VFM of your servicersquo (0-5 scale) - Percentage who scored their provider with a 4 or 5 ratingrsquo shown
Water Company HafrenDyfrdwy Hartlepool Northumbrian Portsmouth Severn Trent South East South
Staffordshire
Value For Money Water 77 82 79 77 78 70 76
Value For Money Sewage 81 84 84 65 80 69 75
Water Company South West Southern Sutton amp East Surrey Thames United
Utilities Wessex Yorkshire
Value For Money Water 65 67 75 75 76 79 79
Value For Money Sewage 66 74 76 75 79 83 80
25
v v
Water Company Affinity Water Anglian Bournemouth Bristol Cambridge Dwr Cymru Essex amp Suffolk
Complaints ndash Writtenper 10000 Properties 156 247 101 172 273 146 316
Complaints ndash Written per 10000 PropertiesLatest Results - September 2020
Water Company HafrenDyfrdwy Hartlepool Northumbrian Portsmouth Severn Trent South East South
Staffordshire
Complaints ndash Writtenper 10000 Properties 345 206 314 109 225 13 168
Water Company South West Southern Sutton amp East Surrey Thames United
Utilities Wessex Yorkshire
Complaints ndash Writtenper 10000 Properties 19 278 113 583 182 118 176
26
v
Performance scorecard
Personal Current Accounts
27
v
BankBuilding Society Monzo Starling Bank First Direct Metro Bank Nationwide Barclays Halifax
Overall Service Quality 86 84 83 81 71 62 62
Overall Service QualityCustomers were asked how likely they would be to recommend their provider to friends and family1
Latest results published in August 2020
These results show the proportion of customers of each provider who said they were lsquoextremely likelyrsquo or lsquovery likelyrsquo to recommend each service1
Access to the full Ipsos Mori Banking metrics surveys published every six months is available here
BankBuilding Society Santander Lloyds Bank Virgin Money HSBC NatWest Bank of
Scotland
Overall Service Quality 61 60 60 59 58 58
Current Account Service QualityBased on the 19 largest personal current account providers in Great Britain
BankBuilding Society
The Co-operative Bank Yorkshire Bank TSB Clydesdale Bank Royal Bank of
Scotland Tesco Bank
Overall Service Quality 57 56 51 51 46 44
28
v
BankBuilding Society Monzo Starling Bank Metro Bank First Direct Nationwide Barclays Halifax
Overall Service Quality 89 88 85 83 81 81 81
Online and Mobile Banking ServicesCustomers were asked how likely they would be to recommend their providerrsquos online and mobile banking services to friends andfamily1
Latest results published in August 2020
These results show the proportion of customers of each provider who said they were lsquoextremely likelyrsquo or lsquovery likelyrsquo to recommend each service1
Access to the full Ipsos Mori Banking metrics surveys published every six months is available here
BankBuilding Society Lloyds Bank Bank of
Scotland Santander NatWest Virgin Money HSBC
Overall Service Quality 78 77 76 75 75 72
Current Account Service QualityBased on the 19 largest personal current account providers in Great Britain
BankBuilding Society Yorkshire Bank Royal Bank of
ScotlandThe Co-
operative Bank Clydesdale Bank TSB Tesco Bank
Overall Service Quality 71 71 67 66 65 59
29
v
Firms offering personal current accounts with most Banking and credit card complaints (per 1000 accounts) H1 2020The data we collect includes complaints on credit cards current accounts packaged accounts savings unregulated loans and overdrafts and other banking For the purpose of accurately displaying data more specific to personal current accounts firms who do not offer personal current accounts have been excluded
A link to the latest FCA complaints data published on 15 December 2020 can be found hereThe figures are complaint numbers opened during the period January 1st 2020 - June 30th 2020 (H1)
Current Account Service QualityBased on the 10 firms offering personal current accounts with most complaints in H1 2020
0
2
4
6
8
10
12
14
Al Rayan Bank PLC Cynergy BankLimited
Barclays Bank Plc Bank of Ireland(UK) Plc
HSBC UK Bank Plc Monzo Bank Ltd Investec Bank PLC Secure Trust BankPlc
Marks amp SpencerFinancial Services
Plc
Tesco PersonalFinance PLC
Com
plai
nts
Firms
Number of complaints on banking and credit cards per 1000 accounts Average complaints per 1000 banking and credit card accounts all firms
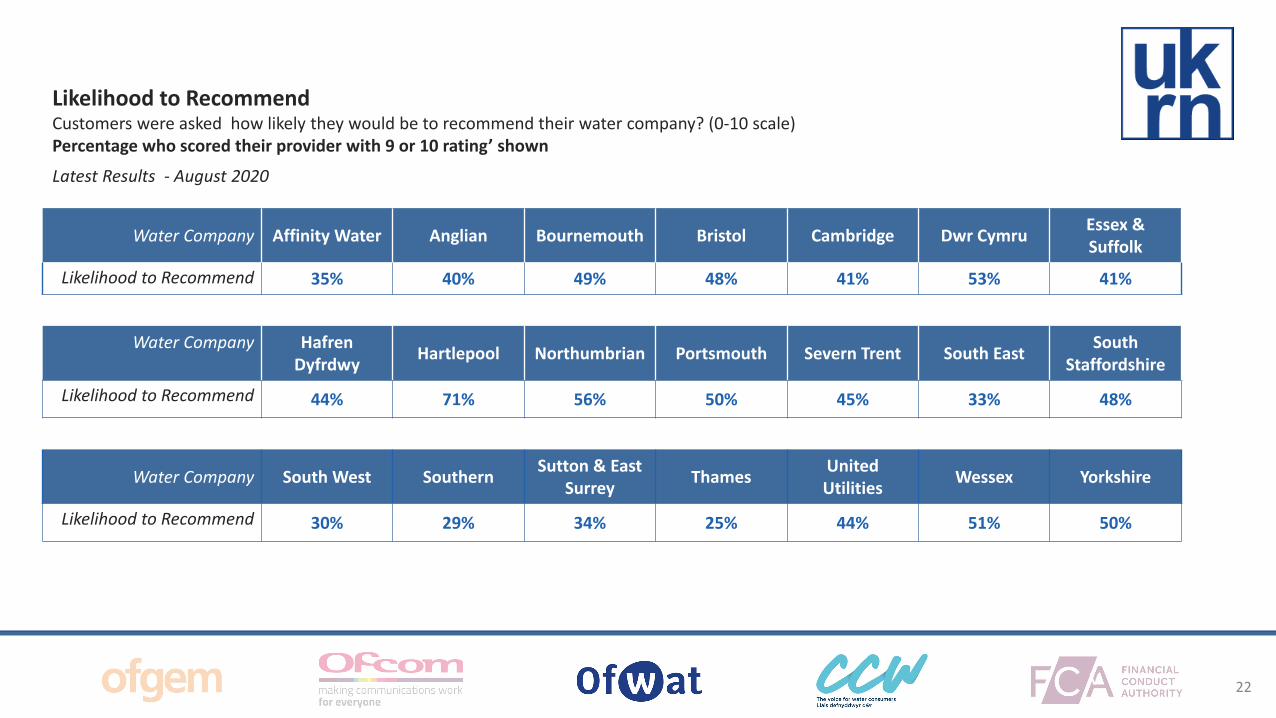
v v
Water Company Affinity Water Anglian Bournemouth Bristol Cambridge Dwr Cymru Essex amp Suffolk
Likelihood to Recommend 35 40 49 48 41 53 41
Likelihood to RecommendCustomers were asked how likely they would be to recommend their water company (0-10 scale)Percentage who scored their provider with 9 or 10 ratingrsquo shown
Latest Results - August 2020
Water Company HafrenDyfrdwy Hartlepool Northumbrian Portsmouth Severn Trent South East South
Staffordshire
Likelihood to Recommend 44 71 56 50 45 33 48
Water Company South West Southern Sutton amp East Surrey Thames United
Utilities Wessex Yorkshire
Likelihood to Recommend 30 29 34 25 44 51 50
22
v v
Water Company Affinity Water Anglian Bournemouth Bristol Cambridge Dwr Cymru Essex amp
Suffolk
Satisfaction with Service Water 90 88 94 94 96 94 91
Satisfaction with Service Sewage 87 85 89 92 87 85 87
Satisfaction Water (W) amp Sewerage (S)Customers were asked lsquowhen thinking about satisfaction with water services and satisfaction with sewerage services how satisfied or dissatisfied are with your servicersquo (0-5 scale) -Percentage who scored their provider with a 4 or 5 ratingrsquo shown
Water Company HafrenDyfrdwy Hartlepool Northumbrian Portsmouth Severn Trent South East South
Staffordshire
Satisfaction with Service Water 92 93 93 96 94 86 93
Satisfaction with Service Sewage 89 89 91 80 91 80 90
Water Company South West Southern Sutton amp East Surrey Thames United
Utilities Wessex Yorkshire
Satisfaction with Service Water 93 89 95 87 93 93 94
Satisfaction with Service Sewage 85 83 82 79 87 93 90
23
v v
Water Company Affinity Water Anglian Bournemouth Bristol Cambridge Dwr Cymru Essex amp Suffolk
Net Promoter Score NA 18 33 29 17 38 19
Net Promoter Score (NPS)Respondents are grouped as follows-Promoters (score 9-10) are loyal enthusiasts -Passives (score 7-8) are satisfied but unenthusiastic customers -Detractors (score 0-6) are unhappy customers
Latest Results - August 2020
Water Company HafrenDyfrdwy Hartlepool Northumbrian Portsmouth Severn Trent South East South
Staffordshire
Net Promoter Score 37 62 22 35 -6 -1 24
Water Company South West Southern Sutton amp East Surrey Thames United
Utilities Wessex Yorkshire
Net Promoter Score -4 -9 7 21 33 33 23
The NPS is calculated by subtracting the of Detractors from the of Promoters
24
v v
Water Company Affinity Water Anglian Bournemouth Bristol Cambridge Dwr Cymru Essex amp Suffolk
Value For Money Water 77 74 85 80 78 77 76
Value For Money Sewage 78 75 83 83 79 79 74
Value For Money (VFM) Water (W) amp Sewerage (S)Customers were asked lsquowhen thinking about value for money how satisfied or dissatisfied are you with the VFM of your servicersquo (0-5 scale) - Percentage who scored their provider with a 4 or 5 ratingrsquo shown
Water Company HafrenDyfrdwy Hartlepool Northumbrian Portsmouth Severn Trent South East South
Staffordshire
Value For Money Water 77 82 79 77 78 70 76
Value For Money Sewage 81 84 84 65 80 69 75
Water Company South West Southern Sutton amp East Surrey Thames United
Utilities Wessex Yorkshire
Value For Money Water 65 67 75 75 76 79 79
Value For Money Sewage 66 74 76 75 79 83 80
25
v v
Water Company Affinity Water Anglian Bournemouth Bristol Cambridge Dwr Cymru Essex amp Suffolk
Complaints ndash Writtenper 10000 Properties 156 247 101 172 273 146 316
Complaints ndash Written per 10000 PropertiesLatest Results - September 2020
Water Company HafrenDyfrdwy Hartlepool Northumbrian Portsmouth Severn Trent South East South
Staffordshire
Complaints ndash Writtenper 10000 Properties 345 206 314 109 225 13 168
Water Company South West Southern Sutton amp East Surrey Thames United
Utilities Wessex Yorkshire
Complaints ndash Writtenper 10000 Properties 19 278 113 583 182 118 176
26
v
Performance scorecard
Personal Current Accounts
27
v
BankBuilding Society Monzo Starling Bank First Direct Metro Bank Nationwide Barclays Halifax
Overall Service Quality 86 84 83 81 71 62 62
Overall Service QualityCustomers were asked how likely they would be to recommend their provider to friends and family1
Latest results published in August 2020
These results show the proportion of customers of each provider who said they were lsquoextremely likelyrsquo or lsquovery likelyrsquo to recommend each service1
Access to the full Ipsos Mori Banking metrics surveys published every six months is available here
BankBuilding Society Santander Lloyds Bank Virgin Money HSBC NatWest Bank of
Scotland
Overall Service Quality 61 60 60 59 58 58
Current Account Service QualityBased on the 19 largest personal current account providers in Great Britain
BankBuilding Society
The Co-operative Bank Yorkshire Bank TSB Clydesdale Bank Royal Bank of
Scotland Tesco Bank
Overall Service Quality 57 56 51 51 46 44
28
v
BankBuilding Society Monzo Starling Bank Metro Bank First Direct Nationwide Barclays Halifax
Overall Service Quality 89 88 85 83 81 81 81
Online and Mobile Banking ServicesCustomers were asked how likely they would be to recommend their providerrsquos online and mobile banking services to friends andfamily1
Latest results published in August 2020
These results show the proportion of customers of each provider who said they were lsquoextremely likelyrsquo or lsquovery likelyrsquo to recommend each service1
Access to the full Ipsos Mori Banking metrics surveys published every six months is available here
BankBuilding Society Lloyds Bank Bank of
Scotland Santander NatWest Virgin Money HSBC
Overall Service Quality 78 77 76 75 75 72
Current Account Service QualityBased on the 19 largest personal current account providers in Great Britain
BankBuilding Society Yorkshire Bank Royal Bank of
ScotlandThe Co-
operative Bank Clydesdale Bank TSB Tesco Bank
Overall Service Quality 71 71 67 66 65 59
29
v
Firms offering personal current accounts with most Banking and credit card complaints (per 1000 accounts) H1 2020The data we collect includes complaints on credit cards current accounts packaged accounts savings unregulated loans and overdrafts and other banking For the purpose of accurately displaying data more specific to personal current accounts firms who do not offer personal current accounts have been excluded
A link to the latest FCA complaints data published on 15 December 2020 can be found hereThe figures are complaint numbers opened during the period January 1st 2020 - June 30th 2020 (H1)
Current Account Service QualityBased on the 10 firms offering personal current accounts with most complaints in H1 2020
0
2
4
6
8
10
12
14
Al Rayan Bank PLC Cynergy BankLimited
Barclays Bank Plc Bank of Ireland(UK) Plc
HSBC UK Bank Plc Monzo Bank Ltd Investec Bank PLC Secure Trust BankPlc
Marks amp SpencerFinancial Services
Plc
Tesco PersonalFinance PLC
Com
plai
nts
Firms
Number of complaints on banking and credit cards per 1000 accounts Average complaints per 1000 banking and credit card accounts all firms
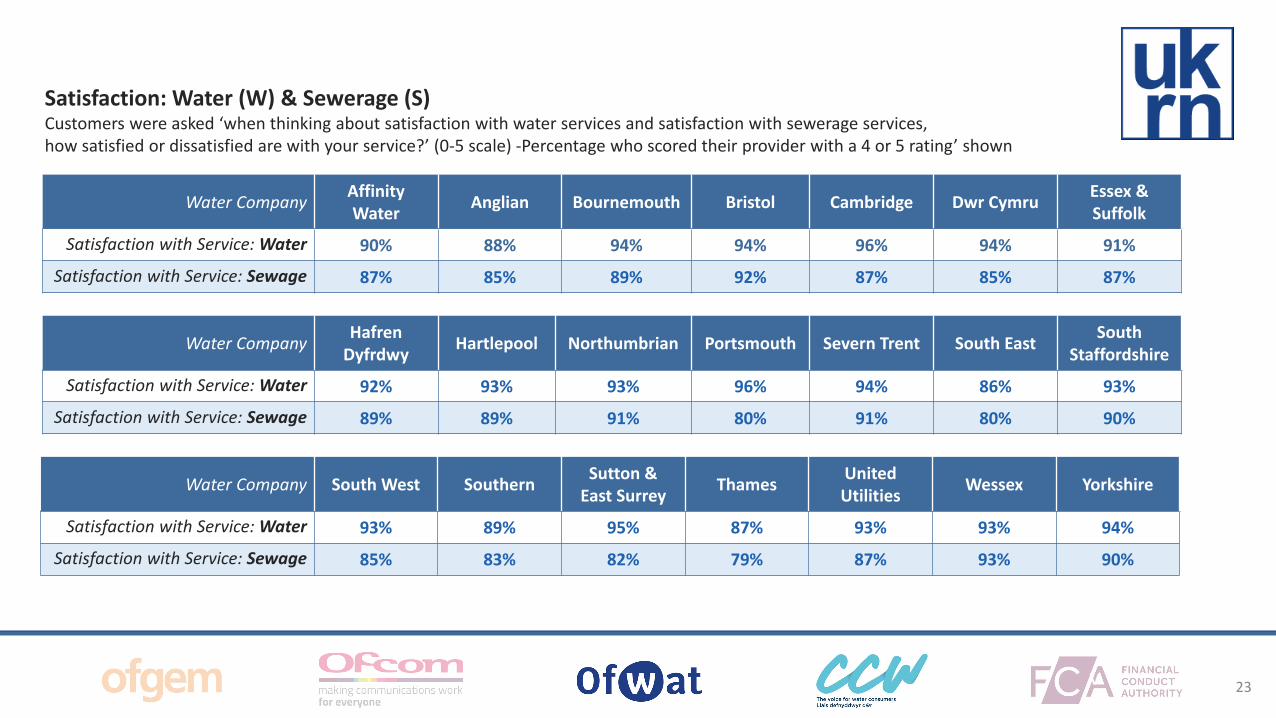
v v
Water Company Affinity Water Anglian Bournemouth Bristol Cambridge Dwr Cymru Essex amp
Suffolk
Satisfaction with Service Water 90 88 94 94 96 94 91
Satisfaction with Service Sewage 87 85 89 92 87 85 87
Satisfaction Water (W) amp Sewerage (S)Customers were asked lsquowhen thinking about satisfaction with water services and satisfaction with sewerage services how satisfied or dissatisfied are with your servicersquo (0-5 scale) -Percentage who scored their provider with a 4 or 5 ratingrsquo shown
Water Company HafrenDyfrdwy Hartlepool Northumbrian Portsmouth Severn Trent South East South
Staffordshire
Satisfaction with Service Water 92 93 93 96 94 86 93
Satisfaction with Service Sewage 89 89 91 80 91 80 90
Water Company South West Southern Sutton amp East Surrey Thames United
Utilities Wessex Yorkshire
Satisfaction with Service Water 93 89 95 87 93 93 94
Satisfaction with Service Sewage 85 83 82 79 87 93 90
23
v v
Water Company Affinity Water Anglian Bournemouth Bristol Cambridge Dwr Cymru Essex amp Suffolk
Net Promoter Score NA 18 33 29 17 38 19
Net Promoter Score (NPS)Respondents are grouped as follows-Promoters (score 9-10) are loyal enthusiasts -Passives (score 7-8) are satisfied but unenthusiastic customers -Detractors (score 0-6) are unhappy customers
Latest Results - August 2020
Water Company HafrenDyfrdwy Hartlepool Northumbrian Portsmouth Severn Trent South East South
Staffordshire
Net Promoter Score 37 62 22 35 -6 -1 24
Water Company South West Southern Sutton amp East Surrey Thames United
Utilities Wessex Yorkshire
Net Promoter Score -4 -9 7 21 33 33 23
The NPS is calculated by subtracting the of Detractors from the of Promoters
24
v v
Water Company Affinity Water Anglian Bournemouth Bristol Cambridge Dwr Cymru Essex amp Suffolk
Value For Money Water 77 74 85 80 78 77 76
Value For Money Sewage 78 75 83 83 79 79 74
Value For Money (VFM) Water (W) amp Sewerage (S)Customers were asked lsquowhen thinking about value for money how satisfied or dissatisfied are you with the VFM of your servicersquo (0-5 scale) - Percentage who scored their provider with a 4 or 5 ratingrsquo shown
Water Company HafrenDyfrdwy Hartlepool Northumbrian Portsmouth Severn Trent South East South
Staffordshire
Value For Money Water 77 82 79 77 78 70 76
Value For Money Sewage 81 84 84 65 80 69 75
Water Company South West Southern Sutton amp East Surrey Thames United
Utilities Wessex Yorkshire
Value For Money Water 65 67 75 75 76 79 79
Value For Money Sewage 66 74 76 75 79 83 80
25
v v
Water Company Affinity Water Anglian Bournemouth Bristol Cambridge Dwr Cymru Essex amp Suffolk
Complaints ndash Writtenper 10000 Properties 156 247 101 172 273 146 316
Complaints ndash Written per 10000 PropertiesLatest Results - September 2020
Water Company HafrenDyfrdwy Hartlepool Northumbrian Portsmouth Severn Trent South East South
Staffordshire
Complaints ndash Writtenper 10000 Properties 345 206 314 109 225 13 168
Water Company South West Southern Sutton amp East Surrey Thames United
Utilities Wessex Yorkshire
Complaints ndash Writtenper 10000 Properties 19 278 113 583 182 118 176
26
v
Performance scorecard
Personal Current Accounts
27
v
BankBuilding Society Monzo Starling Bank First Direct Metro Bank Nationwide Barclays Halifax
Overall Service Quality 86 84 83 81 71 62 62
Overall Service QualityCustomers were asked how likely they would be to recommend their provider to friends and family1
Latest results published in August 2020
These results show the proportion of customers of each provider who said they were lsquoextremely likelyrsquo or lsquovery likelyrsquo to recommend each service1
Access to the full Ipsos Mori Banking metrics surveys published every six months is available here
BankBuilding Society Santander Lloyds Bank Virgin Money HSBC NatWest Bank of
Scotland
Overall Service Quality 61 60 60 59 58 58
Current Account Service QualityBased on the 19 largest personal current account providers in Great Britain
BankBuilding Society
The Co-operative Bank Yorkshire Bank TSB Clydesdale Bank Royal Bank of
Scotland Tesco Bank
Overall Service Quality 57 56 51 51 46 44
28
v
BankBuilding Society Monzo Starling Bank Metro Bank First Direct Nationwide Barclays Halifax
Overall Service Quality 89 88 85 83 81 81 81
Online and Mobile Banking ServicesCustomers were asked how likely they would be to recommend their providerrsquos online and mobile banking services to friends andfamily1
Latest results published in August 2020
These results show the proportion of customers of each provider who said they were lsquoextremely likelyrsquo or lsquovery likelyrsquo to recommend each service1
Access to the full Ipsos Mori Banking metrics surveys published every six months is available here
BankBuilding Society Lloyds Bank Bank of
Scotland Santander NatWest Virgin Money HSBC
Overall Service Quality 78 77 76 75 75 72
Current Account Service QualityBased on the 19 largest personal current account providers in Great Britain
BankBuilding Society Yorkshire Bank Royal Bank of
ScotlandThe Co-
operative Bank Clydesdale Bank TSB Tesco Bank
Overall Service Quality 71 71 67 66 65 59
29
v
Firms offering personal current accounts with most Banking and credit card complaints (per 1000 accounts) H1 2020The data we collect includes complaints on credit cards current accounts packaged accounts savings unregulated loans and overdrafts and other banking For the purpose of accurately displaying data more specific to personal current accounts firms who do not offer personal current accounts have been excluded
A link to the latest FCA complaints data published on 15 December 2020 can be found hereThe figures are complaint numbers opened during the period January 1st 2020 - June 30th 2020 (H1)
Current Account Service QualityBased on the 10 firms offering personal current accounts with most complaints in H1 2020
0
2
4
6
8
10
12
14
Al Rayan Bank PLC Cynergy BankLimited
Barclays Bank Plc Bank of Ireland(UK) Plc
HSBC UK Bank Plc Monzo Bank Ltd Investec Bank PLC Secure Trust BankPlc
Marks amp SpencerFinancial Services
Plc
Tesco PersonalFinance PLC
Com
plai
nts
Firms
Number of complaints on banking and credit cards per 1000 accounts Average complaints per 1000 banking and credit card accounts all firms
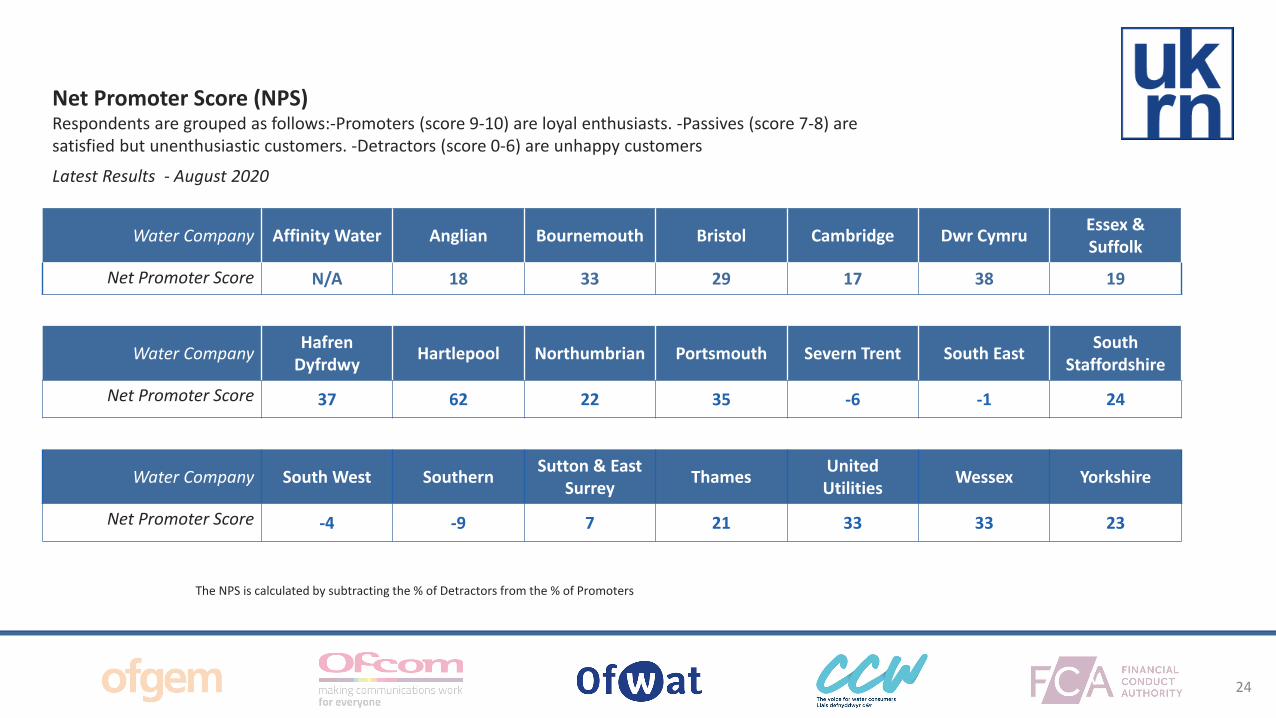
v v
Water Company Affinity Water Anglian Bournemouth Bristol Cambridge Dwr Cymru Essex amp Suffolk
Net Promoter Score NA 18 33 29 17 38 19
Net Promoter Score (NPS)Respondents are grouped as follows-Promoters (score 9-10) are loyal enthusiasts -Passives (score 7-8) are satisfied but unenthusiastic customers -Detractors (score 0-6) are unhappy customers
Latest Results - August 2020
Water Company HafrenDyfrdwy Hartlepool Northumbrian Portsmouth Severn Trent South East South
Staffordshire
Net Promoter Score 37 62 22 35 -6 -1 24
Water Company South West Southern Sutton amp East Surrey Thames United
Utilities Wessex Yorkshire
Net Promoter Score -4 -9 7 21 33 33 23
The NPS is calculated by subtracting the of Detractors from the of Promoters
24
v v
Water Company Affinity Water Anglian Bournemouth Bristol Cambridge Dwr Cymru Essex amp Suffolk
Value For Money Water 77 74 85 80 78 77 76
Value For Money Sewage 78 75 83 83 79 79 74
Value For Money (VFM) Water (W) amp Sewerage (S)Customers were asked lsquowhen thinking about value for money how satisfied or dissatisfied are you with the VFM of your servicersquo (0-5 scale) - Percentage who scored their provider with a 4 or 5 ratingrsquo shown
Water Company HafrenDyfrdwy Hartlepool Northumbrian Portsmouth Severn Trent South East South
Staffordshire
Value For Money Water 77 82 79 77 78 70 76
Value For Money Sewage 81 84 84 65 80 69 75
Water Company South West Southern Sutton amp East Surrey Thames United
Utilities Wessex Yorkshire
Value For Money Water 65 67 75 75 76 79 79
Value For Money Sewage 66 74 76 75 79 83 80
25
v v
Water Company Affinity Water Anglian Bournemouth Bristol Cambridge Dwr Cymru Essex amp Suffolk
Complaints ndash Writtenper 10000 Properties 156 247 101 172 273 146 316
Complaints ndash Written per 10000 PropertiesLatest Results - September 2020
Water Company HafrenDyfrdwy Hartlepool Northumbrian Portsmouth Severn Trent South East South
Staffordshire
Complaints ndash Writtenper 10000 Properties 345 206 314 109 225 13 168
Water Company South West Southern Sutton amp East Surrey Thames United
Utilities Wessex Yorkshire
Complaints ndash Writtenper 10000 Properties 19 278 113 583 182 118 176
26
v
Performance scorecard
Personal Current Accounts
27
v
BankBuilding Society Monzo Starling Bank First Direct Metro Bank Nationwide Barclays Halifax
Overall Service Quality 86 84 83 81 71 62 62
Overall Service QualityCustomers were asked how likely they would be to recommend their provider to friends and family1
Latest results published in August 2020
These results show the proportion of customers of each provider who said they were lsquoextremely likelyrsquo or lsquovery likelyrsquo to recommend each service1
Access to the full Ipsos Mori Banking metrics surveys published every six months is available here
BankBuilding Society Santander Lloyds Bank Virgin Money HSBC NatWest Bank of
Scotland
Overall Service Quality 61 60 60 59 58 58
Current Account Service QualityBased on the 19 largest personal current account providers in Great Britain
BankBuilding Society
The Co-operative Bank Yorkshire Bank TSB Clydesdale Bank Royal Bank of
Scotland Tesco Bank
Overall Service Quality 57 56 51 51 46 44
28
v
BankBuilding Society Monzo Starling Bank Metro Bank First Direct Nationwide Barclays Halifax
Overall Service Quality 89 88 85 83 81 81 81
Online and Mobile Banking ServicesCustomers were asked how likely they would be to recommend their providerrsquos online and mobile banking services to friends andfamily1
Latest results published in August 2020
These results show the proportion of customers of each provider who said they were lsquoextremely likelyrsquo or lsquovery likelyrsquo to recommend each service1
Access to the full Ipsos Mori Banking metrics surveys published every six months is available here
BankBuilding Society Lloyds Bank Bank of
Scotland Santander NatWest Virgin Money HSBC
Overall Service Quality 78 77 76 75 75 72
Current Account Service QualityBased on the 19 largest personal current account providers in Great Britain
BankBuilding Society Yorkshire Bank Royal Bank of
ScotlandThe Co-
operative Bank Clydesdale Bank TSB Tesco Bank
Overall Service Quality 71 71 67 66 65 59
29
v
Firms offering personal current accounts with most Banking and credit card complaints (per 1000 accounts) H1 2020The data we collect includes complaints on credit cards current accounts packaged accounts savings unregulated loans and overdrafts and other banking For the purpose of accurately displaying data more specific to personal current accounts firms who do not offer personal current accounts have been excluded
A link to the latest FCA complaints data published on 15 December 2020 can be found hereThe figures are complaint numbers opened during the period January 1st 2020 - June 30th 2020 (H1)
Current Account Service QualityBased on the 10 firms offering personal current accounts with most complaints in H1 2020
0
2
4
6
8
10
12
14
Al Rayan Bank PLC Cynergy BankLimited
Barclays Bank Plc Bank of Ireland(UK) Plc
HSBC UK Bank Plc Monzo Bank Ltd Investec Bank PLC Secure Trust BankPlc
Marks amp SpencerFinancial Services
Plc
Tesco PersonalFinance PLC
Com
plai
nts
Firms
Number of complaints on banking and credit cards per 1000 accounts Average complaints per 1000 banking and credit card accounts all firms
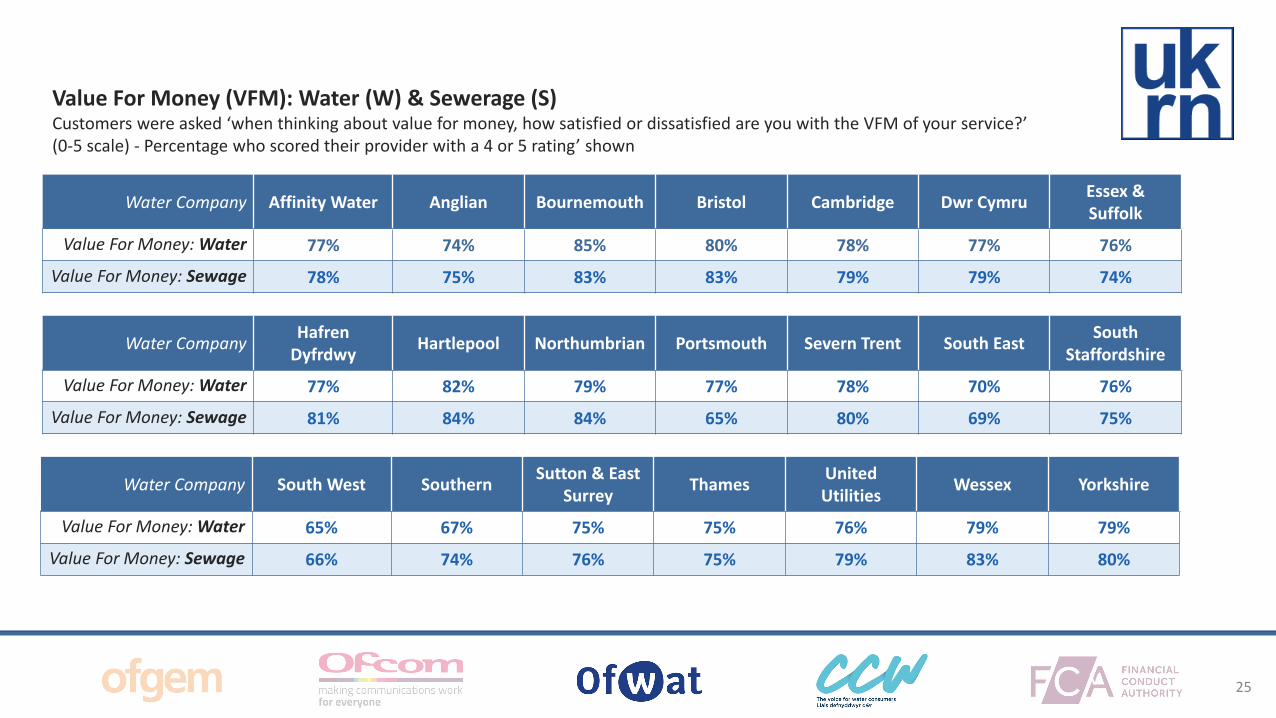
v v
Water Company Affinity Water Anglian Bournemouth Bristol Cambridge Dwr Cymru Essex amp Suffolk
Value For Money Water 77 74 85 80 78 77 76
Value For Money Sewage 78 75 83 83 79 79 74
Value For Money (VFM) Water (W) amp Sewerage (S)Customers were asked lsquowhen thinking about value for money how satisfied or dissatisfied are you with the VFM of your servicersquo (0-5 scale) - Percentage who scored their provider with a 4 or 5 ratingrsquo shown
Water Company HafrenDyfrdwy Hartlepool Northumbrian Portsmouth Severn Trent South East South
Staffordshire
Value For Money Water 77 82 79 77 78 70 76
Value For Money Sewage 81 84 84 65 80 69 75
Water Company South West Southern Sutton amp East Surrey Thames United
Utilities Wessex Yorkshire
Value For Money Water 65 67 75 75 76 79 79
Value For Money Sewage 66 74 76 75 79 83 80
25
v v
Water Company Affinity Water Anglian Bournemouth Bristol Cambridge Dwr Cymru Essex amp Suffolk
Complaints ndash Writtenper 10000 Properties 156 247 101 172 273 146 316
Complaints ndash Written per 10000 PropertiesLatest Results - September 2020
Water Company HafrenDyfrdwy Hartlepool Northumbrian Portsmouth Severn Trent South East South
Staffordshire
Complaints ndash Writtenper 10000 Properties 345 206 314 109 225 13 168
Water Company South West Southern Sutton amp East Surrey Thames United
Utilities Wessex Yorkshire
Complaints ndash Writtenper 10000 Properties 19 278 113 583 182 118 176
26
v
Performance scorecard
Personal Current Accounts
27
v
BankBuilding Society Monzo Starling Bank First Direct Metro Bank Nationwide Barclays Halifax
Overall Service Quality 86 84 83 81 71 62 62
Overall Service QualityCustomers were asked how likely they would be to recommend their provider to friends and family1
Latest results published in August 2020
These results show the proportion of customers of each provider who said they were lsquoextremely likelyrsquo or lsquovery likelyrsquo to recommend each service1
Access to the full Ipsos Mori Banking metrics surveys published every six months is available here
BankBuilding Society Santander Lloyds Bank Virgin Money HSBC NatWest Bank of
Scotland
Overall Service Quality 61 60 60 59 58 58
Current Account Service QualityBased on the 19 largest personal current account providers in Great Britain
BankBuilding Society
The Co-operative Bank Yorkshire Bank TSB Clydesdale Bank Royal Bank of
Scotland Tesco Bank
Overall Service Quality 57 56 51 51 46 44
28
v
BankBuilding Society Monzo Starling Bank Metro Bank First Direct Nationwide Barclays Halifax
Overall Service Quality 89 88 85 83 81 81 81
Online and Mobile Banking ServicesCustomers were asked how likely they would be to recommend their providerrsquos online and mobile banking services to friends andfamily1
Latest results published in August 2020
These results show the proportion of customers of each provider who said they were lsquoextremely likelyrsquo or lsquovery likelyrsquo to recommend each service1
Access to the full Ipsos Mori Banking metrics surveys published every six months is available here
BankBuilding Society Lloyds Bank Bank of
Scotland Santander NatWest Virgin Money HSBC
Overall Service Quality 78 77 76 75 75 72
Current Account Service QualityBased on the 19 largest personal current account providers in Great Britain
BankBuilding Society Yorkshire Bank Royal Bank of
ScotlandThe Co-
operative Bank Clydesdale Bank TSB Tesco Bank
Overall Service Quality 71 71 67 66 65 59
29
v
Firms offering personal current accounts with most Banking and credit card complaints (per 1000 accounts) H1 2020The data we collect includes complaints on credit cards current accounts packaged accounts savings unregulated loans and overdrafts and other banking For the purpose of accurately displaying data more specific to personal current accounts firms who do not offer personal current accounts have been excluded
A link to the latest FCA complaints data published on 15 December 2020 can be found hereThe figures are complaint numbers opened during the period January 1st 2020 - June 30th 2020 (H1)
Current Account Service QualityBased on the 10 firms offering personal current accounts with most complaints in H1 2020
0
2
4
6
8
10
12
14
Al Rayan Bank PLC Cynergy BankLimited
Barclays Bank Plc Bank of Ireland(UK) Plc
HSBC UK Bank Plc Monzo Bank Ltd Investec Bank PLC Secure Trust BankPlc
Marks amp SpencerFinancial Services
Plc
Tesco PersonalFinance PLC
Com
plai
nts
Firms
Number of complaints on banking and credit cards per 1000 accounts Average complaints per 1000 banking and credit card accounts all firms
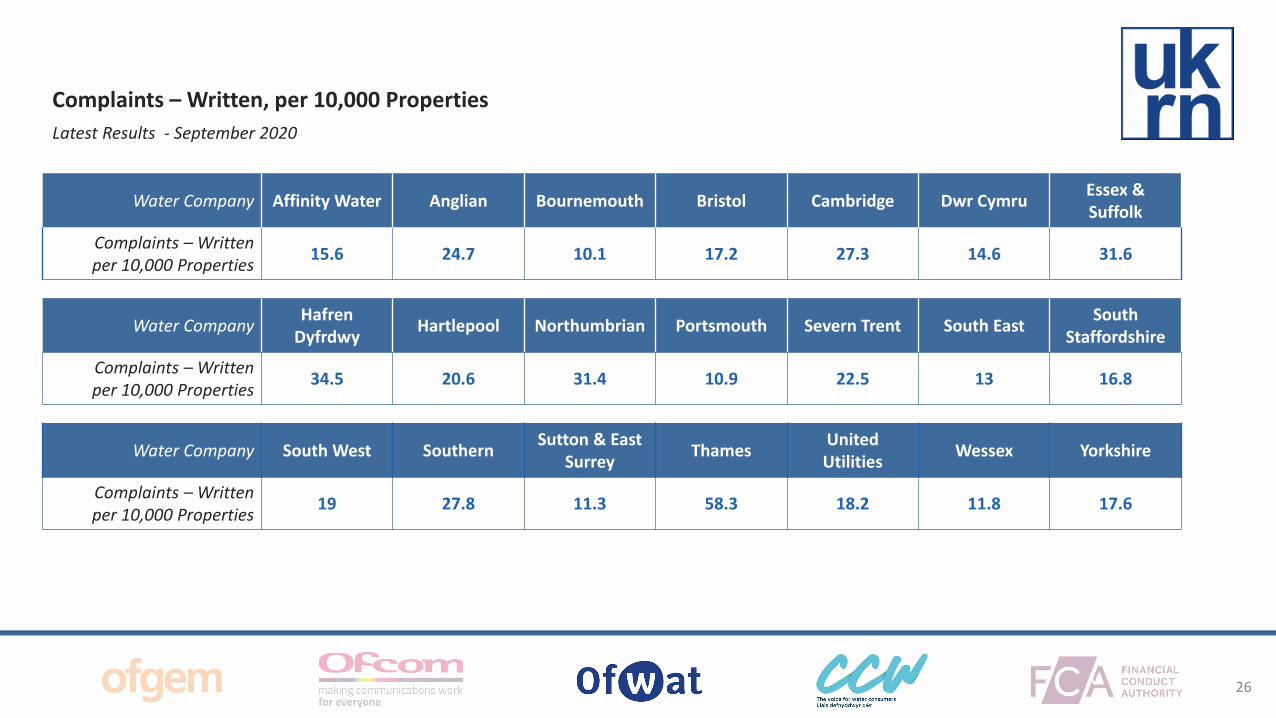
v v
Water Company Affinity Water Anglian Bournemouth Bristol Cambridge Dwr Cymru Essex amp Suffolk
Complaints ndash Writtenper 10000 Properties 156 247 101 172 273 146 316
Complaints ndash Written per 10000 PropertiesLatest Results - September 2020
Water Company HafrenDyfrdwy Hartlepool Northumbrian Portsmouth Severn Trent South East South
Staffordshire
Complaints ndash Writtenper 10000 Properties 345 206 314 109 225 13 168
Water Company South West Southern Sutton amp East Surrey Thames United
Utilities Wessex Yorkshire
Complaints ndash Writtenper 10000 Properties 19 278 113 583 182 118 176
26
v
Performance scorecard
Personal Current Accounts
27
v
BankBuilding Society Monzo Starling Bank First Direct Metro Bank Nationwide Barclays Halifax
Overall Service Quality 86 84 83 81 71 62 62
Overall Service QualityCustomers were asked how likely they would be to recommend their provider to friends and family1
Latest results published in August 2020
These results show the proportion of customers of each provider who said they were lsquoextremely likelyrsquo or lsquovery likelyrsquo to recommend each service1
Access to the full Ipsos Mori Banking metrics surveys published every six months is available here
BankBuilding Society Santander Lloyds Bank Virgin Money HSBC NatWest Bank of
Scotland
Overall Service Quality 61 60 60 59 58 58
Current Account Service QualityBased on the 19 largest personal current account providers in Great Britain
BankBuilding Society
The Co-operative Bank Yorkshire Bank TSB Clydesdale Bank Royal Bank of
Scotland Tesco Bank
Overall Service Quality 57 56 51 51 46 44
28
v
BankBuilding Society Monzo Starling Bank Metro Bank First Direct Nationwide Barclays Halifax
Overall Service Quality 89 88 85 83 81 81 81
Online and Mobile Banking ServicesCustomers were asked how likely they would be to recommend their providerrsquos online and mobile banking services to friends andfamily1
Latest results published in August 2020
These results show the proportion of customers of each provider who said they were lsquoextremely likelyrsquo or lsquovery likelyrsquo to recommend each service1
Access to the full Ipsos Mori Banking metrics surveys published every six months is available here
BankBuilding Society Lloyds Bank Bank of
Scotland Santander NatWest Virgin Money HSBC
Overall Service Quality 78 77 76 75 75 72
Current Account Service QualityBased on the 19 largest personal current account providers in Great Britain
BankBuilding Society Yorkshire Bank Royal Bank of
ScotlandThe Co-
operative Bank Clydesdale Bank TSB Tesco Bank
Overall Service Quality 71 71 67 66 65 59
29
v
Firms offering personal current accounts with most Banking and credit card complaints (per 1000 accounts) H1 2020The data we collect includes complaints on credit cards current accounts packaged accounts savings unregulated loans and overdrafts and other banking For the purpose of accurately displaying data more specific to personal current accounts firms who do not offer personal current accounts have been excluded
A link to the latest FCA complaints data published on 15 December 2020 can be found hereThe figures are complaint numbers opened during the period January 1st 2020 - June 30th 2020 (H1)
Current Account Service QualityBased on the 10 firms offering personal current accounts with most complaints in H1 2020
0
2
4
6
8
10
12
14
Al Rayan Bank PLC Cynergy BankLimited
Barclays Bank Plc Bank of Ireland(UK) Plc
HSBC UK Bank Plc Monzo Bank Ltd Investec Bank PLC Secure Trust BankPlc
Marks amp SpencerFinancial Services
Plc
Tesco PersonalFinance PLC
Com
plai
nts
Firms
Number of complaints on banking and credit cards per 1000 accounts Average complaints per 1000 banking and credit card accounts all firms
v
Performance scorecard
Personal Current Accounts
27
v
BankBuilding Society Monzo Starling Bank First Direct Metro Bank Nationwide Barclays Halifax
Overall Service Quality 86 84 83 81 71 62 62
Overall Service QualityCustomers were asked how likely they would be to recommend their provider to friends and family1
Latest results published in August 2020
These results show the proportion of customers of each provider who said they were lsquoextremely likelyrsquo or lsquovery likelyrsquo to recommend each service1
Access to the full Ipsos Mori Banking metrics surveys published every six months is available here
BankBuilding Society Santander Lloyds Bank Virgin Money HSBC NatWest Bank of
Scotland
Overall Service Quality 61 60 60 59 58 58
Current Account Service QualityBased on the 19 largest personal current account providers in Great Britain
BankBuilding Society
The Co-operative Bank Yorkshire Bank TSB Clydesdale Bank Royal Bank of
Scotland Tesco Bank
Overall Service Quality 57 56 51 51 46 44
28
v
BankBuilding Society Monzo Starling Bank Metro Bank First Direct Nationwide Barclays Halifax
Overall Service Quality 89 88 85 83 81 81 81
Online and Mobile Banking ServicesCustomers were asked how likely they would be to recommend their providerrsquos online and mobile banking services to friends andfamily1
Latest results published in August 2020
These results show the proportion of customers of each provider who said they were lsquoextremely likelyrsquo or lsquovery likelyrsquo to recommend each service1
Access to the full Ipsos Mori Banking metrics surveys published every six months is available here
BankBuilding Society Lloyds Bank Bank of
Scotland Santander NatWest Virgin Money HSBC
Overall Service Quality 78 77 76 75 75 72
Current Account Service QualityBased on the 19 largest personal current account providers in Great Britain
BankBuilding Society Yorkshire Bank Royal Bank of
ScotlandThe Co-
operative Bank Clydesdale Bank TSB Tesco Bank
Overall Service Quality 71 71 67 66 65 59
29
v
Firms offering personal current accounts with most Banking and credit card complaints (per 1000 accounts) H1 2020The data we collect includes complaints on credit cards current accounts packaged accounts savings unregulated loans and overdrafts and other banking For the purpose of accurately displaying data more specific to personal current accounts firms who do not offer personal current accounts have been excluded
A link to the latest FCA complaints data published on 15 December 2020 can be found hereThe figures are complaint numbers opened during the period January 1st 2020 - June 30th 2020 (H1)
Current Account Service QualityBased on the 10 firms offering personal current accounts with most complaints in H1 2020
0
2
4
6
8
10
12
14
Al Rayan Bank PLC Cynergy BankLimited
Barclays Bank Plc Bank of Ireland(UK) Plc
HSBC UK Bank Plc Monzo Bank Ltd Investec Bank PLC Secure Trust BankPlc
Marks amp SpencerFinancial Services
Plc
Tesco PersonalFinance PLC
Com
plai
nts
Firms
Number of complaints on banking and credit cards per 1000 accounts Average complaints per 1000 banking and credit card accounts all firms
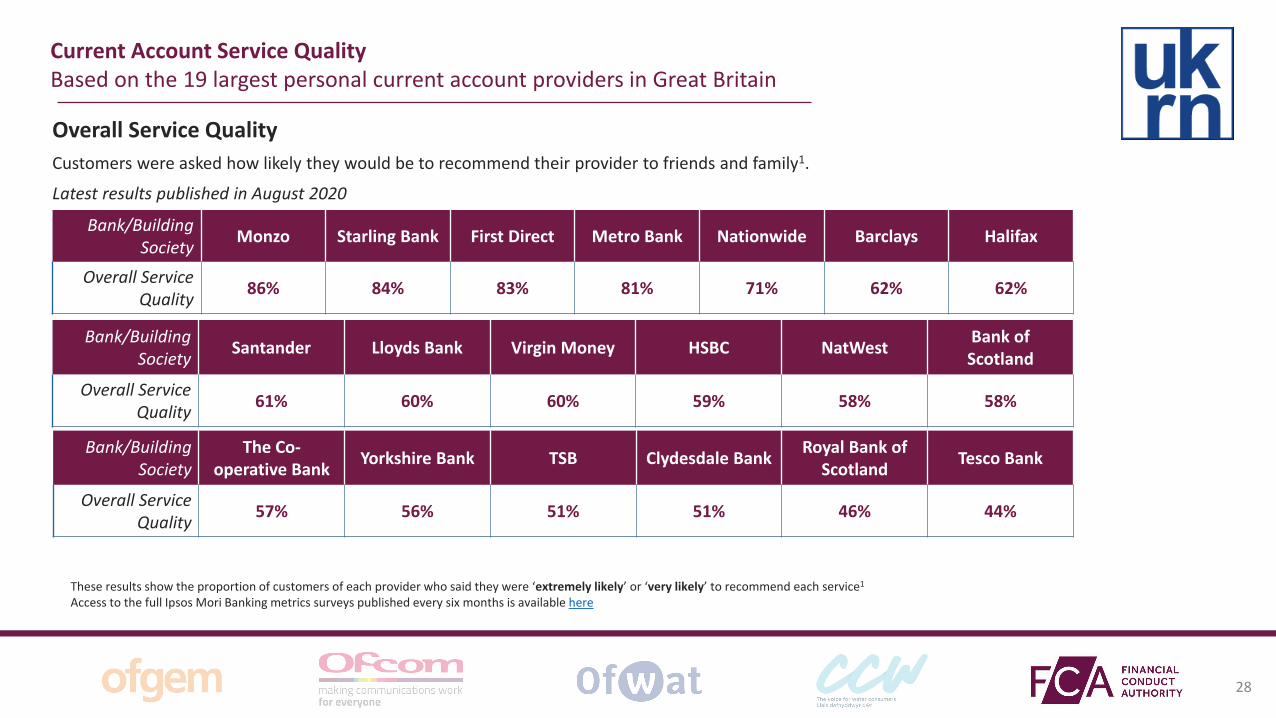
v
BankBuilding Society Monzo Starling Bank First Direct Metro Bank Nationwide Barclays Halifax
Overall Service Quality 86 84 83 81 71 62 62
Overall Service QualityCustomers were asked how likely they would be to recommend their provider to friends and family1
Latest results published in August 2020
These results show the proportion of customers of each provider who said they were lsquoextremely likelyrsquo or lsquovery likelyrsquo to recommend each service1
Access to the full Ipsos Mori Banking metrics surveys published every six months is available here
BankBuilding Society Santander Lloyds Bank Virgin Money HSBC NatWest Bank of
Scotland
Overall Service Quality 61 60 60 59 58 58
Current Account Service QualityBased on the 19 largest personal current account providers in Great Britain
BankBuilding Society
The Co-operative Bank Yorkshire Bank TSB Clydesdale Bank Royal Bank of
Scotland Tesco Bank
Overall Service Quality 57 56 51 51 46 44
28
v
BankBuilding Society Monzo Starling Bank Metro Bank First Direct Nationwide Barclays Halifax
Overall Service Quality 89 88 85 83 81 81 81
Online and Mobile Banking ServicesCustomers were asked how likely they would be to recommend their providerrsquos online and mobile banking services to friends andfamily1
Latest results published in August 2020
These results show the proportion of customers of each provider who said they were lsquoextremely likelyrsquo or lsquovery likelyrsquo to recommend each service1
Access to the full Ipsos Mori Banking metrics surveys published every six months is available here
BankBuilding Society Lloyds Bank Bank of
Scotland Santander NatWest Virgin Money HSBC
Overall Service Quality 78 77 76 75 75 72
Current Account Service QualityBased on the 19 largest personal current account providers in Great Britain
BankBuilding Society Yorkshire Bank Royal Bank of
ScotlandThe Co-
operative Bank Clydesdale Bank TSB Tesco Bank
Overall Service Quality 71 71 67 66 65 59
29
v
Firms offering personal current accounts with most Banking and credit card complaints (per 1000 accounts) H1 2020The data we collect includes complaints on credit cards current accounts packaged accounts savings unregulated loans and overdrafts and other banking For the purpose of accurately displaying data more specific to personal current accounts firms who do not offer personal current accounts have been excluded
A link to the latest FCA complaints data published on 15 December 2020 can be found hereThe figures are complaint numbers opened during the period January 1st 2020 - June 30th 2020 (H1)
Current Account Service QualityBased on the 10 firms offering personal current accounts with most complaints in H1 2020
0
2
4
6
8
10
12
14
Al Rayan Bank PLC Cynergy BankLimited
Barclays Bank Plc Bank of Ireland(UK) Plc
HSBC UK Bank Plc Monzo Bank Ltd Investec Bank PLC Secure Trust BankPlc
Marks amp SpencerFinancial Services
Plc
Tesco PersonalFinance PLC
Com
plai
nts
Firms
Number of complaints on banking and credit cards per 1000 accounts Average complaints per 1000 banking and credit card accounts all firms
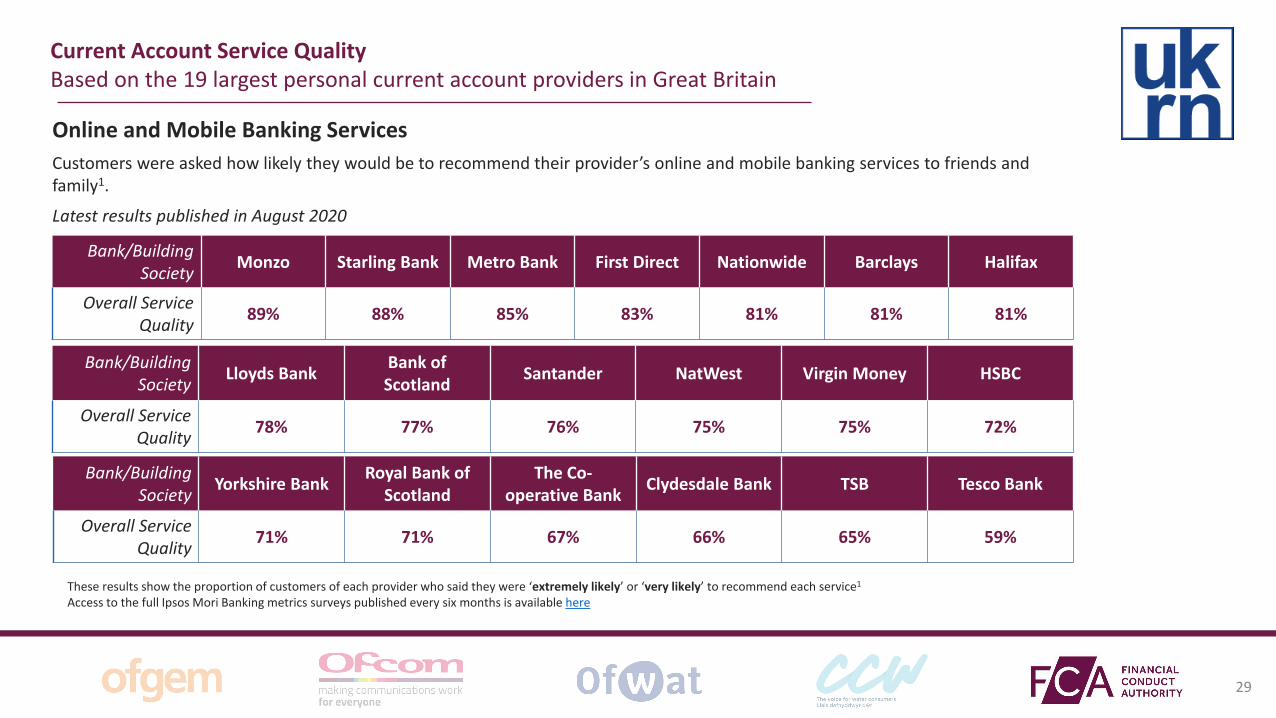
v
BankBuilding Society Monzo Starling Bank Metro Bank First Direct Nationwide Barclays Halifax
Overall Service Quality 89 88 85 83 81 81 81
Online and Mobile Banking ServicesCustomers were asked how likely they would be to recommend their providerrsquos online and mobile banking services to friends andfamily1
Latest results published in August 2020
These results show the proportion of customers of each provider who said they were lsquoextremely likelyrsquo or lsquovery likelyrsquo to recommend each service1
Access to the full Ipsos Mori Banking metrics surveys published every six months is available here
BankBuilding Society Lloyds Bank Bank of
Scotland Santander NatWest Virgin Money HSBC
Overall Service Quality 78 77 76 75 75 72
Current Account Service QualityBased on the 19 largest personal current account providers in Great Britain
BankBuilding Society Yorkshire Bank Royal Bank of
ScotlandThe Co-
operative Bank Clydesdale Bank TSB Tesco Bank
Overall Service Quality 71 71 67 66 65 59
29
v
Firms offering personal current accounts with most Banking and credit card complaints (per 1000 accounts) H1 2020The data we collect includes complaints on credit cards current accounts packaged accounts savings unregulated loans and overdrafts and other banking For the purpose of accurately displaying data more specific to personal current accounts firms who do not offer personal current accounts have been excluded
A link to the latest FCA complaints data published on 15 December 2020 can be found hereThe figures are complaint numbers opened during the period January 1st 2020 - June 30th 2020 (H1)
Current Account Service QualityBased on the 10 firms offering personal current accounts with most complaints in H1 2020
0
2
4
6
8
10
12
14
Al Rayan Bank PLC Cynergy BankLimited
Barclays Bank Plc Bank of Ireland(UK) Plc
HSBC UK Bank Plc Monzo Bank Ltd Investec Bank PLC Secure Trust BankPlc
Marks amp SpencerFinancial Services
Plc
Tesco PersonalFinance PLC
Com
plai
nts
Firms
Number of complaints on banking and credit cards per 1000 accounts Average complaints per 1000 banking and credit card accounts all firms
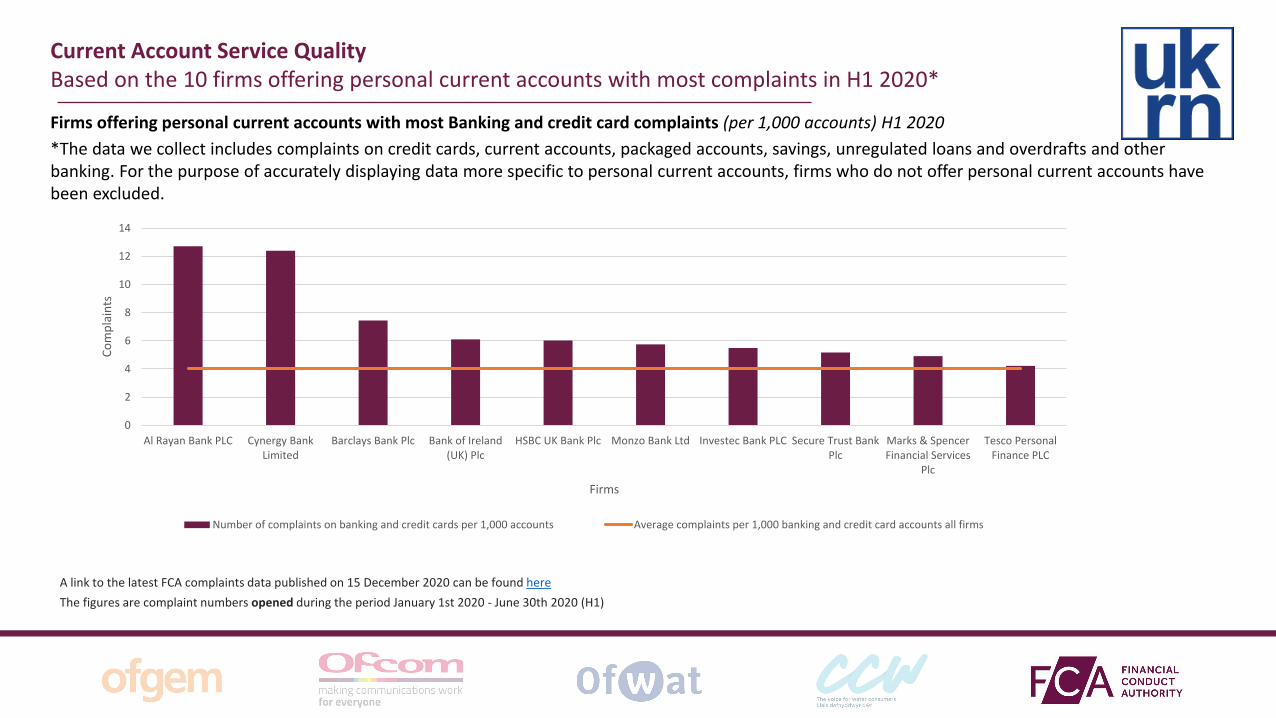
v
Firms offering personal current accounts with most Banking and credit card complaints (per 1000 accounts) H1 2020The data we collect includes complaints on credit cards current accounts packaged accounts savings unregulated loans and overdrafts and other banking For the purpose of accurately displaying data more specific to personal current accounts firms who do not offer personal current accounts have been excluded
A link to the latest FCA complaints data published on 15 December 2020 can be found hereThe figures are complaint numbers opened during the period January 1st 2020 - June 30th 2020 (H1)
Current Account Service QualityBased on the 10 firms offering personal current accounts with most complaints in H1 2020
0
2
4
6
8
10
12
14
Al Rayan Bank PLC Cynergy BankLimited
Barclays Bank Plc Bank of Ireland(UK) Plc
HSBC UK Bank Plc Monzo Bank Ltd Investec Bank PLC Secure Trust BankPlc
Marks amp SpencerFinancial Services
Plc
Tesco PersonalFinance PLC
Com
plai
nts
Firms
Number of complaints on banking and credit cards per 1000 accounts Average complaints per 1000 banking and credit card accounts all firms
Recommended