Uttara
khand
State
Per
spec
tive
and
Stra
tegic
Pla
n
2009
-202
7
Watershed Management Directorate, Dehradun

TABLE OF CONTENTS
Executive Summary
List of Abbreviations
Chapter-1 – Introduction 1-5
Chapter-2 - About the State 6-39
General State Profile
Physiographic Zones of Uttarakhand
Land use
Natural Resource Base of Uttarakhand
Forest Cover
Water Regime
Development Indicators of the State
Operational and Livelihood Status
Irrigation Status
Drought and Floods
Agricultural Growth and Development
Inputs in Agriculture
Status of Forests
Livestock
Fisheries
Agriculture Marketing, Credit and Processing

Chapter-3 - Status of Rainfed Areas in the State 40-82
Position of Rainfed Area in the State
Livelihood Analysis in Rainfed Areas
Major Problems and Constraints of Agriculture Production in
Uttarakhand
Yield Gaps of Major Crops
Yield Gaps in Horticulture Crops
Yield Gaps in Fisheries
Inputs, Credits, Processing and Marketing Gaps
Technology/Extension/ Adoption Gaps
Infrastructural and Institutional Gaps
Chapter-4 - Major Programs / Schemes and Impacts 83-98
Major Programs/Schemes/Projects Operational In the State
Analysis of Various Programs/ Schemes
Chapter – 5 - Issues and Challenges 99-110
Challenges for Food Security
Challenges for Water Security
Challenges for Feed and Fodder Security
Challenges for Environmental Security
Challenges for Livelihood Security
Chapter – 6 - Vision and Mission 111-112
Vision of Watershed Management Directorate
Mission Statement
Chapter -7 – Perspective 113-143
Need for Perspective Plan
Project Area
Soil and Moisture Conservation Measures
Water Harvesting Techniques
Forestry
Agriculture
Horticulture
Livestock Based Production System
Income Generating Activities
Chapter-8 - Implementation Strategy 144-180
Institutional Arrangement
Preparation & Participation Process
Implementation & Financial Management:
Capacity Building Strategy
District wise area Proposed for Treatment
Physical and financial implications of the project
Chapter -9 - Output and Outcome Indicators 181-188
Results Framework and Monitoring of IWMP
Annexures
Appendices
Maps
References

UTTARAKHAND STATE
PERSPECTIVE AND STRATEGIC PLAN, 2009-2027
EXECUTIVE SUMMARY
Uttarakhand is located between 28o 43' – 31o 27' N latitudes and 77o 34' – 81o 02' E longitudes. The river
Tons separates the state from Himachal Pradesh in the north-west, whereas the river Kali separates it from
Nepal in the east. The greater Himalaya is the northern boundary of the state and is also the international
border with China (Tibet). Foot-hills in the south are bound by Uttar Pradesh. The region, being situated
centrally in the long sweep of the Himalaya, forms a transitional zone between the per-humid eastern and the
dry to sub-humid western Himalaya. Uttarakhand became the 27th state of the Republic of India on 9
November 2000.
The population of the state primarily depends on agriculture for livelihood; about 70% of the population is
engaged in agriculture. Out of total reported area, only 14.02% is under cultivation. More than 55.0% of the
cultivated land in the State is rainfed. The cropping intensity is 160.6%. The landholdings are small and
scattered. The average land holding is around 0.68 ha (that too is divided into many patches) in the hills and
1.77 ha in the plains.
About 70% of hills population is engaged in agriculture. There is hardly any other major source of livelihood
deriving from the secondary or tertiary sectors. These sectors are very poorly developed primarily because of
inaccessibility and vulnerability of mountain regions. Although almost 70% of the population is dependent of
the primary sectors, the contribution of this sector of the GDP/NDDP is only 37.5. As a result, it does not
provide sufficient income levels to the people. This subsistence nature, which leads to low incomes and
unstable incomes, which in turn lead to a sizeable out-migration of male members that leads to only women
headed families behind, and the role of women in the household economy becomes more important.
After attaining statehood in 2000, the economic progress of Uttarakhand has been rapid, with its economic
growth rate increasing from just over 3% per annum to 11% per annum. However, this rapid growth has been
accompanied by adverse impacts on the local ecology, thus making the incorporation of sustainable
development practices into the State’s overall development strategy an imperative.
Water, agriculture, forestry and energy, among other issues, are central to the State’s inclusive strategy for
future growth. Most of the people of this state are dependent on their natural environment, with over three-
fourths of the total population dependent on agriculture for their livelihood. Also, with over fifteen
important rivers and over a dozen glaciers in the State, Uttarakhand is a valuable fresh water reserve. There
are also about 200 large and medium sized hydro-projects and therefore hydroelectricity continues to be a
prime source of capital for the local economy. Forests cover a large percentage of the land area with many
industries being forest based.
The Himalayan watersheds are under constant threat of mass wasting and erosion caused by depletion of
forest cover, unscientific agronomic practices and hydrologic imbalances. The ever increasing population, the
need to provide a better quality of life to the people and the pressure on natural resources is further
compounding the problem. The total of 7.66 lakh ha. cultivated area in the State 4.21 lakh ha. area is rainfed.
An insight into the rainfed regions reveals a grim picture of poverty, water scarcity, rapid depletion of ground
water table and fragile ecosystem. Land degradation due to soil erosion by wind and water, low rainwater
use efficiency, high population pressure, acute fodder shortage, poor livestock productivity, under investment
in water use efficiency, lack of assured and remunerative marketing opportunities and poor infrastructure are
important concerns of enabling policies. The challenge in rainfed areas, therefore, is to improve rural
livelihoods through participatory watershed development with focus on integrated farming system for
enhancing income, productivity and livelihood security in a sustainable manner.
The main objective of the proposed project is to increase the productivity and income of the rural inhabitants
in the Rainfed Micro-watersheds of the State on priority basis area through sustainable management of the
natural resources. Since agriculture and related activities are the main source of livelihood for the proposed
target area, land based activities and livestock will play a significant role in achieving the project objectives.
The project will reduce the emphasis on traditional crops and will increase prominence on high value crop and
value addition through grading, packaging, processing and encouraging organic farming. Further, to ensure
the sustainability of the proposed activities and ensuring cost sharing by participants for capital investments
and also the recurrent costs associated with maintenance of the assets.
To realize the above objectives following three components and sub components need to be incorporated in
the Integrated Watershed Management Project (IWMP).
1. Participatory Watershed Development and Management
Promotion of social mobilization and community driven sustainable and equitable decision making
Collectively planned Watershed Treatments

2. Enhancing Livelihood Opportunities
Farming Systems Improvement supporting increased employment and productivity
Value addition and marketing support
Income Generating Activities for Self Help Groups integrated with watershed Development
3. Institutional Strengthening and promotion of economic/livelihood activities
Capacity building of all tiers of PRIs and local community institutions in exercising rights and
responsibilities
Information, Education and Communication to promote optimization from amongst different
strategies.
A number of watershed management projects are being executed in the state under different schemes; the
Micro watersheds where these schemes are being implemented have been selected more on the grounds of
suitability of working areas to the Project Implementing Agency (PIA) than on the basis of any priority made
in an objective manner. There are a number of projects/ schemes operational in the State which is
implementing MWS treatments. Keeping these schemes in view only the untreated MWS were shortlisted for
the above project.
In the State 1110 MWS have been delineated leaving Haridwar District. In the untreated MWS which are
537, 124 micro watersheds have been identified above 3200 mt. altitude comprising a total area of 14, 25,750
ha. These are areas with little to no human habitations, snow bound glaciers, rocky and forest covered areas.
The status of this land is mainly Reserve Forest which is under the jurisdiction of the State Forest
department. Micro watersheds in this zone are land slide prone having slopes greater than 30 degrees
gradient. Besides, these areas are also facing tremendous pressure and degradation of their natural resource
due to high tourist and pilgrim inflow. Any watershed treatment required in this zone (> 3200mt) will be
undertaken as convergence projects requiring special interventions by the concerned departments.
Within the 537 untreated MWS, 409 micro watersheds have been identified which are below 3200 mt.
altitude comprising a total area of 18,11,887 ha. and additionally 1,20,000 ha. of area from Haridwar
district have been prioritized for treatment (MWS have not been delineated in Haridwar district). The total
area available for treatment under the plans has also been calculated for every district. The criteria and
weightage for selection of MWS has been done on the basis of criteria provided by Department of Land
Resource Ministry of Rural Development, Govt. of India.

These MWS could also be taken up under various convergence schemes. Amongst the various convergence
schemes specific projects designed by various Line Departments like Forest, Agriculture, Rural Development
can be taken up. Any Externally Aided Project working on Watershed Guidelines could also prove to be a
good convergence project. Within these projects also NREGS could also be used as an effective convergence
tool.
19.31 lakh ha. area would be taken up for treatment in all the districts of the State. Of the 537 untreated
MWS 409 have been shortlisted for the Integrated Watershed Management Project (IWMP).
The plan wise phasing of the physical and financial program of watershed development has been depicted in
(Annexure Table 8.2 a). Uttarakhand State being predominantly a hill state with difficult terrain a financial
outlay of Rs. 15000 per ha. has been taken for the hill district and for the plain districts of Udhamsingh
Nagar, Haridwar and some part of Nainital districts financial outlay of Rs. 12000 per ha. has been taken.
Thus a total outlay of Rs. 2742.52 crores has been projected for a period of 18 years. The financial provision
required for the 11th plan is Rs. 621 crores for the 12th Plan, it is Rs. 624 crores, for the 13th Plan Rs. 660
crores and for the 14th Plan it is 858.52 crores.
The annual plan for the remaining 11th Plan showing the Watershed areas planned for treatment and
financial provision year wise has been depicted district wise in (Annexure Table-8.2 b). 86 MWS covering an
area of 4.3 lakh ha. are proposed to be taken up for treatment in the 11th plan period.
Watershed Management works entail considerable amount of budget and hence a proper monitoring and
impact evaluation is desired to assess the benefits accrued out of the expenditure incurred. Thus, to monitor
the achievement of our defined project objectives certain output indicators have been designed which will help
in quantifying the objectives any change in achievement of objectives will help in flagging our procedural
shortcomings like ineffective community mobilization, poor PRA process improper prioritization of natural
resource management objectives etc.

LIST OF ABBREVIATIONS
AWP Annual Work Plan APMC Agriculture Produce Marketing Committee BPL Below Poverty Line BQ Black Quarter CBO Capacity Building Organization CEO Chief Executive Officer CAPART Council For Advancement of People’s Action And Rural
Technology CAT Catchment Area Treatment Plan CAS Country Assistance Strategy CSWRTI Central Soil and Water Research and Training Institute DWDU District Watershed Development Units DPC District Planning Committee DPAP Drought Prone Area Program DPR Detailed Project Report DCCBs District Cooperative and Credit Banks EDP Entrepreneurial Development Program ES&A Environment and Social Assessment ERR Economic Rate of Return FFS Farmers Field School FPAP Flood Prone Area Project FMD Foot & Mouth disease FYM Farmyard Manure FIGs Farmer Income Group GDP Gross Domestic Product GPWDP Gram Panchyat Watershed Development Plan GP Gram Panchayat IMM Integrated Moisture Management IEC Information Education and Communication IWM Integrated Weed Management IWMP Integrated Watershed Management Project IWDP Integrated Wastelands Development Program IGA Income Generating Activity IPDM Integrated Pest & Disease Management IPNM Integrated Plant Nutrient Management KGK Krishi Gyan Kendra KVK Krishi Vigyan Kendra LSD Land Survey Directorate MWS Microwatersheds MoU Memorandum of Understanding MIS Management Information System NWP National Water Policy NABARD National Bank of Agriculture and Regional Development NGOs Non Government Organizations NREGA National Rural Employment Guarantee Act NWFPs Non-Wood Forest Products NWDPRA National Watershed Development Project for Rainfed Areas

NWFP Non Wood Forest Produce NRAA National Rainfed Area Authority NIRD National Institute of Rural Development PIAs Project Implementing Agencies PCNA Participatory Communication Needs Assessment PRA Participatory Rural Appraisal PDS Public Distribution System PAD Project Appraisal Document PDOs Project Development Objectives PIP Project Implementation Plan PACS Primary Agriculture Credit Societies RF Revolving fund RBM River Bed Material RVP River Valley Project SHPI Self Help Promoting Institution STCR Soil Test Crop Response SHG Self Help Groups TA Technical Assistant Team VDC Village Development Communities UKUMP Uttarakhand Krishi Utpadhan Mandi Parishad UOCV Uttarakhand Organic Community Board UDWDP Uttarakhand Decentralized Watershed Development Project UGs User Groups VOs Voluntary Organizations WMD Watershed Management Directorate WDF Watershed Development Fund WDT Watershed Development Team WC Watershed Committees
1
CHAPTER 1 INTRODUCTION
Uttarakhand is located between 28o 43' – 31o 27' N latitudes and 77o 34' – 81o 02' E
longitudes. The river Tons separates the state from Himachal Pradesh in the north-
west, whereas the river Kali separates it from Nepal in the east. The greater
Himalaya is the northern boundary of the state and is also the international border
with China (Tibet). Foot-hills in the south are bound by Uttar Pradesh. Starting from
the foot hills in the south, the state extends upto the snow-clad peaks of the Himadri
making the Indo-Tibetan boundary. The region, being situated centrally in the long
sweep of the Himalaya, forms a transitional zone between the per-humid eastern
and the dry to sub-humid western Himalaya. Uttarakhand became the 27th state of
the Republic of India on 9 November 2000. Historically, Uttarakhand is believed to
be the land where Vedas and the Shastras were composed and the great epic, the
Mahabharata, was written.
The average annual rainfall of the state, as recorded is 1,547 mm. With an altitudinal
variation ranging from 200m to more than 8,000m above mean sea level. The
climate of the state is quite harsh particularly in winter when temperature goes
occasionally below freezing point in many of the subdivisions of the state.
The state of Uttarakhand, embodying the Kumaon and Garhwal Himalayas with a
geographical area of about 53,485 sq. km, supports a human population of
84,79,562 (Census 2001) persons. The state, also comprising two administrative
divisions - Garhwal and the Kumaon, consists of 13 districts–Dehradun, Uttarkashi,
Chamoli, Dehradun, Pauti Garhwal, Tehri Garhwal, Rudraprayag, Haridwar (in
Garhwal Division), Almora, Pithoragarh, Nainital, Bageshwar, Champawat and
Udham Singh Nagar (in Kumaon Division). It is further divided into 46 tehsils, 73
towns, and 95 development blocks, 7541 Gram Sabhas, and 671 Nyay Panchayats
and 16826 inhabited villages. The population constitutes 0.83% and 21.40% of the
total population of Indian Republic and Indian Himalayan Region (IHR), respectively.
Within an altitudinal variation ranging from 200 m to more than 8000 m above msl,
the state comprises five lithotectonically and physiographically distinct subdivisions
namely, the Outer Himalaya comprising the Tarai and Bhabhar, Sub-Himalayan belt

2
of the Siwalik, the Lesser Himalaya, the Great Himalaya and the Trans-Himalaya or
Tethys. Human habitation is found up to an altitude of 3500 m above msl; however,
the zone between 1200 - 2000 m, largely falling in the Lesser Himalaya (1500 - 2500
m above msl), is densely populated. The decennial growth rate of the population of
the state for the decade 1991-2001 was 19.20. In this region the human population is
continually increasing and the region is experiencing major difficulties in sustaining
its growing population on its squeezing environmental resources-land availability,
forests and grasslands, water resource, etc. Much of the environmental resource
degradation is governed by mountain specificities, viz., inaccessibility, fragility,
marginality, diversity (heterogeneity), niche (natural suitability) and adaptability
(human adaptation) apart from the growing population. They result in limited external
linkages and replication of external experiences, slow pace of development, intra-
regional imbalances and underutilization of regional potential.
The total area of the state is distributed in altitude zones as given below:
Altitudinal Zone Percentage of area
Below 1000 meter 26.00
1000 - 2000 meter 33.00
2000 - 3000 meter 13.00
Above 3000 meter 28.00
Uttarakhand State 100.00
The population of the state primarily depends on agriculture for livelihood; about 70%
of the population is engaged in agriculture. Out of total reported area, only 14.02% is
under cultivation. More than 55.0% of the cultivated land in the State is rainfed. The
cropping intensity is 160.6%. The landholdings are small and scattered. The average
land holding is around 0.68 ha (that too is divided into many patches) in the hills and
1.77 ha in the plains.

3
The State supports about 4.75 million livestock population out of which about 21.3
lakh are cattle, 11.00 lakh are buffaloes, 3.60 lakh are sheep and 10.97 lakh are
goats. As much as 36.5% of the population of the state lives under poverty line.
Three hill districts, i.e., Chamoli, Tehri Garhwal and Uttarkashi have more than 45%
of their population below poverty line while the other districts have around 30-40% of
population below the poverty line. Another important aspect of poverty distribution is
that poverty is more pronounced amongst some disadvantaged groups as
Scheduled Castes and Scheduled Tribes, where 44% of families are below poverty
line. Inequalities are also evident in other parameters of poverty, such as literacy and
nutrition levels. For example literacy rate is 84.01% for males and 60.26% for
females. In case of urban areas male literacy is 87.21% against a female literacy
rate of 74.78%. It is comparatively lower in the case of rural areas with figures of
82.74% and 55.52% for male and female respectively. Literacy rates in case of
Scheduled Castes people are even further low with 46% and 20% for males and
females respectively.
About 70% of hills population is engaged in agriculture. There is hardly any other
major source of livelihood deriving from the secondary or tertiary sectors. These
sectors are very poorly developed primarily because of inaccessibility and
vulnerability of mountain regions. Although almost 70% of the population is
dependent of the primary sectors, the contribution of this sector of the GDP/NDDP is
only 37.5. As a result, it does not provide sufficient income levels to the people. This
subsistence nature, which leads to low incomes and unstable incomes, which in turn
lead to a sizeable out-migration of male members that leads to only women headed
families behind, and the role of women in the household economy becomes more
important.
Because of the extraction of natural resources by the inhabitants for subsistence
living far beyond their capacity to regenerate, many areas of the state are facing
degradation of natural resources. For example, against the requirement of 18 ha of
forests land including 5-12 ha of well-stocked forests, per ha of cultivated land, the
ratio of forest to agriculture is only 1.33:1 and the ratio of well-stocked forests to
agricultural land is only 0.84:1. Further, soil erosion from the different land use

4
systems in the watersheds has increased many-fold and land productivity has been
declining. The water retention capacity of the fragile watersheds has reduced and
people are now facing acute shortage of water. Grazing intensity is high; each ha.
supports about 7.99 units of livestock against the appropriate 2 livestock units. The
green fodder requirement has been estimated as 259 lakh mt per annum, but
present production is only 52 lakh mt. both from the forests and agriculture.
To reverse this order of deterioration of natural resources and support livelihood
activities for the inhabitants watershed management has been taken up as the
functional and planning tool for conservation of natural resources and sustainable
development by the Government of India through its Common Guidelines for
Watershed Development Projects 2008. The State of Uttarakhand, through its
Watershed Management Directorate (WMD) which has been designated as the State
Level Nodal Agency for the same will be formulating State Level Perspective Plan
(SLPP) for Integrated Watershed Management Project (IWMP) in Uttarakhand for 15
years period (i.e. 2009-24).
Objectives
The main objective of the proposed SLPP is to increase the productivity and income
of the rural inhabitants in the Rainfed Micro-watersheds of the State on priority basis
area through sustainable management of the natural resources. Since agriculture
and related activities are the main source of livelihood for the proposed target area,
land based activities and livestock will play a significant role in achieving the project
objectives. The project will reduce the emphasis on traditional crops and will
increase prominence on high value crop and value addition through grading,
packaging, processing and encouraging organic farming. Further, to ensure the
sustainability of the proposed activities and ensuring cost sharing by participants for
capital investments and also the recurrent costs associated with maintenance of the
assets.
Components
To realize the above objectives following three components and sub components
need to be incorporated in the Integrated Watershed Management Project (IWMP).

5
1. Participatory Watershed Development and Management
Promotion of social mobilization and community driven sustainable and
equitable decision making
Collectively planned Watershed Treatments
2. Enhancing Livelihood Opportunities
Farming Systems Improvement supporting increased employment and
productivity
Value addition and marketing support
Income Generating Activities for Self Help Groups integrated with watershed
Development
3. Institutional Strengthening and promotion of economic/livelihood activities
Capacity building of all tiers of PRIs and local community institutions in
exercising rights and responsibilities
Information, Education and Communication to promote optimization from
amongst different strategies.

6
CHAPTER 2 ABOUT THE STATE
GENERAL STATE PROFILE
Uttarakhand which came into existence on 9th November 2000 is the 27th Indian state
and the 10th in Himalayan region. It lies between 280 43‟ and 310 27‟N Latitude and 770
34‟ and 810 02‟E Longitude. The total geographical area of the state is 53,483 sq. Km., of
which approximately 89% is mountainous. Of the total geographical area, about 19% is
under permanent snow cover, glaciers and steep slopes. The total population of the state
is 8.48 million (Census 2001) of which over 5 million people live in the mountainous parts
of the state. Below Poverty Line population in hills is 44% and in the plains is 19%, thus,
making the State average BPL population 36.5%.
Uttarakhand is a part of the North-Western Himalayas bounded by Nepal in the East
and Himachal Pradesh in the West. The Northern boundary goes upto Tibet/China
whereas southern boundary extends into Indo-Gangetic Plains. The major North Indian
Rivers the Ganga and the Yamuna, originate from this region.
Uttarakhand state covers over 53000 sq.km. of geographical area, it is split into
13 districts within two revenue divisions (MAP-1- Map showing District and Block
Boundaries).
1. Garhwal Revenue Division includes following 7 districts-
i. Dehradun
ii. Tehri
iii. Pauri Garhwal
iv. Uttarkashi
v. Chamoli
vi. Rudra Prayag
vii. Haridwar
2. Kumaon Revenue Division includes 6 districts
i. Nainital

7
ii. Almora
iii. Pithoragarh
iv. Champawat
v. Bageshwar
vi. Udham Singh Nagar
These thirteen districts include 49 Tehsil, 95 Development Blocks and 16,826 revenue
villages within their administrative boundaries. Almost 65% (34,662 sq.km.) of the total
geographical area of the state (53,662 sq.km.) is under forests with 12 Protected Areas
covering an area of 6,479 sq.km (Annexure Table- 2.1)
Population
The district wise population detail as per Census 2001 is given below in Table-2-a
Table-2-a District wise population detail (in '000)
S.No District Male Female Total SC ST
Male Female Total Male Female Total
1 Hardwar 773.173 671.040 1444.213 131.652 111.006 242.658 1.128 0.898 2.026
2 Almora 293.576 336.870 630.446 63.269 65.033 128.302 0.530 0.386 0.916
3 Bageshwar 118.202 131.251 249.453 28.038 27.896 55.934 0.875 0.948 1.823
4 Nainital 400.336 362.576 762.912 60.704 53.972 114.676 1.739 1.653 3.392
5 US Nagar 649.020 585.528 1234.548 65.559 55.747 121.306 44.407 41.920 86.327
6 Pithoragarh 227.592 534.557 462.149 46.613 44.845 91.458 9.081 9.071 18.152
7 Cham-
pawat
110.916 11.545 224.461 16.393 14.715 31.108 0.254 0.193 0.447
8 Dehradun 675.549 603.534 1279.083 74.251 63.213 137.464 44.510 39.566 84.076
9 Uttarkashi 151.599 142.580 294.179 28.082 26.512 54.594 1.205 1.095 2.300
10 Pauri 331.138 365.713 696.851 45.046 45.636 90.682 0.859 0.641 1.500
11 Rudra
prayag
107.425 120.036 227.461 4.868 4.821 9.689 0.006 0.001 0.007
12 Chamoli 183.033 186.165 369.198 29.297 28.258 57.555 4.873 5.212 10.085
13 Tehri 294.842 309.766 604.608 36.710 35.964 72.674 0.260 0.348 0.608
Total 4316.401 4163.161 8479.562 630.482 577.618 1208.100 109.727 101.932 211.659
(Source: Census 2001)

8
The total population of the state is 84,79,562 which live in 16,826 villages. The
population is multi-ethnic belonging to varied cultural origins. Around 36.5% of the
population is Below Poverty Line (BPL).
PHYSIOGRAPHIC ZONES OF UTTARAKHAND Major Physiographic zones
The Uttarakhand Himalayas are divided into the following distinct non-montane and
montane physiographic zones (Map -5 State Map showing different Altitude Zones) as follows:
a. Non-montane
i. Bhabhar: This is a level surface zone at the foothills of the Himalayas 34 km wide
where the Himalayan torrents rush down from the steep slopes and disappear under
boulders and gravels due to the extremely porous soil type of Bhabhar.
ii. Tarai: Situated below the Bhabhar and parallel to it, the Tarai is a marshy and damp
tract (once 80-90 km wide) containing fertile soils with good water retention capacity.
b. Montane
i. Sub-Himalayas: Called Sub-Himalayas because it possesses the least of Himalayan
features. It consists of two zones, the Shivaliks - the youngest of the Himalayan ranges
and the Doon (flat longitudinal structural valleys) to the north of Shivaliks. The Shivaliks
extend in a narrow varying width of 6 to 30 km with altitudes of 300 to 1000 m.
ii. Mid Himalayas : This zone extends in a varying width of 60-90 km in an abrupt rise
in elevation between 1000 m to 3000 m. It contains two types of physiographic sub-units
The Himachal ranges
The Himachal valleys and lake basins.
iii. Greater Himalayas: This zone has a varying width of 40-60 km. The altitude varies
between 3000-7000 m. Except for lower valleys, this zone is perpetually covered with
snow hence called Himadri. The region covers glacial landforms above 3000 m.
9
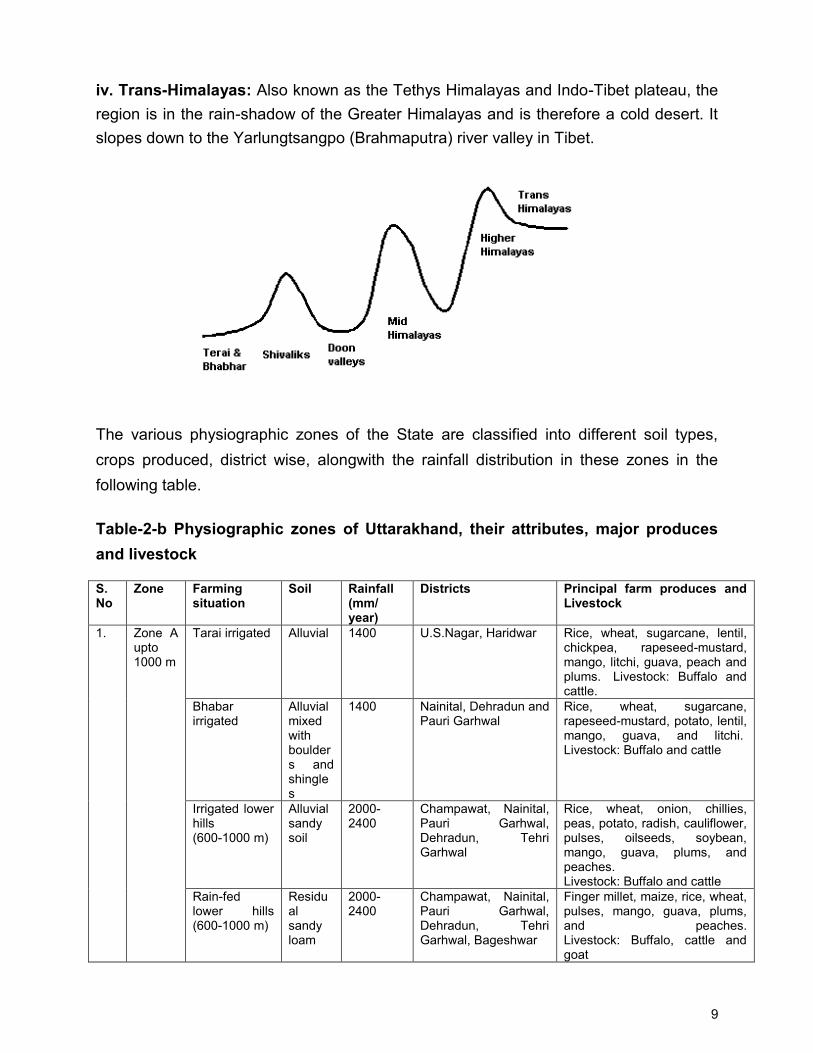
iv. Trans-Himalayas: Also known as the Tethys Himalayas and Indo-Tibet plateau, the
region is in the rain-shadow of the Greater Himalayas and is therefore a cold desert. It
slopes down to the Yarlungtsangpo (Brahmaputra) river valley in Tibet.
The various physiographic zones of the State are classified into different soil types,
crops produced, district wise, alongwith the rainfall distribution in these zones in the
following table.
Table-2-b Physiographic zones of Uttarakhand, their attributes, major produces and livestock
S. No
Zone Farming situation
Soil Rainfall (mm/ year)
Districts Principal farm produces and Livestock
1. Zone A upto 1000 m
Tarai irrigated Alluvial 1400 U.S.Nagar, Haridwar Rice, wheat, sugarcane, lentil, chickpea, rapeseed-mustard, mango, litchi, guava, peach and plums. Livestock: Buffalo and cattle.
Bhabar irrigated
Alluvial mixed with boulders and shingles
1400 Nainital, Dehradun and Pauri Garhwal
Rice, wheat, sugarcane, rapeseed-mustard, potato, lentil, mango, guava, and litchi. Livestock: Buffalo and cattle
Irrigated lower hills (600-1000 m)
Alluvial sandy soil
2000- 2400
Champawat, Nainital, Pauri Garhwal, Dehradun, Tehri Garhwal
Rice, wheat, onion, chillies, peas, potato, radish, cauliflower, pulses, oilseeds, soybean, mango, guava, plums, and peaches. Livestock: Buffalo and cattle
Rain-fed lower hills (600-1000 m)
Residual sandy loam
2000- 2400
Champawat, Nainital, Pauri Garhwal, Dehradun, Tehri Garhwal, Bageshwar
Finger millet, maize, rice, wheat, pulses, mango, guava, plums, and peaches. Livestock: Buffalo, cattle and goat

10
S.No
Zone Farming situation
Soil Rainfall (mm/year)
Districts Principal farm produces and Livestock
2. Zone B 1000-1500m
Mid hills south aspect (1000-1500 m
Sandy loam
1200- 1300
Champawat, Nainital, Almora, Dehradun, Tehri Garhwal, Bageshwar
Rice, finger millet, wheat, potato, tomato, peas, Cole crops, pulses, peach & plums. Livestock: Cattle, sheep & goat
3. Zone C 1500-2400m
High hills (1500-2400m)
Red to dark
1200- 2500
Pithoragarh, Almora, Chamoli, Bageshwar
Amaranth, finger millet, French-beans, Cole crops, potato, peas, peaches, plums, pear, apple, stone fruits. Livestock: Cattle, sheep and goat,
4. Zone D >2400m
Very high hills Red to dark Black clay
1300 Pithoragarh, Chamoli, Uttarkashi
Amaranth, buckwheat, peas, Cole crops, apple and potato. Livestock: Sheep, goat
Agro Climatic Zones
Uttarakhand State is divided into two agro climatic zones only i.e. the hills and plains.
The rainfall distribution in the various districts is given in (Annexure Table 2.3.) as seen
by the land use data of Uttarakhand 64% of the land area of Uttarakhand is under forest
cover and about 14% area is under agriculture.
Exhibit -2-I

11
LAND USE
Like most other hill economies, the people of Uttarakhand practice integrated systems
of farming, forestry, horticulture, livestock and off-farm activities. The recorded forest
area constitutes 64.79% of the total reported area, though the actual cover based on
remote sensing and satellite imagery information is only 44 percent. The net sown area
for the region is a little over 13% of the total reported area, although there are wide
variations in this percentage from district to district. About 33% of the total area in
Uttarakhand is either rocky/ snow covered/ glaciated or otherwise unproductive and
degraded land. About 12% of agricultural land has got irrigation and about 90% land is
used for growing cereals, fodder (berseem) and some vegetables.
The extent of wasteland in the State district wise has been given in (Annexure Table
2.4.) Nearly 30% of the geographical area of the State has been classified into various
types of degraded land. The status and extent of soil erosion has been given in
(Annexure Table 2.5.) Majority i.e. 53% of the area falls in the category of severe and
very severe soil erosion.
NATURAL RESOURCE BASE OF UTTARAKHAND
FOREST COVER
As per the State of Forest Report 2005 the recorded forest area of the state is
34662 sq.km, which constitute 64.79% of its geographical area. By legal status reserve
forest constitute 71.08% protected forest 28.51% and unclassified forest 0.41% of the
total forest area. Major forest types occurring in the state are Tropical Moist Deciduous,
Tropical Dry Deciduous, Sub Tropical Pine, Himalayan Moist Temperate, Sub Alpine
and Alpine Forests. Forests are largely distributed throughout the state with conifers
and Sal being major forest formation (MAP-2- Forest Cover Map of the State).

12
WATER REGIME
The predominantly hilly State of Uttarakhand has a varied hydrogeological setup and
can be divided broadly into two distinct hydrogeological regimes viz. the Gangetic
alluvial plain and the Himalayan mountain belt. The former is covered with a vast
expanse of alluvium and unconsolidated sedimentary material of varying size fractions
(ranging from boulder to clay) and is a promising zone for ground water development.
The latter zone, being predominantly hilly, offers much less potential for large scale
development of ground water. Ground water in the hilly region occurs mostly in
fissures/fractures and emerges as springs. The springs are amenable to small scale
development of ground water resources in the State. The yield of tube wells in Shiwalik
formation ranges from 50.4 m3/hr to 79.2 m3/hr, in Bhabar formations yield is upto 332.4
m3/hr. In Tarai belt yield of tubewell ranges 36m3/hr to 144 m3/hr and in Indo-Gangetic
plains yield varies from 90 m3/hr to 198 m3/hr.
Major River Basins and Sub Basins
The main drainage system of Uttarakhand have been grouped into following six
catchments (MAP-4-State Map showing major Rivers and Drainage Systems):
Yamuna Catchment - The Yamuna river originates from the base of Bandarpunch
peak. It has carved a deep V- shaped gorge. The Yamuna cuts across the Nag Tibba
range and Mussoorie range near a place called Yamuna bridge. The rivers Tons, Pabar
and Aglar are its important tributaries. It passes through the Doon valley on its Western
boundary.
Bhagirathi Catchment – This is one of the two rivers which join to form the river
Ganga. It originates from the snout of the Gangotri glacier at Gaumukh which is at the
base of Chaukhamba peak. The Bhagirathi river has cut a deep gorge across the
granitic rocks of the higher Himalayas of Garhwal. Its main tributaries are the river
Janhavi and the Bhilangana.
Alaknanada Catchment - This river joins the river Bhagirathi at Devprayag to form the
river Ganga. It originates from the eastern slopes of Chaukhamba – from the Bhagirathi

13
kharak and Satopanth glaciers. The river flows along the Badrinath temple. Its main
tributaries are the Khiraonganga, Pindar Dhauliganga, Birahi, Nandakini, Mandakini etc.
It has formed a broad valley at Srinagar (Garhwal).
Mandakini Catchment - It comes out from the Mandakini glacier near Kedarnath. It
cuts through a gorge of glacial debris. The river has formed road terraces at
Augustmuni and Tilwara. At Tilwara it is joined by the river Lastar Gad. The river
Mandakini joins the river Alaknanda at Rudraprayag.
Pindar Catchment- The river Pindar originates from the Pindari Glacier which is
located between Nanda Devi and Nanda kot peaks. Sundardhunga river joins the
Pindar near Dhakuri. The Pindar joins the river Alaknanda near Karanprayag.
Kali Catchment – The river Kali forms the boundary between Kumaon and Nepal. The
Towns of Champawat and Pithoragarh are situated on the back of the Kali river. Its
important tributaries are Darma and Saryu rivers.
The Land Survey Directorate (LSD) has divided the Uttaranchal into 8 catchments, and
then into 26 watersheds, then into 110 SWS and finally into 1110 MWS and shown in
Map. Haridwar district is yet to be delineated by the Land Survey Directorate but
essentially an area of 2.33 lac ha. needs to be taken up for the watershed works. The
number of SWS and MWS falling in each district of the state is given in Table 2.3 below:
Table 2-c Details of Catchments, Watersheds, Sub watersheds and MWS in Uttarakhand
S.No. Catchment Watershed No. of Sub-
watersheds No. of MWS
Total Area (ha.)
1 Alaknanda Alaknanda 7 86 6,69,643
Lower Alaknanda 5 32 95,475
Mandakini 5 33 1,68,049
Pindar 5 56 1,87,800
Total 22 207 11,20,967 2 Bhagirathi Bhagirathi 14 120 5,77,523
Bhilangana 4 39 1,49,660
Total 18 159 7,27,183

14
Table 2-c Details of Catchments, Watersheds, Sub watersheds and MWS in Uttarakhand
S.No. Catchment Watershed No. of Sub-
watersheds No. of MWS
Total Area (ha.)
3 Ganga -A Song 5 56 1,76,597
4 Ganga- B Hiyunl/mal 6 28 1,00,683
Nayar 6 59 2,08,612
Total 12 87 3,09,295
5 Kali Kali 5 82 5,49,682
Lower Kali 3 34 1,17,760
Saryu 8 123 4,45,494
Total 16 239 11,12,936 6 Kosi Bhakra 3 9 1,64,746
Gola 3 20 1,65,988
Kosi 4 71 2,10,075
Nandhaur Left 3 17 1,23,618
Total 13 117 6,64,427 7 Ramganga Dhela Nadi 1 2 45,393
Khoh 2 8 48,723
Ramganga 8 75 3,33,926
Total 11 85 4,28,042 8 Yamuna Aglar 2 7 25,698
Asan 3 18 82,088
Lower Tons 3 19 45,265
Tons 4 36 1,67,926
Yamuna 7 80 2,29,185
Total 19 160 5,50,162 Grand Total 116 1110 50,89,610 + Haridwar 2,33,506
Total 53,20,291
Table 2-d District wise total number of Micro-watersheds and their area in ha.
S.No. District No. of MWS Area (ha)
1 Pauri Garhwal 129 5,38,775
2 Dehradun 95 3,05,043
3 Chamoli 138 8,22,225
4 Uttarkashi 164 7,86,921

15
5 Tehri 134 4,14,588
6 Rudraprayag 40 1,82,223
7 Almora 100 3,18,324
8 Bageshwar 59 2,14,590
9 Pithoragarh 128 7,51,958
10 Champawat 41 1,45,712
11 Nainital 74 4,28,646
12 Udham Singh Nagar 8 1,77,780
13 Haridwar - 2,33,506
Total 1,110 53,20,291
Soil
Soil is one of the most important natural resource of Uttarakhand. This natural resource
is depleting gradually, day by day, as soil erosion in the area is increasing with the
increase in deforestation for different developmental activities.
Soil scientists as well as Metrological experts have grouped different types of soil of
Uttarakhand in to the following soil zones based on different climatic zones.
Table 2-e - Different Soil Types distribution in Uttarakhand
Sl.No. Soil zones Altitude (m) Climatic Zones Types of soil
I Shiwalik and Doon
areas
300-900 Moist -Dry Jalod soil
II Lower Himalayas 900-1800 Dry-Temperate Grey forests soil
III Upper Himalayas 1800-3000 Moist-
Temperate
Grey deciduous
soil
IV Alpine areas 3000 & above Moist-
Temperate
Himani soil
In another classification, depending upon the land use pattern and agriculture pattern,
soils of Uttarakhand has been divided into following categories.

16
i. Soil of Tarai and Bhabar region
ii. Grey Forests Soil
iii. Dark Grey Soil
iv. Acidic/Alkaline Forests Soil
v. Hilly Grey Soil
vi. Himani Soil
vii. Soil covered with snow
DEVELOPMENT INDICATORS OF THE STATE
The Development indicators of the State have been given in (Annexure Table 2.6). The
poverty ratio of the State is 31.8% which much higher than the national average of
21.8%. The literacy rate of the State is 71.6% which is considerably higher than the
national average of 64.8%. The Per Capita income of the State is also considerably
lower than the national average.
OPERATIONAL AND LIVELIHOOD STATUS
In Uttarakhand main workers and marginal workers percentage is higher than that of
Indian average of 32.96% and 63.82% respectively. Non workers are nearly 5 percent
lower than the Indian average which is 3.2%.
Workers comparison with Indian Average Exhibit -2-II
Source: Census of India 2001(Provisional Population Totals), Uttaranchal, Tata statistical outline of India, 2000-2001,Uttarakhand Update, Joshi A. et. al.
36.36 32.96
5.56 3.2
58.0863.82
0
10
20
30
40
50
60
70
Uttarakhand India
Break-up of workers as %to total population
Main
Marginal
Non-Workers

17
IRRIGATION STATUS
As mentioned earlier net irrigated area in the State is less than 50% of the total
cultivated area. Rainfed area constituted 55% of the total cultivated area. The hill
districts like Chamoli, Almora, Champawat, Pithoragarh and Pauri Garhwal have more
than 90% area under rainfed cultivation. The districts of Udhamsingh Nagar and
Haridwar have 2% and 11% area respectively under rainfed cultivation (Annexure
Table 2.13). As Uttarakhand is predominately a hill state open wells and tanks are
present only in the plain regions of Dehradun, Haridwar, Pauri Garhwal and
Udhamsingh Nagar Districts. Canal irrigation is present in the whole of the state but hill
districts like Chamoli and Tehri Garhwal have less than 1000 ha. of area under canal
irrigation. Tube / Borewells are mainly situated in Haridwar and Udhamsingh Nagar
Districts. Irrigation in the hill districts is mainly through pipelines laid from the water
sources present in the hills (Annexure Table 2.14).
Uttarakhand being a hill state groundwater status of only the plain areas has been
studied by the State Ground Water Board. They have listed Bhagwanpur block of
Haridwar District as an over exploited block and Bahadrabad, Narsain and Roorkee
blocks in Haridwar Districts as semi critical (Annexure Table 2.15 a.).
DROUGHT AND FLOODS
Uttarakhand is a disaster prone state. Landslides, forest fires, cloudbursts and flash-
floods are seasonal in nature and these strikes at a certain period of the year with high
frequency. Earthquakes are the most devastating in the mountains and are
unpredictable. So far, in the recent years (1990 onwards) Uttarakhand has experienced
two major earthquakes (magnitude > 6 ) in Uttarkashi (1991) and Chamoli (1999) and a
series of landslides/cloud burst such as Malpa (1998), Okhimath (1998), Fata (2001),
Gona (2001), KhetGaon (2002), Budhakedar (2002), Bhatwari(2002), Uttarkashi (2003),
Amparav (2004), Lambagar (2004), Govindghat(2005), Agastyamuni(2005) and
Ramolsari(2005).

18
Apart from frequent cloudbursts in hilly regions of the State which cause a great deal of
damage to life and property in hills. There are frequent droughts in the State as main
stays of agriculture in the hills are mainly rains. Each year many districts face drought
like conditions which result in failure of the crops.
When drought like conditions prevails most of the remotely located springs in the hills
start drying up or the discharge is reduced to such a level that they are unable to fulfill
the basic requirement of the residents. There is also a drastic reduction in the flow of
major rivers in the State. In the Himalayan region, „naula‟ (12 m deep well, mostly lined
to get water from seepage), „dhara‟ (spout springs) and „hand pumps‟ (at few places)
are the main sources of water for irrigation and household consumption, because rural
water supply (if it is available) is either irregular or unwholesome. Except the spout
spring, which delivers water at the ground surface naturally, „naula‟ and „hand pump‟ are
artificial methods to extract water from the sloppy aquifer. Perennial or non-perennial
nature of these water sources depends upon the aerial coverage of the discharging
aquifer. In turn, these aquifers are recharged by rain or by snow-melt water, which gets
infiltrated through the land surface and percolates to join the aquifers. The natural rate
of groundwater recharge is reckoned to be 31% of the total annual rainfall. Therefore,
soil characteristics and land use play a major role in recharging sloppy aquifers.
Deforestation, grazing and trampling by livestock, erosion of top fertile soil, forest fires
and development activities (e.g. road-widening, mining, building construction, etc.)
cause reduction in the infiltration rate and sponge action of the land and thus the failure
of the watershed, which results in unchecked flow of water during the monsoon to cause
a sudden swelling of streams and rivers, so that there are floods in the foothills and
even in the plains, and droughts in the villages located on the slope of the mountains.
Regarding nature‟s role, there is about 30–40% decline in average rainfall over the past
50 years. Under such circumstances, rainwater harvesting and its storage is the only
option left with us.

19
AGRICULTURAL GROWTH AND DEVELOPMENT
Uttarakhand is largely rainfed, irrigation facilities are minimal, land holdings are small
and fragmented, with a predominance of wastelands. Crop yields in Uttarakhand are
low and there is a lack of effective marketing infrastructure including all post-harvest
activities such as collection of the farm produce from the fields, transportation to
warehouse, storage, processing, packaging, access to potential markets, information
about prices, and finally marketing the produce at a price which is most remunerative to
the farmer. In addition, there is a lack of availability and accessibility to horticultural
inputs and the knowledge/information about suitable and remunerative crops and
scientific management practices is scanty. Limited credit facility to farmers, remains
another big constraint.
Uttarakhand has just 14% of the total land under cultivation and about 65% of
population depends on agriculture for their livelihood. The region also suffers on
account of heavy soil erosion and significantly lower yields as compared to the national
average. Since agricultural income cannot sustain the families for more than four
months in a year, each family has almost one or two persons working outside the state
that remits regular money to sustain the family for the rest of the year. In addition, the
region did not receive the attention it deserved till the inception of the state (2000-2001).
Under these present circumstances, the major challenges before the state is to achieve
economic prosperity without losing out on its biodiversity. In this context the state has
made a conscious choice of pursuing the path of organic agriculture, which not only
fetches a premium price for the farmer with minimum external inputs but is also
environmentally benign. Because of a variety of agro-climatic niches that exists within
the region, the state has tremendous potential to emerge as a regular supplier of seeds
to other states in the country. Taking advantage of relatively higher literacy rates,
coupled with new initiatives in ICT (Information Communication Technology),
Uttarakhand is poised to become a knowledge state in agriculture. The agricultural
portal being developed by the state will have 2700 kiosks and will provide a one „stop

20
shop‟ for all farmers. In addition, GIS (Geographic Information Systems) based data
bank is being developed for monitoring of watershed development works. There is also
a need of cultivating horticultural crops particularly medicinal and aromatic plants and
other high value species while promoting biotech industry for seed production.
Breakdown of the state‟s latest available aggregate GDP shows clear dominance of the
services sector. Given the terrain of the state and favourable climatic conditions,
agriculture continues to be the major source of income for more than three-fourths of
the state‟s population. Agriculture and allied activities with an average share of about
37.3 per cent during 1993-94 to 2001-02, is a significant contributor to the state
domestic product as against the national average of 27.8 per cent during the period
considered. The State hosts all major climatic zones thus giving it an edge in developing
activities based on floriculture, fruits and nuts, vegetables and vegetable seeds.
Given that Uttaranchal has significant area under forests, forestry and logging is a key
component of the agricultural GDP (7.1 per cent of the agriculture GDP) during the
period. The state outperformed the national aggregates of the yield of some of the major
crops. During 2001-02, Uttaranchal posted significantly high yield of major coarse
cereals
Agricultural land use Statistics Exhibit-2-III

21
As per (Annexure Table 2.8) the cropping intensity of the State is 161% of the net
sown area less than 50% area is irrigated, rest of the cultivated area is rainfed. Nearly
50% of the area of arable area of the State is held by the marginal and small farmers
i.e., farmers having less than 2 ha. of area for cultivation (Annexure Table 2.9).
In the Kharif Season nearly 68% of the area is rainfed of the total area major area is
under cereal and pulse productions. As area under cereal production is the maximum of
which 66% is rainfed the yield in rainfed area is 14.7 qt. per ha. which is very less
compared to irrigated areas where it is 21.4 qt. per ha. The overall yield from all the
major crop in the rainfed area is 13.93 qt. per ha. compared to the yield in irrigated area
which 21 qt. per ha (Annexure Table 2.10). In the Rabi season again majority of the
area is under cereal cultivation of which nearly 60% of the area is rainfed. The overall
productivity in rainfed areas is just 10.67 qtl. per ha. compared to yield in rainfed area
which is 30.94qtl. per ha. (Annexure Table 2.11).
In terms of major horticultural crop of the total approximately 2.72 lac ha. area under
production, nearly 70.15% area is rainfed. Total fruit production in the State is rainfed
and vegetable production is irrigated. The yield of fruits which are totally rainfed is 53.26
qtl. per ha. and vegetable production is 131.28 qtl. per ha. (Annexure Table 2.12).
INPUTS IN AGRICULTURE
When hill districts of the state are examined more closely, agriculture emerges as the
main activity of all the hill districts. Since most of the land is covered with forest there is
very little scope for diversification. However, some districts have already diversified into
alternative farm-based activities like fruits and vegetables, aromatic and medicinal
plantations and some have also tried to extract the potential from animal husbandry
activities like dairy and poultry. Forest trees also offer an alternative source of livelihood.
The cropping pattern of the hill districts is mainly based on traditional agriculture. In
almost all the hill districts, rice, wheat, mandwa, and sanwa remain the main crops with
the maximum area under cultivation. Production is mainly for self consumption and

22
distribution in village markets; there is not much statistical evidence of development of
mandis and markets to dispose off any surpluses.
As expected, the yields are not very high in Uttarakhand as a whole and also the
productivity of the hill districts is generally lower than the state average. This is because
of the small and fragmented land holdings, low use of quality seeds, limited irrigation
facilities, lack of extension and low farm mechanization. Due to the small size of the
land holdings, farm mechanization was not technically feasible. On an average, about
two-third of the land holdings are marginal in size with an average land of less than 0.66
ha in all the districts.
The majority of Uttarakhand agriculture is rainfed and there is not much surplus for the
market. As a result most of the able-bodied men have migrated to other places in
search of employment. Only women are left in the hills and they have started looking
after the farms. The challenge is to change this structure and create employment
through agriculture. This could be done by diversifying the agricultural pattern so as to
create alternative income and better living standards. The alternative areas of
diversification are towards horticulture crops, spices and condiments, tea plantations,
and herbal and medicinal plants. Development of organic farming is another option for
agriculture-based hill regions. Development of animal husbandry and forest resources
are already a part of hill livelihood, which has limitations on its further expansion.
Horticulture: In addition to staple foods, the hill districts of Uttarakhand have diversified
into the production of condiments and spices like chillies, ginger, and garlic. The area
under these is as high as 2275 ha in Almora, 1098 ha in Champawat and 962 ha in
Pithoragarh. Some areas in Pauri grow sugarcane also. The area under fruit cultivation
is quite high in Uttarkashi and, in almost all the hill regions, substantial areas are under
vegetable cultivation. There is great potential for diversification into oilseeds like
sesamum, rapeseed, mustard and soybean that will contribute towards increasing
income in the hill regions.

23
Herbal and Medicinal plants : Uttarakhand has observed an increase in the area under
cultivation of aromatic and medicinal plants. This positive attitude of farmers towards
aromatic plant cultivation is because of the high returns from this crop. Intercropping of
aromatic plants with food grains can also help diversify the income basket for small and
marginal farmers. Farmers can derive huge benefits by diversifying into the cultivation of
aromatic plants. These benefits have been generated with the help of the Herbal
Research and Development Institute (HRDI) that works on aromatic plants used in
cosmetics, soaps, and perfumes. Although the productivity of land in the hills is very
low, there is a huge demand and ready market for aromatic plants. The HRDI has
identified areas in selected hill regions where these crops can be grown and adopted a
clustered approach that includes production and processing.
There is huge commercial value in the oils and essences extracted from aromatic and
medicinal plants. Aromatic plants like lemon grass, citronella, palmarosa, chamomilla,
tulsi, geranium, naramotha, Japanese mint, khuas, and marigold are used extensively in
the cosmetics industry. The main problems are the high cost of processing and the
difficulty of getting buyers to the processing units. Oil extracted from plants is not linked
with the pharmaceutical industry because of low production. Since limited quantities of
aromatic and medicinal plants are produced, buyers are not able to establish linkages.
There is scope for medicinal plants and medicinal trees like tejpatta, amla, harad, and
bahera are being planted. There is high demand for ritha but the forest department has
not taken any initiatives. For medicinal plants, support prices by the government are
required because of long-term plantation. To increase production and productivity it is
important to establish the cluster approach and low-cost processing. Forest cooperation
has made 3-4 mandis where auctions take place. No government initiative has been
taken in the case of aromatic plants. There is a great deal of potential for the
development of these crops in the hill regions without much heavy investment. The
HRDI has tried to install processing units among the clusters of farmers close to their
farms. The institute also has storage facilities where farmers can store their oil extracts
if they are not sold at an appropriate price in the market. There is a need to take
appropriate measures for improving productivity and production of herbal and medicinal

24
plants and their trade in the state. Medicinal and aromatic plants can be a strong option
for diversification but linkages with the market should be developed.
Organic farming: Yield levels can be effectively raised in a stable and sustainable
manner only by adopting organic farming methods, since extensive use of chemical
fertilizers ultimately leads to soil deterioration. As per statistics, the use of fertilizers in
the hill districts is very low. In Uttarakhand around 10,000 ha land is under organic
farming, covering over 15,000 farmers and 45 crops. The key objective of diversifying
towards organic farming is to improve crop productivity, soil health and the price of the
output, and thus the income of the farmers. Organic products have a parallel market
which, if captured in a strategic manner, can lead to the rapid development of these hill
districts.
The hill regions are disconnected from the plains due to a poor road network and, thus,
fertilizers is limited and expensive. This has increased the number of organic activities
and farmers growing organic produce. Uttarakhand is the first state of the country to be
declared an organic state. Due to this, a great need was felt to constitute an
organization to promote and coordinate dispersed organic activities and efforts for
organic farming in the state. The Uttarakhand Organic Commodity Board (UOCB) came
into existence. The role of the Board is to promote organic farming in the state and to
provide options in diversifying towards organic farming. Training in organic food
processing and value addition has been imparted to the producer groups, but lack of
infrastructural facilities is a major constraint. It is necessary to integrate the farmers to
generate surplus for exports, but the physical geography of the hill villages makes this
difficult. Another issue that emerges in marketing and making agriculture a commercial
venture is branding the products so that they can be sold globally.
STATUS OF FORESTS
The recorded forest area of the State is 34,662 km2, which constitutes 64.79% of its
geographic area. By legal status, Reserved Forests Constitute, 71.08% Protected
Forest 28.51% and unclassed Forests 0.41% of the total area.

25
Major forest types occurring in the State are Tropical Moist Deciduous, Tropical Dry
Deciduous, Sub-Tropical Pine, Himalayan Moist temperate, Himalayan Dry Temperate,
Sub Alpine and Alpine Forest. Forests are largely distributed throughout the State with
conifers and sal being the major forest formations. The State has 6 National Parks and
an equal number of Wildlife Sanctuaries covering an area of 0.71 million ha, which
constitutes 13.35% of its geographic area. The famous Corbett Tiger Reserve is located
in the State covering an area of 0.13 million ha. Nanda Devi Biosphere Reserve, having
an area of 0.59 million ha. is also located in this State.
The Forest Cover of the State, based on satellite data of October – December 2004, is
24,442 sq.km, which is 45.70% of the geographic area. Very dense forest is 4,002
sq.km. moderately dense forest 14,396 sq.km. and open forest 6,044 sq.km.
Van Panchayats in Uttaranchal were born out of conflicts and compromises that
followed the settlements and reservations of forests in the hills at turn of the last
century. The first government approved Van Panchayat was thus formed in 1921.
According to recent estimates, there are 6,069 Van Panchayats managing 405,426
hectares of forests (13.63% of total forest area) in the state. Most of these have been
carved out of civil (protected) forests under the jurisdiction of the Revenue Department.
The area under each Van Panchayat ranges from a fraction of a hectare up to over
2,000 hectares.
It may be mentioned here that Community forests managed in accordance with Van
Panchayat Act is a hybrid of state ownership and community responsibility. In its efforts
to manage and control community forest use Forest committees are guided by Revenue
Department rules and by the technical advice of the Forest Department. In contrast to
civil forests, community forests or Panchayati forests as they are popularly known are
not „open‟ forests. Access and use of forests is guided by rules elaborately designed
and implemented by the communities. Infact four identifiable working rules exist relating
to Use, Monitor, Sanctions and Arbitration. Though only notionally or nominally owned
by the communities, community forests are in a very real sense common property with
an identifiable user group, have finite subtractive benefits and are susceptible to

26
degradation when used beyond a sustainable limit. However what is more important is
that the local users consider them as their collective property and in real sense they are
not actually divisible. These forests though are not completely immune from misuse and
the condition of the forests varies from poor to very good.
Despite being an excellent example of state-people partnership which has been
relatively successful in managing forest resources in the region, the institutions are
facing challenges from unrealistic and target driven policies which would affect its
democratic functioning. There is a need to replicate such institutions in other areas
rather than interfering with the existing ones. Moreover Non-governmental
Organizations need to play more active role in keeping these institutions alive by
bringing the communities to the centre stage of decision making. In order to strengthen
such community oriented institutions, one needs to identify such similar institutions and
undertake comparative studies on the same so that anomalies if any can be removed.
Forests play an important role in the economy of the state. Timber and fuel form the
major produce group, while bamboo, drugs, grasses, gum and resins etc., the minor
produce group. Forests are the major source of raw materials for industries, buildings,
railways and other tertiary sectors. There is an increased pressure on forests for fuel,
fodder and timber requirements that is having an effect on the desired level of forest
density and productivity of forests. The destruction and degradation of forests are taking
a heavy toll on soil and water resources, making the land less productive and leading to
impoverishment of the rural population.
Potential for forestry and waste land development : The State has good forest cover
which needs to be protected. The State has also large scale wood based industries in
the form of paper mills, Plywood units, Katha factories and rosin factories and small
scale units mainly of saw milling, carpentry, packing cases, sports goods, furniture,
carving, toys, etc. with large scale building activities both in private and public sector,
residential and other purpose, consumption of wood in solid and processed form has
gone up. This has resulted in increased demand of forest produce specially timber and
will certainly put additional pressure on the existing forests. No systematic wood

27
balance study has been conducted in the State, but considering the demand of various
forest produce in the State, a systematic planning needs to be attempted.
In order to bridge the gap between demand and supply and ensure regular supply of
raw material to the wood based industries, other agencies and farmers also have to play
important roles in the afforestation/ plantation program. This also provides opportunities
for the farmers to go for farm forestry and agroforestry in the State.
The choice of species has to be based on agro- climatic conditions, objectives and
market demand in the area. Accordingly, Poplar, Eucalyptus, Bamboo, Jatropha, Khair,
Chyura and Sisal have been recommended for plantation in these districts. State
Government is giving special emphasis on bamboos and Jatropha plantation and
proposes to cover 2 lakh ha area under each of these species in the State.
In Tarai areas and in foot hills, there is a vast scope for agro- forestry programs where
fast growing species like Poplar, Eucalyptus, Bamboo etc. can be taken up to meet the
increasing demand of industries and the local people. Planting of Sisal in hilly areas
also holds promise.
The areas which are covered under Poplar plantation are Haridwar, Dehradun, Nainital
and Udhamsingh Nagar. These districts are considered best for plantation of Poplar in
combination with field crops and farmers have adopted this species on their farm lands.
It is estimated that nearly 1000 ha land is under poplar plantation on farm lands under
agro forestry system in above mentioned 4 districts.
Resin : Resin obtained from the chirpine trees is an important non wood forest produce.
Resin and turpentine are used in the paper, soap and paint industry. Resin extraction
is an important livelihood opportunity for the rural population at present in Uttarakhand.
There are 116 resin based industries in the State. Resin extraction was experimentally
started in the year 1916 and from the year 1920 regular extractions started.
Till the year 1993 resin extraction was done through „French cup and lip technique‟.
Though, the Resin extraction per tree varied between 1.5 to 1.75 kg. it lead to extensive

28
damage of the chir tree. From the year 1994 resin extraction is being done through the
„Rill Technique‟ through this technique the damage of the trees is limited. Extraction is
done from the month of October to March. Resin so collected is then auctioned to
various industries. In the year 2006-07 Rs. 4632.87 lakh worth resin was auctioned by
the State.
River Bed Material : In the Bhabar areas of the State a lot of boulders and sand
collects in the rivers after the rains. It is essential that for silvicultural purposes and to
save the nearby habitations these boulders and sand be removed so that the river
course is not diverted. Thus, collection of this river bed material is an very important
livelihood option for the locals of the area. The State Forest Department takes due
permission from the Govt. of India for the removal of RBM. The amount of RBM to be
removed every year from each river is calculated on technical basis and these areas are
then leased out to the Forest Corporation for removal. The Corporation in turn engages
local people for removal of RBM. This RBM is then taken to various stone crusher units
for grading and sorting purposes. In the year 2006-07 the Forest Corporation earned
revenue to the tune of Rs. 4531 lakhs through RBM removal. The main rivers in which
RBM removal is done are Gaula, Sharda, Kosi, Dabka, Ganga, Yamuna and Song.
Bamboo: As per the national scenario, Uttarakhand comes under bamboo deficit area.
There are 7 major species of bamboos viz. Dendrocalamus strictus, D. hamitonii,
Bambusa nutans, Arundinaria faccata, Themonocalamus spathiflora, Himalecalmus
falconeri, Sinarundunaria jaunserensis. Forest land under Bamboo is 139409 ha. There
is no survey of bamboos available on private lands. Major bamboos markets in
Uttarakhand are Haldwani, Dehradun, Ramnagar, Khatima and Jwalapur.
Uttarakhand Bamboo and Fiber Development Board: In order to promote bamboos
in Uttarakhand, the State Government has set up Bamboos and Fiber Development
Board. The Board has identified three naturally occurring Bamboos viz. Bambusa
nutans, D. Strictus & D. hamiltonii for promotion in the State. Recently, the State
Government has signed a MoU with a Thailand based company which would invest a
sum of Rs. 211 crores for bamboo plantation activities in Van Panchayats of

29
Uttarakhand. The Company targets a total of 1.5 lakh ha for bamboo plantation during
2004-14.
More than 20 bambusetums have been established all over Uttarakhand at forest
division level representing various bamboo species. Centre of Excellence for Bamboo
has been established at Lacchiwala and Centre of Excellence for Bamboo and Fiber
has been established at Paniyali, Kotdwar. A Government order from the Principal Chief
Conservator of Forest, Forest Department has been issued to make felling and transit
rule for bamboos easy by lifting the ban on felling and transit of bamboos outside the
forest area.
Uttarakhand Bamboo and Fibre Development Board has set up two Ajeevika Vatika‟s at
Peepalkoti, Chamoli and Kapkot, Bageshwar. The key components in these Vatika are
bamboo and fiber nursery, demonstration plantation, bambusetum, treatment and
processing of bamboos, training facilities for artisan‟s production and marketing of
bamboo products. The board has established a High tech Nursery in Haridwar district
with a capacity of 2.0 lakh seedlings.
The Board is also conducting trainings on Ringal Design Prototype Development in
Ringal handicrafts, Bamboo furniture making, skill upgradation and design
diversification trainings, Bamboo housing demonstration and training, entrepreneur
development etc., under National Bamboo mission launched by govt. of India.
Jatropha plantation : The State of Uttarakhand has potential for promoting Jatropha
especially in the low elevation areas. For this purpose state government has set up
Uttarakhand Biofuel board. The board plans to raise Jatropha plantation on Van
Panchayat lands in different forest divisions by selecting intended beneficiaries from
Van Panchayat members. The plantation will be raised mainly on wasteland/ degraded
Van Panchayat lands. The State Government has planned to cover around 2.0 lakh ha
area under Jatropha plantation in two phases through the Board. However, in the first
phase, 1.0 lakh ha would be covered in four years i.e. 25000 ha each year for 2005-06,
2006-07, 2007-08 and 2008-09. The Board has assured buyback arrangement of
30
Jatropha seeds through Forest Development Corporation which in turn will supply seeds
to Uttarakhand Biofuel Company for processing.
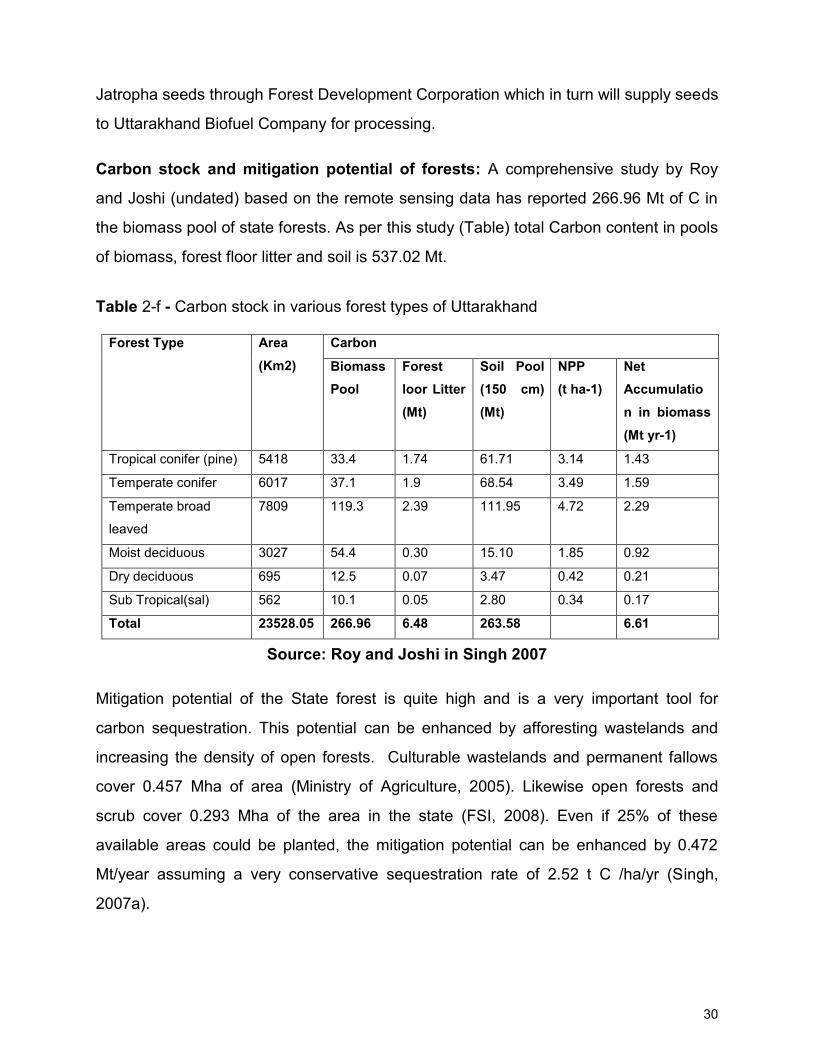
Carbon stock and mitigation potential of forests: A comprehensive study by Roy
and Joshi (undated) based on the remote sensing data has reported 266.96 Mt of C in
the biomass pool of state forests. As per this study (Table) total Carbon content in pools
of biomass, forest floor litter and soil is 537.02 Mt.
Table 2-f - Carbon stock in various forest types of Uttarakhand
Forest Type Area
(Km2)
Carbon
Biomass Pool
Forest loor Litter
(Mt)
Soil Pool (150 cm)
(Mt)
NPP (t ha-1)
Net Accumulatio
n in biomass
(Mt yr-1)
Tropical conifer (pine) 5418 33.4 1.74 61.71 3.14 1.43
Temperate conifer 6017 37.1 1.9 68.54 3.49 1.59
Temperate broad
leaved
7809 119.3 2.39 111.95 4.72 2.29
Moist deciduous 3027 54.4 0.30 15.10 1.85 0.92
Dry deciduous 695 12.5 0.07 3.47 0.42 0.21
Sub Tropical(sal) 562 10.1 0.05 2.80 0.34 0.17
Total 23528.05 266.96 6.48 263.58 6.61
Source: Roy and Joshi in Singh 2007
Mitigation potential of the State forest is quite high and is a very important tool for
carbon sequestration. This potential can be enhanced by afforesting wastelands and
increasing the density of open forests. Culturable wastelands and permanent fallows
cover 0.457 Mha of area (Ministry of Agriculture, 2005). Likewise open forests and
scrub cover 0.293 Mha of the area in the state (FSI, 2008). Even if 25% of these
available areas could be planted, the mitigation potential can be enhanced by 0.472
Mt/year assuming a very conservative sequestration rate of 2.52 t C /ha/yr (Singh,
2007a).

31
Payment for ecosystem services: The Himalayan region has 69% of India‟s
freshwater resources. The region houses high concentration of poor population and the
interactions between the people and the water-related ecosystem are more evident here
than anywhere, also they are more affected due to high rainfall and sudden climatic
variations. The water resources of the region provide great environmental and
ecosystem services through fish production, biomass and wildlife, and transport of fertile
soils carried by floodwaters. The high discharge of rivers and the steep terrain provide
high potential for power generation. On the flip side, the Himalayan region is riddled with
political conflicts over sharing of water resources between states and nations. With the
rising inter and intra state water conflicts in the country, smooth inter-sectoral
management and allocation of water have become a prime need. The economic value
of the services being provided by Himalayan forests is being increasingly recognized.
Water availability in downstream states, for example, critically depends on forest cover
in the upstream Himalayan states. Several of these states have demanded that they be
compensated for maintaining high forest cover at the cost of (foregone) development
options. Internationally as well, the notion of 'payments for environmental services' is
receiving wide attention. It is being argued that services that were previously not valued
in an economic sense and hence were kept outside the purview of market/policy
mechanisms need to be explicitly valued so that upstream areas these can be paid for.
The payment system could either operate through the market (as a voluntary transfer
between a two or more well-defined groups) or through a politically negotiated inter-
state (or inter-region) fiscal arrangement.
In the above context, the Report of Task Force on the Mountain Ecosystems under the
Eleventh Five Year Plan (Planning Commission 2006a) explicitly recognizes „the need
for clearer understanding of resource flows to and from mountain areas‟. The Report
also contends that this will lead to increased income to mountain communities and a
fairer distribution of earnings from natural resource exploitation and services provided
(Planning Commission 2006a). The Uttarakhand government had submitted a proposal
to the 12th Finance Commission in the context of valuation of water resources and has
asked for a financial award for the ecosystem services rendered by the state to the

32
nation. The Terms of reference of the 13th Finance Commission states that in making
its recommendations, the Commission should consider "the need to manage ecology,
environment and climate change consistent with sustainable development."
It is essential to regenerate degraded forest and wastelands. A large area of degraded
land in the state can be reclaimed as most of the land needs only basic water and soil
conservation measures and some amount of plantation and protective work. Agro-
forestry can play an immensely important role in the rural economy. The wasteland can
be converted to grow plants, fodder and fuel. All the hill districts have more than 60 per
cent of the area under forest. Thus, many of the livelihood options in these regions
depend on forest-based products. The maximum pasture and grazing land is in
Bageshwar, Champawat and Pithoragarh; this is crucial for better fodder availability for
livestock in these districts. Champawat also has large tracts of fallow land due to
poverty, lack of water and the un-remunerative nature of farming.
LIVESTOCK
Uttarakhand has a mix of almost all domesticated species of livestock, very large in
numbers and very low in productivity, across the board. In economic terms they are a
wealth indeed, low productivity not-withstanding, as the sector supports livelihoods of
nearly 80 per cent of the rural households in the state, at least in part in the majority of
cases and in full in some (tribals and nomads exclusively living off livestock).
Livestock production in Uttarakhand is the endeavour of the small holder (marginal,
small and landless) and takes place in millions of small and tiny holdings scattered
across the state. The predominant farming system is mixed crop-livestock farming, both
in the plains as well as the hills, irrigated in the plains and rain fed in the hills.
Individual livestock holdings are small (5 or 6 animals), often made up of a mix of
different species, the combination made up invariably of cattle and or buffalo and goat.
Cattle are the most popular species and are farmed for milk production in the plains
(commercial); and in the hills for work animal production as well as for milk for home

33
consumption. Sheep are held in larger flocks of 10-15 animals along with a few goats in
some cases, except by the tribals and nomads where flocks are much larger (100–1000
of sheep, goats or both) and migratory (summer grazing in the alpine pastures in the
upper reaches).
Distribution of livestock is equitable, almost 80 per cent of all species and types are
owned by the marginal farmers. Much smaller percentages are held by the small
farmers. Land less rural households own milch animals where milk marketing
infrastructure exists; and local poultry, often for supporting family nutrition. Income from
livestock are for these reasons more equitably distributed compared to income from
land.
Major Livestock Products in Uttarakhand are Milk, Meat, Eggs, Wool and Work Output.
During the course of centuries the livestock rearing is well spread over in the life of
mountainous community and until 50 yrs. back the livestock raised by the villagers were
the status symbol and indicator of prosperity. Even today the livestock enterprises are
important for the economic development of hilly region.
In terms of fodder availability mainly in the plain districts of Uttarakhand fodder crops
are cultivated Udhamsingh Nagar and Haridwar district has more than 10000 ha. area
under fodder crop. In terms of grazing land availability the hill districts particularly in the
higher Himalayas grazing lands known as Bugyals are predominant. The district of
Pithoragarh, Chamoli, Pauri Garhwal, Almora and Bageshwar have more than 20000
ha. of grazing land available. With the introduction of cross breed, mix cross bred
indigenous cattle are found in the state with Dehradun, Nainital, Udhamsingh Nagar and
Haridwar having more than cross bred cattle availability. Among the buffalos improved
varieties are present in all the districts of the state with Udhamsingh Nagar, Haridwar
and Dehradun leading in numbers. Amongst the sheep‟s improved varieties are found a
maximum in Uttarkashi district. Goatary and poultry are also very popular in all the
district of the state (Annexure Table 2.16). An average of 2.35 liters per household per
day production of milk has been recorded which is much better than the national

34
average of 1.47 liters per house hold per day. The marketing of milk is done through
SHGs cooperatives and dairies (Annexure Table 2.17)
FISHERIES
Fish is a nutritious food product it not only helps in eradicating malnutrition but also
helps in creating livelihood opportunities for the rural folk. The state of Uttarakhand is
developing a fisheries policy in this regard so that fisheries can help in economic growth
of the State. The State of Uttarakhand has a large variety of fish species and various
types of water sources both natural and manmade. Aquaculture can be a source of
livelihood for the locals by providing opportunities for angling and ecotourism also. The
length of major rivers in the State is about 2686 km. There are a number of natural
lakes in the higher reaches of Garhwal Himalayas and a number of lakes in Kumaons
middle Himalayas. The area of these lakes is about 300 ha. The State is also known for
world popular Trout and Mahaseer fish which are an angler‟s delight. The State at
present is producing fish seed of an amount of Rs. 3.5 crores. These seeds are then
given to the fish growers and also released in various water sources.
Cold water fisheries: The fishes of commercial importance in cold water are
Mahaseer, Trout, Snow Trout and Mirror Carp only and are present in number of lakes
and rivers of the State. The Mahaseer, Trout, Snow Trout and Mirror Carp are highly
suitable fish species for Sport / Game/ Food fisheries in the hills, and have potential to
attract a large number of tourists. The state has cold water streams of about 2686 km.
length which is suitable for food and game fishes like, Snow Trouts, and Mahaseer. At
present the production of these fishes from the streams is very poor and are not well
managed from recreational and conservation point of view. If developed scientifically,
this is likely to generate considerable revenue for the state Govt. through promotion of
tourism related to game fisheries. In the recent years the population of Mahaseer has
depleted drastically in the state. To maintain the natural stock of Mahaseer species,
there is a need to launch conservation programs by the department.

35
Natural lakes: Uttarakhand is having thirty one natural lakes in the state covering an
area of about 300 ha. the fishing rights of most of the lakes are under the control of the
Forest Department (in some cases the Municipal Corporation). The production of fish
from these lakes is merely 6 mt annually which could be enhanced upto a level of 20 mt
through appropriate Scientific and Management Policy. Average fish productivity from
these lakes is very low. For enhancing the same, efforts are required from NRCCF
(ICAR) situated at Bhimtal, Nainital.
Reservoirs: The State is endowed with seven large sized man- made reservoirs in
Udhamsingh Nagar district covering an area of 20,075 ha. The Sharda Sagar reservoir
is the largest reservoir with 6880 ha. water area and Nanak Sagar reservoir with an
water area of 4084 ha. is the second largest. The average fish productivity of these
reservoirs is of order of 50 kg/ ha. as per the study conducted by BABCONS in the
recent past, the production level from these reservoirs have further gone down
considerably. These reservoirs are owned by Irrigation Department and extension
services are provided by the Fishery Department. There is an urgent need for
formulation of stocking policy and aqua culture technologies through scientific stock
management of these reservoirs for exploiting these extremely precious resources in
the State.
There are a total of 1545 ponds/ tank covering an area of 604 ha. in the state and also
there are 7 reservoirs covering an area of 20075 ha. in Udhamsingh Nagar District
which are used for fisheries production. The yield per tonne per ha. in reservoirs is
0.079 tonnes per ha. The yield from ponds and tanks is 2.92 tonne per ha. These
ponds and tank are basically community owned. The production of fish per annum is
2811 mt. for the whole of state. There is a scope for increased in productivity and it can
be taken up a livelihood activity for Self Help Groups (Annexure Table 2.18).
Processing, canning facilities, quality labs, research centers and reefer vans etc. are
required to make this into a potential revenue generator for the state. The „unique
selling proposition‟ of cold water fish is that it has a big export potential.
36
AGRICULTURE MARKETING, CREDIT AND PROCESSING
Agriculture marketing today means more than linking the producer with consumer, it
includes creation of favorable economic environment for farmers to enthuse him to grow
more and improve their income. Towards this end, Market Yards have become
instrumental for higher remuneration to them through proper weighing, cleaning, and
grading and better price realization of their produce. The farmers look forward to a
regulated market yard as a dependable infrastructure to further their economic goal.
The advantages of a regulated market yard system are immense and wherever such a
system exists, it has been so widely appreciated that today the farmers consider it as a
boon to them where they can confidently sell their produce and get an appropriate
return for the quantity and quality they produce year after year.
Market yard are classified into three categories according to the mode of sales i.e.,
primary, secondary and terminal. Sellers of a primary market yard mainly farmers of the
command area; in case of secondary market yard, farmers and traders beyond the
command area bring their commodities for marketing.
A primary market yard should be suitably located for easy accessibility and have
provisions to sell produces grown by farmers in the command area and have sundry
shops to meet the immediate requirements of a farmer when he comes there to sell his
produce. It should also have facilities for the traders, commission agents and other
market functionaries to facilitate easy trading and smooth price realization to the
farmers. The facilities should match to the functional requirements of the commodities to
be traded and also to the surrounding locality where the market yard is to function.
Secondary and terminal market yards are located in semi urban and urban areas and
the facilities are planned for the commodities for the commodities to be traded.
Market yards in Uttarakhand : Uttarakhand has adopted the “Krishi Utpadan Mandi Act”
on 27th December 2000 and Uttarakhand Krishi Utpadan Mandi Parishad (UKUMP) is
an apex body of the market committees. Regulated to market yards at convenient
production and marketing centre‟s provide the ideal platforms for marketing and selling
the agricultural produce and related products at remunerative price. Marketing and

37
selling of agricultural produce and related products at remunerative prices are one of
the most important aspects necessary for sustainable agriculture. To achieve this
objective, availability of adequate and appropriate marketing and storage infrastructure
is necessary.
Direct marketing in agriculture : Farmers come into direct contact with the consumers
and receive the payment directly from the consumers. This marketing strategy in
agriculture enables the farmers to sell their produce to the processors or bulk buyers at
lower transaction costs and may be at better price than what they get from
intermediaries or from the wholesale market.
Agriculture Produce Marketing Committee (APMC) Act and its amendment: The
wholesaling of agricultural produce is governed by the agricultural produce marketing
act of the State Govt. once a commodity is notified, the APMC act makes its transaction
mandatory in the regulated market. The market fees charged on value of produce sold
(Mandi tax) does not reflect the actual operation and maintenance cost of the wholesale
market but seen as another tax on agricultural commodities. The focus of the APMCs
has been on regulation and not development of markets for the local products,
introducing grading and encouraging local processing etc. The APMC have also not
played any significant role in bringing better market information to the farmers. The
operation in APMC creates monopolies of the State Marketing Board/ Market
Committees in regulation the wholesale market by not allowing direct marketing, often
leading to cartelization of a few brokers or aartis and non- transparency in price setting
to the disadvantage of the farmers. The monopolistic operation of the market committee
also acts as a disincentive to private sector in setting up processing unit for value
addition, as they do not have direct linkage with the farmers, which would otherwise
help them in getting raw materials of assured quality and quantity. In tune with
liberalization, the policy framework should give farmers the liberty to freely market their
produce anywhere including direct marketing to processors or other buyers without
paying any market fees. However, in case they want the facilities of the market yard,

38
they have to pay a service charge, which should be sufficient to cover the operation cost
of the market committee.
Storage Godowns : Storage godowns ensure storage of agricultural produce in a
scientific manner resulting in longer shelf life, reduction in post harvest losses,
preservation in quality of produce, prevention of distress sale, maintenance of stability in
price and assured availability all through the year, promotion of pledge financing and
marketing credit and introduction of a system of warehouse receipt in respect of
agricultural commodities stored in godowns, etc. It also provides capacity required for
buffer and operational stock of food grains to maintain PDS. FCI also has its own
storage capacity of about 60,126 MT in the state.
Cold storage : Cold chain facilities is one of the important forward linkages of
agricultural activities and cold storage provides infrastructural facility for reducing post
harvest losses in respect of horticultural / floricultural / perishable agricultural produce
i.e. fruits, vegetable, species. Besides, dairy products and forest produce can also be
stored in a cold storage. Cold storage facilities ensure quality and extension of shelf life,
prevent distress sale and glut situation during harvest and scarcity during off season,
and provide marketing flexibility, thus, providing remunerative prices to farmers. Potato,
tomato, vegetables, fruits like apple, mango, species, dairy products, fish, meat etc. are
the major commodities in the State requiring cold storage facilities. Besides, marketing
and transit centers acting as links between production and consuming point also have
greater demand for cold storage facilities. Cold chain infrastructures under integrated
production and post harvest management/processing system with upgraded technology
are encouraged.
Processing: Uttarakhand State does not have adequate units to undertake the
processing of Horticulture and agro – based products though there is ample potential for
such units. Cultivation and processing of white buttons mushroom, floriculture under
control conditions, micro-propagation of plants through tissue culture, species,
processed fruits and vegetables etc. are some of the potential activities which can be
taken up in State. Only a small quantity of fruits and vegetable harvested are
commercially processed.

39
Micro Credit : The State of Uttarakhand has a total population of about 85 lakhs most of
which resides in rural areas. As per the recent BPL survey 2002 carried out, out of
13.10 lakh rural households in the state 6.21 lakh households belong to BPL families
which constituted 47.42% of the total households.
After formation of Uttarakhand State, vigorous efforts have been made to promote micro
finance with active association of NGOs‟ Banks, Government Department through
various schemes. As at the end of October 2007, about 38000 SHGs have been formed
in the State and about 23000 SHGs have been credit linked with Banks. The SHG
movement, though has reached each and every district of the State, the spread,
however, is uneven and the progress in promotion and credit linkage of SHGs is not
encouraging in Haridwar, Chamoli, Pauri Garhwal, Rudraparayag, Champawat and
Pithoragarh districts.

40
CHAPTER -3 STATUS OF RAINFED AREAS IN THE STATE
POSITION OF RAINFED AREA IN THE STATE
On the basis of various climatic factors, influencing crop productivity, the State‟s
agriculture in hill is divided in four climatic regions.
A. Lower hills, rainfed Below 1000 m above msl
B. Mid hills, rainfed north aspect 1000-1500 m above msl
C. Mid hills rain fed south aspects 1000-1500 m above msl
D. Mid hills, irrigated 1000-1500 m above msl
E. High hills, rainfed north aspect 1500-2400 m above msl
F. High hills, rainfed south aspect 1500-2400 m above msl
G. Very high hills Above 2400 m above msl
Though the rainfall pattern vary from district to district and also with altitudes and
slopes, the average annual rainfall experienced in Uttarakhand is 1500 mm. In the 71
development blocks of hill being fully rainfed, the monsoon behavior like onset/ duration
of precipitation, intensity of precipitation and withdrawal of monsoon etc. cast great
effect on crop production. As per the Annual report of Uttarakhand Organic Commodity
Board it has been found through analysis of rainfall pattern during last many years
that:-
Rainfall in monsoon is generally deficient and erratic over the years.
Peak rainfall is shifting from the mid July to mid August.
The total number of rainy days is shrinking.
During Rabi Season, rainfall was erratic/ negligible over the years.
Peak rainfall in Rabi season is shifting towards harvesting season.
Of the total States area 9.38% is the net rainfed area under agriculture, 4.79% area is
under Horticulture, 24.72% area is under the other categories i.e., areas under non
agriculture Use (NAU), culturable wastelands, pasture lands etc. Almora, Bageshwar,
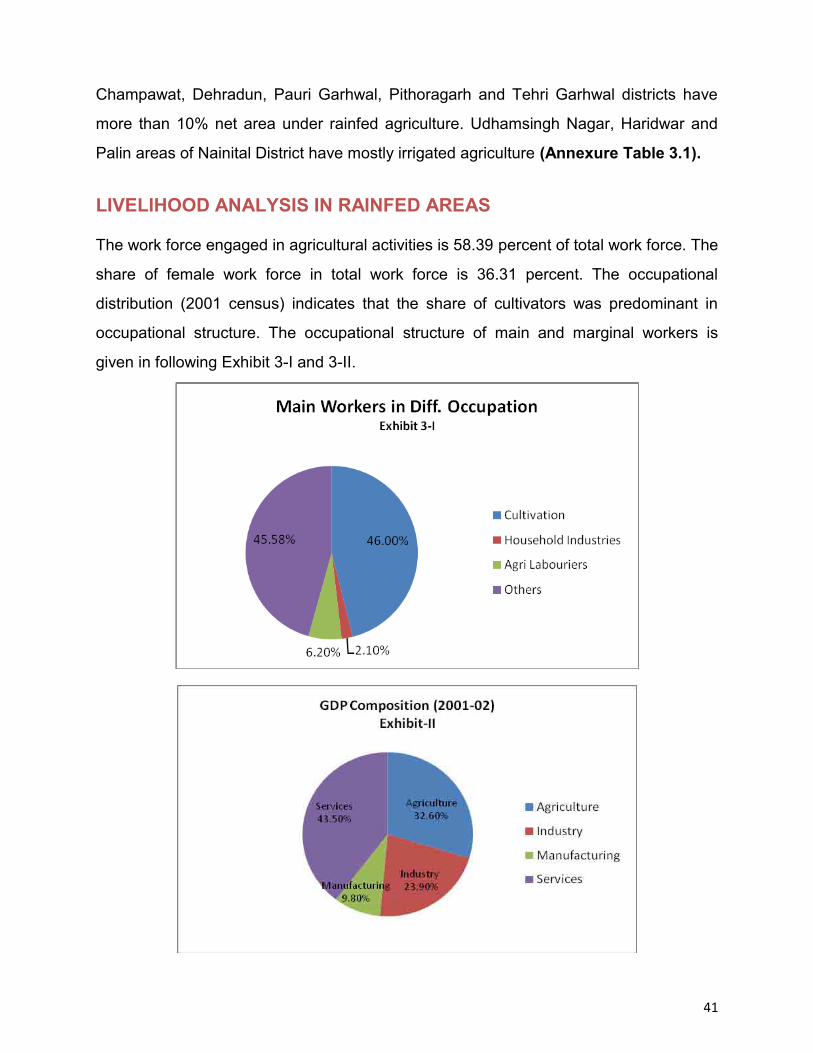
41
Champawat, Dehradun, Pauri Garhwal, Pithoragarh and Tehri Garhwal districts have
more than 10% net area under rainfed agriculture. Udhamsingh Nagar, Haridwar and
Palin areas of Nainital District have mostly irrigated agriculture (Annexure Table 3.1).
LIVELIHOOD ANALYSIS IN RAINFED AREAS
The work force engaged in agricultural activities is 58.39 percent of total work force. The
share of female work force in total work force is 36.31 percent. The occupational
distribution (2001 census) indicates that the share of cultivators was predominant in
occupational structure. The occupational structure of main and marginal workers is
given in following Exhibit 3-I and 3-II.

42
Main workers are those workers who had worked for the major part of the reference
period i.e., six months or more are termed as main workers. Marginal workers are those
workers who had not worked for the major part of the reference period i.e, less than six
months are termed as marginal workers.
The proportion of marginal workers is 1/4th of total work force and a higher proportion of
marginal workers are engaged in agriculture sector. It indicates that development
programs should be devised in such a manner so that adequate employment
opportunities on sustainable basis are provided to the marginal workers. It would help in
reduction of poverty level as also arresting in migration of labour force from rural to
urban areas.
(Table 3.a) District wise details of main and marginal workers
District Main workers Marginal workers
Total workers % age of marginal workers to total workers
Uttarakashi 114842 21062 135904 15.50
Chamoli 96900 67829 164729 41.18
Tehri Garhwal 181205 83510 264715 31.55
Dehradun 336504 63971 400475 15.97
Pauri Garhwal 171647 98224 269871 36.40
Rudraprayag 76068 25965 102033 25.45
Haridwar 353556 71707 425263 16.86
Pithoragarh 124062 74647 198709 37.57
Almora 204649 87533 292182 29.96
Nainital 220995 57952 278947 20.78
US Nagar 300141 92015 392156 23.46
Bageshwar 85613 33231 118844 27.96
Champawat 56165 34043 90208 37.74
Total 2322347 811689 3134036 25.90

43
The district which are having high proportion of marginal workers than State average
(25.90%) are Chamoli, Tehri Garhwal, Pauir Garhwal, Almora, Pithoragarh, Bageshwar
and Champawat which indicates that employment opportunities on sustainable basis
needs to be generated in these districts particularly under wage employment. In addition
to this, the no. of unemployment persons registered in Live register were 4.14 lakh
(2005-06) and for them also employment opportunities on sustainable basis needs to be
provided.
There are 16.14 lakh non workers in the age group of 14 to 16 years. Assuming that
11.20 lakh (80%) of non workers would be from age group of 18-60 years, it would not
be possible to absorb this work force in agriculture sector alone. Major portion of the
non workers can be gainfully employed in Non Farm sector activities which are not only
labour intensive but also give rise to wage / self employment in rural areas and will be
helpful in arresting migration to urban areas. Of the 16.14 lakh Non workers, 12.18 lakh
are women constituting 75.5% of Non workers. In order to provide gainful employment
to such large number of women, it calls for focusing our efforts on making schemes
most suitable to women, especially household industry.
(Table 3.b) Classification of Workers and Its Percentage to Total Workforce
Numbers in Lakh
Type of
workers
Main Marginal Total Male Female
Cultivators 10.67 (34.0) 5.03 (16.1) 15.7 (50.01) 6.84 (21.8) 8.86 (28.3)
Agricultural
laborers’ 1.43 (4.6) 1.17 (3.7) 2.6 (8.3) 1.90 (6.1) 0.69 (2.2)
Household industry
0.49 (1.6) 0.23 (0.7) 0.72 (2.3) 0.44 (1.4) 0.29 (0.9)
Others 10.63 (33.9) 1.69 (5.4) 12.32 (39.3) 10.78 (34.4) 1.54 (4.9)
Total 23.22 (74.1) 8.12 (25.9) 31.34 (100) 19.96 (63.7) 11.98 (36.3)

44
MAJOR PROBLEMS AND CONSTRAINTS OF AGRICULTURE PRODUCTION IN UTTARAKHAND
Like elsewhere in Indian in the state of Uttarakhand, the farmers also adopt two types of
agriculture practices i.e. the rainfed and the irrigated. Cereals are emphasised in the
irrigated agriculture and two crops are taken in an agriculture year. However in the
rainfed system millets, pulses and tuber crops are grown along with cereals and other
oilseeds. Mono cropping is a common practice in the irrigated areas. Contrary to this
mixed cropping is common in rainfed areas. Mixed cropping, practiced in the hilly region
helps in maintaining the crop diversity and reduces the risk of environmental and
business uncertainty.
The land use pattern of crops in Uttarakhand reflects a declining trend in the acreage of
conventional crops like barley and at the same time increase in non-conventional crops
like soyabean and other vegetable crops. Farmers are gradually shifting from low value
crops to high value crops. The decline in the area under traditional crop has been
relatively higher in the Kharif season as compared to Rabi season. During the kharif
season the farmers are putting a sizable land area under the production of offseason
vegetables. The land under production of traditional kharif crop has declined at 10
percent as against 8 percent for rabi crop. Despite the small holdings most of the
farmers who are relatively well connected to the market and have adequate irrigation
facility have opted for a shift in production from low value food grains to high value
commercial crops particularly vegetable and pulses.
The distinct geographical features of Uttarakhand with dominantly mountainous part,
coupled with Bhabar & Terai regions makes it a unique region where it is possible to
grow varieties of fruits, flowers and other horticultural crops. With altitude gradient
varying from 250 meters above sea level to 7187 meters above sea level, combination
of geographical features determines the climatic condition favourable for many fruit
crops, consequently, nearly all types of fruits ranging from tropical to temperate fruits
can be grown easily.

45
Uttarakhand has about 13 percent of its geographic area under cultivation out of
which about eighty percent of the land does not have assured irrigation facilities thus
making agriculture crops totally dependent on vagaries of nature.
However in these dry lands fruit plants can be grown successfully provided agro-
climatic and soil conditions are right.
Similarly in the irrigated land cultivation of off-season vegetables, flowers and seed
production of flowers and vegetables can be more remunerative.
This region also offers good potential for growing certain specialized crops as
Mushroom, olive, Asparagus, spices, ornamental flowers which not only hold high
commercial value but also have export potential value as well.
Floriculture: Gladiolus, tuberose, lilies, tulips, carnation, begonias, dahlias, roses.
These horticulture crops not only improve per unit returns but also help in protecting
the environment.
During the past main emphasis of nearly all- horticultural schemes has been towards
increasing the area and production of fruits and vegetables. Marketing and post
harvesting management have received a very negligible attention.
Analysis of Agriculture and Horticulture produce in Uttarakhand
We have used a two dimensional matrix for the Agriculture and Horticulture produce of
the state. The matrix is an interpolation mapping of the Agriculture and Horticulture
produce of the state based on their relative economic returns as well as their relative
market potential. The analysis is based on the relative returns in the present conditions.
The state could use the matrix to prioritize on the commodities to be focused so as to
generate more revenue for the farmers and the state. The various produce in this matrix
have been categorized as Stars, Cash Cows, Under Dogs and Question Marks, which
are elaborated after the matrix.
After the matrix analysis we have done a SWOT analysis for the overall farming scenario
of the state.

46
(Table 3.c) Two Dimensional Matrix for Agriculture Produce in Uttarakhand
MA
RK
ET P
RO
SPEC
TS
LOW
HIG
H
H
IGH
M
ark
et
pro
spe
cts
Low
hig
h
QUESTION MARKS Floriculture
Tea
Sericulture
Apiculture
Organic produce
Mushroom cultivation
Medicinal and Aromatic plants
STARS Horticulture (fruits)
Off season vegetables
Potato
Seeds
Basmati rice
UNDER DOGS Coarse Grains (Mandwa, Oat, -
Sawan Fafar, Uggal, chua, etc.)
Hills cereals production
Fisheries
CASH COW Cereals
Pulses
Oilseeds
Sugarcane
Spices
Dairy
LOW HIGH
ECONOMIC RETURNS
The above matrix is an interpolation of the agriculture produce in Uttarakhand based on
their relative economic returns as well as their relative market prospects. The analysis of
returns is based on the present conditions. Whereas the state needs to analyze this
matrix and should prioritize on the commodity to be produced so as to generate revenue
both for the state as well as the farmers. The various produce of the state has been
categorized as stars, cash cows, dogs, and question marks.
Star: Stars are those produce which have relatively high returns for the producer as well
as have high market growth prospects. The rate of return are higher than compared to
other crops, also per unit costs are reducing due to economies of scale. Off-season
vegetables are one of the star performers within this category. Due to its varied agro
climatic conditions the state is able to produce off-season vegetables, which have high
demand in the plains as well as city markets. The agro-ecological diversity also
promotes cultivation of large number of subtropical as well as temperate fruits, which
have high economic value as well as better growth prospects in future. Similarly the
state has a unique resource in terms of medicinal and aromatic plants which at present
is a trade worth fifty crores, has very high market prospect, it has the potential to be a

47
star if developed. The Delhi market itself has a demand of about 500 crore worth of
medicinal plants. The other commodity in this category is potato, which is demanding a
premium in the market the potential is increasing up both in terms of consumption as
well production. Efforts should be made to further the developments and create avenues
for better and sustained results.
Cash Cows: Cereals (excluding basmati rice), pulses, oilseeds and other cash crops like
sugarcane, spices etc can be termed as cash cows because of their assured market as
well decent returns compared to other coarse grains as the market of these crops are
saturated and the demand has is expected to remain constant (changing only with rise in
population). The need for marketing of these produce are less because they classify as
necessity and their demand elasticity is relatively less compared to the horticulture
produce.
Efforts are required for them to develop further to maintain their position both in terms of
productivity and production. Value addition to these produce could be a resource for
increasing revenues.
Under Dogs: Due to the subsistence nature of agriculture, lack of extension services and
risk aversive behaviour of farmers, many of them (farmers) in the state grow coarse
grains, which is produced for home consumption. The market for these produce are
almost negligible and hence the returns (if there) area also abysmally low. There is a
need for finding scope of value addition for these products so that they become
economically viable for the farmers. By this way the biodiversity could be maintained
here rather than going for only few crops there by posing a threat to the environment.
Focus on development of various crops, which still have an unrealized potential, creating
market demand by propagation of their intrinsic properties. Some crops which have a
very low productivity and market demand should be dissuaded in lieu of other crops for
cultivation.
Question marks: The international market for floriculture is expanding but the domestic
market at present is very small. But in the years to come the floriculture industry is

48
poised for an expansion. Similar is the case for organic produce as well as honey. The
market for these produce are promising and the ability to harness them will depend on
the states preparedness as well as infrastructure support to these industry. All these
aspects classify floriculture, organic produce, honey in the category of question marks.
The focus of development should be to turn the items in the question marks to Stars and
Cash Cows in over the period of next 5-10 years.
Swot Analysis of Uttarakhand Agriculture
Strengths:
The state falls in agro-ecological zone 4 and 11. In addition to this the varied
topographical conditions provide the state with a unique combination of agro-climatic
condition suitable for a plethora of flora and fauna.
Due to the above condition the state has rich crop diversity which includes a large
number of cereals, pulses, oilseeds and other cash crops like sugarcane.
The state has a huge potential for diversified horticulture development in the state,
like Tea, Sericulture, Medicinal Plants and Herbs, mushroom, apiary, etc.
Traditional method of cultivation in most of the part of the state has lead to lesser
exploitation and hence lesser degradation of the natural resources.
The area of Plain, Terai and Bhabar is characterized by rich soil and good irrigation
facility. These areas have excellent agriculture and can be termed as the granary of
the state.
The districts of Haridwar, Dehradun, Udhamsingh Nagar are famous for its basmati
rice and have a presence in the national as well as international market.
The Pantnagar University of Agriculture Science & Technology forms the backbone
of the states R&D and education in the field of agriculture.
The state has an existing set up of research stations KVKs and KGKs which can be
geared to meet the states need.

49
Weakness:
Lack of sub-regional and ecological approach to agriculture planning and
management.
Fragility of ecosystem.
Steep slopes and shallow soils in the hill leads to increased erosion leaving behind
less productive soil for crop production.
Small and scattered land holdings lead to economical unviable agriculture. More than
seventy percent of the land holding are less than one hectare in size and the average
per-capita land holding is about 0.91 hectare making farm mechanization difficult.
Limited area under irrigation. Only about ten percent of the cultivated land in the
state is irrigated the rest is rainfed. Even in this thirty percent there is a stark variation
in the amount of land under irrigation in different districts. The rainfed agriculture
restricts the number of crop taken in a year and thus reduces the cropping intensity
of the state.
Due to difficult terrains and fragile ecosystem there has been inadequate
infrastructure development in the area. This has direct bearing on the development of
agriculture development.
Further, lack of post harvest technology as storage, grading, processing leads to lack
of interest/initiative among farmers to grow high value crop, and thus restricting itself
to subsistence farming.
Lack of proper market linkage leads to increased number of intermediaries which
results in low value realization to the producer.
Lack of supply of inputs at the right time and in right quantity coupled by inadequate
extension work leave the farmers to practice traditional agriculture
Continued vicious cycle of low production, low productivity and low input supply
unawareness of new technologies and lack of extension support leaves the farmer

50
practicing the conventional agriculture which is not sufficient for him to sustain his
livelihood.
Socio-economic constraints.
Opportunities:
The present yields of almost all the crops are very low. There is an immense scope
of increase in productivity through quality inputs (e.g. High-yielding varieties, assured
irrigation etc.)
As mentioned earlier about 55% of the cropped area in the state is rainfed.
Opportunities lie in the state in harnessing the rainwater and watershed development
leading to increased area under assured irrigation. This would subsequently increase
the cropping intensity of the state. Harvesting the rainwater and subsequently
storage at higher elevation would help providing life saving irrigation. The stored
water could be utilized through gravitational force to low lying areas.
Areas under rainfed agriculture can be shifted to cropping of oilseeds and pulses
because they require less water.
Diversification of agriculture: Variation in altitude and microclimate offers natural
advantage for crop diversification. Less remunerative crops can be replaced
/alternated with more remunerative crop on a rotational basis. This will take care of
sustainability as well as economic viability.
Production of high value field crops. Promotion of cultivation of these crops will fetch
higher prices to the farmers and hence higher net returns even if the production is
low.
Value added products: In regions where it is not feasible to grow high yielding variety
or it is not suitable for diversification of crops, value addition to the existing produce
can be done. For example, the hills form the natural habitat for growing crops like
finger millets, barnyard millets, amaranthus, buckwheat etc. these crops are rich in
various nutrients which are essential for proper growth to the body. A number of

51
products can be prepared from these crops to provide nutritional security. Research
on nutritional aspect and value addition at local level would on one hand result in
sustainable agriculture and on the other hand help in checking migration.
Integrated Nutrient and pest management can help increase yield and decrease the
loss due to insects and diseases.
Popularizing zero tillage, minimum tillage, surface seeding would on one hand
reduce the cost of cultivation and at the same time make agriculture more
sustainable as through reduced erosion.
Developing hill specific technologies: Developing of low cost portable as well as efficient
tools is needed to augment the production in terraced field and other hilly regions.
Huge scope for getting value and development of sustainable agriculture by
promotion of Organic Farming. Use of bio-fertilizer in place of synthetic fertilizer can
help in restoring the humus content of the soil and hence can prepare the state in a
big way to take up organic farming.
Huge scope of bio-compost production in the state, it has capacity to export a major
quantity of produce.
Threats:
Increased population and subsequently decreasing per capita availability of land may
lead to unsustainable practices like monoculture, increased used of fertilizers and
plant protection chemicals.
Market oriented agriculture may lead to unsustainable practices. So it would be
prudent to take care of the aspect of sustainability while deciding the cropping
pattern of the state.
Continuous rice wheat cropping system may lead to depletion of humus and other
soil nutrients.
Unavailability of agri-inputs on time. Since the terrains are inaccessible so non-
availability of quality inputs may hamper the production productivity.

52
Development of the region specific technology may remain in the lab if it is not
disseminated through proper extension work.
Lack of market support will further de-motivate the farmers from taking initiative on
the production side.
Remunerative crops in horticulture may push the farmer to go in for the same. This
may further decrease the per unit land available for agronomic crops.
ANALYSIS OF ISSUES FOR DEVELOPMENT OF AGRICULTURAL CROPS
With the immense bio-diversity and production capabilities the state has not yet
leveraged its potential to increase revenue generation through focused cultivation of its
diverse crops. Increased revenue generation will have direct impact on the rural
development. Some issues which need to be addressed are:
1. Fragmented and scattered land holdings - Land holding pattern in the state – The
State has nearly 70 percent of land holdings, which are sub-marginal less than 1
hectare, which is nearly 27 percent of the cultivable land. While 26 percent of land
holdings are between 1- 4 hectares in size, which is nearly 51 percent of the total
cultivable area; and above 4 hectares of land is held by around 3 percent, which is
nearly 22 percent of the total cultivable area. Land consolidation is required for
economies of scale in crop production.
2. Low productivity of crops – The productivity of crops especially of the hills is low, as
they are mostly relied on for subsistence farming and is mostly rain-fed. The crops
grown are also not agro-climatically best suited for cultivation in the area. What is
required is micro-crop planning best suited to the particular area‟s micro climate.
3. Low penetration of extension services and research - The extension services,
especially in the hill areas has very limited reach. The lab to land transfer to
technology is hardly taking place. Inputs like seeds, pesticides, fertilizers, etc. are
also difficult to access. Focused impetus is required for the increasing the reach of
the extension services and research to the farmers all over the state.

53
4. Irrigation facilities are poor – Hills mostly rain-fed. Focused action plans along with
the watershed development made for optimizing the resources.
5. Information, transportation and communication infrastructure lacking. This
infrastructure needs to be developed with public and private sector investments.
6. Lack of Markets and marketing facilities and infrastructure. – Focused development
of supply-chain of produce from village markets to consumer is needed.
7. High Migration from the state: A big number of able bodied men leave the villages for
work in towns, army etc. leaving women to do most of the household work as well as
cultivation. This leads to subsistence farming with the least amount of effort.
ANALYSIS OF ISSUES IN AGRICULTURAL PRODUCTION
In Uttarakhand State, agriculture covers 7.81 lakh hectares. Out of which Hill regions
covers 4.43 lakh hectares around 56.8 percent and the plain region covers 3.37 lakh
hectares 43.2 percent. Irrigated areas in the Hills are around 10 percent whereas in
the plain areas it is around 85 – 90 percent.
There are nearly 9.26 lakh farmers in the state out of which nearly 8.16 lakh farmers
are small & marginal farmers, which is around 88 percent of the total farmers. Small
and marginal holdings of these farmers adversely affect production of agriculture
crops in the state.
Production of cereals in the state is around 8.64 lakh M.T. & in plains is around 9.53
lakh M. T. Productivity in the state cereals in Hill region is around 13.05
quintals/hectare and in the plains is around 28.4 quintals/hectare. The productivity is
more than double in plains than in Hills.
Requirement of the cereals is around 14.82 lakh M.T. whereas the production is
around 18.18 lakh M.T. The production of pulses and oil seeds around 0.23 lakh MT
& 0.18 lakh MT respectively where as requirement of pulse & oil seeds are around
2.74 lakh MT & 2.08 lakh MT respectively. Production of coarse cereals is done on

54
2.21 lakh hectares producing 3.01 lakh MT with a productivity of 13.61 quintals /
hectare.
Farming in hills is varied to that of plains. It requires set of package of practices,
which are area and crop specific.
Area under cultivable wasteland is around 3.22 lakh hectares.
Overall cropping intensity in the state is around 161%.
In the plain areas there is excessive use of fertilizers & mono cropping resulting in
low humus content in the soil. Thereby affecting the physio – chemical & biological
properties of the soil. In hills, excessive slope washes away top soil reducing humus
content of top soil thereby reducing the water holding capacity of the soil.
Excessive use of fertilizers and in the plains agriculture increases the cost of
production of the crops resulting in lower profits to the farmers.
Lack of research in traditional crops such as Jhingora, Ramdana, Rajma, Fafar,
Oggal etc in the hills, which have a substantial growth potential.
Seed replacement rate have been negligible in hills though few varieties of major
crops have been developed by lab. There is a paucity of certified seeds in the state
available to the farmers.
Lack of quality control labs in the state, which could check the quality of pesticides,
fertilizers etc.
The state lacks in quantity and quality of bio-fertilizers to augment the farming in the
state.
Lacks in the marketing facility of the produce.
Loss of crops because of natural calamities
The diversity of varied agro-climatic conditions in the state is not tapped as yet.
Women work force in agriculture constitutes nearly 80 percent of the workforce.
Lack of suitable farm equipment and machinery for hills.
55
ANALYSIS OF ISSUES IN LIVESTOCK MANAGEMENT
Agriculture in Uttarakhand is interlinked with animal husbandry and forestry to form a
production system. Agriculture & Animal Husbandry contribute two-third of net domestic
output from commodity producing sectors in Uttarakhand. In Uttarakhand, small and
marginal farmers have a strong dependence on livestock sector as it is not only a source
of milk and draught power, but it‟s by products, such as, manure, hides, bones, etc help
in supplementing farm income.
While Uttarakhand has a very high population of animals the productivity is very low.
Most of the grazing pastures are in the hilly districts. Generally, the cattle stays in small
sheds, these sheds have no concrete floor and usually have tin or thatched ceilings.
During the daytime animals graze in the forests, they are also given animal feed
prepared by the farmers. In the plains animals are fed grass mixed with hay and they are
kept in the tin sheds.
The Uttarakhand Agriculture Policy spelt out the priorities as:
Programs for artificial insemination for breed development of animals.
Ensure availability of required investment and expansion & strengthening of medical
facilities to encourage animal husbandry.
Provide solutions to increase productivity of local animals.
Special attention on Angora rabbit breeding, and strengthening of its distribution
system.
Promote dairy by expanding milk processing capacity, expansion of intensive mini
dairy and strengthening of distribution structure.
Fodder Management: Conservation and scientific management of pastures spread over
an area of 1.84 lakh hectares on high altitudes, also measures to check uncontrolled
grazing on the same.
Plantation of feedstock trees like shatoot, Bhimal, chamlai and grasses like clover, talfatue.
Mixed cropping will be emphasized in the villages.

56
Production of barseem, barley, oat at the plains of the mountains.
Cold tolerance varieties will be included in the cropping pattern.
Cultivation of grass and pulses (intercropping on orchards and on field boundaries).
Establishment of fodder bank and ready -to- eat type of concept.
Health Care : In Uttarakhand most of the districts have health infrastructure, which is
grossly inadequate. The infrastructure available in need for immediate attention to be
fully functional, and there is an urgent need to have more health centers near the
villages, so that the immediate medical attention is available for the animals. For
example there are 23 veterinary hospitals functioning in the Dehradun district. These
veterinary hospitals are wide spread in the District. Places like Chakrata, Tyuni,
Lakhamandal, Kalsi, Sahiya, Lakhwara, Vikasnagar, Harbartpur, Sesambara etc. are all
connected by road.
In spite of the present set up, livestock markets do not have any veterinary facilities.
Animals in Uttarakhand are very susceptible to epidemics. Diseases, such as, Foot &
Mouth disease (FMD), Haemorrhagic Septicemia (HS), Black Quarter (BQ), Gastro
Intestinal Parasitism and Schistosomiasis are potential threats. Since the livestock
markets are a large gathering of animals, preventive action needs to be taken. In most
districts the animal health infrastructure is grossly inadequate.
ANALYSIS OF ISSUES RELATED TO INTEGRATION OF AGRICULTURE AND
FORESTRY:
Subsistence agriculture is the prime source of livelihood for more than 80 percent people
of Uttarakhand. In this region, terraced slopes covering 85 percent of the total
agricultural land are generally rain fed while the valley covering 15 percent of the area
are irrigated. Agriculture of this region is very complex as it is interlinked with crop
husbandry, animal husbandry and forest to form a production system. Inaccessibility,
environmental heterogeneity and ecological fragility favored evolution of subsistence
production system sustained with organic matter and nutrients derived from the forests.

57
The forests cover 63.44 percent of the total area of Uttarakhand. The forests constitute
the most important natural resource in Uttarakhand. They form an eco-system and the
protection of forest has remarkable contribution in the process of economic development
and environmental stability.
The locals of the region are dependent on forests for employment and resources like
fuel wood, timber, fodder, medicinal herbs etc. But rising population and increasing
needs have led to indiscriminant exploitation of forest resources and hence to depletion
of forests. Therefore, there is an urgent need to take action towards maintenance and
rejuvenation of forests without harming the livelihood of local people.
Evaluation of present state of agriculture and forest lead one to the conclusion that
strategies need to be developed to reach a balance between agriculture and forests.
Also the strategies or action plan is required to ensure fulfillment of both ecological and
economic needs. The forest wastelands and forest areas suitable for agro forestry
should be utilized for agriculture to increase the revenues and the employment
opportunities for the states rural population.
So far there has been a dichotomy between agriculture sector and forests. According to
Government policy, at least 60 percent of the total area is required to be under forest
cover. Rest 40 percent is only available for habitation, cultivation, grazing land etc. As
the rising population is putting more pressure on agriculture, it is necessary to increase
the crop production. Since the area available is limited, one of the options can be to
integrate agriculture with forests in the village common lands. That is, coexistence of
agricultural crops with forests.
A few suggestions for the integration of agriculture and forests are -
1. Alley cropping: In alley cropping, an agricultural crop is grown simultaneously with a
long-term tree crop to provide annual income while the tree crop matures. Fine
hardwoods like walnut, oak, etc. are favored species in alley cropping systems and
can potentially provide high value lumber or veneer logs. Nut crops can be another
intermediate product.

58
2. Forest Farming: In forest farming, high-value specialty crops are cultivated under the
protection of a forest canopy that has been modified to provide the correct shade
level. Crops like medicinal plants and herbs, spices, culinary products, special
varieties of mushrooms, decorative ferns, etc. could be effectively grown without
disturbing the eco balance. Forest farming provides income while high-quality trees
are being grown for wood products. Some products, especially medicinal and
botanical, can have tremendous economic value, while others provide a lower but
steady supplemental income.
3. Silvipasture: Silvipasture combines trees with forage and livestock production. The
trees are managed for high-value saw logs and at the same time provide shade and
shelter for livestock and forage, reducing stress and sometimes increasing forage
production. In plantations of conifers or hardwoods for timber, managed grazing
provides added products and income.
4. Horticulture: The climatic conditions of the region are suitable for plantations like
apple, walnut, apricot, litchi etc. The fruit plantations can serve dual purpose of
maintaining forest cover and at the same time provide employment and economic
benefits to farmers.
5. Fodder management: This region is home to a large number of domesticated
animals. This reflects the huge fodder requirement of the region. Technology has
been developed for the production of erect grasses like hybrid Napier, Setaria spp.
and Desmodium coloratum on cultivated field terrace risers, degraded and steep
sloppy lands, wet land sites etc. Pangola grass is the most suitable grass species
under Pine and Deodar trees.
ANALYSIS OF ISSUES RELATED TO IRRIGATION
Most of the agriculture in the state is rainfed. The net irrigated area of the state stands at
339769 hectares (1996-97). The net irrigated area to net sown area for the state is 45%.
At present, the sources of irrigation in Uttarakhand are canals, wells, Rahat, tubewells
etc. But given the hilly terrain of the state, these sources are also not available in all the
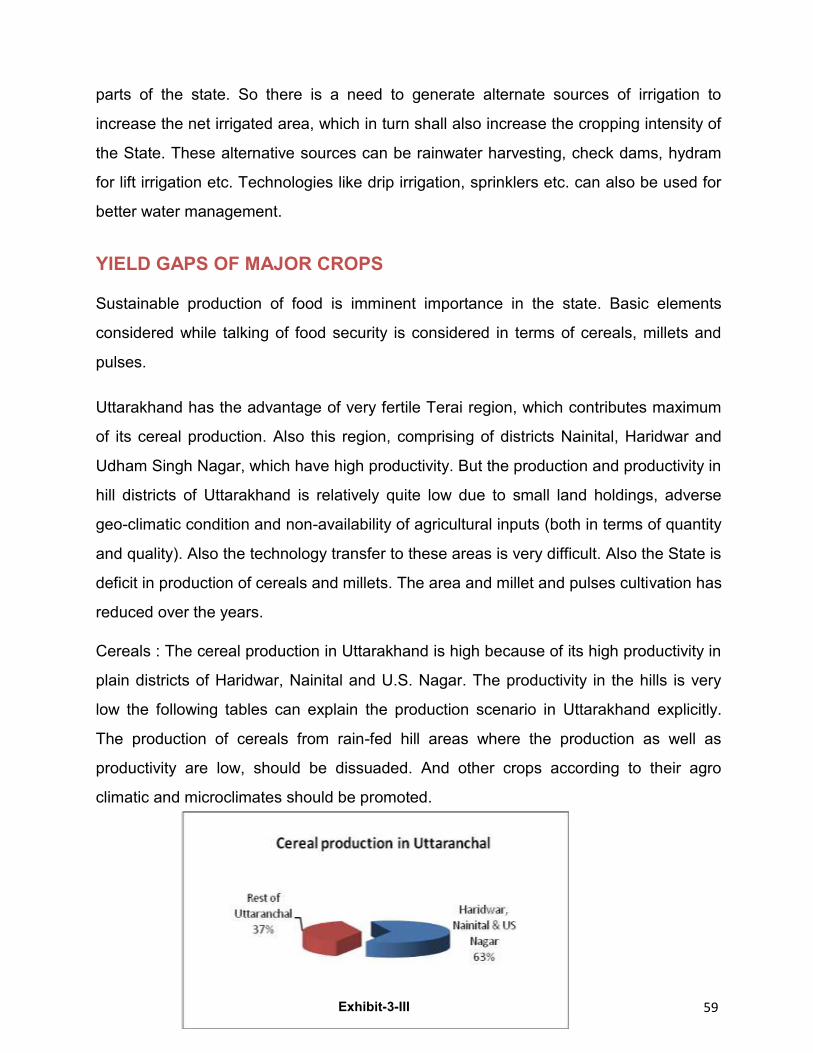
59
parts of the state. So there is a need to generate alternate sources of irrigation to
increase the net irrigated area, which in turn shall also increase the cropping intensity of
the State. These alternative sources can be rainwater harvesting, check dams, hydram
for lift irrigation etc. Technologies like drip irrigation, sprinklers etc. can also be used for
better water management.
YIELD GAPS OF MAJOR CROPS
Sustainable production of food is imminent importance in the state. Basic elements
considered while talking of food security is considered in terms of cereals, millets and
pulses.
Uttarakhand has the advantage of very fertile Terai region, which contributes maximum
of its cereal production. Also this region, comprising of districts Nainital, Haridwar and
Udham Singh Nagar, which have high productivity. But the production and productivity in
hill districts of Uttarakhand is relatively quite low due to small land holdings, adverse
geo-climatic condition and non-availability of agricultural inputs (both in terms of quantity
and quality). Also the technology transfer to these areas is very difficult. Also the State is
deficit in production of cereals and millets. The area and millet and pulses cultivation has
reduced over the years.
Cereals : The cereal production in Uttarakhand is high because of its high productivity in
plain districts of Haridwar, Nainital and U.S. Nagar. The productivity in the hills is very
low the following tables can explain the production scenario in Uttarakhand explicitly.
The production of cereals from rain-fed hill areas where the production as well as
productivity are low, should be dissuaded. And other crops according to their agro
climatic and microclimates should be promoted.
Exhibit-3-III

60
Pulses : As is evident from the graph, the State is severely lacking in pulses, which are a
critical part of food security as most important supply of protein. The state has been
traditionally producing Rajma, Guerns (Lal dal) and Gahat. There is potential for
development of other pulses in the state. Cropping patterns and „package of best
cropping practices‟ needs to be extended to the farmers, and there is a need to increase
the area under production and productivity of pulses in the state. The state also has the
opportunity for producing and marketing the traditional pulses with high nutritional value
like Gahat. This highly nutritious pulse is mainly consumed in winter. Soup made from
this grain is believed to maintain body warmth during severe winters. This soup has
medicinal properties, it is a cure to kidney stone. Other pulses grown in the state are
Arhar, Urad, Moong, Gram and Masoor. Masoor is the main pulse from the state with
nearly 15,950 hectares under cultivation. The productivity of the pulses and area under
production can be increased with promotion of scientific cropping patterns in the state.
Exhibit-3-IV
Millets : The State of Uttarakhand is deficit in millet production that includes madua,
sawaa, koto and oat. Though eight of the thirteen districts produce more than their local
requirement. The millet requirement per capita per year is 42 Kg.
Millet is a very important crop for the difficult Himalayan conditions as they have high
nutritional value and are one of the cheapest sources of dietary energy, in the form
proteins and carbohydrates. Such crops are particularly valuable in the mountains where
most of the population depends on vegetable proteins and carbohydrates as dietary

61
staples. Traditionally in the Himalayas many of these traditional crops supplement the
wheat and rice meals.
The production of Millets in Uttarakhand could be given focus to achieve self-sufficiency.
Millets production zones and cropping patterns could be augmented and streamlined for
attaining sustainable and optimum production.
Exhibit-3-V
YIELD GAPS IN HORTICULTURE CROPS
Various topographic and agro-climatic conditions are congenial for different kind of fruits
cultivation at different altitudes e.g. apples, peaches, plums, apricots, walnuts, pecans,
cherry are grown successfully between altitudes of 2000 – 3000 meters, almonds, kiwis
etc, at 1000 – 2000 meters. In areas below 1000 meters and in fields of Terai and
Bhabar, mango, litchis, jackfruits, aonla, and papaya can be easily grown.
The areas of expansion should be taken up strategic locations in accordance to the
topography, agro climatic zone and soil conditions. Here help should be taken from the
GIS mapping of the state with the watershed and micro watershed analysis data.
Present area under fruit cultivation is around 1.89 lakh hectares. The area under fruit
cultivation can be increased by nearly 25,000 hectares over the next five years.
Productivity : The productivity of the fruit crops in Uttarakhand is low. For example when
compared with apple production the Jammu & Kashmir the productivity in the year 1998
356141.6301001
55140.6
0
100000
200000
300000
400000
Availability Production Deficit
Availability, Production and Deficit in MT
Millets in Uttarakhand

62
– 1999 was around 9500 Kg/Hectare as to 3210 in Uttarakhand. Recent proactive steps
of the horticulture department should enhance the productivity trends comparable to
neighboring states. Improving crop productivity would include various components like
uprooting senile and virus infected plants, integrated pest and nutrient management,
training to the farmers (up gradation of skills) and supply of high yielding variety of
planting material and seeds.
YIELD GAPS IN FISHERIES
The issues for consideration by the State Government for increasing the productivity in
the fisheries sector are :
Extension Services: The fishery department must take up on priority, creation of
awareness among the fish farmers as also promotion and popularization of fisheries
schemes in the State. There is no major constraint for supply of fingerlings, feed and
bank loan to support fisheries development. Fishery Department may therefore, provide
necessary extension.
Exploitation of potential areas: Some of the districts like Udhamsingh Nagar, Haridwar,
parts of Nainital and Dehradun have the potential for intensive fish farming. Similarly,
fish seed production units have also a good scope in these districts. There is a need for
identifying prospective entrepreneurs for such schemes. The department must provide
forward and backward linkages, extension and subsidy support to the entrepreneurs to
promote fisheries development. There is a need for convergence of efforts by different
agencies, with FFDA acting as the nodal agency for inland fisheries development.
Sport fishery: Apart from existing angling sites in the streams / lakes, efforts may be
made to identify more area of the Kumaon and Garhwal region for fishery sport in the
State. Where ever possible, infrastructure facilities for anglers may be provided created
by fisheries department.
Promotion of High Tech fish farming, intensive fish farming: The State Govt. may
encourage private fish centre to set up project of high tech fish farming for intensive

63
culture of carps in the plain district with high density stocking and heavy feeding with
water exchange and oxygenation using aerators.
Increasing fish seed production: Development of mini fish seed hatcheries in the private
sector in all potential districts on the pattern existing in UP, Punjab and Haryana may be
encouraged, so as to achieve self.
Utilization of available technical expertise in the State: The Uttarakhand has good
research support in the fishery sector in the Shape of NRCCF, the ICAR centre at
Bhimtal, College of fishery sciences, GB Pant University of Agriculture and technology,
Pantnagar and various other universities located in Garhwal and Kumaon regions. The
support of these agencies may be availed to extend expertise in setting up of a trout
hatchery/ Mahaseer hatchery to meet the expected requirement of trout and Mahaseer
fingerlings.
Increasing fish productivity: As the average annual fish productivity of the existing lakes
and the streams is very low, it is proposed that development of minimized hatcheries in
the private sector in all potential districts on pattern existing in UP, Punjab and Haryana
may be encouraged by the State government so as to achieve self sufficiency in seed
production in the State.
Marketing facilities for fish: Department is running fish marketing centre‟s at Kiccha and
as such centre‟s are very helpful for realizing better price for their produce, department/
government may come out with a programmer for creating marketing centre‟s in all
major cities and towns in the state.
Organic fish culture: Organic fish culture is being practiced in almost the entire State by
default as, almost negligible quantity of chemical fertilizers are being used. However,
occasionally, in order to meet the phosphate requirements of the pond water, some of
the farmers are using super phosphate. The Government of Uttarakhand may consider
promoting the technology of organic fish farming with an ultimate view to export of
organic fish harvest in order to fetch a better market price.

64
INPUTS, CREDITS, PROCESSING AND MARKETING GAPS
Agriculture Inputs: Adequate and timely availability of inputs is essential for agricultural
growth. A dynamic and growing, agricultural sector requires seeds, fertilizers, plant
protection chemicals, bio pesticides, agricultural machinery and credit at reasonable
rates to the farmers. Inputs management becomes an important component of modern
agriculture. Balanced use of high quality inputs at the appropriate time brings in the
much-desired results in terms of both production and productivity. The detrimental
effects of injudicious use of chemicals is an area of concern and ways and means have
to be found to ensure sustainable agricultural growth by promotion of balanced use of
chemicals and emphasis on organic farming.
Seeds: Uttarakhand is ahead of many states in the production as well as the distribution
of high yielding hybrid variety of seeds. The largest State Seed Corporation „Terai Seed
Development Corporation‟ forms part of the state. Besides that around 100 private seed
companies are engaged in the production and distribution of certified seeds in the state.
Seed distribution is also handled by the cooperative agencies working in the state.
The distribution of the certified seeds is on constant rise in the state, which is a positive
feature as the seeds distributed are of high yielding variety and also are treated. Seed
production through self-help groups and by private nurseries is to be encouraged
Fertilizer: Fertilizer is one of the most critical inputs in agriculture. The consumption of
chemical fertilizer in the state is 69.10 kg/ha (Agricultural Directorate Uttarakhand,
Progress report 1999-2000) as against national average of around 95.33 kg /ha (CMIE –
EIS November 2000). But it is seen that the consumption of fertilizers is not uniform in
the state. It is highly skewed with Haridwar, Nainital, U. S. Nagar, Dehradun accounting
for maximum fertilizer consumption. The fertilizer consumption in Haridwar, US Nagar is
even higher than the national average. In rest of the district‟s the fertilizer use is
negligible. Given the state‟s thrust towards promotion of organic farming and the
premium associated with organic produce, near absent use of fertilizers in these districts
could prove to be boon for the state.

65
Cooperatives: The objective of organizing the cooperatives in the state is the upliftment
of weaker sections of the society by improving their economic status. The district
cooperative banks along with its branches provide the people with the short-term,
medium term and long term loans. The Primary Agriculture Credit Societies (PACS)
constitute maximum number of cooperatives in Uttarakhand. They provide the farmers
with inputs for agriculture like seed, fertilizers, plant protection equipment credit and
other consumer non-durable. The central consumer stores and its branches make food
grains and other items available to the urban as well as rural people at affordable prices.
With the help of the cooperative societies the farmers are made available the required
inputs according to their requirements. The Bhesaj unions are presently facilitating the
production and trade of medicinal and aromatic plants in the hilly region of the state.
They identify farmers who take up the cultivation of medicinal and aromatic herbs on
their private land.
The number of active members is quite less in Uttarakhand and hence threatens the
viability of the co-operative through reduced business. So there is a dire need to revive
the cooperatives by increased business though increased member participation. Thus
there is a big potential for increasing active membership so as to increase business
operations & for making the PACS viable and better service centers.
Micro Credit : The spread of SHG bank linkage programme is most uneven and also
has not made much progress in the State due to Bank‟s conservative approach. To
speed up formation of SHGs, it is necessary to involve staff of different Govt.
Department including of Aanganwari workers. Banks may include sensitization on Micro
Credit in their regular training sessions to create awareness among various branch
Managers of all banks.
The major recommendations on SHG promotion are as follows:-
At present, the SHGs (outside SGSY) have to pay stamp duty on execution of
documents with banks for credit linkage. Since members of SHGs belong to poor
families, financing to SHGs may also be exempted from stamp duty on the lines of
SGSY programme.

66
The participation of bank branches is still not up to the desired extent although there
is network of 1135 bank branches and 763 PACS in the State. The banker‟s
conservative attitude, skepticism over the utility of micro finance as a business
proposition, security orientation and reluctance to finance women SHGs must
undergo change to upscale the SHG Bank Linkage Program.
A large number of SHGs have been promoted by the DCCBs/ PACS in the State.
The progress in credit linkage of these groups is yet to pick up. State Govt. may
issue necessary instructions to the DCCBs/ PACS to provide credit facility to eligible
groups.
Keeping in view the limited outreach of the NGOs, it is necessary to involve other
State govt. Department engaged in rural development activities and working at
grassroots level to upscale the movement further. Department like Forest, Agriculture
and Education, etc, with vast manpower functioning at village level can also be
involved for associating with this movement. Some of these departments have also
formed groups to implement their programs. These groups also can be co-opted into
the movement by introducing savings and credit as add- on activities to their core
functioning.
The government may consider issuing necessary instructions to the women and
Child Welfare Department to involve Aanganwari workers in promotion of SHG
program in the State like in other States. An effort in this direction has been initiated
in Nainital and Haridwar district.
The banks may include the Micro credit and joint Liability Group concept in their
regular training sessions.
The progress of formation and credit linkage of SHGs as also the progress in the
formation of farmers clubs may be reviewed in each and every district level meeting.
The para–statal agencies/ NGOs which are promoting SHGs may also be selectively
invited in the Distt./Block level meetings convened by LDMs.
Non availability of data from Banks is an area of concern. The Management
Information System (MIS) for Micro credit is yet to be developed by the banks.
67
Rating of SHGs is an important requirement for embedding quality in the SHGs and
to create consciousness of the same amongst the players in the movement. Partner
agencies may develop their own norms or adopt the norms suggested by NABARD.
All partners may ensure to suffix the name of the Self Help Promoting Institution
(SHPI) at the end of the name of the SHGs so as to enable easier identification in the
field and avoid duplication.
Govt. should evolve system of grading of NGOs functioning in the State. The norms
evolved by NABARD for NGO‟s grading can be replicated.
RBI has directed all banks in the country to introduce „No Frills Accounts‟ where the
minimum balance could be zero or a very nominal amount with a view to making
available basic banking to vast sections of poor population / SHGs. All banks are
urged to give facility of such a „No frills‟ accounts to SHGs.
Processing: In Uttarakhand, there exists the necessary political will and commitment for
developing food-processing industry. As a flourishing Food Processing industry will be
an important revenue generator for the state and also provide employment to the rural
masses and restrict the out migration from the state. Uttarakhand has the raw material
resources for developing a progressive and sustainable food processing industry.
Presently the food processing industry is in a nascent stage, which requires to be
developed with pro-active governmental facilitation.
Uttarakhand presently has very few medium and large-scale food processing units, most
of the foods processing units are in the „Village and Small Scale sector‟ and most of
them are not doing well. There are many sick units as well, recently the government
leased its food-processing factory in Ramgarh to NDDB. The state also has around 48
fruit and vegetable canning units in villages that are defunct; there are plans to
rejuvenate nearly 24 units.
There are many schemes to promote the food-processing industry sector agencies like
Kumaon Mandal Vikas Nigam, Garhwal Mandal Vikas Nigam, Khadi and Village Industry
Board, Hiltron, Janjati Vikas Nigam etc. and some central government agencies
promoting the food processing industry.

68
Marketing : Agriculture in the state is characterized by marginal holdings and small
scale scattered production. Agriculture marketing comprises of all the operations
involved in the movement of produce from the farm till it reaches the ultimate consumer.
Several functions are involved in this process like assembling, sorting, grading,
packaging, transporting, loading/unloading, storing/ warehousing, trading, processing,
financing, risk bearing and retailing. Various intermediaries between the producers to the
consumers handle these functions.
The biggest challenge that the state faces is in terms of transportation and logistics. The
terrain makes it difficult to have proper and cost effective infrastructure like road, storage
facilities, reefer vans, pack houses etc. The transportation costs are high and access is
limited. The mode of transportation is ropeways, horse carts, trucks, tractors and costs
of transportation are high rendering the products costly in the market place. The more
inaccessible the markets the greater are the number of intermediaries and lower the
share of the farmer in the consumer price.
Despite having abundant resources and production of high value horticultural, medicinal
and aromatic crops much of it goes waste for lack of proper post harvest and marketing
infrastructure, particularly in the hilly areas. This coupled with poor availability of market
information and other support services like input supply and credit etc. makes the farmer
dependent on intermediaries. Quite often the farmer is not able to realize his cost of
production.
Action points that need to be considered for closing in on the present marketing gaps
are:-
Transportation is the major problem in hill regions. So, either procurement centre
may be established in the area or some transportation subsidy may be introduced
for improving profitability of the farmers.
Presently only storage of potatoes is available as post harvest facilities. The
awareness among farmers about other post harvest management aspects such as
grading, processing etc. needs to be created by the concern departments.
69
For planning of marketing strategies, a data base on consumer behavior market
competitiveness, strategies of potential rivals in export market, income and price
response needs to be developed in the State.
Organization commodity specific growers‟ associations at village, market (AMC) and
state level and integrating their functions in relation to market centric activity.
Linking up villages to local market; local market to regional/ state markets and state
markets to national and international markets duly network them online
(e. marketing).
Govt. of Uttarakhand may tap Rural Infrastructure Development Fund from
NABARD for all the AMCs projects on a comprehensive basis (new as well as
modernization).
Involving Gram Panchayats to organize and manage markets at local level by
undertaking remunerative schemes and improving their revenues.
Village level processing should be encouraged by providing appropriate technology
and by organizing the marketing of such processed products.
TECHNOLOGY/EXTENSION/ ADOPTION GAPS
Agriculture research has contributed immensely to agriculture growth. Future agriculture
growth will depend a great deal on how appropriately the research priorities are
determined with a state centric focus. The role of agriculture research and development
in the state of Uttarakhand should be to identify problems faced by the farming
community and to recommend solutions to these problems, which can be adopted by
the farming community. At the same time the researchers in agriculture have to work to
meet the increasing food demands of the society both in quality and quantity terms.
Agriculture research and development is vital for developing an economically
remunerative and ecologically sustainable agriculture. Development of region specific
modern packages of practices for different crops in different conditions should be the
focus and development of new varieties of crops. The research activity should also
focus on customizing research results to suit the local conditions for benefit of
agriculture community.

70
Resources - Agri Research and Development: The state is fortunate to have a number
of Research & Development Institutes. It has one of the best agriculture universities of
the country, G. B. Pant University in Pantnagar. G. B. Pant University is one of the
oldest Agriculture Universities in the country and is a forerunner in the field of agriculture
research and development. Presently the university has nine colleges in different fields
of agriculture.
Other institutions in the field of research and development in Uttarakhand are:
1. Vivekanand Hill Laboratory, Almora
2. Defence Research Laboratory, Pitthoragarh; research stations at Auli, Harsil,
Goraparao and Rainwala
3. Research and Training Institute, Chaubattia, Ranikhet
4. Central Medicinal and Aromatic Plants Institutes at Pantnagar and Purra
5. Forest Research Institute, Dehradun
6. Central Soil and Water Management and Training Institute Dehradun.
7. G. B. Pant Institute of Himalayan Environment and Development, Kosi-
Katarmal
8. Research Stations of G. B. Pant University at Rani Chauri, Majhera, Sui &
Pauri
These institutes have been working on various projects on development of Agriculture.
They are equipped with large scientific human resources, laboratories and zonal
research stations, which could contribute in a big way to the development of agriculture
in the State. The scientists working in these institutes have developed resources and
expertise in working with diverse agro climatic zones in the state. They are aware of the
problems and issues in the development of agriculture of the state.
The state should utilize these resources to focus on the issues of development in the
state. It should build their capacities, bring state centric research focus and facilitate the
transfer of research & development done by these institutes to the farmers in a proactive
mode.

71
Exhibit-3-VI- Focus issues in Agri Research & Development
Some of the major issues, which require focus, are as depicted in Exhibit above.
The challenge before the state is to supplement the conventional / traditional agricultural
practices with inputs from „Research and Development‟ to give agriculture eco-
sustainable and remunerative solutions. The state needs to streamline the „Lab to Land‟
transfer of technology to the farmers. In future, the state should propagate state centric
research where farmers and private sector companies could bring their problems and
issues for getting optimal solutions.
A large number of research projects are being carried out in the G. B. Pant University
most of them are All India Coordinated Research Projects, NATP projects, State
Government projects and other projects.
The Defence Agricultural Research Laboratory, Pithoragarh are also having intensive
research programs at the institute and research stations.
Training and Development: The state has to identify and intensify its research activities
to the focus areas in the field of agriculture beneficial to the state agriculture. The areas
of immediate interest/concern are
Organic Farming
Increase productivity
Integrated Pest &
Nutrient Management
Modern Harvesting Techniques
Post Harvesting
Management
Identification, Documentation and Commercial Cultivation of Medical and Aromatic Plants
Increase cropping intensity
Develop Cost effective Packaging
Solutions
Biotechnology
Developing Farm Equipment and
Machinery
Bio- propecting and patenting
Developing region and crop specific package of practices for
crops
Agri Research &
Development Conservation of Biodiversity and development of Eco-sustainable
agriculture

72
Horticulture
Hill agriculture
Conservation of states bio-diversity
Integrated Pest Management
Organic farming
Biotechnology
The agriculture R&D of the state should work in the field of
1. Development of new varieties through genetic improvement of the crops.
2. In-Situ selection of superior clones from seedlings.
3. Development of hybrids in vegetables suited for diverse climatic condition of the
state.
4. Development of new techniques in Agriculture which includes;
Package of practice for specific crops in specific regions.
Development of horticulture.
Identifying rootstocks good for hill horticulture.
Integrated Nutrient Management (through organic Farming).
Bio intensive integrated pest management.
Protected cultivation through use of plastic/poly houses.
Domestication of wild varieties and regional varieties to maintain the gene pool of
the state.
Tissue culture to enhance the propagation practices.
5. Identification of medicinal and aromatic plants & their documentation and patenting.
6. Post harvest management of agriculture produce specially horticulture
produce.

73
7. Developing of farm equipment /machinery for the hilly region.
8. Developing cost effective modern packaging solutions.
Agriculture Education: Agriculture industry is in constant need of capable
professionals, more so in Uttarakhand where agricultural industry in on threshold of
development. Agriculture Industry in the state is evolving and demands professionals
with technological, scientific and business skills. New vistas of employment are opening
in support areas such as plant/animal science, food science, processing,
agribusinesses, etc. There is a growing need for quality agri education in the state.
Agriculture is the biggest employer of the State‟s workforce. Quality agri education will
essentially form the foundation of vibrant agri businesses in the newly formed state.
Hence it is imperative that it gives due importance to agricultural education.
Presently the state has:
1. G. B. Pant Agriculture and Engineering University at Pantnagar and its mountain
campus at Ranichauri. G. B Pant University is incidentally one of the best agriculture
education centers in the country.
2. H. M. Bahuguna Garhwal University, Srinagar.
3. College of Commercial Horticulture, Bharasar
Other research and educational institutions like Forest Research Institute, Dehradun,
Rani Chauri hill campus of G. B. Pant University, Kumaon and Garhwal University are
also providing academic training to students.
G. B. Pant University, Pantnagar has remained in the forefront of agri education,
research as well as extension in the country. With the formation of Uttarakhand state it
needs to have more focused approach by generating region specific knowledge and
solutions in order to benefit the people of the state.
It would be desired that special provisions be made to teach agriculture to children in
schools. The children‟s awareness and understanding of our food system is essential,

74
they must be exposed to the necessity of sustainable agriculture practices to ensure that
the future of our food supply is secure.
Programs should be made to educate women in the state as they perform a substantial
part of agricultural work. Even farmers must be encouraged to enroll themselves in the
evening educational programs to know about the latest techniques and best package of
practices. A forum could be created where farmers, scientists and students interact with
each other on a regular basis and learn from each other. Farmers would get scientific
help while academicians would learn the latest problems and undertake research on
relevant and useful topics.
The state is bestowed with abundant natural resources in form of forests, water bodies
and plants of rare kind. What it requires is focused application of skills and knowledge to
make best use of it in a sustainable manner. G.B.PANT and other Agri institutions must
help in bridging this gap and give a fillip to the state‟s agriculture by providing the
requisite skills and technical assistance. There is a need today for more number of
qualified agriculture professionals. Creation of new institutions imparting quality Agri
education is required. But caution must be taken for a sustainable supply – demand
pattern for agri graduates and scholars.
Agriculture Extension: Agriculture human resources play an important role in overall
development of Agriculture. The whole chain in the agriculture development process
(new technology development – awareness – knowledge – adoption – increased
productivity) requires trained manpower at every stage to make the technology initiatives
successful in achieving economic surplus.
Agriculture extension services play an important role in transfer of knowledge from the
laboratory to the field and in developing agricultural human resources. It acts as a
support in adoption process by the farmers and provides inputs at every stage of the
farming process. It is an ongoing process, which maintains a close working relationship
with the farmers.

75
If research and development is the engine of agriculture then Agriculture extension is
the wheel of agriculture. It is said that even if the present techniques, that have already
been developed, are transferred to all the farmers through efficient extension services
then the production will take a quantum jump.
For the state wanting to boost its agriculture economy then its extension services have
to be robust so as to reach the farmers in every nook and corner of the state. Bring to
them efficient, quality and timely services and best practices. This has to be done
through an integrated effort of all the agencies involved in extension services in the
state.
Extension Services in the State : In Uttarakhand today, the extension activity in the state
is carried out by various agencies.
Government: Through it‟s Agriculture department, Horticulture department and
various other agencies and NGO‟s.
Universities: Through its extension department
Multilateral and other organizations: Through NGO‟s
Farmer
Farmer Awareness
Farmer Knowledge
Adoption by the
farmers
Changes in
productivity, increase
in incomes
Agriculture
Exhibit 3-VII
Agriculture Extension

76
In addition to this there are two Krishi Vigyan Kendra in the Garhwal and Kumaun
region. The extension machinery is supported by 5 Krishi Gyan Kendra‟s situated in
different regions of the state.
Similarly the State Agriculture University also has under its preview to carry out its
extension activity. The G. B. Pant University has an extension department, which is
doing extension services in the state. It is presently providing extension services to 11 of
the 13 districts of Uttaranchal. It uses its various research stations, KVK‟s and KGK‟s to
extend extension services.
Even though the State University has an elaborate extension department, the results of
their in Uttarakhand agriculture are yet to be seen. One of the reasons for this could be
the University was earlier catering to the requirements of 28 districts entire Uttar
Pradesh, hence could not devote special attention and focus required for Hill agriculture.
The challenge before the state is to streamline the extension services expertise to the
development of prosperous agriculture in Uttaranchal.
The state has to look into these constraints at priority and to augment the extension
services provided by the University proactively and innovatively for the benefit of
agriculture in the state.
NGO‟s in Agriculture : There are more than 250 active NGO‟s in the state, who have
been working very closely with the rural population of the state. The NGO‟s have been
instrumental in providing a crucial link to the rural masses of Uttaranchal. They also
become well acquainted with the issues and needs of the rural masses.
They work on the specific projects and the achievements made by the end of the project
are not sustainable in most of the cases. The requirement today is sustainability of the
initiatives undertaken. The improvements and developments achieved by the particular
projects should lead to sustainable improvements and development of the target group.
The success stories should be replicated in other regions of the state. The state could
utilize their services by broad banding the specific projects, streamlining and providing a
focused approach to deliver sustainable development of rural masses and region. The
state machinery should facilitate and augment their work with a proactive approach.

77
Even though such an infrastructure is available for extension services, still we find that
Uttarakhand agriculture is at the subsistence level. Looking at the rate of technology
transfer we may conclude that the present system is inefficient. The present system is
unable to provide farmers with timely and practical solutions. The system at present is
less responsive to the changing scenario. These activities are currently taken up as
routine assignments and not as drivers of change.
Given the diverse agro climatic conditions of the state and the difficult terrain. The state
needs to revamp the approach of extension to make it more action oriented and
responsive to the needs of farming community. The state needs to take an area specific
as well as focused approach.
INFRASTRUCTURAL AND INSTITUTIONAL GAPS
Importance of infrastructure in agriculture and rural development are well documented. It
is estimated that 15% of crop produce is lost between the farm gate and the consumer
because of poor roads and inappropriate storage facilities alone, thereby adversely
influencing income of farmers (World Bank 1997). Improved infrastructure also leads to
expansion of markets, economies of scale, and improvement in factor market
operations. The development of rural infrastructure helps to enlarge markets with
greater access to factors of production. Easier access to markets allows an expansion of
the production of perishable and transport-cost- intensive products. It can also lead to a
conversion of latent demand into effective commercial demand. These effects of
infrastructure accentuate the process of commercialization in agriculture and rural sector
(Jaffee and Morton 1995). Further, any investment that helps to increase rural
production, income and employment also helps to reduce poverty.
Roads play an important role in the development of the economy. Bonney (1964)
observed that there was a direct relationship between increase in acreage of export crop
cultivation and the standard of road and distance from main commercial centers. There
is enhanced entrepreneurial activity, sharp decline in freight and passenger charges and
improved service as a result of investment on rural roads. While analyzing the socio-

78
economic impact of a new road, Elmondorf and Merrill (1977) found that road created
inflow and outflow channels of transportation, communication and modernization as well
as migration, both into and out of the community. In this sense, rural road act not only as
a bridge between urban/ developed and poor/ rural/ underdeveloped areas, but also as
agents of diffusion, contact and unification. Improvement in rural roads affects
agricultural development followed by development of social services. It is observed that
roads tend to have a greater initial impact on production where cash crops are grown,
because food crops, grown by small farmers, have a lower price elasticity of supply than
cash crops (USAID, 1972)
Rural Road Network in Uttarakhand State : Presently the state has a total length of road
of 28512 kms (2006-07). The length of National Highways was 2229 km (7.8% of total
length). The share of rural roads was 15968 km. (56%) and it is estimated at 253 kms/
lakh of rural population as against the All India average of 243 Kms / lakh population.
The main issues related to Rural Roads and Bridge Project is as under:-
Inclusion of Defect Liability Clause and its proper implementation: Due to burgeoning
maintenance expenditure of the roads, it is highly necessary to incorporate a clause
in the tender that the contractors / firms shall be responsible for the “Defect liability
period” preferably for five years and in no case less than three years after the
projects are commissioned/ completed. The same may be included and
implemented in true spirit by the Department to ensure proper maintenance of the
new roads and also to ensure the quality of the roads.
Multiplicity of contractors : For effective implementation of Defect Liability clause the
multiplicity of contractors in construction of roads may be avoided and this may also
lead to improvement in road quality during construction.
District wise analysis indicates that Tehri Garhwal, US Nagar, Pauri Garhwal,
Haridwar, Dehradun and Almora districts are having road network equal to the State
average whereas Chamoli, Pithoragarh, Uttarkashi, Rudraprayag, Nainital,
Champawat and Bageshwar districts are having road network lesser than State
average.

79
The maintenance of roads as per the norms of Indian Road Congress and construction,
prioritization of areas in road network planning and effective implementation of Defect
Liability clause, etc. are few aspects which may improve the connectivity of roads in long
term.
Irrigation infrastructure (2006-07) in Uttarakhand State : The Covered Command Area
under State canal was 2.88 lakh ha. and the total Net irrigated area in the State was
3.40 lakh ha.
Issues of irrigation sector
Presently the level of utilization of created irrigation potential is around 62% in the
State. It has been observed that due to absence of proper water distribution system,
the mis-utilization of water and operating charges incurred are on higher side. There
is a need to effectively implement the water distribution system through formation of
WUAs.
In Chamoli, Rudraprayag, Tehri Garhwal, Pauri Garhwal, Uttarkashi, Almora,
Champawat and Bageshwar districts the irrigation facilities are very much on lower
side than the State average and attention needs to be paid in these districts for
increasing the area under irrigation.
Despite of having huge discharge, the time taken for irrigation on per acre basis is on
higher side (varied between 5.35 hrs. to 6.39 hrs.). This clearly indicates that the
water distribution system needs to be revamped on priority basis for minimization of
Operation & Maintenance charges.
Popularization of water saving devices viz., Drip and Sprinkler system particularly in
Horticultural crops among farmers needs to be promoted.
Availability of veterinary facilities : In addition to veterinary hospitals, AI centers and
animal breeding farms may play an effective role in the development of Livestock sector
in the State. The infrastructural gaps identified on animal husbandry and dairy
development (particularly in hill regions) may be prioritized and accordingly some
concrete steps may be taken up for the development of this sector.

80
Issues related to Animal Husbandry and Dairy development
Refrigerators/bulk milk coolers in the societies or enroute are required.
AI centers do not have proper mobility and coverage per unit is very large
particularly in hilly regions.
Intensive fodder development programme may be taken up in the treated Micro –
watershed.
Horticultural infrastructure: Horticulture is one of the critical sector in the economy of the
state. Horticulture provides the much needed opportunity for diversification in agriculture
especially in the context of peculiar topography and agro – climatic conditions of the hill
states where the scope for production of conventional field crops is limited. Horticulture
development is an effective tool for accelerating development in the hills areas due to
limited land available for cultivation, availability of cultivable waste lands and necessity
of supplementary job and income opportunities.
Issues : Support and capacity building service such as nurseries, collection centers with
grading and weighing facilities, fruit preservation centre‟s and training cum skill
development centers need to be developed on a large scale in hill areas of the State.
Agriculture Finance has been recognized as one the crucial inputs to successful and
rewarding agricultural activities in the country. Agricultural finance allows the
farmer/processor to leverage his capacity to invest in the farming/processing activity,
with a direct bearing on his capacity to produce at a higher scale, yield and quality. All
kinds of agriculturists, whether in farming, allied activities or in processing, need to
borrow, and the easy availability of adequate, timely and affordable credit remains the
central objective of any system willing to facilitate agricultural growth.
Financing agriculture in India has not been very popular with Banks and Indian Financial
Institutions. Given a number of structural constrains, both real and imagined, such as
small land holdings, climatic uncertainty, unorganized nature of Indian agriculture, lack
of account keeping systems (since there is no incidence of tax on agriculture and
consequently no statutory compulsion to keep books), banks were reluctant to lend to

81
the agricultural sector. Professional and costly moneylenders were the only source of
credit to agriculture till 1935.
With the passing of Reserve Bank of India Act 1934, District Central Co-op. Banks Act
and Land Development Banks Act, agricultural credit received impetus. A powerful
alternative credit distribution system agency came into being. Large-scale credit became
available with reasonable rates of interest at easy terms, both in terms of granting loans
and recovery. Both the Co-operative and Nationalized banks advanced credit mostly to
agriculture. The former advanced short-term and medium term loans while the latter
advanced long-term loans. The Reserve Bank of India as the Central bank of the
country took lead in making credit available to agriculture through these banks by laying
down suitable policies.
Although the co-operative banks started financing agriculture with their establishments
in 1930‟s, significant growth happened only after Independence when suitable legislation
was passed and policies were formulated. Thereafter, bank credit to agriculture made
phenomenal progress by opening branches in rural areas and attracting deposits.
Fourteen major commercial banks were nationalized in 1969, co-operative banks were
the main institutional agencies providing finance to agriculture. After nationalization, it
was made mandatory for these banks to provide finance to agriculture as a priority
sector. These banks undertook special programs of branch expansion and created a
network of banking services throughout the country and started financing agriculture on
large scale. Thus agriculture credit acquired a multi-agency dimension.
The procedures and amount of loans for various purposes have been standardized.
Among the various purposes "Crop loans" (Short-term loan) has the major share. In
addition, farmers get loans for purchase of electric motor with pump, tractor and other
machinery, digging wells or boring wells, installation of pipe lines, drip irrigation, planting
fruit orchards, purchase of dairy animals and feeds/fodder for them, poultry, sheep/goat
keeping and for many other allied enterprises.
Banks across the country are however increasingly waking up the potential of
agricultural credit, having realized that barring natural calamities and climatic vagaries,
the Indian farmer is a reliable borrower. They have also realized that a more local and
82
area-specific approach where-in the banker understands the specific needs and
situation of the farmer in a comprehensive manner is more efficient rather than a
fragmented approach.
Role of Finance in Agro-Vision for Uttarakhand : Agriculture and Agri-business finance
assumes an even more significant and catalytic role in the development of these sectors
in Uttarakhand, given the high dependence of the State on agriculture and allied
activities. For instance, Uttarakhand produces about 5.80 lakhs tons of fruits, 3.80
lakhs tons of vegetables and 4.28 lakhs tones of potato (1996-97). Out of this only about
1-2 percent is processed. Processing can lead to value addition. Higher margins for
one‟s products cannot be obtained without value addition. Such value addition through
processing, marketing, storage and production of required raw materials requires credit.
Huge amount of credit needs to be pumped in to agriculture sector to provide support to
farmers, which shall in turn give, thrust to agriculture and propel the State‟s economy.
As the agriculture moves from traditional to commercial, from subsistence to
remunerative; importance of credit becomes more pronounced. Now that agriculture
policy of the State is to stress on horticulture, floriculture, medicinal crops etc., the role
of production technology, processing and marketing would be vital. These require
investments from public and the private sector. Apart from production, private
investment can be encouraged in storage, transportation and marketing of agricultural
products. This shall increase the life of perishable commodities, enhance marketability
and thus make agriculture more remunerative. It shall also have a spread effect on
economy of the State as a whole.
In summation, the role of credit in Uttarakhand can be:
1. Provision of timely, adequate and easy institutional credit on affordable terms to the
agriculturists in the state, be they small, large or marginal farmers.
2. Availability of Credit and/or financial assistance for allied activities such as animal
husbandry, medicinal & aromatic plants, sericulture etc.
3. Facilities for availing credit on commercial /soft terms for agri-business activities such
as food processing, agro-processing, organic farming, floriculture, horticulture etc.

83
CHAPTER - 4 MAJOR PROGRAMS / SCHEMES AND IMPACTS
MAJOR PROGRAMS/SCHEMES/PROJECTS OPERATIONAL IN THE STATE
Since 1980s many externally supported programs/schemes and major
Government programs related to Watershed Development have been going on in the
State. Drought Prone Area Program (DPAP), Integrated Wasteland Development
Program (IWDP) and National Watershed Development Program for Rainfed Areas
(NWDPRA) are the major centrally sponsored programs being implemented in the State
by the Rural and Agricultural Departments (Annexure Table 4.1, MAP-7- State Map showing MWS’s treated by DPAP/IWDP/NWDPRA).
Apart from this, Ram Ganga River Valley Project (RVP) and Flood Prone Area Project
(FPAP) are the schemes being implemented by the Forest Department of the State
which are centrally sponsored in Macro Mode by the Ministry of Agriculture. Ram Ganga
Valley project was started in the year 1962. The main aim of the scheme was to protect
the Dam constructed on the Ram Ganga River near Kalagarh from excessive siltation
and to increase the life of the reservoir. The main works under the scheme are
afforestation, pasture development treatment of the arable land, plantation of
horticulture tree species, Drainage Line Treatment and Soil and Moisture Conservation
works. The Flood Prone Area project is being implemented since the year 1981-82
under the scheme the Upper Ganga and Upper Yamuna basin above Tajewala has
been taken up for treatment of Flood Prone areas. In this scheme plantation, soil and
moisture conservation works, Drainage Line Treatment, Agro Forestry and Afforestation
are the major works being carried out.
The Forest Department is also implementing catchment area treatment plans
(CAT) in the areas forming catchment areas of the various Micro Hydel Projects which
are under construction on various rivers of the State. These CAT plans are a part of the
Compensatory Afforestation Plan of the various Land transfer proposals for these micro
hydel projects. These plans are mainly being implemented in the forests areas of the
catchments concerned. The major works being carried out are Drainage Line

84
Treatment, Afforestation, Soil and Moisture Conservation Works (MAP-8- State Map showing the areas covered by CAT Plans)
The Watershed Management Directorate since 1982 has been implementing
externally aided watershed projects in various micro watersheds of the State. At present
World Bank Aided Uttarakhand Decentralized Watershed Development Project
(UDWDP) is being implemented the project period is from Sep 2004 to 2012. It
proposes to cover 2348 sq. km. of area covering 76 MWS, 11 districts and 18 blocks.
Till the start of this project 193 MWS covering an area of 7592 sq. km. had already been
treated under various externally aided projects (MAP-6-State map showing MWS’s
Treated by WMD)
Drought Prone Area Program (DPAP) is one of the earliest area development program
launched by the Central Govt. in 1973-74 to tackle the special problems faced by those
fragile areas which are constantly affected by severe drought prone conditions. Till now,
117 MWS have been partly treated under this program and works in parts of 729 MWS
is on-going. The major lacuna of this program has been that forest areas were not taken
up for watershed treatments. Uttarakhand State being forest rich State as a result major
areas have been left out.
Integrated Wastelands Development Program (IWDP), a Centrally Sponsored Program,
has been under implementation since 1989-90, and was transferred to the erstwhile
Department of Wasteland Development (now Department of Land Resources) along
with the National Wasteland Development Board in July, 1992. From 1 April 1995, the
program is being implemented through watershed approach. The development of
wastelands and degraded lands under the program is expected to promote the
generation of employment in the rural areas besides enhancing the participation of
people at all stages leading to sustainable development of land and equitable sharing of
the benefits. IWDP envisages the development of non-forests wastelands in the
country. The basic approach in implementation of this program has been modified from
1.4.1995 when the Guidelines for Watershed Development through watershed approach
came into force. Since then, projects for development of wastelands on micro

85
watershed basis are being sanctioned. From 1999-2000, new IWDP projects are
prioritized for sanction in consultation with the State Governments.
The basic objective of the program is aimed at an integrated development of
wastelands/degraded lands based on village/micro watershed plans. These plans are
prepared by the Watershed Associations/ Watershed Committees with the technical
guidance of the Watershed Development Teams of the Project Implementation
Agencies (PIAs) after taking into consideration the land capability, site condition and
local needs of the people. The Program aims at fulfillment of the following objectives:
Developing wastelands/degraded lands on watershed basis, keeping in view the
capability of land, site conditions and local needs promoting the overall economic
development and improving the socio-economic condition of the resource poor and
disadvantaged sections inhabiting the program areas. Restoring ecological balance by
harnessing, conserving and developing natural resources i.e. land, water, vegetative
cover.
Encouraging village community for:
(a) Sustained community action for the operation and maintenance of assets created
and further development of potential of the natural resources in the watershed.
(b) Simple, easy and affordable technological solutions and institutional arrangements
that make use of, and build upon, local technical knowledge and available material.
The main aim of the project is employment generation, poverty alleviation,
community empowerment and development of human and other economic
resources of the village.
In Uttarakhand State 134 MWS in all the 13 districts have been taken up for treatment.
It is proposed that about 3 lakh ha. wasteland would be treated through this program.
NWDPRA is a centrally sponsored program for scientific land use through development
of integrated farming system on the principles of watershed management in each
mandal where the arable area under assured means of irrigation is less than 30%. The
objectives of the program are: conservation, development and sustainable management

86
of natural resources including their use, to enhance agricultural productivity and
production in a sustainable manner, restore ecological balance in the degraded and
fragile rainfed eco-systems by greening these areas through appropriate mix of trees,
shrubs and grasses, to reduce regional disparity between irrigated and rainfed areas
and creation of sustained employment opportunities for the rural community including
the land less.
In our State 403 MWS have been sanctioned for treatment in 71 Rainfed Blocks. Works
in 230 MWS has been completed But again it has to be noted that only a part of arable
area of these MWS have been treated and also forest areas of these MWS were not
taken up for soil and water conservation measures.
Watershed Development supported by CAPART, Sir Ratan Tata Trust and other Donor
Agencies: Several watershed development projects are also being implemented by
NGOs funded by CAPART, Sir Ratan Tata Trust.
The various Watershed Development Schemes being implemented in the State with
area covered Number of watershed sanctioned and completed has been depicted in
(Annexure Table-4.1). Essentially DPAP, IWDP, NWDPRA and other major schemes
are being implemented in the State. Apart from this, FPR, RVP and CAT Plan are being
implemented by Forest Department MWS wise essentially for the treatment of forest
areas. Externally Aided Projects being implemented by Watershed Management
Directorate are being implemented mainly in the villages and the surrounding village
community forests.
Rainfed Areas and degraded areas being treated through various schemes and
projects has been depicted in the enclosing (Maps 6, 7 and 8). The Watershed Map the
State with district boundaries is being depicted in (MAP-3- State Map showing Sub Watershed and Microwatershed Boundaries). The MWS proposed for treatment in
the four plans is being depicted in (MAP-9- State Map showing the areas proposed for
treatment under IWMP) and district wise maps showing MWS proposed for treatment
are depicted in (Maps 10 to 21)

87
ANALYSIS OF VARIOUS PROGRAMS/ SCHEMES
The schemes implemented by the Department of Agriculture and Rural Development
have not been analyzed on the basis of their impact on biophysical, social, economic
and environmental aspects. The analysis of the various externally aided projects being
implemented by the Watershed Management Directorate is as follows:-
Doon Valley Integrated Watershed Management Project
The Doon Valley Integrated Watershed Management project was prepared in 1990s as
a participatory, process project. Project implementation started in mid–1993 and
completed in December 2001. The main activities were centered on people and the
implementation has been on a rolling year program of 3-4 years in each 300 villages in
the Doon Valley, Bhagirathi and Bhimtal areas.
The project was perceived by many as having been a success. But “Success” can be
measured in different ways. Conventionally, we look at the outputs against the
objectives. However, different stakeholders may have different interpretations of the
outputs and indeed, the relevance of the original objectives. A further parameter could
be the sustainability and replicability of the processes and methods developed.
Some of the factors that helped to achieve this apparent success were:
Objectives: The objective of the project were:-
Primary objective
Arrest, and as far as possible, reverse the ongoing degradation of the Doon Valley
Environment
Since people have been the agent of change in the process of degradation, they
were placed centrally to the Project objectives and strategy.
Subsidiary objectives
Involve the local population in all stages of planning, implementation and
management of project activities.

88
Improve the quality of life of rural people so as to enable them to remain in the rural
areas and to be positively involved in the management of the environment.
The project particularly focused on women and the improvement of their situation by
reducing their work loads and enabling them to generate income other activities.
Achievement of objectives
The traditional watershed objectives of reducing degradation.
Socio economic objective of improving the quality of life of villagers, especially of
women, and to involve communities so that they will be able to better manage their
own environment in future.
From a series of formal impact studies, conducted by the project staff and by the
Technical Assistant Team (TA), using participatory methods, it was apparent that there
had been overall success in meeting the objectives. Average scores of over 65% had
been achieved for the overall impacts of project physical activities. Similarly, sectoral
impact studies by the TA team had indicated significant success in meeting the
objective in terms of forestry, fodder, agriculture, horticulture, livestock, irrigation and
soil and water conservation.
In terms of socio- economic impacts, the project had been successful in involving
people in the planning, implementation, maintenance and monitoring of interventions.
Environmental awareness had been raised and women had become positively involved
in decision making. Village organizations set up to manage watershed activities and,
through reciprocal contributions had developed viable revolving funds for future
maintenance of assets and loaning to members. The GAREMA‟s had achieved an
encouraging degree of sustainability and many had formed “federations” (COREMA‟s)
for mutual support. Moreover, the previous dependency syndrome, geared to
government subsidies, largely had been replaced by a sense of self- reliance. This
augured well for future management of the environment by the communities.
Although inputs were primarily land based, impact studies showed that some success
had been achieved in targeting the “focus” group of poor, land–less and disadvantaged

89
people. Not all focus group members had been able to benefit and there had inevitably
been some favoring of the elite. However, most communities themselves had become
aware of such disadvantaged groups.
The project was therefore largely successful in meeting the socio- economic objectives
and in involving people, especially women. Progress was undoubtedly made in arresting
the on-going degradation of the Doon Valley environment. Mainly through efforts at
village level to reduce pressure on the forests.
Integrated Watershed Development Project (Hills- II)
Project Period: 1999 to 2005
Principal Performance Ratings
Outcome: Satisfactory
Sustainability: Likely
Institutional Development
Impact:
Substantial
Assessment of Development Objective and Design and Quality at Entry
Original Objective: The original development objective was to improve the productive
potential of the Project area using evolving cost effective watershed treatment
technologies and community participation approaches. The secondary objective was to
assist the project state with institutional development and consolidate progress made
under various programs
Assessment: The Shivalik area in Uttaranchal includes parts of 98 micro watersheds
out of which at the start of the project 17 micro watersheds extending over 1237 sqkm.
were selected. After the MTR the area was increased to include total 24 micro
watersheds covering an area of 1573 sqkm. and covered 493 of 505 villages.
The Project Development Objectives (PDOs) were highly relevant to the development of
mountainous region of the then UP later reorganized to Uttaranchal where the
population is dependent on agriculture and on the natural resources in their vicinity, for

90
fulfilling requirement of fodder, fuel wood, minor forest produce. The area of Shivalik
had low productive potential and was ravaged by vagaries of erosion of soil and loss of
land due to stream, forest fire, bank erosion flash floods.
The project design followed the Shivalik watershed development strategy prepared for
the state and subsequently establishing the Watershed Management Directorate
(WMD) as the nodal agency in the state for planning and monitoring all watershed
projects and project implementation agency had borne results not only in the Shivaliks,
but also in other watershed projects in the state.
Prior to IWDP the WMD had implemented four externally aided watershed projects and
was in the penultimate year of the fifth watershed project namely, Doon Valley Project
financed by the European Union. The project design, the project appraisal documents
and the safe guard policy of the Shivalik project were qualitatively and conceptually a
large improvement. The WMD and also the Government of Uttaranchal benefited from
the well structured project design and implementation arrangements.
The PDOs, were also in line with the state‟s strategy aimed at supporting rural
development through generation of self-employment, (e.g. entrepreneurship, credit
linkages, cost sharing in development initiatives) and institutional reforms (e.g.
beneficiary participation, demand-driven funds, re-orientation of public sector functions).
This were also consistent with national strategy for hill area development and also was
framed to fulfill the Country Assistance Strategy (CAS) goal of attaining sustainable
development of agriculture, water and rural areas as key to poverty alleviation. Further
the project also handled the complexity in the targeted areas due to geographical
spread, altitude, slope, aspect, soil, climate and land use which constitute serious
inherent risks as well as anthropogenic differences between Garhwal and Kumaon Hills.
Revised Objective: The original development objective remained the core. But in view
of the sector related Country Assistance Strategy (CAS), hierarchy of objectives in PAD,
observations of Mid-Term Review Mission, the development and associated objectives
given in the Project Implementation Plan (PIP), and the objectives set for M&E
Consultants, the objectives got transformed with greater focus as under:

91
The overall aims and objectives of the project were to:
Slow down and reverse the degradation of natural environment (using appropriate
soil and moisture conservation technology);
Conserve soil and water through in-situ moisture conservation, water harvesting and
land management practices;
Increase and improve the production and income from agriculture, horticulture,
fodder, fiber, fuel wood and livestock (through the process of soil and water
conservation and other inputs)
Reduce flooding and devastation (caused by erosion of soil)
Briefly the main immediate objectives of the project were to:
Improve the productive potential of the Shiwalik hills in Uttaranchal
(using/appropriate watershed treatment technologies and participatory approaches);
Assist institutional development;
Generate and develop additional livelihood opportunities and
Consolidate progress already made (in unifying approaches to watershed
development/management among various programs operating in the Shiwalik hills).
Original Components : Broad and sub-component areas were:
Watershed Development (Protection and Restoration) Treatments for:
a) Natural resources conservation, development and management – on (i) Non-arable
lands, (ii) Arable lands, (iii) Drainage lines through forestry, soil conservation and
water sources development.
b) Improved and diversified farming system – covering agriculture, horticulture, trees
on non-forest lands and vermin composting, organic farming and IPM, in other
words, bio-fertilizers and bio-agents, livestock and poultry development.
c) Rural infrastructure development – road, bridle track, market and support
permanent assets.

92
d) Strengthening and developing institution – such as VDC, SHGs, UGs – linkage
through clusters, associations/federations to agencies that help improve marketing
and return as well as procurement of inputs for farming and IG activities.
e) Human resource development by capacity building in technical and management
skills, awareness, empowerment, etc.
f) Policy changes and strategic shifts and development – in cost sharing, reduced
subsidy, implementing through community, marketing logistics, maintenance and
repair, revolving fund, withdrawal, etc. and also on integration of activities at various
levels.
Revised Components: Broad and sub-component areas remained same. However,
within sub-component areas additional activities were introduced following Supervision
Mission report and also targets were revised upward in many cases. Amongst the
additional activities few important ones were as under:
Arable land: Top working of mehal/pear, poly-house and poly tunnel
demonstrations, bio-compost demonstration and community fruit plantations
Non-arable land: Bamboo and agave plantations
Livestock & Fodder: Plot border plantation of Napier on farm land, grass and fodder
plants in strips /row, patches in existing forest areas, backyard poultry
Social & Economic: Introduction of Social Funds
Institutions: Associations/Federations and Linkages with marketing bodies, NGOs,
etc.
Achievement of Objectives and Outputs
Outcome: Watershed Protection and Development
Regenerating natural resources base: Satisfactory: Overall key project objectives
have been achieved. Notwithstanding inherent severe risks due to altitude, slope,
soil, land use and rainfall, the degradation processes have been substantially
arrested on 16.5 percent of arable, 16.7 percent of non-arable land in drainage lines
through a combination of soil and water conservation structures, vegetative
treatments, planting by forest, forage and horticultural species and grasses.

93
Project objective of regenerating environment towards its natural state has been
achieved reasonably by of way reduced soil loss, direct protection to 4453 ha from
getting irreversibly lost and restoring some area to productive uses, creating green
stock over large area that can absorb CO2 and release O2 in significant quantities, set
processes for improving Source of Carbon Stock and hydrologic regeneration over
extensive areas.
Similarly, conservation practices like plot border planting with terrace repair on-arable
land and contour trenching on non-arable land for in-situ moisture conservation was
achieved while water harvesting structures, ponds, irrigation tanks, roof rain water
harvesting tanks numbering 6248, wells and lifts etc. created irrigation potential at
micro-level over extensive area as the most effective input for diversification and higher
productivity.
Enhancement of Biomass Productivity: Satisfactory : Project succeeded to improve
productive potential of both arable (crop lands) as well as non-arable lands
significantly on the foundation treatments as mentioned above. Progress
components like CAD, minikits, HVC coupled with improved inputs like irrigation,
compost, better seeds etc. helped push the productivity to far higher level such as
between 31 and 17% coverage for irrigated crops and between 29 and 17% for
rainfed crops, cropping intensity to 191 percent and irrigation intensity to 174%.
Horticulture had taken a long stride by both raising fruit plants on uncultivated land
and cultivating vegetables on farms besides medicinal and aromatic plants which
opened up new avenues for employment and high income.
Further by developing organic farming in 36 percent of project villages and stall feeding
through 10010 mangers, modern agriculture could be put on course to be environment
friendly. Whereas, massive planting on non-arable and ex-situ areas created high stake
for areas with erstwhile low productivity as the planted areas have attained real potential
of good to very good economic returns on 19490 ha.
Improved Rural Infrastructure: Satisfactory: Improved infrastructure development in
the form of village roads, bridle track and bridges has improved connectivity and

94
reduced time required for schooling, fetching fuel, fodder and water and other social
travels in 441 villages. Similarly drinking water has been taken to benefit both human
beings and animals of villages.
Outcome: Institutional and Social Changes
CBOs, Community Participation: Highly Satisfactory: Through formation of VDC,
SHG, User Groups and Van Panchayats, multi dimensional community participation
could be obtained. Whereas, by building capacity through training, exposure visits
and decentralized workshops in a variety of technical and management skill of
beneficiaries, some of the project activities could be carried through them. These
have benefited 39,737 villagers including 23,792 (60%) females and also 13,866
(47.5%) persons from BPL families.
Economic and Social Empowerment: Satisfactory: Due to creation of revolving funds
for VDCs (Rs.15.71 million), saving funds for SHGs (Rs. 8.06 million) and
operational funds for User Groups (Rs. 2.48 million), they could take many initiatives
in implementing the project plan, in undertaking IG activities and for collection and
marketing of produces with higher income. A total of 24,405 villagers including 71%
women and 33% persons from BPL families were trained in 795 skill improvement
courses, while 5420 persons were sensitized through exposure visits in five major
areas concerning social and economic sustainability. Consequently live cases
became available of technical and financial empowerment through additional income
from IG activities, better farming and project activities especially amongst women
and BPL families.
Economic Viability and Sustainability: Satisfactory: Economic analysis for eight
major component areas and project as a whole (excluding cost on
administration/coordination) revealed an Economic Rate of Return (ERR) of 19.9%
and with cost on coordination included ERR was 18%. These values were higher
than those given in PAD. Project implementation has been an economically viable
one as a whole and also individually crop cultivation, horticulture, livestock, forest
plantations, infrastructure development, institutional and social changes and soil

95
conservation. Similarly, analysis of project outcomes, if these have contributed to
sustainability, carried out separately for all three broad PAD sets namely, watershed
protection and development, institutional and social development and finally
economic and financial viability, revealed that institutional and social development
contributed handsomely towards sustainability, and interventions for improving
production potential also contributed quite reasonably but those for watershed
protection did so only in fair degree. Thus project as a whole could be rated good or
fairly strong or as likely sustainable.
Uttarakhand Decentralized Watershed Development Project
Project period 2004-2011, Project at a glance till 2008
A World Bank funded community based Integrated Watershed Project.
Project cost is about $89.35 million with State share of about 18.6% and beneficiary
contribution as 3.5%.
Commencement of Project since September, 2004 with a Project period of seven
years.
The Project area is 2348 sq. km. spread over 76 selected Micro watersheds in
middle Himalayas at an altitude of 700 mt. to 2000 mt.
The Project operates in 18 blocks of 11 districts of the State.
The Project aims to treat about 468 selected Gram Panchayats with Gram
Panchayat as planning, implementing and monitoring agency at the Panchayat level.
Project activities initiated in 467 GPs and at different phases of Project
implementation.
616 Farmers Interest Groups (FIGs) have been constituted.
466 Gram Panchayat Watershed Development Plans (GPWDPs) have been
finalized by March, 2009 and are under different stages of implementation.
Under farming system improvement, improved varieties of crops have been
demonstrated in 560 ha. under compact area demonstration and various varieties of
off-season vegetables were demonstrated in 378 ha of area.

96
Under horticulture activities 416 orchard development and 344 ha. high value crops
and medicinal/aromatic plants were demonstrated
Under livestock activity fodder crop demonstration in 183 ha. and pasture
development in 271 ha. have been carried out.
Under Capacity building 408 staff members and 69442 community members
including PRI members have been imparted training during the year.
Under GPWDP, 46322 m3 agriculture terrace repair, 2052 ha. Agriculture &
vegetable minikits demonstration were carried out.
Under drainage line treatment in 118580 m3 soil conservation structures were built
during the year.
Under GPWDP, 48 Km. irrigation channel, 393 irrigation tank, 2589 roof water
harvesting tank and 88 village pond were carried out.
Expenditure details- During this year the total expenditure was 71.9062 crores, thus
having a cumulative expenditure of 189.3016 crores since the inception of the
Project excluding beneficiary contribution. So far the Project has received a total
beneficiary contribution of about 14.3698 crores since the inception of the Project.
First round of Participatory Monitoring and Evaluation (PME) in 342 GPs, second
round in 242 GPs, third round in 118 GPs and forth round in 42 GPs were carried
out.
Mid Term Review impact as reported by The Energy Resources Institute (TERI),
New Delhi
1. Social mobilization has resulted in formation of community institutions viz. 447
WWMC, 930 RVC, 585 FIGs.
2. Approx. 70% of target households were found to be involved in preparation of
GPWDP.
3. The women focus in the project has resulted in high participation of women in
project activities.
4. Up to 52% benefits found to be flowing to „C‟ category household which constitute
the vulnerable groups in the project.

97
5. The number of people provided labour from the vulnerable group for works has
been found to range from 60%to100%.
6. Demonstrations of improved varieties have resulted in crop diversification as well
as enhancement of productivity of crops.
7. The aggregate increase in area under improved varieties is found to be 7%.
8. Increase in area under improved varieties of paddy is 5.07%, wheat 8.52%,
Madua 10.92%, maize 14.14%, Tomato 332.88% and Cauliflower 189% in
sampled GPs.
9. Increase is seen in productivity of agriculture and horticulture crops due to
adoption of improved varieties. Productivity increase of 15.61% in paddy, 10% in
wheat, 24.5% in Madua, 13.03% in maize, 14.10% in tomato, 10% in cauliflower
was observed.
10. Adoption of improved farming techniques by the farmers in the project area is
observed.
11. Under Agribusiness, approx. 5368.5 tons of vegetable produce has been
marketed from the project area. The gross returns have been to the extent of Rs.
444.8 Lakhs.
12. Market linkages with Mother Dairy and other local and outside Mandies are
established.
13. Increase in income from project intervention is approx. 12% in sampled villages
(After adjusting for inflation).
14. Increase in fodder availability across all categories is about 3%.
15. Shelters and Mangers have increased the usage of stall feeding practices.
16. Extent of irrigated agricultural land has increased by 10% in sampled GPs.
Relative contribution of sources is as follows: Canal/ Gul- 54%, Tank- 23% and
water harvesting structure- 1%.
17. PME has evolved as a forum and process for involving stakeholders in monitoring
the project implementation progress (quality and quantity). It is also turning out to
be an important feedback mechanism from the stakeholder to the project.
18. Leadership building amongst community members in the project area observed.
About 66 community members associated with the project as motivator, assistant

98
accountant, members of RVC, VG, FIG and SHG have been elected as Gram
Pradhan or ward member in the Panchayat elections held in Sept. 2008.
19. About 94% of the families in the sampled GPs were found to be aware of the
project objectives while 87% of families were aware of content of respective
GPWDPs.
20. Up to 55% increase in frequency of Gram Sabha meetings has been observed in
sampled GPs. Further increase in attendance is up to 60% while participation of
women and vulnerable group members is 91% and 72% respectively.
21. 92% of sampled GPs report enhancement in capacity to maintain accounts. The
annual audit of GP account by a firm of Chartered Accountants empanelled with
CAG has been conducted in all the GPs up to 2006-07.
22. An average increase of 101% in number of project related GP meetings was
observed in sampled GPs while increase in attendance was found to be up to
39%.
23. Administrative capacity of staff has also increased.
24. Action taken on 84% of monitoring reports (that needed action)
25. About 72.49 lakh mandays have been generated in the project since inception of
the project.

99
CHAPTER - 5 ISSUES AND CHALLENGES
The state of Uttarakhand is a region of outstanding natural beauty with tremendous
potential for sustainable growth and development. The northern region of the State is
part of the Great Himalayan Range, covered in snow and glaciers. Other parts of
Uttarakhand are covered in dense forest making up the bulk of its natural resources
base. The largely mountainous nature of the state endows it with a unique
ecosystem that is home to a large number of flora and fauna. Two of the Indian
subcontinents most important rivers - the Ganga and Yamuna also originate from the
glaciers of Uttarakhand.
After attaining statehood in 2000, the economic progress of Uttarakhand has been
rapid, with its economic growth rate increasing from just over 3% per annum to 11%
per annum. However, this rapid growth has been accompanied by adverse impacts
on the local ecology, thus making the incorporation of sustainable development
practices into the State‟s overall development strategy an imperative.
Water, agriculture, forestry and energy, among other issues, are central to the
State‟s inclusive strategy for future growth. Most of the people of this state are
dependent on their natural environment, with over three-fourths of the total
population dependent on agriculture for their livelihood. Also, with over fifteen
important rivers and over a dozen glaciers in the State, Uttarakhand is a valuable
fresh water reserve. There are also about 200 large and medium sized hydro-
projects and therefore hydroelectricity continues to be a prime source of capital for
the local economy. Forests cover a large percentage of the land area with many
industries being forest based.
CHALLENGES FOR FOOD SECURITY
Subsistence agriculture is the prime source of livelihood and employment of more
than seventy percent of the population in Uttarakhand. It accounts for about thirty-
seven percent of the Net Domestic Product of the state. Agriculture in Uttarakhand is
very complex and is interlinked with crop husbandry, animal husbandry and forestry

100
to form a production system. Inaccessibility, environmental heterogeneity and
ecological fragility have favoured evolution of subsistence production system in the
hill state. Presently about twelve percent of the geographic area is under cultivation
in the state.
The total geographic area of Uttarakhand has been divided in to four physiographic
zones on basis of mean altitude from the sea level. Tehri, Bhawar, and low lying
valley up to 1000m (Zone A) have hot and humid climate and support crops like
paddy wheat, litchi, pulses etc. The Subtropical Zone lies in between the altitude of
1000m to 1500m and is capable of growing a diverse range of crops including
horticulture crops. The area lying in the altitude of 1500m to 2400m classify as
Temperate region, and hence support a large number of temperate fruit cultivation,
floriculture as well as medicinal plants. The region above the altitude of 2400m is
further classified as Sub-Alpine as well as Alpine Zones. This region is not fit from
agriculture point of view and is used as pasturelands and is a store house of
medicinal herbs. The diverse agro-climatic condition of the state gives it a unique
advantage as well as a competitive edge over other states in production of
vegetables (offseason vegetables in context of plains) that fetch high value in the
market. The challenge before the state is to identify crops suitable for each zone
depending on the climatic conditions, soil texture so as to have a focussed approach
in development of the agriculture in the state.
As most of the area is under forests and wastelands this leaves behind only a small
amount of land (about 12 percent) for cultivation. Among the cultivated land about 50
percent of the landholding is submarginal and further 21 percent of the land is
between 0.5-1 hectare. Thus we find that about 70 percent of land holding are less
than 1 hectare in size and cover about 27 percent of the area under cultivation. While
about 26 percent of land holdings are between 1 to 4 hectares in size covering about
51 percent of the total cultivated area. Also just over 3 percent of land holdings are
above 4 hectares in size and cover about 22 percent of the total cultivated area. As
large number and area is under small and marginal holdings, scale of economies
cannot be availed of, and so the input cost per unit of output is higher. Therefore it
becomes all the more difficult task to make agriculture a profitable occupation.

101
Thus the main issues which need to be addressed are:-
Untapped diversity;
Identifying niche areas for developing specific crops;
Acidic & shallow soils in Hills due to soil erosion;
Decreasing humus content in soils in plains due to high use of chemicals;
Social inequalities as there are fragmented and scattered land holdings and there
are limited opportunities of diversifying the crops due to smallholdings;
Area under Pulses and Oilseeds are currently low;
Productivity of the hills very low;
Gender inequality as women workforce in agriculture constitutes to about 80
percent;
Agriculture in the state is rainfed;
Very high transportation cost for agricultural marketing.
CHALLENGES FOR WATER SECURITY
The annual rainfall in Uttarakhand is 1700 mm (NABARD 2004); however the total
number of rainy days is about 100; and most (95%) of the precipitation that falls in
the catchment area as surface water, is lost due to steep slopes and mountainous
terrain. The total annual requirement of the human population, animal population,
agriculture and industry is estimated to be around 3% of the annual precipitation
received.
The state has about 0.55 million ha of un-irrigated land and the majority of it falls in
the hilly areas of the state, which is also home to the poorer sections of the
populace. 47.42% of persons in the state are Below Poverty Line (Planning
Commission 2006) and the most vulnerable sections are living in the hilly areas of
the state.
Given the dependence on glacial melts for water the state‟s vulnerability to water
resources has increased with fast receding glacial melts and the consequent

102
changing hydrological patterns. Hydrological studies over the last decade
corroborate that water resources in the state are decreasing and there is an
impending crisis, which can be illustrated by.
receding glaciers in the Great Himalayan Zone;
long term decreasing trend of stream discharges;
dwindling capacities of lakes;
increasing surface runoff on the hillsides ;
an increase in floodwater and decrease in base flow water in channels and rivers;
extensive soil erosion and landslips have become a recurring phenomenon in the
region.
These changes at the state and national level would impact the community adversely
as the pressure on natural resources and environment would compound; water
availability in the rivers would be affected; crop yields could decrease, therefore
raising concerns on food security in the long run; and health concerns due to floods
and droughts are expected to rise in the country due to projected changes in the
hydrological cycle.
The Human Development Report also highlights the complexity of climate change
patterns with respect to projections for India. The changing rainfall pattern would also
affect agriculture and one factor that will shape the profile of winners and losers is
the adaptive capacity of the farmers to the changing precipitation levels. Hence,
there is a need to build capacities of the farmers to adapt to these variations. Risk
would especially be skewed towards producers who depend on rainfall and lack
assets to adapt through investment Strategies for mitigating risk for farmers and
providing better facilities need to be worked upon.
Country level estimates of the „water stress‟ indicator, also indicates that India falls in
the category of water stressed countries. In India, the demand for water resources
has increased manifold with urbanization, agriculture expansion, increasing
population. Concurrently, there has also been a change in cropping pattern, land use
pattern and over exploitation of water resources to meet the needs of the growing
population in the urban and rural areas; this has affected the hydrological cycles in
many regions in the country. There is not much data available which indicates the

103
possible impacts on natural resources due to climate change; hence, the need to do
extensive research to study these impacts. For instance, there is not enough work on
the impact of hydroelectric power on local and regional climate. Research on various
aspects is also essential to take informed decisions or precautionary steps for
sustainable development of natural resources to mitigate negative impacts.
National Water Policy 2002: The NWP 2002 emphasizes an appropriate
reorientation/re-organization of institutional structures and mechanisms to initiate a
participatory approach to water resource management by involving beneficiaries and
other stakeholders in the project planning stage itself. However, the policy does not
indicate how such participation and local water initiatives could be put into practice
and is weak on conceptualization of community involvement and management.
Draft Water Policy of Uttarakhand (dated: 3rd November‟ 2005): Given the national
context, the draft state water policy of Uttarakhand in its vision statement declares
water as a basic human right; emphasizes on the need for conservation and
development of water resources to achieve developmental goals (sustainable
agriculture development, harnessing potential hydropower and industrial
development); and envisages the participation of all tiers of Government in
management and use of water resource. The water allocation priorities in the state
water policy are in sync with the NWP 2002. However, the policy also states that the
local self-government institutions could modify these priorities of water use as per
actual needs. The draft water policy also asserts that priority shall be given to
identification and rejuvenation of traditional water resources like Naula, Dhara, Guls,
Ponds, etc in the state.
CHALLENGES FOR FEED AND FODDER SECURITY
Serious constraints in the availability of feed and fodder in the country has forced the
government to study the “economics of fodder” for devising a strategy to deal with
the crisis which may adversely impact the agricultural growth in the country. Unless
we ensure the availability of feed and fodder, the productivity of livestock would not
increase. The livestock sector would play a major role in tackling the problem of food
security in coming years. The estimates by many researchers during the last few

104
years have indicated that the supply of green fodder in 2003 was only 389.81 million
tonnes (mt), while the demand was 1,025 mt, a huge deficit of 61.96%.
According to Ministry of Agriculture, contribution of livestock to total GDP has
increased from 4.8% during 1980-81 to about 6.5% during 2002-03 and is currently
5.3%. The contribution of livestock to agriculture GDP has gone up from 13.8% in
1981 to 23.8% during 2002-2003
In rural areas there is the crisis of fodder for livestock. In rural India, domestic
animals are engines that drive the economy. They provide resilience and wealth
people cope with adverse conditions because of their livestock. But no policy exists
on how to feed these 500 million or so animals. Areas today aren‟t fodder-secure,
and the grim reality is that food security in this country is not possible without fodder
security.
Animals survive by foraging on available land and on agricultural residues. But the
productivity of our common lands-forest and revenue land - are pathetic; grass yields
on these are mostly illusionary. Sheer grazing pressure ensures animals literally
nibble away a pasture‟s productivity, suppressing regeneration of grasses and tree
fodder. Add to these the fact that agricultural production is stagnating, or that farmers
are shifting to crops that do not yield fodder.
This crisis of fodder security is of a great magnitude as first, it concerns the very poor
that depend on livestock to survive another tomorrow. Second, it relates to the
country‟s most neglected lands: common forests. Third, it is about neglected
animals.
The villagers maintain poor quality of livestock which have very low milk yields and
the problem is also that animals with higher milk yields - the crossbred cows our
planners are fond of-need better quality fodder. These animals do not forage on
degraded land; they require stall-feeding. Improving the animal economy, then,
demands on improving the quality and quantity of fodder available to livestock. But
this has simply not been planned for, or done.

105
The fact is that the fodder crisis is part of the larger land and water crisis of rural
India. Better agricultural productivity on private lands is a sure-shot source of
additional fodder. But this productivity is limited by the non-availability of water to
irrigate crops. That is why the villagers need to take their animals to graze in
forestlands. Part of the problem is there is no water to grow crops, and so, no
agricultural residues for animals to eat. Water then becomes the first enabling tool. It
is, therefore, imperative that we link fodder security to water security - building water
recharge structures for irrigation.
The third concern relates to the largest grazing lands-the common lands-degraded
through sheer pressure. It is understood these lands ought to be regenerated. But
what needs to be further understood is that such regeneration is not possible without
factoring in the animal economy. Building boundary walls to keep grazing animals
out will not succeed; the pressure is too great. Planting of fodder yielding species is
required in the common lands to meet the fodder demand. Thus, here the fodder
security for livestock is linked with forest security - replanting and regenerating our
vast common lands.
CHALLENGES FOR ENVIRONMENTAL SECURITY
„Climate change refers to a statistically significant variation in either the mean state
of the climate or in its variability, persisting for an extended period of decades or
longer (IPCC, 2001). The United Nations Framework Convention on Climate Change
(UNFCCC), in its Article 1, defines climate change as “a change of climate which is
attributed directly or indirectly to human activity that alters the composition of the
global atmosphere and which is in addition to natural climate variability observed
over comparable time periods”.
As per Chapter 13 Mountains: Fragile Ecosystems in Peril of Agenda 21 highlights,
“mountains are important sources of water, energy, minerals, forest and agricultural
products and areas of recreation. They are storehouses of biological diversity, home
to endangered species and an essential part of the ecosystem”. Mountain
ecosystems having unique climatic and biophysical conditions house rare species of
flora and fauna as compared to those habiting lowland areas with widespread

106
ecological niches. Mountain ecosystems also constitute an important element of the
hydrological cycle hence both influencing climatic conditions and being impacted
them. Sudden changes in critical variables such as temperature and precipitation
can adversely impact the snow and ice cover, glacial flows and hence impact life and
livelihoods of communities downstream.
Thus the State of Uttarakhand having immense natural resource endowments in the
form of forest and water resources, high livelihood dependency on a climate-
sensitive sector such as agriculture and with about 36.5% of the population below
poverty line, is at high vulnerability to climate change.
Impact on Water resources: The Himalayas constitute one of the most important
glaciers systems in the world and contribute to 69% of India‟s freshwater. The
Gangotri glacier in the Uttarkashi district of Uttarakhand has been receding at the
rate of 20-22 m annually, with grave implications for water availability downstream
and hydropower generation. Glacial melting can lead to formation of GLOFs (Glacial
Lake Outburst Floods) and heavy flows initially followed by dry spells. Precipitation is
the main source of water in Uttarakhand, accumulating as snow on the mountain
slopes in the Trans and Great Himalayan region. There are four major river systems
in the state, viz. the Bhagirathi – Alaknanda, Ganga, the Yamuna-Tons and the Kali
constituting nearly 900 glaciers, in addition to other sources of water such as lakes,
streams, rivulets and springs. The state has witnessed a long-term decreasing trend
of stream discharges, decline in capacities of the lakes, increase in surface runoff on
hillsides, increase in floodwater, decrease in base flow water in channels and rivers,
and recurrent soil erosion and landslips.
Impact on agriculture: Variations in climatic factors can affect crop yields either
directly via changes in temperature, precipitation and/or CO2 concentrations or
indirectly via changes in soil properties and distribution of pests. Variability in
precipitation has implications both for the economic growth of agriculture-based
economies and for the food security of the nation. In India, it is estimated that a
temperature rise of 2°C could lower the yields of staple crops such as wheat and rice
by 10% and reduce farm revenues (DFID, 2006). Nearly 78% of the population in
Uttarakhand is dependent on agriculture for livelihood. Agriculture in Uttarakhand is

107
already constrained due to mountainous terrain, low temperatures and short growing
seasons, with climate change compounding these factors.
Impact on energy supply and demand: With over a billion people, India today only
produces 660 billion KWh of electricity and over 600 million Indians, a population
equal to the combined population of USA and EU, have no access to electricity, and
limited access to other clean, modern fuels such as LPG and kerosene (GoI, 2007).
The expansion needed in the energy systems, in a climate-constrained world,
represents an enormous challenge for the country but also an opportunity to promote
sustainable development. Renewable energy options existing in Uttarakhand are
primarily micro hydro, solar energy, biomass for electricity generation, bio-energy,
especially bio-fuels for transport sector and biogas for cooking.
Impact on forests and biodiversity: Changes in climate could alter the
configuration and productivity of the forests ecosystems. Rising temperature,
changes in availability of water, and enriched CO2 are expected to bring significant
changes in species composition in approximately one third of the forests worldwide.
Nearly 200,000 villages in India depend on forests for their livelihood. Climate
change is likely to affect forest biodiversity and cause a shift in forest boundaries
thereby impacting the supply of forest products and consequently forest-based
livelihoods.
Forest ecosystems in Uttarakhand are already subjected to socio-economic
pressures leading to forest degradation and climate change can significantly affect
the availability of forest goods and services in terms of quality and quantity.
Production of several indigenous herbs and forest species in the state is likely to be
severely impacted by these changes. Many Non-Wood Forest Products (NWFPs)
are likely to be more vulnerable to changes in climate system than timber and fuel
wood production and hence would have a more serious impact on NWFP-
dependent forest communities.
Impacts on human health: Climate change can directly impact human health due
to mortality and morbidity related to extreme events such as droughts, floods,
cyclones, temperature extremes, etc. or indirectly due to change in transmission

108
pathways of disease agents such as pathogens and pests by creating favorable
conditions for their survival and propagation. Pathways by which climate change
affects human health would also include factors that are embedded in the
environmental and socio-economic conditions of regions exposed to climatic
extremes. Mountain regions such as Uttarakhand are vulnerable to direct health
impacts of climate change due to floods and GLOFs and consequent health
outcomes due to impacts on drinking water supply and sanitation and spread of
water-borne diseases. Furthermore the occurrence of certain vector-borne diseases
such as malaria has also been projected to shift towards higher altitudes with
changes in the climate.
CHALLENGES FOR LIVELIHOOD SECURITY
Majority of population of Uttarakhand lives in rural areas and its dependence on
agriculture almost as an exclusive source of livelihood. The efforts therefore have
been directed towards sustainable development of rural economy by way of
provision of non-farm employment opportunities, safe drinking water, empowering
women and equipping them with skills, tools and finances for around economic
development, promoting weaker sections of society and creating self-employment
opportunities for rural youth.
In future, agricultural and other land-based activities, in the long run, even with the
high and diversified rate of growth will not be able to ensure employment to all the
rural workers at adequate levels of income. Technological advancement coupled
with institutional changes in agriculture sector will lead to further shrinking of
employment potential and also conversion of a substantial number of those under
employed in agriculture into openly unemployed seeking work elsewhere. Given the
fact that some of them will be able to get employment in urban areas; still it is
necessary that the rural economy gets diversified into non-farm activities to provide
productive employment to rural labor force. This will also help in arresting migration
from rural areas to urban areas.
The state policy seeks improvement of quality of life, generation of productive
employment and removal of regional disparity. Therefore, the focus of employment

109
strategies has to be shifted towards creating conditions not only to expand
employment opportunities but also to achieve better living and working conditions.
Agriculture will continue to play an important role in providing employment. It is
necessary that the rural economy gets expanded and diversified into non-farm
activities towards providing productive employment to the growing labor force. Such
diversification and expansion of the rural economy is possible through promotional
policies and efforts. The success of these policies will largely depend on the ability to
do away with some of the inherent weaknesses of the delivery system and the ability
to design appropriate strategies as some are suggested below:
Given the high incidence of underemployment and increasing casual labor, a
primary objective of the state policy should be to generate productive work
opportunities in sectors which are more labor-intensive.
It is not enough to merely create employment opportunities, but also to provide
the people with the human capital which will enable them to take advantage of
these opportunities. Education and skill development are the prerequisites for
such empowerment. Special programs should be implemented to develop skills,
enhance technological levels and provide marketing channels for people
engaged in traditional occupations.
There is a tendency to implement many schemes with similar objective targeting
the same population. Convergence of related schemes across sectors will help
obviate any duplication of effort and depletion of resources as well as reduce the
overhead cost of programs.
A long-term perspective of development, reinforced by a consistent state policy,
is crucial to successful implementation of programs.
Isolated successful interventions cannot make any perceptible impact on social
and economic development. Yet, these micro level experiments represent the
seeds of change and need to be multiplied on a wider scale towards the
realization of the development goals. As a result, institutionalization of the
process and methods adopted in these experiments are necessary.
The essence of success stories is “people‟s participation”. The essential
ingredients of people‟s participation in the development process are assessment
of local resources, local level planning, people development, and establishment

110
of local organizations as an umbrella support mechanism to facilitate people‟s
actions. These processes will need to be institutionalized and sustained through
the PRIs, which should be strengthened with greater devolution of central
powers and functions.
In the ultimate analysis, growth generating productive employment will be an
outcome of efficient institutions which implies good governance.

111
CHAPTER - 6 VISION AND MISSION
Uttarakhand State is well endowed with forest and water resources. More than
12,000 glaciers and 8 major river catchments act as the lifeline for the entire
hydrological system of Indo-Gangetic plain. The Himalayan Watersheds are under
constant threat of mass wasting and erosion caused by depletion of forest cover,
unscientific agronomic practices, hydrologic imbalances and natural calamities. The
ever increasing population, the need to provide a better quality of life to the people
and the pressure on natural resources is further compounding the problem.
Considering the magnitude of the problems, the Uttarakhand Govt. has realized the
significance of taking up watershed based planning. A total of about 8 watersheds,
116 sub watersheds and 1110 Micro Watersheds have been identified in the state
which are being taken up for regeneration and sustainable development, in phased
manner.
“Our Common Future” the Brundtland Commission Report 1987 developed the
concept of Sustainable Development. The main frame of the report is around
sustainability, the report narrates the kind of development that “meets the need of
the present without compromising the ability of the future generation to meet their
own needs”. Further, it is a process of change in which exploitation of the resources,
direction of investment, the reorientation of the technology development and
institutional change are all in harmony and enhance both current and future potential
to meet human needs and aspirations. Keeping these tenets in mind our vision for
Watershed Development in rainfed areas has been developed.
In the state, thrust has been given to Integrated Watershed Development Programs.
A separate Directorate- Watershed Management Directorate (WMD) has been
established as a nodal agency for coordination, monitoring and implementation of
integrated watershed development programs in the state. With this objective in mind
the State Level Nodal Agency has been formulated according to the Common
Guidelines 2008 and has been anchored with the Watershed Management
Directorate.

112
VISION OF WATERSHED MANAGEMENT DIRECTORATE
'To improve the productive potential of natural resources and increase incomes of
rural inhabitants in degraded watersheds of the state through socially inclusive,
institutionally and environmentally sustainable approaches.'
MISSION STATEMENT
Holistic development of the degraded and rain-fed areas of the state through
integrated management of natural resources on participatory basis to achieve
ecological balance, income enhancement through increased livelihood opportunities,
poverty alleviation, welfare of vulnerable groups including women and landless,
equity in benefit sharing and institutional strengthening through capacity building.

CHAPTER -7 PERSPECTIVE
NEED FOR PERSPECTIVE PLAN
The Himalayan watersheds are under constant threat of mass wasting and erosion
caused by depletion of forest cover, unscientific agronomic practices and hydrologic
imbalances. The ever increasing population, the need to provide a better quality of
life to the people and the pressure on natural resources is further compounding the
problem. The total of 7.66 lakh ha. cultivated area in the State 4.21 lakh ha. area is
rainfed. An insight into the rainfed regions reveals a grim picture of poverty, water
scarcity, rapid depletion of ground water table and fragile ecosystem. Land
degradation due to soil erosion by wind and water, low rainwater use efficiency, high
population pressure, acute fodder shortage, poor livestock productivity, under
investment in water use efficiency, lack of assured and remunerative marketing
opportunities and poor infrastructure are important concerns of enabling policies.
The challenge in rainfed areas, therefore, is to improve rural livelihoods through
participatory watershed development with focus on integrated farming system for
enhancing income, productivity and livelihood security in a sustainable manner.
A number of watershed management projects are being executed in the state under
different schemes; the Micro watersheds where these schemes are being
implemented have been selected more on the grounds of suitability of working areas
to the Project Implementing Agency (PIA) than on the basis of any priority made in
an objective manner.
For overall integrated development in the state, it is important to implement
development activities in the untreated MWS on the basis of priority made in an
objective manner. The criteria of selection of MWS to be taken up under the
Common Guidelines were as follows:-

114
There are a number of projects/ schemes operational in the State which is
implementing MWS treatments. Keeping these schemes in view only the untreated
MWS were shortlisted for the above project.
Of the total of 1110 MWS delineated in the State. Out of the 537 untreated MWS,
124 micro watersheds have been identified above 3200 mt. altitude comprising a
total area of 14,25,750 ha. This is the area with little to no human habitation,
snow bound glacier, rocky and forest covered area. The status of this land is
mainly Reserve Forest under the jurisdiction of the Forest department. The High
altitude National Parks/Sanctuaries such as the Nanda Devi National Park,
Gangotri National Park, Kedarnath Wildlife Sanctuary and Askot Wild Life
Sanctuary lie in this zone. Besides, this area is also home to the some of the
places of great religious significance such as Badrinath, Kedarnath, Gangotri and
Yamunotri.
Micro watersheds in this zone are land slide prone areas having slopes greater than
30 degrees gradient. Besides, these areas are also facing tremendous pressure and
degradation of their natural resource due to high tourist and pilgrim inflow.
The Micro watersheds - Badrinath, Jumagard & Dhauliganga (District Chamoli) are
home to Internationally famous places of religious and ecological significance viz
Badrinath shrine and Valley of Flowers National Park ( A world heritage site) .Due to
large number of pilgrims visiting Badrinath shrine and tourist pressure at Valley of
Flower National Park, the above Micro-watershed are facing degradation. The Micro
watershed Kedarnath (District Rudrapryag) has the world famous religious shrine
Kedarnath. It is under pressure from high number of pilgrims and trekkers visiting the
area. The Micro watershed Gangotri and Yamnotri (District Uttrarkashi) are home to
Gangotri and Yamnotri both places of great ecological, religious and tourism
importance. Similarly Harikidoon is also facing degradation due to pressure from
tourists and pilgrims.
Any watershed treatment required in this zone (> 3200mt) will be undertaken as
convergence projects requiring special interventions by the concerned departments.

Out of the 537 untreated MWS, 409 micro watersheds have been identified below
3200 mt. altitude comprising a total area of 18,11,887 ha. and additionally
1,20,000 ha. of area from Haridwar district have been prioritized for treatment
(MWS have not been delineated in Haridwar district). These MWS would be
taken up for treatment on the basis of prioritization made in the manner given
below. All the 409 MWS lying below 3200mts altitude have been prioritized for
every district. The total area available for treatment under the plan has also been
calculated for every district (Annexure Table 7.1).
The criteria and weightage for selection of MWS has been done on the following
criterion.
(Table 7-a.) Criteria and weightage for selection of MWS
S.No Criteria Max. Ranges and Scores 1. % of SC/ST
population 10 More than
40% (10) 20 to 40% (5%)
Less than 20% (3)
2. Actual wages 5 Actual wages are significantly lower than minimum wages (5)
Actual wages are equal to or higher than minimum wages (0)
In the State actual wages are equal and higher than minimum wages (0)
3. % of small and marginal farmers
10 More than 80% (10)
50 to 80% (5) Less than 50% (3)
4. Area under assured irrigation
15 Less than 10% (15)
10 to 20% (10) 20 to 30% (5)
Above 30% (Reject)
5. Degraded land 15 High–above 20% (15)
Medium – 10 to 20% (10)
Low- less than 10% of TGA (5)
6. Contiguity to another watershed that has already been developed/ treated
10 Contiguous to previously treated watershed and contiguity within the MWS in the project (10)
4 to 6 MWS in cluster (10)
2 to 4 MWS in cluster (5)
7. Cluster approach in the plains (more than one contiguous MWS in the project)
15 Above 6 MWS in cluster (15)
4 to 6 MWS in cluster (10)
2 to 4 MWS in cluster (5)
Total scores 80

116
From a total of a 537 untreated MWS 409 MWS would be taken up for treatment in
this project. The details of MWS of each districts with its weightage criteria is
annexed with (Appendix Table 7.(I to XII))
These MWS could also be taken up under various convergence schemes. Amongst
the various convergence schemes specific projects designed by various Line
Departments like Forest, Agriculture, Rural Development can be taken up. Any
Externally Aided Project working on Watershed Guidelines could also prove to be a
good convergence project. Within these projects also NREGS could also be used as
an effective convergence tool.
PROJECT AREA
The entire state of Uttarakhand comprising thirteen districts will be the project area.
However actual work will be carried out only in selected prioritized untreated MWS
shown in (Map-9 - State Map showing the areas proposed for treatment under IWMP)
Keeping the Common Guidelines for Watershed Management in mind a Perspective
Plan of Integrated Watershed Management is envisaged which aims at sustainable
utilization and management of natural resources like water, land and vegetation. It
will also address the issue of sustainable farming system and rural livelihood
opportunities with the participation of local communities for ensuring long term
ecological and economic security. As per the common guidelines the plan has been
based on the following principles.
1. Inclusiveness: The poor, small and marginalized farmers, household landless
women, shepherd and SC, ST persons would be mobilized to form SHGs it shall
be ensured that these groups are dependent on the watershed areas for
livelihood. These SHGs would be provided revolving fund and capacity building in
various income generating activities would also provided. Gender budgeting
would also implemented.
2. Decentralization: Within the framework of Panchayati Raj Institution Watershed
Committees shall be constituted along with Self Help Groups, User Groups and
individual beneficiaries. The Watershed Committee formed would be given
financial autonomy in implementing the project. These empowered committees
would plan and implement and monitor the plan at the Gram Panchayat level.
3. Social mobilization: The project functionaries will have shift in roles from
controller and regulators to facilitators. For this purpose professional team
including voluntary organization would be selected for social mobilization,
community organization. Capacity building of communities shall be done for
planning and implementing the project.
4. Community Participation: All the stakeholders would be involved in planning,
budgeting, implementing and monitoring of the projects. To inculcate sense of
ownership amongst the stakeholder’s community contribution in the form of water
development fund would be there to ensure the sustainability after the withdrawal
of the project. The project would give special emphasis on the vulnerable groups
of the community.
The main project components would be:
a) Participatory Watershed Development and Management
b) Enhancing Livelihood Opportunities
c) Institutional Strengthening
a. Participatory Watershed Development and Management :
Promotion of Social Mobilization and Community Driven Decision Making
Natural Resource Management
b. Enhancing Livelihood Opportunities :
Farming System Improvement
Income Generating Activities for the SHGs
Value Addition and Marketing Support
c. Institutional Strengthening
Capacity Building of Gram Panchayat, Watershed Committees
Information, Education and Communication
Monitoring, Evaluation and Learning System
Within these components the following activities would be undertaken:
118
SOIL AND MOISTURE CONSERVATION MEASURES
The soil and moisture conservation treatment in arable and non arable areas are
separate. In arable lands soil and moisture conservation measures can be broadly
classified into two categories, viz; i. Biological, and ii. Mechanical and Engineering
i. Biological or Vegetative measures are preferred in watershed development
programs as they are eco friendly, sustainable and cost effective. These
measures are normally adopted on lands having milder slopes, less run off and
sediment flow. These can be adopted singly or in combination with mechanical
measures depending upon the intensity of soil erosion problem. Commonly used
biological measures consist of vegetative barriers, alley cropping, strip cropping,
contour farming, tillage and mulching.
ii. Mechanical and Engineering measures: In situations where biological
measures only are insufficient to check erosion toward desirable level due to high
velocity of run off or discharge, mechanical measures are needed. These
measures not only check erosion but also conserve moisture for crop growth.
Basically these measures constitute a series of mechanical barriers constructed a
cross the slope to reduce or break the length of slope only or both the length and
degree of slope to dissipate the energy of flowing water. Mechanical measures
like bunding, terracing, leveling etc. are adopted in arable lands on relatively
moderate to steep slopes.
Non arable lands are those lands which are generally unsuitable for cultivation of
agricultural crops due to one or more limitation of slope, erosion, stoniness,
shallowness, wetness, flooding, climate etc. these wasted lands are formed due to
misuse, over exploitation and non adoption of suitable conservation measures quite
often, establishment of vegetation on these highly degraded lands is difficult due to
higher run off / debris movement, lack of moisture and absence of fertile soil.
Engineering or mechanical measures are, therefore, often needed before
undertaking re-vegetation program to stabilize the slopes and create conditions
conducive for plant growth by arresting fine soil and improving moisture status. For
this purpose diversion drain, contour trenching, stone wall, half moon terracing,
wattling followed by vegetation measures help control erosion.

Drainage line treatment is essential for a watershed as drainage lines carry run off
and sediment flow. These drainage lines may have different forms such as drainage
channel, gullies, natural/ artificial water ways, streams, rivers or torrents. Network of
these drainage lines, quite often suffers from degradation due to uncontrolled run off
and may go on extending and render and adjoining lands degraded. Drainage line
treatment can be done through check dams which may be vegetative, temporary and
gabion, Torrents also known as raos may be trained by construction of spurs,
protection wall, embankments and bio fencing etc.
WATER HARVESTING TECHNIQUES
Various system of water harvesting depending upon the source of water supply may
be implemented like (a) in-situ rain water harvesting can be done through bunding
and terracing, contour farming, mulching etc. (b) rain water / direct surface run off
harvesting through roof top collection, dug out ponds, storage tank, diversion bunds /
channel etc. (c) Stream flow or run off harvesting through nala bunding, water
harvesting dam, percolation tank/ ponds, (d) Sub surface flow harvesting.
FORESTRY
Afforestation means raising of forest crop on lands which are not already covered
with the forests. Besides, production of fuel, fodder, fiber, fruits and timber, forests
serve the important purpose of preservation of environment and conservation of soil
and water. Although, existing vegetation gives a clear indication of the suitable
species but the choice of the species depends upon various factors. Fast growing,
top feed and drought resistant tree species capable of growing under adverse
condition should be preferred for afforestation purposes. Species like Grewia optiva,
Morus alba, Bauhinia, Salix alba, Robinia pseudoacacia, Eucalyptus, Populus spp.
etc. could be taken up for plantation.
Pasture or grassland management is forage production from all kinds of natural
vegetation edible to livestock, mostly grasses and herbs, on the non- arable lands.
Pasture or grasslands require management by initial range improvement measures,
especially reseeding and planting, and kept in a state of optimum productivity by

120
proper grazing system with different kinds of livestock for different periods and
periodic improvement. The forage may be utilized either in situ by grazing or by stall
feeding or both. Poor and fair common property lands can be stocked by selected
high forage yielding perennial grass species by reseeding and / or planting of rooted
slips. Some of the most important species are Dichanthium annulatum, Sehima
nervosum, Chrysopogon fulvus etc.
AGRICULTURE:
In rainfed regions agriculture is the livelihood of a large section of our population
which meets their food, fiber and energy requirements. In the rainfed areas, an ideal
cropping system involves sequential cropping of a cereal followed by legume,
shallow rooted, by deep rooted crop, fertility depleting by fertility restoring crops, soil
degrading by soil regenerating crop, and the crops demanding heavy inputs by those
that can survive on low inputs. Following points are important for in and efficient
integrated crop management program:
Timely sowing is a must;
Introduction of suitable of suitable high yielding varieties matching the rainfall
pattern;
Inclusion of a legume component to build – up soil fertility and saving on fertilizer
use ;
Stable, productive and remunerative intercropping system;
Double cropping systems, where feasible;
Inclusion of fodder component;
Farming System improvement is possible through integrated crop management
strategy. Integrated crop management is a holistic approach for overall management
of cropping systems from seed to seed for obtaining potential yield. Integrated crop
management comprises four important components. They are:
Integrated plant nutrient management (IPNM)
Integrated moisture management (IMM)
Integrated weed management (IWM)

Integrated pest & disease management (IPDM)
IPNM is dependent on IWM, IPDM is dependent on IPNM. Likewise all the four
components are interdependent and supplementary to each other.
IPDM without IPNM, IWM and IMM will not produce potential yield. Hence, all
training’s, field trials and demonstrations proposed under the project shall combine
IPNM, IMM, IPDM and IWM judiciously aiming at Farming System improvement.
Integrated Plant Nutrient Management (IPNM)
Integrated nutrient management is a system / an approach; where in the overall
nutrient requirement of a crop is assessed / estimated on the basis of Soil Test Crop
Response (STCR), accordingly the nutrients are supplied. In the absence of IPNM it
is impossible to assess the exact nutritional requirement of a given crop. If IPNM is
not followed there will imbalance in the application of nutrients, as a result there will
be either excess or deficit in the availability of nutrients, and it also reduces the
plant’s ability to utilize nutrients from the soil and leads to improper metabolism of
nutrients. This may result in the reduction of immunity of the plants, which may
attract pests and diseases, resulting in poor yields. IPNM is invariably practiced in
the degraded shallow, soils resulting in poor crop yields. IPNM has to be planned on
scientific basis, from the first day of land preparation, sowing to harvesting. IPNM
can be practiced by sensitizing area groups, creating awareness to farmers through
publicity propaganda, organizing communities and training’s. Demonstrations can be
conducted on the lines of Farmers Field School (FFS). Application of nutrients based
on STCR results. All decisions are taken by farmers in the fields with the help of
extension staff, during the period of demonstration from pre sowing to post harvest
(seed-to seed). Farmers can actively be involved in the field and they record all the
observations and maintain the records during demonstration period.
Integrated Moisture Management: Moisture retention is central to farming system
improvement; this can be possible through contour farming. It is an easy, effective
and low cost method of controlling erosion, conserving moisture and improving crop
yields. Carrying out farm operations such as ploughing, seeding, planting and inter-
culturing along the contour lines result in creation of furrows which act as miniature

122
reservoirs to hold the excess runoff, dissipate the energy of flowing water and
provide increased opportunity time for runoff absorption. Tillage, mulching and
residue management practices are helpful in reducing erosion losses and increasing
in situ moisture conservation in the soil profile. Tillage influences physical
characteristics of soil and infiltration of rain water; whereas mulching and residue
management practices check evaporation losses of water and also help in
improvement of soil fertility.
Integrated Weed Management
Weeds are integral part of cropping system. Weeds are naturally selected and have
the ability to survive under adverse condition. No-single method in the past has
proved effective against weeds. IWM is a combination of mechanical, cultural,
manual, biological and chemical method of weed control. Potential yields of any crop
can be obtained only when the weeds are properly managed. Weeds compete for
moisture, nutrients, space and they acts as hosts for many pests and disease.
Therefore IWM is imperative. Unlike IPNM the source of weeds are innumerable, for
example weed can spread through FYM, soil, wind, water along with crop seeds and
by birds. Therefore to manage the weeds we must select well-decomposed weed
seed free compost. Before sowing, after sowing, during crop period and after
harvesting, weeds shall be controlled. Only certified seeds / planting materials,
seeds shall be used. Creating awareness among the farmers (users groups) by
publicity, propaganda, and organizing communities. IWM shall be practiced through
demonstrations on the lines of farmer field demonstrations.
Integrated Pest & Disease Management
IPDM is a management tool for pests and disease management, where in
mechanical, cultural, biological, chemical, use of resistant varieties, and quarantine
methods are carefully combined to keep pest & diseases at below economic injury
levels to obtain optimum crop yields. The advantages of IPDM are:
IPDM is Eco & farmer friendly.
Environmentally safe.
Cost effective.

If reduces the application of pesticides.
Results are assured.
IPDM can be practiced from seed to seed, which includes pre- sowings to post
harvesting of the crop. The first step involved in IPDM planning is to sensitize the
facilitators i.e. extension staff and the farmers in the watershed areas. This can be
done by organizing Farmers Field demonstration. Farmers’ Field demonstration has
proved as the best way to demonstrate IPM. It is a non-formal type of educational
learning situation wherein the participants will be able to acquire the skills and
knowledge of integrated pest management through the integrated adoption of
production technology in raising a healthy crop. At the end of the training farmers
will:–
1. Become experts in their own field for arriving at right decision for pest
management.
2. Be able to conserve the defenders (natural enemies) in their field.
3. Observe the crop regularly.
4. Be able to grow healthy crop.
HORTICULTURE
Rainfed Horticulture has assumed greater attention now days due to better economic
returns. Fruit trees provide better substitute and offer alternative opportunities in
areas where cropping may not be possible due to non availability of irrigation.
Selection of suitable hardy variety resistant to drought, adverse weather condition,
diseases and pest and use of local or other hardy root stock for raising fruit trees is
of utmost importance for the success of conservation horticulture. The fruit crop
selected should be such that their maximum growth takes place during the period of
maximum water availability in the soil and low- pressures deficit in the atmosphere.
The most part of the reproductive cycle i.e., period from flowering to fruiting should
also fall during this period and fruit ripening should be completed before the onset of
dry summers. It is essential that nurseries should be stocked with high yielding good
varieties of fruit plants at the local level.

124
Medicinal and Aromatic Plants
At present, our agricultural system is dominated by a certain group of crops as more
than 80% of our food comes from about 10 species only. Under such circumstances,
crop diversification will be a boon from ecological as well as nutritional point of view.
Concept of diversification is need based as well as economically viable. It is helpful
in ensuring better soil health, better utilization of resources, nutrient recycling,
efficient nutrient use, aversion of risk and uncertainty, decreased weed infestation
etc. Inclusion of medicinal and aromatic plants, ornamental flowers with fruit trees
and fuel and fodder trees may be remunerative cropping system.
The high biodiversity by different climatic zones of Uttarakhand hold immense
potential for enhancing livelihoods through medical and aromatic crop cultivation.
The variations in microclimate over short distance, increases the potential for agro
diversity and range of the natural resource produce.
Uttarakhand supports a large number of medicinal plants, which are extensively
used by the pharmaceutical industry for preparation of drugs used in Indian System
of Medicine. These plants are either used as single (e.g. SHATAVARI from
Asparagus racemosus) or multi-herb products (e.g. CHYAWANPRASH containing
amla fruit and several herbs). The degree of threat to natural populations of such
medicinal plants has increased because more than 90% of medicinal plant raw
material for herbal industries in India and for export is drawn from natural habitats. In
this context, medicinal plants of Uttarakhand can open avenues of economic growth
in the emerging world market.
The State Government has taken initiative to promote medicinal and aromatic plant
cultivation through involvement of public and private sector in nurseries/planting
material, establishment of herbal mandies and processing/distillation units, simplified
transit rules. State Government has prioritized 26 potential species of medicinal and
aromatic plant for promotion of cultivation.
Due to non tradition of cultivation of medicinal, aromatic and dye plants, these were
rarely tested and tried for domestication and for propagation and mainstream
cultivation for marketing and livelihood promotion or as a supplementary income

source of the people. The project has great potential to take up this challenge and
provide opportunity to the people to its project area for a sustainable livelihood
program. The following table gives details of the potentially recommended medicinal
plants and culinary herbs for promotion in the project area. More number of the
species of crops, plants and herbs of different medicinal values has been provided
for the final choice for selection and also maintaining biodiversity and risk of failure of
any mono crop from farmers point.
Table 7-b List of medicinal and aromatic plants for cultivation purposes
Sl. No.
Name of Crops /Plant/Herbs
Botanical Name Altitude (ft.)
CROP SPECIES
1. Satavari Asparagus racemosus 2500-5500
2. Chirayata Swertia chirayita 5500-7000
3. Aswagandha Withania Somnifera 2500-4500
4. Giloy Tinospora Cordifolia 2500-5000
5. Meethi Tulsi Stevia repaudiana Upto 3000
PLANT SPECIES
1. Reetha Sapindus mukorossi Upto 5000
2. Baheda Terminalia Bellirica Upto 4000
3. Harar Terminalia chebula Upto 4000
4. Amla Emblica officinalis Upto 6000
CULINARY HERB SPECIES
1. Thyme Thymus valgaris Upto 4000
2. Rosemary Rosmarinus officinalis Upto 4000
3. Oregano Oreganum valgare Upto 4500
4. Sweet Marjoram Origanum marjorana Upto 3000
5. Mint Mentha piperita Upto 3500
Floriculture: Uttarakhand has special advantage to grow different kinds of flowers
crops around the year because it is endowed with conducive agro-climatic
conditions, cheap labor, vast natural resources, low production cost etc. increase
awareness about the potential of this sector will encourage many progressive
growers and entrepreneurs to take up floriculture as a commercial enterprise.

126
Flowers like Marigold, Gladioli, carnations and orchids, lilies etc. can be grown in the
hills of Uttarakhand.
LIVESTOCK BASED PRODUCTION SYSTEM
Livestock based production system is an integral component of agriculture in rural
economy. Nearly 70% of the population residing in rural areas is engaged with
traditional systems of animal husbandry. However, to improve production and
generate livelihood support to the rural poor for upliftment of their economy, scientific
ways of animal based production systems need to be intensified.
Cattle based production system: Cattle rearing are an integral part of farming
activity. Buffalos are generally preferred to cows because of high price of milk, being
versatile, draft and resistance to diseases. But buffalo rearing has its own
disadvantages. Therefore, it is recommended that farmers should have viable unit of
three cows (cross bred and two to three buffalos).
Some of the important points for effective cattle management are :
Follow proper housing, ventilation, disease control and feeding management.
Animal should be milked 45 days after calving.
Animals should be de-wormed 15 days prior to calving.
Treat the navel cord of calf to prevent illness.
Feed the calf 22-31 cholestrum per day.
Start feeding concentrate at 4 weeks age, if the calf is not getting sufficient milk.
Dehorn the calf at 2-4 weeks age.
Proper vaccinations and health care should be done.
Cross bred should conceive by about 90 days after calving, if not, then test for
fertility.
Goat / sheep based production system: Goat / sheep rearing are traditionally and
widely practiced across the country. A viable unit / family comprises of 50 local
improved sheep (Ewes) including 1-2 raw or 30 local improved goats (bucks)
including one doc. Goats and sheep are commonly fed by open grazing. However,

stall-fed goats consume any fodder, are resistant to diseases and fetch good market
value.
Backyard poultry: The backyard poultry farming exists in rural areas involving
mostly well adapted indigenous or cross–bred chicken to which minimum inputs are
used from local resources for their management. The production potential of these
birds is around 80-100 eggs per bird per annum. As a secondary enterprise in
backyards, 10-20 cross – bred birds can be maintained as broilers or layers.
INCOME GENERATING ACTIVITIES
The State of Uttarakhand has high degree of agro-climatic diversity and economic
backwardness. The economic deprivation in region is not only because of small land
holdings but also because of unproductive land use due to rain fed and operational
constraints faced due to harsh physical conditions. Major operational constraints
include undulating nature of farm holding coupled with inequitable agrarian structure,
absence of land consolidation, poor infrastructure for storage, processing, value
addition and marketing of agricultural products, and most importantly the ecological
handicaps incidental to mountainous area. Due to all the above constraints, the
people of the tract are forced to look for alternative avenues to augment their income
and daily needs, thus the rate of seasonal and permanent migration is very high with
males and women has to bear the entire workload of the household. The situation is
more acute for the women from landless and small marginal landholders. In order to
tackle this pressing problem of land degradation as an indirect consequence of low
productivity and poverty, there is a need to evolve strategies for income
enhancement of local population within the village itself.
To wean away people from making unsustainable use of natural resources and to
improve their economic status, some alternative means of livelihood need to be
provided to them. This would be achieved through viable and potential livelihood
activities designed under the project.
Since landless and women have very limited resources and they are not secure on
the financial front, specific support is needed for starting an income generating
activity. With this background, to put the income generating activities on a sound

128
footing, acquisition of necessary skills and working capital are proposed under IGA
strategy for vulnerable groups. It will enhance the capacity of women, the poor,
SC/ST, to increase their income- levels. In this way, it will focus and assist those
sections of village communities who will receive very little benefits from the
watershed treatment activities.
Objectives
1. Organization of Self Help groups for sustainable productivity enhancement.
2. Build and enhance the capacity of Self Help group for livelihood.
3. Promotion of micro- enterprises through entrepreneurship development program
The overall objective of this component is the socio-economic upliftment of women,
poor, SC/ST, by the expansion of income earning options through on farm & off farm
employment and sustainable and efficient use of natural resources. Some key
preconditions are needed for this:
Availability of infrastructure both physical and institutional at local level.
Access to support services (e.g. credit, inputs, training and information).
Access to markets and knowledge.
Safeguards against ecological problems (e.g. land degradation,
overexploitation of natural resources and endangered bio-diversity).
Identification of potential income generating activities is the most important and very
crucial step to meet the above objectives. Inaccessibility, thin spread of resources
and materials, lack of forward and backward linkages and deficiencies in
infrastructure and service render commercial production very risky. Therefore
provision of infrastructure and institutional and organizational mechanism for supply
of inputs and for marketing, with a view to ensuring a minimum scale of operations,
has become essential for the survival and growth of IGA.
The major thrust area of the Income Generating Activities is to increase the
productivity and income of rural habitants in the project area through sustainable
management of natural resources. The reduction of poverty and enhanced livelihood
opportunities for vulnerable families and to improve skills and create alternate
livelihood options for them are objectives of this proposed plan.
Providing skills and create alternate livelihood means to augment income, the
unsustainable use of natural resources could be reduced. If the natural resources
are used optimally, keeping in view their carrying capacity, the objective of the
project to increase the productivity and income of rural habitants in the project area
through sustainable management of natural resources could be achieved.
An indicative list of possible activities which can be taken up as individual /joint IGA
which are also being implemented by Externally Aided Project of the Watershed
Management Directorate are given below:
1. Horticulture - Vegetable production, Mushroom cultivation and Floriculture
2. Food processing , preservation, Pickle making, manufacture of soyabean by
products and Bakery
3. Cultivation of medicinal plants
4. Fibre handicraft, Plate / rope making , carpet making
5. Livestock production (backyard poultry, goat/ sheep units), Dairy unit - processing
plants
6. Fisheries
7. Beekeeping
8. Forest/ horticulture nurseries
9. Seri culture
10. Vermi culture
11. Tailoring with shared/ individual owned sewing machine, Setting up a Individual/
jointly owned shop or tea-stall and production of tools for artisan activities
12. Marriage band, Tent house and Stove/ catering unit
Self Help Group Fund Support: Since the marginalized groups are not secure on
the financial front, specific action has to be taken to arrange the finances needed for
starting an income generation activity. To meet and supplement the requirements of
an Income Generation Activity, a SHGs fund support for capacity building and
working capital assistance is provided at the GP level. It will serve the purpose of

130
promotion of micro- enterprises and will work as a Revolving Fund. The SHGs will
utilize this fund either for a joint IGA or individual activities within a group.
Most of the proposed project interventions are land based, thus to provide benefits to
the SHGs including poorest of poor, special activities have to be thought so that the
project interventions do not profit only the landed and affluent sections of the
community. This is also a mechanism to involve these people with the implementation
of the project, who may otherwise remain indifferent.
Working capital will be used to assist identified groups for purchase of goods and
equipment if required. This will be utilized jointly and individually as per the group’s
decision. Apart from this, adequate Entrepreneurship Development Trainings and skill
trainings for production will be conducted. It will enable them to enhance their
capacity for income generation programs.
Social Mobilization / formation of Community Group: This project aims at a multi
dimensional approach for decentralized watershed development, catering to a major
part of rural Uttarakhand. The theme of the project is to evoke and involve
communities through PRIs, for the implementation of this project and its further
sustenance.
The communities are actually the first vehicles or mode of contact with the watershed.
The relationship of people and the natural resources are interwoven, integrating
different components such as soil, water, biomass, livestock etc. on a day-to-day
basis in order to sustain their lives. The status of a watershed at any point in time is a
reflection of people's needs and their dependence on the land for their livelihood.
Thus community members are prime stake holders in any watershed endeavor. The
hilly communities have been managing their natural resources from time immemorial
to fetch their needs within a framework of practices and wisdom and their economy is
essentially thriving on watershed produces, therefore genuine involvement of local
people in managing and improving the condition of the watershed is essential if their
living conditions are to be positively improved.
This plan orients around the community, its wisdom, participation and harmonious use
of existing natural resources. The community living in the micro watershed will be

encouraged, enabled and augmented with the technical inputs to fulfill the various
objectives. The motivational inputs will be environmental awareness, introducing
latest technologies for improving productive potential without deteriorating the
prevailing eco-system. Introducing wide and viable options for improving economic as
well as environmental status will further augment this. The proposed plan will
enhance the capability and capacity of communities by providing them technical
assistance in an integrated coordinated way. Communities will play central role, right
from planning to the management of programs. They will be responsible for overall
management of the watershed and it is expected as basis for all other inter connected
relations and outcomes.
To achieve diverse project objectives and enable genuine community participation,
the following approach is outlined.
Community Mobilization: The foremost step in community mobilization involves
understanding of prevailing social structure and dynamics, clan patterns as well as
the influential/ dominating clusters within the community. Establishment of close
rapport with all the segments of the society from vulnerable to elite groups would
require special understanding of social issues and knowledge of special tools and
training. Special attention will be paid to involve and gain the confidence of women
folk.
The IEC tools will play a significant role in the mobilization of community and these
tools will be used for enabling them to understand the concept of the project as well
their participatory role. With the assistance of various IEC tools suitable environment
will be created for effective community participation.
The essential steps conducive for effective community mobilization will be given
(Table 7-c): steps for community mobilization
Step Activity Purpose
I
Informal village level
discussions (in small
homogenous groups)
To collect basic information about the village, with
the assistance of WDT
To understand the social structure and dynamics
of the community.
Rapport building with the people, especially with
women and vulnerable groups of the community

132
Step Activity Purpose
To know the traditional practices related to their
livelihood and existing approach of community
towards NRM.
To understand recent trends in usufruct pattern on
public and common lands.
II Introductory meeting with
existing formal and non-
formal groups and with the
entire community
Raising awareness in the community about the
broader aspects of Integrated participatory
Watershed development and NRM
To explain the broad concept, objective and
working of project vis-a-vis effective role of the
community.
Gathering information about existing village CBOs
and PRIs setup
III Selection of Village
Motivator from each
village through specially
convened meeting with
the assistance of WDT.
To find a suitable communicator preferably from
weaker sections/ Mahila Mangal Dal/ SHG existing
in the village so as to encourage and mobilize
communities, particularly the women folk for active
involvement in the planning and implementation of
different project activities.
Appraising the selected
motivator about his/her
role in the implementation
of the project along with
duty chart and
performance indicators
To provide basic and trustworthy link with the
community
IV Formal and informal group
meetings and awareness
campaigns by WDT and
village motivator for
motivating and evoking
amidst all segments of the
society
To mobilize community for collective decision
making action
To spell out their needs and perception in shaping
the project.
To stimulate them about their role in decision
making with reference to Integrated Participatory
watershed development.
V Stake holder Analysis To identify the vulnerable sections of the society
The traditional practices related to their livelihood
Existing approach of community towards NRM
Dissemination of key information regarding the project : In order to disseminate
clarity about the aim, object and methodology being adopting in the plan, it is
necessary to impart key information among the community members. Awareness
campaigns as well as hamlet and village level meetings will achieve this. Information
package developed under IEC, including visual information on watershed will also be
utilized, to inculcate better understating of the project theme among all the stake-

holder of the community. The following steps will be taken to bring out community
participation in a planned and transparent manner.
(Table 7-d). Steps for community participation
Step Activity Purpose
I Approaching Gram Pradhan
by WDT staff for convening
general meeting of Gram
Sabha along with fixing date
and venue
Imparting key information regarding the
project, its aim, objective and
methodology, also for Disclosure
Workshops
II Performing Gram Sabha
meeting
To Disseminate the key information
regarding the project
To select the community organizer
III Convening a special meeting
to form and activate GPs
Watershed committee at
Gram Sabha level
To select Secretary Watershed
Committee and members of the
Watershed Committee.
To assist in preparation of village
proposals, implementation and mgt. of
Plan at village level
Participatory Watershed Planning at the village level with the involvement of all
stake-holders and using the budget envelopment as the basis: The involvement
of stakeholders at grass root level is a vital element of watershed management. It is
of utmost importance to involve them in such a manner that they feel ownership of
project at every step. The stakeholders so motivated, will provide relevant
information about the natural resource prevailing within the watershed, their
traditional practices in harnessing them as well as specific local wisdom and practice
with in the community. The emerging trends of migration and consequent changing
pattern of common property rights will also be put forth by them. They will also spell
out their needs for improvement of their economic status by sustainable use of
natural resources.
Participatory planning as envisaged above will not only entail determining felt needs
through community level workshops and meeting PIA but more importantly will reach
a common understanding among local actors and PIA staff regarding true problems
and determining which of them can be realistically addressed through joint action.

134
This will also include identification of arable and non-arable land within the village so
as to ascertain specific treatment measures required. Another crucial exercise
required is identifying vulnerable section of the society and reorganizing their
peculiar needs. During these exercises, community members, Panchayati Raj
Representatives and other local players would be encouraged to voice their own
perceptions of the problems at stake. Project staff and concerned NGO will facilitate
this process through their expertise and dissemination of relevant information.
This will ultimately lead to a series of negotiations between local actors and technical
staff regarding:
The issues to be addressed ;
Institutional promotion for facilitating smooth functioning
The respective responsibilities of each partner; and
The technical design of activities selected.
This will be achieved by WDT and with the support of social mobilizers. Technical
input by the PIA staff will also be provided at this stage, to chalk out details of
implementation procedures, time and work schedule and cost sharing will be
negotiated and finalized with concerned group for a participatory take off.
Following steps will be involved in village level watershed planning.
(Table 7-e). Steps for participatory community planning of Watershed Projects Step Activity Purpose
I Base line data collection,
participatory Rural Appraisal and
Environment & Social Assessment
Ascertaining the potential of natural/human
resources and extent of people's reliance on
them within village.
Ascertaining the geographical distribution of
land, its title, ownership, and usufruct rights,
to delineate community's dependence on the
resources and to understand the recent
history of the community to understand
emerging trends.
Determining the current condition of the
watershed.
To assess the livelihood practices pursued by
different groups.
Establishing environmental baseline by
blending and super imposition of villager's
drawn resources map, the cadastral or
revenue department map, Satellite imageries
prepared by Remote Sensing agencies/GIS.

Step Activity Purpose
Finding an overview about the causes of
degradation or enhancement of natural
resources.
Exploring local wisdom and identifying
specific local technologies
Taking stock of the needs of the community
for viable economic development
Ascertaining priorities regarding NRM and
phasing out the activities
Undertaking state of affairs and role of
women vis-à-vis Gender's view point in the
community
Inclusion of marginal group's and vulnerable
section's interest with right to access to
common property resources
II Identification of vulnerable sections
of the society for ascertaining their
peculiar needs and existing gaps
through above mentioned exercises
Formation of SHGs preferably homogeneous
members.
To prepare an IGA related Sub-plan for
vulnerable groups to improve their livelihood
status.
III Identification of potential
interventions for treatment of the
watershed on arable and non-
arable lands (This will be done by
WDT with active cooperation of the
community to determine the extent
of degradation, topography, soil
texture and scope of probable water
harvesting options. Blending of area
specific latest technical expertise
with the traditional wisdom of the
community so as to evolve suitable
strategy for both arable and non-
arable lands.)
To devise ways and means for upgrading the
soil structure and providing irrigation facilities
as and where practicable by scientifically
blended options with traditional local wisdom
for enriching vegetational growth for catering
local needs.
Optimum utilization of land potential
producing zone specific crops along with
horti, fodder, fuel and timber species. Site
selection of appropriate engineering as well
as non-engineering measure to improve soil
condition and check further erosion.
IV Integration of Natural Resource
Management into watershed
committees proposals.
Screening of activities as regards potential
negative social and environmental impacts
V Formation of the village plan with
the application of NRM framework.
Collection, documentation and compilation of
relevant facts, data, and opinion, derived from
the enumerated exercises so as to provide a
comprehensive shape for implementation.
Ensuring non-erosion of rights and interests
of vulnerable sections, increasing their
income generation avenues, along with
safeguarding environment.
The exercise mentioned above will determine the scope and parameters of watershed
development and the extent of community participation for a particular village. In order

136
to obviate the possibility of non-inclusion of certain hidden aspects, which may cast its
shadow in proper planning, and implementation of the project, a thorough checking of
the facts and figures gathered till now is necessary. The community as a whole will be
motivated and persuaded to prepare need based and area specific feasible watershed
development plan through a revision exercise.
The WDT will facilitate the overall process and if necessary will guide at every step of
planning to the Watershed Committee Level/ Gram Panchayat level. Orientation and
Capacity building inputs will be provided to the community with special emphasis on
the representative of PRIs. Following steps will be taken to finalize Watershed
Committee Proposals.
(Table 7-f) Steps for finalization of Watershed Committee Proposals Step Activity Purpose I Revision of facts & figures
derived through the above-
mentioned exercise.
To obviate chances of non-inclusion of certain
basic facts and figures.
II Convening "Agree to do" meeting
for finalization of Watershed
Committee proposals.
Evolving final shape of the project, with the
incorporation of vulnerable groups sub-plan,
extent of community participation, cost sharing
& its mechanism, budgetary provision and
procedural formalities at revenue village level.
III It will be mandatory to have at
least 66% household
representation of all hamlets with
particular emphasis on equal and
proportional women
representation.
Confidence building and inducing ownership
feelings with overall transparency among the
stake-holders.
Approval of proposals by the village
community
The mitigation measures for the negative impact of the proposed activities and
monitoring indicators for the concerned activities have been tabulated below:-

(Table 7- g) - MITIGATION MEASURES FOR NEGATIVE IMPACTS AND MONITORING INDICATORS Subprojects/ activities Negative Impacts Mitigation Measures Monitoring indicators Construction/ Infrastructure Induced Degradation 1. Drainage line
treatment
2. Soil and water
conservation Link
road 3. Storage facilities 4. Marketing facilities
Soil loss during the construction of
engineering structures and quarrying for
stone and other materials
Siltation of water bodies downstream
during the construction of engineering
measures.
Maintenance of the structures will require
additional responsibilities to the
stakeholders.
Low quality constructions may lead to
failure and more hazards in downstream
Destabilization of the land and soil
erosion/landslips along the road cuttings.
Siltation of water bodies downstream due
to runoff.
Destruction of local flora during road
construction and also along the roads.
Construction of the structures may cause
some soil erosion.
Deterioration of cultural institutions (such
as barter systems, helping attitude etc.)
Treatment of the destabilized sites
through vegetative measures, jute
netting, etc.
Marginal groups should be given priority
in the local employment generation.
Quality of constructions should be
ensured to reduce the failure and more
hazards in downstream.
Proper designing and planning for road
construction/laying will stabilize the land
and reduce soil erosion/landslips.
Bio-physical measures to rehabilitate
disturbed land to check soil erosion.
Use of land not suitable for other
productive purposes may be brought
under infrastructure activities.
Preference to marginal groups in
employment engraftation.
Incentive to ideal persons to promote
and uphold the culture and strengthening
of local institutions to deal with anti-
social activities.
Conservation of soil
measured by stabilized
erosivity, gullies etc.
Reduction/increase in the
frequency of slope slippages ,
debris flow, swollen streams,
flash flood in downstream
Increase/decrease in water
yield in the downstream
sources and duration of water
discharge
Increase/decrease in
number of link paths
Availability/non-availability in
off-season food products
Increase / decrease
Productive land use for
infrastructure
Improvement in incomes of
vulnerable groups (child
labour) and leisure time.
Increase /decrease in
nutrition and education levels
Water Harvesting 1. Village Pond
2. Irrigation Channel
3. Water Supply through
More labour/money is required to maintain
the water structures.
Water logging due to improper drainage.
Water pollution through deposition of
waste materiel due to public use.
Health impacts due to breeding of
mosquitoes.
Soil conservation measures around the
structures (bio-engineering measures).
Disposal of waste water away from the
ponds and proper drainage
Regular disinfections by chlorination and
use of filters will reduce chances of
water borne diseases.
Increase/decrease in water
use efficiency for all activities
e.g., household consumption,
irrigation, drinking, etc.
Increase/decrease in irrigated
area

138
Pipelines
4. Roof Water
Harvesting
5. Ground water
harvesting (Digging of
wells)
Disputes over water sharing (domestic
demand vs irrigation demand) may arise.
Mud formation along the water distribution
points
Marginal farmers are deprived from the
benefits as they have small holdings.
More chances of water borne diseases if
the unclean water is consumed without
treatment
Seepage/leakage in roof tops and under
water tanks.
Drawing underground water may lead to
shortage of water in other adjacent
sources.
Deposition of excavated soil damages the
surrounding vegetation
Conflicts among the users/owners of the
land where the well is dug.
Due to freezing of water in winters, water
pipes get damaged and water supply gets
interrupted.
Difficult on the part of villagers to maintain
/ repair pipelines.
Loss of land
Fish rearing to consume the mosquito
eggs.
Proper designing of the channel of size
and site of channel should be ensured.
Rules and regulations over sharing and
rational use of water to be framed by the
stakeholder communities.
Construction of smaller under ground
tanks will reduce chances of leakage.
Use of ferro-cement for repairs of tanks
will reduce chances of leakage.
Deep wells may not be dug to reduce
drawing underground water.
Selection of site to dig the well as per the
convenience and cooperation of
stakeholders to reduce conflicts among
users.
Compaction of the excavated soil in the
dug pipelines
Installation / laying of pipelines deep in
the ground will reduce freezing of water.
Skill development among villagers to
repair / maintain pipelines
Increase/decrease in crop
production
Increase/decrease in water
quality (colour, taste, odour)
Decrease/increase in time
and distance per day put in
for collection of water
Access to water by the
marginalized groups
Alternate livelihood for those
vulnerable whose land may
be affected.
Access to transhumant to
meet their water
requirements.
Forestry 1. Afforestation
2. Silvi-pasture
Introduction of exotic species.
Proliferation / dominance of invasive /
exotic species
Conflict among uses over resource sharing
Conflict among uses over resource sharing
Shortage of grazing land during initial
phase.
Selection of high productive native
species over exotic species.
Plantation of mixed broadleaf species to
supplement fodder.
Strengthening of traditional institutions
will help sort out conflict among users.
Equal sharing of resources among users
by rules/regulation.
Area covered under
afforestation (ha)
Increase/decrease in fodder /
fuelwood yield
Decrease/increase in women
labour (days) for collection of
fuel wood and fodder

Restrict rights of the people Provide alternative to meet the needs of
the people
Increase/decrease in number
of Oak seedlings/sapling
Increase/decrease in forest
crown cover/ canopy closure
Increase/decrease in soil
moisture
Increase/decrease in forest
floor vegetation and litter
layer thickness
Reduction/increase in
occurrence of fire incidences
Increase/decrease in forest
wealth (resin, NTFPs, leaf
litter layer, fodder etc.)
Increase/ decrease in the use
of non- chemical applications
e.g.,bio-pesticides,
mechanical, cultural
activities.
All receive benefits
AGRICULTURE 1. High Yielding
Varieties
2. Diversified Agriculture
3. On-Farm Cultivation
Loss in soil moisture.
Loss in soil fertility (Nitrogen, Carbon,
etc.).
Soil and water pollution due to use of
pesticides.
More demand of water for irrigation and
competing demands on surviving/existing
sources which are used for drinking.
High nutritional value traditional crops
should not be totally replaced by high
yielding varieties.
Rotation of crops and bringing the
cultivated land under leguminous crops
(pea, lentil etc.) will maintain soil fertility.
Use of bio-compost, organic mulch
(Green manure) and vermi-compost will
Damage to crops (resistance
against diseases, frost,
drought etc.)
Production of grain, straw and
other plant products
Quality of production (taste,
odour, colour, perishability
etc.)

140
(Vegetables, spices and condiment)
4. Terrace Repairs 5. Vegetative
Boundary
Pressure on local forests/ vegetation for
fodder for animals and packaging
material.
Loss of traditional / indigenous practices
of crop cultivation.
HYVs are labour intensive and bring more
workload on women.
Marginal groups (landless
farmers/labourers) will less benefit, since
they do not have land to bring under
HYVs
Due to monoculture chances of crop
failure due to frost/fog, insect/pest and
diseases.
Discontinuation of barter system and
more dependency on external resources /
agents and, therefore, loss of self-
dependency.
Possibility of loss of local
races/cultivars/gene pools/ crop varieties
Conflicts among the neighbouring farmers
due to the shade caste from vegetative
field boundary
result in lesser use of permissible
chemical fertilizers and pesticides
Promotion of agro-forestry will maintain
biological fertility of soil.
Planting of nitrogen fixing species on
the crop field bunds will help maintain
biological fertility of soil.
Selection of low water demanding crops
and rain water harvesting; storage of
surface water (of streams, nalla, etc.)
through water storage ponds will help
harvest more water for use in HYV
cropping.
Plantation/protection of pest controlling
plants (Marigold, etc.).
Levelling of crop fields and maintenance
of terraces / bunds to check water runoff
and soil loss
Plantation of fodder species in the
unculturable wastelands will supplement
fodder.
More participation of males in
agricultural activities will reduce work
load on women.
Rotation of crops periodically will restore
the soil fertility.
Use of waste bio-products for packaging
Protected cultivation (use of polyhouse,
polypit, polytrench, etc.) will reduce the
chances of HYV crop failure.
Increase/decrease in per unit
land economic benefits
Changes in nature of soil
(fertility, hardness, moisture,
colour etc.)
Quantity of seeds produced
Reduction/increase of soil
erosion and water runoff
Increase / decrease in work
load on women
Number of local crop varieties
grown and area under them
Increase/ decrease in the use
of non- chemical applications
e.g.,bio-pesticides,
mechanical, cultural activities

HORTICULTURE 1. Fruit Crops 2. Medicinal Plants 3. Floriculture
Soil contamination due to use of chemical
fertilizers and pesticides and herbicides.
Increase in water consumption, therefore
depletion in water resources.
Increase in water pollution due to use of
pesticides / fertilizers.
The marginal landholders will less benefit,
as they may not have land to bring under
horticulture.
Possible eruption/increase in anti-social
practices such as drinking due flow of cash
after harvest.
Health hazards due to more use of
chemical fertilizers & pesticides
Lesser use of permissible chemical
fertilizers / pesticides (Tables 5 & 6) will
reduce chances of soil contamination
and water pollution.
Higher use of bio-fertilizers (bio-
compost, vermicompost, microbial
inoculants, etc.) and bio-pesticides will
reduce chances of soil contamination
and water pollution
Selection of crops with high efficiency in
water utilization and high yield will
reduce pressure on water use.
Rain water harvesting; storage of
surface water (of streams, nalla, etc.)
through water storage ponds will
supplement to water needs in HYV
cropping..
Preference in employment (labour) to
marginal groups.
Increase or decrease of
production of fruits and other
plant products
Quality of production (taste,
odour, colour, perishability
etc.)
Increase / decrease in
economic benefits per unit
land
Damage of crops against
diseases, frost, drought, etc.
Increase/ decrease in the use
of non- chemical applications
e.g.,bio-pesticides,
mechanical, cultural activities
LIVESTOCK 1. Natural breeding
2. Artificial insemination
3. Use of Urea-
Molasses blocks
4. Fodder management
5. Veterinary camps
Introduction of exotic/alien species of
grasses and fodder crops to meet the
demand of fodder that dominate the local
species.
Hybrid animals are more prone to
diseases.
Hybrid animals require more provisions for
health care.
Limited breeding facility (a bull can serve
only 2 animals in a week) in case of hybrid
animals.
Hybrid animals are more prone to
Limited area should be brought under
exotic species of grass plantation.
Timely assistance from the Animal
Health Department (AHD) or WMD for
health care provisions.
Control feeding of urea-molasses bricks
will not result in poisoning.
Farmers training and awareness
programmes to check the quality of the
urea-molasses brick and poisoning.
Proper packing and storage of treated
fodder will not result in poisoning.
Reporting of animalcoverage
Non-occurrence of diseases/
disease outbreaks
Production of milk, meat
enhancement
Overall
improvement/deterioration in
productivity of milk, meat etc.
Quantity of fodder
saved/consumed.
Enhancement/decrease in
fodder production

142
diseases.
Hybrid animals require intensive care
attention.
Loose/moisturised feeding of urea-
molasses brick may lead to poisoning.
Improper treatment of grasses or straw
might lead to food poisoning.
Dependency on professionals in the
artificial insemination and other activities
and in the absence of professionals quality
of service will deteriorate.
Poor quality vaccination may increase the
out-break of diseases.
Veterinary camps may be sponsored
from Central Kit.
Services should be provided by
professionals.
Shelter for animals owned by
transhumant.
Increase/reduction in work
load of women
Changes in animal type
(animal composition).
Increase/ decrease in the
use of drugs and pesticides
Facilities extended to
transhumant
INCOME GENERATING ACTIVITIES (IGA) 1. NTFPS
2. Decorative items
3. Wood craft
4. Bamboo products
5. Nursery
6. Mushroom
7. Beekeeping
8. Integrated fish
farming
9. Woollen products
Conflict among the users over common
resources
Chances of excessive harvest of a
particular species / plant parts
Destabilization of stabilized slopes dug to
remove soil for plant raising in the nursery
More demand for water for many IGA
activities.
Risk of food poisoning due to unaware use
of over grown / decayed mushroom.
Chances for economic risk due to death of
fishes due to diseases.
Water pollution due to processing of wool
for making products.
Possible occupational health hazards
during wool processing.
Strengthening of village resource
management institutions to reduce
conflicts among the users over common
resources
Prohibited use of species to avoid over
exploitation.
Use of Styrofoam tray to reduce soil loss
in nursery activities.
Use of water saving techniques / water
harvesting to meet demand of water in
IGA activities.
Awareness among the users and proper
training will help the users in mushroom
and fish farming activities.
Processing of wool washing not be done
directly in water sources.
Use of masks or nose cover (cloth)
during wool processing.
Number of plants of different
species raised
Increase/decrease in
productivity.
Increase/decrease in income
of beneficiary
Participation of vulnerable
groups in decision making at
the watershed level.

Social Mobilization / Formation of Community Groups
Maintenance of records for:
How many people of the
Watershed Committee of GP
(including Women, SC, ST,
transhumant, BPL and other
vulnerable and weaker
sections) attended the
meeting.
Number of beneficiaries
(including Women, SC, ST,
BPL and other vulnerable and
weaker sections)
Whether every member of the
beneficiary group is
participating or not?
Increase/decrease in labour
demand.


144
CHAPTER-8 IMPLEMENTATION STRATEGY
The major activities of the watershed development project would be sequenced into
three phases
I. Preparatory Phase : The watershed development team (WDT) shall facilitate
in the formation of the local level institutions, Watershed Committees (WC),
Self Help Groups (SHG) and User Groups (UGs)
II. Watershed works Phase :
III. Consolidation and withdrawal Phase :
INSTITUTIONAL ARRANGEMENT
The principles of new common guidelines would be followed for implementation of
Integrated Watershed Management Projects. An appropriate institutional
arrangement would be made at various levels for effective decision making and
professional management of the projects.
State level Institutional arrangement- STATE LEVEL NODAL AGENCY:
Watershed Management Directorate in Uttarakhand has been declared as a
nodal department and State Level Nodal Agency (SLNA) has also been
constituted under the chairmanship of Additional Chief Secretary by the State
Government to implement new Common Guidelines. The SLNA will be having
an independent bank account. Central assistance for SLNA will be transferred
directly to the account of SLNA. The SLNA will sign an MOU with the
Departmental Nodal Agency setting out mutual expectations with regard to
performance, timelines and financial parameters including conditions related to
release of funds to SLNA. The SLNA will be required to review the programme
and provide enabling mechanism to set up State Data Cell and ensure regular
reporting to the Central Government/ Nodal Agency at the central level in the
Department. There would be multidisciplinary professional support team at the
State level to implement the programme. The State Level Nodal Agency is
having a full-time CEO who is a serving Government officer and is also the Chief
Project Director, Watershed Management Directorate, Uttarakhand.

145
The SLNA consists of one representative from the NRAA, one representative
from the Central Nodal Ministry, one representative from NABARD, one
representative each from the State Department of Rural Development,
Agriculture, Animal Husbandry and allied sector, one representative from
Ground Water Board and one representative from an eminent voluntary
organization and two professional experts from research institutes / academia of
the state. There is also representation from NREGA and other related
implementing agencies at the state level.
The SLNA will sanction watershed projects for the State on the basis of
approved state perspective and strategic plan as per procedure in vogue and
oversee all watershed projects in the state within the parameters set out in these
Guidelines.
A Team of 4 to 7 professional experts nominated to assist the State Level Nodal
Agency. This team is selected by the State Level Nodal Agency from the line
departments. Their disciplines will, inter-alia, include agriculture, water
management, capacity building, social mobilisation, information technology,
administration and finance/ accounts, etc. A requisite number of administrative
staff is deputed to support this team of experts.
The main functions of the SLNA will be to:
a) Prepare a perspective and strategic plan of watershed development for the
state on the basis of plans prepared at the block and district level and indicate
implementation strategy and expected outputs/outcomes, financial outlays and
approach the Nodal Agency at the central level in the Department for appraisal
and clearance.
b) Establish and maintain a state level data cell from the funds sanctioned to the
States, and connect it online with the National Level Data Centre.
c) Provide technical support to District Watershed Development Units (DWDU) of
the state.
d) Approve a list of independent institutions for capacity building of various
stakeholders within the state and work out the overall capacity building strategy
in consultation with NRAA/Nodal Ministry.
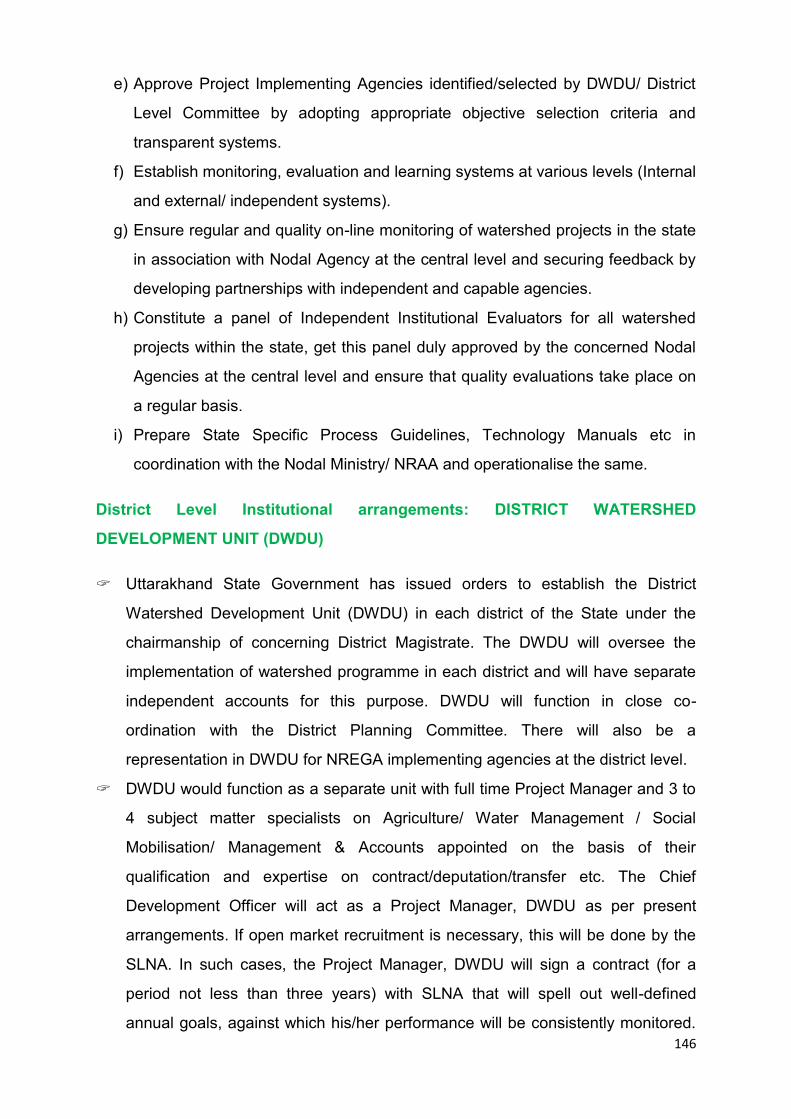
146
e) Approve Project Implementing Agencies identified/selected by DWDU/ District
Level Committee by adopting appropriate objective selection criteria and
transparent systems.
f) Establish monitoring, evaluation and learning systems at various levels (Internal
and external/ independent systems).
g) Ensure regular and quality on-line monitoring of watershed projects in the state
in association with Nodal Agency at the central level and securing feedback by
developing partnerships with independent and capable agencies.
h) Constitute a panel of Independent Institutional Evaluators for all watershed
projects within the state, get this panel duly approved by the concerned Nodal
Agencies at the central level and ensure that quality evaluations take place on
a regular basis.
i) Prepare State Specific Process Guidelines, Technology Manuals etc in
coordination with the Nodal Ministry/ NRAA and operationalise the same.
District Level Institutional arrangements: DISTRICT WATERSHED
DEVELOPMENT UNIT (DWDU)
Uttarakhand State Government has issued orders to establish the District
Watershed Development Unit (DWDU) in each district of the State under the
chairmanship of concerning District Magistrate. The DWDU will oversee the
implementation of watershed programme in each district and will have separate
independent accounts for this purpose. DWDU will function in close co-
ordination with the District Planning Committee. There will also be a
representation in DWDU for NREGA implementing agencies at the district level.
DWDU would function as a separate unit with full time Project Manager and 3 to
4 subject matter specialists on Agriculture/ Water Management / Social
Mobilisation/ Management & Accounts appointed on the basis of their
qualification and expertise on contract/deputation/transfer etc. The Chief
Development Officer will act as a Project Manager, DWDU as per present
arrangements. If open market recruitment is necessary, this will be done by the
SLNA. In such cases, the Project Manager, DWDU will sign a contract (for a
period not less than three years) with SLNA that will spell out well-defined
annual goals, against which his/her performance will be consistently monitored.

147
The arrangements for setting up/ strengthening the DWDUs/District Data Cell
will be financially supported by the Government of India after review of available
staff, infrastructure and the actual requirement.
The main functions of DWDU will be as follows:
a) Identify potential Project Implementing Agencies (PIAs) in consultation with
SLNA as per the empanelment process as decided by the respective state
governments.
b) Take up the overall responsibility of facilitating the preparation of strategic and
annual action plans for watershed development projects in respective districts.
c) Providing professional technical support to Project Implementing Agencies
(PIAs) in planning and execution of watershed development projects.
d) Develop action plans for capacity building, with close involvement of resource
organizations to execute the capacity building action plans.
e) Carry out regular monitoring, evaluation and learning.
f) Ensure smooth flow of funds to watershed development projects.
g) Ensure timely submission of required documents to SLNA / Nodal Agency of
the Department at central level.
h) Facilitate co-ordination with relevant programmes of agriculture, horticulture,
rural development, animal husbandry, etc with watershed development projects
for enhancement of productivity and livelihoods.
i) Integrate watershed development projects/ plans into District Plans of the
district planning committees. All expenditure of watershed projects would be
reflected in district plans.
j) Establish and maintain the District Level Data Cell and link it to the State Level
and National Level Data Centre.
Role of Panchayati Raj Institutions at district and intermediate levels:
The full responsibility of overseeing the watershed program within the district will
lie with the DWDU which will work in close collaboration with the District Planning
Committee (DPC). The DPC will provide full governance support to the
programme. The DPC will approve the perspective and annual action plans

148
relating to watersheds projects in the district. DPC will integrate the watershed
development plans with over all district plans and also oversee its
implementation. DWDU will help the DPC in providing oversight and ensuring
regular monitoring and evaluation of the programme. The District Panchayat /
Zilla Parishad will have an important role of governance in matters relating to the
co-ordination of various sectoral schemes with watershed development projects,
review of progress, settling disputes etc. Where the Panchayat system is not in
operation, this role will be played by the DWDU/District Autonomous Councils.
Similarly, Intermediate Panchayats have an important role in planning the
watershed development projects at the intermediate level. They can also provide
valuable support to PIAs and Gram Panchayats/ Watershed Committees in
technical guidance with the help of their subject matter specialists.
Institutional Arrangements at Project Level: PROJECT IMPLEMENTING
AGENCY (PIA)
SLNA will select and approve the PIAs following appropriate mechanisms for
Districts. These PIAs may include relevant line departments, autonomous
organizations under State/ Central Governments, Government Institutes/
Research bodies, Intermediate Panchayats, Voluntary Organizations (VOs).
However, the following criteria will be followed in the selection of the PIAs:
PIA should preferably have prior experience in watershed related aspects or
management of watershed development projects.
PIA should be prepared to constitute dedicated Watershed Development
Teams.
Voluntary Organizations (VOs): Voluntary Organizations will have an
important role in the program and their services will be utilized substantively in
the areas of awareness generation, capacity building, IEC and social audit
among others. As far as direct implementation of the programme is
concerned, Voluntary Organizations (VOs) with established credentials may
be chosen as PIAs on the basis of detailed criteria as enumerated below.
The Voluntary Organizations (VOs) would need to satisfy the following criteria to be
selected as PIA:

149
Should be a registered legal entity of at least 5 years standing.
Should have had at least 3 years of field experience in the area of community
based Natural Resource Management and livelihood development.
Should not have been blacklisted by CAPART or any other Department of
Government of India or State Government.
Should be equipped with a dedicated, multidisciplinary team with gender
balance.
Should furnish three years balance sheet, audited statement of accounts and
income returns. All accounts of the organization should be up to date.
Should furnish the profile of its Board of Directors.
Should have successfully implemented projects independently.
It will be subjected to the following conditions:
(i) At any point of time, one VO cannot be assigned more than 10,000 ha area in
a district.
(ii) At any point of time, one VO cannot be assigned more than 30,000 ha area in
a State.
(iii) In any case, not more than 1/4th of the total Projects at a time in a State to be
implemented by VOs.
Selected PIAs will sign a contract/MOU with the concerned DWDUs/ District
Level Committee. It will spell out well-defined annual outcomes, against which the
performance of each PIA will be monitored each year and evaluated on a regular
basis by institutional evaluators from a panel approved by the SLNA /
Departmental Nodal Agency at the central level.
Each PIA must put in position a dedicated watershed development team (WDT)
with the approval of DWDU. The WDT will be hired on contract / deputation /
transfer etc for a term not exceeding the project period. The composition of the
WDT will be indicated in the contract/ MOU. No programme funds for DPR and
watershed works under any circumstances should be released to either the PIA
or Watershed Committee (WC) unless the composition of the WDT has been
clearly indicated in the MOU/ contract and the team members are fully in place.

150
Roles and Responsibilities of the PIA: The Project Implementing Agency (PIA) will
provide necessary technical guidance to the Gram Panchayat for preparation of
development plans for the watershed through Participatory Rural Appraisal (PRA)
exercise, undertake community organization and training for the village communities,
supervise watershed development activities, inspect and authenticate project
accounts, encourage adoption of low cost technologies and build upon indigenous
technical knowledge, monitor and review the overall project implementation and set
up institutional arrangements for post-project operation and maintenance and further
development of the assets created during the project period.
The PIA, after careful scrutiny, shall submit the Action Plan for Watershed
Development Project for approval of the DWDU and other arrangements. The PIA
shall submit the periodical progress report to DWDU. The PIA shall also arrange
physical, financial and social audit of the work undertaken. It will facilitate the
mobilization of additional financial resources from other government programmes,
such as NREGA, SGRY, National Horticulture Mission, Tribal Welfare Schemes,
Artificial Ground Water Recharging, Greening India, etc.
WATERSHED DEVELOPMENT TEAM (WDT):
The WDT is an integral part of the PIA and will be set up by the PIA. Each WDT
should have at least four members, broadly with knowledge and experience in
agriculture, soil science, water management, social mobilisation and institutional
building. At least one of the WDT members should be a woman. The WDT members
should preferably have a professional degree. However, the qualification can be
relaxed by the DWDU with the approval of SLNA in deserving cases keeping in view
the practical field experience of the candidate. The WDT should be located as close
as possible to the watershed project. At the same time, it must be ensured that the
WDT should function in close collaboration with the team of experts at the district
and state level. The expenses towards the salaries of the WDT members shall be
charged from the administrative support to the PIA. DWDU will facilitate the training
of the WDT members.

151
Roles and responsibilities of WDT: The WDT will guide the Watershed Committee
(WC) in the formulation of the watershed action plan. An indicative list of the roles
and responsibilities of the WDT would include among others, the following.
o Assist Gram Panchayat / Gram Sabha in constitution of the Watershed
Committee and their functioning.
o Organizing and nurturing User Groups and Self-Help Groups.
o Mobilising women to ensure that the perspectives and interests of women are
adequately reflected in the watershed action plan.
o Conducting the participatory base-line surveys, training and capacity building.
o Preparing detailed resource development plans including water and soil
conservation or reclamation etc. to promote sustainable livelihoods at household
level.
o Common property resource management and equitable sharing.
o Preparing Detailed Project Report (DPR) for the consideration of Gram Sabha.
o Undertake engineering surveys, prepare engineering drawings and cost
estimates for any structures to be built.
o Monitoring, checking, assessing, undertaking physical verification and
measurements of the work done.
o Facilitating the development of livelihood opportunities for the landless.
o Maintaining project accounts.
o Arranging physical, financial and social audit of the work undertaken.
o Setting up suitable arrangements for post-project operation, maintenance and
future development of the assets created during the project period.
Local Level Institutions: WATERSHED COMMITTEE (WC)
The Gram Sabha will constitute the Watershed Committee (WC) to implement the
Watershed project with the technical support of the WDT in the village. The
Watershed Committee (WC) has to be registered under the Society Registration
Act, 1860. The Gram Sabha may elect/appoint any suitable person from the
village as the Chairman of Watershed Committee. The secretary of the
Watershed Committee (WC) will be a paid functionary of the Watershed
Committee (WC). The Watershed Committee (WC) will comprise of at least 10

152
members, half of the members shall be representatives of SHGs and User
Groups, SC/ST community, women and landless persons in the village. One
member of the WDT shall also be represented in the Watershed Committee
(WC). Where the Panchayat covers more than one village, they would constitute
a separate subcommittee for each village to manage the watershed development
project in the concerned village. Where a watershed project covers more than
one Gram Panchayat, separate committees will be constituted for each Gram
Panchayat. The Watershed Committee (WC) would be provided with an
independent rented office accommodation.
The Watershed Committee will open a separate bank account to receive funds
for watershed projects and will utilise the same for undertaking its activities. The
expenses towards the salaries of the WDT members and Secretary of Watershed
Committee (WC) shall be charged from the administrative expenses under the
professional support to the PIA.
Secretary, Watershed Committee: The Secretary of the Watershed Committee
(WC) will be selected in a meeting of the Gram Sabha. This person would be an
independent paid functionary distinct and separate from the Panchayat Secretary.
He would be a dedicated functionary with no responsibilities other than the
assistance to the Watershed Committee (WC) and would work under the direct
supervision of the President of Watershed Committee (WC) and would be selected
on the basis of merit and experience. The expenses towards the honorarium to be
paid to Secretary of Watershed Committee (WC) will be charged from the
administrative support to the PIA. The Secretary will be responsible for the following
tasks:
Convening meetings of the Gram Sabha, Gram Panchyat, Watershed Committee
for facilitating the decision making processes in the context of Watershed
Development Project.
Taking follow-up action on all decisions.
Maintaining all the records of project activities and proceedings of the meetings of
Gram Panchayat, Watershed Committee (WC) and other institutions for
Watershed Development Project.
Ensuring payments and other financial transactions.

153
Signing the cheques jointly with the WDT nominee on behalf of the Watershed
Committee.
SELF HELP GROUPS (SHG): The Watershed Committee shall constitute SHGs in
the watershed area with the help of WDT from amongst poor, small and marginal
farmer households, landless/asset less poor agricultural labourers, women,
shepherds and SC/ST persons. These Groups shall be homogenous groups having
common identity and interest who are dependent on the watershed area for their
livelihood. Each Self Help Group will be provided with a revolving fund of an amount
to be decided by the Nodal Ministry.
USER GROUPS (UG): The Watershed Committee (WC) shall also constitute User
Groups in the watershed area with the help of WDT. These shall be homogenous
groups of persons most affected by each work/ activity and shall include those
having land holdings within the watershed areas. Each User Group shall consist of
those who are likely to derive direct benefits from a particular watershed work or
activity. The Watershed Committee (WC) with the help of the WDT shall facilitate
resource-use agreements among the User Groups based on the principles of equity
and sustainability. These agreements must be worked out before the concerned
work is undertaken. It must be regarded as a pre-condition for that activity. The User
Groups will be responsible for the operation and maintenance of all the assets
created under the project in close collaboration with the Gram
PANCHAYAT AND THE GRAM SABHA: The Gram Panchayat would perform the
following important functions:
Supervise, support and advise Watershed Committee from time to time.
Authenticate the accounts/ expenditure statements of Watershed
Facilitate the convergence of various projects/ schemes to institutions of
watershed development project.
Maintain asset registers under watershed development projects with a view to
retain it after the watershed development project.
Provide office accommodation and other requirements to Watershed Committee.
Allocate usufruct rights to deserving user groups/ SHGs over the assets created.

154
The Uttarakhand State IWMP is based on joint relationship among three entities: (i)
village communities and GPs; (ii) WMD/SLNA and (iii) PIA’s. All these three
stakeholders will fulfill their respective roles and responsibilities for the project to be
successful. Specifically:
Village community and GP : Will plan and implement the project
WMD/SLNA: Provide overall coordination and assist the village communities & GPs
PIA: Carry out social mobilization, may provide technical assistance and undertake
other activities as agreed to with GPs and WMD
ROLES AND RESPONSIBILITIES
A. Panchayat level Institutions (Table 8-a.)
S. No.
Institution Composition Role Accountable to
1. Gram Sabha All adult voters of the Gram Panchayat
To facilitate in the constitution of WC.
To elect/ appoint any suitable person from the village as the chairman of Watershed Committee.
Ensure inclusion of disadvantaged groups such as women, poor, SC/ST, transhumant.
To approve the DPRs.
To approve / pass the rules for WDF.
Village community
2. Gram Panchayat
Gram Pradhan & Ward Members
Supervise / support and advise Watershed Committee.
Authenticate the accounts / expenditure statements of WC and other institutions of Watershed Project.
Facilitate the conversion of various projects/schemes to IWMP.
Maintain assets registers under IWMP with a view to retain it after the project.
Provide office accommodation and other requirements to WC.
Allocate usufruct rights to deserving user groups / SHGs over the assets created.
To operate the WDF bank account.
Gram Sabha and WMDs
3. Watershed Committee
Chairman of WC to be elected / appointed by Gram Sabha
should have atleast 10 members half of the
Assist in the preparation of DPRs.
Manage the SHGs Fund.
Manage the watershed development fund (WDF).
Implementation of the watershed project.
Maintain the accounts of the Watershed Project.
Prepare the rules for operation of WDF.
GP

155
S. No.
Institution Composition Role Accountable to
members shall be representatives of SHGs and user group, SC, ST community, women and landless. One member of WDT to be represented in the WC.
Submit timely monthly and annual financial reports to WMD.
Ensure that the WC annual accounts are audited on a timely basis and submitted to the WMD
4. Van Panchayat
VP Sarpanch, VP Members
Implement all plantation related activities under the project
Coordinate with concerned Forest Department office for technical and management issues.
GP
5. Secretary Watershed Committee
An independent paid functionary selected by Gram Sabha
Convening of all Mandatory and all required GP , Gram Sabha and WC meetings and upkeep of minutes of the meeting
Act as co-signatory along with WDT to operate the Watershed Development Project account
Assist in the procurement process by being designated as Secretary of the Procurement Committee
Maintain and safe custody of all records Accounts and cash
Timely submission of all returns , reports and utilization certificates
Timely and satisfactory Audit of GP accounts.
Maintain all accounts books related to the project
Make all vouchers & prepare cheques
Collect dues from beneficiaries & issue receipts
Ensure that records are maintained for all labor contributions from beneficiaries;
Prepare all financial documentation & reports as required b the project
GP for Project reporting system to DWDU.
B. Field level institutions (Table 8-b.)
S. No.
Institution Composition Role Accountable to
1. WDT 4-5 experts Assist GP / GS in constitution of the WC and their functioning.
Organizing and nurturing user groups and self help group.
Mobilize women to ensure that their perspective and interests are reflected
PIA & DWDU

156
S. No.
Institution Composition Role Accountable to
in the Watershed Plan.
Assist in conducting the participatory baseline surveys training and capacity building.
Preparing detailed resource development plans.
Common property resource mgt. and equitable sharing.
Undertake engineering surveys prepared drawing and cost estimates of any structures to be built.
Preparation of DPR.
Monitoring, checking, assessing, undertaking, physical verification and measurement of the works done.
Facilitating the development of livelihood opportunities.
Maintaining project accounts.
Arranging physical, financial and social audit of the works.
Setting up suitable arrangements for post project operation, maintenance and future development of the asset created.
2. Project Implementation Agency (PIA)
Appointed by the SLNA
Provide technical guidance to the GP for preparation of the DPRs.
Undertake community mobilization and training of the village community.
Supervise watershed development activities.
Inspect and authenticate project accounts.
Encourage adoption of low cost technologies and build upon Indigenous Technical Knowledge.
Monitor and review the overall project implementation.
Set up institutional arrangements for post project operation.
Submit action plan for approval to DWDU.
Submit periodical progress report to DWDU.
Arrange physical, financial and social audit of the work undertaken.
DWDU and
SLNA
3. DWDU Appointment by SLNA
Identify potential PIAs in consultation with SLNA.
Facilitate the preparation of watershed development plan for the respective districts.
Provide professional, technical support to PIA in planning and execution of the projects.
Develop action plan for capacity
SLNA

157
S. No.
Institution Composition Role Accountable to
building.
Carry out regular monitoring, evaluation and learning.
Ensure smooth flow of funds to watershed development projects.
Ensure timely submission of required documents to SLNA.
Facilitate coordination with relevant programs of other line departments with the watershed development projects.
Integrate watershed development project/ plans into district plans of DPCs.
Established and maintain the district level data cell and link to national level data centre.
C. State level institutions (Table 8-c.)
S. No.
Insti- tution
Composition Role Accoun-table to
1. CEO, SLNA
Appointed by State Govt.
Prepare a perspective and strategic plan of watershed development for the state. Indicating implementation strategy, expected output, financial outlay and approach central level nodal agency for appraisal and clearance.
Establish and maintain a state level data cell and connected with national level data centre.
Provide technical support to the DWDUs.
Approve and facilitate in building a state level consortium for capacity building for various stakeholders.
Approved PIAs identified / selected by DWDUs.
Establish monitoring, evaluation and learning system at various levels.
Ensure regular and quality on line monitoring of watershed projects.
Constitute a panel of independent institutional evaluators and get this panel approved by the Central Level Nodal Agency.
Prepared state specific process guidelines, technologies manuals etc.
SLNA
2. State Steering Committee
Comprises Secretary level officers. Chaired by the Chief Secretary.
Facilitate inter-departmental coordination
Overall approval to work plans of WMD
State Govt.

158
Conflict resolution: Every attempt should be made to resolve all conflicts within the
Gram Sabha and Watershed Committees. The WDT will facilitate the villagers in this
regard.
In case of conflict among GP, WC, WDT and PIAs, the DWDUs will act as the
conflict resolution officer. If Gram Sabha so feels that it requires formal arbitration, a
three-member committee will be set up for the purpose of arbitration. It shall
comprise the PM, DWDU, a nominee of the Gram Sabha and a nominee of the
WDT.
In the above case if either party is unsatisfied with decision of the DWDUs then they
can Appeal to Additional Director, SLNA of the region. The decision of the committee
at Additional Director, level shall be final and binding on all parties.
PREPARATION & PARTICIPATION PROCESS
I. Initial preparation by SLNA:
Who: SLNA and DWDU’s
When: Before village entry
Preparation of communication and information packages for GPs and village
communities
Training/Orientation of project functionaries (DWDU, PIAs) on the vision of the
project, the processes, roles and responsibilities of each entity, and rules
Training of project functionaries on how to work with GPs and village communities
in preparing a Plan (focus on process, roles and responsibilities, rules, from
where to seek what information).
Development of training module for Secretary Watershed Committee.
SLNA may seek external assistance to carry out training and communication
activities. Some notable sources of the state government are Uttarkhand
Academy of Administration, Nainital; Forest and Van Panchayat Training Institute,
Haldwani; State Institute of Rural Development, Rudrapur; CSWRTI, Dehradun;

159
Garhwal University; Kumaon University; and GBP University of Agriculture and
Technology, Pantnagar.
Selection of PIAs by SLNA/ DWDUs.
Formation of WDT by the PIA’s.
II. Orienting communities and GPs to the project:
Who: PIA staff supported by communication activities
When:Soon after village entry
Entry of WDT into village to give basic information on the project
Consensus among communities and GP to participate in the project
Signing of MOU between the WC and PIAs intent to participate in the project as
per the project rules and guidelines for participation and implementation.
Social mobilization, including PRA, at village and GP levels; facilitation by WDT.
Use of communication tools such as print material, audio-visuals, folk
performances to enhance awareness among the community
Helped by WDT and community carry out Participatory Communication Needs
Assessment (PCNA) to identify communication gaps and develop measure and
process to address them
Community receives detailed information on watershed management, concept of
community-driven and process-led development, concept of ownership, and
details of its contribution to the project
Information on the project such as vision and objectives, rules, roles and
responsibilities of each entity, process of participation and implementation
Information sources such as posters and brochures
Community receives complete information on financial allocation for its GP and
details of the allocation formula

160
Detailed information on how community will prepare the Watershed Development
Plan and complete information on processes, rules and guidelines.
III. Selection and training of Secretary Watershed Committee :
Who: Selection by GP/ GS; training by DWDUs
When: After sharing complete project-related information with GP & community
Secretary needed to help WC and individuals maintain proper accounts and
records, and facilitate smooth transfer of funds.
GP/GS/ WDT will be part of process to select Secretary.
Basic criteria and qualifications for Secretary fixed by PIAs / DWDU
The WC develops a set of roles and responsibilities for the Secretary WC in
consultation with the WDT.
The WDT will develop a list of three qualified persons from the GP/GS who are
interested in working as the Secretary.
The President WC will finalize the candidate from this list to work as the
Secretary.
The DWDU shall be responsible for providing adequate training to the selected
candidate within four months.
The Secretary will receive his/her honorarium directly from the PIA.
The Gram Panchayat may terminate the services of a particular Secretary if Gram
Sabha passes a resolution to this effect. The WDT shall then make search for
another Secretary at the earliest in consultation with the Gram Panchayat.
Capacity Building Activities
Sensitization and training of project staff (SLNA / DWDUs / PIAs) and GPs to facilitate the implementation of a community driven watershed project
Comprehensive information, training and capacity building of individuals and CBOs in the village communities to participate effectively in the project
Training of PIA staff, GPs and Watershed Committees, on the rules and regulations of the project
Training of Secretary Watershed Committees to provide services to the Watershed Committees

161
IV Development of Village Watershed Proposal :
Who: Watershed Committee
When: After receiving complete information and initial training on the project
The Watershed Committee of the Revenue Village is responsible for developing
its proposal.
Each member of the RV shall get the opportunity to present his/her views on what
activities should be included in the Proposal
The watershed committee and revenue village must thoroughly understand the
rules and processes of the project.
V. Application of Environment and Social Economic Framework to Village
Watershed Proposal :
Who: Watershed Committee
When: Upon selection of activities
Appendix -1 is applied to ensure that no activity on the negative list of the project
is selected.
Activities which clear Appendix-1 are subjected to Appendix-2. Those falling
under Appendix-2 will need a limited ESA conducted by an outside agency.
Only, then can they be selected for inclusion in the Village Watershed Proposal.
A set of activities, after application of Appendix -1and Appendix–2 are finalized
which will comprise the Village Watershed Proposal.
The Watershed Committee receives a firm commitment from the beneficiaries to
contribute in terms of time, material and/or money as per the project guidelines.
The Watershed Committee asks the following questions with regard to its
Proposal:
Does the Proposal meet the vision and objectives of the project?

162
Does it bring about social equity with regard to benefits being obtained by the
village community?
Was it finalized on the basis of the voice and preferences of women, poor,
SC/ST and tribal/transhumant population?
Have the WC planned for reducing negative impacts and incorporated
mitigating measures to protect the environment?
Appendix–3 is used and filled up to ensure compliance with E&SA of the
project. Completed copy of Appendix-3 shall form part of the Village
Watershed Plan. Table 7-g may be used for identifying mitigating measure for
negative social and environmental impacts of an activity.
Attention will also be paid to minimizing use of pesticides and use of pesticides
only as per the Integrated Pest Management (IPM) Strategy for the project.
Village Watershed Proposal is finalized by combining all selected activities and
submitted to the WC.
VI Development of Gram Panchayat Watershed Development Plan (GPWDP):
Who: WC
The WC receives Proposals from all its Revenue Villages.
The WC shall integrate all the Proposals and form a combined plan known as
Gram Panchayat Watershed Development Plan (GPWDP). The WDT will
facilitate in the structured presentation of the GPWDP so that it makes easy
consolidation of data regarding the contents of the GPWDP at the level of PIA to
ensure provision of budget as well as monitor the progress of the activities
towards project objectives. an indicative list is given in Appendix – 4.
The GPWDP shall include an implementation plan over years and withdrawal
strategy during the fourth year.

163
The WC shall make sure that the GPWDP conforms to E&SA of the project and
shall apply Appendix- 1 & 2 and 3 to ensure the same. Completed copy of
Appendix 3 shall form part of the GPWDP. The WC may make any appropriate
changes to ensure compliance with E&SA.
Attention will also be paid to minimizing use of pesticides and use of pesticides
only for the project.
Simultaneously, the WC shall also make changes in the GPWDP to ensure that
the proposed expenditure in its GPWDP does not exceed the financial ceiling set
for the GP.
The GP will do year-wise phasing of the amount of Budget Envelop in its GPWDP
to help the DWDU/ SLNA to plan for provision of Funds in future years. These
AWPs will be revisited in the last quarter of each financial year.
The WC shall submit the GPWDP to the Gram Sabha for discussion and
approval.
The WC will submit the approved GPWDP to the concerned PIA / DWDU for
review and appraisal.
The DWDU office will appraise the GPWDPs for appraisal. After appraisal, the
DWDU / PIA will convey proposed modifications and options to the GP.
VII Plan for Enhancing Livelihood Opportunities:
In this sub component such activities will be undertaken directly by the PIA to
increase the productivity of land and other natural resources in the Gram Panchayat
with the objective to increase income levels of the people. The arrangement of
Funds for these activities is Budget envelope of GP. However the community/
individual beneficiary will make available contribution like land, manure which will not
require direct cash contribution.
Who: WDT in consultation with WC.
When: After approval of the GPWDP.

164
The activities to be done under this component are:
Farming systems improvement: The Objective of this sub component is to: (a)
disseminate technologies and provide advisory services for agriculture,
horticulture, silvi-pastoral treatments and animal husbandry; (b) provide quality
seeds and seedlings; and (c) establish linkages between UGs and suppliers for
processing and marketing of high value crops. The major emphasis will be the
introduction of off- season vegetables and high value crops. The project will
provide all the inputs (seed/seedlings, bio-agents and bio-fertilizers) of the
subprojects, with the condition that the land, labor, irrigation and farm yard
manure will be provided by farmers. In order to facilitate the production of
marketable produce, formation of UGs will be introduced to facilitate the
production, processing and marketing of high value crops. This subproject will
demonstrate improvements in the productivity of crops already cultivated in the
area and the introduction of new high value crops (new varieties of off-season
vegetables, fruit crops, medicinal and aromatic plants will be introduced based on
agro-climatic factors, demand and assured market). For this purpose the private
sector and Institutions and Organizations specialized in the subject concerned
can also be contracted by the DWDU. Training will also be provided in application
of new technologies; storage techniques; etc.
Identify the farmers and the lands proposed for this activity
Identify the crops , farming system in which demonstration are required by
GP
Value addition and marketing support: This sub-component will support
agribusiness development. The project will make investments that would: (i)
identify potential niche market opportunities; (ii) establish links with entrepreneurs
who could help in exploiting the market potential; (iii) disseminate appropriate
information and technology to farmers to help them to enter into production; (iv)
co-finance subprojects with UGs & SHGs (on a one-time subsidy basis); (v) co-
finance subprojects with entrepreneurs (on a one-time subsidy basis) for storage,
processing and or marketing infrastructure needed to exploit the market potential.

165
Income generating activities for vulnerable groups: This is designed to finance
small income generating micro-enterprises for vulnerable groups (women and
landless), which will promote the project’s objective of equity and sustainable
NRM. These SHGs would be identified during the watershed planning process
through a wealth/ asset ranking PRA methods). Training will be provided to
vulnerable groups to encourage their entrepreneurial development. The Income
Generating Activity proposals will be developed after the implementation of the
Entrepreneurial Development Program (EDP) and the GPWDP will only reflect the
overall envelope and the target groups. The funds will be disbursed through the
GPs to the SHGs, who will manage them. The funds will be disbursed in two
installments based on the implementation performance of the SHGs who are
managing the income generating activities for which specific indicators have been
included. The WDT’s endorsement (sign off) will be required on each proposal to
ensure that the E&SA has been applied.
Revolving Fund: Revolving fund (RF) has been provided for marginalized
groups, which are either left out or receive little benefits from the watershed
treatment activities of the project. Most of the proposed watershed interventions
are land-based and thus, to provide benefits to these groups, special activities
have to be thought that the project does not profit only the landed and affluent
sections of the village. In addition, this is a mechanism to involve these people
with the implementation of the project, who may otherwise remain indifferent.
Since all income generation activities, from the selection of the activity to the final
disposal of the product would be decided and executed by the Self Help Groups
(SHGs) themselves, a participatory process methodology would serve best. This
would not only result in poverty alleviation in tangible terms but also help
marginalized section to organize themselves into sustainable SHGs. This would go a
long way in meeting the goal of productivity enhancement of the project areas.
The overall objective of the RF is the socio-economic upliftment of women, poor,
SC/ST and transhumant communities by the expansion of income earning options
through on farm & off farm employment and sustainable and efficient use of natural
resources. Some key preconditions are needed for this:

166
Availability of infrastructure, both physical and institutional, at local level.
Access to support services (e.g. credit, inputs, training and information)
Access to markets and knowledge
Safeguard against ecological problems (e.g. land degradation,
overexploitation of natural resources and endangered bio-diversity)
Implementation Strategy for IGAs: The implementation of the strategy for
enhancing incomes of vulnerable groups will take place in seven steps:
Identification of vulnerable sections/individuals and their need assessment
Formation of SHGs of identified vulnerable groups/individuals and women
Entrepreneurship Development of the SHGs
Selection of the Income Generating Activity (IGA)
Formation of Sub Plan for RF
Implementation of Sub Plan for RF
Networking of Groups for the sustainability of IGA
VIII Identification of Vulnerable Groups and their Needs:
Who: WDT
When: After orientation of the GP & community to the project
Help the communities understand the reasons for their poverty, what
opportunities could reduce their poverty and how they can collectively act to
make this happen.
Conduct Participatory Rural Appraisal (PRA) for the identification of vulnerable
groups/individuals
Identification of vulnerable sections of the society, poorest of the poor, through
the process of wealth ranking
Ascertain their special needs and existing gaps
167
Take stock of the needs of the community for viable economic development
IX Formation of SHGs:
Who: WDT
When: After identification of vulnerable groups/individuals
SHGs of groups/individuals identified as part of the above-mentioned exercise
and will be formed as per the NABARD guidelines. Economic homogeneity and
emotional affinity will be key factors for formation of any SHG.
They will function as credit and thrift groups. However, to promote Income
Generation Activities from the beginning itself, commodity approach will be
emphasized during the formation of SHG. This will enable to develop further
linkages regarding IGAs at a cluster level.
Other factors to be considered in formation of SHGs are:
Availability of resources, needs and demands of the community as regards
taking up viable IGA in the project areas
Scenario of other ongoing IGA schemes and their beneficiaries
Members of those vulnerable groups, not covered under other ongoing
schemes will be given priority during formation of SHGs under the project
X Capacity Building of SHGs:
Who: DWDU/SLNA
When:Upon identification of capacity building needs by the SHGs & PIA staff
Prepare comprehensive capacity building plan in consultation with SHGs
Training would cover the following areas:
Aspects including market analysis and trends, pricing, rights and rules, etc.
Production aspects of IGA including technical training
Value addition and storage

168
Marketing
Record keeping, bookkeeping and management of finances
Follow up training to meet the ever-changing needs of the market
Institutional development, cooperatives, federations
The abovementioned subjects will be covered under two sub-components of
capacity building program:
i) Entrepreneurship Development Program (EDP): The EDP will be conducted
after the completion of basic modules to the SHGs and within first 18 months of
the project. It will assist the SHG members in identifying a viable activity, which
they can take up for the enhancement of their livelihood. Aspects such as market
analysis, quality control, management of finance, establishing forward and
backward linkages, pricing, rights and rules etc. will be covered through this
training.
For the selection of members for EDP, priority will be given to poor dependent on
occupation merely adequate for subsistent living. Groups who are graded ‘Good’
will be eligible for this program.
ii) Skill Training and Exposure program: Skill training will be conducted for those
members who have participated in the EDP. It is presumed that the SHG
members who start IGA activities will be given skill training and exposure.
XI Selection of IGAs:
Who: SHGs
When:After completion of EDP
Following factors may be considered for the selection of a specific IGA for a
specific group. The ES&A will also be applied at the time of the selection of IGA.
Availability of resources
Existing skills and capacity such as carpet weaving, handicraft, etc. which can
be converted into IGAs

169
Quality and marketability of the product
Sufficient demand of the product
Risk taking capacities of the groups
Financial inputs required
Forward and backward linkages
XII Sub Plan for RF:
Who: WC Assisted by WDT
When:Upon receipt of IGA proposals for funding from SHGs
Upon finalization of an IGA by the SHG, it will prepare a proposal for funding
(See Attachment F-9 for format) and submit the same to WDT for appraisal.
Through WC clearance by the WDT, will be submitted to WC which who shall
incorporate a same into its annual sub plan for IGA activities.
If a proposal is not viable, it will be sent back to the SHG for appropriate changes
and resubmitted by the SHG to WDT for appraisal. The same shall then be
submitted to the WC.
XIII Networking of Groups for the sustainability of IGAs:
Who: SHGs, Experts including WDT
When: Upon maturity of SHGs and starting of IGAs at a certain level
Upon maturity of SHGs and reaching of IGAs to a certain level, the project would
encourage the formation of Association and Federations of SHGs.
These would be based on production, processing and marketing of the products.
The activities of these institutions would include Input Management, Common
Storage Facilities, Grading and Packaging, Group Marketing, Market Outlet
Development, Joint Market Negotiation and Transport Organization.

170
Assessment of SHGs Preparation of IGA
proposal by SHGs
Appraisal by WDT
Appraisal of
proposal by WC
Release of funds
to SHG
SPA signed between
SHG & WC
XIV Utilization Mechanism for RF: Due to the limited saving capacity of SHGs,
their savings amount may not be sufficient to undertake IGAs. Thus, under the
project, it is proposed to provide working capital assistance to the SHGs engaged in
IGAs. It will serve the purpose of promotion of micro- enterprises and will work as a
Revolving Fund. This fund will be utilized by the SHG either for a joint IGA or for
individual initiatives. For additional funds, SHGs will be linked to the banks.
At revenue village level a Sub Plan will be prepared by the vulnerable groups with
the assistance of WDT. This plan will include the following:
1. Prioritization of IGA for the Revenue Village based on their viability
2. Detail out the utilization and recovery mechanism of this Revolving Fund.
This evaluation will be done by WDT after EDP and skill development program. The
indicators for the assessment of SHGs will be mainly as follows:
Regularity of meeting and attendance
Regularity of saving and common fund generated
Bylaws formed and proceeding should be recorded
Awareness about income generation activities
Capacity building ( EDP, skill development)
Further, the SHGs will carry out self-assessment to gauge their requirement of
working capital and the availability of resources. On the basis of both these
assessments, the grading of SHGs will be done and money from the Revolving Fund
will be given to such groups which will fulfil the parameters. SHGs not receiving
funding during the year will be reassessed the following year.
Fund Flow Mechanism

171
XV Review and appraisal of GPWDP:
Who: PIA & DWDU
When:After receiving proposed GPWDP from WC
Receipt of the proposed GPWDP by DWDU
Appraisal of the GPWDP by DWDU as per of E&SA
If any shortcoming is found or if the GPWDP proposes to spend beyond the
financial ceiling set for the GP, then DWDU will send it back to the WC with
written observations and recommendations.
The WC shall consider these observations and recommendations and may make
appropriate changes in its GPWDP and if need be may again go to Gram Sabha
for approval
The final GPWDP shall be resubmitted to DWDU for further implementation..
XVI Payment to WC:
Who: DWDU
When:After approval of final GPWDP by GP & submission of AWP
After approval of GPWDP by the Gram Sabha, the WC shall prepare a detailed
Annual Work Plan (AWP) for the first year. This will contain details of activities to
be funded and implemented, who shall implement them and when, who shall
benefit from them, details of beneficiary contribution, and the cost to be incurred
for each activity.
‘On-account payment’ amounting to 10% of the approved AWP amount will be
transferred to WC account by the DWDU.
The WC will need to maintain and submit books of accounts and other documents
while claiming reimbursement.
XVII Process of 2nd and 3rd year AWPs:
Who: WC
When:After successfully implementing 1st year’s AWP

172
The WC shall make a detailed AWP for the second year upon near completion of
activities listed out in the first year’s AWP.
This AWP will be submitted to the DWDU for information, MOU signed for its
implementation, and transfer of due funds to the WC Account.
Same process will be followed for AWP for the third year.
IMPLEMENTATION & FINANCIAL MANAGEMENT:
The WC will get funds for implementation from the project through their DWDU and
will also have to collect the beneficiary contributions as agreed to with SLNA. The
Funds made available to WC by the project will be of two kinds.
Implementation Fund
Revolving Fund
And the fund generated by the WC will be watershed Development Fund.
Implementation Fund: Implementation Fund will be the grant transferred to the WC
for the implementation of Project activities. As such major amounts received by the
WC will be under this head. This fund will be used only for the activities proposed in
the Project. The amount will be received in a separate Bank Account i.e.
‘Watershed Development Project Account’ which will be operated by Chairman
and Secretary of WC jointly.
Revolving Fund: This fund relates to the amounts transferred to the WC for the
purpose of enhancing equity and providing small loans to vulnerable groups in the
village. The amount will be received by the WC in its ‘Watershed Development
Project Account’.
I. Flow of Funds to the WC :
Initial On-Account Payment: On-Account payment to the extent of 10% of the Annual
Work Plan shall be given at the beginning of the Project to the WC. It will be however
adjusted on the completion of the GPWDP cycle.

173
Reimbursement of Cost of Works: During Implementation of the Project,
reimbursement of expenditure on works shall be made on submission of monthly
financial statements. All expenditures made as per the agreed work plan and GWDP,
incurred during the month will be reimbursed by the DWDU. In the event that the
money is completely spent before the end of the month, the WC can submit the
financial statements before the end of the month and receive the reimbursement.
II. Estimates and Technical Sanction:
Who: WC and PIA
When:Before initiating any activity
After preparation of detailed AWP and receipt of the initial On Account payment
from the PIA the estimate for each activity to be initiated will be prepared by the
WC with the help of the Technical Representative of the WDT in the format given
vide Appendix-5.
Technical member of the WDT will carry out the following functions in preparation
of detailed cost estimate of activities earmarked to be undertaken in a village:
The Technical Representative of WDT, along with a WC member shall take up
survey of a particular work for preparing the estimates. For Departmental works,
Respective Unit officer shall give technical approval. The design and the
estimates need be discussed with the concerned members and finalized.
Technical member of the WDT will carry out the following functions in preparation
of detailed cost estimate of activities earmarked to be undertaken in a village:
o Sanction of the Activity: A technical sanction will have to be obtained for each
estimate prepared by the GP before initiating any activity. The format of Technical
Sanction is given vide Appendix- 6.
o The competent authority to accord technical sanction for watershed works are
simplified as detailed in the table given below.

174
Technical sanction for watershed works (Table 8-d.)
Sanctioning Limit Sanctioning Authority
Upto Rs 10,000 Should be passed in the meeting of WC. No sanction from PIA required. Copy will be sent to PIA for information.
Above Rs. 10,000 Sanction from PIA is required according to norms. The estimates prepared will be submitted to the WDT by WC for according sanction from the DWDU.
Once sanction is granted, a ‘technical sanction number.’ shall be allotted for each
activity.
An Integrated Activity register shall be maintained by the Secretary at each WC.
There will be no splitting of work/activity for the purpose of bypassing sanctioning
requirement from PIA for activities above Rs. 10000.
III. Implementation Agency for Work:
The WC will have the right to appoint anyone of the following Implementers for
the implementation of the work:
The Gram Panchayat
The Individual Farmer (Beneficiary) for the work to be executed on his
individual land. (Individual will work as a contractor, in the case.)
User Group/SHG may be engaged for the activities to be implemented on
common/ community/ village assets or on individual land or asset, should the
beneficiary have no objection to this arrangement. Revenue Village
Committee will also work as a contractor.
The First Right of implementation of each work under the project rests with
village-level entities such as the User Group, SHG or the Van Panchayat,
individual farmer. If these options are not available then the WC itself may decide
to execute the works. If all the above options do not work out only then the works
will be awarded to independent contractors, However the WC will have to obtain
in writing their inability to undertake the project activities before awarding the
contract for the said work to an independent contractor.
175
In case of special technical requirements for which the above mentioned village
level institutions do not possess adequate capacities, and then the WC may
outsource a contractor having past experience in specialized technical works.
Such a Contractor will be appointed only after the Beneficiaries have deposited
the full amount of their share of the cost of the said activity in advance with the
Gram Panchayat.
Sub-Project Agreement between WC and Implementer: If the WC does not
undertake to execute the work on its own, then for each activity a Sub-Project
Agreement (SPA) shall be signed between the WC and the Implementer. The design
and cost estimates prepared with the assistance of WDT Representative shall form
part of the SPA. The major areas covered in the SPA will be as follows:
Objectives:
Sub Contracting
Implementation of Works
Procurement of Material
Responsibility of Damages
Time Limit
Schedule of Payment
Duties and Responsibilities of the WWC
Duties and responsibilities of the Implementer
Settlement of Disputes
Ownership and responsibility of maintenance post completion of works.
IV. Implementing the Work:
Technical representative of the WDT will provide guidance to the Implementer
and will monitor the work to ensure that the work is completed in time and as per
the estimates and the designs prepared.
Work must be completed in the sequenced manner as approved by the Gram
Sabha.

176
Technical Representative of the WDT team shall verify the progress of works at
different stages and record in a Measurement Book (MB) after verification. The
MBs however shall be kept in safe custody of the Secretary at each WC. The
format of the MB, as prescribed by the State Financial Rules vide form nos. 16
and 17, should be followed.
V. Basis of Payment / Reimbursement:
If the WC undertakes to implement the work on its own then the WC cannot
spend more than the amount sanctioned, net of beneficiary contribution.
In case the work is implemented by an Implementer other than WC, the total
payment made shall not exceed the estimated unit cost (net of Beneficiary
Contribution) as approved and adjusted proportionately for actual measurements.
If there is any change in design with respect to original estimation, revised
sanction should be sought in this regard.
The above amounts will also be eligible for reimbursement to WC by DWDU.
Authorization: The bill received will have to be routed through the Secretary who,
before making any payments, shall cross check with the Integrated Activity Register
to verify the quantum of earlier payments made before getting it approved by the
WC. All payments shall be authorized by the WC, which shall meet for the purpose
at least once a week.
VI. Stages of payment:
Bills for the work implemented by WC itself will be paid as soon as it is
authorized by the WDT
The payment to the Implementer (Individual/VP/UG/SHG) will be on the basis
of running bills and subsequently on final bill supported by the Completion
Certificate.
Advances: No advance payments shall be made to the Implementers. Following
Table summarizes the fund flow from WC to Implementer.
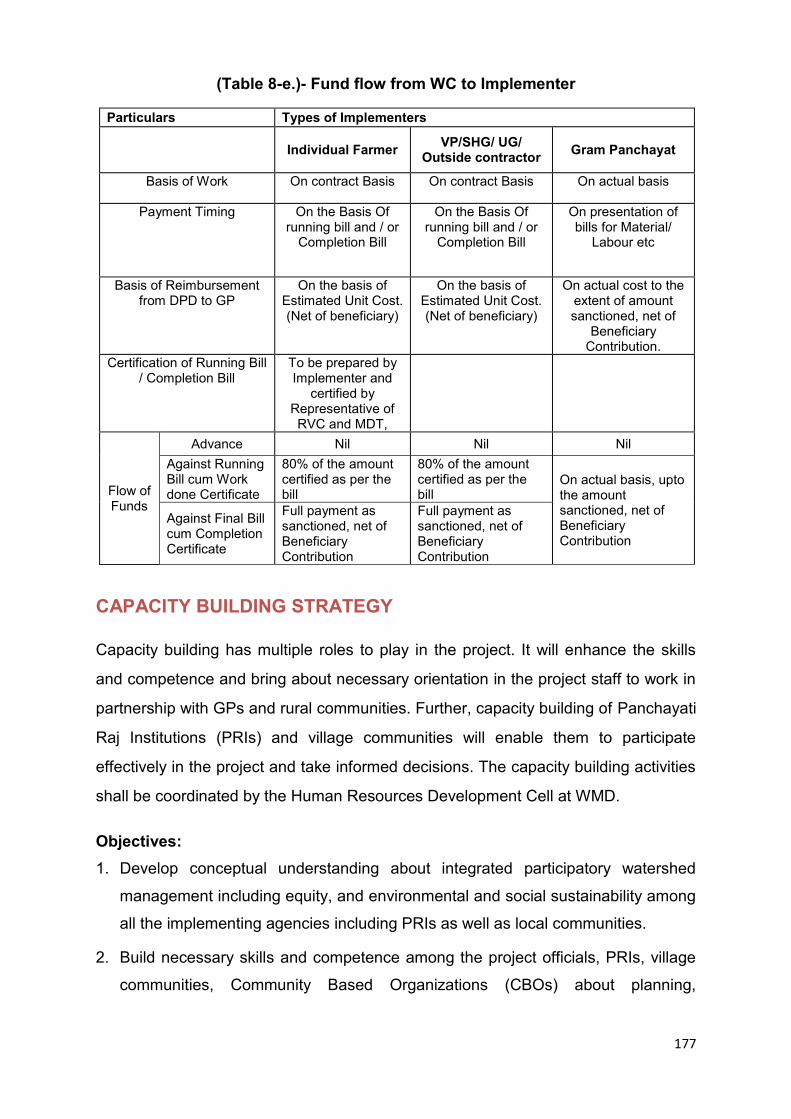
177
(Table 8-e.)- Fund flow from WC to Implementer
Particulars Types of Implementers
Individual Farmer VP/SHG/ UG/ Outside contractor Gram Panchayat
Basis of Work On contract Basis On contract Basis On actual basis
Payment Timing On the Basis Of running bill and / or
Completion Bill
On the Basis Of running bill and / or
Completion Bill
On presentation of bills for Material/
Labour etc
Basis of Reimbursement from DPD to GP
On the basis of Estimated Unit Cost. (Net of beneficiary)
On the basis of Estimated Unit Cost. (Net of beneficiary)
On actual cost to the extent of amount sanctioned, net of
Beneficiary Contribution.
Certification of Running Bill / Completion Bill
To be prepared by Implementer and
certified by Representative of RVC and MDT,
Flow of Funds
Advance Nil Nil Nil
Against Running Bill cum Work done Certificate
80% of the amount certified as per the bill
80% of the amount certified as per the bill
On actual basis, upto the amount sanctioned, net of Beneficiary Contribution
Against Final Bill cum Completion Certificate
Full payment as sanctioned, net of Beneficiary Contribution
Full payment as sanctioned, net of Beneficiary Contribution
CAPACITY BUILDING STRATEGY
Capacity building has multiple roles to play in the project. It will enhance the skills
and competence and bring about necessary orientation in the project staff to work in
partnership with GPs and rural communities. Further, capacity building of Panchayati
Raj Institutions (PRIs) and village communities will enable them to participate
effectively in the project and take informed decisions. The capacity building activities
shall be coordinated by the Human Resources Development Cell at WMD.
Objectives: 1. Develop conceptual understanding about integrated participatory watershed
management including equity, and environmental and social sustainability among
all the implementing agencies including PRIs as well as local communities.
2. Build necessary skills and competence among the project officials, PRIs, village
communities, Community Based Organizations (CBOs) about planning,

178
implementation and management of various project activities, including income
generation.
3. Develop understanding about the Environmental and Social issues, including the
project’s Environmental and Social Management Framework.
4. Build and enhance the capability of all stakeholders for the sustainability of
programs initiated by the project.
5. Strengthen community participation and ensure their positive involvement in
sustainably managing their common property resources.
Target Groups: An initial training needs assessment will be carried out to
determine the training needs of various stakeholders in the project. The capacity
building strategy will target:
1. Policy makers and executives of PRIs
2. PIA staff/ field functionaries
3. WC
4. CBOs and other community members
5. Panchayat Secretaries
6. Secretary of WC to be appointed under the project
7. Community-based resource persons
8. Transhumant communities
Training Modules: Each target group will be trained on multiple issues related to the
project. Some of the key issues covered will be:
(Table 8-f.)- Key issues
Target Group Capacity building issues Policymakers, Project Staff
Orientation & sensitization to community-driven projects
Concept of integrated watershed development
Project rules & regulations
Community mobilization
Application of ESMF to planning & implementation process
Tribal & transhumant strategy
GPs including WCs, Village Communities Secretary of WC, CBO’s
Concept of integrated watershed development
Project rules & regulations
Application of ESMF to planning & implementation process
Tribal & transhumant strategy
Financial management, procurement guidelines & maintenance of records
Technical skills in the areas of livestock, agriculture, horticulture, value addition to produce, water harvesting, livelihood improvement
SHGs EDP and skills development
Application of ESMF to planning & implementation process
Formation of associations & federations
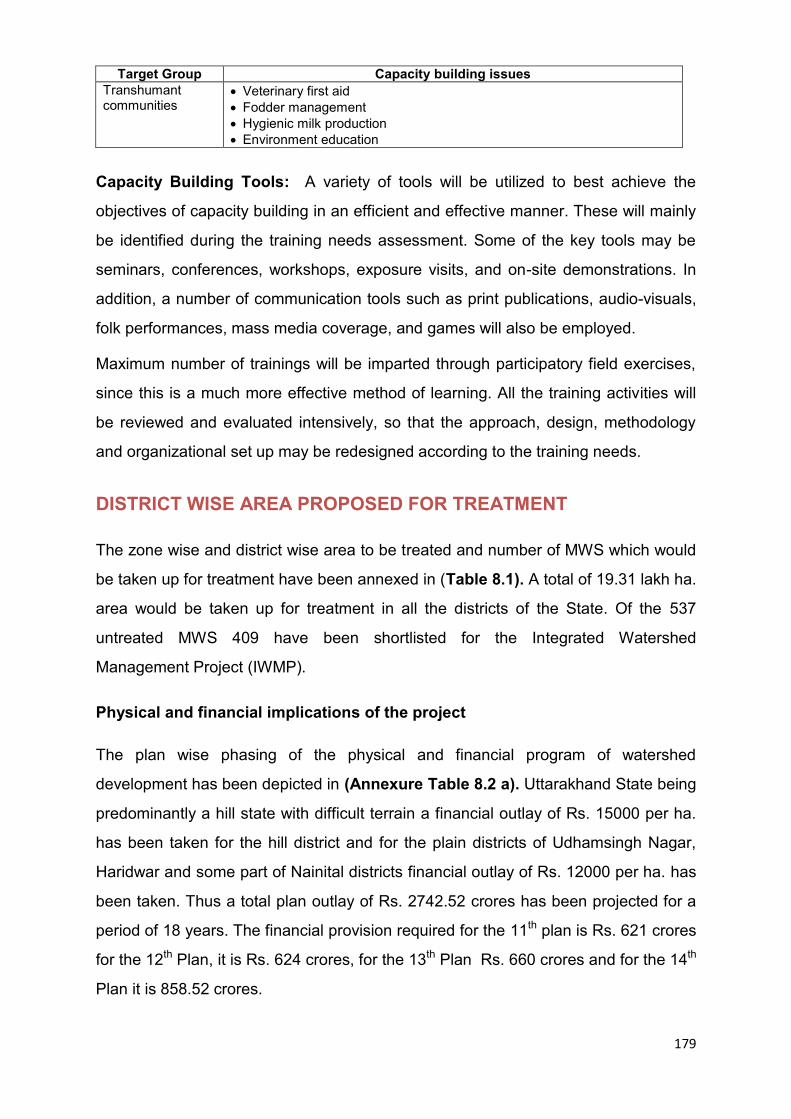
179
Target Group Capacity building issues Transhumant communities
Veterinary first aid
Fodder management
Hygienic milk production
Environment education
Capacity Building Tools: A variety of tools will be utilized to best achieve the
objectives of capacity building in an efficient and effective manner. These will mainly
be identified during the training needs assessment. Some of the key tools may be
seminars, conferences, workshops, exposure visits, and on-site demonstrations. In
addition, a number of communication tools such as print publications, audio-visuals,
folk performances, mass media coverage, and games will also be employed.
Maximum number of trainings will be imparted through participatory field exercises,
since this is a much more effective method of learning. All the training activities will
be reviewed and evaluated intensively, so that the approach, design, methodology
and organizational set up may be redesigned according to the training needs.
DISTRICT WISE AREA PROPOSED FOR TREATMENT
The zone wise and district wise area to be treated and number of MWS which would
be taken up for treatment have been annexed in (Table 8.1). A total of 19.31 lakh ha.
area would be taken up for treatment in all the districts of the State. Of the 537
untreated MWS 409 have been shortlisted for the Integrated Watershed
Management Project (IWMP).
Physical and financial implications of the project
The plan wise phasing of the physical and financial program of watershed
development has been depicted in (Annexure Table 8.2 a). Uttarakhand State being
predominantly a hill state with difficult terrain a financial outlay of Rs. 15000 per ha.
has been taken for the hill district and for the plain districts of Udhamsingh Nagar,
Haridwar and some part of Nainital districts financial outlay of Rs. 12000 per ha. has
been taken. Thus a total plan outlay of Rs. 2742.52 crores has been projected for a
period of 18 years. The financial provision required for the 11th plan is Rs. 621 crores
for the 12th Plan, it is Rs. 624 crores, for the 13th Plan Rs. 660 crores and for the 14th
Plan it is 858.52 crores.

180
The annual plan for the remaining 11th Plan showing the Watershed areas planned
for treatment and financial provision year wise has been depicted district wise in
(Annexure Table-8.2 b). A total of 86 MWS covering an area of 4.3 lakh ha. would
be taken up for treatment in the 11th plan period.
The component wise breakup of the estimated budget for the 11th Plan has been
depicted in (Annexure Table -8.2 c). In the 11th Plan, it is proposed that a total 86
MWS would be taken for treatment in 12 districts of the State for Haridwar district
30000 ha. of area would be taken up for treatment. The maximum area to the tune of
50,000 ha. would be treated in Udhamsingh Nagar District. A maximum of 17 MWS
would be covered in Uttarkashi District. The Matrix of conversions of watershed
programs with other ongoing schemes is depicted in (Annexure Table 8.3). As
Watershed Management Directorate has a past history of undertaking externally
aided Watershed Projects from time to time, the remaining MWS would be taken up
through these projects.

181
CHAPTER -9 OUTPUT AND OUTCOME INDICATORS
Watershed Management works entail considerable amount of budget and hence a
proper monitoring and impact evaluation is desired to assess the benefits accrued
out of the expenditure incurred. Thus, to monitor the achievement of our defined
project objectives certain output indicators have been designed which will help in
quantifying the objectives any change in achievement of objectives will help in
flagging our procedural shortcomings like ineffective community mobilization, poor
PRA process improper prioritization of natural resource management objectives etc.
RESULTS FRAMEWORK AND MONITORING OF IWMP
Results Frameworks (Table 9.a)
Objective Outcome Indicators Use of outcome
Information To improve the productive potential of natural resources and increase incomes of rural inhabitants in selected watersheds through socially inclusive, institutionally and environmentally sustainable approaches.
10% increase in household Income (over baseline) in targeted villages (disaggregated) by Gender and socio- economic class.
10% increase in Vegetative and biomass index of treated watersheds
15% increase availability of water over baseline for domestic and/or agriculture use.
20% improvement in administrative capacity of GPs as measured by performance indicators
Lack of achievement may flag:
Tariff and subsidy structure inhibits viability of farming systems improvements
Poor participatory process
Inadequate prioritization of NRM investments
Inadequate capacity building of GPs and other local institutions.
Intermediate Results (One per component)
Results Indicators for each component
Use of Results monitoring
Component One (a)Communities are mobilized and prioritize their own mix of watershed development technologies by actively involving all households.
Component One 80% of households are
included in preparation of the plan.
60% of activities in IWMP address soil conservation measures, water resource management, forest fuelwood and/or fodder management identified during PRA exercise
Component One Low level may flag either
poor mobilisation of community or poor inclusion of all socio- economic households in decision taking in village.
Low level may flag poor understanding of project objectives or weak PRA processes.

182
Objective Outcome Indicators Use of outcome Information
(b) Gram Panchayats directly implement the mix of watershed treatments and village development investments using appropriate User Groups/sub-committees at revenue village levels (if necessary)
More than 50% of GPs have treated > 80% of area proposed for treatment in the approved IWMP Plan.
Low level may flag either poor strength or capacity of WC to implement the project activities or administrative and legal hurdles in treating the area or poor availability of technical guidance for treatment of area.
Component Two (a)New high value crop, horticulture and livestock technologies are adopted by farmers and/or herders.
Component Two 10% increase in (over
baseline) of improved varieties and High Value crops and fruit trees.
20% increase (over baseline) in fodder production
1% increase (over baseline) in number of improved breed animals.
Component Two Low level may flag either
inappropriate technologies proposed; poor strength of WC to implement project activities; or natural disaster like drought/flood caused lowering in productivity.
(b)Appropriate technologies for processing, storage and market linkages have been adopted by farmers to increase the value of their produce.
15% increase in net value of produce realized by farmers adopting these technologies
Low level may flag either inappropriate techniques or incorrect assessment of market and marketing strategies or change in tariff structure
(c) Vulnerable groups (including women) establish Self-Help Groups (SHGs) and implement income generating activities.
30% increase in number of functioning SHGs.
60% of loans repaid to SHG by borrowers
50% of enterprises still active after two years
Low level may flag insufficient level of capacity building and training of SHG
Inappropriate identification of enterprises
Component Three (a) WC and other relevant local institutions have developed sufficient capacity to design, prioritize, implement, operate and maintain watershed treatments.
Component Three
At least 50% attendance in statutory Gram Sabha meetings
50% increase over baseline in proportion of GP Constituents aware of annual budget and expenditure of GP
80% of GPs targeted under project having satisfactory annual audit report
Component Three
Low level may flag lack of understanding o productivity of project objectives of non-responsive GP
Low level may flag either poor capability of GPs or lack of interest on part of constituents.
Low level may flag that capacity building support is inadequate and institutional strength is weak

183
Objective Outcome Indicators Use of outcome Information
(b) All stakeholders are informed and educated about key design and participation features of the project using targeted messages evolved through a comprehensive communications strategy.
50% of target households aware of project objectives, activities and methodologies
Low level may flag inadequacy of IEC activities
(c) Effective and efficient project coordination, management, monitoring and evaluation systems are established and operational.
90% of monitoring reports submitted and action taken on 80%
90% staff deployment as per agreed schedule
Late or non submission of reports will flag either poor systems; weak understanding of roles and responsibilities; lack of sufficient personnel for the job
Low level of staff deployment may indicate insufficient incentive to work in project area or insufficient number of qualified government staff available.
The time frame for monitoring of the results have been tabulated as follows:

184
Arrangements for results monitoring (Table 9.b.)
Target Values Target Values Data Collection and Reporting
Outcome Indicators Baseline YR1 YR2 YR3 YR4 YR5 Frequency and
Reports
Data Collection Instruments
Responsibility for Data
Collection 10% increase in
household Income (over baseline) in targeted villages (disaggregated) by Gender and socio- economic class.
Baseline information will be collected during the first year of stratified sample
Increase not measurable
5% (over baseline) by Mid Term
Not measured
Not measured
Baseline, pre Midterm and Final Year Survey to be carried out in May-June
Formats will be evolved by contracted consultants
External consultants in sample villages under supervision of WMD
10% increase in Vegetative and biomass index of treated watersheds
Baseline collected by remote sensing and also by field transects
Increase not measurable
4% increase expected at MTR
Increase will not be measured
Increase will not be measured
Baseline, Midterm and end of project
Remote sensing field survey by Scientific institutions
External consultants under supervision of WMD
15% increase availability of water over baseline for domestic and/or agriculture use.
Baseline collected using PRA methods and field survey
Data will be collected
5% increase expected
Data will be collected
Data will be collected
Assessments at baseline, midterm and end of project. Data collected annually in lean period May-June
Field monitoring devices and by PRA techniques
WDT under supervision of WMD

185
Target Values Target Values Data Collection and Reporting
Outcome Indicators Baseline YR1 YR2 YR3 YR4 YR5 Frequency and
Reports
Data Collection Instruments
Responsibility for Data
Collection 20% improvement
in administrative capacity of WC
Baseline will be collected during first year.
Not measured
5% increase expected at Mid term
Not measured
Not measured
Baseline, midterm and end of project
Format developed by contracted consultants using WC performance indicators from Deptt. of Panchayati Raj
Contracted consultants under supervision of WMD.
Component One :
a. 80% of
households are included in preparation of Plan
No baseline because planning process in WC will commence
Average of 80% of target households involved in preparation of Plan
Average of 80% of target households involved in preparation of Plan
Not measured because all Plan will have been prepared
Not measured because all Plan will have been prepared
Annually during period ending March
Proceedings Register of Gram Panchayat meeting
WDTs and external M&E consultants during Mid Term and end of Project
60% of activities in Plan address soil conservation measures, water resource mgt., forest fuelwood and/or fodder management identified during PRA exercise
Not measured because Plan will be under preparation
50% of GP plans produced should include about 60% of these activities
60% of GP plans produced should include about 60% of these activities
80% of GP plans produced should include about 60% of these activities
80% of GP plans produced should include about 60% of these activities
Annually during period ending March
From approved plans
WDTs for reach village
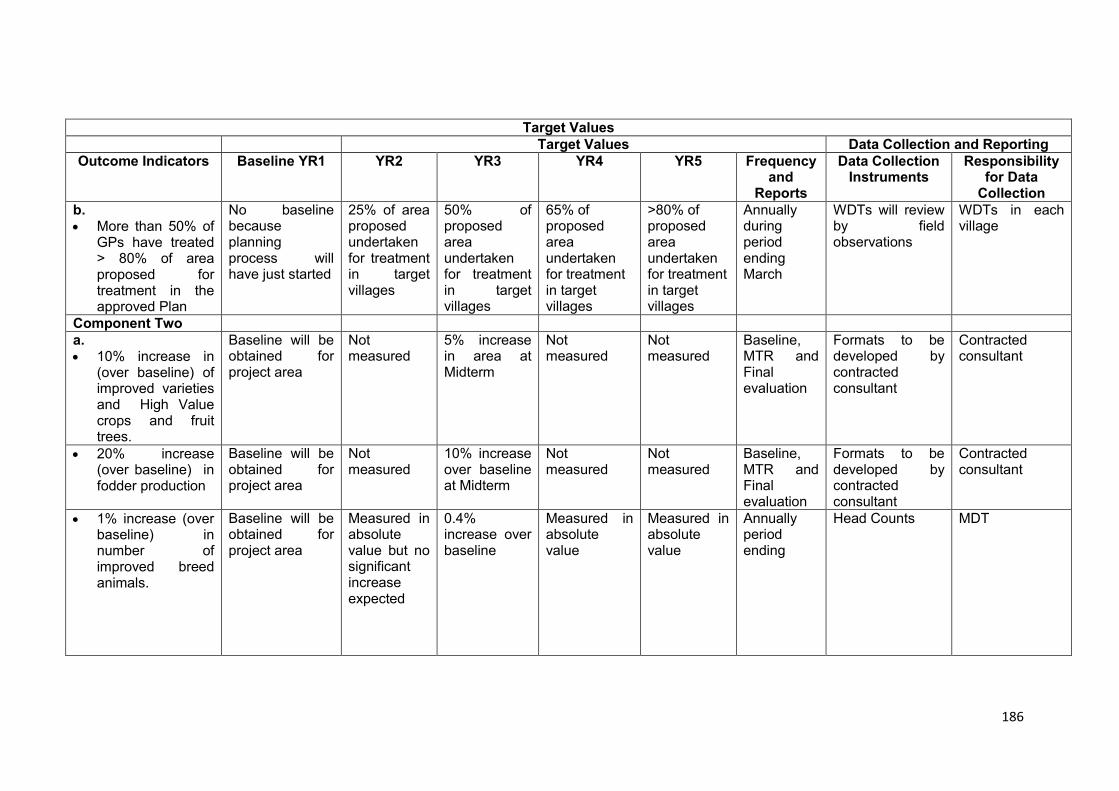
186
Target Values Target Values Data Collection and Reporting
Outcome Indicators Baseline YR1 YR2 YR3 YR4 YR5 Frequency and
Reports
Data Collection Instruments
Responsibility for Data
Collection b. More than 50% of
GPs have treated > 80% of area proposed for treatment in the approved Plan
No baseline because planning process will have just started
25% of area proposed undertaken for treatment in target villages
50% of proposed area undertaken for treatment in target villages
65% of proposed area undertaken for treatment in target villages
>80% of proposed area undertaken for treatment in target villages
Annually during period ending March
WDTs will review by field observations
WDTs in each village
Component Two
a. 10% increase in
(over baseline) of improved varieties and High Value crops and fruit trees.
Baseline will be obtained for project area
Not measured
5% increase in area at Midterm
Not measured
Not measured
Baseline, MTR and Final evaluation
Formats to be developed by contracted consultant
Contracted consultant
20% increase (over baseline) in fodder production
Baseline will be obtained for project area
Not measured
10% increase over baseline at Midterm
Not measured
Not measured
Baseline, MTR and Final evaluation
Formats to be developed by contracted consultant
Contracted consultant
1% increase (over baseline) in number of improved breed animals.
Baseline will be obtained for project area
Measured in absolute value but no significant increase expected
0.4% increase over baseline
Measured in absolute value
Measured in absolute value
Annually period ending
Head Counts MDT

187
Target Values Target Values Data Collection and Reporting
Outcome Indicators Baseline YR1 YR2 YR3 YR4 YR5 Frequency and
Reports
Data Collection Instruments
Responsibility for Data
Collection b. 15% increase in
net value of produce realized by farmers adopting these technologies
Baseline information collected
Not measured
4% increase over baseline
Not measured
Not measured
Baseline, Midterm, Final evaluation
Formats developed by external consultants
External Consultants
c. 30% increase in
number of functioning SHGs.
Baseline information collected
5% increase 15% increase 25% increase 30% increase
Annual monitoring reports
Formats developed by external consultants
External Consultants
60% of loans repaid to SHG by borrowers
Baseline information collected
20% of loans repaid
30% of loans repaid
50% of loans repaid
60% of loans repaid
Annual monitoring reports
Formats developed by external consultants
External Consultants
50% of enterprises still active after two years
Baseline information collected
Not measured
20% of enterprises established in previous two years still active
Not measured
Not measured
Baseline, Midterm, Final evaluation
Formats developed by external consultants
External Consultants
Component three
a. At least 50% attendance in statutory GS meeting
Baseline information collected
15% attendance
25% 40% 50% Annual Monitoring reports
GP proceedings register
WDTs and GP in each village

188
Target Values Target Values Data Collection and Reporting
Outcome Indicators Baseline YR1 YR2 YR3 YR4 YR5 Frequency and
Reports
Data Collection Instruments
Responsibility for Data
Collection
50% increase over baseline in proportion of GP Constituents aware of annual budget and expenditure of GP
Baseline information collected
Not measured
25% increase Not measured
Not measured
Baseline MTR and Final Evaluation
Formats developed by external consultants
External Consultants
80% of GPs targeted under project having satisfactory annual audit report
Baseline information collected
15% 30% 60% 70% Annual Reports
Panchayati Raj Deptt. records/Project Monitoring Reports
WDT and Finance Officer of WMD
b. 50% of target
households aware of project objectives, activities and methodologies
No baseline as project would have just begun
Baseline collected
30% Not measured
Not measured
Baseline in Yr 3, Midterm, Final evaluation
Formats developed by external consultants
External Consultants
c. 90% of monitoring
reports submitted and action taken on 80%
Not measured 50% compliance on each
100% compliance on each
100% compliance on each
100% compliance on each
Annual & Half yearly reports
Status reports and Annual Work Plans
WDTs and GPs

189

ANNEXURES

Districts No. of Blocks Area (Ha.) Male Female Total S.C. S.T. % Pop.BPL
1 Almora 11 465858 293848 336719 630567 140430 878 39%
2 Bageshwar 3 213542 118510 130952 249462 64524 1943 42%
3 Chamoli 9 847580 183745 186614 370359 67539 10484 52%
4 Rudraprayag 3 235421 107535 119904 227439 40311 186 37%
5 Champawat 3 235388 111084 113458 224542 38098 740 37%
6 Dehradun 6 368944 679583 602560 1282143 173448 99329 32%
7 Haridwar 6 231076 776021 671166 1447187 313976 3139 18%
8 Naintal 8 406475 400254 362655 762909 148184 4961 31%
9 Pauri Garhwal 15 673431 331061 366017 697078 106653 1594 27%
10 Pithoragarh 8 410638 227615 234674 462289 106449 19279 31%
11 Tehri Garhwal 10 485766 295168 309579 604747 87325 691 20%
12 Udham Singh Nagar 7 279234 649484 586130 1235614 162782 110220 20%
13 Uttarkashi 6 812414 152016 142997 295013 67467 2685 69%
Total 95 5665767 4325924 4163425 8489349 1517186 256129
General Population ( As per the 2001Census )Sl.No.
Annexure Table 2.1: General Information of the State
Source : 1. Planning Commission. Uttarakhand 2. Agriculture Department, Uttarakhand

Sl.no. Name of the ACZ
Area (Ha.) Districts Major Soils Rainfall Major Crops
1 9 465858 Almora Brown Forest Soil, Red to Dark, Black Clay 1192.35 Wheat,Paddy,Ragi
2 9 213542 Bageshwar Brown Forest Soil, Red to Dark, Black Clay 912.19 Wheat,Paddy,Ragi
3 9 847580 Chamoli Brown Forest Soil, Red to Dark, Black Clay 1047.00 Wheat,Paddy,Ragi
4 9 235421 Rudraprayag Brown Forest Soil, Red to Dark, Black Clay 1159.86 Wheat,Paddy,Ragi
5 9,14 235388 Champawat Brown Forest Soil, Red to Dark, Black Clay 1262.00 Wheat,Paddy,Ragi
6 9,14 368944 DehradunAlluvial, Sandy, Residual, Brown Forest Soil, Red to
Dark1631.10 Wheat,Paddy,Ragi,Sugarcane
7 9,14 231076 HaridwarAlluvial, Sandy, Residual, Brown Forest Soil, Red to
Dark826.16 Wheat,Paddy,Ragi,Sugarcane
8 9 406475 NaintalAlluvial, Sandy, Residual, Brown Forest Soil, Red to
Dark1574.00 Wheat,Paddy,Ragi,Sugarcane
9 9 673431 Pauri Garhwal Brown Forest Soil, Red to Dark, Black Clay 1057.09 Wheat,Paddy,Ragi
10 9 410638 Pithoragarh Brown Forest Soil, Red to Dark, Black Clay 842.51 Wheat,Paddy,Ragi
11 9 485766 Tehri Garhwal Brown Forest Soil, Red to Dark, Black Clay 1039.32 Wheat,Paddy,Ragi
12 9,14 279234 U S Nagar Alluvial, Sandy Soil, Residual Sandy Loam 1459.53 Wheat,Paddy,Ragi,Sugarcane
13 9 812414 Uttarkashi Brown Forest Soil, Red to Dark, Black Clay 1153.96 Wheat,Paddy,Ragi
5665767 1165.93
Annexure Table 2.2: Agro-climatic zones of the State
Source : Agriculture Deptt. Uttarakhand
Table 2.2

Sl.no. Districts Jan. Feb. Mar. Apr. May. June July Aug Sept Oct Nov Dec Total
1 Almora 4.00 135.90 129.70 34.70 86.65 154.00 117.40 257.00 262.70 5.30 0.00 5.00 1192.35
2 Bageshwar 4.20 66.71 86.35 30.00 25.00 185.00 249.00 183.00 71.60 7.00 0.00 4.33 912.19
3 Chamoli 0.00 35.00 37.00 16.00 46.00 186.00 247.00 386.00 76.00 16.00 2.00 0.00 1047.00
4 Rudraprayag 0.00 107.20 84.10 60.60 62.10 215.70 152.50 258.20 153.50 39.00 2.06 24.90 1159.86
5 Champawat 0.00 190.00 177.00 36.00 59.00 143.00 162.00 282.00 187.00 16.00 0.00 10.00 1262.00
6 Dehradun 2.00 112.00 26.00 15.00 12.00 109.00 594.10 458.00 303.00 0.00 0.00 0.00 1631.10
7 Haridwar 0.00 132.90 47.26 29.30 0.00 77.00 211.30 303.30 25.10 0.00 0.00 0.00 826.16
8 Naintal 2.34 124.00 80.17 35.13 41.00 167.28 299.67 484.56 325.85 14.00 0.00 0.00 1574.00
9 Pauri Garhwal 3.25 0.00 0.00 0.50 0.87 111.27 208.54 297.38 286.78 81.27 0.00 67.23 1057.09
10 Pithoragarh 0.00 95.86 0.00 0.00 0.00 0.00 272.44 473.00 0.00 0.00 1.21 0.00 842.51
11 Tehri Garhwal 0.00 0.00 67.63 15.08 42.22 34.55 296.90 424.48 151.22 7.24 0.00 0.00 1039.32
12 Udham Singh Nagar 0.00 100.00 23.83 9.70 10.16 211.66 226.66 437.00 440.52 0.00 0.00 0.00 1459.53
13 Uttarkashi 0.00 153.36 160.60 69.80 76.20 111.00 296.80 113.80 156.80 15.60 0.00 0.00 1153.96
Average Rainfal 1.21 96.38 70.74 27.06 35.48 131.19 256.49 335.21 187.70 15.49 0.41 8.57 1165.93
Annexure Table 2.3: Normal rainfall (monthly, mm) Year 2007
Source : Agriculture Department, Uttarakhand
Table 2.3

Sl. no.
Districts Gullied Land
Land With or Without scrubs
Water logged/marshy
land
Saline and
alkaline area
Degraded notified
forest land
Degraded pasture/ grazing
land
Degraded land under plantation
Sand/ Coastal
Land
Mining/ Industrial
area
Barren rocky area
Steep slping area
Snow/ glacier
area
Total wastelands/degraded land
Geographical area
% of the total geographical
area
1 2 3.00 4.00 5.00 6.00 7.00 8.00 9.00 10.00 11.00 12.00 13.00 14.00 15.00 16.00 17
1 Almora 0.00 1.16 0.00 0.00 1.94 0.19 0.00 0.00 0.00 1.60 1.99 0.74 7.62 313.40 6%
2 Bageshwar 0.00 0.05 0.00 0.00 1.58 0.28 0.00 0.00 0.00 1.31 1.82 50.38 55.43 225.00 4%
3 Chamoli 0.00 1.03 0.00 0.00 12.12 4.19 0.00 0.00 0.00 1.84 6.19 423.89 449.26 912.50 17%
4 Rudraprayag 0.00 0.00 0.00 0.00 0.00 0.00 0.00 0.00 0.00 0.00 0.00 0.00 0.00 0.00 0%
5 Champawat 0.00 0.90 0.00 0.00 7.41 0.44 0.18 0.00 0.00 0.26 0.29 1.55 11.02 176.60 3%
6 Dehradun 0.06 12.12 0.00 0.00 14.03 0.00 0.00 0.00 0.00 0.00 39.93 0.00 66.14 308.80 6%
7 Haridwar 1.52 3.96 2.99 0.00 28.61 0.00 0.00 0.00 0.00 0.00 0.00 0.00 37.08 199.50 4%
8 Naintal 0.00 1.91 0.22 0.00 14.68 0.06 0.41 0.00 0.00 0.38 1.13 0.56 19.34 421.60 8%
9 Pauri Garhwal 0.00 0.02 1.17 0.00 5.55 2.42 0.00 0.00 0.00 0.67 14.61 0.27 24.72 544.00 10%
10 Pithoragarh 0.00 0.09 0.00 0.00 2.06 1.67 0.00 0.00 0.00 27.22 7.14 375.93 414.11 709.10 13%
11 Tehri Garhwal 0.00 0.99 0.02 0.00 6.42 0.44 0.00 0.00 0.00 2.80 10.49 34.89 56.04 442.10 8%
12 Udham Singh Nagar 0.00 1.55 2.37 0.00 6.34 0.00 0.43 0.00 0.00 0.00 0.00 0.00 10.69 257.90 5%
13 Uttarkashi 0.00 0.24 0.00 0.00 8.05 1.96 0.00 0.00 0.00 4.72 13.04 428.43 456.43 801.60 15%
Total 1.59 24.02 6.76 0.00 108.81 11.64 1.02 0.00 0.00 40.79 96.62 1316.64 1607.88 5312.10 100%
Source - Watershed Atlas of India (2000). Dept of land Resource and NRSA
Annexure Table 2.4: Status of Degraded Land in the State - Area in 000' ha.
Table 2.4

Class Range of Soil loss (t/ha/yr.)
Area (Lakh ha.) Area (%)
Very Slight < 5
Slight 5 - 10 5
Moderate 10 - 15 8.39 16
Severe 20 - 40 16.45 31
Very Severe 40 - 80 11.92 22
Extremely severe > 80 1.51 3
41.07 77
Snow Covered 5.70 11
Rockey 4.09 8
Not Serveyed 2.43 5
GRAND TOTAL 53.29
Source : Land Survey Directorate, Uttarakhand
2.80
Annexure Table 2.5: Extent of Soil Erosion in the State
Table 2.5

Sl. No Development Indicators State. National
1 Per Capital Income (Rs.) 2005-06 24870 25956
2 Poverty Ratio (2004-05) 31.8 21.8
3 Contribution of Agril. To State GDP (%) 18.47 17
4 HDI NA NA
5 Infrastructure Development Index NA NA
6 Literacy (%) 71.6 64.8
7 Cooperative Credit (Rs./ha.) 6149 NA
8 Bank Credit (Rs./ha.) 28349 NA
NA - Not Available
* - Based on National Sample Survey
Annexure Table 2.6: Developmental Indicators of the State (As on 31-03-2006)
Table 2.6

Agriculture i.e. Crops including
Horticulture.
Animal Husbandry and Dairying
Fishery Wages Non-farm income
Others
Marginal
Small
Medium
Large
Share Croppers
Land less
* Similarly for different ACZ/Divisions (If possible)
State as a whole (Absolute value in Rs. And % in parenthesis)Farmers Typology
Annexure Table 2.7: Source wise Income Distribution in the State and ACZ/Divisions
Table 2.7

Districts Geogra phical area
Forest Area Land under
Non-agril. Use
Cultivable waste
Permanent pastures
Land under miscellaneons tree crops and groves
Curreut Fallows
Other Fallows
Net Sown area
Area Sown more than
once
Net Irrigated
Area
Gross cropped
area
Cropping intensity
(%)
1 2 3 4 5 6 7 8 9 10 11 12 13 14
Almora 4.659 2.362 0.126 0.424 0.305 0.272 0.009 0.078 0.826 0.487 0.050 1.313 158.906
Bageshwar 2.135 1.102 0.047 0.169 0.275 0.207 0.020 0.031 0.217 0.175 0.040 0.392 180.403
Chamoli 8.476 5.061 0.080 0.481 0.498 0.405 0.005 0.011 0.349 0.179 0.016 0.528 151.324
Rudraprayag 2.354 1.799 0.030 0.080 0.043 0.116 0.007 0.007 0.200 0.115 0.026 0.314 157.334
Champawat 2.384 1.323 0.047 0.152 0.191 0.265 0.029 0.068 0.254 0.164 0.024 0.418 164.402
Dehradun 3.690 2.018 0.218 0.640 0.003 0.151 0.077 0.075 0.470 0.265 0.209 0.735 156.495
Haridwar 2.311 0.724 0.267 0.021 0.001 0.008 0.026 0.039 1.202 0.535 1.072 1.736 144.502
Naintal 4.064 2.983 0.093 0.268 0.000 0.178 0.033 0.030 0.466 0.333 0.280 0.799 171.499
Pauri Garhwal 6.729 3.851 0.155 0.385 0.352 0.561 0.078 0.182 0.807 0.428 0.077 1.235 153.091
Pithoragarh 4.107 2.052 0.101 0.406 0.533 0.269 0.013 0.044 0.481 0.395 0.040 0.876 182.204
Tehri Garhwal 4.858 3.221 0.053 0.781 0.006 0.001 0.071 0.058 0.613 0.380 0.085 0.992 162.014
Udham Singh Nagar 2.811 0.937 0.253 0.033 0.000 0.013 0.025 0.029 1.511 1.079 1.484 2.590 171.452
Uttarkashi 8.124 7.217 0.052 0.023 0.083 0.044 0.024 0.032 0.274 0.144 0.051 0.417 152.553
56.701 34.651 1.522 3.863 2.289 2.490 0.417 0.684 7.667 4.678 3.452 12.345 161.014
Source : Agriculture Department Uttarakhand
Annexure Table 2.8: Land Utilisation Statistics (Preceeding 3 years average) Lakhs ha.
Table 2.8

Landless
No. Area in ha. No. Area in
ha. No. Area in ha. No. Area in
ha. No. Area in ha. No. Area in
ha. No.
1 Almora 94273 39424.45 21798 29645.71 5734 14609.96 501 2560.82 16 385.57 122322 86626.51
2 Bageshwar 49798 16399.55 4673 6136.92 761 1970.44 68 379.15 3 40.64 55303 24926.70
3 Chamoli 26399 8944.34 7607 10880.72 3848 10364.02 810 4222.36 19 394.92 38683 34806.36
4 Rudraprayag 25466 9351.42 4726 6538.56 1347 3480.94 168 919.35 6 78.64 31713 20368.91
5 Champawat 26890 10735.97 6444 8776.96 2106 5485.63 371 1954.49 27 466.39 35838 27419.44
6 Dehradun 50419 17286.83 8460 12085.28 5225 14429.73 1740 9535.25 140 2999.13 65984 56336.22
7 Haridwar 78690 31608.91 20981 28636.77 12034 33193.13 4462 24347.21 177 2928.51 116344 120714.53
8 Naintal 32733 10625.50 8362 11902.64 6196 17091.15 2371 13515.89 261 5604.35 49923 58739.53
9 Pauri Garhwal 43839 20440.42 24412 34965.14 14627 39355.50 3552 19111.13 129 1773.10 86559 115645.29
10 Pithoragarh 75256 27419.91 9663 12946.77 1898 4838.96 164 855.91 14 275.64 86995 46337.19
11 Tehri Garhwal 56053 23470.97 17927 24896.66 6206 16426.47 875 4521.50 18 269.27 81079 69584.87
12 Udham Singh Nagar 43908 19421.59 17055 24235.70 14014 39007.85 8009 44718.39 584 20078.41 83570 147461.94
13 Uttarkashi 24543 7380.87 6294 9077.73 4418 12130.50 1072 5559.07 27 334.43 36354 34482.60
Total 628267 242510.73 158402 220725.56 78414 212384.28 24163 132200.52 1421 35629.00 890667 843450.09
Large Farmers Total
Source : Agriculture Department Uttarakhand Table : Less than 1 ha-marginal farmers, 1-2 ha-smal farmers, 2-4 ha semi-med. Farmers, 4-10 ha medium farmers and more than 10 ha - large farmers.
Annexure Table 2.9: Land holdings (Agriculture Census) 2000-01 Year
Marginal FarmersDistricts Small Farmers Semi-med. Farmers
Sl.no Medium Farmers
Table 2.9

Irrigated % Rainfed % Total Irrigated % Rainfed % Total Irrigated Rainfed Average
Cereals172381 34% 334622 66% 507003 3689560 43% 4920250 57% 8609810 21.40 14.70 16.98
Pulses1560 4% 37604 96% 39164 10390 3% 334120 97% 344510 6.66 8.89 8.80
Oilseeds6812 40% 10033 60% 16845 106000 53% 93720 47% 199720 15.56 9.34 11.86
Others821 25% 2449 75% 3270 6660 40% 9980 60% 16640 8.11 4.08 5.09
Total181574 32% 384708 68% 566282 3812610 42% 5358070 58% 9170680 21.00 13.93 16.19
Area (ha.)Crops Yield (q/ha.)Production (q)
Annexure Table 2.10: Area, Production and Yield of Major Crops in Irrigated / Rainfed Conditions during Kharif Season
Source : Agriculture Department Uttarakhand
Table 2.10

Irrigated % Rainfed % Total Irrigated % Rainfed % Total Irrigated Rainfed Average
Cereals170194 40% 251252 60% 421446 5583470 66% 2819540 34% 8403010 32.81 11.22 19.94
Pulses9197 41% 13410 59% 22607 91810 62% 56060 38% 147870 9.98 4.18 6.54
Oilseeds6929 48% 7444 52% 14373 61190 69% 27610 31% 88800 8.83 3.71 6.18
Others12986 100% 0 0% 12986 429900 100% 0 0% 429900 33.10 0.00 33.10
Total199306 42% 272106 58% 471412 6166370 68% 2903210 32% 9069580 30.94 10.67 19.24
Area (ha.)Crops Yield (q/ha.)Production (q)
Annexure Table 2.11: Area, Production and Yield of Major Crops in Irrigated / Rainfed Conditions during Rabi Season
Source : Agriculture Department Uttarakhand
Table 2.11
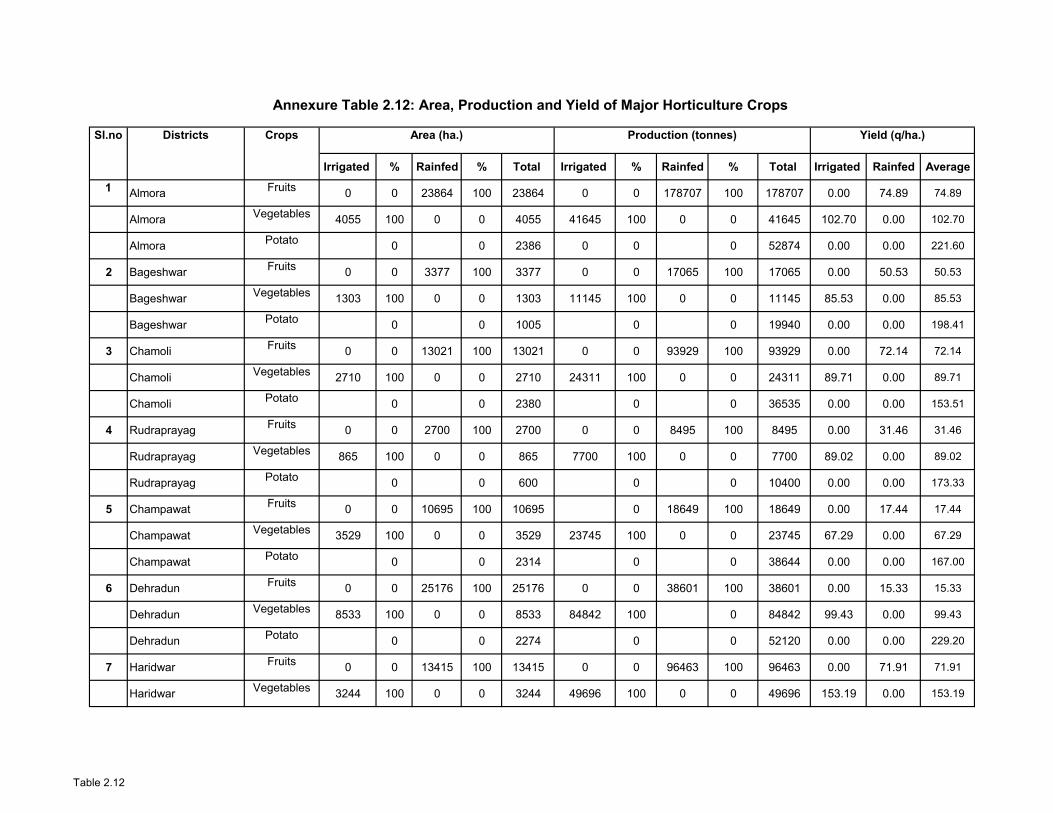
Irrigated % Rainfed % Total Irrigated % Rainfed % Total Irrigated Rainfed Average
1Almora
Fruits0 0 23864 100 23864 0 0 178707 100 178707 0.00 74.89 74.89
AlmoraVegetables
4055 100 0 0 4055 41645 100 0 0 41645 102.70 0.00 102.70
AlmoraPotato
0 0 2386 0 0 0 52874 0.00 0.00 221.60
2 Bageshwar Fruits
0 0 3377 100 3377 0 0 17065 100 17065 0.00 50.53 50.53
Bageshwar Vegetables
1303 100 0 0 1303 11145 100 0 0 11145 85.53 0.00 85.53
Bageshwar Potato
0 0 1005 0 0 19940 0.00 0.00 198.41
3 ChamoliFruits
0 0 13021 100 13021 0 0 93929 100 93929 0.00 72.14 72.14
ChamoliVegetables
2710 100 0 0 2710 24311 100 0 0 24311 89.71 0.00 89.71
ChamoliPotato
0 0 2380 0 0 36535 0.00 0.00 153.51
4 RudraprayagFruits
0 0 2700 100 2700 0 0 8495 100 8495 0.00 31.46 31.46
RudraprayagVegetables
865 100 0 0 865 7700 100 0 0 7700 89.02 0.00 89.02
RudraprayagPotato
0 0 600 0 0 10400 0.00 0.00 173.33
5 ChampawatFruits
0 0 10695 100 10695 0 18649 100 18649 0.00 17.44 17.44
ChampawatVegetables
3529 100 0 0 3529 23745 100 0 0 23745 67.29 0.00 67.29
ChampawatPotato
0 0 2314 0 0 38644 0.00 0.00 167.00
6 DehradunFruits
0 0 25176 100 25176 0 0 38601 100 38601 0.00 15.33 15.33
DehradunVegetables
8533 100 0 0 8533 84842 100 0 84842 99.43 0.00 99.43
DehradunPotato
0 0 2274 0 0 52120 0.00 0.00 229.20
7 HaridwarFruits
0 0 13415 100 13415 0 0 96463 100 96463 0.00 71.91 71.91
HaridwarVegetables
3244 100 0 0 3244 49696 100 0 0 49696 153.19 0.00 153.19
Annexure Table 2.12: Area, Production and Yield of Major Horticulture Crops
Sl.no Area (ha.)Crops Yield (q/ha.)Production (tonnes)Districts
Table 2.12

Irrigated % Rainfed % Total Irrigated % Rainfed % Total Irrigated Rainfed Average
Sl.no Area (ha.)Crops Yield (q/ha.)Production (tonnes)Districts
HaridwarPotato
0 0 1410 0 0 28510 0.00 0.00 202.20
8 NaintalFruits
0 0 25120 100 25120 0 0 87401 100 87401 0.00 34.79 34.79
NaintalVegetables
8130 100 0 0 8130 75267 100 0 0 75267 92.58 0.00 92.58
NaintalPotato
0 0 2471 0 0 55350 0.00 0.00 224.00
9 Pauri GarhwalFruits
0 0 19838 100 19838 0 0 30699 100 30699 0.00 15.47 15.47
Pauri GarhwalVegetables
4623 100 0 0 4623 42025 100 0 0 42025 90.90 0.00 90.90
Pauri GarhwalPotato
0 0 1190 0 0 16330 0.00 0.00 137.23
10 PithoragarhFruits
0 0 15032 100 15032 0 0 36748 100 36748 0.00 24.45 24.45
PithoragarhVegetables
4916 100 0 0 4916 49098 100 0 0 49098 99.87 0.00 99.87
PithoragarhPotato
0 0 2080 0 0 47048 0.00 0.00 226.19
11 Tehri GarhwalFruits
0 0 19513 100 19513 0 0 25299 100 25299 0.00 12.97 12.97
Tehri GarhwalVegetables
6276 100 0 0 6276 50120 100 0 0 50120 79.86 0.00 79.86
Tehri GarhwalPotato
0 0 2357 0 0 49690 0.00 0.00 210.82
12 Udham Singh NagarFruits
0 0 6141 100 6141 0 0 36206 100 36206 0.00 58.96 58.96
Udham Singh NagarVegetables
5142 100 0 0 5142 57154 100 0 0 57154 111.15 0.00 111.15
Udham Singh NagarPotato
0 0 2473 0 0 53332 0.00 0.00 215.66
13 UttarkashiFruits
0 0 12794 100 12794 0 0 66899 100 66899 0.00 52.29 52.29
UttarkashiVegetables
2883 100 0 0 2883 43694 100 0 0 43694 151.56 0.00 151.56
UttarkashiPotato
0 0 2004 0 0 48062 0.00 0.00 239.83
Total 56209 20.68 190686 70.15 271839 560442 31.06 735161 40.74 1804438 99.71 38.55 66.38
Source : Horticulture Department of Uttarakhand
Table 2.12

(Ha.) (%)
Almora 0.83 0.05 1.31 0.10 6 0.78 94
Bageshwar 0.22 0.04 0.39 0.08 18 0.18 82
Chamoli 0.35 0.02 0.53 0.03 5 0.33 95
Rudraprayag 0.2 0.03 0.31 0.05 13 0.17 87
Champawat 0.25 0.02 0.42 0.04 10 0.23 90
Dehradun 0.47 0.21 0.74 0.34 44 0.26 56
Haridwar 1.2 1.07 1.74 1.50 89 0.13 11
Naintal 0.47 0.28 0.80 0.40 60 0.19 40
Pauri Garhwal 0.81 0.08 1.24 0.14 10 0.73 90
Pithoragarh 0.48 0.04 0.88 0.07 8 0.44 92
Tehri Garhwal 0.61 0.09 0.99 0.16 14 0.52 86
US Nagar 1.51 1.48 2.59 2.48 98 0.03 2
Uttarkashi 0.27 0.05 0.42 0.09 19 0.22 81
Total 7.67 3.45 12.35 5.49 45 4.22 55
Source : Agriculture Department Uttarakhand
Annexure Table 2.13: Irrigation Status (Area in lakh ha)
Rainfed Area (%)Districts Net Cultivated Area
Net Irrigated
Area
Gross Cultivated Area
Gross Irrigated Area
Net Irrigated (%)
Table 2.13

No. Area No. Area No. Area No. Area No. Area No. Area
Almora3178
0 0 0 0 0 0 0 0 0 1840 0 5018
Bageshwar 4633
0 0 0 0 0 0 0 0 1176 5809
Chamoli841
0 0 0 0 0 0 0 0 991 1832
Rudraprayag1403
0 0 0 0 0 0 0 0 772 2175
Champawat1325
0 0 0 0 655 0 0 197 2177
Dehradun13997
0 0 0 72 3237 0 0 5181 22487
Haridwar15080
0 0 0 136 90073 0 0 2064 107353
Naintal21363
0 0 0 0 4577 0 0 152 26092
Pauri Garhwal3037
0 21 0 0 476 0 0 4504 8038
Pithoragarh1255
0 0 0 0 0 0 0 0 2915 4170
Tehri Garhwal778
0 0 0 0 0 0 0 0 6913 7691
Udham Singh Nagar 25250 0 313 10516 103838 0 0 5679 145596
Uttarkashi3468
0 0 0 0 0 0 0 0 1506 4974
95608 0 334 0 10724 0 202856 0 0 0 33890 0 343412
Source : Agriculture Department Uttarakhand
Annexure Table 2.14: Source wise Area Irrigated (Latest data) (Area in Hectares)
TanksDistricts Canals (Area)
TotalOpen Wells Tube/Bore wells Lift Irrigationn Other Sources
Table 2.14

No. of Blocks % Area No. of Blocks % Area No. of Blocks % Area No. of Blocks % Area
Dehradun (Doiwala) 1 5.27
Dehradun (Sahaspur) 1 6.53
Haridwar (Bahadrabad) 1 71.54
Haridwar (Bhagwanpur) 1 133.41
Haridwar (Narsen) 1 82.47
Haridwar (Roorkee) 1 87.02
Haridwar (Khanpur) 1 67.39
Naintal (Ramnagar) 1 32.08
Naintal (Haldwani) 1 24.67
USNagar (Gadarpur) 1 72.74
USNagar (Sitarganj) 1 69.60
USNagar (Rudrapur) 1 86.77
USNagar (Jaspur) 1 77.09
USNagar (Bazpur) 1 84.70
USNagar (Kashipur) 1 84.28
USNagar (Khatima) 1 82.52
Rest of nine districts including Hilly Development Block of above four districts Total 78 Dev Blocks are :
Source : Central Ground Water Board
SafeOver ExploitedDistricts Critical Semi Critical
Annexure Table 2.15 (a): Groundwater Status
Table 2.15 a

No. Total Area (ha) No. Total Area (ha) No. Total Area (ha)
Almora
Bageshwar
Chamoli
Rudraprayag
Champawat
Dehradun
Haridwar
Naintal
Pauri Garhwal
Pithoragarh
Tehri Garhwal
Udham Singh Nagar
Uttarkashi
Total
Data not available
Command Area up to 20 haDistricts Command Area 20-100 ha Command Area > 100 ha
Annexure Table 2.15 (b): Details of Water Bodies
Table 2.15 b

Fodder Crops
Grazing Land
Cross Bred
Indigenous Total Improved Indigenous Total Improved Indigenous Total Improved Indigenous Total Boiler Layer Ducks
1 Almora 0 30461 9874 227869 237743 3326 106402 109728 180 4710 4890 0 171732 171732 17689 44878 2 2333 526426
2 Bageshwar 0 27486 1339 119782 121121 774 41476 42250 9294 10689 19983 0 81105 81105 4973 9751 0 1799 266258
3 Chamoli 0 49808 15367 173088 188455 6489 48664 55153 8070 37581 45651 0 78162 78162 3932 14932 0 5394 372815
4 Rudraprayag 0 4308 2262 100166 102428 946 36276 37222 675 14961 15636 0 39726 39726 2521 3085 0 1811 196823
5 Champawat 131 19078 12411 87226 99637 1236 36385 37621 25 33 58 0 48492 48492 31672 24652 0 1799 187607
6 Dehradun 2884 329 39791 148117 187908 22781 48904 71685 1339 20837 22176 0 116672 116672 288968 70322 155 11338 409779
7 Haridwar 21105 51 25714 102354 128068 83374 185161 268535 125 2145 2270 0 21265 21265 39202 23999 51 17766 437904
8 Naintal 1873 0 27208 143375 170583 13840 109266 123106 31 147 178 0 63207 63207 115711 101018 75 5006 362080
9 Pauri Garhwal 92 35179 9356 348197 357553 5426 60946 66372 2680 31283 33963 0 150575 150575 12410 55147 10 4936 613399
10 Pithoragarh 1 53326 17299 223449 240748 2359 84518 86877 7378 25426 32804 0 145173 145173 35454 15024 7 2537 508139
11 Tehri Garhwal 0 593 2279 120881 123160 5062 109988 115050 7155 7656 14811 0 101981 101981 8234 21159 0 7129 362131
12 U Singh Nagar 10889 46 53595 70356 123951 60828 115077 175905 70 2087 2157 0 44514 44514 905037 76823 1068 4276 350803
13 Uttarkashi 0 8279 11119 95708 106827 3643 35047 38690 53131 48137 101268 0 95593 95593 8841 30588 0 6787 349165
Total 36975 228944 227614 1960568 2188182 210084 1018110 1228194 90153 205692 295845 0 1158197 1158197 1474644 491378 1368 72911 4943329
Source : Livestock Department, Uttarakhand
Area under fodder (ha)
Districts Cattle (Nos.) Sheep (No.)
Annexure Table 2.16: Livestock Population
Total (No.)
Buffaloes (Nos)Sl.No
Goats (No.) Poultry (Nos.) Other (No.)
Table 2.16

Parameters State National
a) Total production (litre/day) 3345205 276353424658
b) A.V.Production (litre/household/day) 2.35 1.47
c) Means of marketing Co-oparatives,Dairy,SHG Co-oparatives,Dairy,SHG
Source : Livestock Department Uttarakhand
Annexure Table 2.17: Milk Population
Table 2.17

No. Area No. Area
1 Almora 88 2.362 0 0 2.92 6.905
2 Bageshwar 52 1.43 0 0 2.92 4.181
3 Chamoli 84 2.53 0 0 2.92 7.396
4 Rudraprayag 31 0.545 0 0 2.92 1.593
5 Champawat 95 1.49 0 0 2.92 4.356
6 Dehradun 107 42.656 0 0 2.92 124.705
7 Haridwar 431 348.783 0 0 2.92 1019.667
8 Naintal 49 2.73 0 0 2.92 7.981
9 Pauri Garhwal 87 1.74 0 0 2.92 5.087
10 Pithoragarh 100 2.516 0 0 2.92 7.356
11 Tehri Garhwal 78 3.042 0 0 2.92 8.893
12 Udham Singh Nagar 241 191.75 7 20075 0.079 1605.581
13 Uttarkashi 102 2.56 0 0 2.92 7.484
Total 1545 604.134 7 20075 0.136 2811.185
Source : Fisheries Department, Uttarakhand
Annexure Table 2.18: Status of Aquaculture (As on 2007-08)
Sl.No Districts Production (t)Water Spread Area (ha)
Ponds/Tanks Reservoirs
Yield (t/ha)
Table 2.18

Commercial Banks
RRBs Cooperative PACs Others
1 Almora 50 19 22 80 6 177
2 Bageshwar 12 12 4 18 4 50
3 Chamoli 24 10 16 54 0 104
4 Rudraprayag 16 5 5 37 0 63
5 Champawat 12 4 7 22 5 50
6 Dehradun 176 15 16 39 11 257
7 Haridwar 105 1 14 42 5 167
8 Naintal 54 19 25 53 12 163
9 Pauri Garhwal 64 34 19 134 1 252
10 Pithoragarh 28 21 15 112 1 177
11 Tehri Garhwal 55 23 24 87 24 213
12 Udham Singh Nagar 85 8 24 34 12 163
13 Uttarkashi 23 3 13 44 0 83
Total 704 174 204 756 81 1919
Source : Department of Rural Department, Uttarakhand
Name of Districts No. of Institutions TotalSl.no.
Annexure Table 2.19: Detials of Credit Institutions in the State (As on 31-03-2006)
Table 2.19
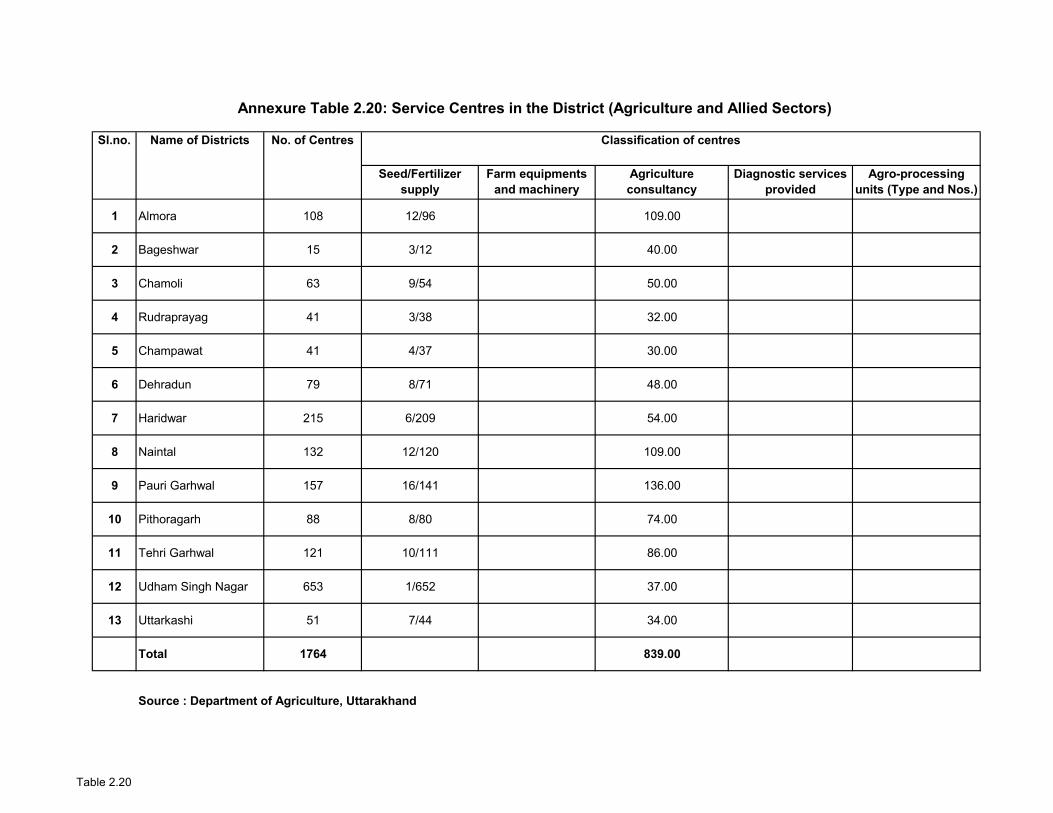
Seed/Fertilizer supply
Farm equipments and machinery
Agriculture consultancy
Diagnostic services provided
Agro-processing units (Type and Nos.)
1 Almora 108 12/96 109.00
2 Bageshwar 15 3/12 40.00
3 Chamoli 63 9/54 50.00
4 Rudraprayag 41 3/38 32.00
5 Champawat 41 4/37 30.00
6 Dehradun 79 8/71 48.00
7 Haridwar 215 6/209 54.00
8 Naintal 132 12/120 109.00
9 Pauri Garhwal 157 16/141 136.00
10 Pithoragarh 88 8/80 74.00
11 Tehri Garhwal 121 10/111 86.00
12 Udham Singh Nagar 653 1/652 37.00
13 Uttarkashi 51 7/44 34.00
Total 1764 839.00
Source : Department of Agriculture, Uttarakhand
No. of Centres Classification of centresName of DistrictsSl.no.
Annexure Table 2.20: Service Centres in the District (Agriculture and Allied Sectors)
Table 2.20
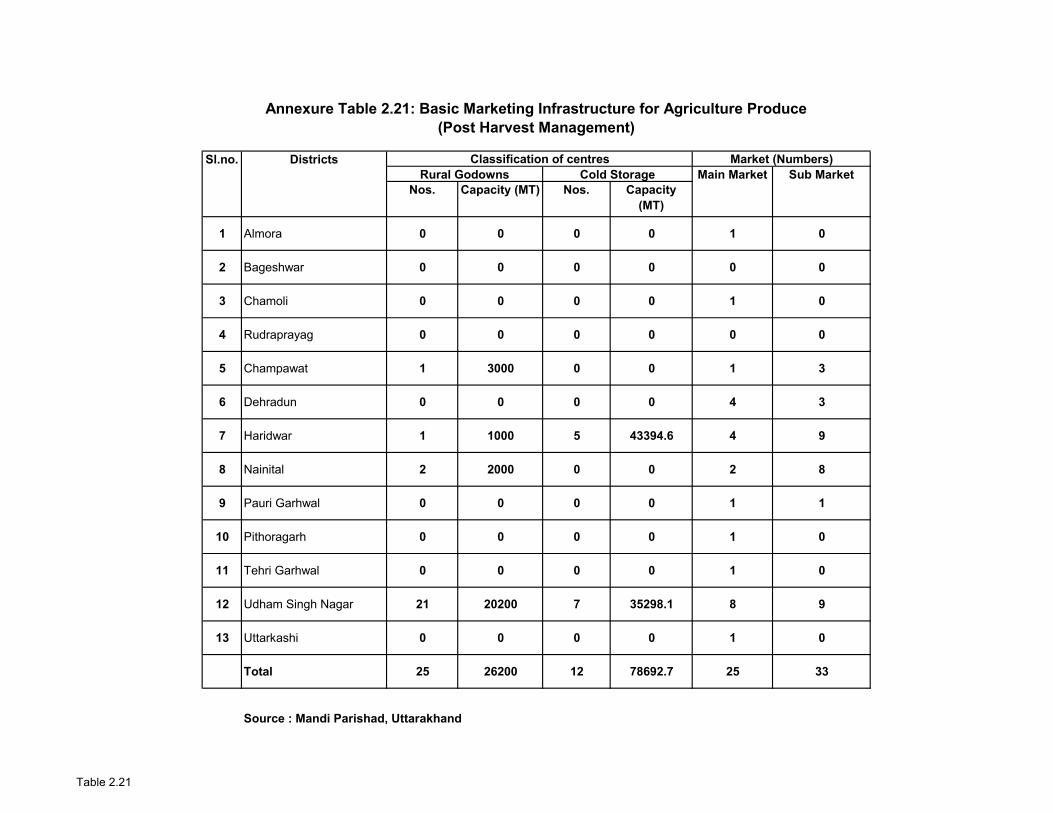
Nos. Capacity (MT) Nos. Capacity (MT)
1 Almora 0 0 0 0 1 0
2 Bageshwar 0 0 0 0 0 0
3 Chamoli 0 0 0 0 1 0
4 Rudraprayag 0 0 0 0 0 0
5 Champawat 1 3000 0 0 1 3
6 Dehradun 0 0 0 0 4 3
7 Haridwar 1 1000 5 43394.6 4 9
8 Nainital 2 2000 0 0 2 8
9 Pauri Garhwal 0 0 0 0 1 1
10 Pithoragarh 0 0 0 0 1 0
11 Tehri Garhwal 0 0 0 0 1 0
12 Udham Singh Nagar 21 20200 7 35298.1 8 9
13 Uttarkashi 0 0 0 0 1 0
Total 25 26200 12 78692.7 25 33
Source : Mandi Parishad, Uttarakhand
Annexure Table 2.21: Basic Marketing Infrastructure for Agriculture Produce (Post Harvest Management)
Sl.no. Market (Numbers)Main Market Sub Market
DistrictsRural Godowns Cold Storage
Classification of centres
Table 2.21

Total
Agriculture Horticulture Forest Others
1 Almora 86348 30305 236179 113026 465858
2 Bageshwar 22802 5685 110160 74895 213542
3 Chamoli 34871 18111 506100 288498 847580
4 Rudraprayag 18732 4165 179895 32629 235421
5 Champawat 32709 16538 132337 56794 238378
6 Dehradun 41358 35983 201831 89821 368993
7 Haridwar 19501 18069 72431 121109 231110
8 Naintal 24924 35721 298336 47452 406433
9 Pauri Garhwal 99048 25651 385099 163054 672852
10 Pithoragarh 49748 22028 205239 133677 410692
11 Tehri Garhwal 65569 28146 322051 70000 485766
12 Udham Singh Nagar 8120 13756 93738 165456 281070
13 Uttarkashi 27891 17681 721661 45182 812415
Sub Total 531621 271839 3465057 1401593 5670110
Source: Agriculture Deptt. Uttarakhand
Sl.no Districts Rainfed Area (ha)
Annexure Table 3.1: Extent of Rainfed Area
Table 3.1

DDP DPAP IWDP IWMP CDP NWDPRA OTHERS TOTAL
Area sanctioned so far for treatment (Ha.) 0 423000 304526 0 0 275735 996000 1999261
Amount sanctioned(Rs.in Crore) 0 230.90 180.29 0 0 198.87 810.42 1420.48
No. of watershed sanctioned (No.) 0 102 143 0 0 27 267 539
Area treated so far (Ha.) 0 58500 0 0 0 199765 761200 1019465
Amount Utilised(Rs.in Crore) 0 97.98 99.02 0 0 106.76 408.42 712.18
Watershed completed (No.) 8 0 0 0 27 190 225
Ongoing watershed (No.) 0 94 143 0 0 0 77 314
Source: 1.Agriculture Deptt. Uttarakhand 2. Rural Development. Uttarakhand 3. WMD. Uttarakhand
Annexure Table 4.1: Watershed Development schemes in the State
Table 4.1
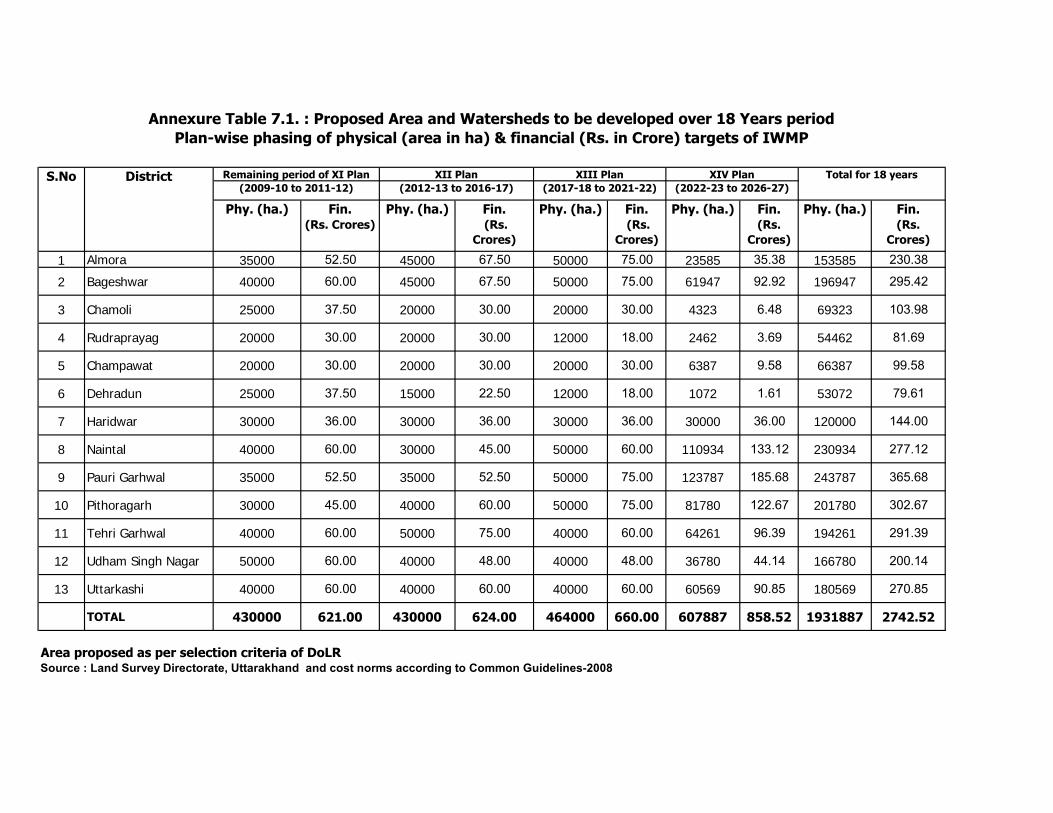
Phy. (ha.) Fin. (Rs. Crores)
Phy. (ha.) Fin. (Rs.
Crores)
Phy. (ha.) Fin. (Rs.
Crores)
Phy. (ha.) Fin. (Rs.
Crores)
Phy. (ha.) Fin. (Rs.
Crores)
1 Almora 35000 52.50 45000 67.50 50000 75.00 23585 35.38 153585 230.38
2 Bageshwar 40000 60.00 45000 67.50 50000 75.00 61947 92.92 196947 295.42
3 Chamoli 25000 37.50 20000 30.00 20000 30.00 4323 6.48 69323 103.98
4 Rudraprayag 20000 30.00 20000 30.00 12000 18.00 2462 3.69 54462 81.69
5 Champawat 20000 30.00 20000 30.00 20000 30.00 6387 9.58 66387 99.58
6 Dehradun 25000 37.50 15000 22.50 12000 18.00 1072 1.61 53072 79.61
7 Haridwar 30000 36.00 30000 36.00 30000 36.00 30000 36.00 120000 144.00
8 Naintal 40000 60.00 30000 45.00 50000 60.00 110934 133.12 230934 277.12
9 Pauri Garhwal 35000 52.50 35000 52.50 50000 75.00 123787 185.68 243787 365.68
10 Pithoragarh 30000 45.00 40000 60.00 50000 75.00 81780 122.67 201780 302.67
11 Tehri Garhwal 40000 60.00 50000 75.00 40000 60.00 64261 96.39 194261 291.39
12 Udham Singh Nagar 50000 60.00 40000 48.00 40000 48.00 36780 44.14 166780 200.14
13 Uttarkashi 40000 60.00 40000 60.00 40000 60.00 60569 90.85 180569 270.85
TOTAL 430000 621.00 430000 624.00 464000 660.00 607887 858.52 1931887 2742.52
Source : Land Survey Directorate, Uttarakhand and cost norms according to Common Guidelines-2008
Total for 18 years
(2009-10 to 2011-12) (2012-13 to 2016-17) (2017-18 to 2021-22) (2022-23 to 2026-27)
Area proposed as per selection criteria of DoLR
Annexure Table 7.1. : Proposed Area and Watersheds to be developed over 18 Years period
Plan-wise phasing of physical (area in ha) & financial (Rs. in Crore) targets of IWMP
S.No District Remaining period of XI Plan XII Plan XIII Plan XIV Plan

Table 8.1: Agro-Climatic zone wise area to be treated under Watershed programmes
Sl.no District Agro-climatic zone Area to be treated (ha)
No. of Watersheds Name of the scheme (IWMP,
NWDPRA etc.)
1 Almora 9153585 44
IWMP
2 Bageshwar 9196947 32
IWMP
3 Chamoli 969323 14
IWMP
4 Rudraprayag 954462 15
IWMP
5 Champawat 966387 14
IWMP
6 Dehradun 9,14 53072 24 IWMP
7 Haridwar 9,14 120000 0 IWMP
8 Naintal 9 230934 25 IWMP
9 Pauri Garhwal 9 243787 71 IWMP
10 Pithoragarh 9 201780 42 IWMP
11 Tehri Garhwal 9 194261 66 IWMP
12 Udham Singh Nagar 9,14 166780 7 IWMP
13Uttarkashi 9 180569 55 IWMP
TOTAL 1931887 409
Source : Land Survey Directorate, Uttarakhand
Table 8.1

Annexure Table-8.2.a: Year-wise phasing of physical (area in ’000 ha) & Financial (Rs. in lakh) targets of IWMP for remaining period of XI Plan *:
1 2
H&D O H&D O H&D O H&D O H&D O H&D O H&D O H&D O
1 Almora 3 0 15 0 2250 2 0 10 0 1500 2 0 10 0 1500 7 0 35 0 5250
2 Bageshwar 3 0 15 0 2250 3 0 15 0 2250 2 0 10 0 1500 8 0 40 0 6000
3 Chamoli 2 0 10 0 1500 2 0 10 0 1500 1 0 5 0 750 5 0 25 0 3750
4 Rudraprayag 2 0 10 0 1500 1 0 5 0 750 1 0 5 0 750 4 0 20 0 3000
5 Champawat 2 0 10 0 1500 1 0 5 0 750 1 0 5 0 750 4 0 20 0 3000
6 Dehradun 2 0 10 0 1500 2 0 10 0 1500 1 0 5 0 750 5 0 25 0 3750
7 Haridwar 0 2 0 10 1200 0 2 0 10 1200 0 2 0 10 1200 0 6 0 30 3600
8 Naintal 3 0 15 0 2250 3 0 15 0 2250 2 0 10 0 1500 8 0 40 0 6000
9 Pauri Garhwal 3 0 15 0 2250 2 0 10 0 1500 2 0 10 0 1500 7 0 35 0 5250
10 Pithoragarh 2 0 10 0 1500 2 0 10 0 1500 2 0 10 0 1500 6 0 30 0 4500
11 Tehri Garhwal 3 0 15 0 2250 3 0 15 0 2250 2 0 10 0 1500 8 0 40 0 6000
12 U S Nagar 0 4 0 20 2400 0 4 0 20 2400 0 2 0 10 1200 0 10 0 50 6000
13 Uttarkashi 3 0 15 0 2250 3 0 15 0 2250 2 0 10 0 1500 8 0 40 0 6000
TOTAL 28 6 140 30 24600 24 6 120 30 21600 18 4 90 20 15900 70 16 350 80 62100
O- Others
3
S. No District Remaining period of XI Plan
2009-10 2010-11 2011-12 Total
Phy. Fin.
Area
Phy. Fin. Phy. Fin. Phy.
H&D- Hilly & Difficult area;Area proposed as per selection criteria of DoLR keeping in view regional balance
Fin.
No. of projects Area No. of projects Area No. of projects Area No. of projects

Table 8.2(b): Annual Plan /Cost Table for three years of XIth plan
2009-10 2010-11 2011-12 3 yrs Total 2009-10 2010-11 2011-12 3 yrs Total
1 Almora 15000 10000 10000 35000 22.5 15 15 52.5
2 Bageshwar 15000 15000 10000 40000 22.5 22.5 15 60
3 Chamoli 10000 10000 5000 25000 15 15 7.5 37.5
4 Rudraprayag 10000 5000 5000 20000 15 7.5 7.5 30
5 Champawat 10000 5000 5000 20000 15 7.5 7.5 30
6 Dehradun(Hills) 10000 10000 5000 25000 15 15 7.5 37.5
7 Haridwar(Plain) 10000 10000 10000 30000 12 12 12 36
Nainital(Hills) 15000 15000 10000 40000 22.5 22.5 15 60
9 Pauri Garhwal 15000 10000 10000 35000 22.5 15 15 52.5
10 Pithoragarh 10000 10000 10000 30000 15 15 15 45
11 Tehri Garhwal 15000 15000 10000 40000 22.5 22.5 15 60
12 U S Nagar(Plain) 20000 20000 10000 50000 24 24 12 60
13 Uttarkashi 15000 15000 10000 40000 22.5 22.5 15 60
Total 170000 150000 110000 430000 246 216 159 621
Sl.No. District Watersheds Area Planned for treatment ( ha) Project Cost (Rs. Crores)
Area proposed as per selection criteria of DoLR

Table 8.2(c): Component-wise breakup of the Extimated Budget for the First Five Years
Area (000 ha)
Nos. Admn. Cost
Moni toring
Evalua tion
EPA Inst. And Capacity Building
DPR Prepara
tion
Water shed
Development
Works
Liveli hood
Activities
Prod. System
and Micro Enter prise
Cosolida tion
Phase
Total
1 Almora 35 12 525 52.5 52.5 210 262.5 52.5 2625 525 682.5 262.5 5250
2 Bageshwar 40 11 600 60 60 240 300 60 3000 600 780 300 6000
3 Chamoli 25 4 375 37.5 37.5 150 187.5 37.5 1875 375 487.5 187.5 3750
4 Rudraprayag 20 7 300 30 30 120 150 30 1500 300 390 150 3000
5 Champawat 20 7 300 30 30 120 150 30 1500 300 390 150 3000
6 Dehradun 25 15 375 37.5 37.5 150 187.5 37.5 1875 375 487.5 187.5 3750
7 Haridwar 30 nd 360 36 36 144 180 36 1800 360 468 180 3600
8 Naintal 40 13 600 60 60 240 300 60 3000 600 780 300 6000
9 Pauri Garhwal 35 11 525 52.5 52.5 210 262.5 52.5 2625 525 682.5 262.5 5250
10 Pithoragarh 30 8 450 45 45 180 225 45 2250 450 585 225 4500
11 Tehri Garhwal 40 21 600 60 60 240 300 60 3000 600 780 300 6000
12 Udham Singh Nagar 50 3 600 60 60 240 300 60 3000 600 780 300 6000
13 Uttarkashi 40 17 600 60 60 240 300 60 3000 600 780 300 6000
Total 430 129 6210 621 621 2484 3105 621 31050 6210 8073 3105 62100
EPA: Entry Point Activities
DPR: Detailed Project Report
Area proposed as per selection criteria of DoLR
Sl.no District Proposed Budget Components (Rs.in Lakhs)

BRGF RKVY NFSM NHM MoWR Schemes
NAP
2008-09 2009-10 (Proposed)
2008-09 2009-10 (Proposed)
1 Almora 724.261 2848.225 - - - - - - 724.261 2848.225
2 Bageshwar 727.384 1551.275 - - - - - - 727.384 1551.275
3 Chamoli 2469.370 7164.775 - - - - - - 2469.370 7164.775
4 Rudraprayag 380.693 576.975 - - - - - - 380.693 576.975
5 Champawat 989.220 1535.800 - - - - - - 989.220 1535.800
6 Dehradun 1578.730 1973.475 - - - - - - 1578.730 1973.475
7 Haridwar 978.821 1842.250 - - - - - - 978.821 1842.250
8 Naintal 374.661 609.318 - - - - - - 374.661 609.318
9 Pauri Garhwal 1491.940 3510.925 - - - - - - 1491.940 3510.925
10 Pithoragarh 1303.220 1857.125 - - - - - - 1303.220 1857.125
11 Tehri Garhwal 4428.839 9317.575 - - - - - - 4428.839 9317.575
12 U S Nagar 1126.200 2819.343 - - - - - - 1126.200 2819.343
13 Uttarkashi 962.694 1714.250 - - - - - - 962.694 1714.250
Total 17536.033 37321.311 - - - - - - 17536.033 37321.311
EPA: Entry Point Activities
DPR: Detailed Project Report
Source : Department of Rural Development, Uttarakhand
DistrictSl.no Name of Schemes and Fund allocation
NREGS Total
Annexure Table 8.3: Details of Schemes to enable Convergence
Table 8.3

APPENDICES

APPENDIX - 1
Criteria for exclusion of sub-projects/activity
Screening Guidelines on Environment and Social safeguards
S.
No.
Criteria
I Forests / biodiversity
1 Activities likely to cause damage to wildlife, or likely to cause damage to a
sanctuary by setting fire, injuring wildlife, or involving indiscriminate felling of
trees or indiscriminate removal of plant, animal or mineral produce from a
sanctuary
II Dams
2 Activity that involves a dam (existing or new) of 10 metres high or more
III Farming System
3 Agricultural activities that intend to use banned pesticides, agrochemicals in WHO
classes IA, IB and II
4 Activities that involve manufacture or sale, stocking or exhibiting for sale or
distribution of any insecticide, pesticide, medicine without a license
5 Activities that totally eliminate indigenous races of food crop
6 Activities that spread of Vector of diseases of livestock
IV Land
7 Activities that can cause risk of floods and damage to downstream resources
8 No constructions related to common activities to be taken up on land owned by
vulnerable groups.
9 Activity that have any adverse impact on the indigenous people/ vulnerable
families in terms of displacement or their livelihoods being affected
10 Activity that introduce/promote child labour?
11 Activity that exclude the vulnerable from the benefits?
12 Activity that involve production, storage and consumption of tobacco, drugs,
alcohol, etc.
13 Activity that cause damage to places of religious importance and historical
monuments and cultural property.

APPENDIX - 2
Criteria for Limited ESA of Sub-Projects/Activity
S.
No.
Criteria
1 Construction of water impounding structures/ earth work with a height of more
than 5 metre and less than 10 metre.
2 Construction of roads, bridge, civil works etc. that may cause destabilization of
lands.
3 Activity that limit the traditional/legal rights of indigenous people on common
property resources.
4 Activity that involve on private land causes loss of livelihood.

APPENDIX - 3
ENVIRONMENTAL AND SOCIAL ASSESSMENT FOR WC AND GP
To be filled up by WC being facilitated by WDT for selecting sub-projects/activities.
Put X for negative impacts and √ for positive or no negative impacts.
Sl.
No
Project activities Possible environmental impacts Possible social impacts Inter
activit
y
impact
Inter
area
impa
ct
Miti-
gative
meas
ures*
Justi-
fication
for
decision A B C D E F G H I J K L M N O P Q R S T U V W X Y Z Z1 Z2 Z3 Z4 Z5
1 2 3 4 5 6 7 8 9 10 11 12 13 14 15 16 17 18 19 20 21 22 23 24 25 26 27 28 29 30 31 32 33 34 35 36 37
Land Arable land Agriculture 1 Cultivation of
HYVs,
On-farm
cultivation (cash
crops / vege.)
2 Spices & condiments
3 Medicinal plants 4 Organic farming 5 Diversified
agriculture
6 Terrace repairs 7 Vegetative field
boundaries
Horticulture 8 Horticultural
crops-fruits,
flowers, aromatic
& medicinal plants
9 Homesteads 10 Essential oils -
Geranium, Rose,
Marigold,
Lemon grass
11 Orchard devel. 12 Rejuvenation of
old orchards
Non-Arable
land
13 Forest

Sl.
No
Project activities Possible environmental impacts Possible social impacts Inter
activit
y
impact
Inter
area
impa
ct
Miti-
gative
meas
ures*
Justi-
fication
for
decision 14 Strengthening of
Van Panchayat
15 Afforestation 16 Bamboo
plantation
17 Soil and water
conservation
works
18 Assisted natural
regeneration
Silvi-pasture 19 Plantation of
fodder
trees/shrubs/gras
ses
20 Fodder
development
21 Rotational
grazing
Water
Harvesting
22 Maintenance of
existing water
source/structure
23 Water
harvesting
Livestock &
animal
husbandry
24 Breed
improvement
25 Stall feeding 26 Nutrition
management
27 Disease control
& health,
veterinary
facilities
28 Stray animal
castration
Natural
hazards
mitigation

Sl.
No
Project activities Possible environmental impacts Possible social impacts Inter
activit
y
impact
Inter
area
impa
ct
Miti-
gative
meas
ures*
Justi-
fication
for
decision 30 Small landslides
control
31 Drainage line
treatment
Income
generating
activities
32 NTFPs 33 Seed production
and nursery
raising
34 Crop processing
and preservation
35 Mushroom
cultivation
36 Bee keeping 37 Knitting and
weaving
38 Fibre production Infrastructure
development
39 Storage facilities 40 Transport
facilities &
connectivity
41 Market linkage 42 Rural credit
facilities
Transhumant 43 Temporary
shelter
44 Water facility 45 Animal health
care
46 Fodder 47. Migratory
path

ID Environment Impacts ID Social Impacts
A Surface Water (Quality/Quantity) P Loss of Species of Medicinal Importance - ENV
B Ground Water (Quality/Quantity) Q Generation of Solid Waste/ Wastewater - ENV
C Siltation of Water Bodies R Require Chemical Fertilizers/Pesticides - ENV
D Agricultural Productivity (Grain/Fodder) S Loss of (danger of extinction) to the Local Gene Pool (Plants/Crops) - ENV
E Soil Quality T Workload (particularly on women)
F Soil Erosion/Gully Formation U Loss of Nutritious Food
G Soil Moisture V Dislocation of People
H Instability of Hill Slopes/Landslides Loss of livelihood
W Loss to SC/ST and Other Marginalized Groups, transhumants.
I Air / Noise Pollution Benefits to the vulnerable
J Pressure on Surrounding Trees and Vegetation Legal rights of the people protected
K Forest Fire X Use of Child Labour
Benefits to the nomads
L Loss of Biodiversity (Flora/Fauna) Y Increase in Insect Pest and Wildlife Attacks
M Loss of Aquatic Life Z Unemployment to Local Labour
N Invasion of Exotic Species Z1 Damage of Places of Religious/Historical Importance/Monuments
O Loss of Rare, Threatened & Endangered Species Z2 Increased Social Conflicts (benefit sharing)
Z3 Adverse Effect on Human Health
Z4 Adverse Effect on Cultural/Ethical/Aesthetic Values

APPENDIX -4
Format for
Gram panchayat watershed development plan
1. Name of Gram Panchayat (GP) :
2. Area of GP :
3. Population of GP :
4. Name of Revenue Villages (RVs) in GP :
5. Name of MWS :
6. Name of Development Block :
7. Name of District :
8. Demography of GP :
Name
of RV
No. of Households Population
Total SC ST Total Out of which SC/ST
Male Female Male Female
Total
9. Livestock Population
Name of
RV
Cow Buffalo Goat &
Sheep
Mule &
Horses
Poultry Others
Male Female Male Female
total
10. Landuse (Revenue Villagewise)
Name
of RV
Total
Geographic
Area in ha
Agriculture land in ha Pasture
and
Barren
Land in
ha
Common
land
under
forest in
ha
River
bed
in ha
Culturable
Waste
land in ha
Irrigated Unirrigated
Total
11. Available Water Resources in the Revenue Village
Name of
RV Type of Water Resource and the availability of water from water
source in months
Spring Naula Gul Well Handpump Stand Post
Kaccha Pucca

12. Availability of Fuel and Fodder
12.1 Sources of Fuel - Sources Period *
Forest - -
LPG -
Biogas -
Kerosene Stove -
Solar Energy -
Others -
* Period Fuel available for - 3 months/6 months/9 months/whole year
12.2 Sources of Fodder - Sources Period *
Agriculture land -
Pasture land -
Forests -
* Period Fuel available for - 3 months/6 months/9 months/whole year
13. Road Accessibility and Market availability : Name of market and the distance in
Km. – Kuccha Road, Metalled Road, Bridle and Mule Track etc.
14. Revenue Villagewise Socio-economic Status of Households
Income Groups No. of Households
1. Poor -
2. Medium -
3. Upper -
(Through PRA Exercise)
15. Need Assessment through PRA Plans
16. Identified activities for Watershed Development
17. Vulnerable Group Plan :
18. Phasing of Activities (Physical and Financial)
Activity Unit
Cost
I yr II yr III yr IV yr V yr Total
Phy Fin Phy Fin Phy Fin Phy Fin Phy Fin Phy Fin
19. MoU for Cost Sharing and Maintenance of Assets should be enclosed in GPWDP

APPENDIX -5 FORMAT FOR PREPARATION OF ESTIMATES BY WC FOR EACH ACTIVITY
Gram Panchayat_____________
Estimate for Activities
Activity Name : ………………………….
Price of Activity : ………………………..
Units/ Physical Measurement: …………………………..
S.No Sub
Activity
Name
Units of
Measur
ement
Units Material Costs Labour Total
LabourCo
st (Rs.)
Total
Cost
Unit
Cost
Typ
e of
Mat
eria
l
Quantity
required
(Units)
Unit
cost
(Rs.)
Total
Material
cost
(Rs.)
Type of
Labour
work
Estimated man days for
stipulated work
Wage rate as per Govt.
norms
Skilled
labour
(No.)
Unskilled/
semi skilled
labour(No.)
Skilled
(Rs.)
Unskilled/
semi skilled
(Rs.)
1 2 3 4 5 6 7 8 9 10 11 12 13 14 15=8+
14
16=15/4
TOTAL
Less Beneficiary Share
Project Share:
Prepared By:

Appendix -6
FORMAT FOR TECHNICAL SANCTION FOR EACH ACTIVITY
Gram Panchayat_____________
Technical Sanction
Activity Name:____________ Sanction No. _____________
Units / Physical Measurement ______________ Total Cost as per estimate: _______
Place of Work: ____________ Beneficiary Share: ____________
Date of Start: _____________ Project Share: _____________
Date of Completion: _______
Summary of Estimated Expenditure, Sub-activity wise
S.No Sub Activity Name
Unit of
Measurement Units Rate per Unit Total Cost
Total
Less: Beneficiary contribution: _________
Project Share: __________________
Sanctioning Authority Name:
Signature: Date:


Sl. No. DISTRICT SWS MWS Clust Appro Contiguty Degraded SC_STSM& Mg
Farm er
Assured
Ir rgation
Actual
Wages
Total
Weight
No. o f
Vil
1 Almora Kuchgad Garsari 15 10 15 5 10 15 0 70 14
2 Almora Kuchgad Gaunchhil Gadhera 15 10 10 5 10 15 0 65 1
3 Almora Badangarh Nayar Khatron Nala 15 10 10 3 10 15 0 63 45
4 Almora Bino Nadi Gaya Gadhera 15 10 10 3 10 15 0 63 10
5 Almora Kuchgad Kotila 15 10 15 5 3 15 0 63 10
6 Almora Dhikala Jakh Gadhera 15 10 15 3 3 15 0 61 14
7 Almora Kuchgad Korar 15 10 15 3 3 15 0 61 17
8 Almora Gagas Jam Gadhera 15 10 10 5 5 15 0 60 56
9 Almora Gagas Mawar 15 10 10 5 5 15 0 60 7
10 Almora Jaigan Nadi Kirori Ganga 15 10 10 5 5 15 0 60 32
11 Almora Kuchgad Karkhet 15 10 10 5 5 15 0 60 9
12 Almora Kuchgad Dungari 15 10 10 5 5 15 0 60 10
13 Almora Gagas Makron 15 10 10 5 3 15 0 58 9
14 Almora Uttari Koshi Khulgad 15 10 10 5 3 15 0 58 22
15 Almora Gagas Mallagad 15 10 10 5 3 15 0 58 28
16 Almora Kuchgad Bajina 15 10 10 5 3 15 0 58 38
17 Almora Badangarh Nayar Nayar Nadi 15 10 10 3 5 15 0 58 44
18 Almora Panar Sidiyagad 15 10 10 5 3 15 0 58 44
19 Almora Maigar Khansar Adigram 15 10 10 3 5 15 0 58 17
20 Almora Jaigan Nadi Galli Gad 15 10 10 5 3 15 0 58 17
21 Almora Panar Kotgad 15 10 10 5 3 15 0 58 7
22 Almora Jaigan Nadi Kunkhet 15 10 10 5 3 15 0 58 17
23 Almora Purvi Nayar Bungdhar Talla 15 10 10 3 5 15 0 58 13
24 Almora Dhikala Gabhini Gadhera 15 10 10 5 3 15 0 58 8
25 Almora Panar Khanigad 15 10 10 5 3 15 0 58 7
26 Almora Panar Kutargad 15 10 10 3 5 15 0 58 30
27 Almora Bino Nadi Tamadhaun 15 10 10 3 5 15 0 58 15
28 Almora Jaigan Nadi Ghuniyoligad 15 10 10 5 3 15 0 58 8
29 Almora Uttari Koshi Kuraligad 15 10 10 5 3 15 0 58 6
30 Almora Jaigan Nadi Begarh 15 10 10 3 5 15 0 58 8
31 Almora Gagas Kaligad 15 10 10 3 3 15 0 56 12
32 Almora Jaigan Nadi Naini 15 10 10 3 3 15 0 56 16
33 Almora Maigar Khansar Mansi 15 10 10 3 3 15 0 56 28
34 Almora Badangarh Nayar Kalsori Gadhera 15 10 10 3 3 15 0 56 53
35 Almora Badangarh Nayar Badangarh Nadi 15 10 10 3 3 15 0 56 93
36 Almora Maigar Khansar Khachyar Gadhera 15 10 10 3 3 15 0 56 14
37 Almora Bino Nadi Chauna 15 10 10 3 3 15 0 56 20
38 Almora Jaigan Nadi Manogad 15 10 10 3 3 15 0 56 8
39 Almora Jaigan Nadi Phalalgad 15 10 10 3 3 15 0 56 7
40 Almora Kuchgad Panyali Gad 15 10 10 3 10 5 0 53 2
41 Almora Uttari Koshi Baldi Gad 5 10 10 5 5 15 0 50 8
42 Almora Maigar Khansar Tyarka Gadhera 15 10 10 5 3 5 0 48 25
43 Almora Gagas Gagas Nadi 5 10 10 5 5 10 0 45 24
44 Almora Maigar Khansar Trag Gadhera 5 10 10 3 3 5 0 36 20
Appendix Table 7-(i)MWS of Almora district with its weightage criteria
Page 1 of 1

Sl. No. DISTRICT SWS MWS Clust Appro
Conti-guty
Degra-ded SC_ST SM& Mg
FarmerAssured Irrgation
Actual Wages
Total Weight No. of Vil
1 Bageshwar Jaigan Nadi Bhatkhola 15 10 10 10 3 15 0 63 51
2 Bageshwar Godigad Dalaurgad 15 10 10 5 5 15 0 60 30
3 Bageshwar Gomti Phatagali 15 10 10 5 5 15 0 60 3
4 Bageshwar Sarju Ratdhar 15 10 10 5 3 15 0 58 22
5 Bageshwar Gomti Bageswar 15 10 10 5 3 15 0 58 27
6 Bageshwar Sarju Saran Gadhera 15 10 10 3 5 15 0 58 4
7 Bageshwar Gomti Kalirao 15 10 10 5 3 15 0 58 12
8 Bageshwar Pinder Upper Ghatiyagad 15 10 10 5 3 15 0 58 2
9 Bageshwar Pinder Upper Talkori 15 10 10 3 5 15 0 58 3
10 Bageshwar Pinder Upper Bauragad 15 10 10 3 5 15 0 58 3
11 Bageshwar Pinder Upper Kaphnigad 15 10 5 10 3 15 0 58 2
12 Bageshwar Ramganga Purvi Chanoli 15 10 10 3 3 15 0 56 2
13 Bageshwar Sarju Ravati Ganga 15 10 10 3 3 15 0 56 5
14 Bageshwar Ramganga Purvi Leti Rauli 15 10 10 3 3 15 0 56 5
15 Bageshwar Sarju GasonGad 15 10 10 3 3 15 0 56 3
16 Bageshwar Ramganga Purvi Lamagarh 15 10 10 3 3 15 0 56 5
17 Bageshwar Godigad Badhargad 15 10 10 5 5 10 0 55 69
18 Bageshwar Godigad Kulurgad 15 10 10 5 10 5 0 55 33
19 Bageshwar Gomti Chhira Raula 15 10 10 5 5 10 0 55 10
20 Bageshwar Gomti Dhatoli Nala 15 10 10 5 3 10 0 53 25
21 Bageshwar Godigad Karariyagaon 15 10 10 5 3 10 0 53 33
22 Bageshwar Sarju Bamsera 15 10 10 5 3 10 0 53 3
23 Bageshwar Sarju Loharkhet 15 5 10 5 3 15 0 53 22
24 Bageshwar Golasukhi Katna Nadi 15 10 5 3 3 15 0 51 73
25 Bageshwar Pinder Upper Surag 15 5 10 3 3 15 0 51 1
26 Bageshwar Pinder Upper Sunderdhonga 15 10 5 3 3 15 0 51 1
27 Bageshwar Sarju Joshigaon 15 10 10 5 3 5 0 48 10
28 Bageshwar Sarju Swajgad 15 10 10 5 3 5 0 48 7
29 Bageshwar Sarju Andherigad 15 10 10 5 3 5 0 48 11
30 Bageshwar Sarju Dharamghar 15 10 10 3 3 5 0 46 15
31 Bageshwar Gomti Garurganga 5 10 10 3 3 10 0 41 34
32 Bageshwar Golasukhi Sukhi Nadi 15 10 5 3 3 5 0 41 36
Appendix Table 7-(ii)MWS of Bageshwar district with its weightage criteria
Page 1 of 1

Sl. No. DISTRICT SWS MWS Clust Appro
Conti-guty
Degra-ded SC_ST SM& Mg
FarmerAssured Irrgation
Actual Wages
Total Weight No. of Vil
1 Chamoli Nagoigad Balasuit 15 10 10 5 5 15 0 60 21
2 Chamoli Budhi Ganga Taraktal 5 10 10 5 10 15 0 55 8
3 Chamoli Nandakini Bhoriyagadhera 5 10 10 3 10 15 0 53 1
4 Chamoli Sarswati Neelganga 5 10 10 10 3 15 0 53 2
5 Chamoli Nandakini Mokhgad 5 10 10 5 5 15 0 50 8
6 Chamoli Lower Pinder Right Chorgad 5 10 10 5 5 15 0 50 2
7 Chamoli Lower Pinder Right Nakot 5 10 10 3 5 15 0 48 17
8 Chamoli Atagad Karanprayag 5 10 10 3 5 15 0 48 17
9 Chamoli Nandakini Molagad 5 10 10 5 3 15 0 48 8
10 Chamoli Sarswati Khirganga 5 10 5 10 3 15 0 48 1
11 Chamoli Nandakini Gulari 5 10 10 3 3 15 0 46 4
12 Chamoli Maigar Khansar Syunigad 5 10 10 3 3 15 0 46 7
13 Chamoli Kail Ganga Ghes 5 10 10 3 3 15 0 46 1
14 Chamoli Plus Sarmola 5 10 10 3 5 10 0 43 19
Appendix Table 7-(iii)MWS of Chamoli district with its weightage criteria
Page 1 of 1

Sl. No. DISTRICT SWS MWS Clust Appro
Conti-guty
Degra-ded SC_ST SM& Mg
FarmerAssured Irrgation
Actual Wages
Total Weight No. of Vil MWS
Area (ha.)Cumi. Area
1 Rudraprayag Mandakini Mandani Ganga 15 10 10 3 10 15 0 63 6 11150 11150
2 Rudraprayag Plus Chamak 15 10 10 5 5 15 0 60 23 1719 12869
3 Rudraprayag Madhya Maheshwar Setgad 15 5 10 5 10 15 0 60 2 2213 15082
4 Rudraprayag Badiyargad Utyasu 15 10 10 3 5 15 0 58 3 1031 16113
5 Rudraprayag Plus Khurar 15 10 10 3 3 15 0 56 8 744 16857
6 Rudraprayag Augustmuni Rampur 15 10 10 3 3 15 0 56 16 2125 18982
7 Rudraprayag Madhya Maheshwar Kyargad 15 10 10 3 3 15 0 56 14 5326 24308
8 Rudraprayag Madhya Maheshwar Anphalgad 15 10 10 3 3 15 0 56 9 3696 28004
9 Rudraprayag Mandakini Kaliganga 15 10 10 3 3 15 0 56 6 6500 34504
10 Rudraprayag Badiyargad Bhardargad 15 5 10 3 5 15 0 53 17 3472 37976
11 Rudraprayag Rudraprayag Ratura 15 10 15 3 3 5 0 51 28 3288 41264
12 Rudraprayag Lastargad Kwila(plus) 15 10 10 3 3 10 0 51 19 2500 43764
13 Rudraprayag Plus Dungri 15 10 10 3 3 10 0 51 17 1244 45008
14 Rudraprayag Lastargad Barsari 15 10 10 3 3 10 0 51 19 2229 47237
15 Rudraprayag Badiyargad Sera 15 5 10 3 5 5 0 43 25 7225 54462
54462
Appendix Table 7-(iv)MWS of Rudraprayag district with its weightage criteria
Page 1 of 1

Sl. No. DISTRICT SWS MWS Clust Appro
Conti-guty
Degra-ded SC_ST SM& Mg
FarmerAssured Irrgation
Actual Wages
Total Weight No. of Vil
1 Champawat Panar Serigad 15 10 10 3 10 15 0 63 12
2 Champawat Lohawati Dara 15 10 10 3 10 15 0 63 7
3 Champawat Panar Kotkigad 15 10 15 5 3 15 0 63 3
4 Champawat Lohawati Lohawati Nadi 15 10 10 3 5 15 0 58 14
5 Champawat Ladhiya Sungaon 15 10 5 3 10 15 0 58 14
6 Champawat Ladhiya Kuirala River 15 10 5 3 10 15 0 58 9
7 Champawat Lohawati Champawat 15 10 10 3 3 15 0 56 25
8 Champawat Panar Siprahgad 15 10 10 3 3 15 0 56 6
9 Champawat Lohawati Daura 15 10 10 3 3 15 0 56 4
10 Champawat Ladhiya Dhamisaun 15 10 5 5 5 15 0 55 18
11 Champawat Cheera Lupra 5 10 15 3 5 15 0 53 4
12 Champawat Ladhiya Nadkuli 15 10 5 3 5 15 0 53 20
13 Champawat Ladhiya Amkhola 15 10 5 3 3 15 0 51 11
14 Champawat Purnagiri Purnagiri 10 10 5 5 5 15 0 50 34
Appendix Table 7-(v)MWS of Champawat district with its weightage criteria
Page 1 of 1

Sl. No. DISTRICT SWS MWS Clust Appro
Conti-guty
Degra-ded SC_ST SM& Mg
FarmerAssured Irrgation
Actual Wages
Total Weight No. of Vil MWS
Area (ha.)Cumi. Area
1 Dehradun Amtiargad Gharatgad 15 10 15 10 10 15 0 75 6 1607 1607
2 Dehradun Amtiargad Gariyargad 15 10 15 10 5 15 0 70 8 1587 3194
3 Dehradun Amtiargad Aragad 15 10 15 10 5 15 0 70 8 2123 5317
4 Dehradun Benalgad Abankhand 15 10 15 10 5 15 0 70 4 1657 6974
5 Dehradun Amtiargad Bagnigad 15 5 15 10 10 15 0 70 2 834 7808
6 Dehradun Rikhnargad Kota 15 10 15 10 10 10 0 70 3 2029 9837
7 Dehradun Tons ABCD Sitkigad 15 10 15 10 3 15 0 68 1 767 10604
8 Dehradun Khutnugad Saiya 15 10 15 10 3 15 0 68 4 1734 12338
9 Dehradun Tons ABCD Anu 15 10 15 10 3 15 0 68 1 985 13323
10 Dehradun Khutnugad Kotuwagad 15 10 15 10 10 5 0 65 6 2368 15691
11 Dehradun Amlawa Seligad Kata Pathar* 15 10 10 5 10 15 0 65 6 2007 17698
12 Dehradun Amlawa Seligad Kalsi 15 10 15 10 3 10 0 63 15 2439 20137
13 Dehradun Tons ABCD Sainj 15 10 10 10 3 15 0 63 5 1395 21532
14 Dehradun Tons Left Sangargad 15 10 10 10 3 15 0 63 2 900 22432
15 Dehradun Tons ABCD Chandinigad 15 10 10 10 3 15 0 63 6 3531 25963
16 Dehradun Benalgad Mashak 15 10 10 10 3 15 0 63 2 1988 27951
17 Dehradun Tons Left Chattagad 15 10 10 10 3 15 0 63 2 2084 30035
18 Dehradun Tons Left Dharmigad 15 10 10 10 3 15 0 63 4 4094 34129
19 Dehradun Benalgad Silli 15 10 15 10 3 10 0 63 2 3073 37202
20 Dehradun Daragad Jakheragad 15 10 10 10 3 15 0 63 2 5751 42953
21 Dehradun Benalgad Ghtai 15 10 10 10 3 15 0 63 4 2978 45931
22 Dehradun Tons ABCD Atal 15 10 15 10 5 5 0 60 3 1820 47751
23 Dehradun Amtiargad Jamrad 15 10 15 10 3 5 0 58 3 2227 49978
24 Dehradun Amlawa Seligad Kata Pathar 15 10 10 10 3 5 0 53 6 3094 53072
53072
Appendix Table 7-(vi)MWS of Dehradun district with its weightage criteria
Page 1 of 1

Sl. No. DISTRICT SWS MWS Clust Appro
Conti-guty
Degra-ded SC_ST SM& Mg
FarmerAssured Irrgation
Actual Wages
Total Weight No. of Vil MWS
Area (ha.)Cumi. Area
1 Nanital Ramgad Sirsa 15 10 15 10 5 10 0 65 19 1595 1595
2 Nanital Lebar Kumia Nadi 10 5 15 10 10 15 0 65 2 2825 4420
3 Nanital Suyal Kwarab 15 10 15 5 5 15 0 65 6 1549 5969
4 Nanital Ramgad Bhandarpani Sot 15 10 10 5 10 15 0 65 3 3105 9074
5 Nanital Suyal Sanchutiya 15 10 10 10 3 15 0 63 9 2506 11580
6 Nanital Ramgad Manarsa 15 10 10 5 3 15 0 58 23 3387 14967
7 Nanital Ramgad Bhowali Nala 15 10 10 5 3 15 0 58 12 3537 18504
8 Nanital Kalsa Gola Kanyali 15 10 15 3 5 10 0 58 7 2856 21360
9 Nanital Ramgad Dhona 15 10 10 5 3 15 0 58 11 4121 25481
10 Nanital Kalsa Gola Tandigad 15 10 10 5 3 15 0 58 21 9106 34587
11 Nanital Ramgad Khaula Nadi 15 10 10 5 3 15 0 58 1 2152 36739
12 Nanital Ramgad Kataliya Sot 15 5 10 3 10 15 0 58 1 2268 39007
13 Nanital Ramgad Basgaon 15 10 15 3 3 10 0 56 14 1006 40013
14 Nanital Kuchgad Dabarbari 15 10 15 5 3 5 0 53 11 1800 41813
15 Nanital Dhara Phika Phika Nadi 15 5 10 3 3 15 0 51 71 22498 64311
16 Nanital Ramgad Ramgad 15 10 10 3 3 10 0 51 23 7368 71679
17 Nanital Kuchgad Amdanda 15 5 5 5 3 15 0 48 47 19267 90946
18 Nanital Lebar Nanaksagar 10 5 10 5 3 15 0 48 5 6625 97571
19 Nanital Ramgad Kanuchiyasot 15 10 10 5 3 5 0 48 5 2993 100564
20 Nanital Lebar Deoha Nadi 10 10 5 5 3 15 0 48 12 17750 118314
21 Nanital Bhakra Bhakra Nadi 15 10 10 3 3 5 0 46 68 18299 136613
22 Nanital Dhela Rattapani Rao 15 5 10 5 3 5 0 43 86 22231 158844
23 Nanital Dhela Dhela 15 5 5 5 3 10 0 43 32 23162 182006
24 Nanital Ramgad Babliya Sot 15 10 5 5 3 5 0 43 18 7275 189281
25 Nanital Baur Kaladhungi 15 10 5 5 3 5 0 43 91 41653 230934
230934
Appendix Table 7-(vii)MWS of Nainital district with its weightage criteria
Page 1 of 1

Sl. No. DISTRICT SWS MWS Clust
ApproConti-guty
Degra-
ded
SC_
ST
SM& Mg
Farmer
Assure
d
Irrgatio
Actual
Wage
s
Total
Weight
No. of
Vil
M_PRIOR
AG_TOTAL
MWS Area (ha.)
SumOfNO_H
H
SumOfTOT_
P
SumOfP_SC
SumOfP_ST
SumOfTOT_IR
R
SumOfUN_IRR
SumOfMGWK
_F
Pop Dens
Cumi. Area
1 Pauri Purvi Nayar Pasolgad 15 10 10 5 10 15 0 65 50 14 2195 4781 1144 5428 1344 0 72.14 990.7 956 1.14 4781
2 Pauri Paschimi Nayar Bhawani 15 10 10 3 10 15 0 63 25 15 984 2025 1032 4630 849 0 13.994 679.977 1111 2.29 6806
3 Pauri Paschimi Nayar Baligad 15 10 10 3 10 15 0 63 25 18 1557 4230 1292 6548 1281 0 51.59 764.38 1077 1.55 11036
4 Pauri Paschimi Nayar Ghatgad 15 10 15 5 3 15 0 63 49 21 1596 3853 1265 5592 1245 0 67.7 1473.81 528 1.45 14889
5 Pauri Paschimi Nayar Syotigad 15 10 10 3 10 15 0 63 24 11 826 4150 1095 5709 758 0 29.81 480.32 999 1.38 19039
6 Pauri Randigad Saldanggad 15 10 15 5 3 15 0 63 58 23 1293 4531 1421 5973 1714 0 25.23 1094.17 233 1.32 23570
7 Pauri Nayar Left Chandol 15 10 15 3 5 15 0 63 33 25 1399 2738 831 3594 624 0 75.02 675.228 594 1.31 26308
8 Pauri Purvi Nayar Chanchariya Gad 15 10 10 3 10 15 0 63 15 16 719 2063 411 2096 269 0 3.001 391.42 356 1.02 28371
9 Pauri Bino Nadi Masangari Nadi 15 10 10 3 10 15 0 63 25 15 1744 5225 973 5194 679 0 20.65 859.55 814 0.99 33596
10 Pauri Srinagar Nadalgad 15 10 15 5 3 15 0 63 33 19 1440 3946 787 3529 726 0 36.49 458.3 71 0.89 37542
11 Pauri Purvi Nayar Byasigad 15 10 15 3 3 15 0 61 7 21 718 2206 890 4494 683 3 23.87 373.29 253 2.04 39748
12 Pauri Paschimi Nayar Maithana 15 10 15 3 3 15 0 61 13 19 758 2358 671 3493 499 3 75.383 264.683 135 1.48 42106
13 Pauri Purvi Nayar Jiwai 15 10 15 3 3 15 0 61 10 21 445 1471 402 1750 218 0 0.9 327.1 96 1.19 43577
14 Pauri Randigad Kotagad 15 10 15 3 3 15 0 61 25 21 1161 2664 579 2246 437 1 42.85 263.42 124 0.84 46241
15 Pauri Paschimi Nayar Tiloli 15 10 15 3 3 15 0 61 7 20 524 1616 282 1303 139 0 15.6 216.33 25 0.81 47857
16 Pauri Machlad Silogi 15 10 10 5 5 15 0 60 68 14 2413 4400 2020 8906 1846 0 17.81 1615.44 1122 2.02 52257
17 Pauri Nayar Right Kangad 15 10 10 5 5 15 0 60 77 16 3630 6176 2037 8777 2672 0 123.4 2406.53 1474 1.42 58433
18 Pauri Nayar Right Thangad 15 10 10 5 5 15 0 60 48 16 2083 4175 1259 5299 1623 3 33.825 1528.75 686 1.27 62608
19 Pauri Srinagar Nakotgad 15 10 10 5 3 15 0 58 59 18 1531 2737 1633 7163 1911 0 11.17 1705.84 631 2.62 65345
20 Pauri Paschimi Nayar Patisain 15 10 10 3 5 15 0 58 53 17 1826 2544 1441 6125 1138 0 36.46 1228.58 1149 2.41 67889
21 Pauri Paschimi Nayar Irgad 15 10 10 5 3 15 0 58 80 14 3447 6164 3382 14786 3013 3 71.44 2105.63 952 2.40 74053
22 Pauri Paschimi Nayar Khargad 15 10 10 5 3 15 0 58 76 16 2906 5271 2593 10745 2935 3 42.76 2207.38 785 2.04 79324
23 Pauri Hiyunl_Pauri Sar 15 10 10 3 5 15 0 58 35 13 1824 2567 1153 4939 757 0 80.35 1249.93 763 1.92 81891
24 Pauri Paschimi Nayar Sirgad 15 10 10 3 5 15 0 58 73 16 2539 4849 1973 8776 1548 0 217.4 1406.61 1337 1.81 86740
25 Pauri Paschimi Nayar Bachheli 15 10 10 3 5 15 0 58 46 17 2027 3071 1204 5190 883 0 80.375 1515.42 899 1.69 89811
26 Pauri Paschimi Nayar Tarpalisain 15 10 10 3 5 15 0 58 20 18 1623 4500 1372 7525 878 0 24.639 847.36 705 1.67 94311
27 Pauri Srinagar Dewanigad 15 10 10 5 3 15 0 58 50 17 1462 3832 1482 6088 1236 0 11.865 1256.39 205 1.59 98143
28 Pauri Randigad Nalagad 15 10 10 5 3 15 0 58 37 14 1503 4550 1290 5532 1156 0 29.641 1006.7 499 1.22 102693
29 Pauri Bino Nadi Binonadi 15 10 10 3 5 15 0 58 38 11 2075 6250 1115 6351 813 0 52.971 649.691 621 1.02 108943
Appendix Table 7-(viii)MWS of Pauri Garhwal district with its weightage criteria
Page 1 of 3

Sl. No. DISTRICT SWS MWS Clust
ApproConti-guty
Degra-
ded
SC_
ST
SM& Mg
Farmer
Assure
d
Irrgatio
Actual
Wage
s
Total
Weight
No. of
Vil
M_PRIOR
AG_TOTAL
MWS Area (ha.)
SumOfNO_H
H
SumOfTOT_
P
SumOfP_SC
SumOfP_ST
SumOfTOT_IR
R
SumOfUN_IRR
SumOfMGWK
_F
Pop Dens
Cumi. Area
30 Pauri Randigad Jwaragad 15 10 10 5 3 15 0 58 34 14 1552 2875 707 2891 678 0 4.12 744.36 109 1.01 111818
31 Pauri Hiyunl_Pauri Chopra 15 10 10 3 5 15 0 58 12 11 1115 1271 222 1025 52 0 6.55 148.96 128 0.81 113089
32 Pauri Kandi Rudragad 15 10 10 3 5 15 0 58 7 10 906 1762 243 1004 38 1 5.2 248.71 185 0.57 114851
33 Pauri Purvi Nayar Udiyar Gad 15 10 10 3 5 15 0 58 5 10 592 3224 229 1094 195 0 4.934 147.89 151 0.34 118075
34 Pauri Purvi Nayar Gwarigad 15 10 10 3 5 15 0 58 5 14 303 3225 240 1084 50 0 5.17 325.87 127 0.34 121300
35 Pauri Paschimi Nayar Dhuijuli 15 10 10 3 3 15 0 56 13 18 732 1711 687 3654 723 0 24.62 246.384 169 2.14 123011
36 Pauri Machlad Bhaligaon 15 10 10 3 3 15 0 56 20 11 438 1250 614 2641 415 0 5.02 422.53 270 2.11 124261
37 Pauri Paschimi Nayar Kutti 15 10 10 3 3 15 0 56 34 11 1005 3819 1766 7847 1497 0 32.725 674.88 461 2.05 128080
38 Pauri Paschimi Nayar Choya 15 10 10 3 3 15 0 56 29 12 1239 3119 1350 6198 958 0 24.293 963.2 529 1.99 131199
39 Pauri Purvi Nayar Gairigad 15 10 10 3 3 15 0 56 37 17 1477 2700 1120 5354 593 0 55.51 813.5 334 1.98 133899
40 Pauri Machlad Kandali Nadi 15 10 10 3 3 15 0 56 41 13 1597 3900 1480 6518 1301 0 17.47 1084.09 482 1.67 137799
41 Pauri Srinagar Devalgad 15 10 10 3 3 15 0 56 31 16 1556 2612 921 4011 632 0 29.36 601.22 416 1.54 140411
42 Pauri Machlad Chargad 15 10 10 3 3 15 0 56 31 12 1987 6600 2190 9918 1284 0 0 1352.65 927 1.50 147011
43 Pauri Paschimi Nayar Talgad 15 10 10 3 3 15 0 56 14 12 645 2188 716 3246 590 0 17.23 345.68 299 1.48 149199
44 Pauri Paschimi Nayar Chakisain 15 10 10 3 3 15 0 56 17 18 896 3050 862 4348 607 0 22.3 442.71 110 1.43 152249
45 Pauri Paschimi Nayar Sidoli 15 10 10 3 3 15 0 56 14 14 852 3119 957 4176 313 0 4.17 379.37 60 1.34 155368
46 Pauri Purvi Nayar Chorkanda 15 10 10 3 3 15 0 56 18 18 1357 3487 993 4476 720 0 27.22 1048.27 295 1.28 158855
47 Pauri Purvi Nayar Thalsaingad 15 10 10 3 3 15 0 56 14 16 1238 3937 964 4979 734 0 19.92 700.91 359 1.26 162792
48 Pauri Srinagar Gadurgad 15 10 10 3 3 15 0 56 33 17 1100 3842 1068 4649 867 0 58.41 710.67 386 1.21 166634
49 Pauri Purvi Nayar Rasiya gad 15 10 10 3 3 15 0 56 14 12 835 2981 690 3437 425 0 12.652 354.337 158 1.15 169615
50 Pauri Srinagar Chilgarh 15 10 10 3 3 15 0 56 30 15 1375 2541 694 2921 578 1 9.791 535.427 115 1.15 172156
51 Pauri Hiyunl_Pauri Amsain 15 10 10 3 3 15 0 56 10 10 461 2385 532 2456 249 0 19.73 542.84 126 1.03 174541
52 Pauri Paschimi Nayar Kaligad 15 10 10 3 3 15 0 56 13 14 663 3844 711 3323 511 0 12.204 336.87 247 0.86 178385
53 Pauri Purvi Nayar Khandgaon 15 10 10 3 3 15 0 56 15 11 1140 4237 641 3490 444 0 27.34 638.17 236 0.82 182622
54 Pauri Bino Nadi Basolagad 15 10 10 3 3 15 0 56 22 13 2469 5119 566 3346 350 0 4.1 751.39 249 0.65 187741
55 Pauri Purvi Nayar Kalagal 15 10 10 3 3 15 0 56 20 13 1320 5281 720 3248 604 1 0.121 907.485 179 0.62 193022
56 Pauri Srinagar Rudraprayag 15 10 10 3 3 15 0 56 8 16 454 4344 412 2048 114 1 7 221 160 0.47 197366
57 Pauri Srinagar Bargad 15 10 10 3 3 15 0 56 5 12 247 1853 161 774 49 0 0 86.6 20 0.42 199219
58 Pauri Srinagar Bachangad 15 10 10 3 3 15 0 56 7 13 2200 5895 335 1633 181 0 2 256.67 116 0.28 205114
59 Pauri Paschimi Nayar Khand 15 10 10 3 3 15 0 56 5 9 316 5025 256 1273 234 0 7.5 154.74 87 0.25 210139
60 Pauri Purvi Nayar Panchard 15 10 10 3 5 10 0 53 7 16 581 2650 477 2264 372 0 76.9 244.45 364 0.85 212789
Page 2 of 3
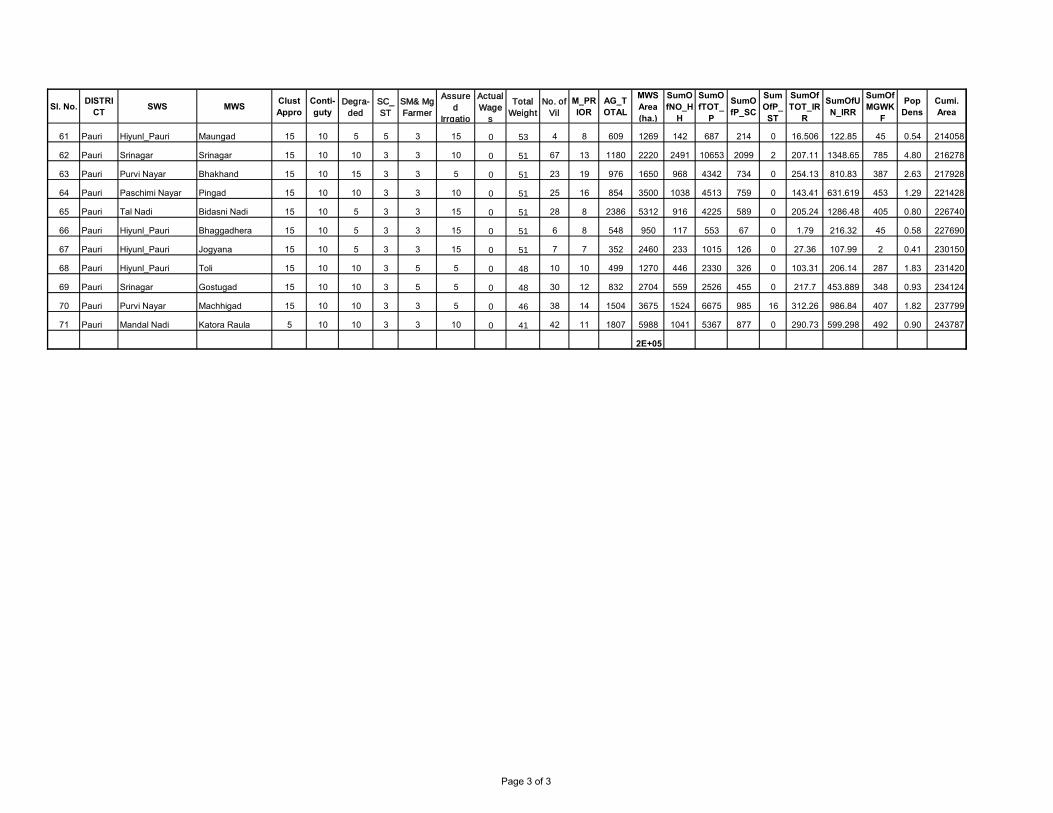
Sl. No. DISTRICT SWS MWS Clust
ApproConti-guty
Degra-
ded
SC_
ST
SM& Mg
Farmer
Assure
d
Irrgatio
Actual
Wage
s
Total
Weight
No. of
Vil
M_PRIOR
AG_TOTAL
MWS Area (ha.)
SumOfNO_H
H
SumOfTOT_
P
SumOfP_SC
SumOfP_ST
SumOfTOT_IR
R
SumOfUN_IRR
SumOfMGWK
_F
Pop Dens
Cumi. Area
61 Pauri Hiyunl_Pauri Maungad 15 10 5 5 3 15 0 53 4 8 609 1269 142 687 214 0 16.506 122.85 45 0.54 214058
62 Pauri Srinagar Srinagar 15 10 10 3 3 10 0 51 67 13 1180 2220 2491 10653 2099 2 207.11 1348.65 785 4.80 216278
63 Pauri Purvi Nayar Bhakhand 15 10 15 3 3 5 0 51 23 19 976 1650 968 4342 734 0 254.13 810.83 387 2.63 217928
64 Pauri Paschimi Nayar Pingad 15 10 10 3 3 10 0 51 25 16 854 3500 1038 4513 759 0 143.41 631.619 453 1.29 221428
65 Pauri Tal Nadi Bidasni Nadi 15 10 5 3 3 15 0 51 28 8 2386 5312 916 4225 589 0 205.24 1286.48 405 0.80 226740
66 Pauri Hiyunl_Pauri Bhaggadhera 15 10 5 3 3 15 0 51 6 8 548 950 117 553 67 0 1.79 216.32 45 0.58 227690
67 Pauri Hiyunl_Pauri Jogyana 15 10 5 3 3 15 0 51 7 7 352 2460 233 1015 126 0 27.36 107.99 2 0.41 230150
68 Pauri Hiyunl_Pauri Toli 15 10 10 3 5 5 0 48 10 10 499 1270 446 2330 326 0 103.31 206.14 287 1.83 231420
69 Pauri Srinagar Gostugad 15 10 10 3 5 5 0 48 30 12 832 2704 559 2526 455 0 217.7 453.889 348 0.93 234124
70 Pauri Purvi Nayar Machhigad 15 10 10 3 3 5 0 46 38 14 1504 3675 1524 6675 985 16 312.26 986.84 407 1.82 237799
71 Pauri Mandal Nadi Katora Raula 5 10 10 3 3 10 0 41 42 11 1807 5988 1041 5367 877 0 290.73 599.298 492 0.90 243787
2E+05
Page 3 of 3

Sl. No. DISTRICT SWS MWS Clust Appro
Conti-guty
Degra-ded SC_ST SM& Mg
FarmerAssured Irrgation
Actual Wages
Total Weight No. of Vil MWS
Area (ha.)Cumi. Area
1 Pithoragarh Gori Ganga Painagad 15 10 10 10 10 15 0 70 8 9312 9312
2 Pithoragarh Ramganga Purvi Gurghatiya 15 10 10 5 10 15 0 65 63 5188 14500
3 Pithoragarh Gori Ganga Patmoligad 15 10 10 5 10 15 0 65 2 3150 17650
4 Pithoragarh Ramganga Purvi Ranikhet 15 10 10 5 10 15 0 65 12 3846 21496
5 Pithoragarh Gori Ganga Bherigad 15 10 10 10 5 15 0 65 3 3750 25246
6 Pithoragarh Gori Ganga Dogrigad 15 10 10 3 10 15 0 63 2 2478 27724
7 Pithoragarh Gori Ganga Ghosigad 15 10 10 3 10 15 0 63 1 8450 36174
8 Pithoragarh Ramganga Purvi Simgad 15 10 15 5 10 5 0 60 12 2608 38782
9 Pithoragarh Gori Ganga Dhuratoli 15 5 15 5 5 15 0 60 12 2468 41250
10 Pithoragarh Ramganga Purvi Dhaulgad 15 10 10 10 5 10 0 60 11 2308 43558
11 Pithoragarh Ramganga Purvi Jhiniyagad 15 5 15 5 5 15 0 60 4 1200 44758
12 Pithoragarh Gori Ganga Rajgari 15 5 10 10 5 15 0 60 4 2462 47220
13 Pithoragarh Godigad Dauligad 15 10 10 10 3 10 0 58 17 1406 48626
14 Pithoragarh Ramganga Purvi Lakrigad 15 10 10 3 5 15 0 58 11 1988 50614
15 Pithoragarh Ramganga Purvi Patligad 15 10 10 3 5 15 0 58 8 2980 53594
16 Pithoragarh Gori Ganga Madkani River 15 10 10 5 3 15 0 58 9 20013 73607
17 Pithoragarh Gori Ganga Kwirigad 15 5 10 3 10 15 0 58 2 4950 78557
18 Pithoragarh Ramganga Purvi Gadiyar Nadi 15 5 10 3 10 15 0 58 2 6948 85505
19 Pithoragarh Dharchula Dharchula 15 10 10 3 3 15 0 56 2 5500 91005
20 Pithoragarh Ramganga Purvi Gogina 15 5 15 3 3 15 0 56 9 18500 109505
21 Pithoragarh Gori Ganga Khetargad 15 10 15 5 5 5 0 55 25 8206 117711
Appendix Table 7-(ix)MWS of Pithoragarh district with its weightage criteria
Page 1 of 2

Sl. No. DISTRICT SWS MWS Clust Appro
Conti-guty
Degra-ded SC_ST SM& Mg
FarmerAssured Irrgation
Actual Wages
Total Weight No. of Vil MWS
Area (ha.)Cumi. Area
22 Pithoragarh Ramganga Purvi Jajar Rauli 15 10 10 5 10 5 0 55 4 1921 119632
23 Pithoragarh Kutti Sirkha 5 10 10 10 5 15 0 55 10 8556 128188
24 Pithoragarh Kutti Jiuntigad 5 10 10 10 5 15 0 55 4 3356 131544
25 Pithoragarh Gori Ganga Sungariya Gadhera 15 10 10 10 3 5 0 53 7 1237 132781
26 Pithoragarh Gori Ganga Tumariya Gadhera 15 5 10 3 5 15 0 53 4 2525 135306
27 Pithoragarh Ramganga Purvi Bhujgad 15 5 10 3 3 15 0 51 10 8868 144174
28 Pithoragarh Gori Ganga Jonligad 15 5 10 3 3 15 0 51 1 1544 145718
29 Pithoragarh Ramganga Purvi Nargoli 5 10 10 5 10 10 0 50 22 2554 148272
30 Pithoragarh Dharchula Chuagad 15 10 10 5 5 5 0 50 2 3700 151972
31 Pithoragarh Gori Ganga Ghungargad 15 5 15 5 5 5 0 50 8 3232 155204
32 Pithoragarh Ramganga Purvi Chamungad 5 10 10 5 5 15 0 50 22 3950 159154
33 Pithoragarh Gori Ganga Senargad 15 5 10 10 5 5 0 50 7 2950 162104
34 Pithoragarh Gori Ganga Dharanti 15 5 10 10 3 5 0 48 31 1925 164029
35 Pithoragarh Ramganga Purvi Barargad 15 10 10 5 3 5 0 48 56 6469 170498
36 Pithoragarh Ramganga Purvi Kaligad 5 10 10 5 3 15 0 48 33 3380 173878
37 Pithoragarh Gori Ganga Bhadoligad 15 5 10 10 3 5 0 48 13 1656 175534
38 Pithoragarh Gori Ganga Pachhugad 5 10 5 10 3 15 0 48 5 7019 182553
39 Pithoragarh Ramganga Purvi Silgad 15 5 10 3 3 10 0 46 10 4385 186938
40 Pithoragarh Kutti 3 5 10 5 5 5 15 0 45 4 4955 191893
41 Pithoragarh Jhulaghat Ghatgad 5 10 10 5 3 10 0 43 27 3362 195255
42 Pithoragarh Gori Ganga Laspa Badligad 5 5 5 10 3 15 0 43 4 6525 201780
201780
Page 2 of 2

Sl. No. DISTRICT SWS MWS Clust Appro
Conti-guty
Degra-ded SC_ST SM& Mg
FarmerAssured Irrgation
Actual Wages
Total Weight No. of Vil MWS
Area (ha.)Cumi. Area
1 Tehri Jalkurgad Bagi 15 10 15 5 10 15 0 70 5 739 739
2 Tehri Nagungad Jaspur 15 10 10 5 10 15 0 65 12 1275 2014
3 Tehri Ghonti Banchurigad 15 10 10 5 10 15 0 65 6 2474 4488
4 Tehri Jalkurgad Kyarkigad 15 10 10 3 10 15 0 63 13 1868 6356
5 Tehri Jalkurgad Piplogi 15 10 10 3 10 15 0 63 10 1718 8074
6 Tehri Bhilangna Upper Chakar Gaon 15 5 15 3 10 15 0 63 11 1038 9112
7 Tehri Aglar Maind 15 10 15 5 3 15 0 63 5 950 10062
8 Tehri Aglar Dewangarh 15 10 15 3 5 15 0 63 8 1986 12048
9 Tehri Aglar Ringaligad 15 10 10 3 10 15 0 63 9 2221 14269
10 Tehri Dangchaura Takoli 15 10 15 3 3 15 0 61 23 2819 17088
11 Tehri Aglar Bichu 15 10 15 3 3 15 0 61 9 2036 19124
12 Tehri Dangchaura Jakhand 15 10 10 5 5 15 0 60 19 2325 21449
13 Tehri Bhilangna Upper Porgad 15 5 10 5 10 15 0 60 10 1906 23355
14 Tehri Bhilangna Upper Gawana 15 5 10 5 10 15 0 60 2 1250 24605
15 Tehri Bhilangna Upper Bajiya 15 5 10 3 10 15 0 58 9 813 25418
16 Tehri Jalkurgad Dharkot 15 10 10 3 5 15 0 58 31 3168 28586
17 Tehri Jalkurgad Ongad 15 5 10 3 10 15 0 58 22 3462 32048
18 Tehri Ghonti Barkot 15 10 10 3 5 15 0 58 14 2304 34352
19 Tehri Ghonti Gadoliyagad 15 10 10 5 3 15 0 58 15 2832 37184
20 Tehri Badangaon Rindol 15 10 10 3 5 15 0 58 13 2613 39797
21 Tehri Balganga Aragad 15 10 10 3 5 15 0 58 20 3370 43167
22 Tehri Dangchaura Mundoli 15 10 10 5 3 15 0 58 12 1338 44505
23 Tehri Aglar Jokhnigad 15 10 10 3 5 15 0 58 8 1457 45962
24 Tehri Badangaon Siloli 15 5 10 3 10 15 0 58 11 2518 48480
25 Tehri Nagungad Seansugad 15 10 10 3 5 15 0 58 47 7813 56293
26 Tehri Aglar Gochugad 15 10 10 3 5 15 0 58 19 4566 60859
27 Tehri Aglar Paligad 15 10 10 5 3 15 0 58 21 5972 66831
28 Tehri Balganga Gongad 15 10 10 5 3 15 0 58 10 5025 71856
29 Tehri Bhilangna Upper Lata 15 5 10 3 10 15 0 58 1 719 72575
30 Tehri Bhilangna Upper Sankri 15 5 10 3 10 15 0 58 3 1969 74544
31 Tehri Dangchaura Jakhi 15 10 10 5 3 15 0 58 3 1931 76475
32 Tehri Bhilangna Upper Chandoli 15 5 10 3 10 15 0 58 5 2500 78975
Appendix Table 7-(x)MWS of Tehri Garhwal district with its weightage criteria
Page 1 of 2

Sl. No. DISTRICT SWS MWS Clust Appro
Conti-guty
Degra-ded SC_ST SM& Mg
FarmerAssured Irrgation
Actual Wages
Total Weight No. of Vil MWS
Area (ha.)Cumi. Area
33 Tehri Bhilangna Upper Payankgad 15 5 10 3 10 15 0 58 1 1063 80038
34 Tehri Nagungad Mal Deota 15 10 10 3 3 15 0 56 29 2087 82125
35 Tehri Southbhagirathi B CHANDRBHAGA GAD 15 10 10 3 3 15 0 56 90 6777 88902
36 Tehri Southbhagirathi B GARGAD 15 10 10 3 3 15 0 56 10 1885 90787
37 Tehri Badiyargad Namigad 15 10 10 3 3 15 0 56 6 1512 92299
38 Tehri Badiyargad Jakhni 15 10 10 3 3 15 0 56 8 1406 93705
39 Tehri Nagungad Dang 15 10 10 3 3 15 0 56 21 2806 96511
40 Tehri Bhilangna Upper Jakhnoli 15 10 10 3 3 15 0 56 29 9188 105699
41 Tehri Southbhagirathi B Palethi 15 10 10 3 3 15 0 56 55 7112 112811
42 Tehri Aglar Diuligad 15 10 10 3 3 15 0 56 16 3187 115998
43 Tehri Badiyargad Dhundsirgad 15 10 10 3 3 15 0 56 21 4812 120810
44 Tehri Aglar Tunetha 15 10 10 3 3 15 0 56 14 2378 123188
45 Tehri Ghonti Dwarigad 15 10 10 3 3 15 0 56 8 2400 125588
46 Tehri Aglar Belgar Nadi 15 10 10 3 3 15 0 56 7 2382 127970
47 Tehri Aglar Kharsugad 15 10 10 3 3 15 0 56 5 1546 129516
48 Tehri Aglar Patalgad 15 10 10 3 3 15 0 56 2 1565 131081
49 Tehri Nagungad Koti 15 10 10 3 3 15 0 56 11 6456 137537
50 Tehri Balganga Tungri 15 5 10 3 5 15 0 53 20 2690 140227
51 Tehri Bhilangna Upper Geonli 15 5 10 5 3 15 0 53 18 1850 142077
52 Tehri Bhilangna Upper Jolagad 15 5 10 5 3 15 0 53 35 8938 151015
53 Tehri Bhilangna Upper Phalanda 15 5 10 3 5 15 0 53 2 656 151671
54 Tehri Bhilangna Upper Saur 15 5 10 3 5 15 0 53 4 1500 153171
55 Tehri Bhilangna Upper Doni 15 5 10 5 3 15 0 53 3 1950 155121
56 Tehri Bhilangna Upper Gairgad 15 5 10 3 5 15 0 53 2 1406 156527
57 Tehri Balganga Kot 15 5 10 5 3 15 0 53 3 4600 161127
58 Tehri Bhilangna Upper Sanrigad 15 5 10 3 5 15 0 53 1 2406 163533
59 Tehri Badangaon Dungmandargad 15 5 10 3 3 15 0 51 30 5196 168729
60 Tehri Balganga Kapol Gaon 15 5 10 3 3 15 0 51 24 4600 173329
61 Tehri Balganga Madhgad 15 5 10 3 3 15 0 51 13 3625 176954
62 Tehri Balganga Toli 15 5 10 3 3 15 0 51 7 3650 180604
63 Tehri Balganga Chasyala 15 5 10 3 3 15 0 51 8 2300 182904
64 Tehri Balganga Pinswar 15 5 10 3 3 15 0 51 3 4400 187304
65 Tehri Balganga Ghangroli 15 5 10 3 3 15 0 51 1 4500 191804
66 Tehri Badiyargad Bhimpanisera 15 10 10 3 3 5 0 46 16 2457 194261
194261
Page 2 of 2

Sl. No. DISTRICT SWS MWS Clust Appro
Conti-guty
Degra-ded SC_ST SM& Mg
FarmerAssured Irrgation
Actual Wages
Total Weight No. of Vil MWS
Area (ha.)Cumi. Area
1 US Nagar Lebar Khakra Nadi 10 10 10 10 5 5 0 50 32 12593 12593
2 US Nagar Baur Baur Nadi 15 10 10 5 3 5 0 48 83 32147 44740
3 US Nagar Dabka Ghuga Nala 15 10 5 3 3 5 0 41 53 12500 57240
4 US Nagar Bhakra Mahabir Nagar 15 5 10 3 3 5 0 41 22 10569 67809
5 US Nagar Tanda Pantnagar 15 10 5 3 3 5 0 41 154 42900 110709
6 US Nagar Bhakra Kagarsen 15 5 10 3 3 5 0 41 27 19532 130241
7 US Nagar Lebar Khatima 10 5 5 10 3 5 0 38 64 36539 166780
Appendix Table 7-(xi)MWS of Udham Singh Nagar district with its weightage criteria
Page 1 of 1

Sl. No. DISTRICT SWS MWS Clust Appro
Conti-guty
Degra-ded SC_ST SM& Mg
FarmerAssured Irrgation
Actual Wages
Total Weight No. of Vil MWS
Area (ha.)Cumi. Area
1 Uttarkashi Tons Right Chaubegad 15 10 15 10 10 15 0 75 1 2138 2138
2 Uttarkashi Rupin Istergad 15 10 10 10 10 15 0 70 3 6091 8229
3 Uttarkashi Jalkurgad Mukhyalgaon 15 10 15 3 10 15 0 68 4 1600 9829
4 Uttarkashi Rikhnargad Kamra 15 10 15 10 3 15 0 68 2 1344 11173
5 Uttarkashi Supin Tons Dangergaon 15 10 15 5 5 15 0 65 1 1506 12679
6 Uttarkashi Jalkurgad Nakurgad 15 10 15 3 5 15 0 63 22 3225 15904
7 Uttarkashi Indrawati Dhanarigad Kyara 15 10 10 3 10 15 0 63 6 1344 17248
8 Uttarkashi Yamuna Middle Kuwa 15 10 15 5 3 15 0 63 7 1284 18532
9 Uttarkashi Yamuna Upper Kuthnaurgad 15 10 10 10 3 15 0 63 1 2550 21082
10 Uttarkashi Indrawati Dhanarigad Thiyara 15 10 15 3 3 15 0 61 8 1618 22700
11 Uttarkashi Yamuna Upper Than 15 10 15 3 3 15 0 61 7 1336 24036
12 Uttarkashi Supin Tons Kunara 15 10 15 3 3 15 0 61 1 3178 27214
13 Uttarkashi Kamolagad Malegad 15 10 10 10 5 10 0 60 5 3236 30450
14 Uttarkashi Tons Left Miyangad 15 10 10 5 10 10 0 60 7 4495 34945
15 Uttarkashi Yamuna Upper Baligad 15 10 10 5 5 15 0 60 3 3568 38513
16 Uttarkashi Rupin Kanoligad 15 5 10 5 10 15 0 60 1 2389 40902
17 Uttarkashi Jalkurgad Mandenagad 15 10 10 3 5 15 0 58 26 2780 43682
18 Uttarkashi Tons Left Deora 15 10 15 5 3 10 0 58 4 1034 44716
19 Uttarkashi Yamuna Upper Chaptari 15 10 10 5 3 15 0 58 7 3083 47799
20 Uttarkashi Syalamgad Khurmolagad 15 10 10 5 3 15 0 58 26 9100 56899
21 Uttarkashi Yamuna Middle Tharsun 15 10 10 5 3 15 0 58 11 4332 61231
22 Uttarkashi Yamuna Middle Duink 15 10 10 5 3 15 0 58 5 2172 63403
23 Uttarkashi Yamuna Middle Serigad 15 10 10 3 5 15 0 58 20 4794 68197
24 Uttarkashi Yamuna Upper Rajgarthi 15 10 10 5 3 15 0 58 5 2665 70862
25 Uttarkashi Yamuna Middle Kaslana 15 10 10 5 3 15 0 58 12 3729 74591
26 Uttarkashi Tons Right Bansukhal 15 10 15 5 3 10 0 58 5 2705 77296
27 Uttarkashi Yamuna Middle Tiyan 15 10 10 5 3 15 0 58 5 1764 79060
28 Uttarkashi Rupin Khanna 15 5 15 5 3 15 0 58 2 1380 80440
Appendix Table 7-(xii)MWS of Uttarkashi district with its weightage criteria
Page 1 of 2

Sl. No. DISTRICT SWS MWS Clust Appro
Conti-guty
Degra-ded SC_ST SM& Mg
FarmerAssured Irrgation
Actual Wages
Total Weight No. of Vil MWS
Area (ha.)Cumi. Area
29 Uttarkashi Tons Right Dhumraligad 15 10 10 10 3 10 0 58 1 2671 83111
30 Uttarkashi Yamuna Upper Paunti-A 15 5 15 3 5 15 0 58 5 4618 87729
31 Uttarkashi Syalamgad Uttarkashi 15 10 10 3 3 15 0 56 7 1379 89108
32 Uttarkashi Yamuna Upper Barkot 15 10 10 3 3 15 0 56 6 1519 90627
33 Uttarkashi Yamuna Upper Poltha 15 5 15 3 3 15 0 56 5 3460 94087
34 Uttarkashi Yamuna Upper Kansera 15 10 10 3 3 15 0 56 1 1742 95829
35 Uttarkashi Kaldigad Ginsigad 15 10 10 3 3 15 0 56 5 10219 106048
36 Uttarkashi Tons Right Salragad 15 5 15 3 3 15 0 56 1 2631 108679
37 Uttarkashi Kharmolagad Banwatigad 15 10 10 3 3 15 0 56 1 2621 111300
38 Uttarkashi Kamolagad Thadunga 15 10 10 5 5 10 0 55 4 2697 113997
39 Uttarkashi Yamuna Upper Naugaon 15 10 10 5 3 10 0 53 17 2814 116811
40 Uttarkashi Kamolagad Saundari 15 10 10 5 3 10 0 53 9 2935 119746
41 Uttarkashi Rikhnargad Lamgad 15 10 15 5 3 5 0 53 3 1550 121296
42 Uttarkashi Yamuna Upper Bhansarigad 15 10 10 5 3 10 0 53 4 3790 125086
43 Uttarkashi Rupin Doni 15 5 10 5 3 15 0 53 6 4398 129484
44 Uttarkashi Kharmolagad Gari 15 10 10 5 3 10 0 53 3 1612 131096
45 Uttarkashi Kamolagad Purola 15 10 10 5 3 10 0 53 2 1562 132658
46 Uttarkashi Yamuna Upper Paligad 15 5 10 5 3 15 0 53 2 5096 137754
47 Uttarkashi Jalkurgad Chandaligad 15 10 15 3 3 5 0 51 4 1568 139322
48 Uttarkashi Kaldigad Utro 15 10 10 3 3 10 0 51 1 2243 141565
49 Uttarkashi Yamuna Upper Rana 15 5 10 3 3 15 0 51 2 3914 145479
50 Uttarkashi Kaldigad Ashiganga 15 5 10 3 3 15 0 51 1 2695 148174
51 Uttarkashi Tons Left Sarugad 15 10 10 5 3 5 0 48 10 7135 155309
52 Uttarkashi Kamolagad Bhangerugad 15 10 10 5 3 5 0 48 5 3306 158615
53 Uttarkashi Kaldigad Gajoli 15 5 10 5 3 10 0 48 2 4470 163085
54 Uttarkashi Jalkurgad Jalkurgad Upper 15 10 10 3 3 5 0 46 8 4934 168019
55 Uttarkashi Yamuna Upper Yamuna Nadi 5 5 10 5 3 15 0 43 5 12550 180569
180569
Page 2 of 2

MAPS
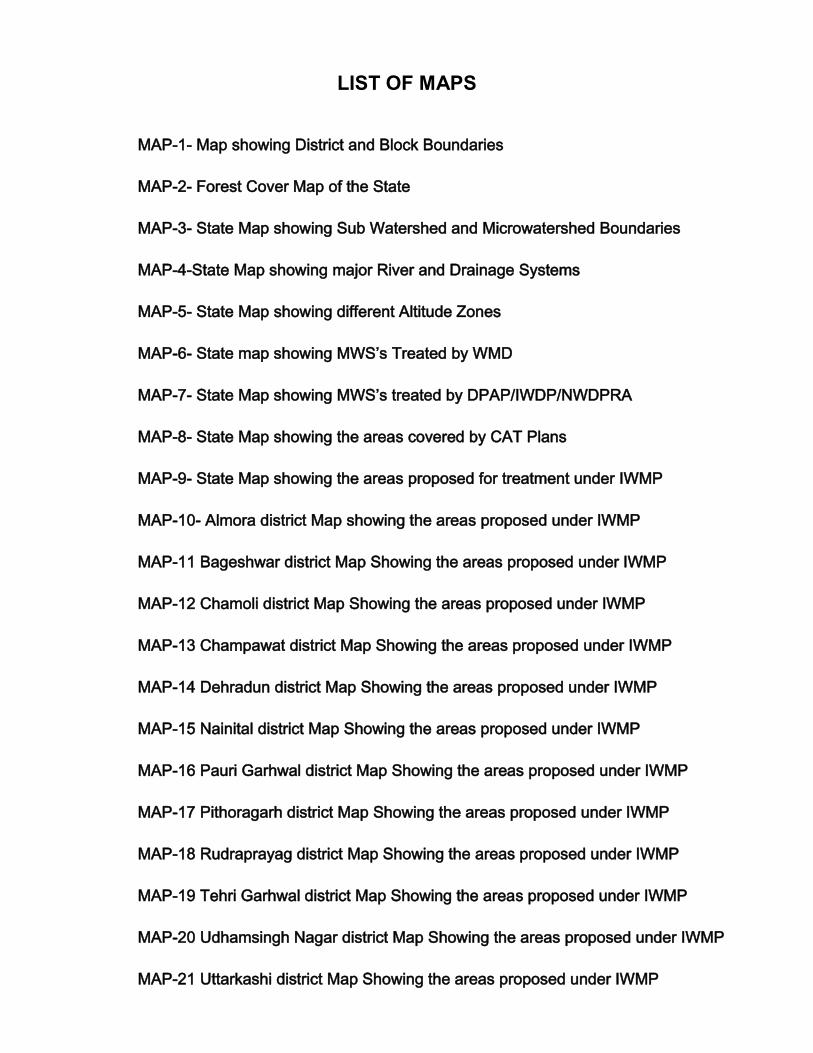
LIST OF MAPS
MAP-1- Map showing District and Block Boundaries
MAP-2- Forest Cover Map of the State
MAP-3- State Map showing Sub Watershed and Microwatershed Boundaries
MAP-4-State Map showing major River and Drainage Systems
MAP-5- State Map showing different Altitude Zones
MAP-6- State map showing MWS’s Treated by WMD
MAP-7- State Map showing MWS’s treated by DPAP/IWDP/NWDPRA
MAP-8- State Map showing the areas covered by CAT Plans
MAP-9- State Map showing the areas proposed for treatment under IWMP
MAP-10- Almora district Map showing the areas proposed under IWMP
MAP-11 Bageshwar district Map Showing the areas proposed under IWMP
MAP-12 Chamoli district Map Showing the areas proposed under IWMP
MAP-13 Champawat district Map Showing the areas proposed under IWMP
MAP-14 Dehradun district Map Showing the areas proposed under IWMP
MAP-15 Nainital district Map Showing the areas proposed under IWMP
MAP-16 Pauri Garhwal district Map Showing the areas proposed under IWMP
MAP-17 Pithoragarh district Map Showing the areas proposed under IWMP
MAP-18 Rudraprayag district Map Showing the areas proposed under IWMP
MAP-19 Tehri Garhwal district Map Showing the areas proposed under IWMP
MAP-20 Udhamsingh Nagar district Map Showing the areas proposed under IWMP
MAP-21 Uttarkashi district Map Showing the areas proposed under IWMP


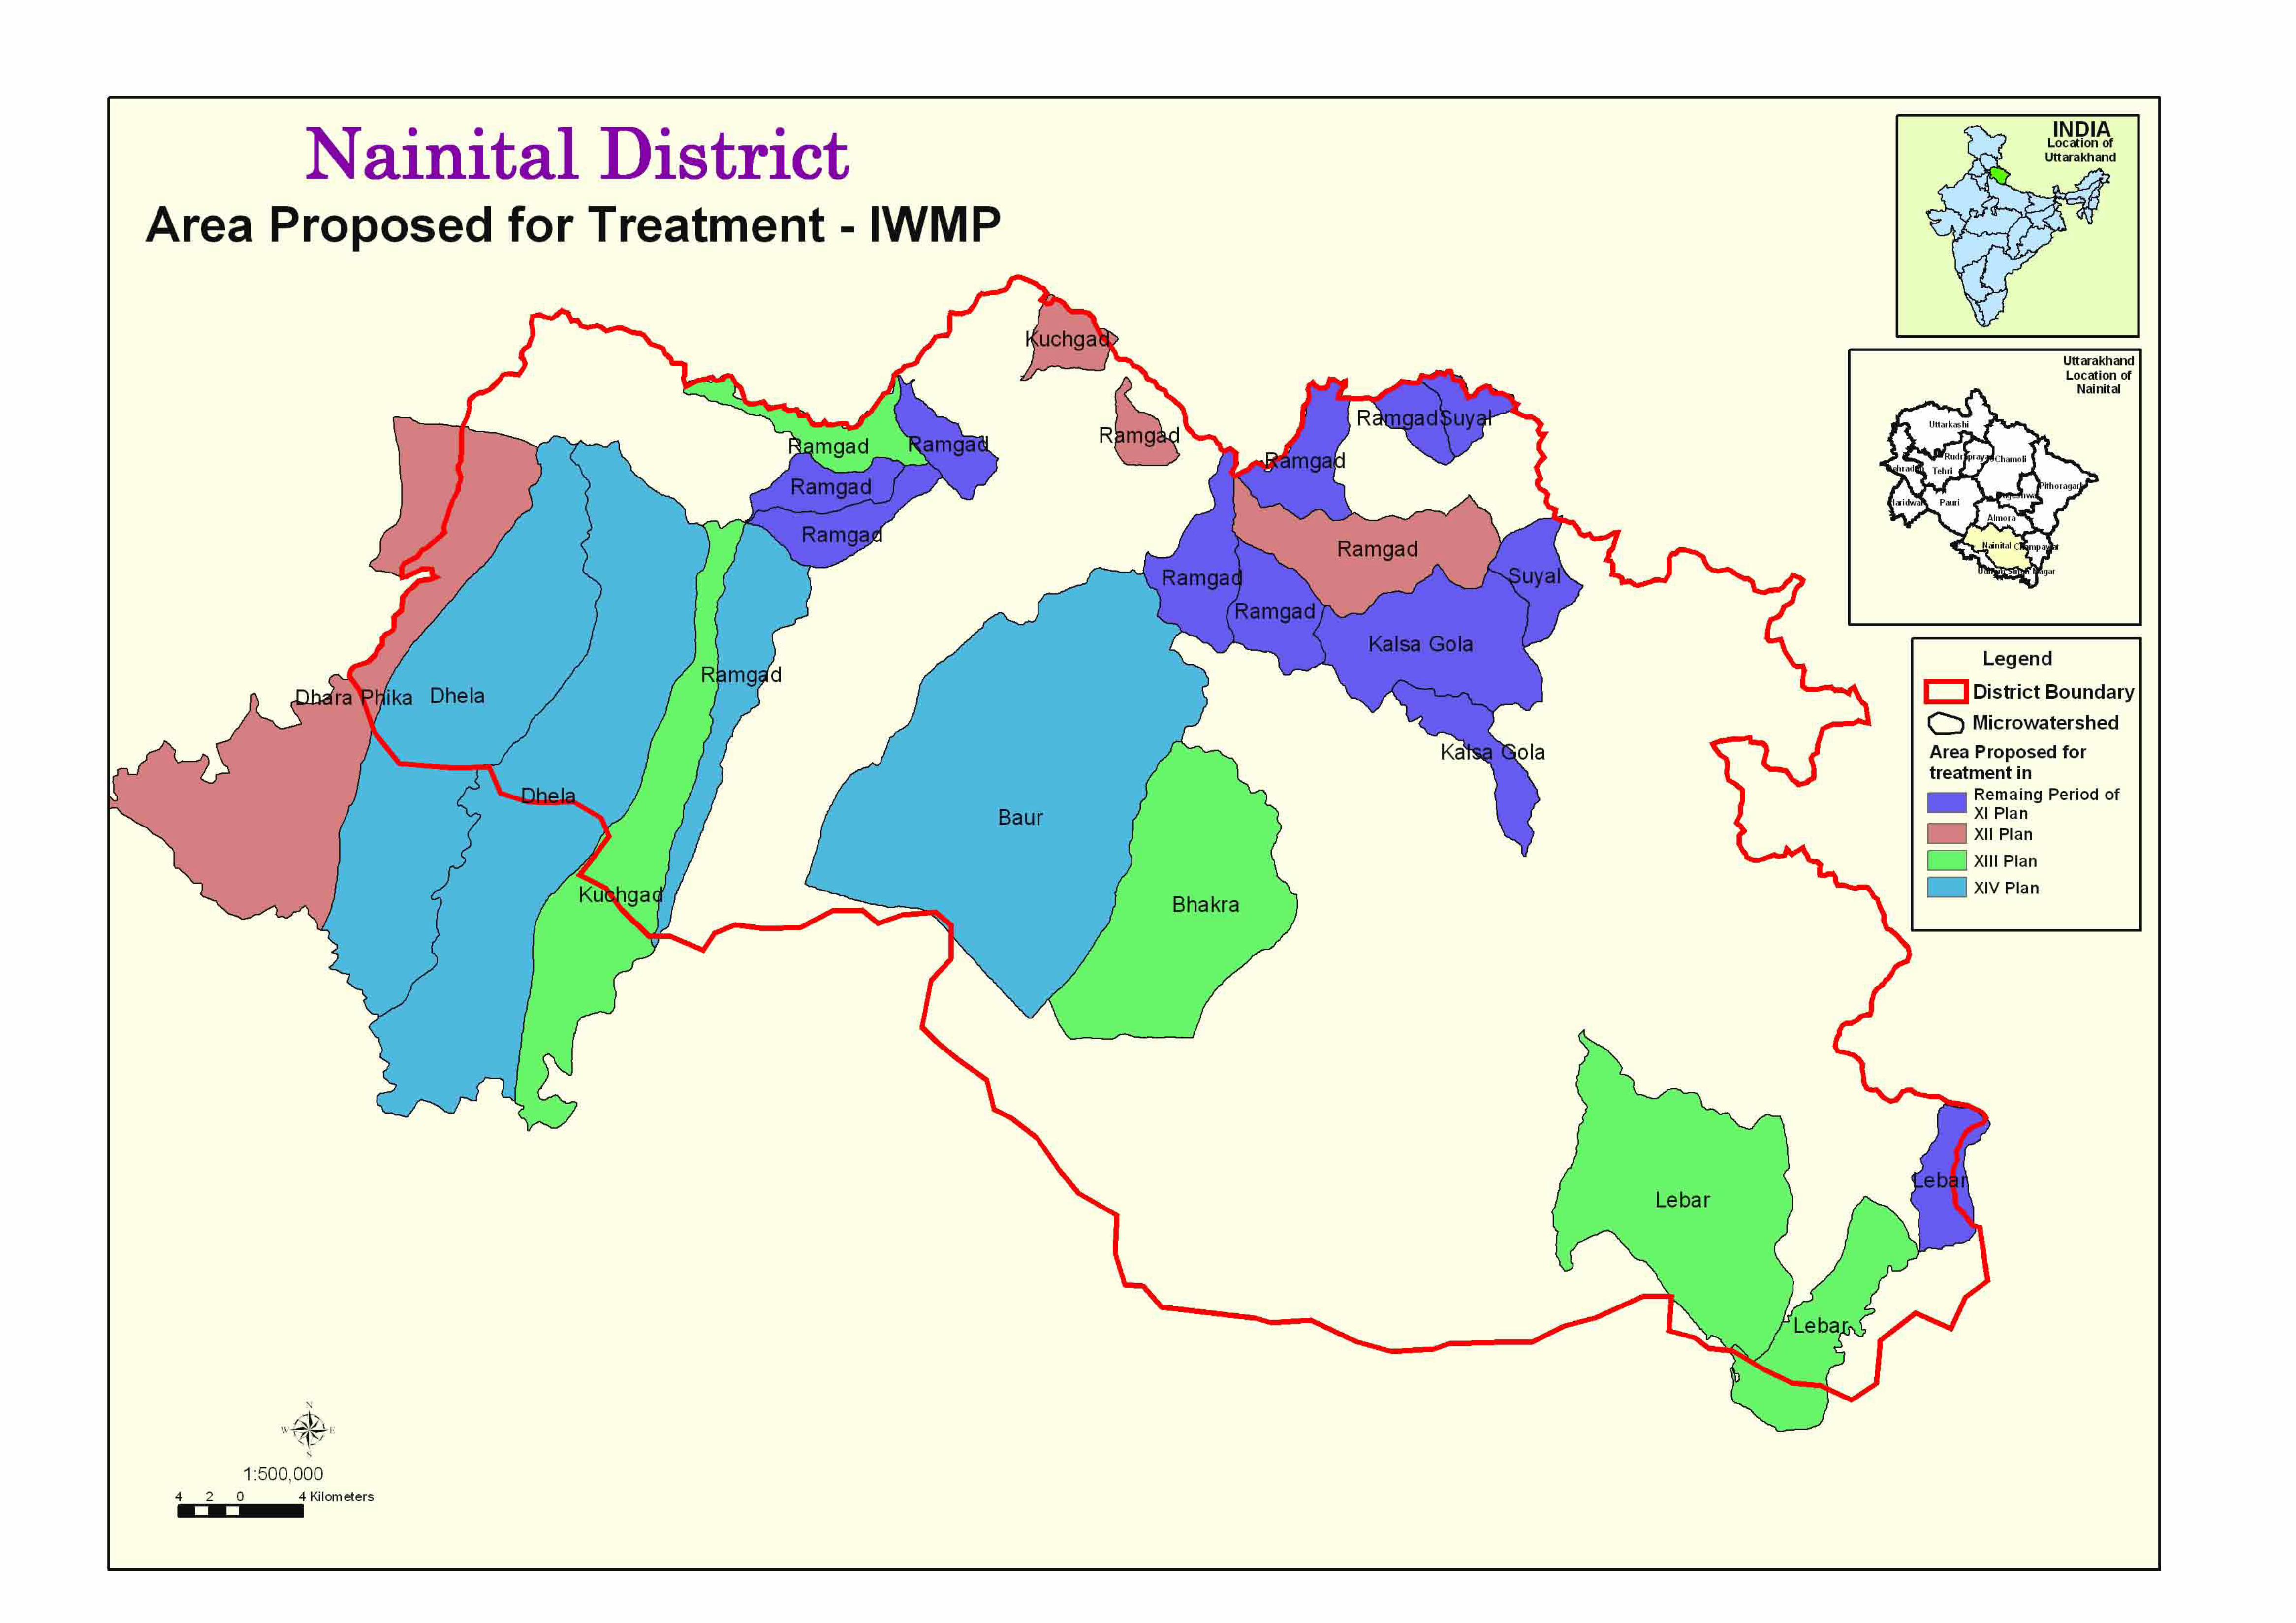


References
Annual Administrative Progress Report 2006-07 Forest Department Govt. of Uttarakhand, Dehradun Common Guidelines for Watershed Development Projects -2008 National Rainfed Area Authority Ministry of Agriculture, Govt. of India Mid Term Review (Status Paper) -2008 World Bank Aided Uttarakhand Decentralized Watershed Development Project Watershed Management Directorate Dehradun Pandey B.P; Pant Charu C; Arya K.L. & Sharma A.K. Watershed Management In Himalaya Concept And Strategy -2002 Watershed Management Directorate Dehradun Project Operation Manual World Bank Aided Uttarakhand Decentralized Watershed Development Project Watershed Management Directorate Dehradun Sharda V.N., Sikka A.K. and Juyal G.P. Participatory Integrated Watershed Management – A Field Manual 2006 Central Soil and Water Conservation Research and Training Institute Dehradun State Focus Paper, Uttarakhand - 2008-09 National Bank for Agriculture and Rural Development Uttarakhand Regional Office, Dehradun Statistical Dairy, Uttarakhand 2005-06 Directorate of Economics & Statistics Department of Planning Govt. of Uttarakhand Uttaranchal Agro Vision – 2010 Food and Agri Division, IDFC, Govt. of Uttaranchal Uttarakhand Forest Statistics -2007-08 Forest Department Govt. of Uttarakhand, Dehradun Uttarakhand Sustainable Development Summit 19-20 June, 2008 Proceedings and Recommendations, Govt. of Uttarakhand, Watershed Management Directorate Dehradun

WATERSHED MANAGEMENT DIRECTORATE UTTARAKHAND
INDIRA NAGAR, FOREST COLONY, DEHRADUN, UTTARAKHANDPhone : 0135-2768712, 2764244, Fax : 0135-2762839Email : [email protected], [email protected]
Website : www. uttara.in/watershed/ intro.html
Recommended