Workforce Diversity
Presented by Sam Johnson
Prepared by the Consultation & Research Team

Produced by the Consultation & Research Team
The Data
• Workforce figures from HR• Mostly from equality monitoring forms
at recruitment stage• High proportion of missing data
• Population data is Economically Active Population from 2011 Census• Economically Active means those who
are working or actively seeking work

Produced by the Consultation & Research Team
Headcount
Down10%from2013
to2014

Produced by the Consultation & Research Team
Starters & Leavers
New
starters
Dow
n by
1/3
Leav
ers
Up
by 1
/3
Applicatio
ns
Dow
n 30%
Produced by the Consultation & Research Team
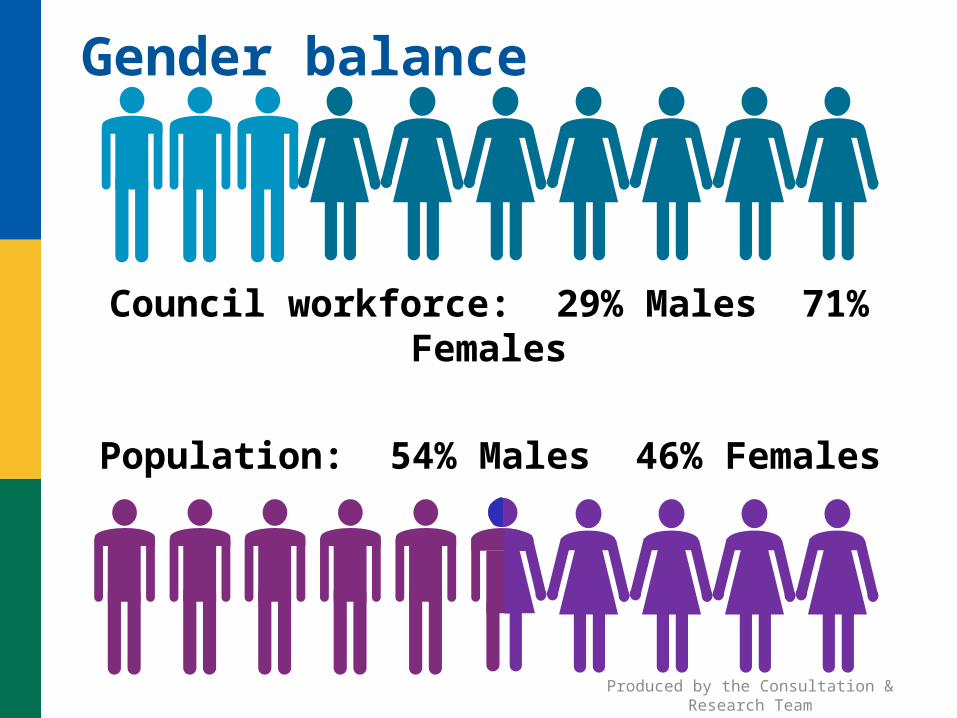
Gender balance
Council workforce: 29% Males 71% Females
Population: 54% Males 46% Females

Produced by the Consultation & Research Team
Transgender• HR data shows no transgender staff• Staff Survey reported 2% who
“live, or want to live, full time in the gender opposite to that they were assigned at birth”
• Many transgender people hide their gender variance.
• Estimated approx. 1%-2% of men and less than 0.5% of women experience gender variance – only a small proportion will seek treatment or full gender transition

Produced by the Consultation & Research Team
Age
16-24
25-34
35-64
65+
75% 50% 25% 0% 25% 50% 75%
6%
18%
73%
3%
17%
26%
54%
3%
Population Council

Produced by the Consultation & Research Team
Ethnicity - Workforce
White British: 76%
White Other: 4%
Visible Minority Ethnic: 3%
Unknown / Prefer not to say17%
Produced by the Consultation & Research Team
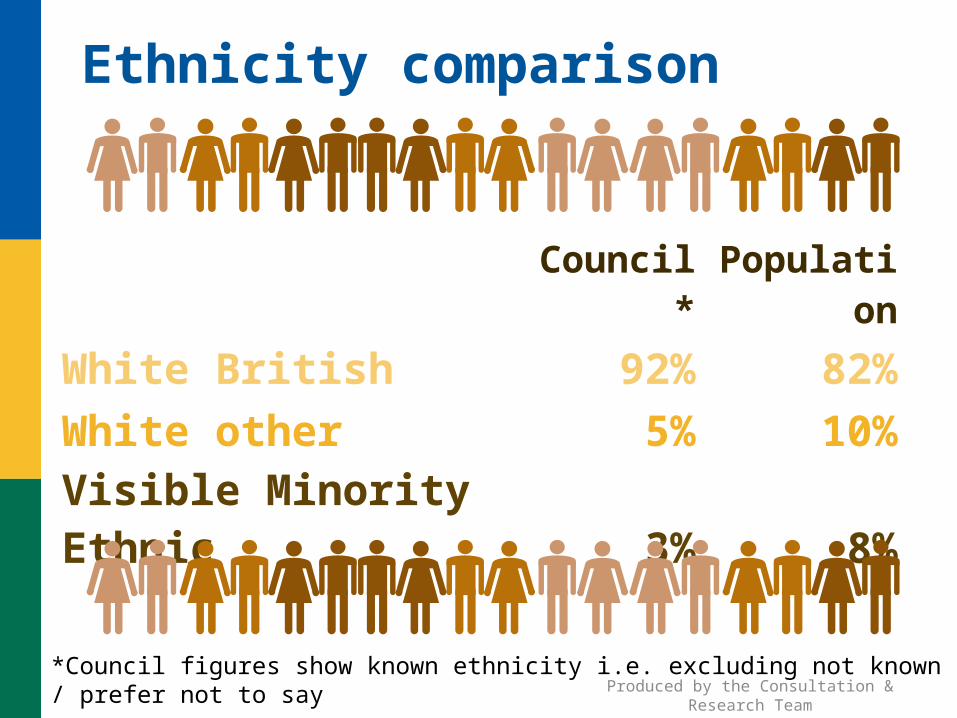
Ethnicity comparison
Council*Populatio
n
White British 92% 82%
White other 5% 10%Visible Minority Ethnic 3% 8%
*Council figures show known ethnicity i.e. excluding not known / prefer not to say

Produced by the Consultation & Research Team
Ethnicity - recruitment
Applicatio
ns received
Applications
appointed
Percentage
appointed
White British 2297 275 12%
White Other 364 26 7%Visible Minority Ethnic 217 18 8%

Produced by the Consultation & Research Team
Sexual orientation
Of those who declare: 97.4% Heterosexual 2.6% Gay /Lesbian / Bisexual
However 42% are unknown(28% missing, 14% prefer not to say)

Produced by the Consultation & Research Team
Sexual orientation
28% no data14% prefer not to say3% gay, lesbian or bisexualEstimated: 5%-7% of population

Produced by the Consultation & Research Team
Sexual orientation – Staff Survey
• 15% prefer not to say
Of those who answered:• 93% were heterosexual• 7% were lesbian / gay / bisexualThis is more in line with government
estimates for the whole population (5%-7%)

Produced by the Consultation & Research Team
Religion & belief
Workforce (excluding unknown)
Christian 50%Other 5%None 25%Prefer not to say20%
Population(2011 Census)
Christian 53%Other 5%No religion 35%Not stated 7%

Produced by the Consultation & Research Team
Disability
9%91%
DisabilityNo disability
2%
6%92%
A lot A little
Council staff with disability* (defined by Equality Act 2010)
* Excludes the 15% of staff whose disability status is not known
Population(Activities limited by illness or disability)

Produced by the Consultation & Research Team
Hours
Part time54%
Full time46%
Part time26%
Full time74%
Part time64%
Full time36%

Produced by the Consultation & Research Team
Hours
45%
55%
10%
90%
Full Time Part Time

Produced by the Consultation & Research Team
GradeGrades 1-3
21% Male
79% Femal
e
Grades 4-6
29% Male
71% Femal
e
Grades 7-9
34% Male
66% Femal
e
Grades 10-12
45% Male
55% Femal
e
Grades 13+
56% Male
44% Femal
e
75% of females are Grade 6 or below, compared to 62% of males

Produced by the Consultation & Research Team
Employment issues
73 Disciplinary cases in 2013/14
Up from 32 cases in 2012/13

Produced by the Consultation & Research Team
Summary
• Council workforce is:• Older• More female• Less ethnically diverse• Representative of disabilities• Representative of sexual orientation
• Large proportion of unknown data • Missing – probably never collected• ‘Prefer not to say’

Produced by the Consultation & Research Team
Next steps - data
• Address missing data• Identify individuals with no data held
and ask for update on Employee First• Remove ‘prefer not to say’ option for
new recruits?• Ask new employees to check/update
details at end of probation?

Produced by the Consultation & Research Team
Next steps – imbalance
• We know where there is imbalance- find out why?
• Is there a reason for the imbalance? E.g. Are BME applicants more likely to have foreign qualifications?
• Can imbalance be addressed? How do we attract more men and more young people into the Council?

Produced by the Consultation & Research Team
Next steps- empoyment issues
• Better monitoring of disciplinaries• Reasons – misconduct, harassment,
bullying?• Is discrimination a factor?• What is the outcome?
• Why such a big increase?• Are staff feeling more confident about
reporting problems?• Are managers taking complaints more
seriously?
Recommended