Chapter 1
Analyzing and Visualizing Data with Power BI @ Peter Lo 2020 1
Worksheet Editing Techniques
1.1 What is Power BI?
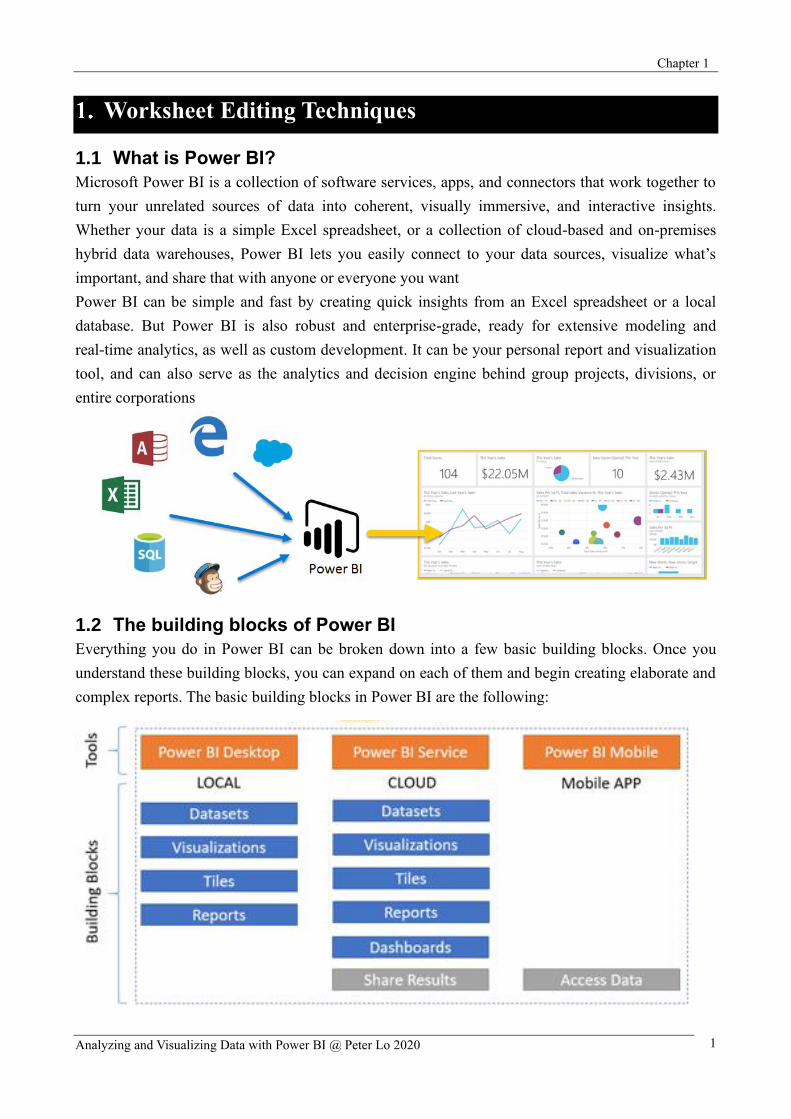
Microsoft Power BI is a collection of software services, apps, and connectors that work together to
turn your unrelated sources of data into coherent, visually immersive, and interactive insights.
Whether your data is a simple Excel spreadsheet, or a collection of cloud-based and on-premises
hybrid data warehouses, Power BI lets you easily connect to your data sources, visualize what’s
important, and share that with anyone or everyone you want
Power BI can be simple and fast by creating quick insights from an Excel spreadsheet or a local
database. But Power BI is also robust and enterprise-grade, ready for extensive modeling and
real-time analytics, as well as custom development. It can be your personal report and visualization
tool, and can also serve as the analytics and decision engine behind group projects, divisions, or
entire corporations
1.2 The building blocks of Power BI
Everything you do in Power BI can be broken down into a few basic building blocks. Once you
understand these building blocks, you can expand on each of them and begin creating elaborate and
complex reports. The basic building blocks in Power BI are the following:
Chapter 1
Analyzing and Visualizing Data with Power BI @ Peter Lo 2020 2
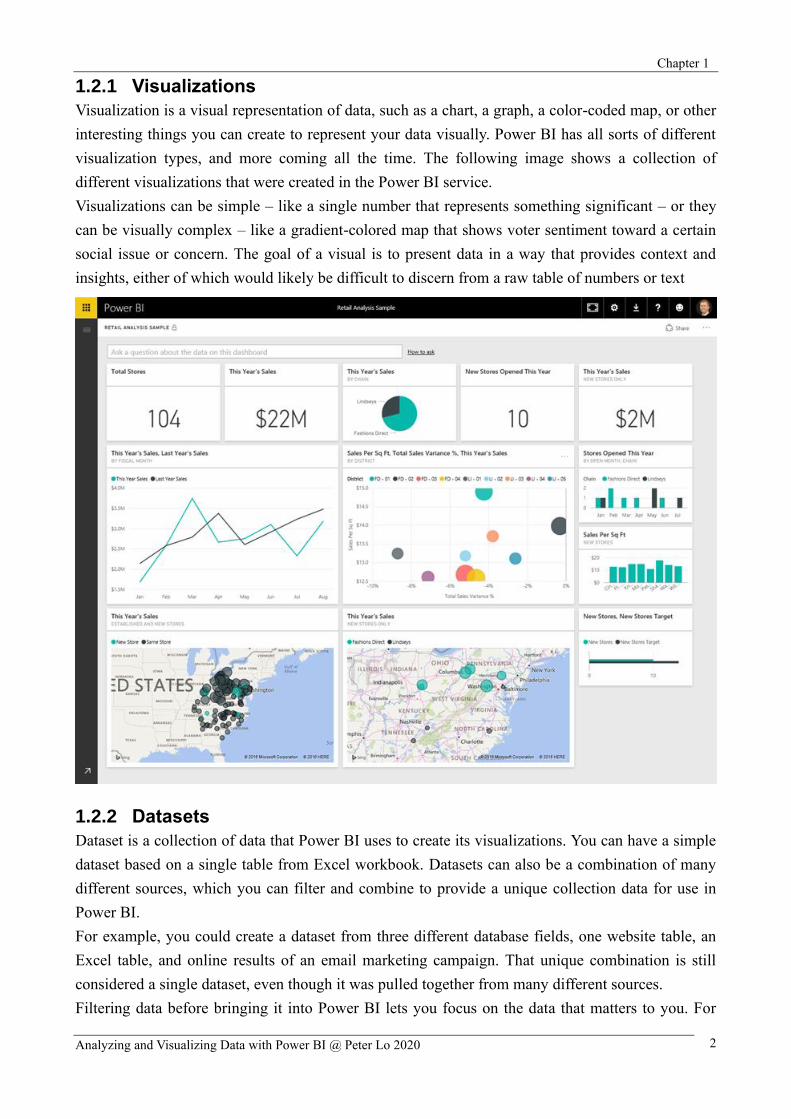
1.2.1 Visualizations
Visualization is a visual representation of data, such as a chart, a graph, a color-coded map, or other
interesting things you can create to represent your data visually. Power BI has all sorts of different
visualization types, and more coming all the time. The following image shows a collection of
different visualizations that were created in the Power BI service.
Visualizations can be simple – like a single number that represents something significant – or they
can be visually complex – like a gradient-colored map that shows voter sentiment toward a certain
social issue or concern. The goal of a visual is to present data in a way that provides context and
insights, either of which would likely be difficult to discern from a raw table of numbers or text
1.2.2 Datasets
Dataset is a collection of data that Power BI uses to create its visualizations. You can have a simple
dataset based on a single table from Excel workbook. Datasets can also be a combination of many
different sources, which you can filter and combine to provide a unique collection data for use in
Power BI.
For example, you could create a dataset from three different database fields, one website table, an
Excel table, and online results of an email marketing campaign. That unique combination is still
considered a single dataset, even though it was pulled together from many different sources.
Filtering data before bringing it into Power BI lets you focus on the data that matters to you. For
Chapter 1
Analyzing and Visualizing Data with Power BI @ Peter Lo 2020 3
example, you could filter your contact database so only customers who received emails from the
marketing campaign were included in the dataset. Then you could create visuals based on that
subset of customers who were included in the campaign. Filtering helps you focus your data, and
your efforts.
An important and enabling part of Power BI is the multitude of data connectors that are included.
Whether the data you want is in Excel or an SQL database, in Azure or Oracle, or in a service like
Facebook, Salesforce, or MailChimp, Power BI has built-in data connectors that let you easily
connect to that data, filter it if necessary, and bring it into your dataset.
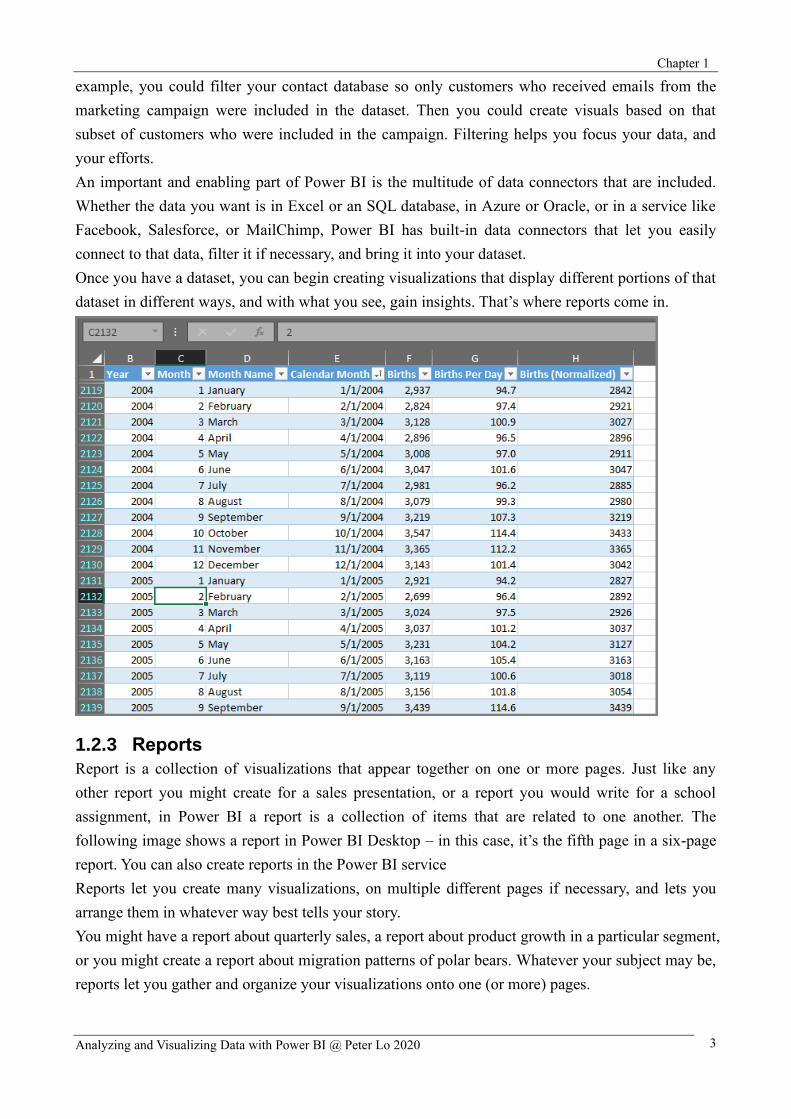
Once you have a dataset, you can begin creating visualizations that display different portions of that
dataset in different ways, and with what you see, gain insights. That’s where reports come in.
1.2.3 Reports
Report is a collection of visualizations that appear together on one or more pages. Just like any
other report you might create for a sales presentation, or a report you would write for a school
assignment, in Power BI a report is a collection of items that are related to one another. The
following image shows a report in Power BI Desktop – in this case, it’s the fifth page in a six-page
report. You can also create reports in the Power BI service
Reports let you create many visualizations, on multiple different pages if necessary, and lets you
arrange them in whatever way best tells your story.
You might have a report about quarterly sales, a report about product growth in a particular segment,
or you might create a report about migration patterns of polar bears. Whatever your subject may be,
reports let you gather and organize your visualizations onto one (or more) pages.

Chapter 1
Analyzing and Visualizing Data with Power BI @ Peter Lo 2020 4
1.2.4 Tiles
Tile is a single visualization found in a report or on a dashboard. It’s the rectangular box that
contains each individual visual. In the following image, you see one tile which is also surrounded
by other tiles.
When you’re creating a report or a dashboard in Power BI, you can move or arrange tiles however
you want to present your information. You can make them bigger, change their height or width, and
snuggle them up to other tiles however you want.
When you’re viewing, or consuming a dashboard or report – which means you’re not the creator or
owner, but it’s been shared with you – you can interact with it, but not change the size of the tiles or
change how they’re arranged
Chapter 1
Analyzing and Visualizing Data with Power BI @ Peter Lo 2020 5

Chapter 1
Analyzing and Visualizing Data with Power BI @ Peter Lo 2020 6
Data Connection
You can connect to data from many different sources in Power BI Desktop. To connect to data,
select Home ➔ Get Data. Selecting the down arrow, or the Get Data text on the button. Selecting
More… from the Most Common menu displays the Get Data window. You can also bring up the
Get Data window by selecting the Get Data icon button directly.
2.1 Data Sources
Data types are organized in the following categories:
All
File
Database
Azure
Online Services
Other
2.1.1 All
The All category includes all data connection types from all categories.
2.1.2 File
The File category provides the following data connections:
Excel
Text/CSV
XML
JSON
Folder
SharePoint Folder
Chapter 1
Analyzing and Visualizing Data with Power BI @ Peter Lo 2020 7
2.1.3 Database
The Database category provides the following data connections.
SQL Server Database
Access Database
SQL Server Analysis Services Database
Oracle Database
IBM DB2 Database
IBM Informix database (Beta)
IBM Netezza (Beta)
MySQL Database
PostgreSQL Database
Sybase Database
Teradata Database
SAP HANA Database
SAP Business Warehouse server
Amazon Redshift
Impala
Google BigQuery (Beta)
Snowflake
2.1.4 Azure
The Azure category provides the following data connections:
Azure SQL Database
Azure SQL Data Warehouse
Azure Analysis Services database (Beta)
Azure Blob Storage
Azure Table Storage
Azure Cosmos DB (Beta)
Azure Data Lake Store
Azure HDInsight (HDFS)
Azure HDInsight Spark (Beta)
2.1.5 Online Services
The Online Services category provides the following data connections:
Power BI service
SharePoint Online List
Microsoft Exchange Online
Dynamics 365 (online)
Dynamics 365 for Financials (Beta)
Common Data Service (Beta)
Microsoft Azure Consumption Insights (Beta)

Chapter 1
Analyzing and Visualizing Data with Power BI @ Peter Lo 2020 8
Visual Studio Team Services (Beta)
Salesforce Objects
Salesforce Reports
Google Analytics
appFigures (Beta)
comScore Digital Analytix (Beta)
Dynamics 365 for Customer Insights (Beta)
GitHub (Beta)
Kusto (Beta)
MailChimp (Beta)
Mixpanel (Beta)
Planview Enterprise (Beta)
Projectplace (Beta)
QuickBooks Online (Beta)
Smartsheet
SparkPost (Beta)
SQL Sentry (Beta)
Stripe (Beta)
SweetIQ (Beta)
Troux (Beta)
Twilio (Beta)
tyGraph (Beta)
Webtrends (Beta)
Zendesk (Beta)
2.1.6 Other
The Other category provides the following data connections:
Vertica (Beta)
Web
SharePoint List
OData Feed
Active Directory
Microsoft Exchange
Hadoop File (HDFS)
Spark (Beta)
R Script
ODBC
OLE DB
Blank Query

Chapter 1
Analyzing and Visualizing Data with Power BI @ Peter Lo 2020 9
2.1.7 Data Source Prerequisites
For each data provider, Power BI supports a specific provider version on objects.
Data Source Provider Minimum
provider version
Minimum data
source version
Supported data
source objects
SQL Server ADO.net .Net Framework 3.5 SQL Server 2005+ Tables/Views, Scalar
functions, Table functions
Access Microsoft Access Database Engine ACE 2010 SP1 No restriction Tables/Views
Excel Microsoft Access Database Engine ACE 2010 SP1 No restriction Tables, Sheets
Oracle ODP.NET ODAC 11.2.0.3.20 9.x+ Tables/Views
System.Data.OracleClient .NET Framework 3.5 9.x+ Tables/Views .NET Framework 3.5+
IBM DB2 ADO.Net client from IBM 10.1 9.1+ Tables/Views
MySQL Connector/Net 6.6.5 5.1 Tables/Views, Scalar
functions
PostgreSQL NPGSQL ADO.NET provider 2.0.12 7.4 Tables/Views
Teradata .NET Data Provider for Teradata 14+ 12+ Tables/Views
SAP Sybase SQL
Anywhere
iAnywhere.Data.SQLAnywhere
for .NET 3.5 16+ 16+
2.2 Data Connection
2.2.1 Connect to Excel
In Power BI, select Get Data ➔ Excel from the Home ribbon. Select the workbook from the Open
dialog that appears.
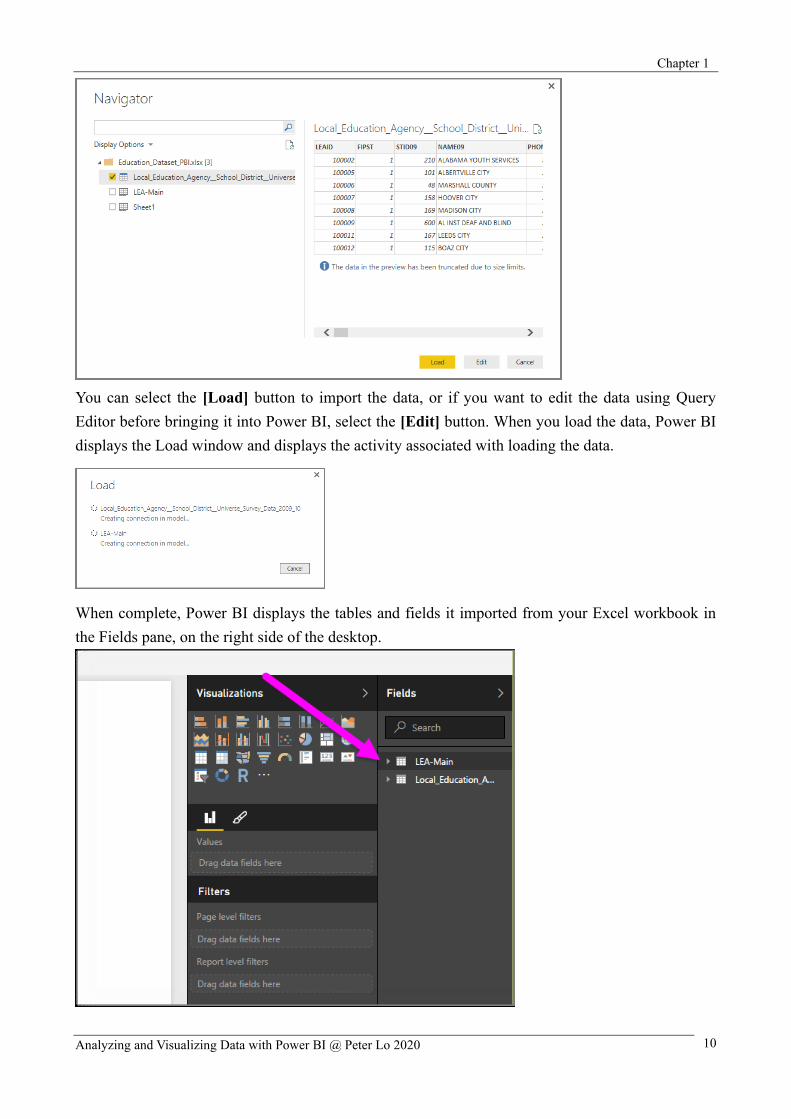
Power BI presents the tables on other data elements from the workbook in the Navigator window.
When you select a table in the left pane, a preview of the data appears in the right pane.
Chapter 1
Analyzing and Visualizing Data with Power BI @ Peter Lo 2020 10
You can select the [Load] button to import the data, or if you want to edit the data using Query
Editor before bringing it into Power BI, select the [Edit] button. When you load the data, Power BI
displays the Load window and displays the activity associated with loading the data.
When complete, Power BI displays the tables and fields it imported from your Excel workbook in
the Fields pane, on the right side of the desktop.
Chapter 1
Analyzing and Visualizing Data with Power BI @ Peter Lo 2020 11
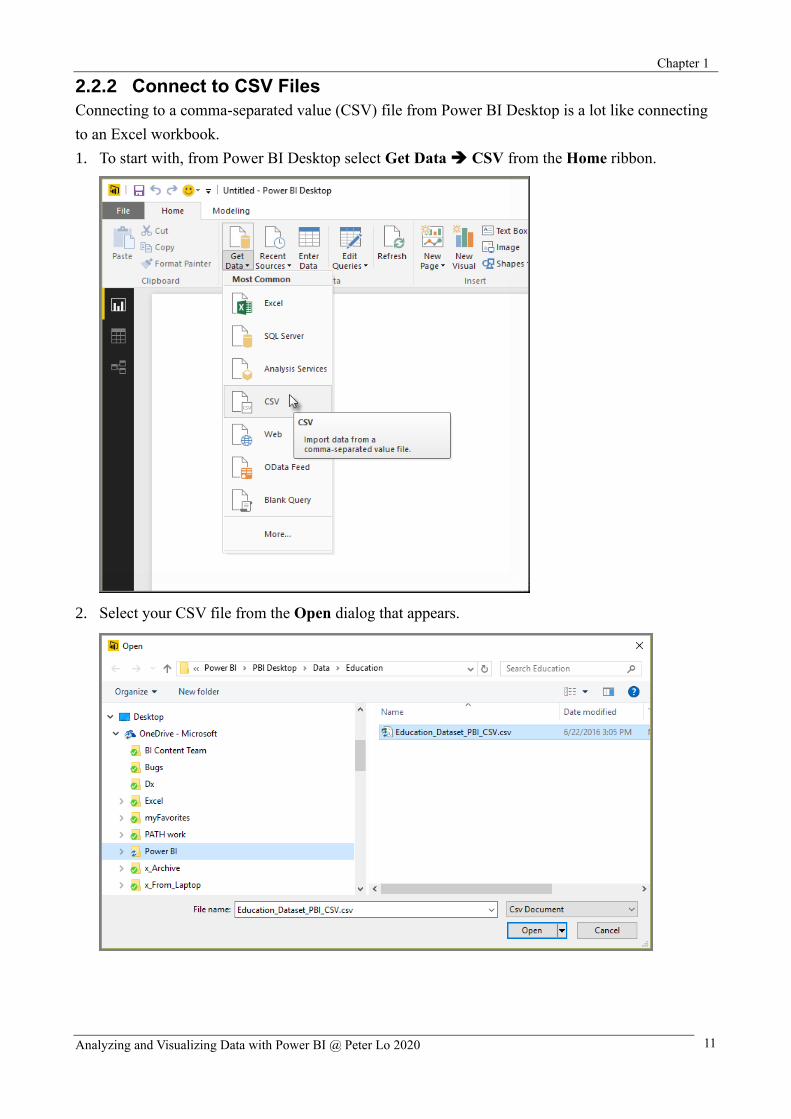
2.2.2 Connect to CSV Files
Connecting to a comma-separated value (CSV) file from Power BI Desktop is a lot like connecting
to an Excel workbook.
1. To start with, from Power BI Desktop select Get Data ➔ CSV from the Home ribbon.
2. Select your CSV file from the Open dialog that appears.

Chapter 1
Analyzing and Visualizing Data with Power BI @ Peter Lo 2020 12
3. When you select Open, Power BI Desktop accesses the file and determines certain file
attributes, such as the file origin, delimiter type, and how many rows should be used to detect
the data types in the file. These file attributes and options are shown in the drop-down selections
at the top of the CSV import dialog window, shown below. You can change any of these
detected settings manually, by choosing another option from any of the drop-down selectors
4. When you satisfied with the selections, you can select Load to import the file into Power BI
Desktop, or you can select Edit to open Query Editor and further shape or transform the data
before importing it. Once you load the data into Power BI Desktop, you see the table and its
columns in the Fields pane, along the right of the Report view in Power BI Desktop.
Chapter 1
Analyzing and Visualizing Data with Power BI @ Peter Lo 2020 13
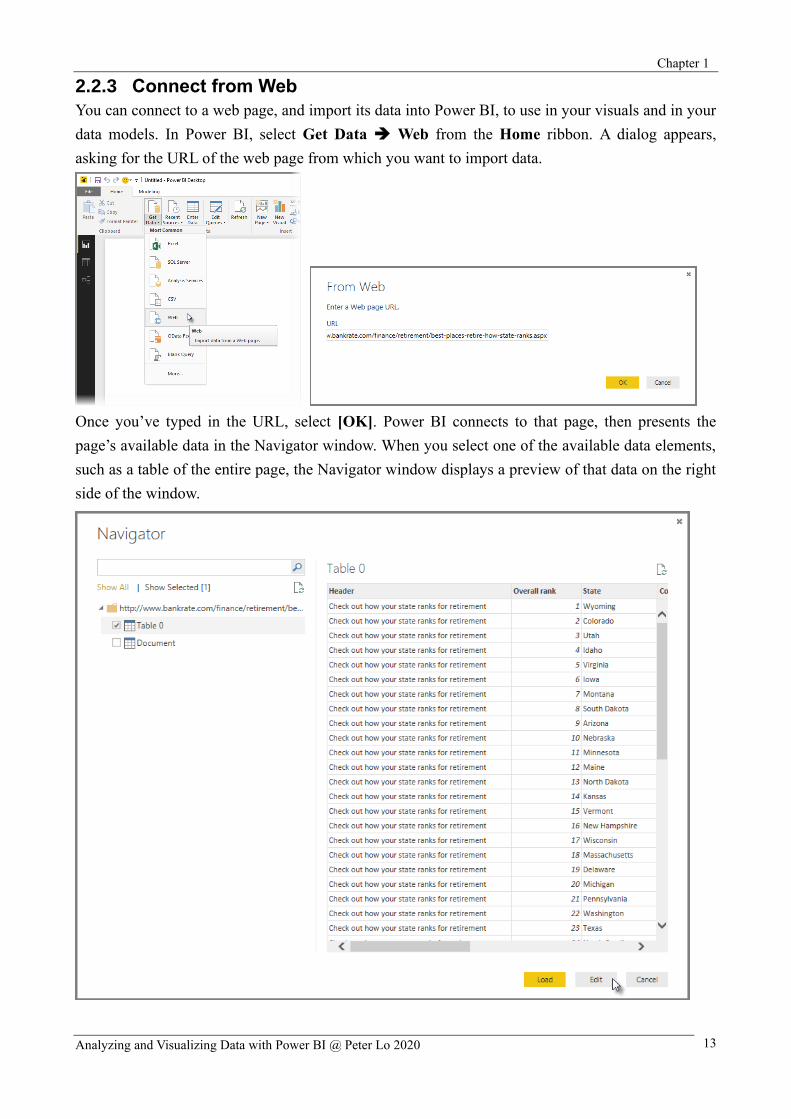
2.2.3 Connect from Web
You can connect to a web page, and import its data into Power BI, to use in your visuals and in your
data models. In Power BI, select Get Data ➔ Web from the Home ribbon. A dialog appears,
asking for the URL of the web page from which you want to import data.
Once you’ve typed in the URL, select [OK]. Power BI connects to that page, then presents the
page’s available data in the Navigator window. When you select one of the available data elements,
such as a table of the entire page, the Navigator window displays a preview of that data on the right
side of the window.

Chapter 1
Analyzing and Visualizing Data with Power BI @ Peter Lo 2020 14
You can choose the [Edit] button, which launches Query Editor, where you can shape and transform
the data on that Web page before importing it into Power BI. Or you can select the Load button, and
import all the data elements you selected in the left pane. When we select [Load], Power BI imports
the selected items, and makes them available in the Fields pane, found on the right side of the
Reports view in Power BI.
From there, you can drag those fields onto the Report canvas and create all the visualizations you
want. You can also work this the data from that Web page just like you would any other data – you
can shape it, you can create relationships between it and other data sources in your model, and
otherwise do what you’d like to create just the Power BI report you want.
Chapter 1
Analyzing and Visualizing Data with Power BI @ Peter Lo 2020 15
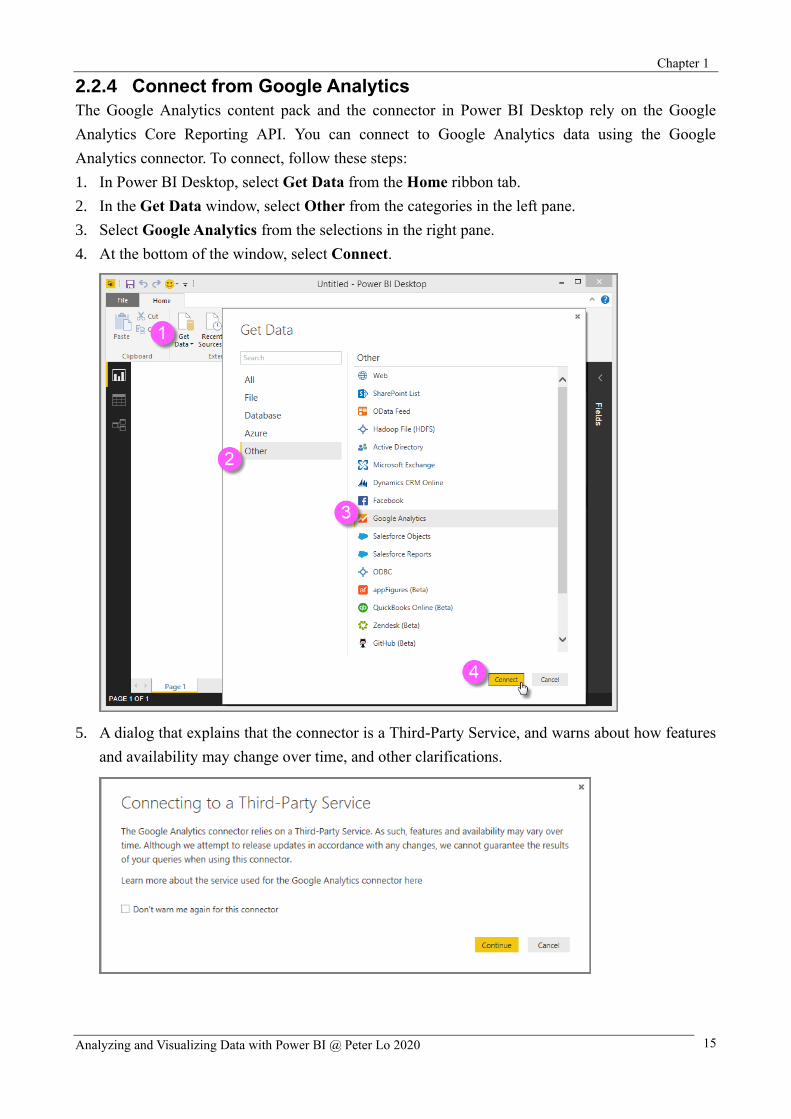
2.2.4 Connect from Google Analytics
The Google Analytics content pack and the connector in Power BI Desktop rely on the Google
Analytics Core Reporting API. You can connect to Google Analytics data using the Google
Analytics connector. To connect, follow these steps:
1. In Power BI Desktop, select Get Data from the Home ribbon tab.
2. In the Get Data window, select Other from the categories in the left pane.
3. Select Google Analytics from the selections in the right pane.
4. At the bottom of the window, select Connect.
5. A dialog that explains that the connector is a Third-Party Service, and warns about how features
and availability may change over time, and other clarifications.
Chapter 1
Analyzing and Visualizing Data with Power BI @ Peter Lo 2020 16
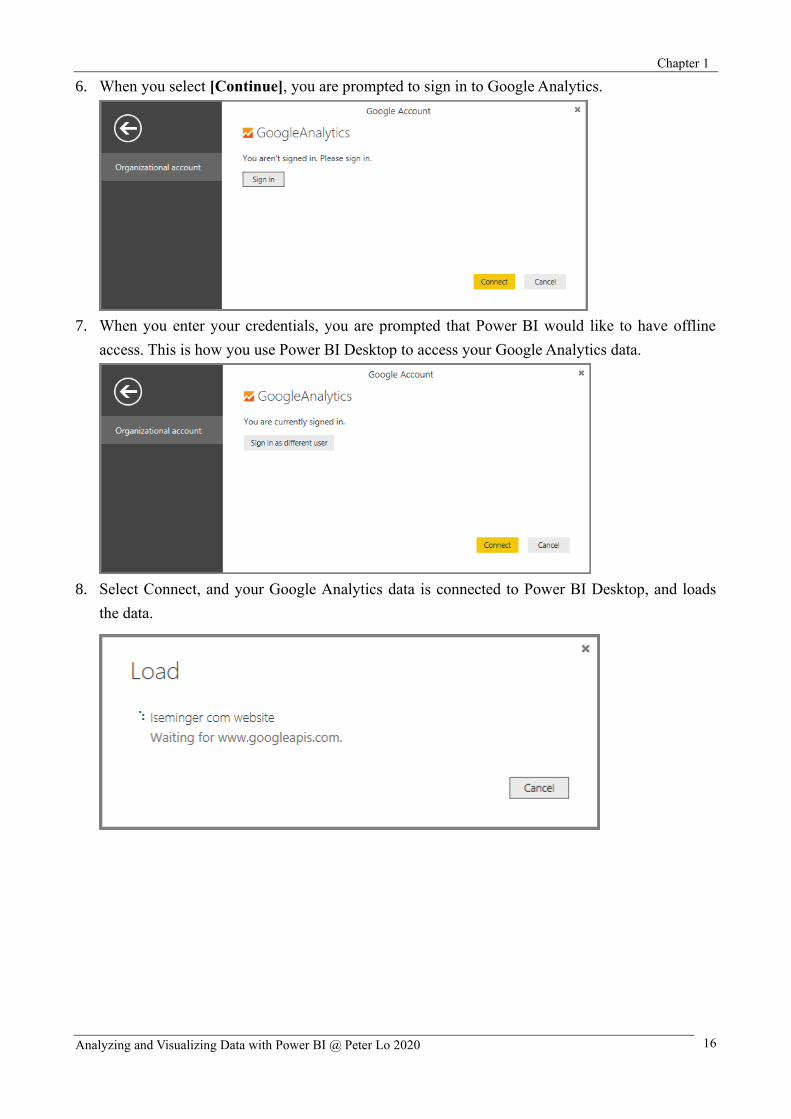
6. When you select [Continue], you are prompted to sign in to Google Analytics.
7. When you enter your credentials, you are prompted that Power BI would like to have offline
access. This is how you use Power BI Desktop to access your Google Analytics data.
8. Select Connect, and your Google Analytics data is connected to Power BI Desktop, and loads
the data.
Chapter 1
Analyzing and Visualizing Data with Power BI @ Peter Lo 2020 17
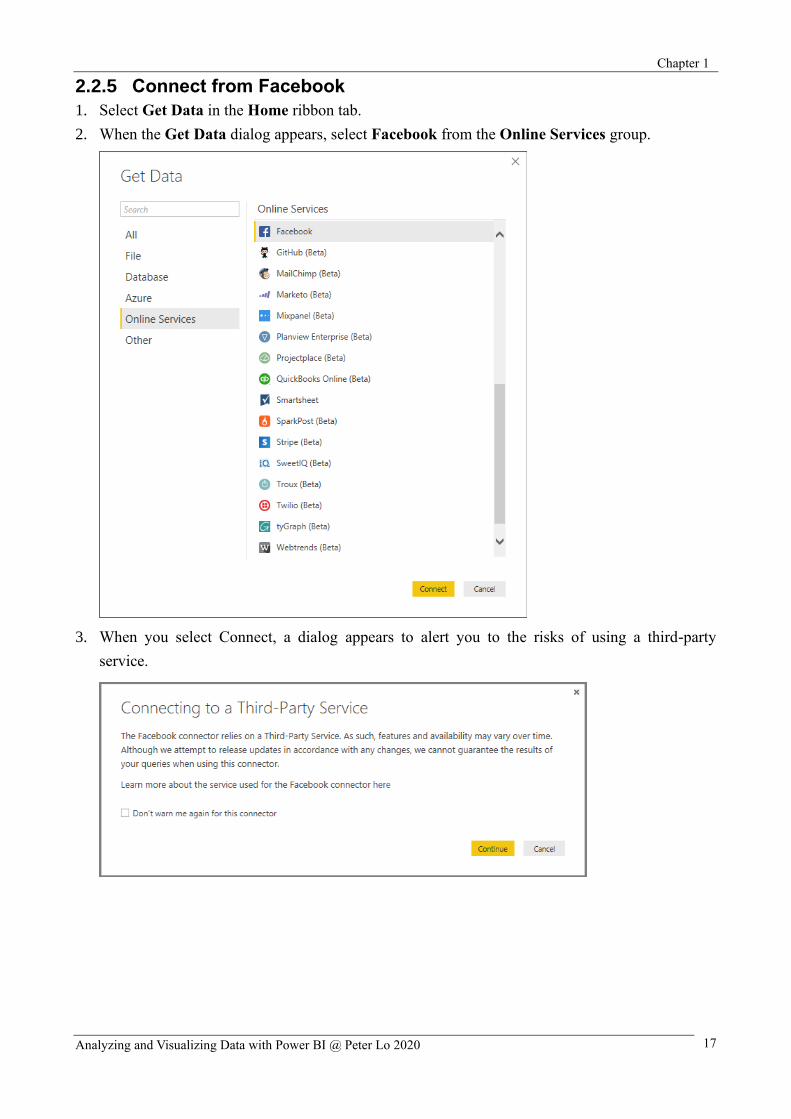
2.2.5 Connect from Facebook
1. Select Get Data in the Home ribbon tab.
2. When the Get Data dialog appears, select Facebook from the Online Services group.
3. When you select Connect, a dialog appears to alert you to the risks of using a third-party
service.
Chapter 1
Analyzing and Visualizing Data with Power BI @ Peter Lo 2020 18
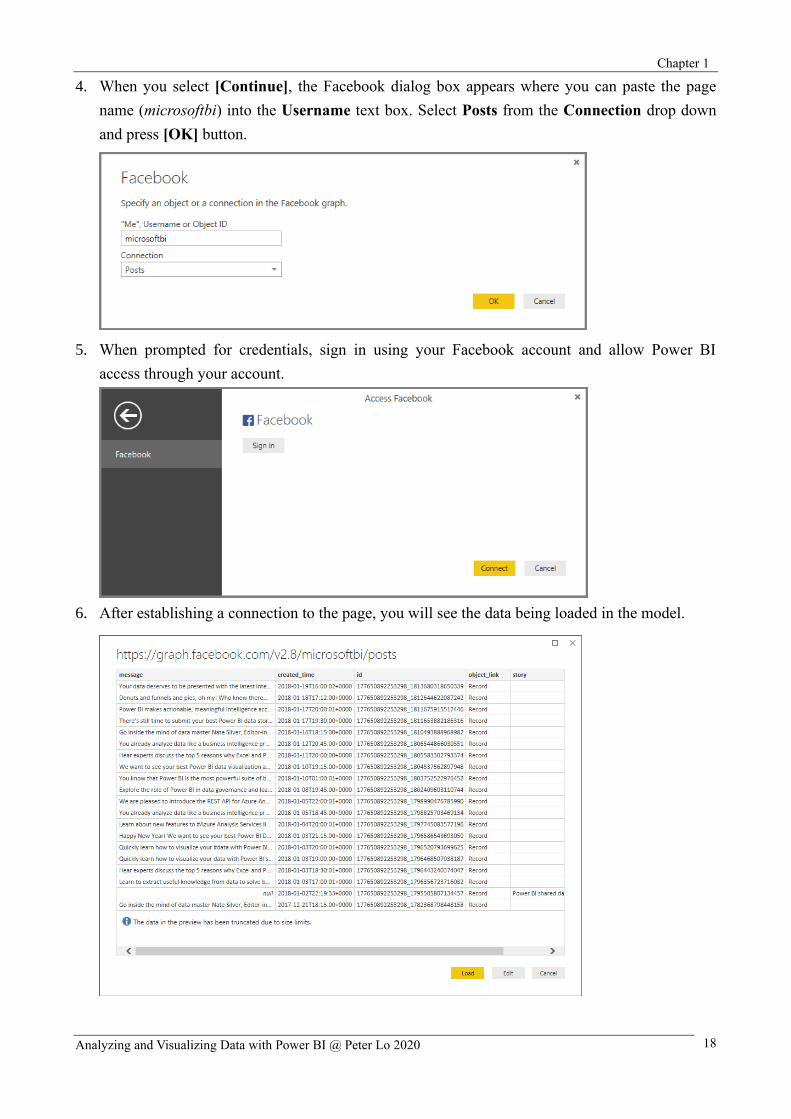
4. When you select [Continue], the Facebook dialog box appears where you can paste the page
name (microsoftbi) into the Username text box. Select Posts from the Connection drop down
and press [OK] button.
5. When prompted for credentials, sign in using your Facebook account and allow Power BI
access through your account.
6. After establishing a connection to the page, you will see the data being loaded in the model.
Chapter 1
Analyzing and Visualizing Data with Power BI @ Peter Lo 2020 19
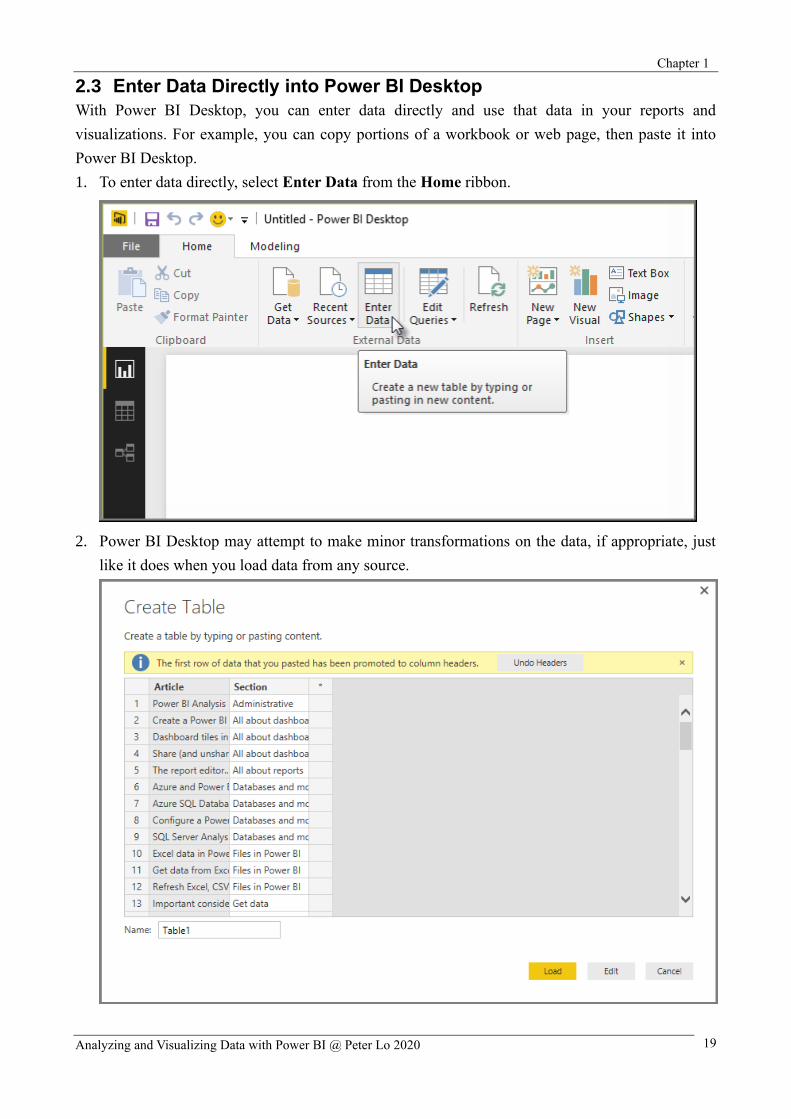
2.3 Enter Data Directly into Power BI Desktop
With Power BI Desktop, you can enter data directly and use that data in your reports and
visualizations. For example, you can copy portions of a workbook or web page, then paste it into
Power BI Desktop.
1. To enter data directly, select Enter Data from the Home ribbon.
2. Power BI Desktop may attempt to make minor transformations on the data, if appropriate, just
like it does when you load data from any source.
Chapter 1
Analyzing and Visualizing Data with Power BI @ Peter Lo 2020 20
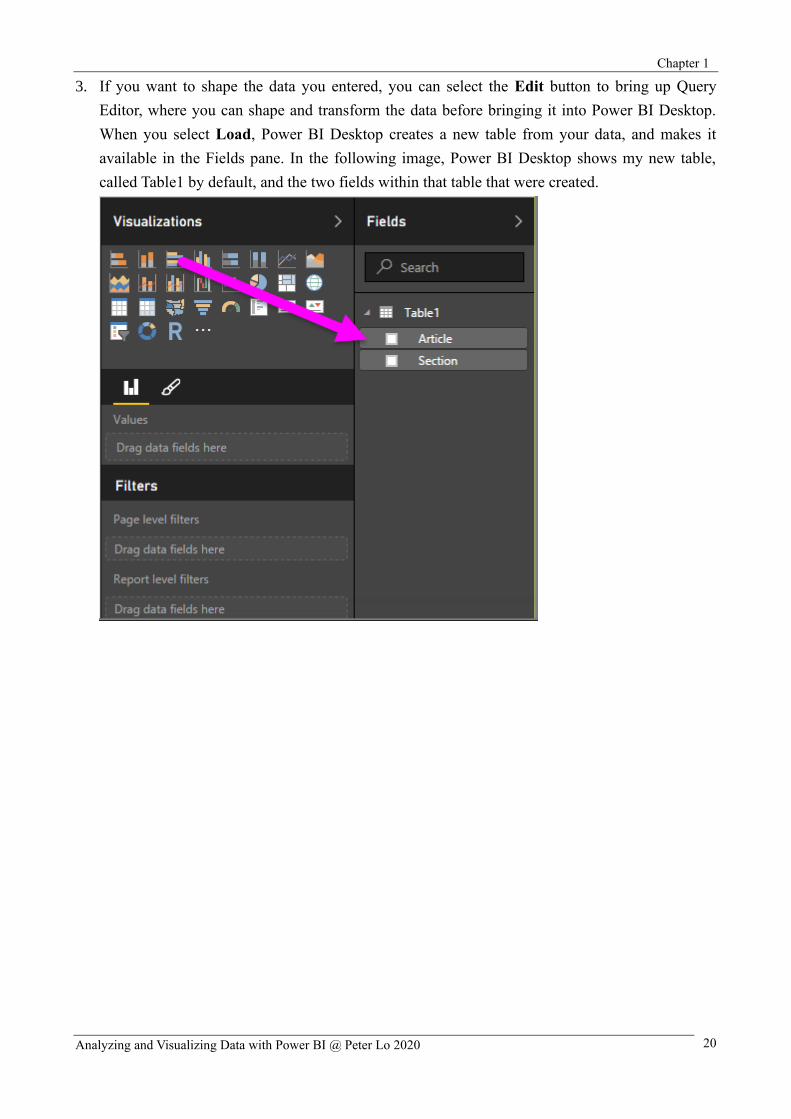
3. If you want to shape the data you entered, you can select the Edit button to bring up Query
Editor, where you can shape and transform the data before bringing it into Power BI Desktop.
When you select Load, Power BI Desktop creates a new table from your data, and makes it
available in the Fields pane. In the following image, Power BI Desktop shows my new table,
called Table1 by default, and the two fields within that table that were created.
Chapter 1
Analyzing and Visualizing Data with Power BI @ Peter Lo 2020 21
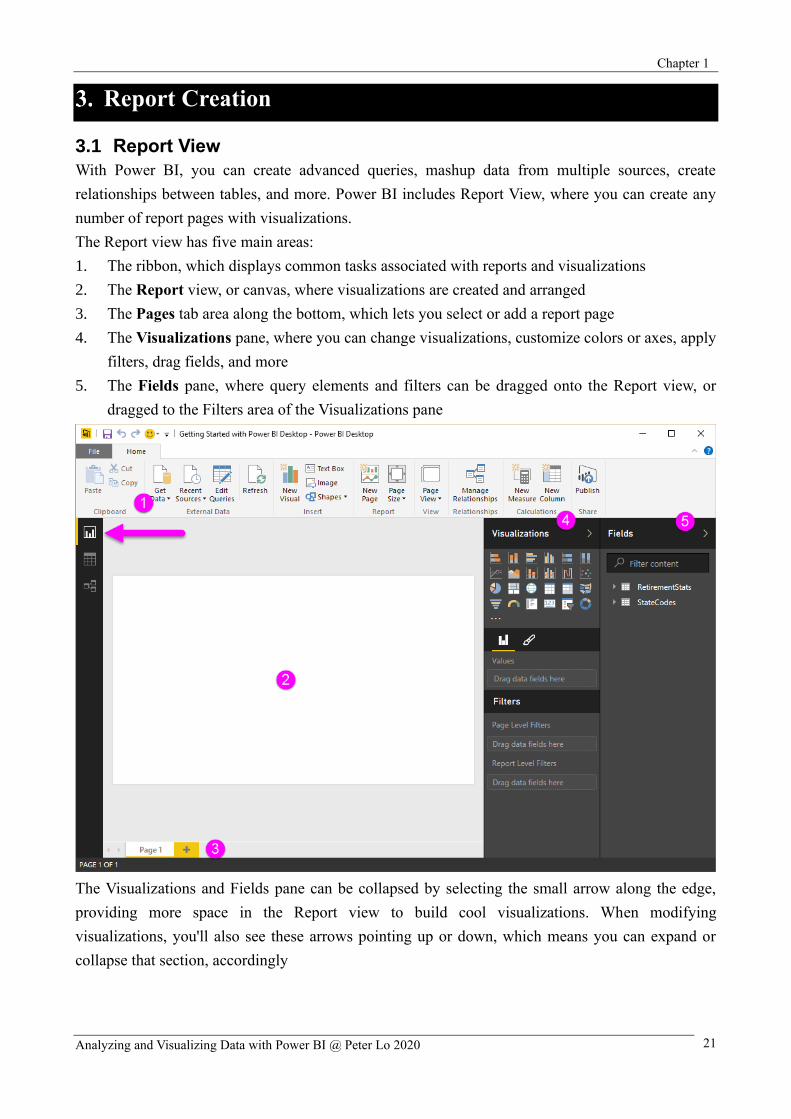
Report Creation
3.1 Report View
With Power BI, you can create advanced queries, mashup data from multiple sources, create
relationships between tables, and more. Power BI includes Report View, where you can create any
number of report pages with visualizations.
The Report view has five main areas:
1. The ribbon, which displays common tasks associated with reports and visualizations
2. The Report view, or canvas, where visualizations are created and arranged
3. The Pages tab area along the bottom, which lets you select or add a report page
4. The Visualizations pane, where you can change visualizations, customize colors or axes, apply
filters, drag fields, and more
5. The Fields pane, where query elements and filters can be dragged onto the Report view, or
dragged to the Filters area of the Visualizations pane
The Visualizations and Fields pane can be collapsed by selecting the small arrow along the edge,
providing more space in the Report view to build cool visualizations. When modifying
visualizations, you'll also see these arrows pointing up or down, which means you can expand or
collapse that section, accordingly

Chapter 1
Analyzing and Visualizing Data with Power BI @ Peter Lo 2020 22
You can switch between Report View, Data View, and Relationship View by selecting the icons in
the left-hand navigation bar. Once you’ve added some data, you can add fields to a new
visualization in the canvas. To change the type of visualization, you can select it from the
Visualization group in the ribbon or you can right click and select a different it from the Change
visualization type icon.
A report will have at least one blank page to start. Pages appear in the navigator pane just to the left
of the canvas. You can add all sorts of visualizations to a page, but it's important not to overdo it.
Too many visualizations on a page will make it look busy and difficult to find the right information.
You can add new pages to your report, just click New Page on the ribbon. To delete a page, click the
X on the page's tab at the bottom of the Report View
Recommended