Embed Size (px)
Citation preview

TSX–NYSE MKT: RIC
POSITIONING FOR SUSTAINABLE GROWTH
National Bank – Site TourMay 17, 2016

Island Gold Mine – Safety Induction
www.richmont-mines.com 3RIC: TSX NYSE-MKT
In case of emergency, stay calm, follow instructions from your tour guide and regroup in the gathering area beside the parking lot. Each area is equipped with a fire extinguisher
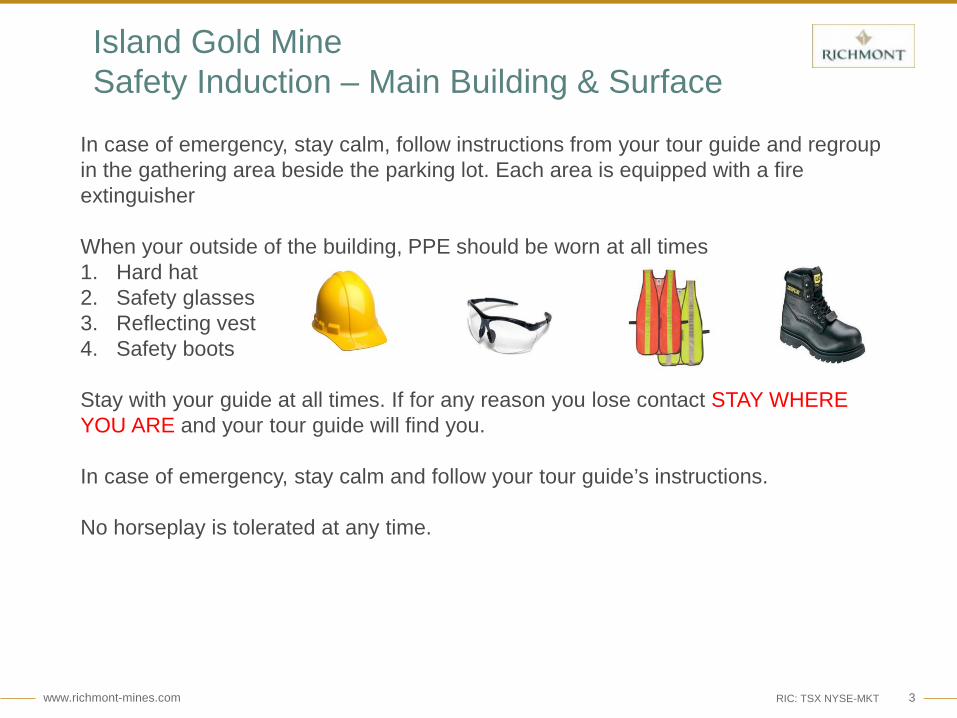
When your outside of the building, PPE should be worn at all times1. Hard hat2. Safety glasses3. Reflecting vest4. Safety boots
Stay with your guide at all times. If for any reason you lose contact STAY WHERE YOU ARE and your tour guide will find you.
In case of emergency, stay calm and follow your tour guide’s instructions.
No horseplay is tolerated at any time.
Island Gold MineSafety Induction – Main Building & Surface
www.richmont-mines.com 4RIC: TSX NYSE-MKT
Island Gold MineSafety Induction - Underground
4
Underground and surface safety requirements:
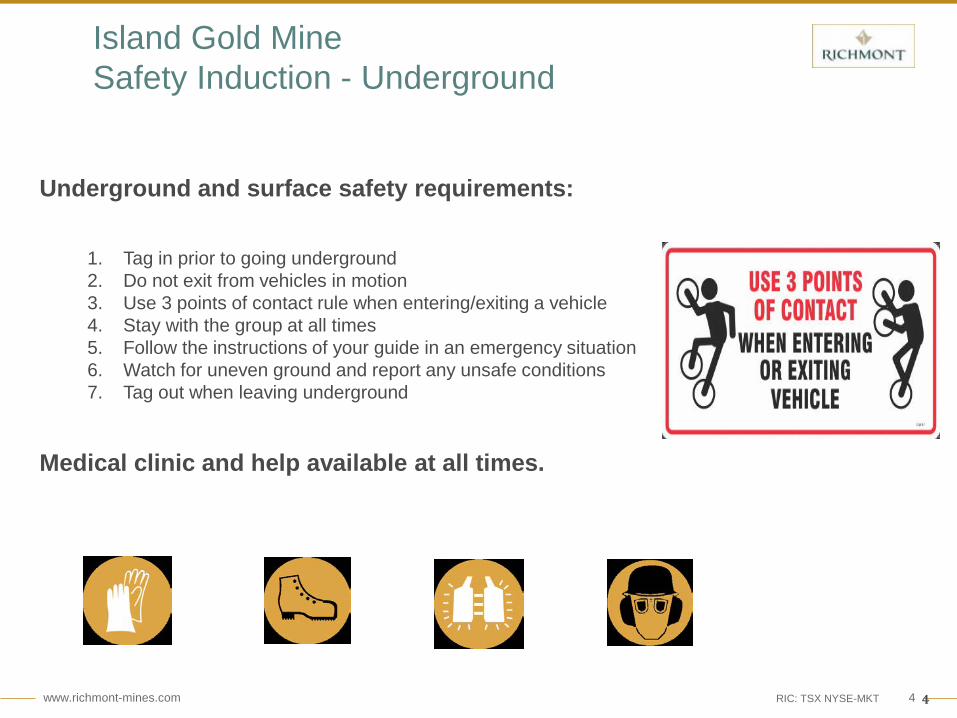
1. Tag in prior to going underground2. Do not exit from vehicles in motion3. Use 3 points of contact rule when entering/exiting a vehicle4. Stay with the group at all times5. Follow the instructions of your guide in an emergency situation6. Watch for uneven ground and report any unsafe conditions7. Tag out when leaving underground
Medical clinic and help available at all times.
Island Gold Mine - Overview
www.richmont-mines.com 6RIC: TSX NYSE-MKT
FORWARD LOOKING STATEMENTS
Safe Harbor Statement & Cautionary Note to U.S. Investors Concerning Resource Estimates
This presentation contains forward-looking statements that include risks and uncertainties. The factors that couldcause actual results to differ materially from those indicated in such forward-looking statements include changes in theprevailing price of gold, the Canadian-U.S. exchange rate, grade of ore mined and unforeseen difficulties in miningoperations that could affect revenue and production costs. Other factors such as uncertainties regarding governmentregulations could also affect the results. Other risks may be detailed from time to time in Richmont Mines Inc.’speriodic reports and annual notice.
The resource estimates in this presentation were prepared in accordance with NI 43-101 adopted by the CanadianSecurities Administrators. The requirements of NI 43-101 differ significantly from the requirements of the United StatesSecurities and Exchange Commission (the “SEC”). In this presentation, we use the terms “Measured”, “Indicated” and“Inferred” Resources. Although these terms are recognized and required to be used in Canada, the SEC does notrecognize them. The SEC permits U.S. mining corporations, in their filings with the SEC, to disclose only those mineraldeposits that constitute “Reserves”. Under United States standards, mineralization may not be classified as a Reserveunless the determination has been made that the mineralization could be economically and legally extracted at the timethe determination is made. United States investors should not assume that all or any portion of a Measured orIndicated Resource will ever be converted into “Reserves”. Furthermore, “Inferred Resources” have a great amount ofuncertainty as to their existence and whether they can be mined economically or legally, and United States investorsshould not assume that “Inferred Resources” exist or can be legally or economically mined, or that they will ever beupgraded to a more certain category.
U.S. Investors are urged to consider the disclosure in our annual report on Form 20-F, File No. 001-14598, which maybe obtained from us or from the SEC’s web site: http://sec.gov/edgar.shtml.
(All amounts are in Canadian dollars, unless otherwise indicated.)
www.richmont-mines.com 7RIC: TSX NYSE-MKT
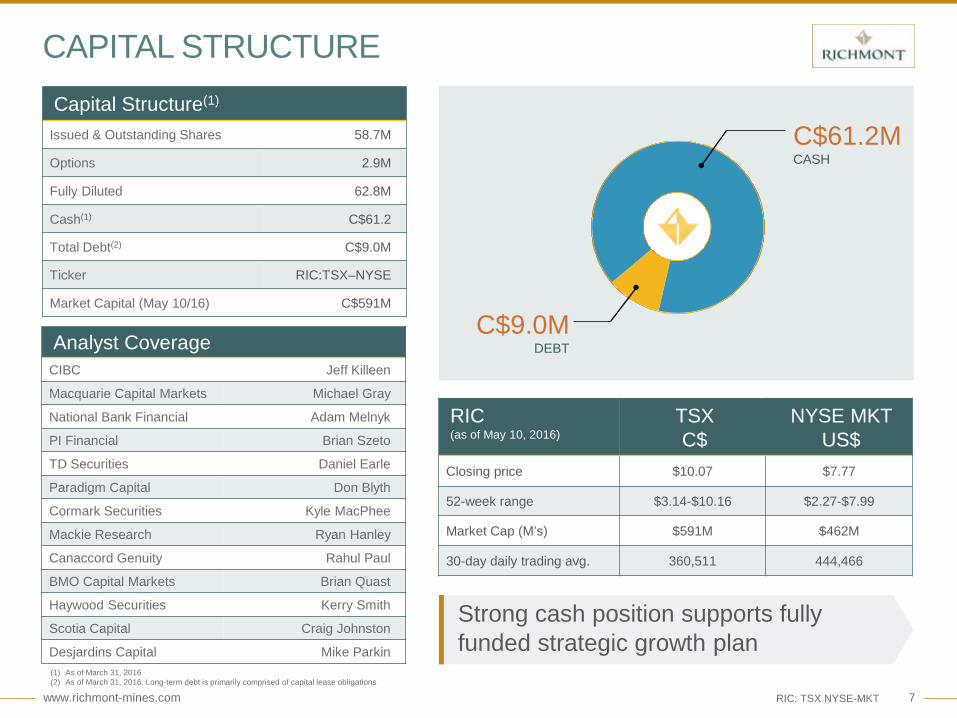
CAPITAL STRUCTURECapital Structure(1)
Issued & Outstanding Shares 58.7M
Options 2.9M
Fully Diluted 62.8M
Cash(1) C$61.2
Total Debt(2) C$9.0M
Ticker RIC:TSX–NYSE
Market Capital (May 10/16) C$591M
(1) As of March 31, 2016 (2) As of March 31, 2016. Long-term debt is primarily comprised of capital lease obligations
C$61.2MCASH
C$9.0MDEBTAnalyst Coverage
CIBC Jeff Killeen
Macquarie Capital Markets Michael Gray
National Bank Financial Adam Melnyk
PI Financial Brian Szeto
TD Securities Daniel Earle
Paradigm Capital Don Blyth
Cormark Securities Kyle MacPhee
Mackie Research Ryan Hanley
Canaccord Genuity Rahul Paul
BMO Capital Markets Brian Quast
Haywood Securities Kerry Smith
Scotia Capital Craig Johnston
Desjardins Capital Mike Parkin
RIC (as of May 10, 2016)
TSX C$
NYSE MKT US$
Closing price $10.07 $7.77
52-week range $3.14-$10.16 $2.27-$7.99
Market Cap (M’s) $591M $462M
30-day daily trading avg. 360,511 444,466
Strong cash position supports fully funded strategic growth plan
www.richmont-mines.com 8RIC: TSX NYSE-MKT
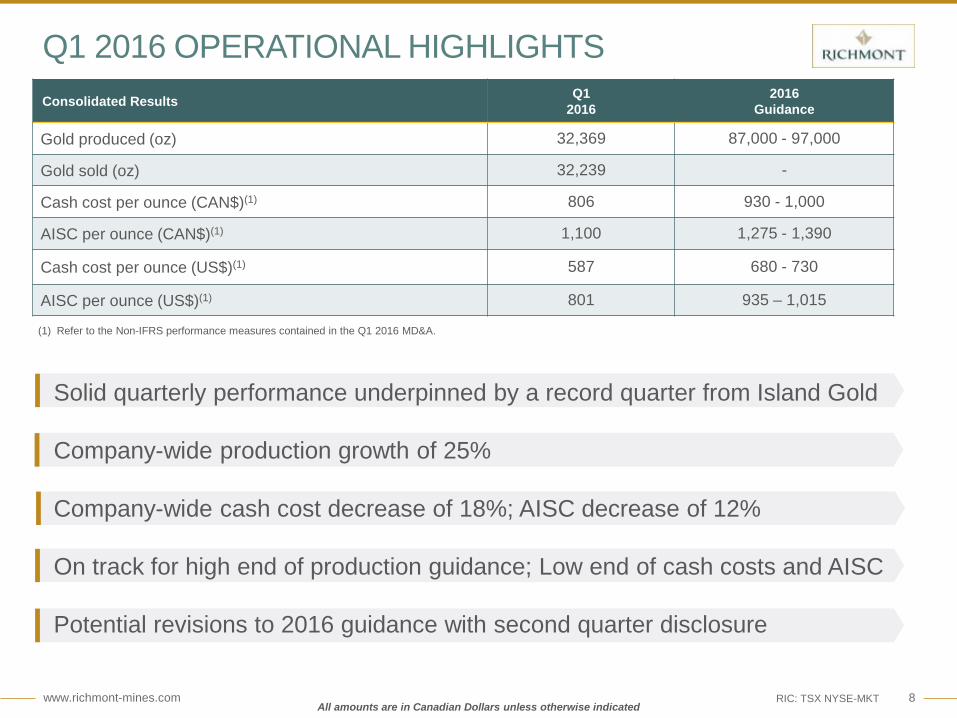
(1) Refer to the Non-IFRS performance measures contained in the Q1 2016 MD&A.
Q1 2016 OPERATIONAL HIGHLIGHTS
All amounts are in Canadian Dollars unless otherwise indicated
Consolidated Results Q12016
2016Guidance
Gold produced (oz) 32,369 87,000 - 97,000
Gold sold (oz) 32,239 -
Cash cost per ounce (CAN$)(1) 806 930 - 1,000
AISC per ounce (CAN$)(1) 1,100 1,275 - 1,390
Cash cost per ounce (US$)(1) 587 680 - 730
AISC per ounce (US$)(1) 801 935 – 1,015
Solid quarterly performance underpinned by a record quarter from Island Gold
Company-wide production growth of 25%
Company-wide cash cost decrease of 18%; AISC decrease of 12%
On track for high end of production guidance; Low end of cash costs and AISC
Potential revisions to 2016 guidance with second quarter disclosure
www.richmont-mines.com 9RIC: TSX NYSE-MKT
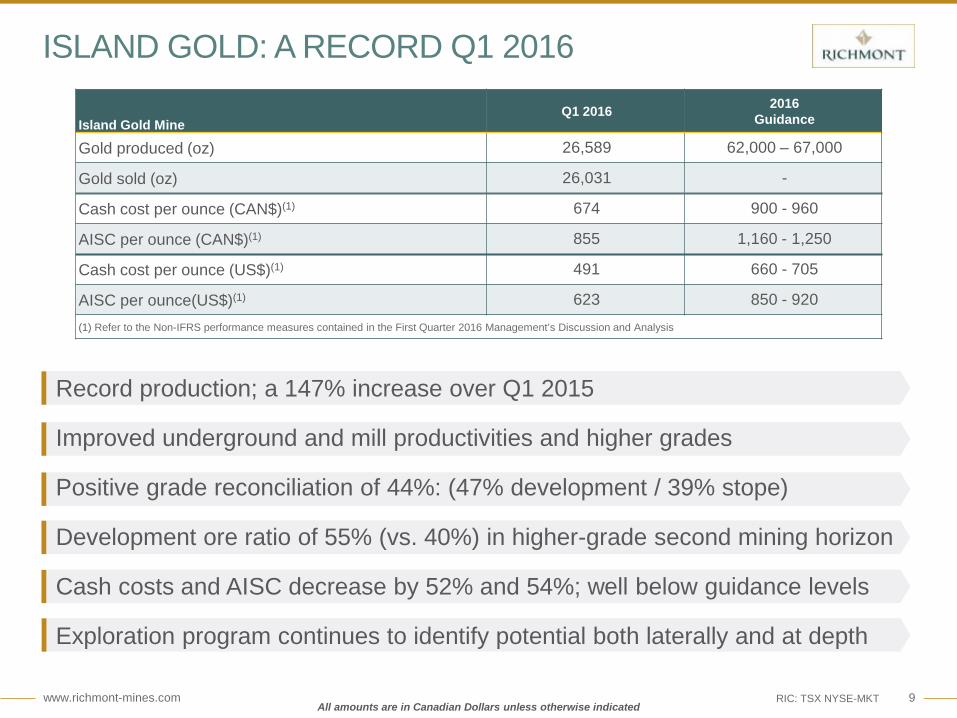
ISLAND GOLD: A RECORD Q1 2016
Island Gold MineQ1 2016 2016
Guidance
Gold produced (oz) 26,589 62,000 – 67,000
Gold sold (oz) 26,031 -
Cash cost per ounce (CAN$)(1) 674 900 - 960
AISC per ounce (CAN$)(1) 855 1,160 - 1,250
Cash cost per ounce (US$)(1) 491 660 - 705
AISC per ounce(US$)(1) 623 850 - 920(1) Refer to the Non-IFRS performance measures contained in the First Quarter 2016 Management’s Discussion and Analysis
All amounts are in Canadian Dollars unless otherwise indicated
Record production; a 147% increase over Q1 2015
Improved underground and mill productivities and higher grades
Positive grade reconciliation of 44%: (47% development / 39% stope)
Development ore ratio of 55% (vs. 40%) in higher-grade second mining horizon
Cash costs and AISC decrease by 52% and 54%; well below guidance levels
Exploration program continues to identify potential both laterally and at depth
www.richmont-mines.com 10RIC: TSX NYSE-MKT
ISLAND GOLD: OPERATING KPIsIsland Gold Mine Q1 2016 2016E
Underground tpd 853 800
Mill tonnes 75,906 292,000
Mill tpd 834 800
Head grade (g/t gold) 11.31 7.0 – 7.5
Recoveries (%) 96.3 96.5
Sustaining Costs ($000’s) 4,713 17,300
Project Costs ($000’s) 6,987 43,400
Non-sustaining exploration Costs ($000’s) 3,770 7,300
Underground Mine Productivity
0.0
2.0
4.0
6.0
8.0
10.0
12.0
0100200300400500600700800900
1000Q
4 14
Q1 15
Q2 15
Q3 15
Q4 15 (1)
2016E
PEA
(800tpd)
Q1 16
Upside
(900tpd)
Gra
ms
per t
onne
Tonn
es p
er d
ay
Underground tpd Head grade (g/t)
- 10,000 20,000 30,000 40,000 50,000 60,000 70,000 80,000 90,000
100,000
2014 2015 2016E(1) PEA BaseCase
(800tpd)(2)
UpsidePotential
(900tpd)(3)
Island Gold Production Upside
All amounts are in Canadian Dollars unless otherwise indicated
(1) Mid-range of 2016 guidance (2) Avg. annual production 2017-2022 (3) Permitted potential (1) Q4 2015 production and mine and mill productivity: Includes a 3-week scheduled underground mine shutdown and a 2-week scheduled mill shutdown
Island Gold Mine - Geology

www.richmont-mines.com 12
Island Gold MineLocation Map
Lake Superior
Marathon
White River
17
25 km
www.richmont-mines.com 13
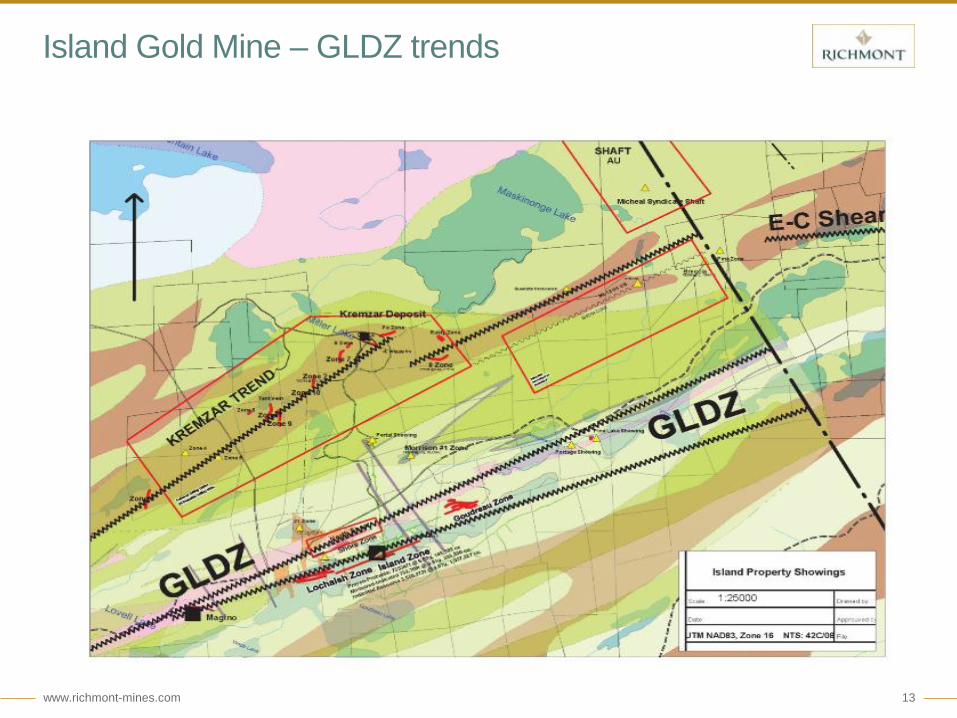
Island Gold Mine – GLDZ trends
www.richmont-mines.com 14RIC: TSX NYSE-MKT
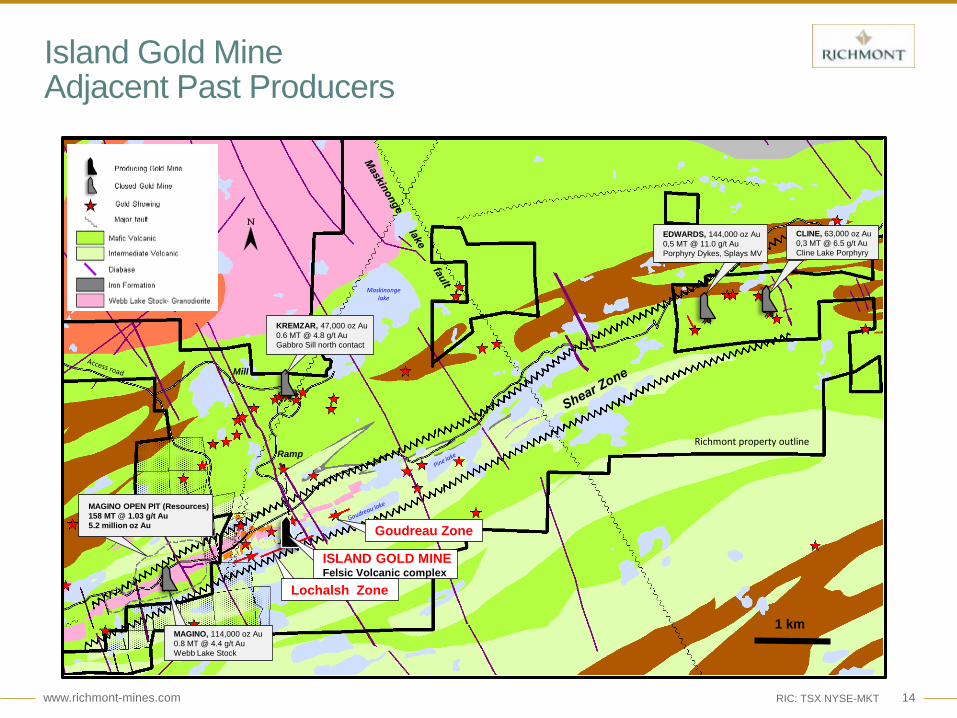
Island Gold Mine Adjacent Past Producers
Mill
CLINE, 63,000 oz Au0,3 MT @ 6.5 g/t AuCline Lake Porphyry
1 km
EDWARDS, 144,000 oz Au0,5 MT @ 11.0 g/t AuPorphyry Dykes, Splays MV
KREMZAR, 47,000 oz Au0.6 MT @ 4.8 g/t AuGabbro Sill north contact
MAGINO, 114,000 oz Au0.8 MT @ 4.4 g/t AuWebb Lake Stock
ISLAND GOLD MINEFelsic Volcanic complex
Richmont property outline
Maskinongelake
Ramp
MAGINO OPEN PIT (Resources)158 MT @ 1.03 g/t Au 5.2 million oz Au Goudreau Zone
Lochalsh Zone
www.richmont-mines.com 15
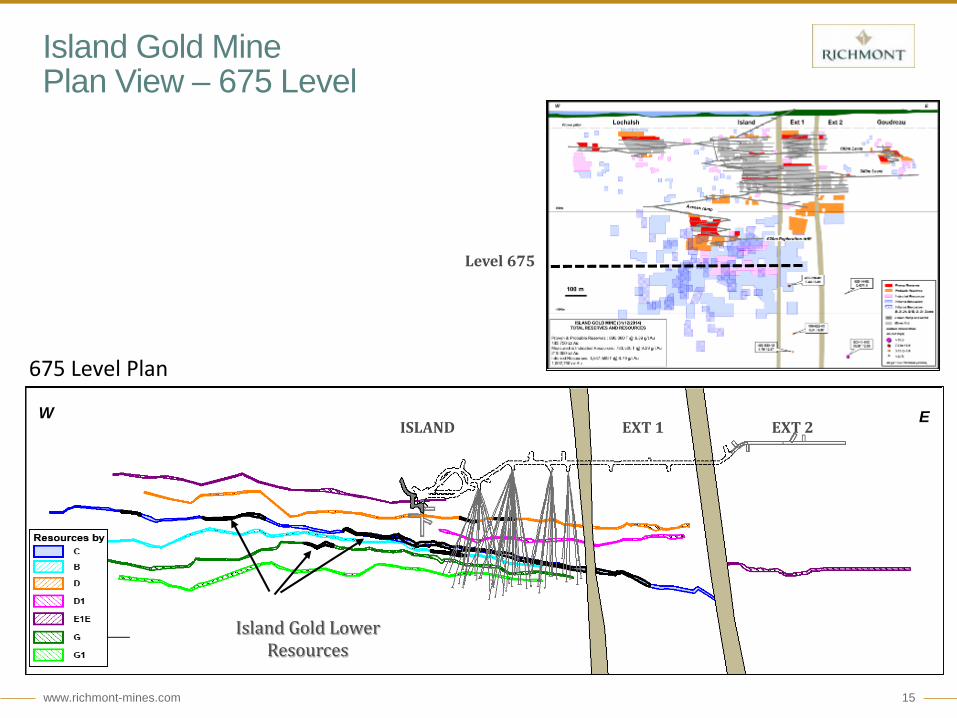
Island Gold MinePlan View – 675 Level
Level 675
Island Gold Lower Resources
ISLAND EXT 1 EXT 2 EW
675 Level Plan

www.richmont-mines.com 16
Island Gold Mine Schematic Cross Section
Overburden
535 Level
620 Level
Island Mainmineralized zones
Island Lowermineralized zones
ramp and drifts
Crown pillar
-500m
-750m
-250m
•Deposit discovered between 1985-87 by CanamaxResources•1989-90 : ramp access with 2 levels developed•2003: option agreement between Richmont and Patricia Mining•2007: beginning of commercial production•2008 : Richmont acquired Patricia Mining•2010 : beginning of deep exploration drilling (-400 to – 1,000 m)•2014 : 320 000 oz of gold extracted from above the 400 level and more than a million ounce resource found below•2015 : more than 560,000 oz in Proven and Probable Reserves, beginning of a deep directional exploration program (-1,000 to -1,500 m)
Inflection Zone
50m
100m
www.richmont-mines.com 17RIC: TSX NYSE-MKT
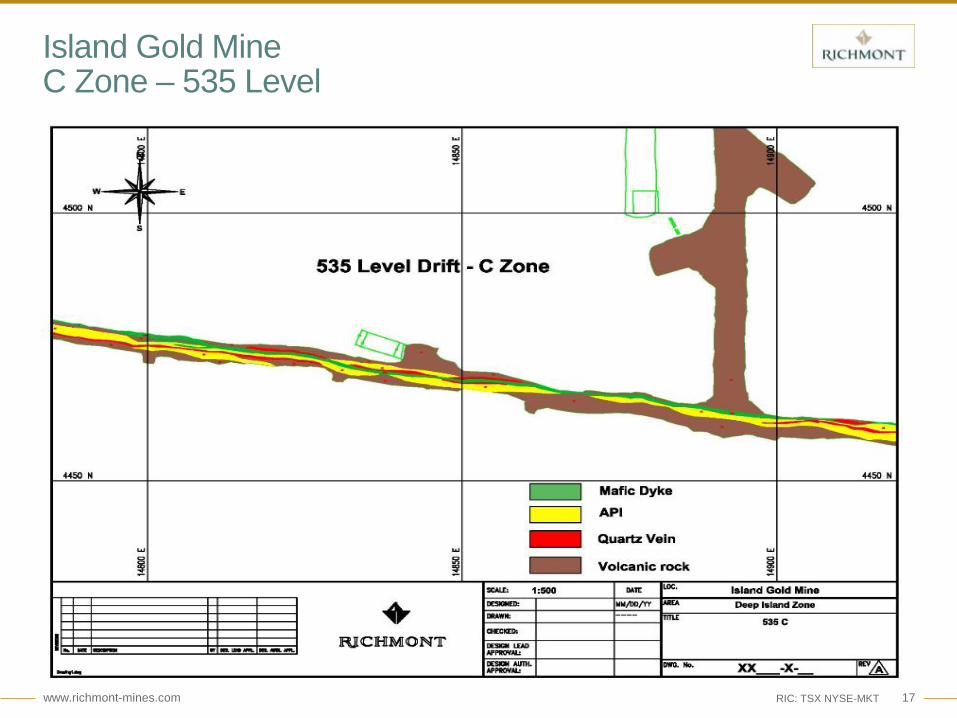
Island Gold MineC Zone – 535 Level
www.richmont-mines.com 18RIC: TSX NYSE-MKT
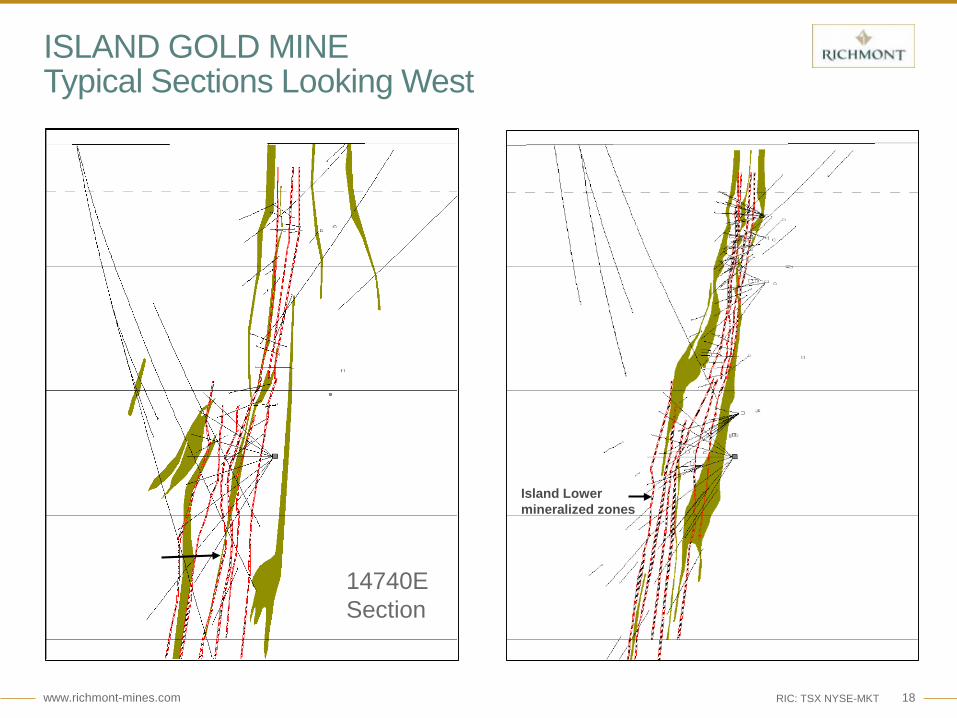
ISLAND GOLD MINETypical Sections Looking West
14740ESection
Island Lowermineralized zones
www.richmont-mines.com 19RIC: TSX NYSE-MKT
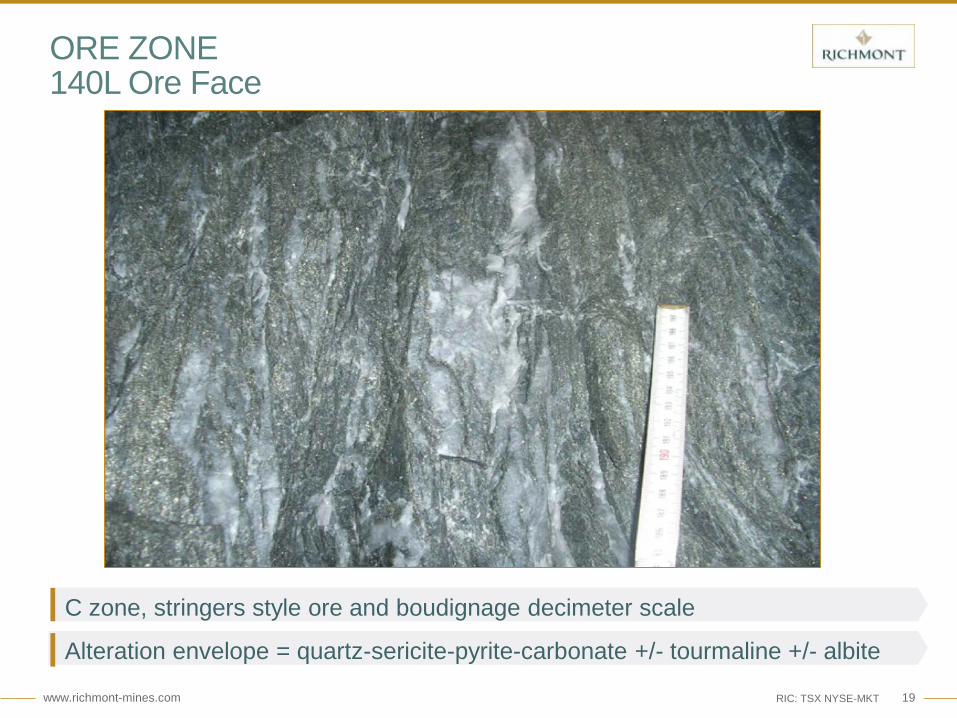
ORE ZONE 140L Ore Face
C zone, stringers style ore and boudignage decimeter scale
Alteration envelope = quartz-sericite-pyrite-carbonate +/- tourmaline +/- albite

www.richmont-mines.com 20RIC: TSX NYSE-MKT
ISLAND GOLD MINEIsland 560 Sill
Approx. 10 cm
Island Gold Mine 560C
www.richmont-mines.com 21RIC: TSX NYSE-MKT
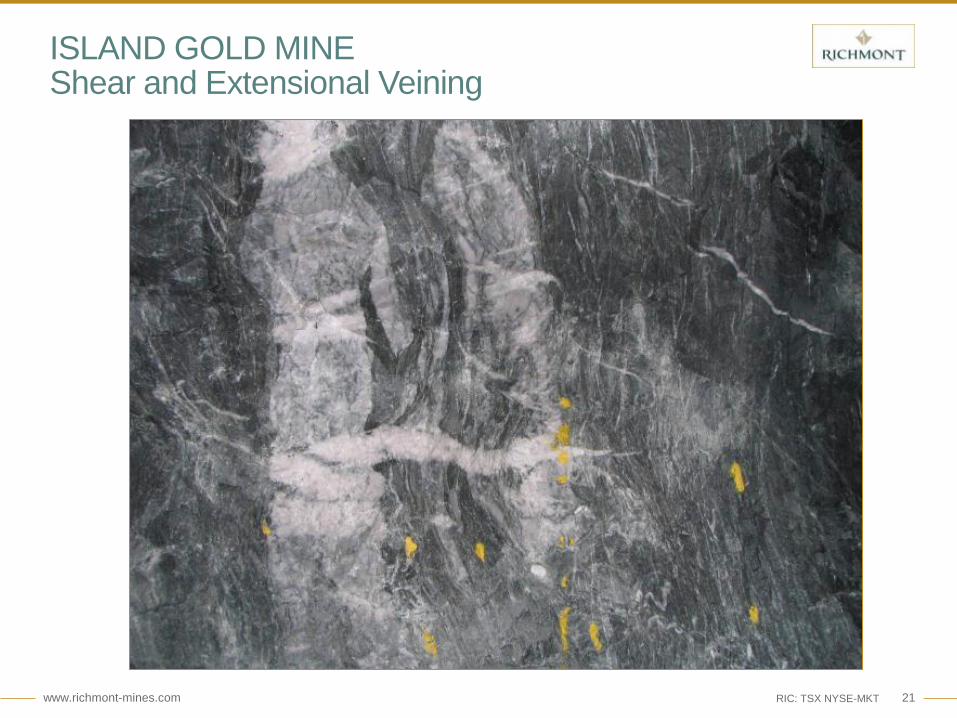
ISLAND GOLD MINEShear and Extensional Veining
Approx. 10 cm
www.richmont-mines.com 22RIC: TSX NYSE-MKT
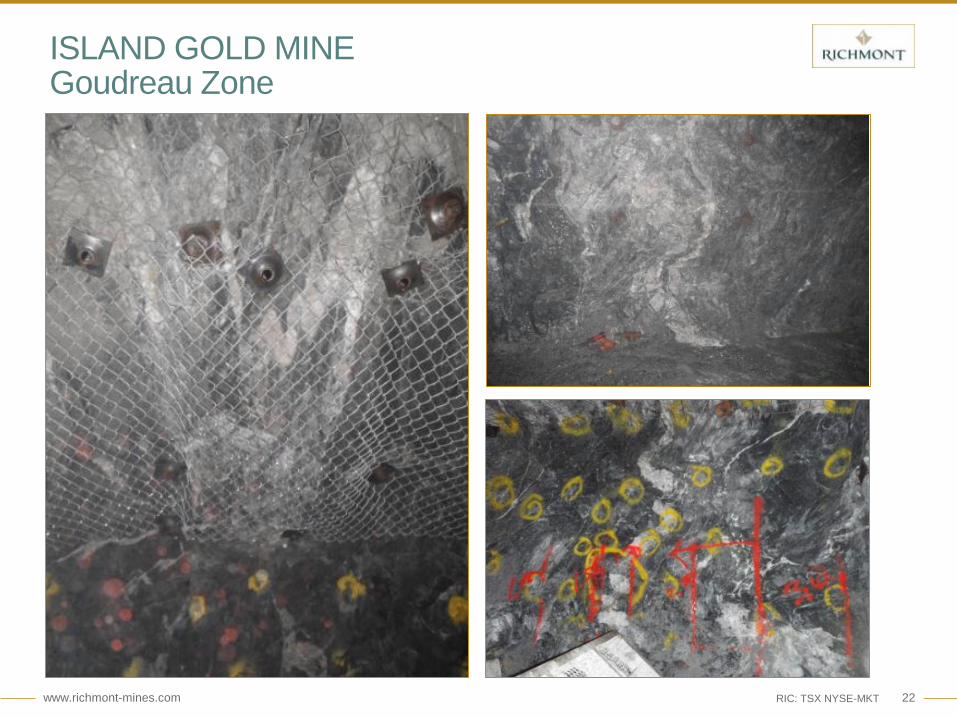
ISLAND GOLD MINEGoudreau Zone
Approx. 10 cm
www.richmont-mines.com 23RIC: TSX NYSE-MKT
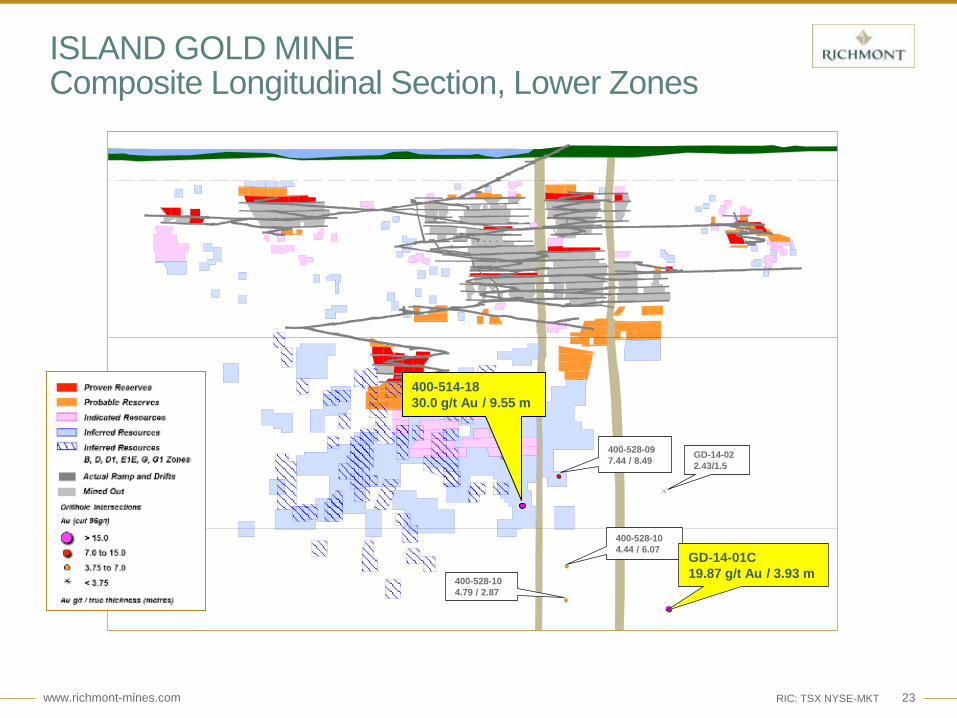
ISLAND GOLD MINEComposite Longitudinal Section, Lower Zones
Approx. 10 cm400-514-1830.0 g/t Au / 9.55 m
400-528-104.79 / 2.87
400-528-097.44 / 8.49
400-528-104.44 / 6.07
GD-14-022.43/1.5
GD-14-01C19.87 g/t Au / 3.93 m
www.richmont-mines.com 24RIC: TSX NYSE-MKT
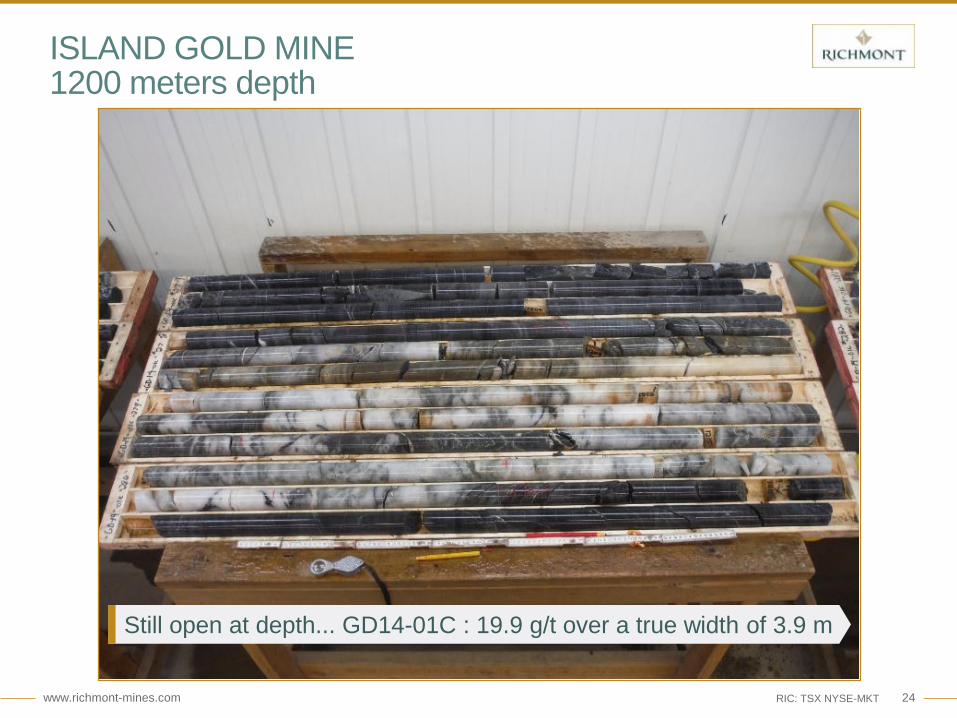
ISLAND GOLD MINE1200 meters depth
Still open at depth... GD14-01C : 19.9 g/t over a true width of 3.9 m
www.richmont-mines.com 25RIC: TSX NYSE-MKT
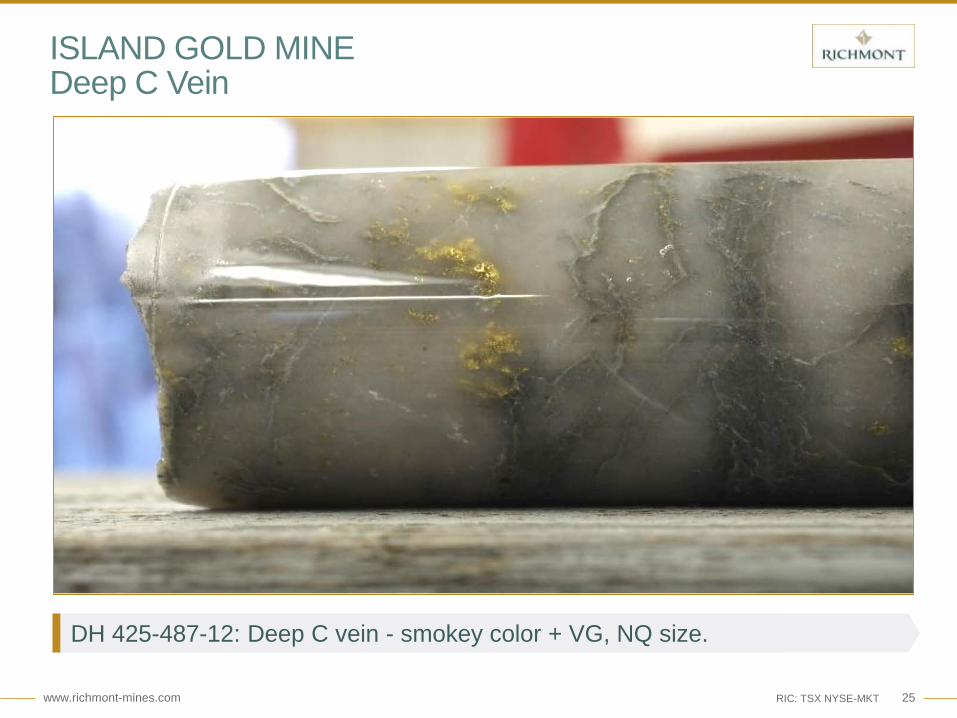
ISLAND GOLD MINEDeep C Vein
DH 425-487-12: Deep C vein - smokey color + VG, NQ size.
www.richmont-mines.com 26RIC: TSX NYSE-MKT
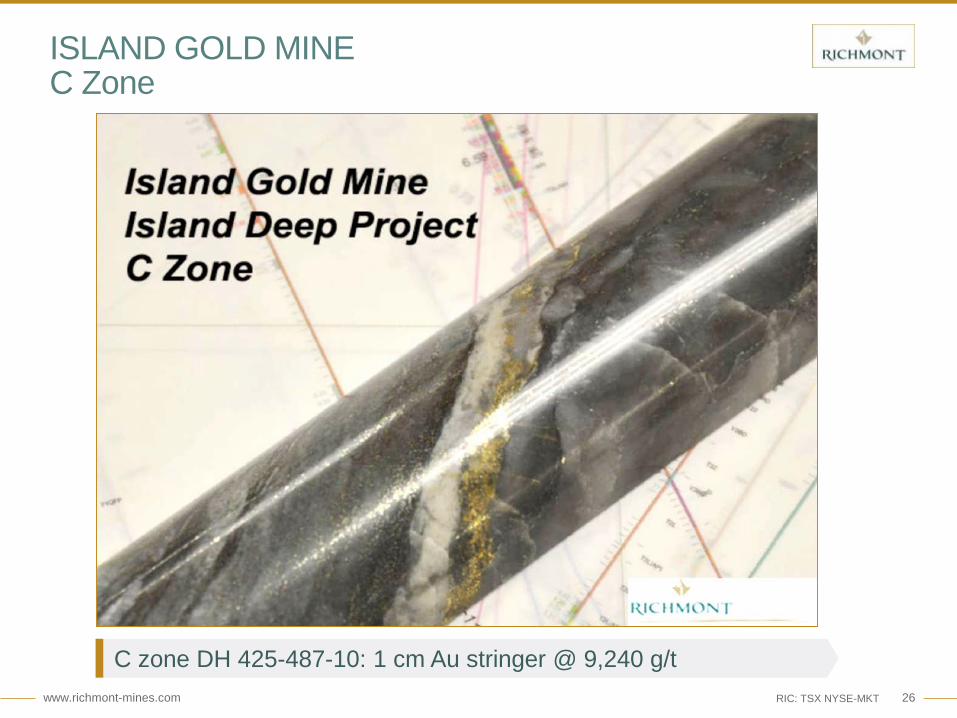
ISLAND GOLD MINE C Zone
C zone DH 425-487-10: 1 cm Au stringer @ 9,240 g/t

www.richmont-mines.com 27RIC: TSX NYSE-MKT
ISLAND GOLD MINEC Zone
www.richmont-mines.com 28RIC: TSX NYSE-MKT
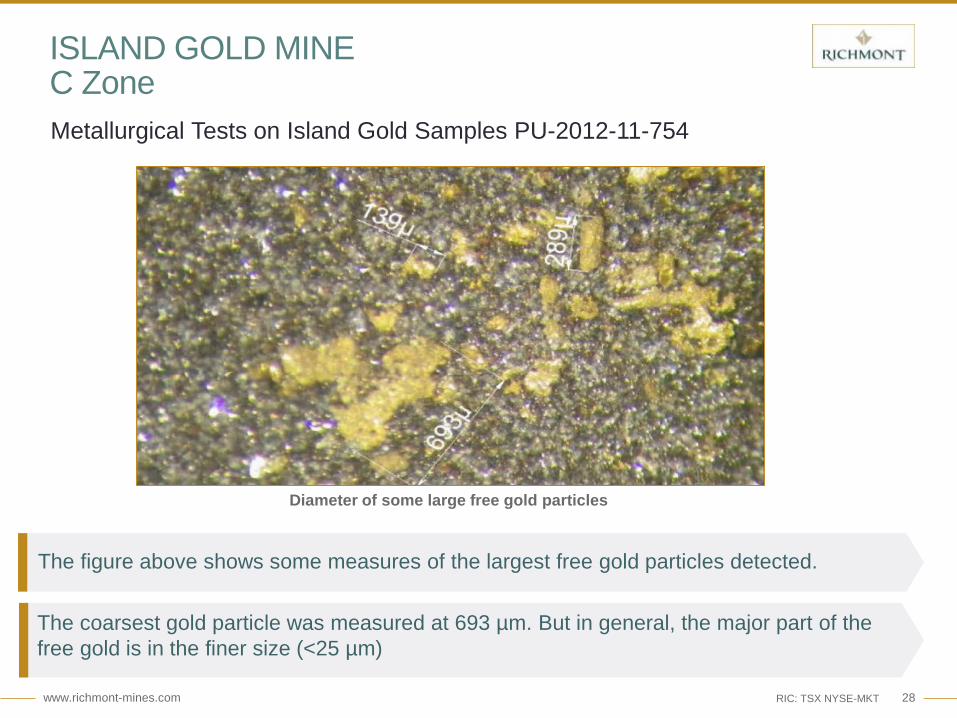
ISLAND GOLD MINEC ZoneMetallurgical Tests on Island Gold Samples PU-2012-11-754
Diameter of some large free gold particles
The figure above shows some measures of the largest free gold particles detected.
The coarsest gold particle was measured at 693 µm. But in general, the major part of the free gold is in the finer size (<25 µm)
www.richmont-mines.com 29RIC: TSX NYSE-MKT
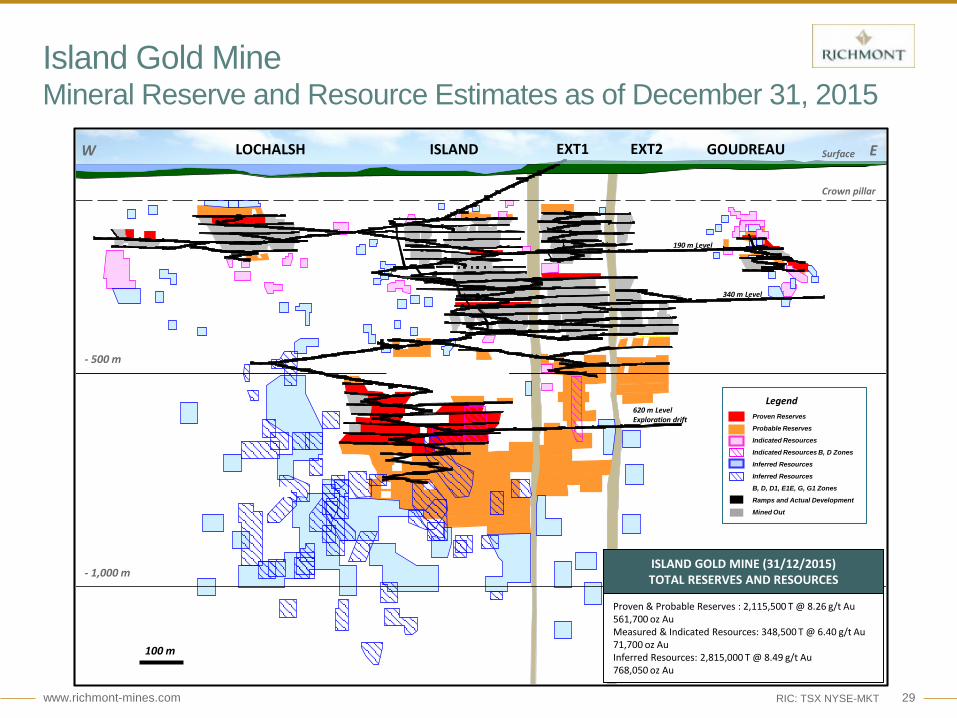
Island Gold Mine Mineral Reserve and Resource Estimates as of December 31, 2015
W EGOUDREAULOCHALSH ISLAND EXT1 EXT2
Crown pillar
Surface
- 500 m
340 m Level
190 m Level
100 m
- 1,000 m
Proven Reserves
Probable Reserves
Indicated Resources
Indicated Resources B, D Zones
Inferred Resources
Inferred Resources
B, D, D1, E1E, G, G1 Zones
Ramps and Actual Development
Mined Out
Legend
ISLAND GOLD MINE (31/12/2015)TOTAL RESERVES AND RESOURCES
Proven & Probable Reserves : 2,115,500 T @ 8.26 g/t Au561,700 oz Au Measured & Indicated Resources: 348,500 T @ 6.40 g/t Au71,700 oz AuInferred Resources: 2,815,000 T @ 8.49 g/t Au768,050 oz Au
ISLAND GOLD MINE (31/12/2015)TOTAL RESERVES AND RESOURCES
620 m LevelExploration drift
www.richmont-mines.com 30RIC: TSX NYSE-MKT
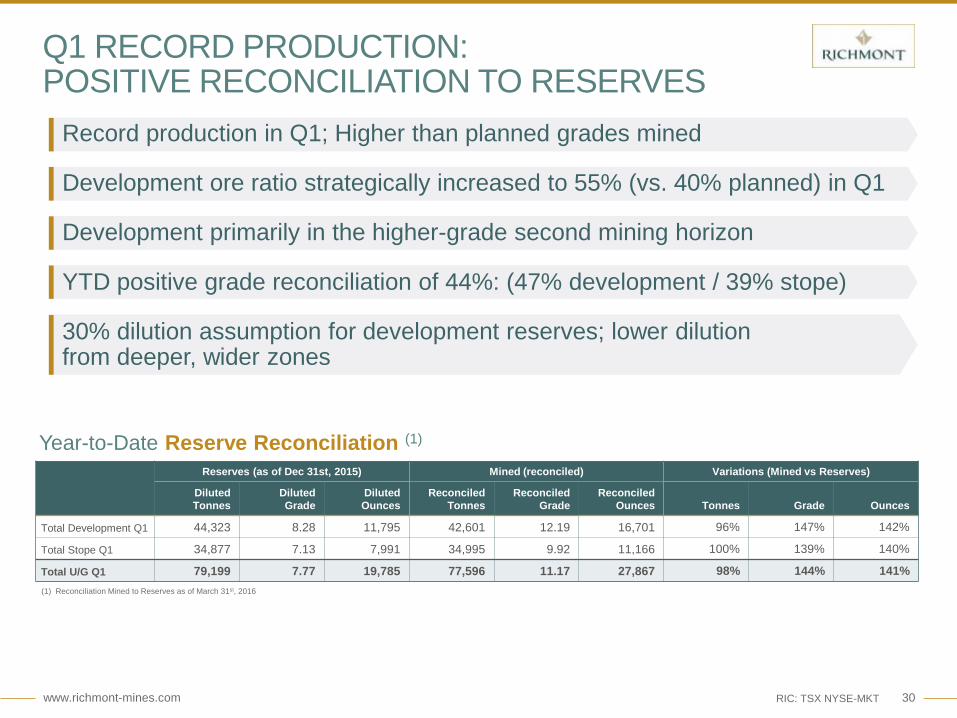
Q1 RECORD PRODUCTION:POSITIVE RECONCILIATION TO RESERVES
(1) Reconciliation Mined to Reserves as of March 31st, 2016
Record production in Q1; Higher than planned grades mined
Development ore ratio strategically increased to 55% (vs. 40% planned) in Q1
Development primarily in the higher-grade second mining horizon
YTD positive grade reconciliation of 44%: (47% development / 39% stope)
30% dilution assumption for development reserves; lower dilution from deeper, wider zones
Reserves (as of Dec 31st, 2015) Mined (reconciled) Variations (Mined vs Reserves)
Diluted Tonnes
Diluted Grade
Diluted Ounces
Reconciled Tonnes
Reconciled Grade
Reconciled Ounces Tonnes Grade Ounces
Total Development Q1 44,323 8.28 11,795 42,601 12.19 16,701 96% 147% 142%
Total Stope Q1 34,877 7.13 7,991 34,995 9.92 11,166 100% 139% 140%
Total U/G Q1 79,199 7.77 19,785 77,596 11.17 27,867 98% 144% 141%
Year-to-Date Reserve Reconciliation (1)
www.richmont-mines.com 31
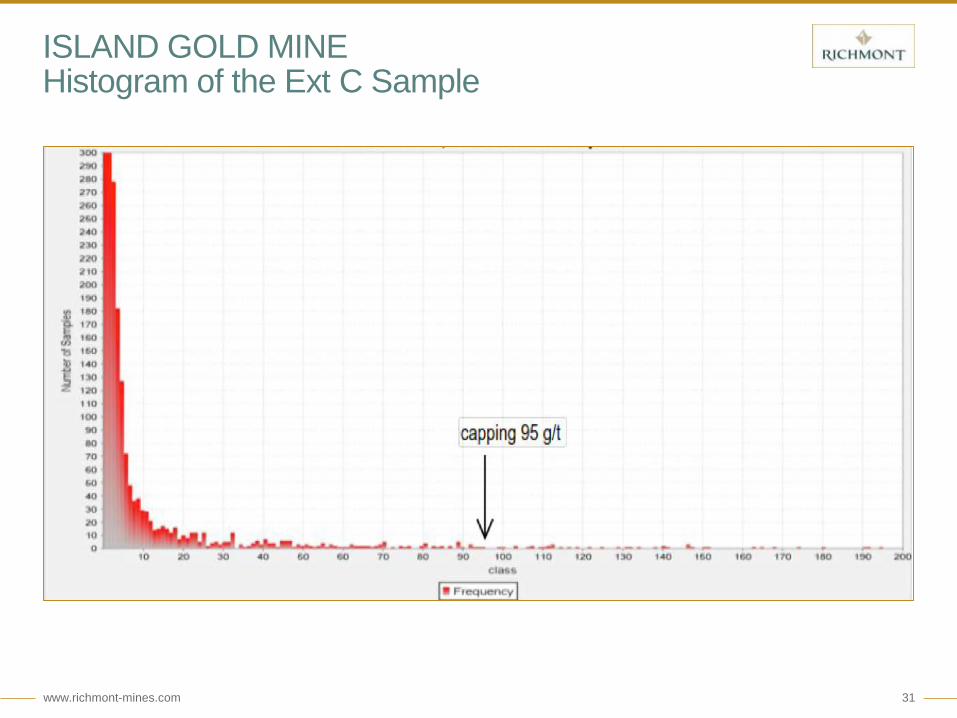
ISLAND GOLD MINEHistogram of the Ext C Sample

www.richmont-mines.com 32
ISLAND GOLD MINELog Normal Probability (Ext C Drill Hole Samples)

Island Gold Mine – Ops & Growth
www.richmont-mines.com 34RIC: TSX NYSE-MKT
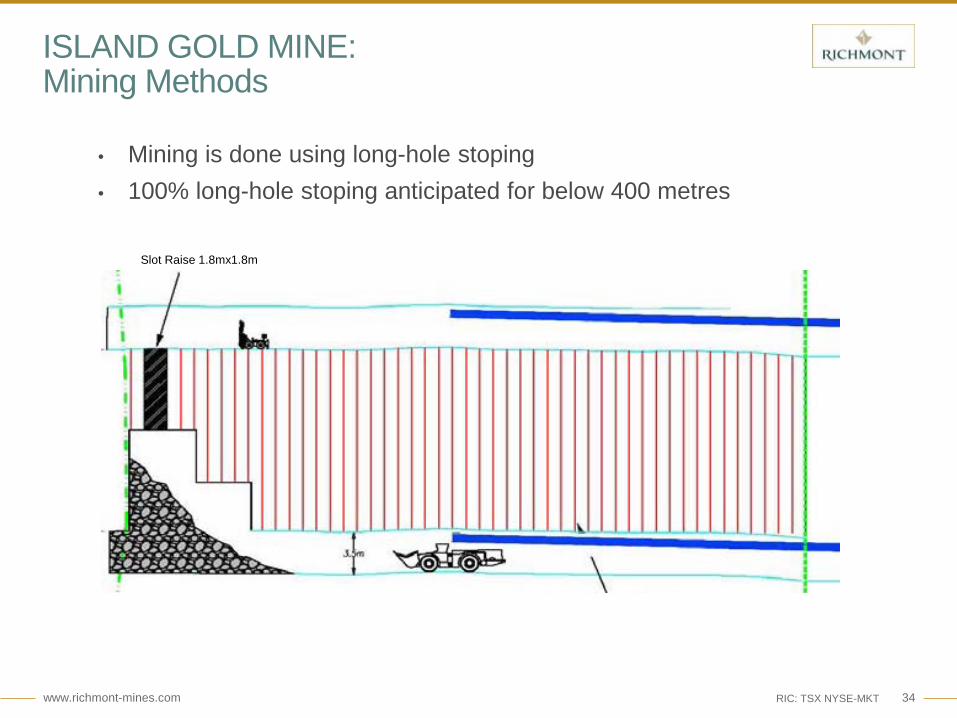
ISLAND GOLD MINE: Mining Methods
• Mining is done using long-hole stoping• 100% long-hole stoping anticipated for below 400 metres
Slot Raise 1.8mx1.8m
www.richmont-mines.com 35RIC: TSX NYSE-MKT
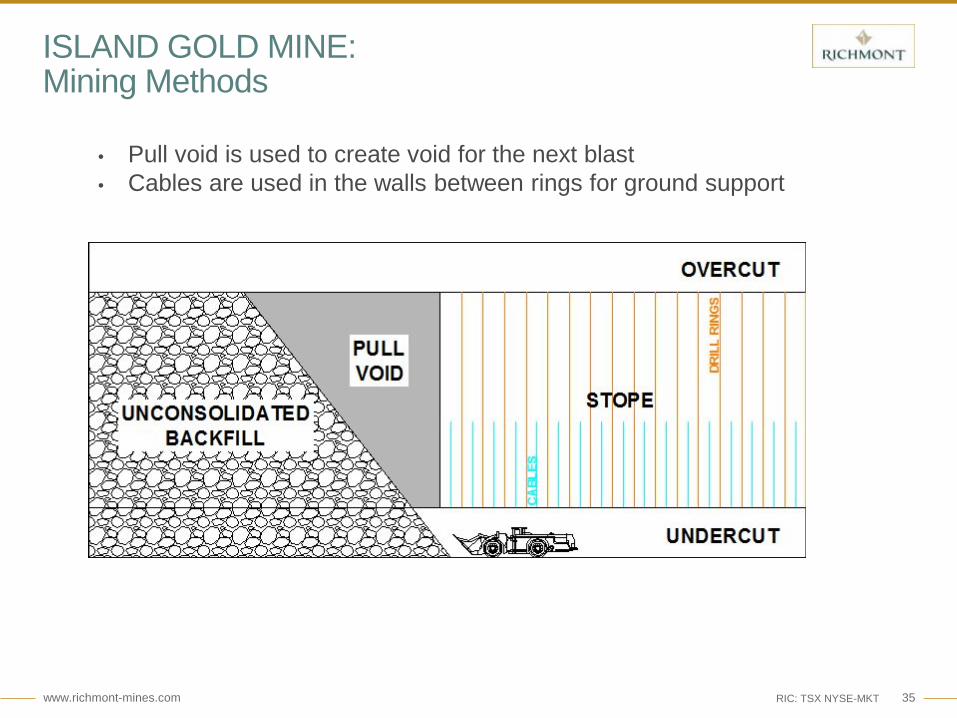
ISLAND GOLD MINE: Mining Methods
• Pull void is used to create void for the next blast• Cables are used in the walls between rings for ground support

www.richmont-mines.com 36RIC: TSX NYSE-MKT
UNIT COST COMPARISONQ1 2016 vs. PEA 2015
2015 PEA Cost/Tonne (C$149/t)(Total 2015 cost/tonne = C$232)
$32SG&A
$72MINING
$32MILLING
$13ROYALTIES
2016 Q1 Cash Cost/Tonne (C$215/t)
$22G&A
$146MINING
$32MILLING
$15ROYALTIES
Higher unit mining costs; strategic decision to increase higher cost ore development ratio
Unit mining costs to decline to PEA levels in 2017-2022; return to lower ore development ratio
Q1 2016 milling and royalty unit costs in-line with PEA; SG&A lower than PEA estimates
www.richmont-mines.com 37RIC: TSX NYSE-MKT
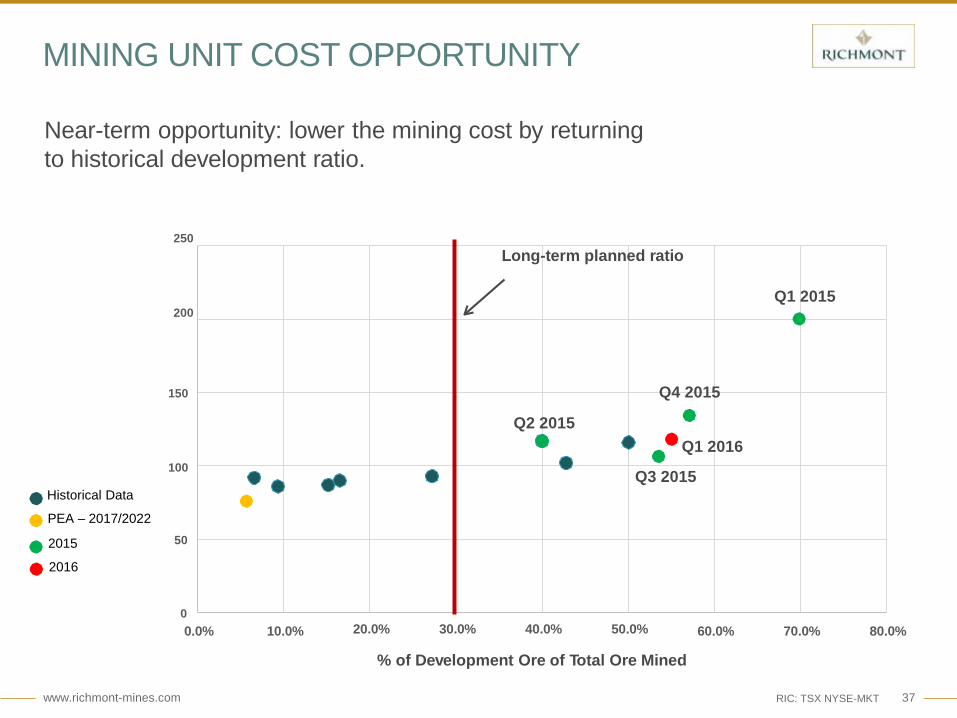
MINING UNIT COST OPPORTUNITY
Near-term opportunity: lower the mining cost by returningto historical development ratio.
Uni
t Min
ing
Cos
t
20.0% 30.0% 40.0% 50.0%
% of Development Ore of Total Ore Mined
0
50
150
Q2 2015
100
250Long-term planned ratio
Q1 2015200
0.0% 10.0% 60.0% 70.0% 80.0%
Historical Data
PEA – 2017/2022
2015
Q4 2015
Q3 2015
2016
Q1 2016

www.richmont-mines.com 38RIC: TSX NYSE-MKT
OTHER IMPROVEMENT INITIATIVES:
Implementation of Performance Management System – Dash Board
Workshops – Mixed Team Sessions (Operations & Supervision)
Operating Costs – Operational Strategy on Main Cost Drivers
Capital Expenditures Control – Allocation & Follow-up
Procurement Strategy on Main Cost Drivers
Dilution Control – Long-hole Stoping
Life of Mine – Optimization of Mine Plans (Expansion Scenario)
Site Admin Costs – Optimization
www.richmont-mines.com 39RIC: TSX NYSE-MKT
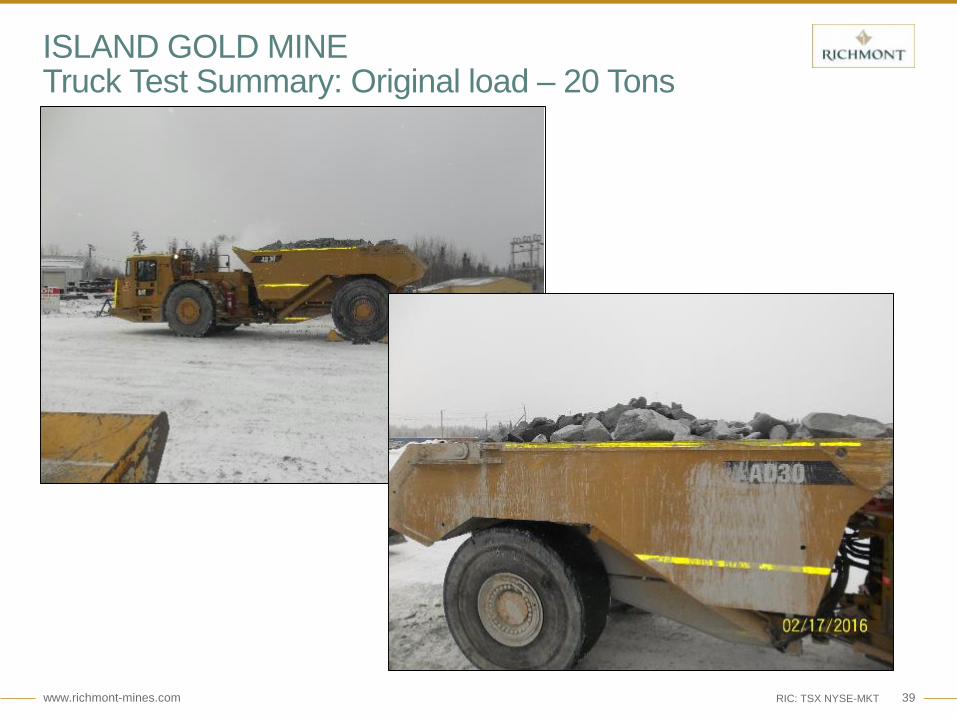
ISLAND GOLD MINETruck Test Summary: Original load – 20 Tons
www.richmont-mines.com 40RIC: TSX NYSE-MKT
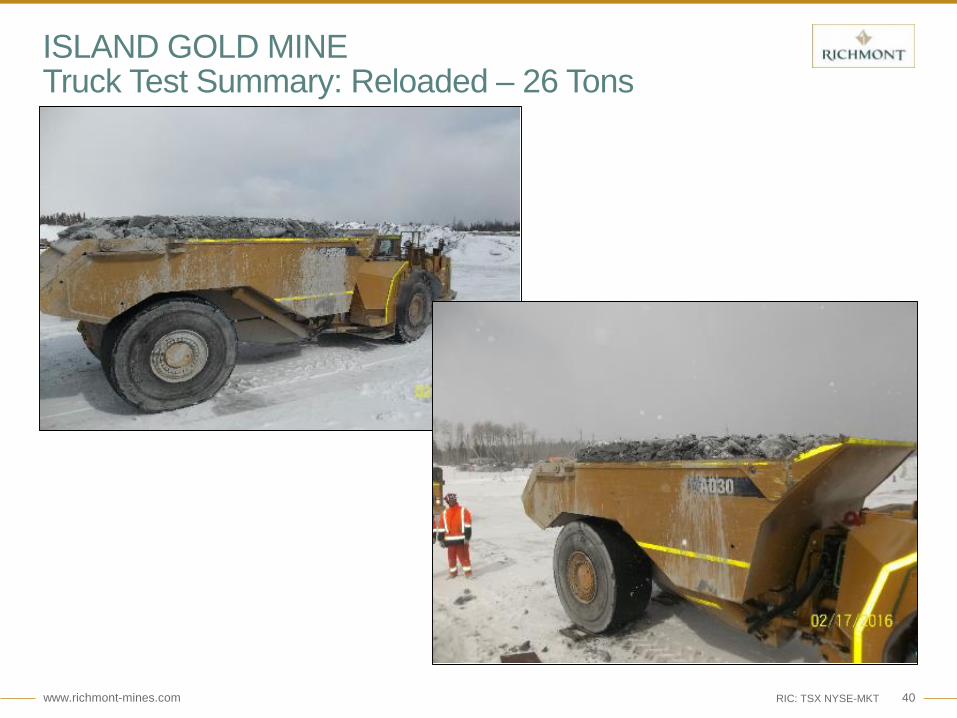
ISLAND GOLD MINETruck Test Summary: Reloaded – 26 Tons

www.richmont-mines.com 41RIC: TSX NYSE-MKT
ISLAND GOLD: 2016 DEVELOPMENT AND MINE PLAN

www.richmont-mines.com 42RIC: TSX NYSE-MKT
• Conceptual expansion case released in H2 2016; Potential Expansion Case to 1,150 tpd decision in H1 2017
ISLAND GOLD: 2015 PEA OVERVIEW• Potential for increased production and lower AISC
0
200
400
600
800
1000
1200
2015 Q1 2016 PEA BaseCase
PermittedCapacity
PEAExpanded
Case
Tonn
espe
r day
• Phased approach: Phase 1 (800 tpd)
• Mining from a depth of 450 to 860 metres over three long-hole mining horizons• Excludes resources above the 450 metre level, isolated resource blocks and parallel zones• Avg. production of approx. 78,000 gold ounces per year from 2017 to 2022 at
$552/oz cash costs
PEA Summary 2017-2022
Tonnes Milled (Mt) 1.7
Head Grade (g/t) 8.67
Mine life excl. transition period (years) 6
Daily mine production (tpd) 801
Gold recovery (%) 96.5
Production (Koz) 464.6
Average annual gold production (Koz) 78
Total operating cost ($M) 256
Average cash operating cost ($/t) 148
Average cash operating cost ($/oz) 552
Transition Period Project Capital 2015-2016 ($M) 62
Sustaining Capital ($M) (2017-2022) 40.5
Mill Expansion Opportunity
www.richmont-mines.com 43RIC: TSX NYSE-MKT
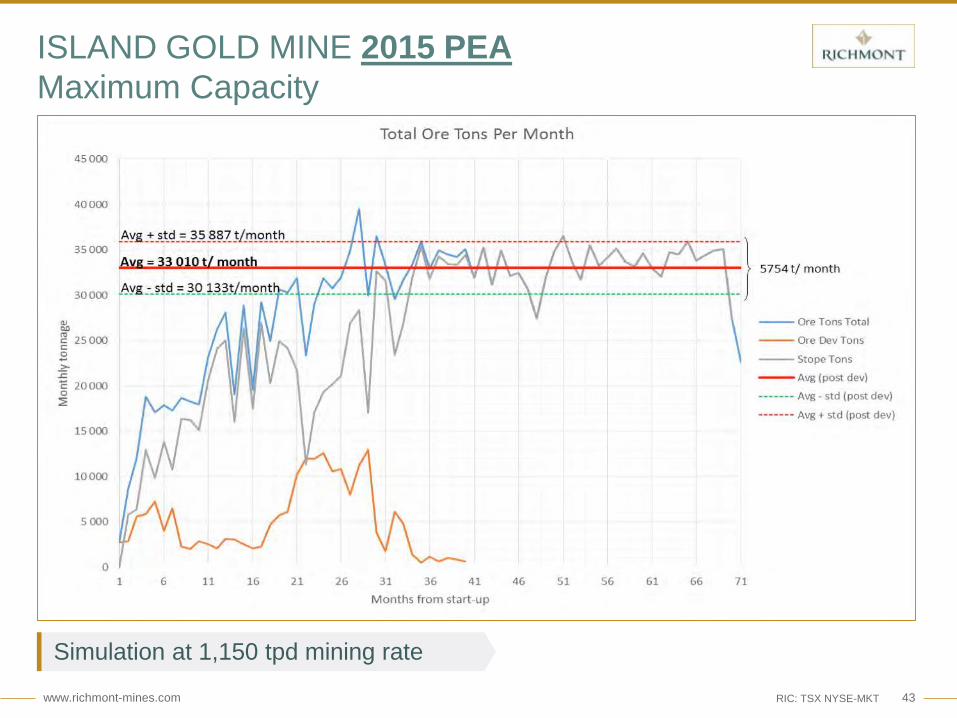
ISLAND GOLD MINE 2015 PEAMaximum Capacity
Simulation at 1,150 tpd mining rate
www.richmont-mines.com 44RIC: TSX NYSE-MKT
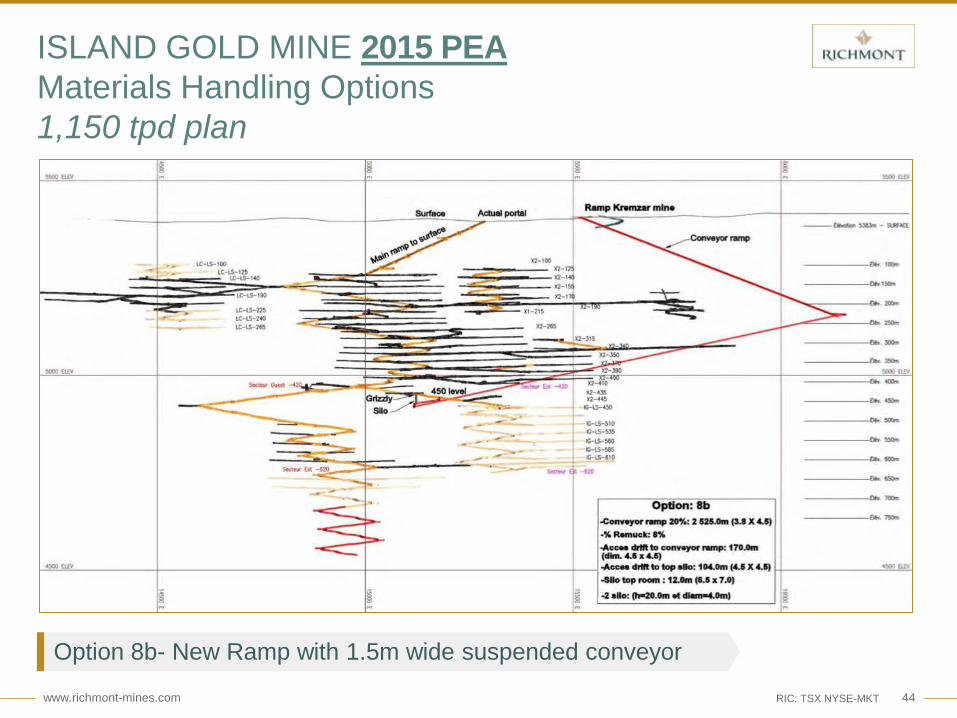
ISLAND GOLD MINE 2015 PEAMaterials Handling Options1,150 tpd plan
Option 8b- New Ramp with 1.5m wide suspended conveyor

www.richmont-mines.com 45RIC: TSX NYSE-MKT
ISLAND GOLD MINE 2015 PEA1,150 tpd plan

www.richmont-mines.com 46RIC: TSX NYSE-MKT
• Necessary Modifications
• Rearrange the crusher circuit including an additional cone crusher
• Replace the crusher circuit screen
• Increase the fine ore bin storage capacity
• Replace the thickener feed well and feed dilution system
• Replace slurry pumps
• Recommended Modifications
• Replace the regrind mill with a 10’ diameter mill
• Add a gravity circuit including a centrifugal bowl concentrator, a magnetic separator and a shaking table
• Add circular screens in CIP tanks
• TOTAL PRELIMINARY COST: C$15.0M
ISLAND GOLD MINE 2015 PEAExpansion Projects: 1,200 tpd Processing Facilities
www.richmont-mines.com 47RIC: TSX NYSE-MKT
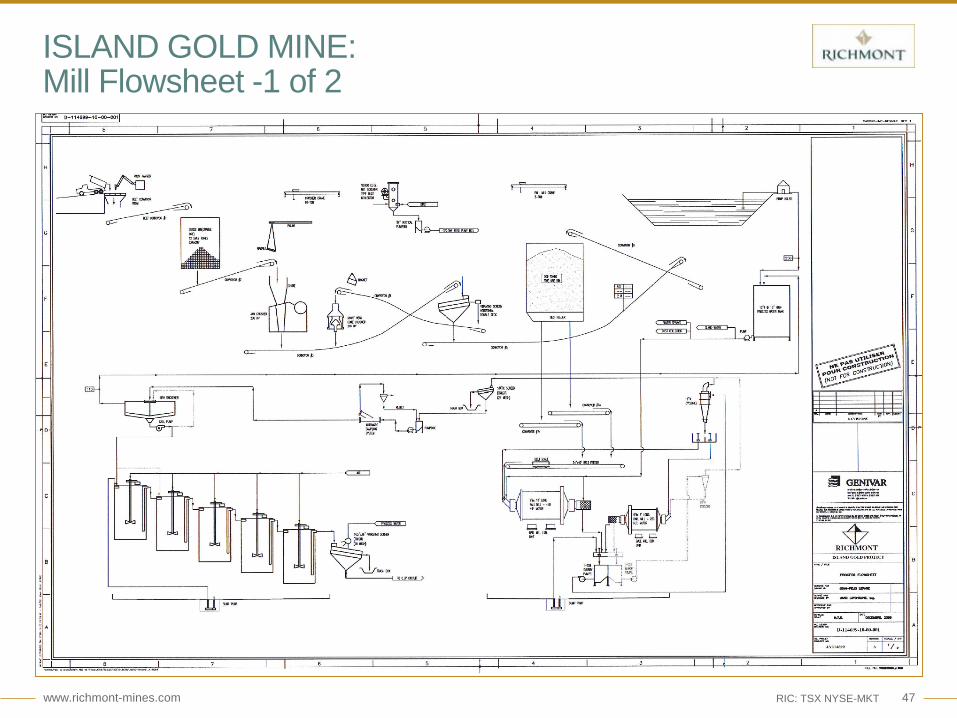
ISLAND GOLD MINE: Mill Flowsheet -1 of 2
www.richmont-mines.com 48RIC: TSX NYSE-MKT
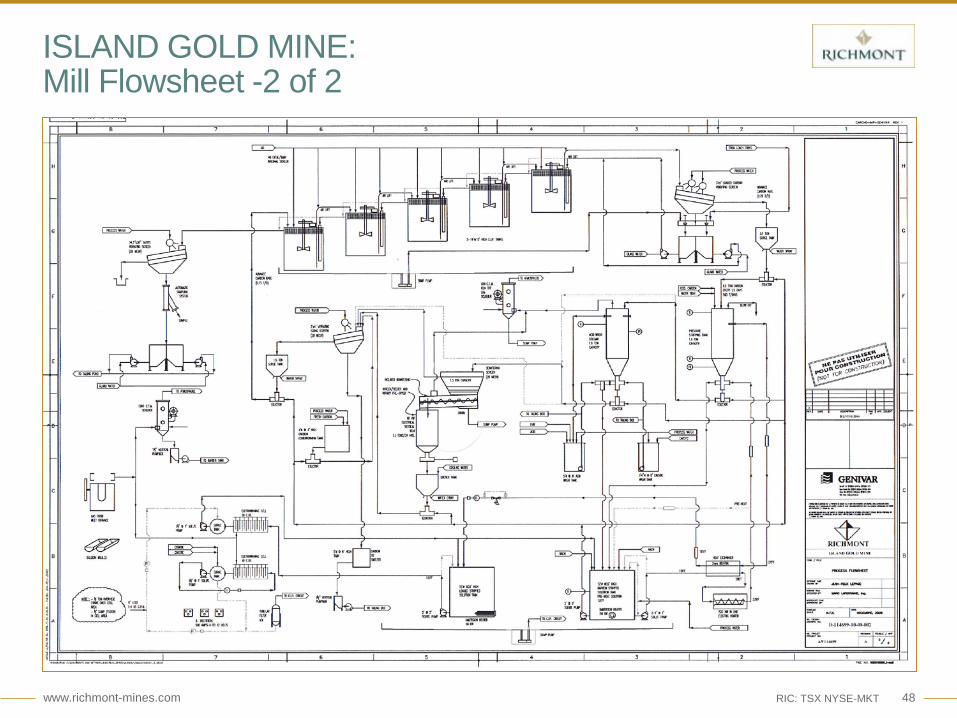
ISLAND GOLD MINE: Mill Flowsheet -2 of 2
www.richmont-mines.com 49RIC: TSX NYSE-MKT
Mining• Expanded resources area used – down to level 1000 and east-west of 2015 PEA area
• New mining capacity analysis – using four mining horizons
• New Life Of Mine (LOM) and operating costs
• Project & sustaining capital estimates
• New mining infrastructure required at expanded capacity
• New ramp design to accommodate haulage down to 1,000m level
• Permitting and timeline
Milling• Increased capacity design - allowing for future growth at a minimum cost
• Gravity circuit vs extra leaching capacity
• Costs breakdown +/- 25%• Permitting and timeline• TOTAL PRELIMINARY COST: C$15.0M
ISLAND GOLD EXPANSION UPDATE H2 2016OBJECTIVES – 2016 PEA
Island Gold Mine – Exploration

www.richmont-mines.com 51RIC: TSX NYSE-MKT
49,196 oz
ISLAND GOLD MINEC Zone, Metal factor (grade*width) as of Dec. 2015
www.richmont-mines.com 52RIC: TSX NYSE-MKT
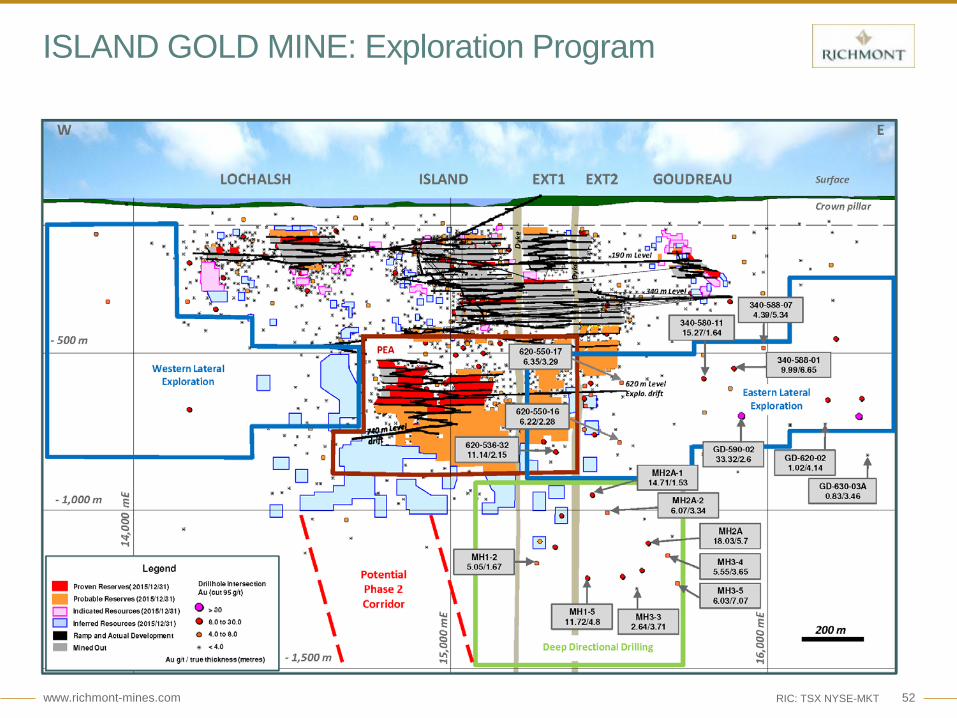
ISLAND GOLD MINE: Exploration Program
www.richmont-mines.com 53RIC: TSX NYSE-MKT
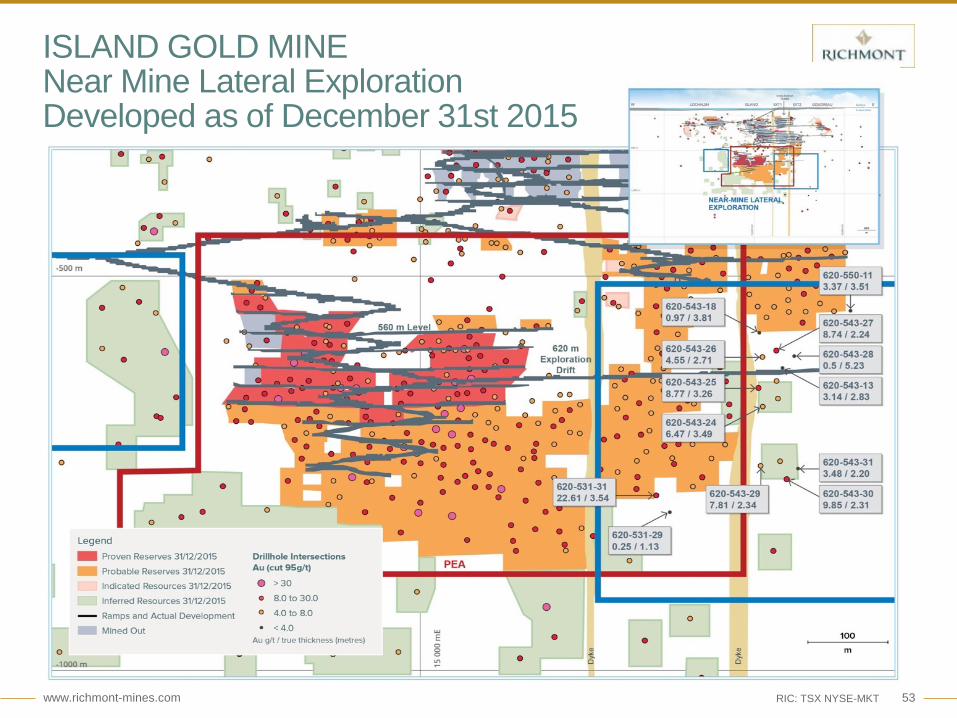
ISLAND GOLD MINENear Mine Lateral ExplorationDeveloped as of December 31st 2015
www.richmont-mines.com 54RIC: TSX NYSE-MKT
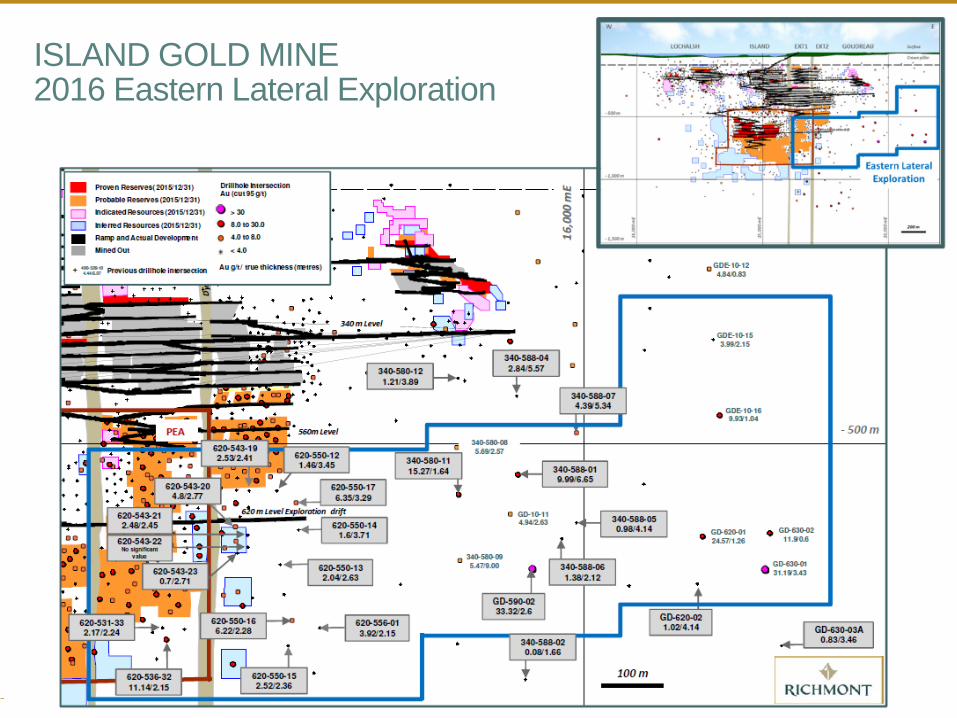
ISLAND GOLD MINE2016 Eastern Lateral Exploration
www.richmont-mines.com 55RIC: TSX NYSE-MKT
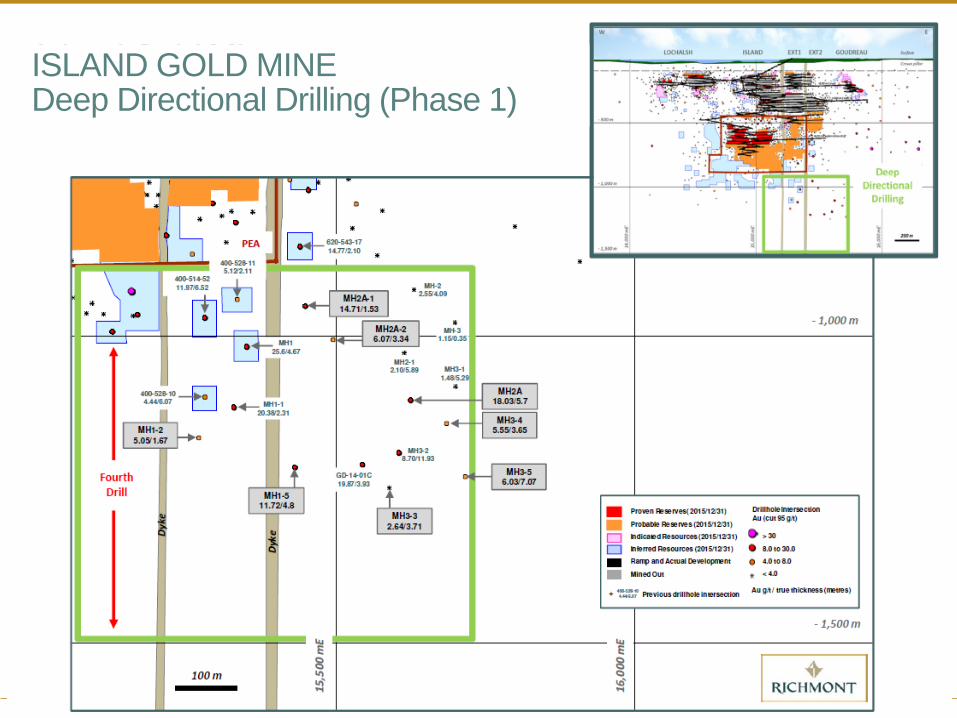
ISLAND GOLD MINEDeep Directional Drilling (Phase 1)

www.richmont-mines.com 56
DEEP DRILLING RESULTS COMPARISON
First 508K oz Deep Resource Block(Feb 25 2013) (capping at 75 g/t)
Average of 53 holes: 11.44 g/t over 4.55 m
Metal Factor
• 13 of 53 holes: 25% below 16 g/t; or • 15 of 55 holes: 27% below 16 g/t
Grade • 9 of 53 holes: 17% below 4 g/t; or• 11 of 55 holes: 20% below 4 g/t
Thickness • 26 of 53 holes: 49% less than 4 m; or• 28 of 55 holes: 51% less than 4 m
New Deep Potential Block (May 5 2016) (capping 95 g/t)
Average of 15 holes: 10.78 g/t over 4.60 m
Metal Factor
• 3 of 15 holes: 20% below 16 g/t
Grade • 1 of 15 holes: 7% below 4 g/t
Thickness • 8 of 15 holes: 53% less than 4 m
DEEP C ZONEINFERRED MINERALS RESOURCES1.5 MT at 10.73 g/t Au, 508,000 ounces
AREA OF POTENTIAL RESOURCES

www.richmont-mines.com 57
ISLAND GOLD MINE: REGIONAL EXPLORATION
Q&A
APPENDIX
www.richmont-mines.com 60RIC: TSX NYSE-MKT
49,196 oz
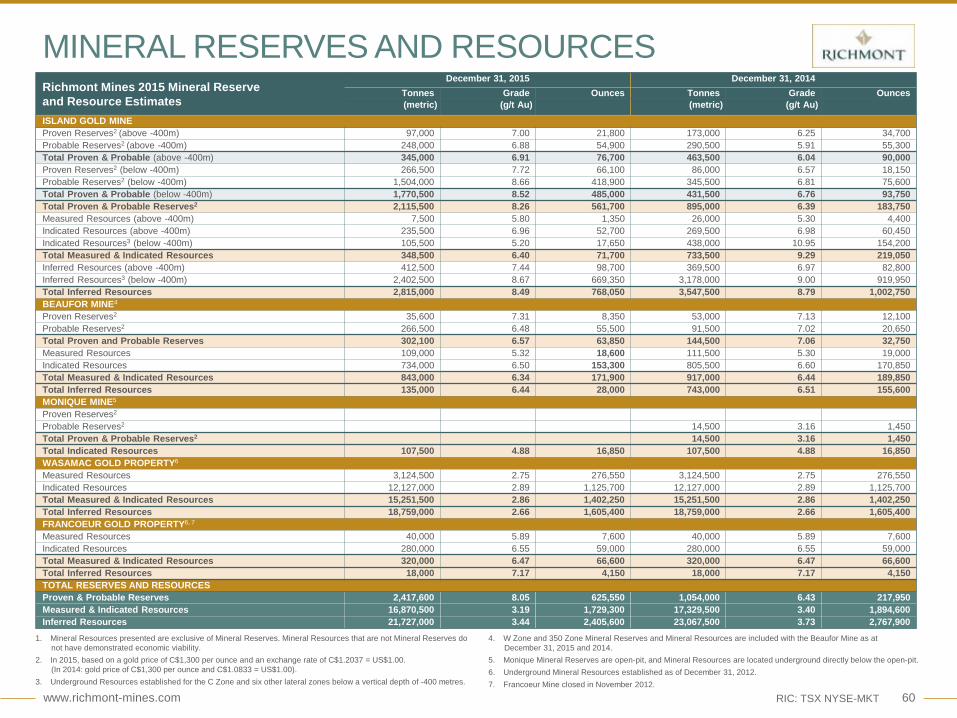
MINERAL RESERVES AND RESOURCESRichmont Mines 2015 Mineral Reserve and Resource Estimates
December 31, 2015 December 31, 2014Tonnes Grade Ounces Tonnes Grade Ounces(metric) (g/t Au) (metric) (g/t Au)
ISLAND GOLD MINEProven Reserves2 (above -400m) 97,000 7.00 21,800 173,000 6.25 34,700Probable Reserves2 (above -400m) 248,000 6.88 54,900 290,500 5.91 55,300Total Proven & Probable (above -400m) 345,000 6.91 76,700 463,500 6.04 90,000Proven Reserves2 (below -400m) 266,500 7.72 66,100 86,000 6.57 18,150Probable Reserves2 (below -400m) 1,504,000 8.66 418,900 345,500 6.81 75,600Total Proven & Probable (below -400m) 1,770,500 8.52 485,000 431,500 6.76 93,750Total Proven & Probable Reserves2 2,115,500 8.26 561,700 895,000 6.39 183,750Measured Resources (above -400m) 7,500 5.80 1,350 26,000 5.30 4,400Indicated Resources (above -400m) 235,500 6.96 52,700 269,500 6.98 60,450Indicated Resources3 (below -400m) 105,500 5.20 17,650 438,000 10.95 154,200Total Measured & Indicated Resources 348,500 6.40 71,700 733,500 9.29 219,050Inferred Resources (above -400m) 412,500 7.44 98,700 369,500 6.97 82,800Inferred Resources3 (below -400m) 2,402,500 8.67 669,350 3,178,000 9.00 919,950Total Inferred Resources 2,815,000 8.49 768,050 3,547,500 8.79 1,002,750BEAUFOR MINE4
Proven Reserves2 35,600 7.31 8,350 53,000 7.13 12,100Probable Reserves2 266,500 6.48 55,500 91,500 7.02 20,650Total Proven and Probable Reserves 302,100 6.57 63,850 144,500 7.06 32,750Measured Resources 109,000 5.32 18,600 111,500 5.30 19,000Indicated Resources 734,000 6.50 153,300 805,500 6.60 170,850Total Measured & Indicated Resources 843,000 6.34 171,900 917,000 6.44 189,850Total Inferred Resources 135,000 6.44 28,000 743,000 6.51 155,600MONIQUE MINE5
Proven Reserves2
Probable Reserves2 14,500 3.16 1,450Total Proven & Probable Reserves2 14,500 3.16 1,450Total Indicated Resources 107,500 4.88 16,850 107,500 4.88 16,850WASAMAC GOLD PROPERTY6
Measured Resources 3,124,500 2.75 276,550 3,124,500 2.75 276,550Indicated Resources 12,127,000 2.89 1,125,700 12,127,000 2.89 1,125,700Total Measured & Indicated Resources 15,251,500 2.86 1,402,250 15,251,500 2.86 1,402,250Total Inferred Resources 18,759,000 2.66 1,605,400 18,759,000 2.66 1,605,400FRANCOEUR GOLD PROPERTY6, 7
Measured Resources 40,000 5.89 7,600 40,000 5.89 7,600Indicated Resources 280,000 6.55 59,000 280,000 6.55 59,000Total Measured & Indicated Resources 320,000 6.47 66,600 320,000 6.47 66,600Total Inferred Resources 18,000 7.17 4,150 18,000 7.17 4,150TOTAL RESERVES AND RESOURCESProven & Probable Reserves 2,417,600 8.05 625,550 1,054,000 6.43 217,950Measured & Indicated Resources 16,870,500 3.19 1,729,300 17,329,500 3.40 1,894,600Inferred Resources 21,727,000 3.44 2,405,600 23,067,500 3.73 2,767,900
1. Mineral Resources presented are exclusive of Mineral Reserves. Mineral Resources that are not Mineral Reserves do not have demonstrated economic viability.
2. In 2015, based on a gold price of C$1,300 per ounce and an exchange rate of C$1.2037 = US$1.00. (In 2014: gold price of C$1,300 per ounce and C$1.0833 = US$1.00).
3. Underground Resources established for the C Zone and six other lateral zones below a vertical depth of -400 metres.
4. W Zone and 350 Zone Mineral Reserves and Mineral Resources are included with the Beaufor Mine as at December 31, 2015 and 2014.
5. Monique Mineral Reserves are open-pit, and Mineral Resources are located underground directly below the open-pit.6. Underground Mineral Resources established as of December 31, 2012.7. Francoeur Mine closed in November 2012.

www.richmont-mines.com 61
2016 OPERATIONAL ESTIMATES2016 Production and Cost Guidance
2016 Capital Investment Guidance
Operational Estimates Island Gold Beaufor2016 Consolidated
EstimatesGold Ounces Produced 62,000-67,000 25,000-30,000 87,000-97,000Cash Costs per Ounce (C$)(1) $900-$960 $1,000-$1,060 $930-$1,000Sustaining Capital per Ounce (C$) $260-$290 $230-$270 $250-$280
Corporate G&A per Ounce (C$) $95-$110
All-in Sustaining Costs per Ounce (C$)(1) $1,160-$1,250 $1,230-$1,330 $1,275-$1,390Cash Costs per Ounce (US$)(1) $660-$705 $735-$780 $680-$730Sustaining Capital per Ounce (US$) $190-$215 $170-$195 $185-$205
Corporate G&A per Ounce (US$) $70-$80
All-in Sustaining Costs per Ounce (US$)(1) $850-$920 $905-$975 $935-$1,015(1) Cash costs and AISC are non-GAAP measures. Refer to the Non-GAAP performance measures section in the 2015 Annual MD&A.
Material assumptions include: an average gold price of C$1,500 per ounce (US$1,100 per ounce); and a foreign exchange rate of 1.364 Canadian dollars to the US dollar.
Capital and Exploration Investment ($M) Island Gold Quebec Division2016 Consolidated
EstimatesSustaining Capital (C$) $17.3 $6.8 $24.1Project Capital (C$)(3) $43.4 $ - $43.4Company-wide Exploration (C$) $7.3(1) $1.1(2) $8.4Sustaining Capital (US$) $12.7 $5.0 $17.7Project Capital (US$)(3) $31.8 $ - $31.8Company-wide Exploration (US$) $5.4 $0.8 $6.2(1) Exploration costs required to complete the drilling programs announced in September 2015.(2) All delineation and exploration drilling for the Beaufor Mine is included in sustaining capital and $1.1 million is related to the Quebec division outside the Beaufor property.(3) Project Capital for Island Gold includes accelerated underground development of $25.0 million (US$18.3 million) related to the PEA and $6.0 million (US$4.4 million) related to discretionary development outside the scope of the PEA.

www.richmont-mines.com 62RIC: TSX NYSE-MKT
CHRISTIAN BOURCIER
Vice-President, Operations
P. ENGPresident and Chief Executive Officer
P. ENG
RICHMONT MINES: MANAGEMENT TEAM
RENAUD ADAMS DANIEL ADAM
Vice-President Exploration
GEO PHD
NICOLE VEILLEUX
Vice-President Finance
CPA, CA
JEAN BASTIEN
Island Gold Mine General Manager
P. ENG, MBA
MARC-ANDRÉ LAVERGNE
Beaufor Mine and Camflo Mill General Manager
P. ENG
MAXIME GRONDIN
Director, Human Resources
CIRC
MÉLISSA TARDIF
ANNE DAY
Vice-President, Investor Relations
MBA
STEVE BURLETON
Vice-President, Business Development
CFA, MBA
Director, Business Performance Management and Infrastructure
BSC ISE
MIGUEL MENDOZA
Lawyer and Corporate Secretary
LLB
www.richmont-mines.com 63RIC: TSX NYSE-MKT
RICHMONT MINES: BOARD OF DIRECTORS
RENÉ MARION
Chairman of the Board
P. ENG
MICHAEL PESNER
Director and Chairman ofthe Audit Committee
CA
RENAUD ADAMS
Director, President and Chief Executive Officer
P. ENG
PETER BARNES
Director
CA
ELAINE ELLINGHAM
Director
P. Geo., MBA
www.richmont-mines.com 64
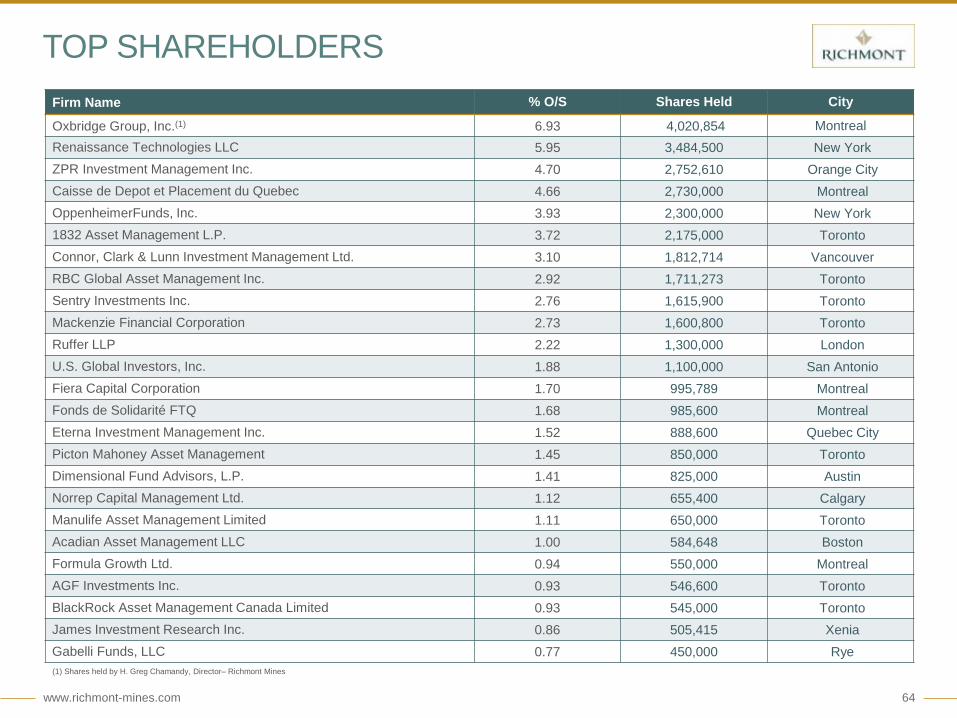
TOP SHAREHOLDERSFirm Name % O/S Shares Held City
Oxbridge Group, Inc.(1) 6.93 4,020,854 MontrealRenaissance Technologies LLC 5.95 3,484,500 New YorkZPR Investment Management Inc. 4.70 2,752,610 Orange CityCaisse de Depot et Placement du Quebec 4.66 2,730,000 MontrealOppenheimerFunds, Inc. 3.93 2,300,000 New York1832 Asset Management L.P. 3.72 2,175,000 TorontoConnor, Clark & Lunn Investment Management Ltd. 3.10 1,812,714 VancouverRBC Global Asset Management Inc. 2.92 1,711,273 TorontoSentry Investments Inc. 2.76 1,615,900 TorontoMackenzie Financial Corporation 2.73 1,600,800 TorontoRuffer LLP 2.22 1,300,000 LondonU.S. Global Investors, Inc. 1.88 1,100,000 San AntonioFiera Capital Corporation 1.70 995,789 MontrealFonds de Solidarité FTQ 1.68 985,600 MontrealEterna Investment Management Inc. 1.52 888,600 Quebec CityPicton Mahoney Asset Management 1.45 850,000 TorontoDimensional Fund Advisors, L.P. 1.41 825,000 AustinNorrep Capital Management Ltd. 1.12 655,400 CalgaryManulife Asset Management Limited 1.11 650,000 TorontoAcadian Asset Management LLC 1.00 584,648 BostonFormula Growth Ltd. 0.94 550,000 MontrealAGF Investments Inc. 0.93 546,600 TorontoBlackRock Asset Management Canada Limited 0.93 545,000 TorontoJames Investment Research Inc. 0.86 505,415 XeniaGabelli Funds, LLC 0.77 450,000 Rye(1) Shares held by H. Greg Chamandy, Director– Richmont Mines
www.richmont-mines.com 65RIC: TSX NYSE-MKT
OUR VISION and STRATEGY
Our vision is to become a leading intermediate gold producer focused on the Americas generating superior per share valuation. We are committed to a “Sustainable Business Model” and a strategy of long-term growth, and will fully utilize the Corporation’s strong balance sheet, assets, cash flow, capital structure and the extensive experience of the Corporations’ Board of Directors and Management Team to build the next leading Canadian based intermediate gold company.
Our strategy, in the short term, will focus on becoming a leading junior gold producer by maintaining at all times a superior per share position on operational & financial metrics while maintaining a sustainable and risk adverse approach under a “Sustainable Business Model”.
We are guided by our core corporate values to achieve long term value for all of our stakeholders. By cultivating a culture of responsible performance, we are focused on operating in a sustainable manner while holding ourselves accountable to all of our stakeholders.

www.richmont-mines.com 66RIC: TSX NYSE-MKT
OUR VALUES
At the heart of this is a commitment to responsibility, integrity and accountability and the Corporation’s four corporate values of Family, Health & Safety, Growth and Team Work.
Health and Safety“Zero tolerance…”
Family“At the heart of
what unites us…”Richmont Mines is a family. Our
management team is easily accessible and actively listens to our employees and their
families. Richmont has put a number of plans and activities in place, including programs that
support work-family balance, scholarships, and student hiring.
Health and safety is a cardinal value of the corporation. Richmont Mines makes every effort to safeguard the health and safety of all of its employees. We implement efficient health and wellness programs and support our objectives with recognition programs.The only truly acceptable result is zero accidents.
Team Work “Working together...”
Richmont Mines strives to create a unified team by encouraging the involvement and
the participation of our employees and stakeholders. We want our employees to enjoy working together. Every position is important. Working together and promoting
cooperation promotes continued success and the achievement of greater objectives.
With an objective of becoming a leading junior gold producer in the short-term and an important intermediate gold producer, Richmont’s growth is supported by the development of our workforce, the health and safety of our employees, and cultivating good relations with the community, while having a transparent approach, driven by integrity and ethics.
Growth “We are building the future…”

www.richmont-mines.com 67RIC: TSX NYSE-MKT
SUSTAINABLE BUSINESS MODEL
We believe in developing Richmont based on the principles of sustainability, in order to deliver sustainable and superior value for all stakeholders with low risk exposure to precious metals.
SustainableHuman Resources
SustainableCommunity Development
SustainableProcess Improvement
SustainableGrowth Principles
Making work life sustainable through employee health & safety and wellness
programs, improved supervisory & operational planning/implementation practices and skills through training programs. Develop potential
leadership abilities through leadership program. Promote Life in Balance; family, work and
personal development.
Reducing inefficiency and waste through quality & performance management by implementation of “Lean” methods and balanced score card approach. Advanced knowledge and experience with energy efficiency, sustainable waste systems & construction/building practices.
Leadership and consulting skills for promoting comprehensive change
toward sustainability in communities and developing world-class relationships
with Aboriginal communities.
Developing sustainable exploration, development, operational and financial practices in order to deliver superior per share value, mitigation/management of risk exposure and discipline approach toward preserving best-in-class balance sheet and capital structure.
![SYNOPSYS™ Input General Formats · 2019. 10. 1. · format: sn option where option is one of the following: null sph rd nb rad nb cv nb ncop pcv nb [ m [ b ] ] umc nb upc nb ymc](https://img.pdfslide.net/doc/110x75/60b65647ea53da7a652209e1/synopsysa-input-general-formats-2019-10-1-format-sn-option-where-option.jpg)