Embed Size (px)
Citation preview

Take Hold Of Your Wealth
Quarterly Investment ReviewSecond Quarter 2015
2
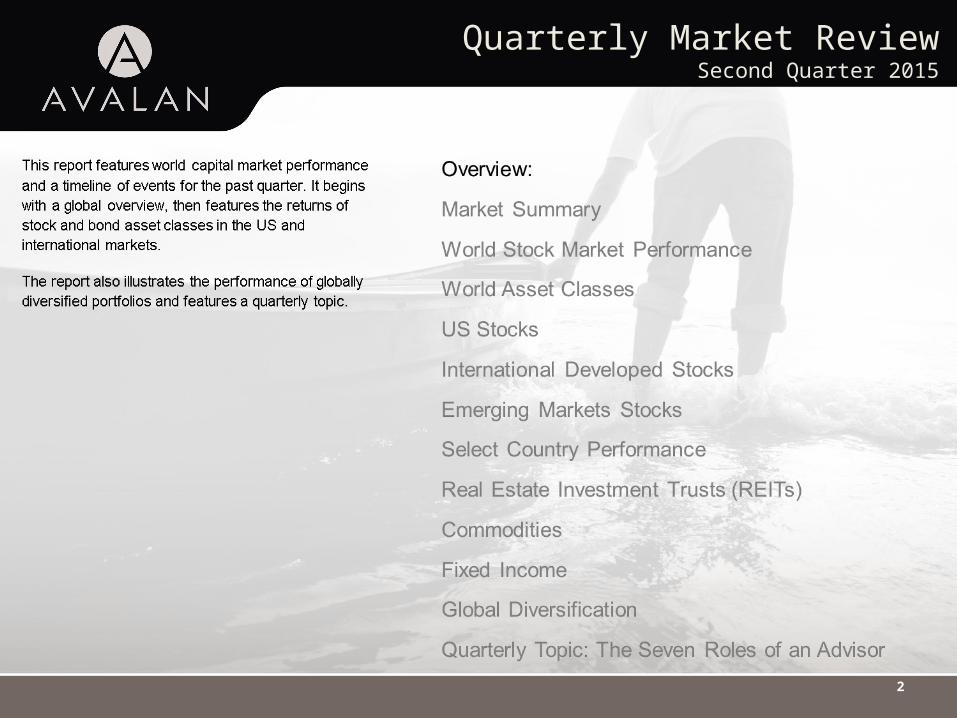
Quarterly Market ReviewSecond Quarter 2015
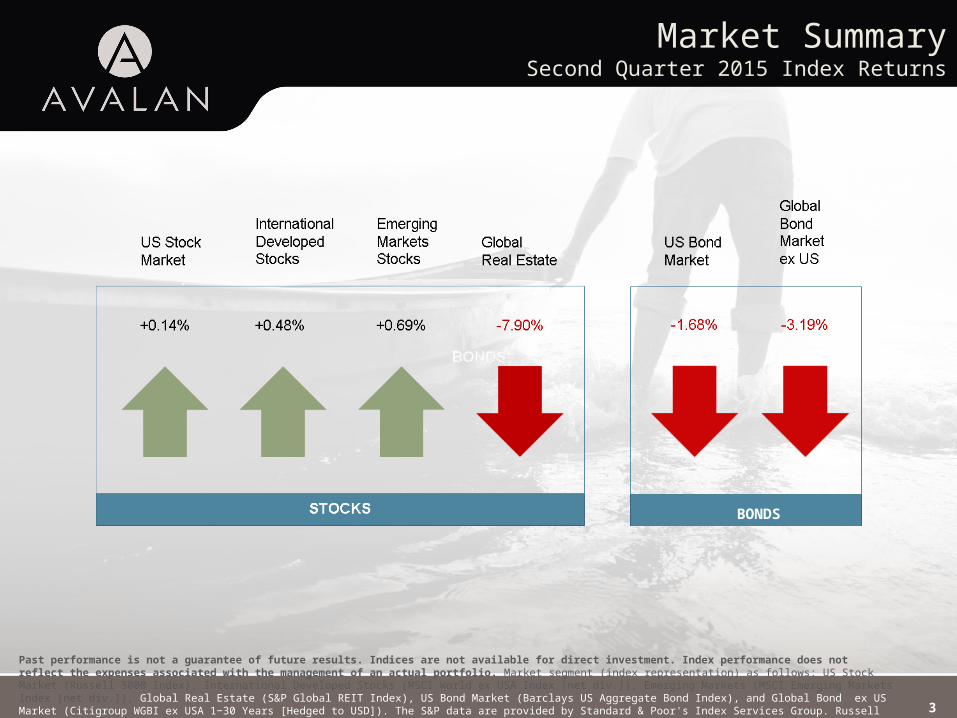
Market SummarySecond Quarter 2015 Index Returns
3
BONDS
Past performance is not a guarantee of future results. Indices are not available for direct investment. Index performance does not reflect the expenses associated with the management of an actual portfolio. Market segment (index representation) as follows: US Stock Market (Russell 3000 Index), International Developed Stocks (MSCI World ex USA Index [net div.]), Emerging Markets (MSCI Emerging Markets Index [net div.]), Global Real Estate (S&P Global REIT Index), US Bond Market (Barclays US Aggregate Bond Index), and Global Bond ex US Market (Citigroup WGBI ex USA 1−30 Years [Hedged to USD]). The S&P data are provided by Standard & Poor's Index Services Group. Russell data © Russell Investment Group 1995–2015, all rights reserved. MSCI data © MSCI 2015, all rights reserved. Barclays data provided by Barclays Bank PLC. Citigroup bond indices © 2014 by Citigroup.
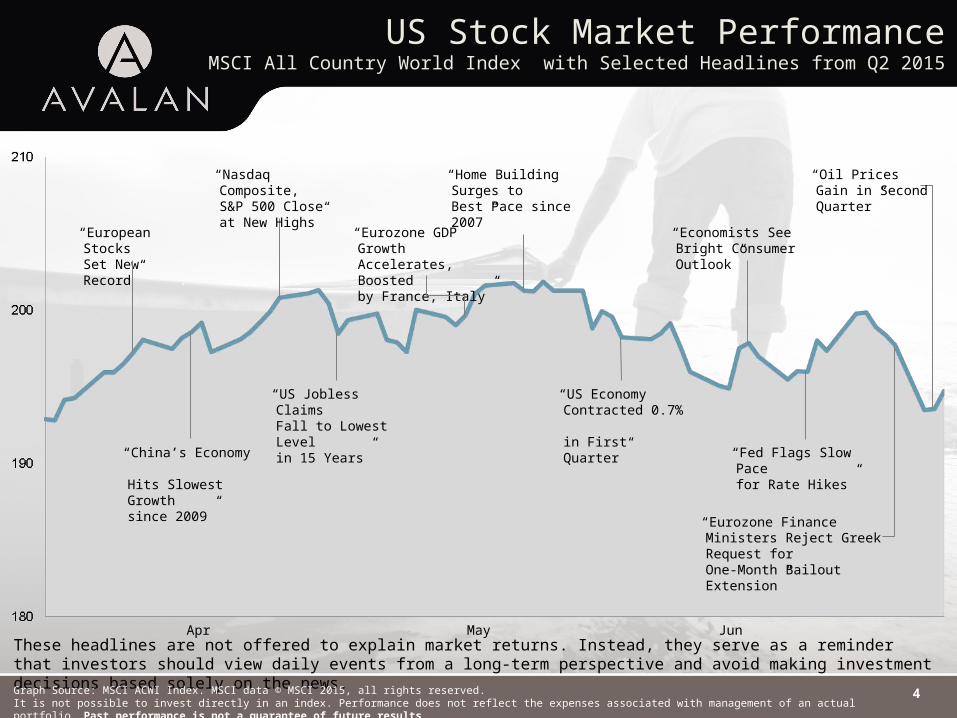
US Stock Market PerformanceMSCI All Country World Index with Selected Headlines from Q2 2015
S&P 500 Index
4
Apr May Jun
“European Stocks
Set New Record”
“Eurozone GDP Growth Accelerates, Boosted by France, Italy”
“Home Building Surges to
Best Pace since 2007”
“Economists See Bright Consumer Outlook”
“China’s Economy Hits Slowest Growth since 2009”
“Nasdaq Composite, S&P 500 Close at New Highs”
“Fed Flags Slow Pacefor Rate Hikes”
“Eurozone Finance Ministers Reject Greek Request for One-Month Bailout Extension”
“US Jobless Claims Fall to Lowest Level in 15 Years”
“US Economy Contracted 0.7% in First Quarter”
“Oil Prices Gain in Second Quarter”
These headlines are not offered to explain market returns. Instead, they serve as a reminder that investors should view daily events from a long-term perspective and avoid making investment decisions based solely on the news.
Graph Source: MSCI ACWI Index. MSCI data © MSCI 2015, all rights reserved.It is not possible to invest directly in an index. Performance does not reflect the expenses associated with management of an actual portfolio. Past performance is not a guarantee of future results.
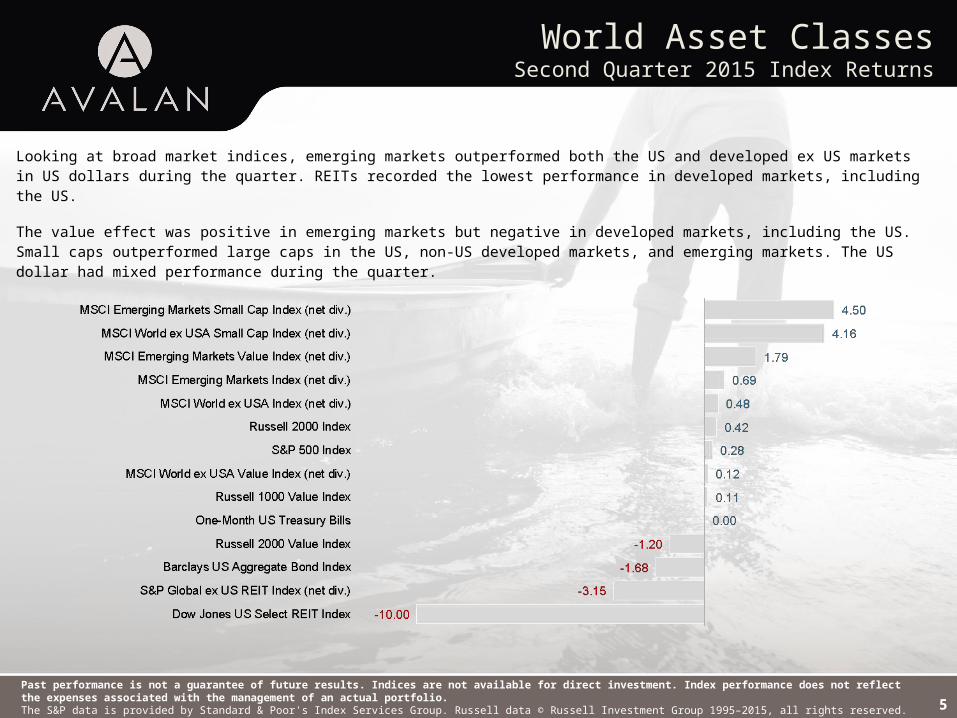
World Asset ClassesSecond Quarter 2015 Index Returns
5
Looking at broad market indices, emerging markets outperformed both the US and developed ex US markets in US dollars during the quarter. REITs recorded the lowest performance in developed markets, including the US.
The value effect was positive in emerging markets but negative in developed markets, including the US. Small caps outperformed large caps in the US, non-US developed markets, and emerging markets. The US dollar had mixed performance during the quarter.
Past performance is not a guarantee of future results. Indices are not available for direct investment. Index performance does not reflect the expenses associated with the management of an actual portfolio. The S&P data is provided by Standard & Poor's Index Services Group. Russell data © Russell Investment Group 1995–2015, all rights reserved. MSCI data © MSCI 2015, all rights reserved. Dow Jones data (formerly Dow Jones Wilshire) provided by Dow Jones Indexes. Barclays data provided by Barclays Bank PLC.
6
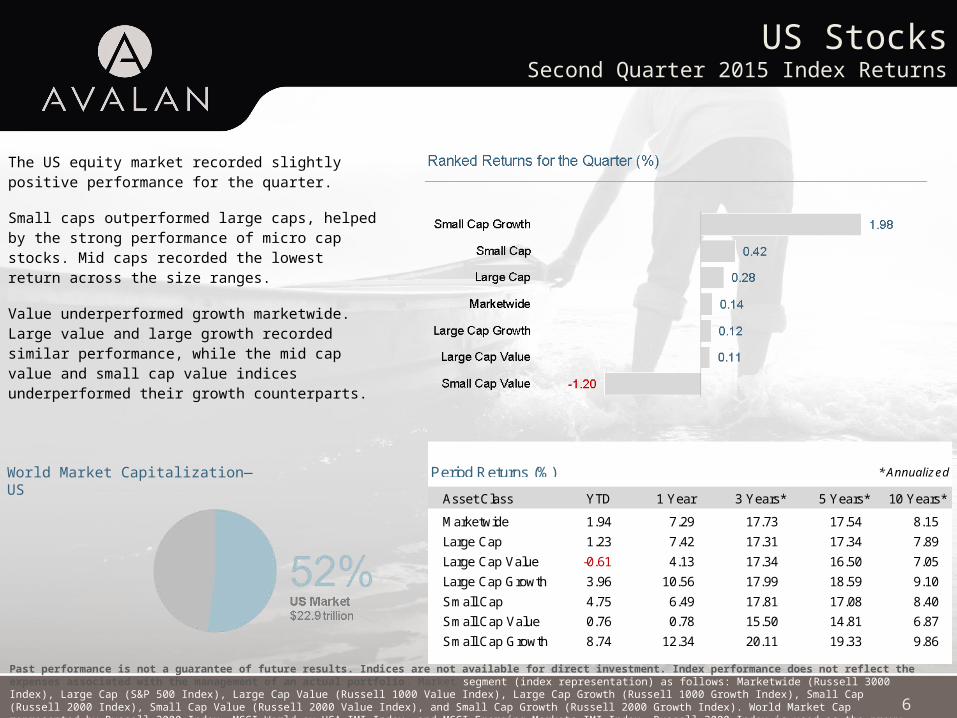
US StocksSecond Quarter 2015 Index Returns
The US equity market recorded slightly positive performance for the quarter.
Small caps outperformed large caps, helped by the strong performance of micro cap stocks. Mid caps recorded the lowest return across the size ranges.
Value underperformed growth marketwide. Large value and large growth recorded similar performance, while the mid cap value and small cap value indices underperformed their growth counterparts.
World Market Capitalization—US Period Returns (%) * Annualized
Asset Class YTD 1 Year 3 Years** 5 Years** 10 Years**
Marketwide 1.94 7.29 17.73 17.54 8.15
Large Cap 1.23 7.42 17.31 17.34 7.89
Large Cap Value -0.61 4.13 17.34 16.50 7.05
Large Cap Growth 3.96 10.56 17.99 18.59 9.10
Small Cap 4.75 6.49 17.81 17.08 8.40
Small Cap Value 0.76 0.78 15.50 14.81 6.87
Small Cap Growth 8.74 12.34 20.11 19.33 9.86
Past performance is not a guarantee of future results. Indices are not available for direct investment. Index performance does not reflect the expenses associated with the management of an actual portfolio . Market segment (index representation) as follows: Marketwide (Russell 3000 Index), Large Cap (S&P 500 Index), Large Cap Value (Russell 1000 Value Index), Large Cap Growth (Russell 1000 Growth Index), Small Cap (Russell 2000 Index), Small Cap Value (Russell 2000 Value Index), and Small Cap Growth (Russell 2000 Growth Index). World Market Cap represented by Russell 3000 Index, MSCI World ex USA IMI Index, and MSCI Emerging Markets IMI Index. Russell 3000 Index is used as the proxy for the US market. Russell data © Russell Investment Group 1995–2015, all rights reserved. The S&P data are provided by Standard & Poor's Index Services Group.
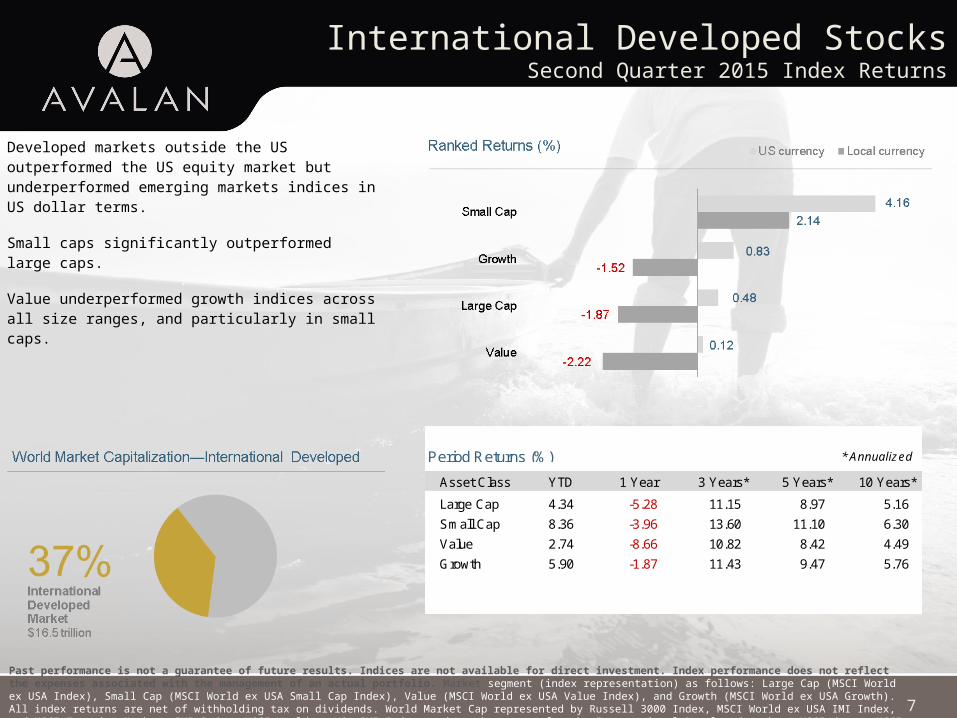
International Developed StocksSecond Quarter 2015 Index Returns
7
Developed markets outside the US outperformed the US equity market but underperformed emerging markets indices in US dollar terms.
Small caps significantly outperformed large caps.
Value underperformed growth indices across all size ranges, and particularly in small caps.
* Annualized
Asset Class YTD 1 Year 3 Years** 5 Years** 10 Years**
Large Cap 4.34 -5.28 11.15 8.97 5.16
Small Cap 8.36 -3.96 13.60 11.10 6.30
Value 2.74 -8.66 10.82 8.42 4.49
Growth 5.90 -1.87 11.43 9.47 5.76
Period Returns (%)
Past performance is not a guarantee of future results. Indices are not available for direct investment. Index performance does not reflect the expenses associated with the management of an actual portfolio. Market segment (index representation) as follows: Large Cap (MSCI World ex USA Index), Small Cap (MSCI World ex USA Small Cap Index), Value (MSCI World ex USA Value Index), and Growth (MSCI World ex USA Growth). All index returns are net of withholding tax on dividends. World Market Cap represented by Russell 3000 Index, MSCI World ex USA IMI Index, and MSCI Emerging Markets IMI Index. MSCI World ex USA IMI Index used as the proxy for the International Developed market. MSCI data © MSCI 2015, all rights reserved.
Emerging Markets StocksSecond Quarter 2015 Index Returns
8
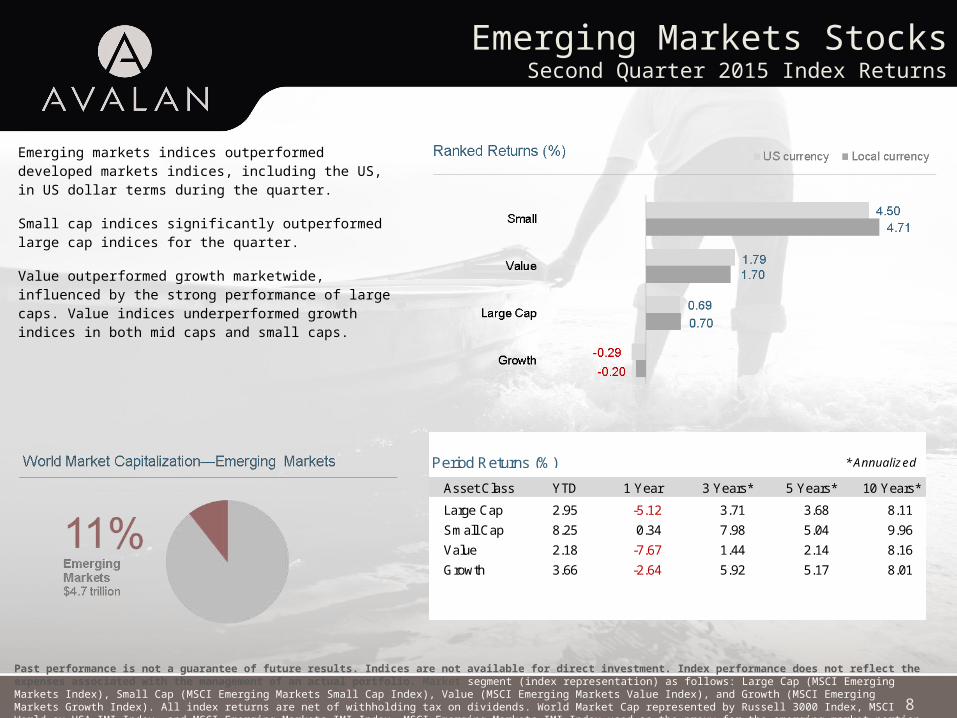
Emerging markets indices outperformed developed markets indices, including the US, in US dollar terms during the quarter.
Small cap indices significantly outperformed large cap indices for the quarter.
Value outperformed growth marketwide, influenced by the strong performance of large caps. Value indices underperformed growth indices in both mid caps and small caps.
* Annualized
Asset Class YTD 1 Year 3 Years** 5 Years** 10 Years**
Large Cap 2.95 -5.12 3.71 3.68 8.11
Small Cap 8.25 0.34 7.98 5.04 9.96
Value 2.18 -7.67 1.44 2.14 8.16
Growth 3.66 -2.64 5.92 5.17 8.01
Period Returns (%)
Past performance is not a guarantee of future results. Indices are not available for direct investment. Index performance does not reflect the expenses associated with the management of an actual portfolio. Market segment (index representation) as follows: Large Cap (MSCI Emerging Markets Index), Small Cap (MSCI Emerging Markets Small Cap Index), Value (MSCI Emerging Markets Value Index), and Growth (MSCI Emerging Markets Growth Index). All index returns are net of withholding tax on dividends. World Market Cap represented by Russell 3000 Index, MSCI World ex USA IMI Index, and MSCI Emerging Markets IMI Index. MSCI Emerging Markets IMI Index used as the proxy for the emerging market portion of the market. MSCI data © MSCI 2015, all rights reserved.
Select Country PerformanceSecond Quarter 2015 Index Returns
9
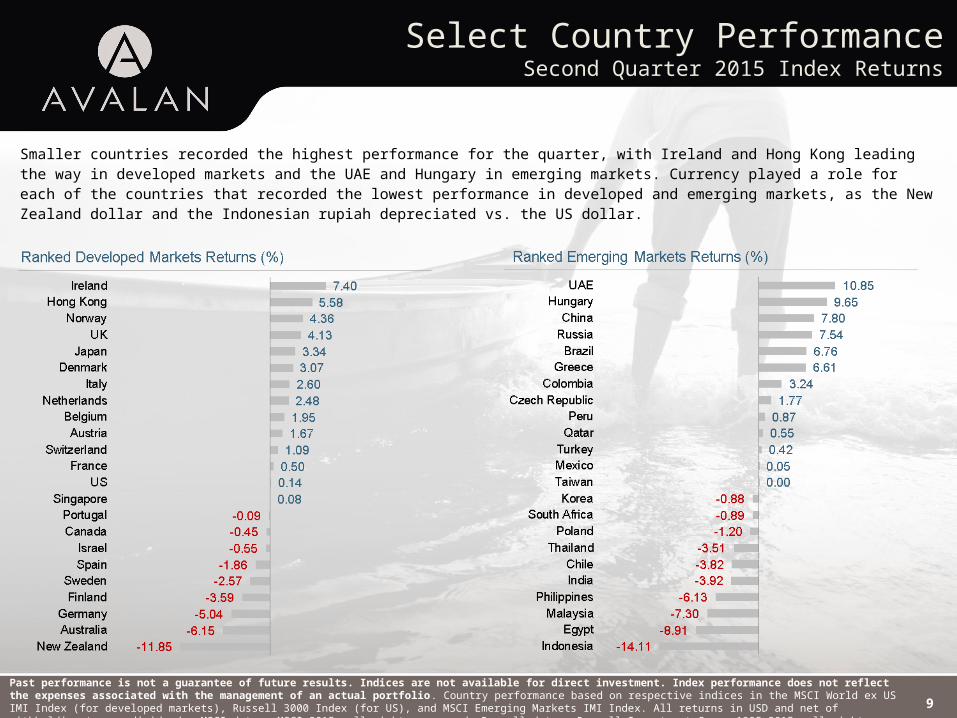
Smaller countries recorded the highest performance for the quarter, with Ireland and Hong Kong leading the way in developed markets and the UAE and Hungary in emerging markets. Currency played a role for each of the countries that recorded the lowest performance in developed and emerging markets, as the New Zealand dollar and the Indonesian rupiah depreciated vs. the US dollar.
Past performance is not a guarantee of future results. Indices are not available for direct investment. Index performance does not reflect the expenses associated with the management of an actual portfolio . Country performance based on respective indices in the MSCI World ex US IMI Index (for developed markets), Russell 3000 Index (for US), and MSCI Emerging Markets IMI Index. All returns in USD and net of withholding tax on dividends. MSCI data © MSCI 2015, all rights reserved. Russell data © Russell Investment Group 1995–2015, all rights reserved. UAE and Qatar have been reclassified as emerging markets by MSCI, effective May 2014
Real Estate Investment Trusts (REITs) Second Quarter 2015 Index Returns
10
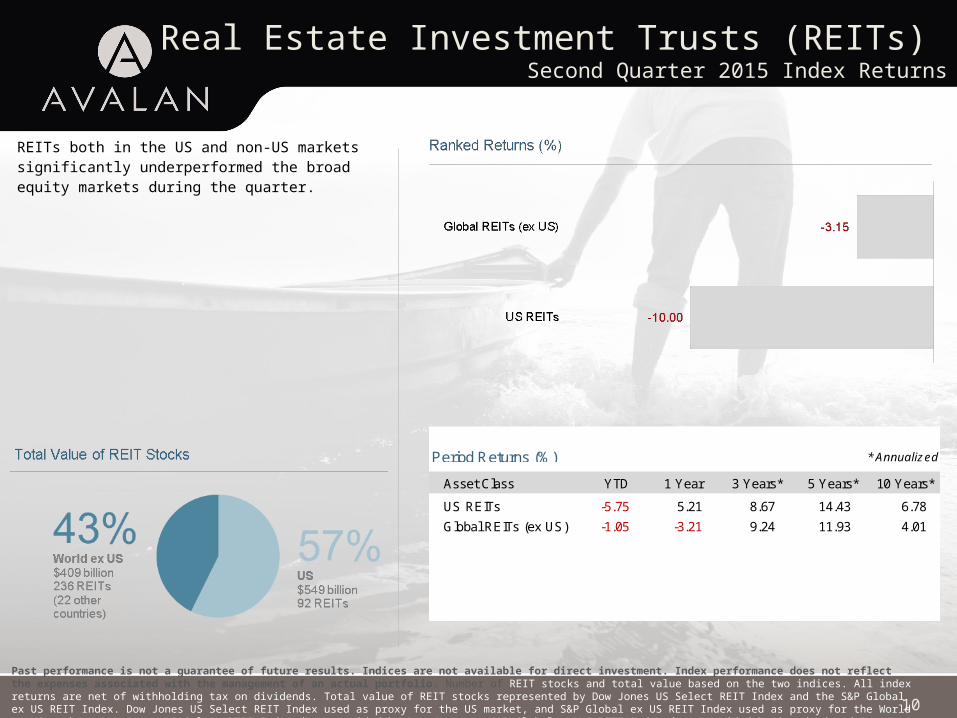
REITs both in the US and non-US markets significantly underperformed the broad equity markets during the quarter.
Period Returns (%) * Annualized
Asset Class YTD 1 Year 3 Years** 5 Years** 10 Years**
US REITs -5.75 5.21 8.67 14.43 6.78
Global REITs (ex US) -1.05 -3.21 9.24 11.93 4.01
Past performance is not a guarantee of future results. Indices are not available for direct investment. Index performance does not reflect the expenses associated with the management of an actual portfolio. Number of REIT stocks and total value based on the two indices. All index returns are net of withholding tax on dividends. Total value of REIT stocks represented by Dow Jones US Select REIT Index and the S&P Global ex US REIT Index. Dow Jones US Select REIT Index used as proxy for the US market, and S&P Global ex US REIT Index used as proxy for the World ex US market. Dow Jones US Select REIT Index data provided by Dow Jones ©. S&P Global ex US REIT Index data provided by Standard and Poor’s Index Services Group © 2014.
CommoditiesSecond Quarter 2015 Index Returns
11
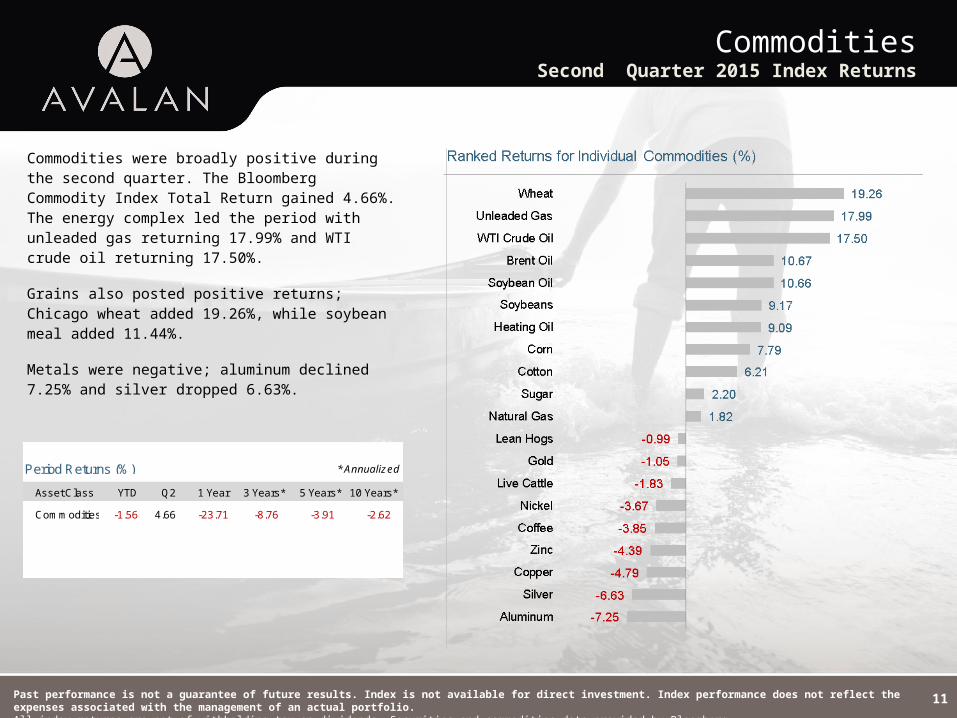
Commodities were broadly positive during the second quarter. The Bloomberg Commodity Index Total Return gained 4.66%. The energy complex led the period with unleaded gas returning 17.99% and WTI crude oil returning 17.50%.
Grains also posted positive returns; Chicago wheat added 19.26%, while soybean meal added 11.44%.
Metals were negative; aluminum declined 7.25% and silver dropped 6.63%.
Asset Class YTD Q2 1 Year 3 Years** 5 Years** 10 Years**
Commodities -1.56 4.66 -23.71 -8.76 -3.91 -2.62
Period Returns (%) * Annualized
Past performance is not a guarantee of future results. Index is not available for direct investment. Index performance does not reflect the expenses associated with the management of an actual portfolio. All index returns are net of withholding tax on dividends. Securities and commodities data provided by Bloomberg.
Fixed IncomeSecond Quarter 2015 Index Returns
12
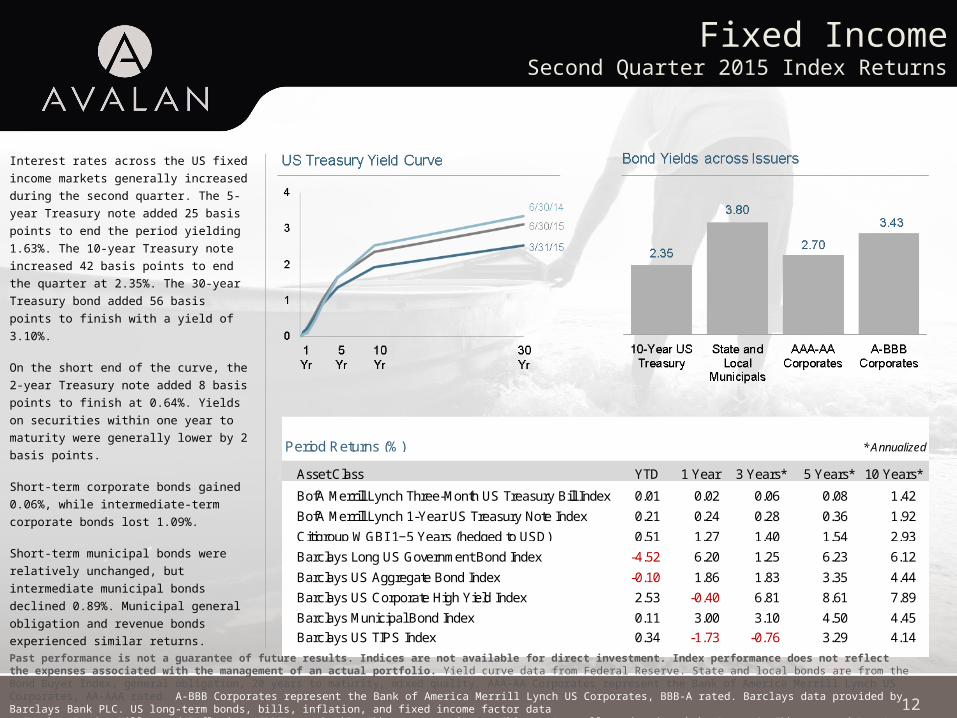
Interest rates across the US fixed income
markets generally increased during the
second quarter. The 5-year Treasury
note added 25 basis points to end the
period yielding 1.63%. The 10-year
Treasury note increased 42 basis points
to end the quarter at 2.35%. The 30-year
Treasury bond added 56 basis points to
finish with a yield of 3.10%.
On the short end of the curve, the 2-year
Treasury note added 8 basis points to
finish at 0.64%. Yields on securities
within one year to maturity were generally
lower by 2 basis points.
Short-term corporate bonds gained
0.06%, while intermediate-term corporate
bonds lost 1.09%.
Short-term municipal bonds were
relatively unchanged, but intermediate
municipal bonds declined 0.89%.
Municipal general obligation and revenue
bonds experienced similar returns.
Period Returns (%)
Asset Class YTD 1 Year 3 Years** 5 Years** 10 Years**
BofA Merrill Lynch Three-Month US Treasury Bill Index 0.01 0.02 0.06 0.08 1.42
BofA Merrill Lynch 1-Year US Treasury Note Index 0.21 0.24 0.28 0.36 1.92
Citigroup WGBI 1−5 Years (hedged to USD) 0.51 1.27 1.40 1.54 2.93
Barclays Long US Government Bond Index -4.52 6.20 1.25 6.23 6.12
Barclays US Aggregate Bond Index -0.10 1.86 1.83 3.35 4.44
Barclays US Corporate High Yield Index 2.53 -0.40 6.81 8.61 7.89
Barclays Municipal Bond Index 0.11 3.00 3.10 4.50 4.45
Barclays US TIPS Index 0.34 -1.73 -0.76 3.29 4.14
* Annualized
Past performance is not a guarantee of future results. Indices are not available for direct investment. Index performance does not reflect the expenses associated with the management of an actual portfolio. Yield curve data from Federal Reserve. State and local bonds are from the Bond Buyer Index, general obligation, 20 years to maturity, mixed quality. AAA-AA Corporates represent the Bank of America Merrill Lynch US Corporates, AA-AAA rated. A-BBB Corporates represent the Bank of America Merrill Lynch US Corporates, BBB-A rated. Barclays data provided by Barclays Bank PLC. US long-term bonds, bills, inflation, and fixed income factor data © Stocks, Bonds, Bills, and Inflation (SBBI) Yearbook™, Ibbotson Associates, Chicago (annually updated work by Roger G. Ibbotson and Rex A. Sinquefield). Citigroup bond indices © 2014 by Citigroup. The BofA Merrill Lynch Indices are used with permission; © 2014 Merrill Lynch, Pierce, Fenner & Smith Incorporated; all rights reserved. Merrill Lynch, Pierce, Fenner & Smith Incorporated is a wholly owned subsidiary of Bank of America Corporation.
Global DiversificationSecond Quarter 2015 Index Returns
13
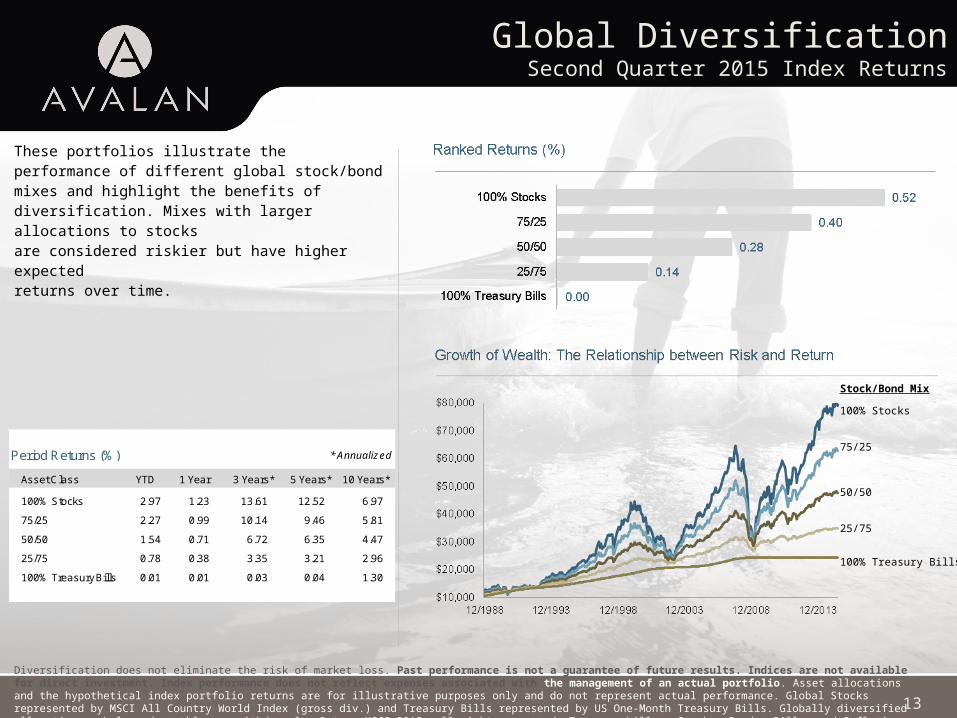
These portfolios illustrate the performance of different global stock/bond mixes and highlight the benefits of diversification. Mixes with larger allocations to stocks are considered riskier but have higher expected returns over time.
Asset Class YTD 1 Year 3 Years** 5 Years** 10 Years**
100% Stocks 2.97 1.23 13.61 12.52 6.97
75/25 2.27 0.99 10.14 9.46 5.81
50/50 1.54 0.71 6.72 6.35 4.47
25/75 0.78 0.38 3.35 3.21 2.96
100% Treasury Bills 0.01 0.01 0.03 0.04 1.30
* AnnualizedPeriod Returns (%)
Stock/Bond Mix
100% Stocks
75/25
50/50
25/75
100% Treasury Bills
Diversification does not eliminate the risk of market loss. Past performance is not a guarantee of future results. Indices are not available for direct investment. Index performance does not reflect expenses associated with the management of an actual portfolio. Asset allocations and the hypothetical index portfolio returns are for illustrative purposes only and do not represent actual performance. Global Stocks represented by MSCI All Country World Index (gross div.) and Treasury Bills represented by US One-Month Treasury Bills. Globally diversified allocations rebalanced monthly, no withdrawals. Data © MSCI 2015, all rights reserved. Treasury bills © Stocks, Bonds, Bills, and Inflation Yearbook™, Ibbotson Associates, Chicago (annually updated work by Roger G. Ibbotson and Rex A. Sinquefield).

The Seven Roles of an AdvisorSecond Quarter 2015
14Adapted from “The Seven Roles of an Advisor” by Jim Parker, Outside the Flags column, May 2015. Dimensional Fund Advisors LP ("Dimensional") is an investment advisor registered with the Securities and Exchange Commission. Diversification does not eliminate the risk of market loss. There is no guarantee investment strategies will be successful. Past performance is no guarantee of future results. All expressions of opinion are subject to change without notice in reaction to shifting market conditions. This content is provided for informational purposes, and it is not to be construed as an offer, solicitation, recommendation, or endorsement of any particular security, products, or services.