Embed Size (px)
Citation preview
Aon plcSecond Quarter 2015 Results July 31, 2015

1
Greg CaseChief Executive Officer
Christa DaviesChief Financial Officer
2
Safe Harbor StatementThis communication contains certain statements related to future results, or states our intentions, beliefs and expectations or predictions for the future which are forward-lookingstatements as that term is defined in the Private Securities Litigation Reform Act of 1995. These forward-looking statements are subject to certain risks and uncertainties that couldcause actual results to differ materially from either historical or anticipated results depending on a variety of factors. These forward-looking statements include information aboutpossible or assumed future results of our operations. All statements, other than statements of historical facts that address activities, events or developments that we expect oranticipate may occur in the future, including such things as our outlook, future capital expenditures, growth in commissions and fees, changes to the composition or level of ourrevenues, cash flow and liquidity, expected tax rates, business strategies, competitive strengths, goals, the benefits of new initiatives, growth of our business and operations, plansand references to future successes, are forward-looking statements. Also, when we use the words such as “anticipate”, “believe”, “estimate”, “expect”, “intend”, “plan”, “probably”,“looking forward”, or similar expressions, we are making forward-looking statements.
The following factors, among others, could cause actual results to differ from those set forth in the forward looking statements: general economic and political conditions in different countries in which Aon does business around the world; changes in the competitive environment; fluctuations in exchange and interest rates that could influence revenue and expense; changes in global equity and fixed income markets that could affect the return on invested assets; changes in the funding status of Aon's various defined benefit pension plans and the impact of any increased pension funding resulting from those changes; the level of Aon’s debt limiting financial flexibility; rating agency actions that could affect Aon's ability to borrow funds; the effect of the change in global headquarters and jurisdiction of incorporation, including differences in the anticipated benefits; changes in estimates or assumptions on our financial statements; limits on Aon’s subsidiaries to make dividend and other payments to Aon; the impact of law suits and other contingent liabilities and loss contingencies arising from errors and omissions and other claims against Aon; the impact of, and potential challenges in complying with, legislation and regulation in the jurisdictions in which Aon operates, particularly given the global scope of Aon’s businesses and the possibility of conflicting regulatory requirements across jurisdictions in which Aon does business; the impact of any investigations brought by regulatory authorities in the U.S., U.K. and other countries; the impact of any inquiries relating to compliance with the U.S. Foreign Corrupt Practices Act and non-U.S. anti-corruption laws and with U.S. and non-U.S. trade sanctions regimes; failure to protect intellectual property rights or allegations that we infringe on the intellectual property rights of others; the effects of English law on our operating flexibility and the enforcement of judgments against Aon; the failure to retain and attract qualified personnel; international risks associated with Aon’s global operations; the effect or natural or man-made disasters; the potential of a system or network breach or disruption resulting in operational interruption or improper disclosure of personal data; Aon’s ability to develop and implement new technology; the damage to our reputation among clients, markets or third parties; the actions taken by third parties that preform aspects of our business operations and client services; the extent to which Aon manages certain risks created in connection with the various services, including fiduciary and investments and other advisory services and business process outsourcing services, among others, that Aon currently provides, or will provide in the future, to clients; Aon’s ability to grow, develop and integrate companies that it acquires or new lines of business; changes in commercial property and casualty markets, commercial premium rates or methods of compensation; changes in the health care system or our relationships with insurance carriers; Aon’s ability to implement initiatives intended to yield cost savings, and the ability to achieve those cost savings.
Further information concerning Aon and its business, including factors that potentially could materially affect Aon's financial results, is contained in Aon's filings with the SEC. SeeAon’s Annual Report on Form 10-K and its Quarterly Reports on Form 10-Q for a further discussion of these and other risks and uncertainties applicable to Aon’s businesses. Aondoes not undertake, and expressly disclaims, any duty to update any forward-looking statement whether as a result of new information, future events or changes in their respectiveexpectations, except as required by law.
Explanation of Non-GAAP MeasuresThis communication includes supplemental information related to organic revenue, free cash flow, adjusted operating margin, adjusted earnings per share, and adjusted effective taxrate that exclude the effects of restructuring charges, intangible asset amortization, capital expenditures, transaction and integration costs and certain other noteworthy items thataffected results for the comparable periods. Organic revenue excludes from reported revenues the impact of foreign exchange, acquisitions, divestitures, transfers between businessunits, reimbursable expenses and unusual items. The impact of foreign exchange is determined by translating last year's revenue, expense or net income at this year's foreignexchange rates. Reconciliations are provided in the attached schedules. Supplemental organic revenue information and additional measures that exclude the effects of therestructuring charges and certain other items do not affect net income or any other GAAP reported amounts. Free cash flow is cash flow from operating activity less capitalexpenditures. The effective tax rate, as adjusted, excludes the applicable tax impact associated with expenses for legacy litigation. Management believes that these measures areimportant to make meaningful period-to-period comparisons and that this supplemental information is helpful to investors. They should be viewed in addition to, not in lieu of, theCompany’s Consolidated Financial Statements. Industry peers provide similar supplemental information regarding their performance, although they may not make identicaladjustments.
3
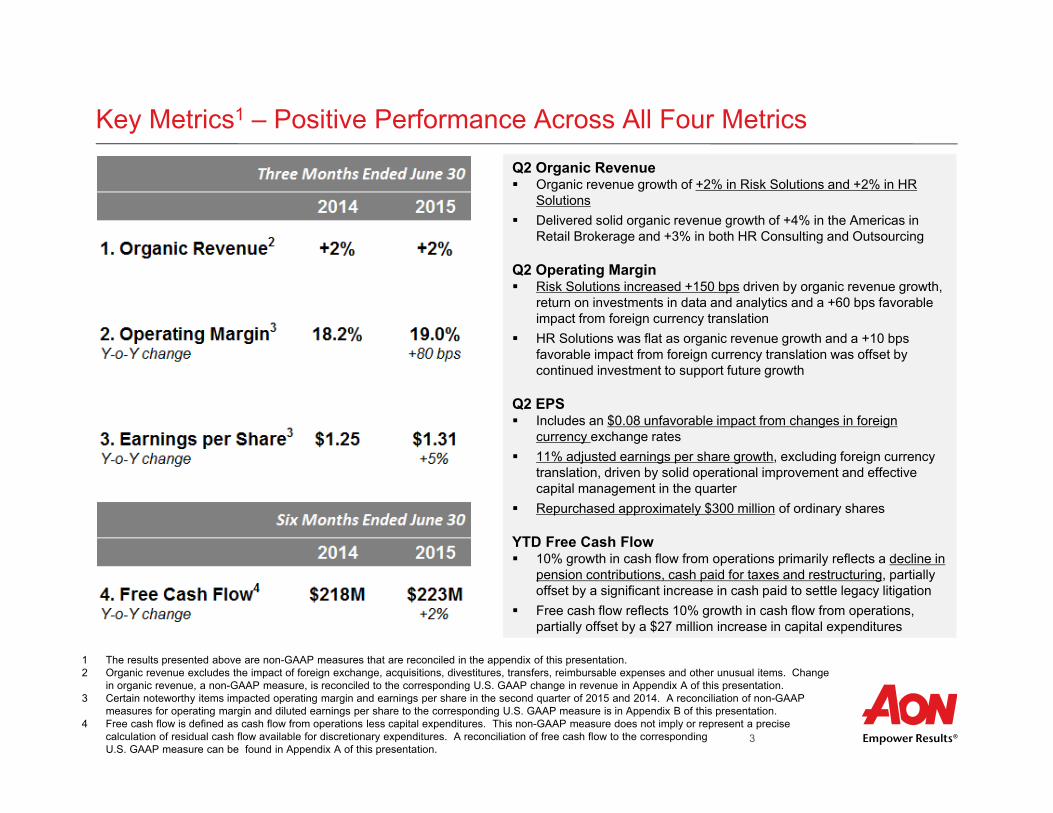
Key Metrics1 – Positive Performance Across All Four Metrics
Q2 Organic Revenue Organic revenue growth of +2% in Risk Solutions and +2% in HR
Solutions Delivered solid organic revenue growth of +4% in the Americas in
Retail Brokerage and +3% in both HR Consulting and Outsourcing
Q2 Operating Margin Risk Solutions increased +150 bps driven by organic revenue growth,
return on investments in data and analytics and a +60 bps favorable impact from foreign currency translation
HR Solutions was flat as organic revenue growth and a +10 bps favorable impact from foreign currency translation was offset by continued investment to support future growth
Q2 EPS Includes an $0.08 unfavorable impact from changes in foreign
currency exchange rates 11% adjusted earnings per share growth, excluding foreign currency
translation, driven by solid operational improvement and effective capital management in the quarter
Repurchased approximately $300 million of ordinary shares
YTD Free Cash Flow 10% growth in cash flow from operations primarily reflects a decline in
pension contributions, cash paid for taxes and restructuring, partially offset by a significant increase in cash paid to settle legacy litigation
Free cash flow reflects 10% growth in cash flow from operations, partially offset by a $27 million increase in capital expenditures
1 The results presented above are non-GAAP measures that are reconciled in the appendix of this presentation. 2 Organic revenue excludes the impact of foreign exchange, acquisitions, divestitures, transfers, reimbursable expenses and other unusual items. Change
in organic revenue, a non-GAAP measure, is reconciled to the corresponding U.S. GAAP change in revenue in Appendix A of this presentation.3 Certain noteworthy items impacted operating margin and earnings per share in the second quarter of 2015 and 2014. A reconciliation of non-GAAP
measures for operating margin and diluted earnings per share to the corresponding U.S. GAAP measure is in Appendix B of this presentation.4 Free cash flow is defined as cash flow from operations less capital expenditures. This non-GAAP measure does not imply or represent a precise
calculation of residual cash flow available for discretionary expenditures. A reconciliation of free cash flow to the corresponding U.S. GAAP measure can be found in Appendix A of this presentation.
4
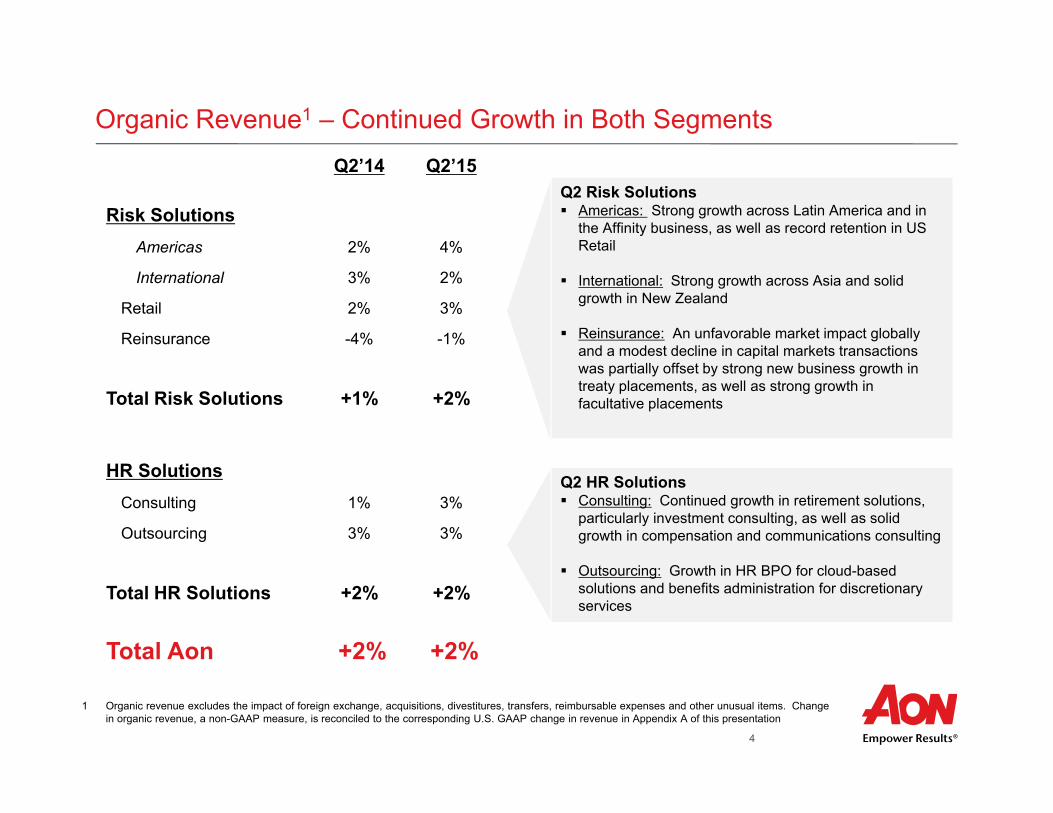
Organic Revenue1 – Continued Growth in Both Segments
Q2 Risk Solutions Americas: Strong growth across Latin America and in
the Affinity business, as well as record retention in US Retail
International: Strong growth across Asia and solid growth in New Zealand
Reinsurance: An unfavorable market impact globally and a modest decline in capital markets transactions was partially offset by strong new business growth in treaty placements, as well as strong growth in facultative placements
Q2’14 Q2’15
Risk SolutionsAmericas 2% 4%
International 3% 2%
Retail 2% 3%
Reinsurance -4% -1%
Total Risk Solutions +1% +2%
HR SolutionsConsulting 1% 3%
Outsourcing 3% 3%
Total HR Solutions +2% +2%
Total Aon +2% +2%
Q2 HR Solutions Consulting: Continued growth in retirement solutions,
particularly investment consulting, as well as solid growth in compensation and communications consulting
Outsourcing: Growth in HR BPO for cloud-based solutions and benefits administration for discretionary services
1 Organic revenue excludes the impact of foreign exchange, acquisitions, divestitures, transfers, reimbursable expenses and other unusual items. Change in organic revenue, a non-GAAP measure, is reconciled to the corresponding U.S. GAAP change in revenue in Appendix A of this presentation

5
Investing in the Business to Position the Firm for Long-Term Growth“Aon has a truly impressive track record of developing innovative solutions to help solve problems and create differentiated valuein response to specific client needs. Solid long-term operating performance, combined with expense discipline and strong cashflow, continues to enable substantial investments that position the firm for long-term growth.”
Risk Solutions HR Solutions Roll-out of the Revenue Engine internationally and Aon
Client Promise firm-wide to drive greater retention and rollover rates
Global Risk Insight Platform (GRIP), which is the world’s leading global repository of risk and insurance placement information providing insight into $135 billion of global premium flow
Aon Broking initiative to better match client needs with insurer appetite for risk and to identify structured portfolio solutions
Further development of data and analytics capability at Aon Benfield to strengthen our already industry-leading value proposition and client serving capability
Aligning our global health and benefits platform to capitalize on our global distribution channel and deep brokerage capabilities in a high growth area
Expansion of content and global footprint through tuck-in acquisitions that increase scale in emerging markets or expand capability to better serve clients
Focusing on innovative solutions to de-risk pension plans and support increasing needs for delegated investment and defined-contribution solutions to fulfill clients’ needs for effective execution of their investment and retirement benefit strategies
Providing the broadest set of health, retirement and talent advisory, technology and advocacy solutions to our clients’ employees and retirees to enable greater transparency, choice and informed decision-making
Expanding our industry-leading suite of private health care exchange solutions for active employees and retirees; enabling clients to transition their participants to a market-based, defined contribution model for healthcare, while addressing unsustainable healthcare cost increases and decreasing population health
Further development of our industry-leading benefits and HR operations solutions and consumer technology platforms, including extensive mobile solutions and cloud-based outsourcing solutions
Expansion of our international footprint to support a global workforce, with investments in key talent and capabilities across emerging markets
6
$376 $375
Net Income
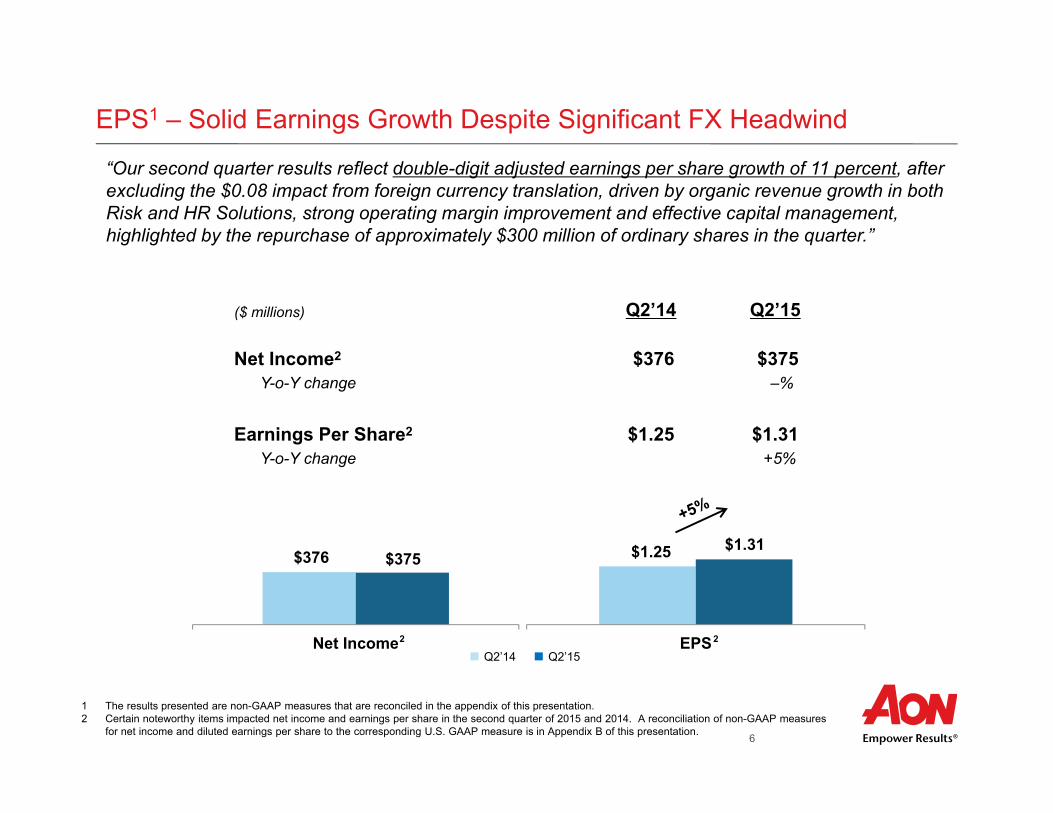
EPS1 – Solid Earnings Growth Despite Significant FX Headwind
($ millions) Q2’14 Q2’15
Net Income2 $376 $375Y-o-Y change –%
Earnings Per Share2 $1.25 $1.31Y-o-Y change +5%
1 The results presented are non-GAAP measures that are reconciled in the appendix of this presentation.2 Certain noteworthy items impacted net income and earnings per share in the second quarter of 2015 and 2014. A reconciliation of non-GAAP measures
for net income and diluted earnings per share to the corresponding U.S. GAAP measure is in Appendix B of this presentation.
$1.25 $1.31
EPSQ2’14 Q2’15
“Our second quarter results reflect double-digit adjusted earnings per share growth of 11 percent, after excluding the $0.08 impact from foreign currency translation, driven by organic revenue growth in both Risk and HR Solutions, strong operating margin improvement and effective capital management, highlighted by the repurchase of approximately $300 million of ordinary shares in the quarter.”
2 2
7
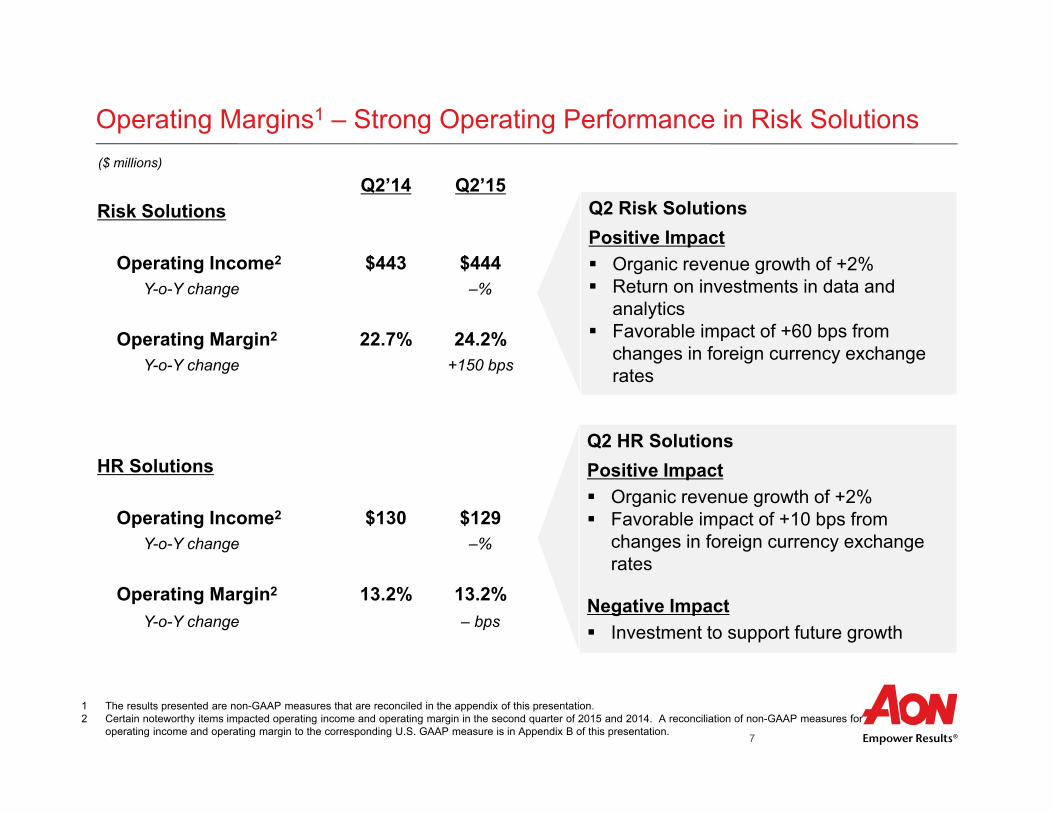
Operating Margins1 – Strong Operating Performance in Risk Solutions
Q2 Risk SolutionsPositive Impact Organic revenue growth of +2% Return on investments in data and
analytics Favorable impact of +60 bps from
changes in foreign currency exchange rates
Q2’14 Q2’15Risk Solutions
Operating Income2 $443 $444Y-o-Y change –%
Operating Margin2 22.7% 24.2%Y-o-Y change +150 bps
HR Solutions
Operating Income2 $130 $129Y-o-Y change –%
Operating Margin2 13.2% 13.2%Y-o-Y change – bps
Q2 HR SolutionsPositive Impact Organic revenue growth of +2% Favorable impact of +10 bps from
changes in foreign currency exchange rates
Negative Impact Investment to support future growth
($ millions)
1 The results presented are non-GAAP measures that are reconciled in the appendix of this presentation. 2 Certain noteworthy items impacted operating income and operating margin in the second quarter of 2015 and 2014. A reconciliation of non-GAAP measures for
operating income and operating margin to the corresponding U.S. GAAP measure is in Appendix B of this presentation.
8
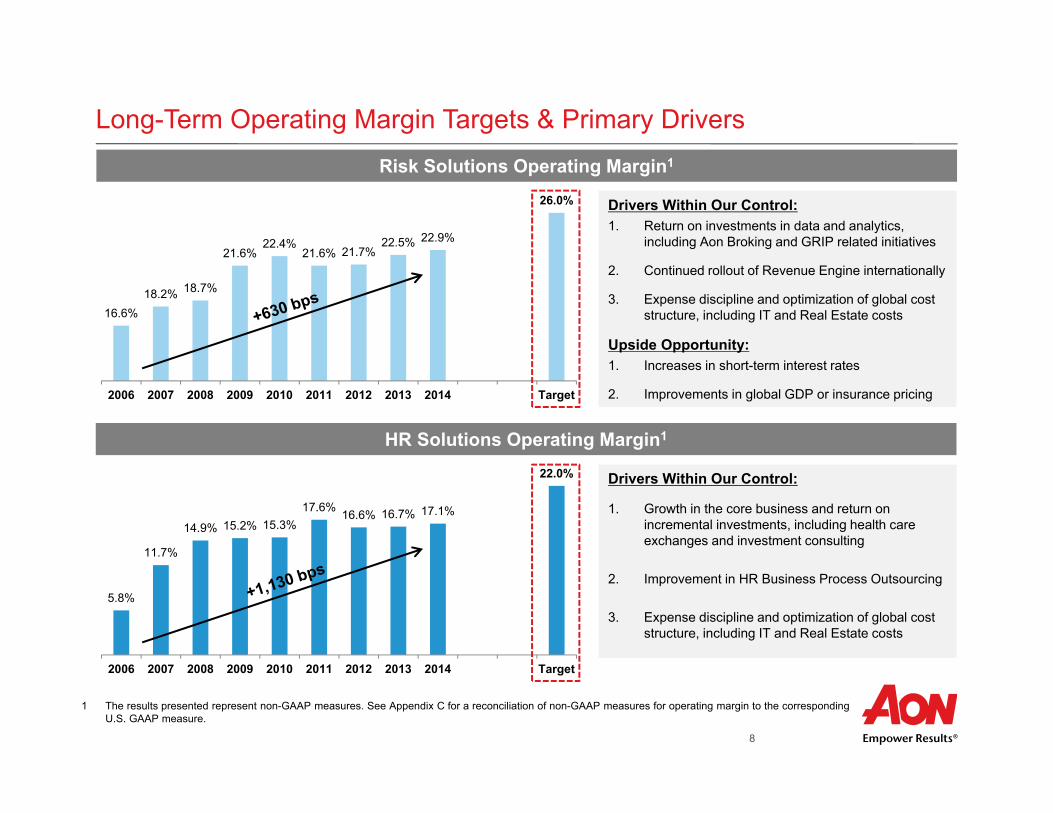
Long-Term Operating Margin Targets & Primary DriversRisk Solutions Operating Margin1
HR Solutions Operating Margin1
16.6%18.2% 18.7%
21.6%22.4%
21.6% 21.7%22.5% 22.9%
26.0%
2006 2007 2008 2009 2010 2011 2012 2013 2014 Target
Drivers Within Our Control:1. Return on investments in data and analytics,
including Aon Broking and GRIP related initiatives
2. Continued rollout of Revenue Engine internationally
3. Expense discipline and optimization of global cost structure, including IT and Real Estate costs
Upside Opportunity:1. Increases in short-term interest rates
2. Improvements in global GDP or insurance pricing
5.8%
11.7%
14.9% 15.2% 15.3%17.6% 16.6% 16.7% 17.1%
22.0%
2006 2007 2008 2009 2010 2011 2012 2013 2014 Target
Drivers Within Our Control:
1. Growth in the core business and return on incremental investments, including health care exchanges and investment consulting
2. Improvement in HR Business Process Outsourcing
3. Expense discipline and optimization of global cost structure, including IT and Real Estate costs
1 The results presented represent non-GAAP measures. See Appendix C for a reconciliation of non-GAAP measures for operating margin to the corresponding U.S. GAAP measure.

9
Unallocated Expenses & Non-Operating Segment Financials
Q2’14 Q2’15QuarterlyGuidance
Unallocated Expenses ($41) ($41) ($45)
Interest Income $2 $4 $2
Interest Expense ($65) ($68) ($72)
Other Income (Expense) ($2) $1 -
Effective Tax Rate1 17.5% 18.0% -
Minority interest ($9) ($10) ($9)
Actual common sharesoutstanding at 6-30-15 N/A 279.8 -
Interest expense increased $3 million due to an increase in total debt outstanding. Interest expense is expected to increase to $72 million in Q3 due to the overlap of $600 million of notes placed in May for notes due in September. The expected run rate is approximately $68 million per quarter thereafter
Adjusted effective tax rate, excluding the applicable tax impact associated with expenses related to legacy litigation, was 18.0% compared to 17.5% in the prior year quarter
Actual common shares outstanding on June 30th were 279.8 million, and there were approximately 7 million additional dilutive equivalents. The Company repurchased 3 million ordinary shares for approximately $300 million in the first quarter. Estimated Q3’15 beginning dilutive share count is ~287 million subject to share price movement, share issuance and share repurchase
($ millions)
1 The effective tax rates used in the U.S. GAAP financial statements were 12.2% and 17.5% for the three months ended June 30, 2015 and 2014, respectively, and 16.8% and 18.3% for the six months ended June 30, 2015 and 2014, respectively. Reconciling items are generally taxed at the effective tax rate. However, after adjusting to exclude the applicable tax impact associated with expenses for legacy litigation, the adjusted effective tax rates for the second quarter and first six months of 2015 were 18.0% and 18.6%, respectively
10
YTD 2014 YTD 2015
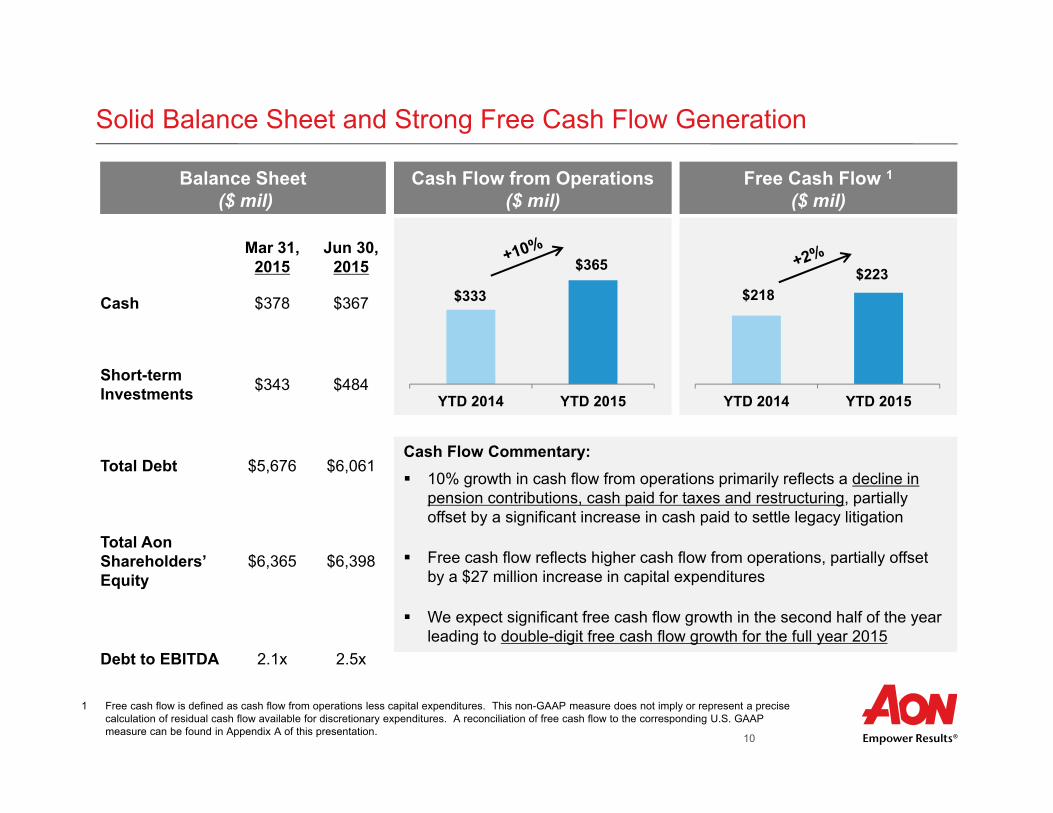
$333
$365
Solid Balance Sheet and Strong Free Cash Flow Generation
Mar 31,2015
Jun 30,2015
Cash $378 $367
Short-termInvestments $343 $484
Total Debt $5,676 $6,061
Total Aon Shareholders’ Equity
$6,365 $6,398
Debt to EBITDA 2.1x 2.5x
Balance Sheet($ mil)
1 Free cash flow is defined as cash flow from operations less capital expenditures. This non-GAAP measure does not imply or represent a precise calculation of residual cash flow available for discretionary expenditures. A reconciliation of free cash flow to the corresponding U.S. GAAP measure can be found in Appendix A of this presentation.
Cash Flow from Operations($ mil)
Free Cash Flow 1($ mil)
Cash Flow Commentary: 10% growth in cash flow from operations primarily reflects a decline in
pension contributions, cash paid for taxes and restructuring, partially offset by a significant increase in cash paid to settle legacy litigation
Free cash flow reflects higher cash flow from operations, partially offset by a $27 million increase in capital expenditures
We expect significant free cash flow growth in the second half of the year leading to double-digit free cash flow growth for the full year 2015
YTD 2014 YTD 2015
$218$223
11
$256 $270 $245 $252
$316$220 $212 $160
$82
$33$19
$12
2014 2015e 2016e 2017eCapital Expenditures Pension Contributions Restructuring - Cash
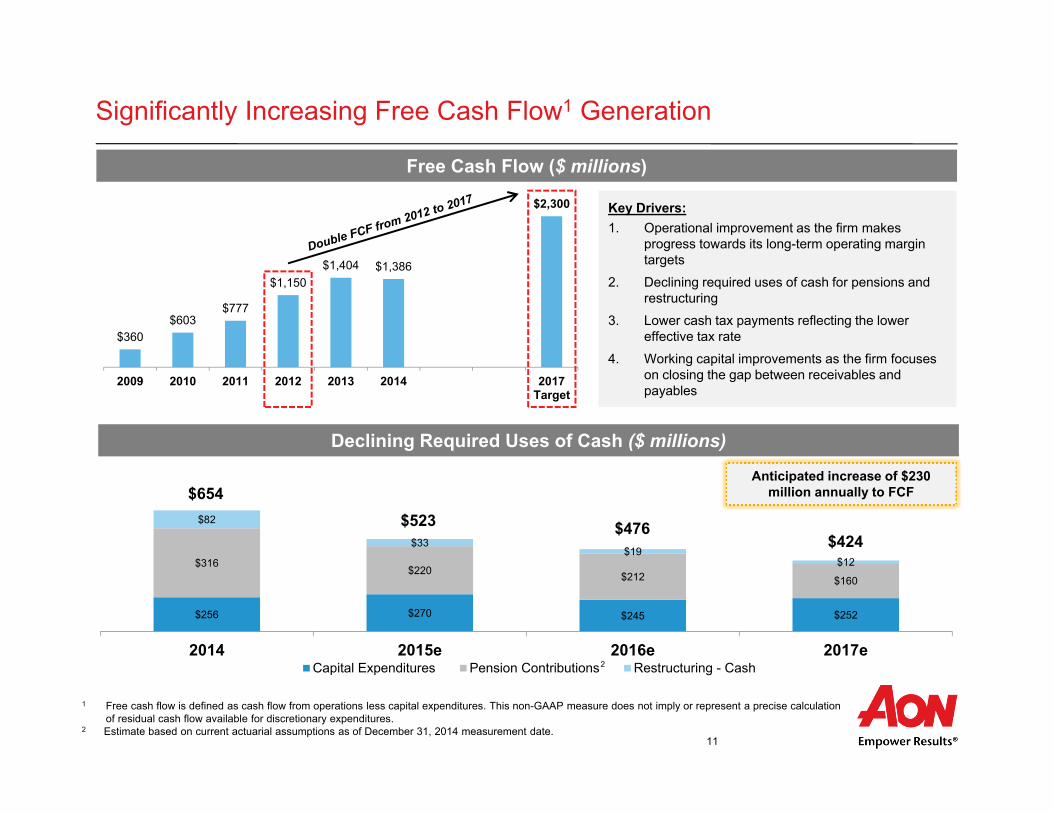
Significantly Increasing Free Cash Flow1 Generation
Declining Required Uses of Cash ($ millions)
$654$523 $476
$424
1 Free cash flow is defined as cash flow from operations less capital expenditures. This non-GAAP measure does not imply or represent a precise calculation of residual cash flow available for discretionary expenditures.
2 Estimate based on current actuarial assumptions as of December 31, 2014 measurement date.
Free Cash Flow ($ millions)
$360$603
$777
$1,150$1,404 $1,386
$2,300
2009 2010 2011 2012 2013 2014 2017Target
Key Drivers:1. Operational improvement as the firm makes
progress towards its long-term operating margin targets
2. Declining required uses of cash for pensions and restructuring
3. Lower cash tax payments reflecting the lower effective tax rate
4. Working capital improvements as the firm focuses on closing the gap between receivables and payables
Anticipated increase of $230 million annually to FCF
2

12
Summary – Continued Long-Term Value Creation
Positioned for sustainable long-term growth in both Risk Solutions and HR Solutions
Significant leverage to an improving global economy, interest rates and insurance pricing
Investing in colleagues and capabilities around the globe to better serve clients
Opportunity for long-term operating margin improvement with increased operating leverage in the business
Strong balance sheet with opportunity for additional leverage while maintaining current credit ratings
Positioned to significantly increase free cash flow generation going forward
Increased financial flexibility and effective capital allocation is expected to drive significant shareholder value

13
Appendix
14
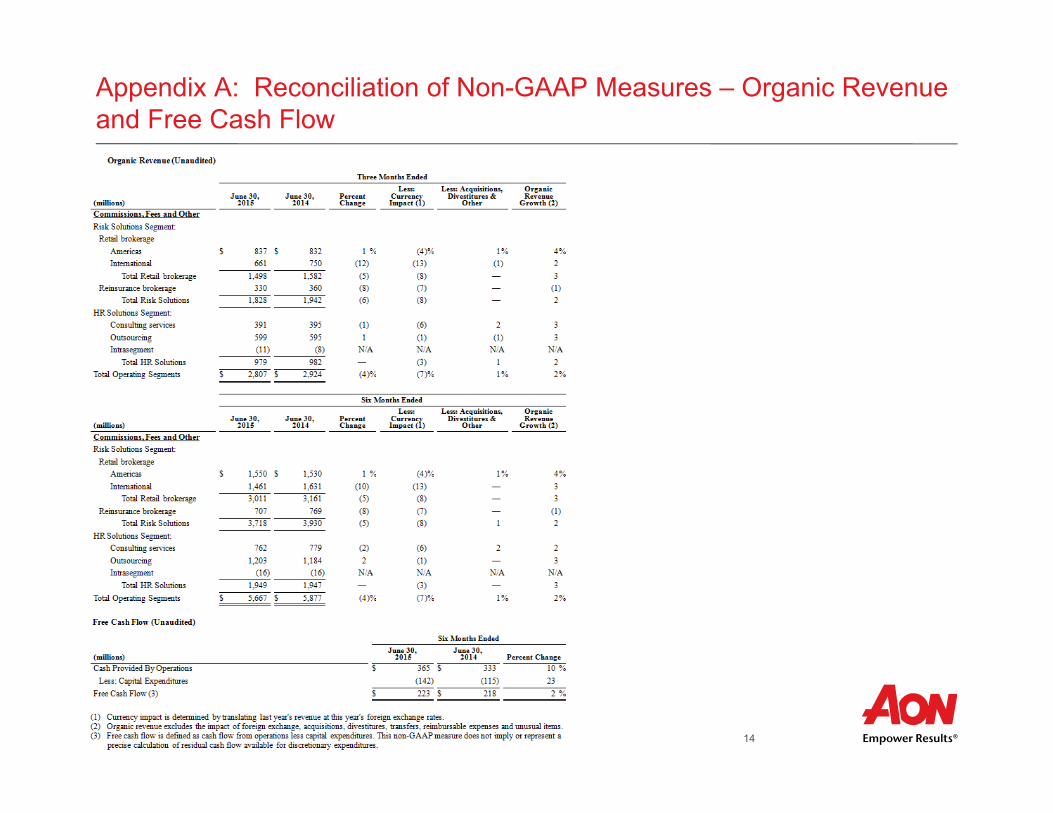
Appendix A: Reconciliation of Non-GAAP Measures – Organic Revenue and Free Cash Flow

15
Appendix B: Reconciliation of Non-GAAP Measures – Operating Margin and Diluted Earnings per Share
16
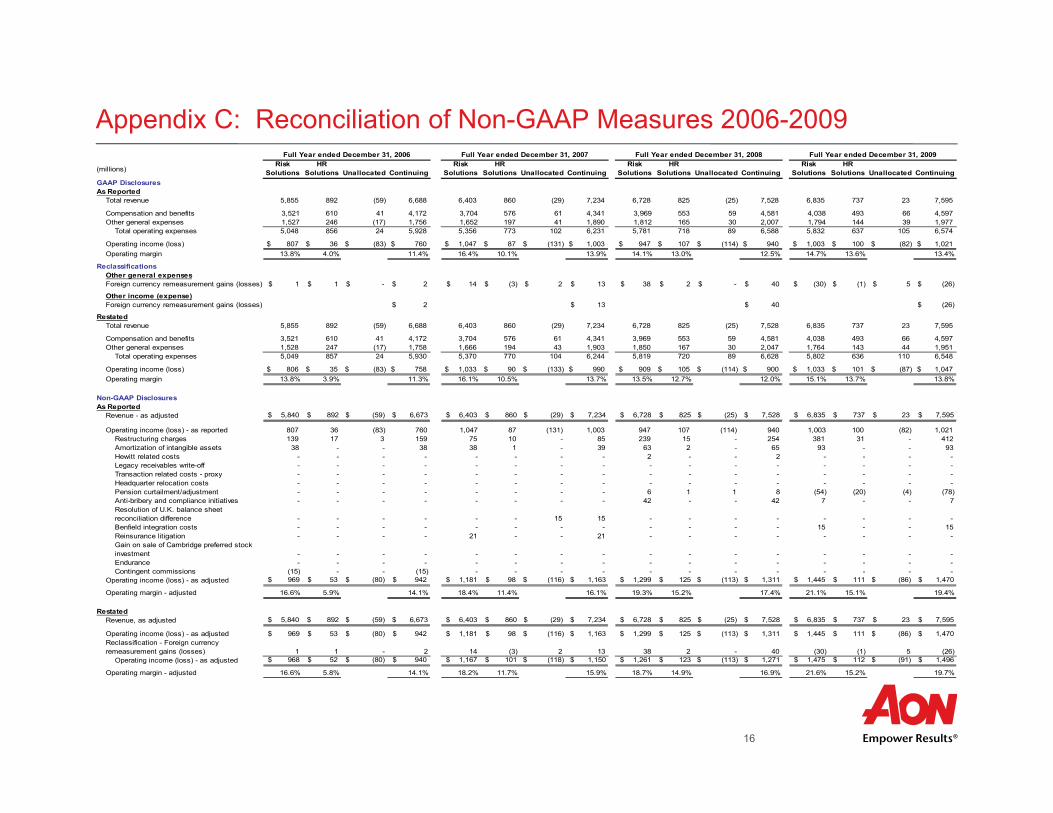
Appendix C: Reconciliation of Non-GAAP Measures 2006-2009Full Year ended December 31, 2006 Full Year ended December 31, 2007 Full Year ended December 31, 2008 Full Year ended December 31, 2009
(millions)Risk
SolutionsHR
Solutions Unallocated ContinuingRisk
SolutionsHR
Solutions Unallocated ContinuingRisk
SolutionsHR
Solutions Unallocated ContinuingRisk
SolutionsHR
Solutions Unallocated ContinuingGAAP DisclosuresAs Reported
Total revenue 5,855 892 (59) 6,688 6,403 860 (29) 7,234 6,728 825 (25) 7,528 6,835 737 23 7,595
Compensation and benefits 3,521 610 41 4,172 3,704 576 61 4,341 3,969 553 59 4,581 4,038 493 66 4,597 Other general expenses 1,527 246 (17) 1,756 1,652 197 41 1,890 1,812 165 30 2,007 1,794 144 39 1,977
Total operating expenses 5,048 856 24 5,928 5,356 773 102 6,231 5,781 718 89 6,588 5,832 637 105 6,574
Operating income (loss) 807$ 36$ (83)$ 760$ 1,047$ 87$ (131)$ 1,003$ 947$ 107$ (114)$ 940$ 1,003$ 100$ (82)$ 1,021$ Operating margin 13.8% 4.0% 11.4% 16.4% 10.1% 13.9% 14.1% 13.0% 12.5% 14.7% 13.6% 13.4%
ReclassificationsOther general expensesForeign currency remeasurement gains (losses) $ 1 $ 1 $ - $ 2 $ 14 $ (3) $ 2 $ 13 $ 38 $ 2 $ - $ 40 $ (30) $ (1) $ 5 $ (26)
Other income (expense)Foreign currency remeasurement gains (losses) $ 2 $ 13 $ 40 $ (26)
RestatedTotal revenue 5,855 892 (59) 6,688 6,403 860 (29) 7,234 6,728 825 (25) 7,528 6,835 737 23 7,595
Compensation and benefits 3,521 610 41 4,172 3,704 576 61 4,341 3,969 553 59 4,581 4,038 493 66 4,597 Other general expenses 1,528 247 (17) 1,758 1,666 194 43 1,903 1,850 167 30 2,047 1,764 143 44 1,951
Total operating expenses 5,049 857 24 5,930 5,370 770 104 6,244 5,819 720 89 6,628 5,802 636 110 6,548
Operating income (loss) 806$ 35$ (83)$ 758$ 1,033$ 90$ (133)$ 990$ 909$ 105$ (114)$ 900$ 1,033$ 101$ (87)$ 1,047$ Operating margin 13.8% 3.9% 11.3% 16.1% 10.5% 13.7% 13.5% 12.7% 12.0% 15.1% 13.7% 13.8%
Non-GAAP DisclosuresAs Reported
Revenue - as adjusted $ 5,840 $ 892 $ (59) $ 6,673 $ 6,403 $ 860 $ (29) $ 7,234 $ 6,728 $ 825 $ (25) $ 7,528 $ 6,835 $ 737 $ 23 $ 7,595
Operating income (loss) - as reported 807 36 (83) 760 1,047 87 (131) 1,003 947 107 (114) 940 1,003 100 (82) 1,021 Restructuring charges 139 17 3 159 75 10 - 85 239 15 - 254 381 31 - 412 Amortization of intangible assets 38 - - 38 38 1 - 39 63 2 - 65 93 - - 93 Hewitt related costs - - - - - - - - 2 - - 2 - - - - Legacy receivables write-off - - - - - - - - - - - - - - - - Transaction related costs - proxy - - - - - - - - - - - - - - - - Headquarter relocation costs - - - - - - - - - - - - - - - - Pension curtailment/adjustment - - - - - - - - 6 1 1 8 (54) (20) (4) (78)Anti-bribery and compliance initiatives - - - - - - - - 42 - - 42 7 - - 7 Resolution of U.K. balance sheet reconciliation difference - - - - - - 15 15 - - - - - - - - Benfield integration costs - - - - - - - - - - - - 15 - - 15 Reinsurance litigation - - - - 21 - - 21 - - - - - - - - Gain on sale of Cambridge preferred stock investment - - - - - - - - - - - - - - - - Endurance - - - - - - - - - - - - - - - - Contingent commissions (15) - - (15) - - - - - - - - - - - -
Operating income (loss) - as adjusted $ 969 $ 53 $ (80) $ 942 $ 1,181 $ 98 $ (116) $ 1,163 $ 1,299 $ 125 $ (113) $ 1,311 $ 1,445 $ 111 $ (86) $ 1,470
Operating margin - adjusted 16.6% 5.9% 14.1% 18.4% 11.4% 16.1% 19.3% 15.2% 17.4% 21.1% 15.1% 19.4%
RestatedRevenue, as adjusted $ 5,840 $ 892 $ (59) $ 6,673 $ 6,403 $ 860 $ (29) $ 7,234 $ 6,728 $ 825 $ (25) $ 7,528 $ 6,835 $ 737 $ 23 $ 7,595
Operating income (loss) - as adjusted $ 969 $ 53 $ (80) $ 942 $ 1,181 $ 98 $ (116) $ 1,163 $ 1,299 $ 125 $ (113) $ 1,311 $ 1,445 $ 111 $ (86) $ 1,470
1 1 - 2 14 (3) 2 13 38 2 - 40 (30) (1) 5 (26)Operating income (loss) - as adjusted $ 968 $ 52 $ (80) $ 940 $ 1,167 $ 101 $ (118) $ 1,150 $ 1,261 $ 123 $ (113) $ 1,271 $ 1,475 $ 112 $ (91) $ 1,496
Operating margin - adjusted 16.6% 5.8% 14.1% 18.2% 11.7% 15.9% 18.7% 14.9% 16.9% 21.6% 15.2% 19.7%
Reclassification - Foreign currency remeasurement gains (losses)
17
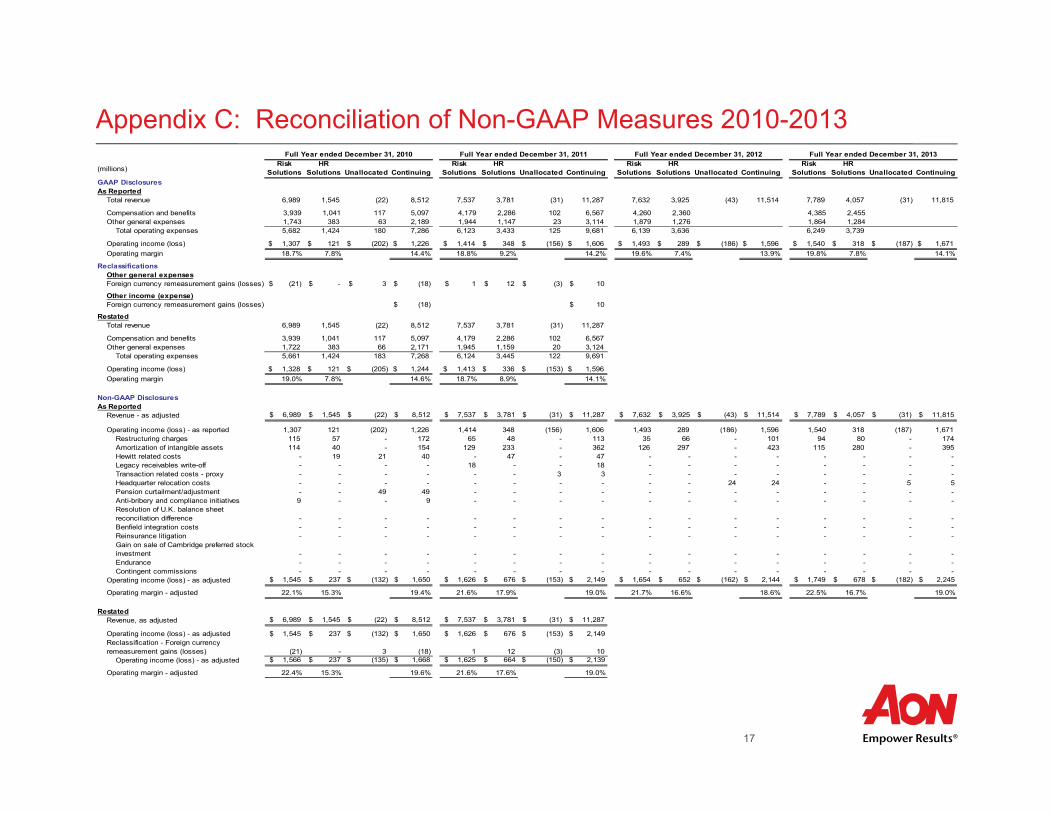
Appendix C: Reconciliation of Non-GAAP Measures 2010-2013Full Year ended December 31, 2010 Full Year ended December 31, 2011 Full Year ended December 31, 2012 Full Year ended December 31, 2013
(millions)Risk
SolutionsHR
Solutions Unallocated ContinuingRisk
SolutionsHR
Solutions Unallocated ContinuingRisk
SolutionsHR
Solutions Unallocated ContinuingRisk
SolutionsHR
Solutions Unallocated ContinuingGAAP DisclosuresAs Reported
Total revenue 6,989 1,545 (22) 8,512 7,537 3,781 (31) 11,287 7,632 3,925 (43) 11,514 7,789 4,057 (31) 11,815
Compensation and benefits 3,939 1,041 117 5,097 4,179 2,286 102 6,567 4,260 2,360 4,385 2,455 Other general expenses 1,743 383 63 2,189 1,944 1,147 23 3,114 1,879 1,276 1,864 1,284
Total operating expenses 5,682 1,424 180 7,286 6,123 3,433 125 9,681 6,139 3,636 6,249 3,739
Operating income (loss) 1,307$ 121$ (202)$ 1,226$ 1,414$ 348$ (156)$ 1,606$ 1,493$ 289$ (186)$ 1,596$ 1,540$ 318$ (187)$ 1,671$ Operating margin 18.7% 7.8% 14.4% 18.8% 9.2% 14.2% 19.6% 7.4% 13.9% 19.8% 7.8% 14.1%
ReclassificationsOther general expensesForeign currency remeasurement gains (losses) $ (21) $ - $ 3 $ (18) $ 1 $ 12 $ (3) $ 10
Other income (expense)Foreign currency remeasurement gains (losses) $ (18) $ 10
RestatedTotal revenue 6,989 1,545 (22) 8,512 7,537 3,781 (31) 11,287
Compensation and benefits 3,939 1,041 117 5,097 4,179 2,286 102 6,567 Other general expenses 1,722 383 66 2,171 1,945 1,159 20 3,124
Total operating expenses 5,661 1,424 183 7,268 6,124 3,445 122 9,691
Operating income (loss) 1,328$ 121$ (205)$ 1,244$ 1,413$ 336$ (153)$ 1,596$ Operating margin 19.0% 7.8% 14.6% 18.7% 8.9% 14.1%
Non-GAAP DisclosuresAs Reported
Revenue - as adjusted $ 6,989 $ 1,545 $ (22) $ 8,512 $ 7,537 $ 3,781 $ (31) $ 11,287 $ 7,632 $ 3,925 $ (43) $ 11,514 $ 7,789 $ 4,057 $ (31) $ 11,815
Operating income (loss) - as reported 1,307 121 (202) 1,226 1,414 348 (156) 1,606 1,493 289 (186) 1,596 1,540 318 (187) 1,671 Restructuring charges 115 57 - 172 65 48 - 113 35 66 - 101 94 80 - 174 Amortization of intangible assets 114 40 - 154 129 233 - 362 126 297 - 423 115 280 - 395 Hewitt related costs - 19 21 40 - 47 - 47 - - - - - - - - Legacy receivables write-off - - - - 18 - - 18 - - - - - - - - Transaction related costs - proxy - - - - - - 3 3 - - - - - - - - Headquarter relocation costs - - - - - - - - - - 24 24 - - 5 5 Pension curtailment/adjustment - - 49 49 - - - - - - - - - - - - Anti-bribery and compliance initiatives 9 - - 9 - - - - - - - - - - - - Resolution of U.K. balance sheet reconciliation difference - - - - - - - - - - - - - - - - Benfield integration costs - - - - - - - - - - - - - - - - Reinsurance litigation - - - - - - - - - - - - - - - - Gain on sale of Cambridge preferred stock investment - - - - - - - - - - - - - - - - Endurance - - - - - - - - - - - - - - - - Contingent commissions - - - - - - - - - - - - - - - -
Operating income (loss) - as adjusted $ 1,545 $ 237 $ (132) $ 1,650 $ 1,626 $ 676 $ (153) $ 2,149 $ 1,654 $ 652 $ (162) $ 2,144 $ 1,749 $ 678 $ (182) $ 2,245
Operating margin - adjusted 22.1% 15.3% 19.4% 21.6% 17.9% 19.0% 21.7% 16.6% 18.6% 22.5% 16.7% 19.0%
RestatedRevenue, as adjusted $ 6,989 $ 1,545 $ (22) $ 8,512 $ 7,537 $ 3,781 $ (31) $ 11,287
Operating income (loss) - as adjusted $ 1,545 $ 237 $ (132) $ 1,650 $ 1,626 $ 676 $ (153) $ 2,149
(21) - 3 (18) 1 12 (3) 10 Operating income (loss) - as adjusted $ 1,566 $ 237 $ (135) $ 1,668 $ 1,625 $ 664 $ (150) $ 2,139
Operating margin - adjusted 22.4% 15.3% 19.6% 21.6% 17.6% 19.0%
Reclassification - Foreign currency remeasurement gains (losses)
18
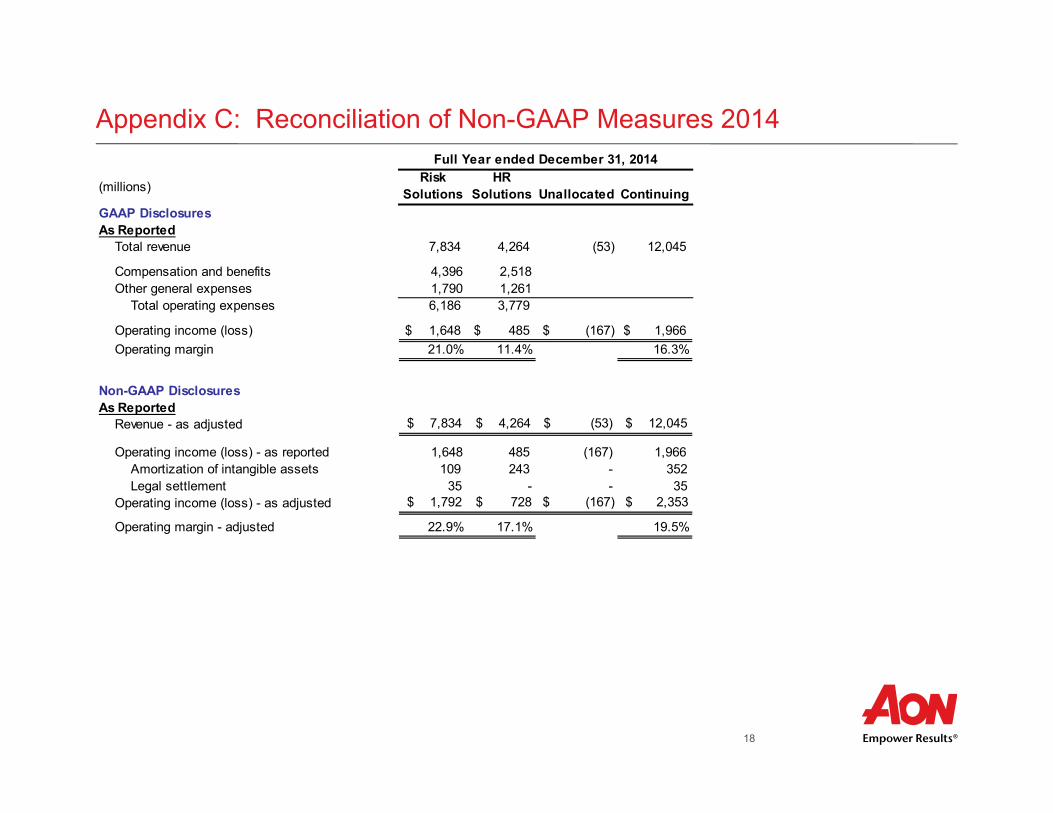
Full Year ended December 31, 2014
(millions)Risk
SolutionsHR
Solutions Unallocated ContinuingGAAP DisclosuresAs Reported
Total revenue 7,834 4,264 (53) 12,045
Compensation and benefits 4,396 2,518 Other general expenses 1,790 1,261
Total operating expenses 6,186 3,779
Operating income (loss) 1,648$ 485$ (167)$ 1,966$ Operating margin 21.0% 11.4% 16.3%
Non-GAAP DisclosuresAs Reported
Revenue - as adjusted $ 7,834 $ 4,264 $ (53) $ 12,045
Operating income (loss) - as reported 1,648 485 (167) 1,966 Amortization of intangible assets 109 243 - 352 Legal settlement 35 - - 35
Operating income (loss) - as adjusted $ 1,792 $ 728 $ (167) $ 2,353
Operating margin - adjusted 22.9% 17.1% 19.5%
Appendix C: Reconciliation of Non-GAAP Measures 2014

19
Appendix D: Intangible Asset Amortization Schedule
Intangible Asset Amortization by Segment
($ millions) 2009 2010 2011 2012 2013 2014 2015 2016 2017 2018
Risk Solutions $93 $114 $129 $126 $115 $109 $112 $104 $93 $78
HR Solutions - $40 $233 $297 $280 $243 $206 $172 $138 $92
Total $93 $154 $362 $423 $395 $352 $318 $276 $231 $170

Investor RelationsScott [email protected]: +44 (0) 20 7086 0100
Erika [email protected]: 312-381-5957
Steven [email protected]: 312-381-3353