Embed Size (px)
Citation preview
Spend ReductionA Project Guide
Date: July 17th, 2007
John Gregg, Senior Manager,
Monitor China
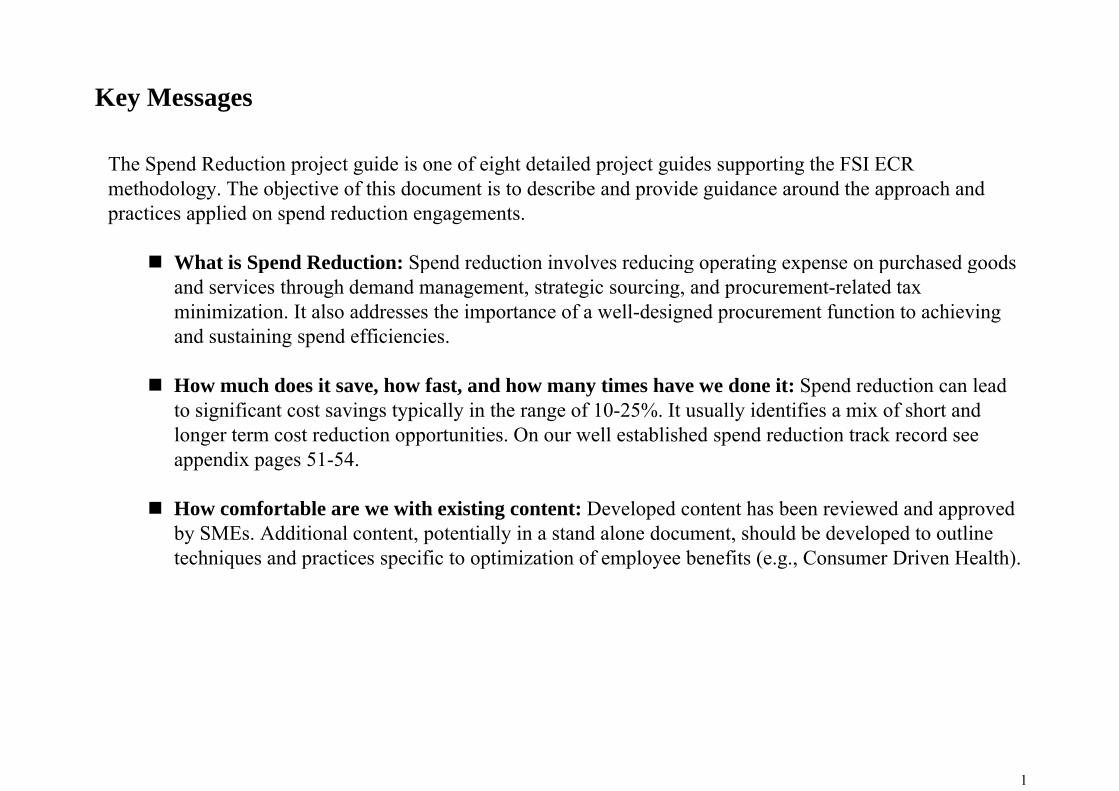
Key Messages
The Spend Reduction project guide is one of eight detailed project guides supporting the FSI ECR methodology. The objective of this document is to describe and provide guidance around the approach and practices applied on spend reduction engagements.
What is Spend Reduction: Spend reduction involves reducing operating expense on purchased goodsWhat is Spend Reduction: Spend reduction involves reducing operating expense on purchased goods and services through demand management, strategic sourcing, and procurement-related tax minimization. It also addresses the importance of a well-designed procurement function to achieving and sustaining spend efficiencies.
How much does it save, how fast, and how many times have we done it: Spend reduction can lead to significant cost savings typically in the range of 10-25%. It usually identifies a mix of short and longer term cost reduction opportunities On our well established spend reduction track record seelonger term cost reduction opportunities. On our well established spend reduction track record see appendix pages 51-54.
How comfortable are we with existing content: Developed content has been reviewed and approved b SME Addi i l i ll i d l d h ld b d l d liby SMEs. Additional content, potentially in a stand alone document, should be developed to outline techniques and practices specific to optimization of employee benefits (e.g., Consumer Driven Health).
1
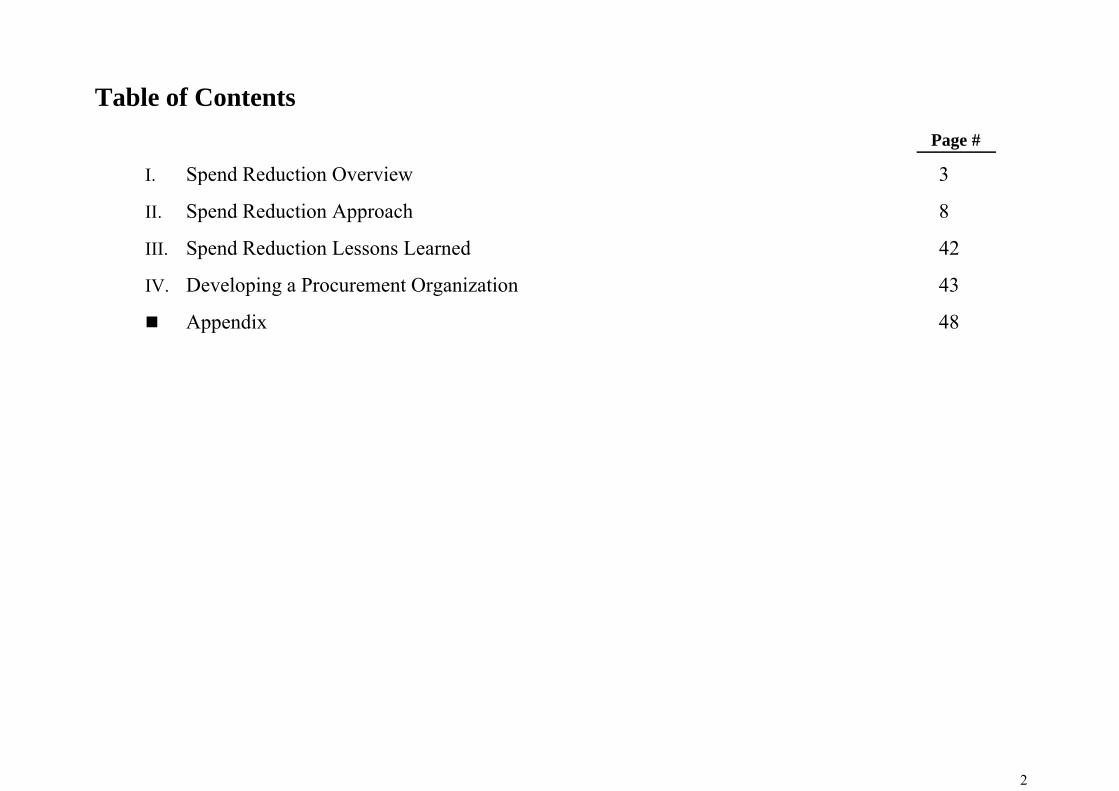
Table of Contents
I Spend Reduction Overview 3
Page #
I. Spend Reduction Overview 3
II. Spend Reduction Approach 8
III. Spend Reduction Lessons Learned 42
IV. Developing a Procurement Organization 43
Appendix 48
2
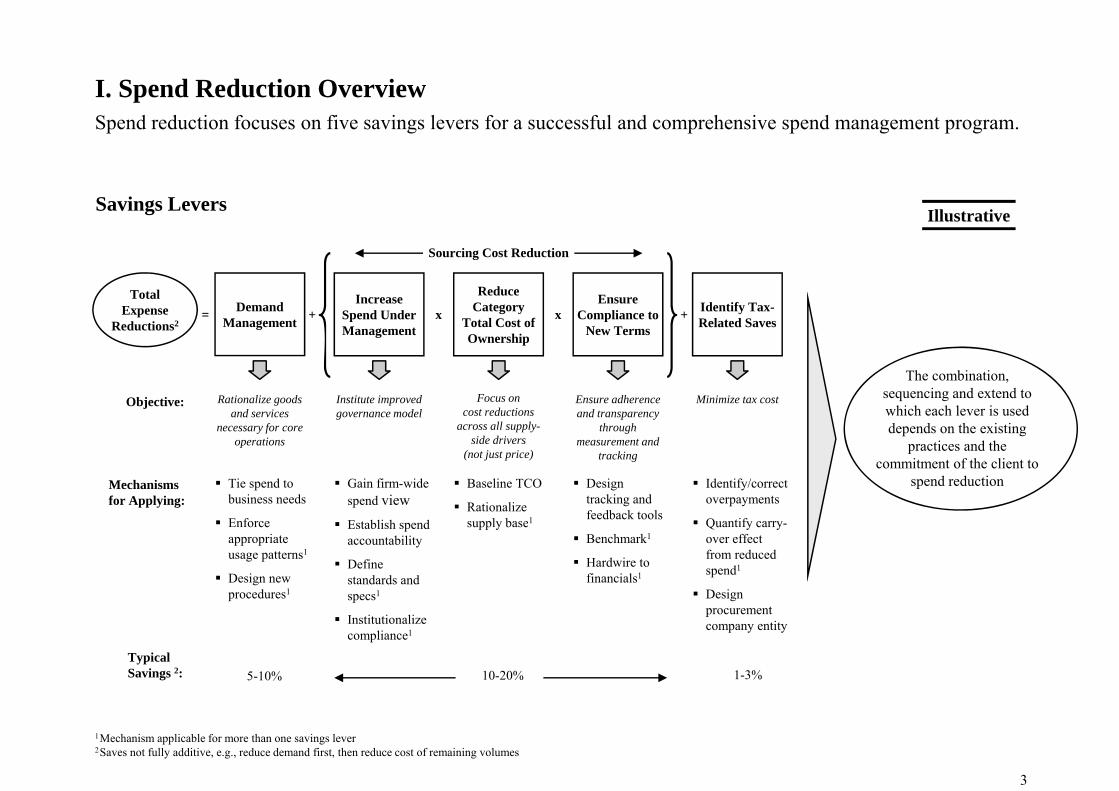
I Spend Reduction OverviewI. Spend Reduction OverviewSpend reduction focuses on five savings levers for a successful and comprehensive spend management program.
Sourcing Cost Reduction
IllustrativeSavings Levers
TotalExpense
Reductions2+ x x= +Demand
Management
IncreaseSpend UnderManagement
Reduce Category
Total Cost of Ownership
Ensure Compliance to
New Terms
Identify Tax-Related Saves
Objective: Rationalize goods and services
necessary for core ti
Institute improved governance model
Focus oncost reductions
across all supply-side drivers
Ensure adherence and transparency
through t d
Minimize tax cost
The combination, sequencing and extend to which each lever is used depends on the existing
Tie spend to business needs
Enforce
operations
Gain firm-wide spend viewEstablish spend
Baseline TCO
Rationalize supply base1
side drivers(not just price)
Design tracking and feedback tools
measurement and tracking
Identify/correct overpayments
Quantify carry-
Mechanisms for Applying:
practices and the commitment of the client to
spend reduction
o ceappropriate usage patterns1
Design new procedures1
Establish spend accountability
Define standards and specs1
i i li
supp y baseBenchmark1
Hardwire to financials1
Qua t y ca yover effect from reduced spend1
Design procurement
Institutionalize compliance1
pcompany entity
Typical Savings 2: 5-10% 10-20% 1-3%
3
1Mechanism applicable for more than one savings lever2Saves not fully additive, e.g., reduce demand first, then reduce cost of remaining volumes
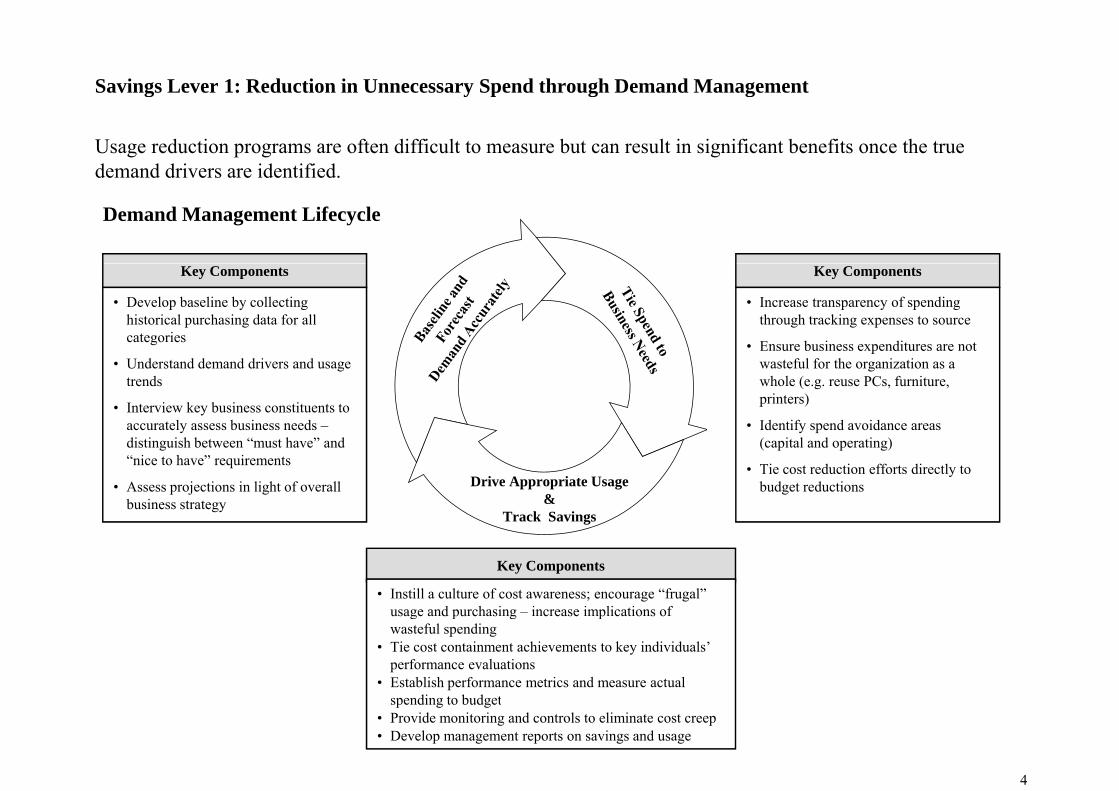
Savings Lever 1: Reduction in Unnecessary Spend through Demand Management
Usage reduction programs are often difficult to measure but can result in significant benefits once the true demand drivers are identified.
Savings Lever 1: Reduction in Unnecessary Spend through Demand Management
demand drivers are identified.
Demand Management Lifecycle
Key Components
• Develop baseline by collecting historical purchasing data for all categories
Key Components
• Increase transparency of spending through tracking expenses to source
• Ensure business expenditures are not • Understand demand drivers and usage
trends
• Interview key business constituents to accurately assess business needs –di ti i h b t “ t h ” d
pwasteful for the organization as a whole (e.g. reuse PCs, furniture, printers)
• Identify spend avoidance areas ( it l d ti )distinguish between “must have” and
“nice to have” requirements
• Assess projections in light of overall business strategy
(capital and operating)
• Tie cost reduction efforts directly to budget reductionsDrive Appropriate Usage
&Track Savings
Key Components
• Instill a culture of cost awareness; encourage “frugal” usage and purchasing – increase implications ofusage and purchasing increase implications of wasteful spending
• Tie cost containment achievements to key individuals’ performance evaluations
• Establish performance metrics and measure actual spending to budget
4
spending to budget• Provide monitoring and controls to eliminate cost creep• Develop management reports on savings and usage
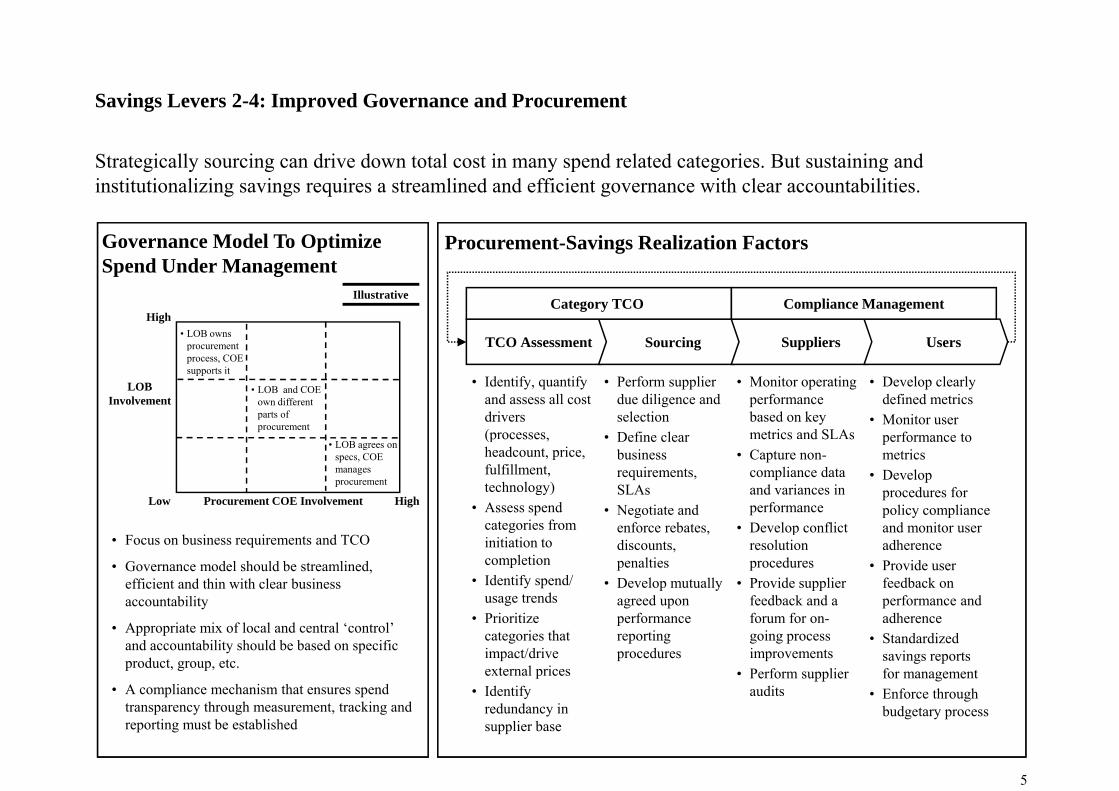
Savings Levers 2-4: Improved Governance and Procurement
Strategically sourcing can drive down total cost in many spend related categories. But sustaining and institutionalizing savings requires a streamlined and efficient governance with clear accountabilities.
Procurement-Savings Realization FactorsGovernance Model To Optimize Spend Under ManagementSpend Under Management
TCO Assessment Sourcing Suppliers Users
Category TCO Compliance ManagementHigh
• LOB owns procurement
Illustrative
• Identify, quantify and assess all cost drivers (processes,
• Perform supplier due diligence and selection
• Define clear
• Monitor operating performance based on key metrics and SLAs
• Develop clearly defined metrics
• Monitor user performance to
LOB Involvement
process, COE supports it
• LOB and COE own different parts of procurement (p ocesses,
headcount, price, fulfillment, technology)
• Assess spend categories from
Define clear business requirements, SLAs
• Negotiate and enforce rebates
e cs d S s• Capture non-
compliance data and variances in performance
• Develop conflict
performance to metrics
• Develop procedures for policy compliance and monitor user
Low Procurement COE Involvement
• LOB agrees on specs, COE manages procurement
High
• Focus on business requirements and TCO
• Governance model should be streamlined, efficient and thin with clear business accountability
categories from initiation to completion
• Identify spend/ usage trendsP i iti
enforce rebates, discounts, penalties
• Develop mutually agreed upon
f
• Develop conflict resolution procedures
• Provide supplier feedback and a f f
and monitor user adherence
• Provide user feedback on performance and dh
• Appropriate mix of local and central ‘control’ and accountability should be based on specific product, group, etc.
• A compliance mechanism that ensures spend h h ki d
• Prioritize categories that impact/drive external prices
• Identify
performance reporting procedures
forum for on-going process improvements
• Perform supplier audits
adherence• Standardized
savings reports for management
• Enforce through
5
transparency through measurement, tracking and reporting must be established
redundancy in supplier base
budgetary process
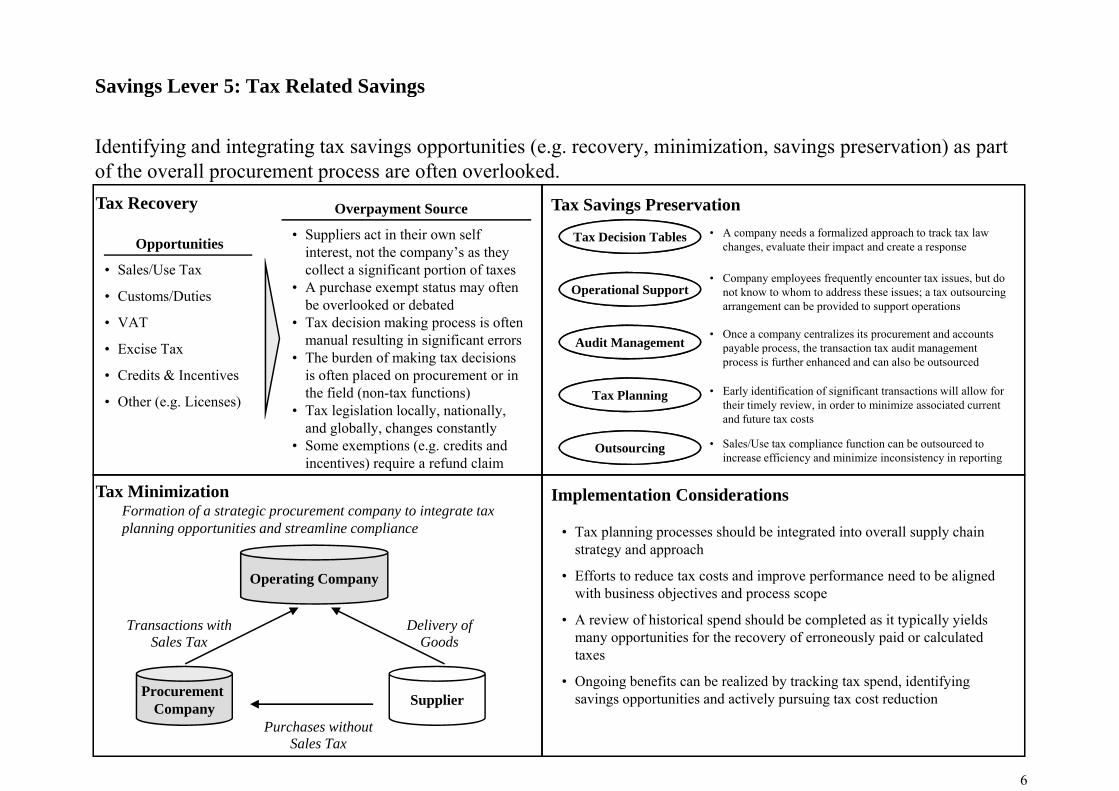
Savings Lever 5: Tax Related SavingsSavings Lever 5: Tax Related Savings
Identifying and integrating tax savings opportunities (e.g. recovery, minimization, savings preservation) as part of the overall procurement process are often overlooked.of the overall procurement process are often overlooked.Tax Recovery
Opportunities
Overpayment Source
• Suppliers act in their own self interest, not the company’s as they
Tax Savings Preservation• A company needs a formalized approach to track tax law
changes, evaluate their impact and create a responseTax Decision Tables
• Sales/Use Tax
• Customs/Duties
• VAT
• Excise Tax
collect a significant portion of taxes• A purchase exempt status may often
be overlooked or debated • Tax decision making process is often
manual resulting in significant errors
Operational Support
Audit Management
• Company employees frequently encounter tax issues, but do not know to whom to address these issues; a tax outsourcing arrangement can be provided to support operations
• Once a company centralizes its procurement and accounts payable process, the transaction tax audit managementExcise Tax
• Credits & Incentives
• Other (e.g. Licenses)
• The burden of making tax decisions is often placed on procurement or in the field (non-tax functions)
• Tax legislation locally, nationally, and globally, changes constantly
Tax Planning • Early identification of significant transactions will allow for their timely review, in order to minimize associated current and future tax costs
payable process, the transaction tax audit management process is further enhanced and can also be outsourced
l / li i b d• Some exemptions (e.g. credits and incentives) require a refund claim
Tax MinimizationFormation of a strategic procurement company to integrate tax planning opportunities and streamline compliance
Implementation Considerations
T l i h ld b i d i ll l h i
Outsourcing • Sales/Use tax compliance function can be outsourced to increase efficiency and minimize inconsistency in reporting
planning opportunities and streamline compliance
Operating Company
• Tax planning processes should be integrated into overall supply chain strategy and approach
• Efforts to reduce tax costs and improve performance need to be aligned with business objectives and process scope
A i f hi i l d h ld b l d i i ll i ld
Procurement Supplier
Transactions withSales Tax
Delivery ofGoods
• A review of historical spend should be completed as it typically yields many opportunities for the recovery of erroneously paid or calculated taxes
• Ongoing benefits can be realized by tracking tax spend, identifying savings opportunities and actively pursuing tax cost reduction
6
Company Supplier
Purchases withoutSales Tax
savings opportunities and actively pursuing tax cost reduction
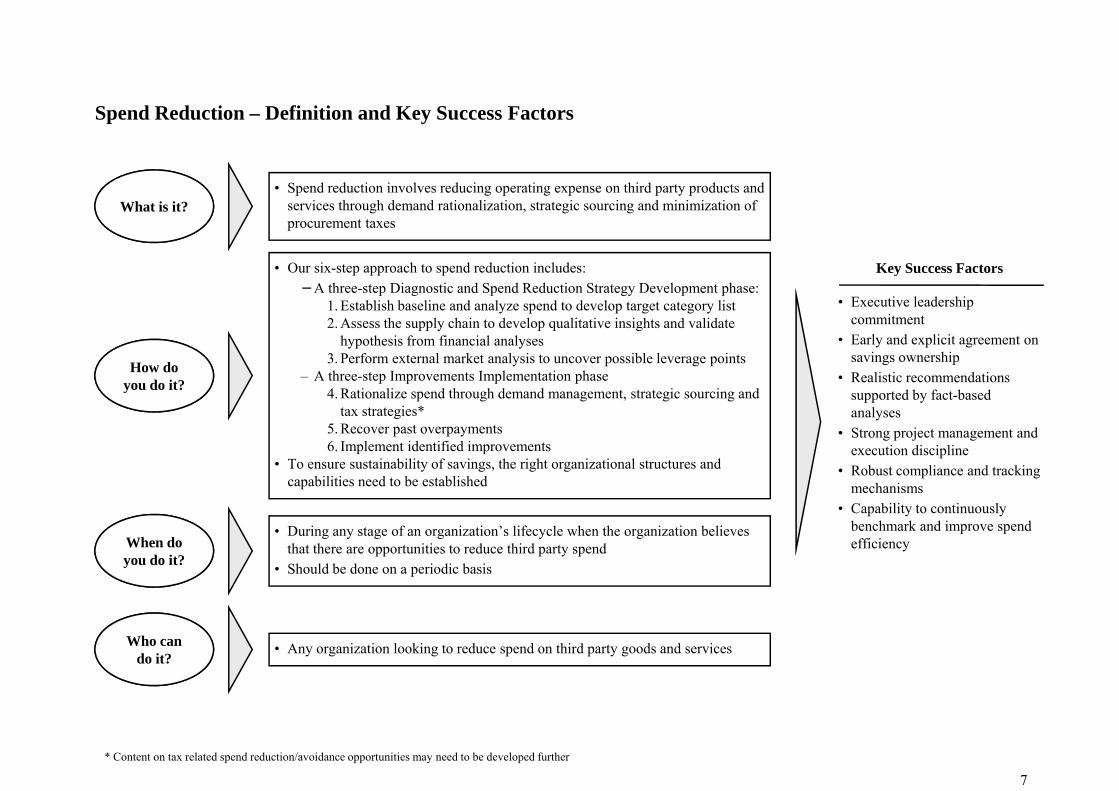
Spend Reduction – Definition and Key Success Factors
What is it?• Spend reduction involves reducing operating expense on third party products and
services through demand rationalization, strategic sourcing and minimization of procurement taxes
O i h d d i i l d K S F• Our six-step approach to spend reduction includes:−A three-step Diagnostic and Spend Reduction Strategy Development phase:
1. Establish baseline and analyze spend to develop target category list2. Assess the supply chain to develop qualitative insights and validate
hypothesis from financial analyses
• Executive leadership commitment
• Early and explicit agreement on
Key Success Factors
How do you do it?
3. Perform external market analysis to uncover possible leverage points– A three-step Improvements Implementation phase
4. Rationalize spend through demand management, strategic sourcing and tax strategies*
5. Recover past overpayments
savings ownership• Realistic recommendations
supported by fact-based analyses
• Strong project management and 6. Implement identified improvements
• To ensure sustainability of savings, the right organizational structures and capabilities need to be established
D i t f i ti ’ lif l h th i ti b li
g p j gexecution discipline
• Robust compliance and tracking mechanisms
• Capability to continuously benchmark and improve spend
When do you do it?
• During any stage of an organization’s lifecycle when the organization believes that there are opportunities to reduce third party spend
• Should be done on a periodic basis
benchmark and improve spend efficiency
Who can do it?
• Any organization looking to reduce spend on third party goods and services
7
* Content on tax related spend reduction/avoidance opportunities may need to be developed further
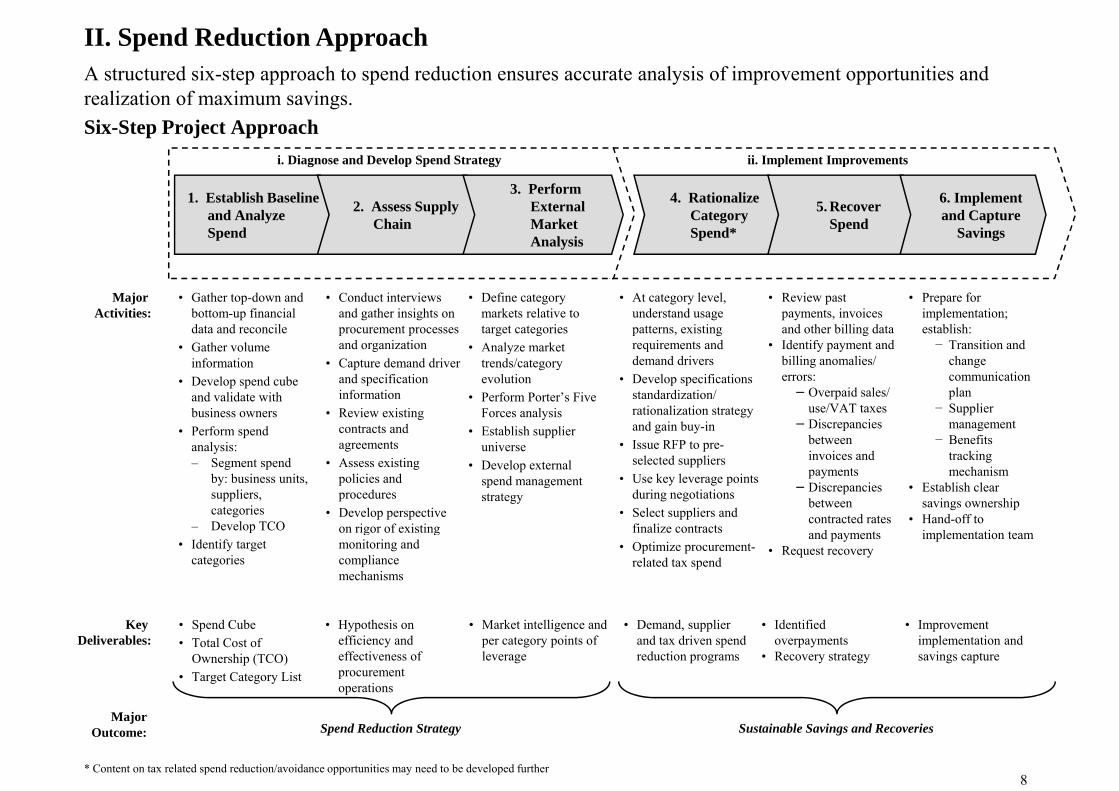
A structured six-step approach to spend reduction ensures accurate analysis of improvement opportunities and
II. Spend Reduction Approach
Six-Step Project Approachrealization of maximum savings.
i. Diagnose and Develop Spend Strategy ii. Implement Improvements
1. Establish Baseline and Analyze Spend
2. Assess Supply Chain
3. Perform External Market Analysis
4. Rationalize Category Spend*
5. Recover Spend
6. Implement and Capture
Savings
Major Activities:
• Gather top-down and bottom-up financial data and reconcile
• Gather volume
• Define category markets relative to target categories
• Analyze market
• At category level, understand usage patterns, existing requirements and
• Conduct interviews and gather insights on procurement processes and organization
• Review past payments, invoices and other billing data
• Identify payment and
• Prepare for implementation; establish:− Transition and Gat e vo u e
information• Develop spend cube
and validate with business owners
• Perform spend
a y e a ettrends/category evolution
• Perform Porter’s Five Forces analysis
• Establish supplier
qdemand drivers
• Develop specifications standardization/ rationalization strategy and gain buy-in
g• Capture demand driver
and specification information
• Review existing contracts and
y p ybilling anomalies/ errors:−Overpaid sales/
use/VAT taxes−Discrepancies
between
change communication plan
− Supplier managementBenefitsanalysis:
– Segment spend by: business units, suppliers, categories
– Develop TCO
universe• Develop external
spend management strategy
• Issue RFP to pre-selected suppliers
• Use key leverage points during negotiations
• Select suppliers and finalize contracts
agreements• Assess existing
policies and procedures
• Develop perspective on rigor of existing
between invoices and payments
−Discrepancies between contracted rates
− Benefits tracking mechanism
• Establish clear savings ownership
• Hand-off to – Develop TCO• Identify target
categories
finalize contracts• Optimize procurement-
related tax spend
on rigor of existing monitoring and compliance mechanisms
and payments• Request recovery
implementation team
Key Deliverables:
• Spend Cube• Total Cost of
Ownership (TCO)• Target Category List
• Demand, supplier and tax driven spend reduction programs
• Hypothesis on efficiency and effectiveness of procurement operations
• Market intelligence and per category points of leverage
• Identified overpayments
• Recovery strategy
• Improvement implementation and savings capture
8
Spend Reduction Strategy Sustainable Savings and RecoveriesMajor
Outcome:
* Content on tax related spend reduction/avoidance opportunities may need to be developed further
i. Diagnose and Develop Spend Strategy
Comprehensive assessment of procured spend supply chain practices and external market positioning helps usComprehensive assessment of procured spend, supply chain practices and external market positioning helps us identify opportunities for expense reduction.
1 E t bli hi B li d A l i S d A ll t t d fi i l b li i t f1. Establishing Baseline and Analyzing Spend. A well constructed financial baseline is a must for any external spend reduction effort. The spend cube allows for efficient, comprehensive analysis of external spend along multiple dimensions including but not limited to: spend by category per business unit/function, spend by supplier, supplier concentration per spend category, etc. , p y pp , pp p p g y,
2. Assessing the Supply Chain. Understanding of the existing supply chain complements the insights developed through spend analysis and helps refine emerging improvement hypotheses. Assessment of existing contracts, procurement capabilities, practices, policies and procedures provides a context for g p p p p p pand helps shape organizational and category-level strategies.
3. Performing External Market Analysis. Detailed analysis of the external market can uncover opportunities to improve efficiency based on existing market power (e.g., bargaining power) and/or development of new procurement advantage (e.g., redefine the category, redefine the supplier relationship). It completes the fact base required to develop category-specific strategies.
The three types of analyses can overlap in timing and may need to be performed in an iterative manner. The rigor with which each of them is performed would depend on the scope of the project, the organization’s recent expense reduction/sourcing history, and management’s appetite for change.
9
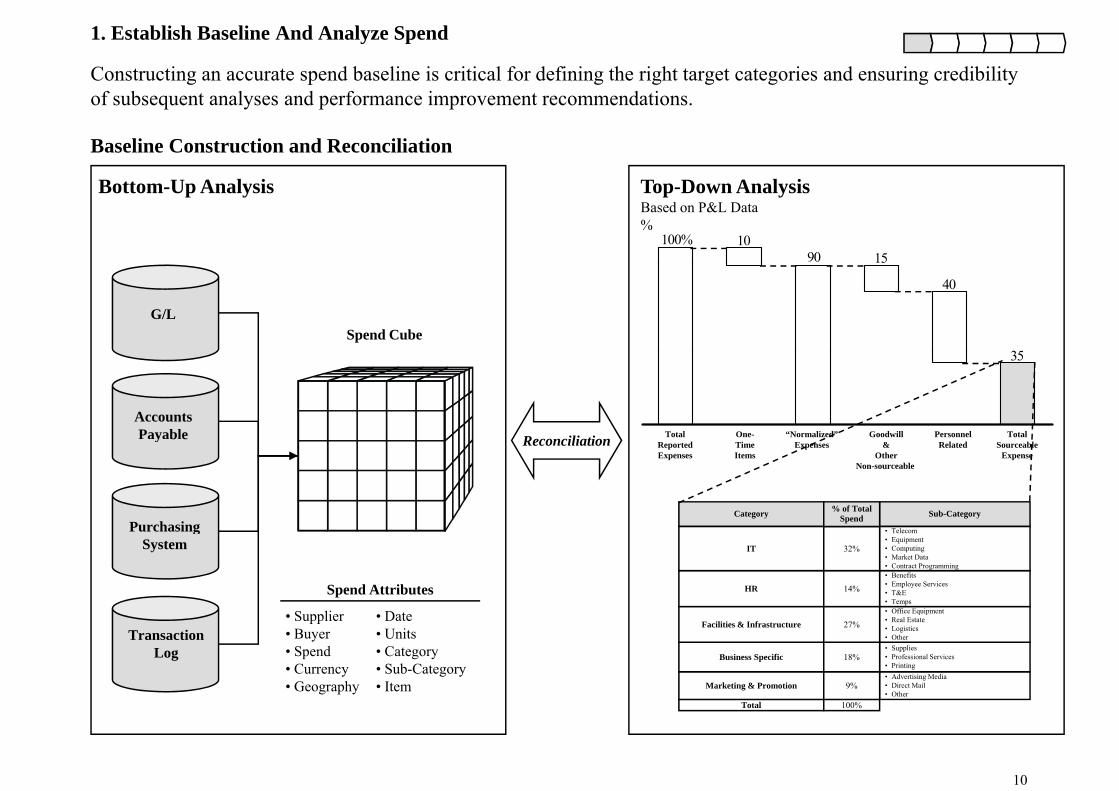
1. Establish Baseline And Analyze Spend
Constructing an accurate spend baseline is critical for defining the right target categories and ensuring credibility of subsequent analyses and performance improvement recommendations.
Baseline Construction and Reconciliation
Top-Down AnalysisBased on P&L Data%
100% 1090 15
Bottom-Up Analysis
G/LSpend Cube
35
40
Accounts Payable Reconciliation
35
Total One- “Normalized” Goodwill Personnel Totaly b e
Purchasing
Reconciliation ReportedExpenses
TimeItems
Expenses &Other
Non-sourceable
Related SourceableExpense
Sub-CategoryCategory % of Total Spend
Purchasing System
• Supplier • Date
Spend Attributes• Office Equipment
• Benefits• Employee Services• T&E• Temps
HR 14%
• Telecom• Equipment• Computing• Market Data• Contract Programming
IT 32%
Transaction Log
• Supplier • Buyer• Spend• Currency • Geography
• Date • Units• Category• Sub-Category• Item
T t l
• Advertising Media• Direct Mail• Other
Marketing & Promotion
• Supplies• Professional Services• Printing
Business Specific
• Real Estate• Logistics• Other
Facilities & Infrastructure
100%
9%
18%
27%
10
Total 100%
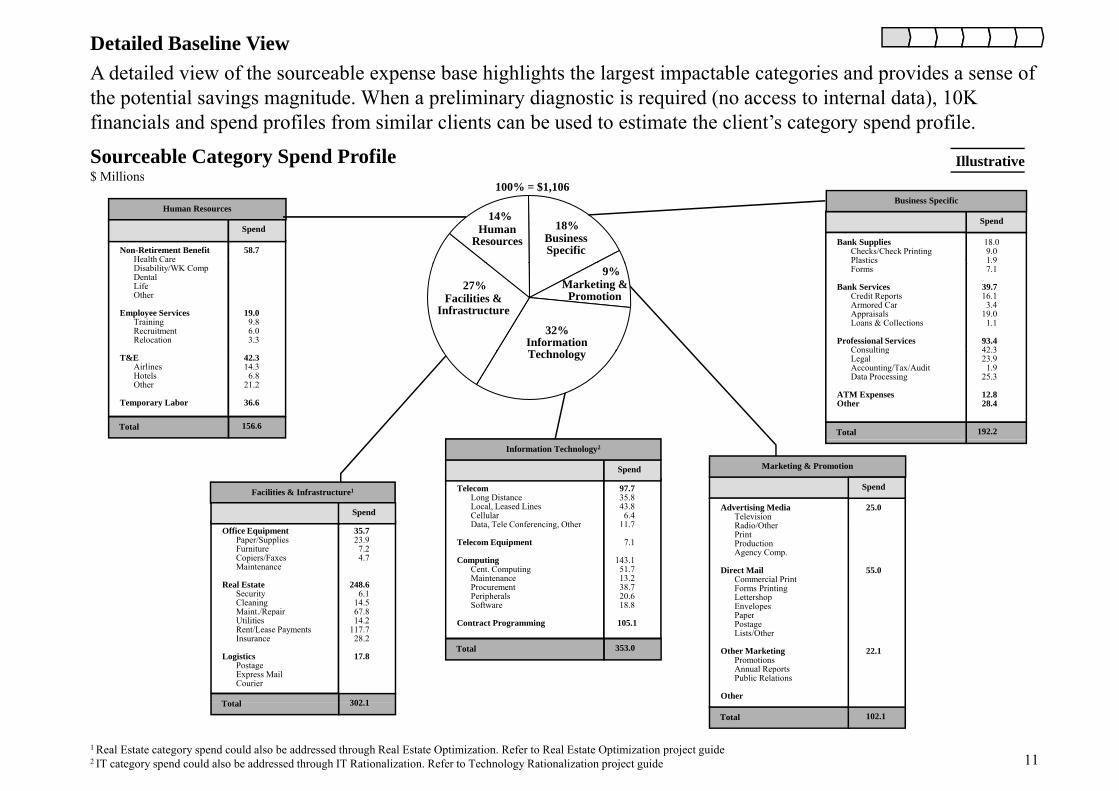
A detailed view of the sourceable expense base highlights the largest impactable categories and provides a sense of Detailed Baseline View
the potential savings magnitude. When a preliminary diagnostic is required (no access to internal data), 10K financials and spend profiles from similar clients can be used to estimate the client’s category spend profile.
Sourceable Category Spend Profile$ Millions
Illustrative
Non-Retirement BenefitHealth Care
58.7
Spend
Human Resources
Bank SuppliesChecks/Check PrintingPlastics
Human Resources Business
Specific
14%18%
100% = $1,106
18.09.0 1.9
Spend
Business Specific
$ Millions
Disability/WK CompDentalLifeOther
Employee ServicesTrainingRecruitmentRelocation
19.09.86.03.3
Forms
Bank ServicesCredit ReportsArmored CarAppraisalsLoans & Collections
Professional ServicesConsulting
Facilities & Infrastructure
Information T h l
Marketing & Promotion
27%
32%
9% 7.1
39.716.13.4
19.01.1
93.442 3
T&EAirlinesHotelsOther
Temporary Labor
42.314.3
6.821.2
36.6
ConsultingLegalAccounting/Tax/AuditData Processing
ATM ExpensesOther
Technology
Total 156.6Total
42.323.91.9
25.3
12.828.4
192.2
TelecomLong DistanceLocal, Leased LinesCellularData, Tele Conferencing, Other
97.735.843.86.4
11.7
Spend
Facilities & Infrastructure1
Spend Advertising MediaTelevisionRadio/Other
Marketing & Promotion
25.0
Spend
Information Technology2
ata, e e Co e e c g, Ot e
Telecom Equipment
ComputingCent. ComputingMaintenanceProcurementPeripheralsSoftware
.7
7.1
143.151.713.238.720.618.8
35.723.97.24.7
248.66.1
14.567.8
Office EquipmentPaper/SuppliesFurnitureCopiers/Faxes Maintenance
Real EstateSecurityCleaningMaint./Repair
Radio/OtherPrintProductionAgency Comp.
Direct MailCommercial PrintForms PrintingLettershopEnvelopesPaper
55.0
Contract Programming
Total
105.1
353.0
14.2117.728.2
17.8
pUtilitiesRent/Lease PaymentsInsurance
LogisticsPostageExpress MailCourier
302 1Total
PaperPostageLists/Other
Other MarketingPromotionsAnnual ReportsPublic Relations
Other
22.1
11
302.1TotalTotal 102.1
1 Real Estate category spend could also be addressed through Real Estate Optimization. Refer to Real Estate Optimization project guide2 IT category spend could also be addressed through IT Rationalization. Refer to Technology Rationalization project guide
Spend Analysis
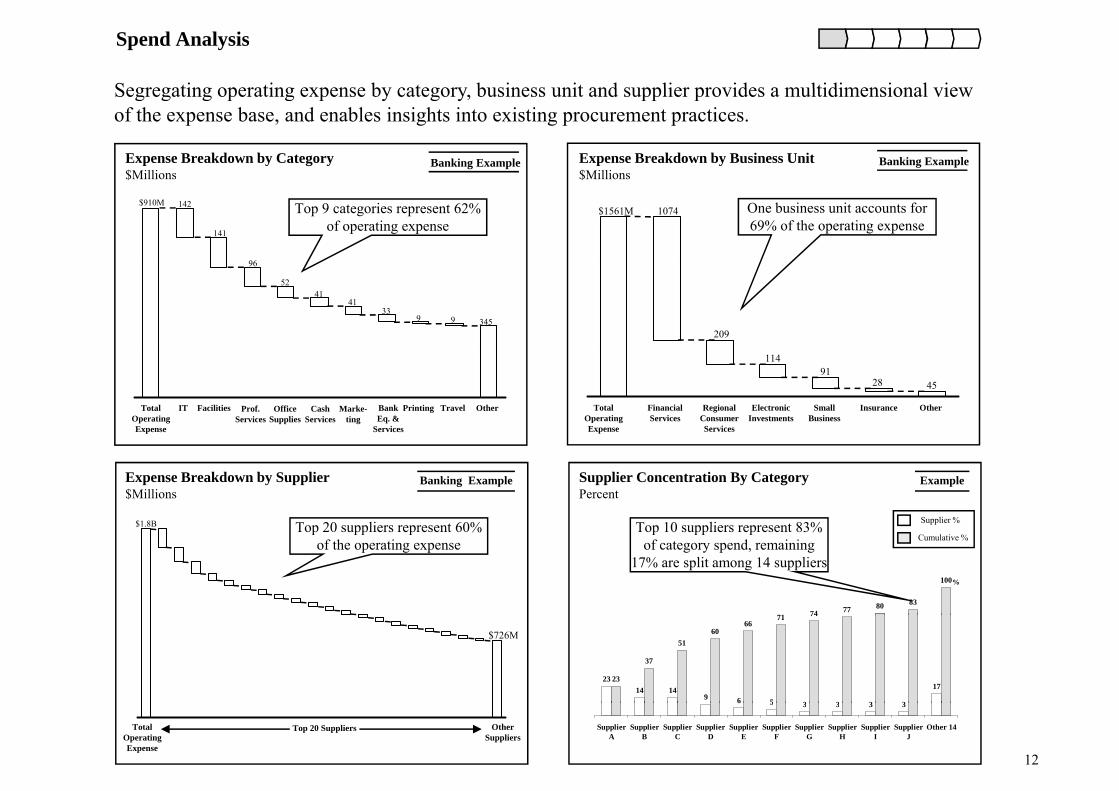
Segregating operating expense by category business unit and supplier provides a multidimensional view
Expense Breakdown by Category$Millions
Expense Breakdown by Business Unit$Millions
Segregating operating expense by category, business unit and supplier provides a multidimensional view of the expense base, and enables insights into existing procurement practices.
Banking ExampleBanking Example
$910M 142
141
96
$Millions
Top 9 categories represent 62% of operating expense
$Millions
$1561M 1074 One business unit accounts for 69% of the operating expense
96
5241
4133
9 9 345209
Total Operating Expense
IT Facilities Prof. Services
Office Supplies
Cash Services
Marke-ting
Bank Eq. &
Services
Printing Travel Other Total Operating Expense
Financial Services
Regional Consumer Services
Electronic Investments
Small Business
Insurance Other
11491
28 45
$1.8B
Expense Breakdown by Supplier$Millions
Top 20 suppliers represent 60%
Supplier Concentration By CategoryPercent
Supplier %
Banking Example Example
Top 10 suppliers represent 83%$ Top 20 suppliers represent 60% of the operating expense
71 74 77 80 83
100
Cumulative %
%
Top 10 suppliers represent 83% of category spend, remaining
17% are split among 14 suppliers
2314 14
9 6 5 3 3 3 3
1723
37
5160
6671 74
$726M
12
Total Operating Expense
Other Suppliers
Top 20 Suppliers
6 5 3 3 3 3
SupplierA
SupplierB
SupplierC
SupplierD
SupplierE
SupplierF
SupplierG
SupplierH
SupplierI
SupplierJ
Other 14
Category Total Cost of Ownership
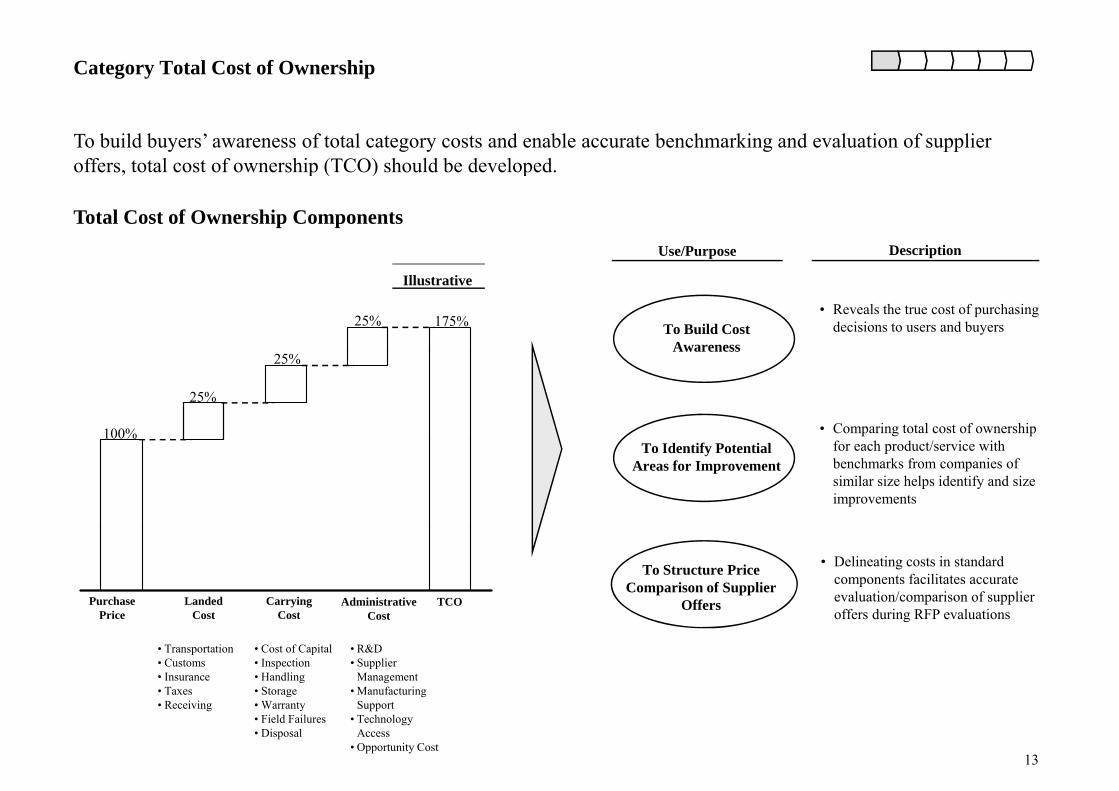
To build buyers’ awareness of total category costs and enable accurate benchmarking and evaluation of supplier offers, total cost of ownership (TCO) should be developed.
Use/Purpose Description
p ( ) p
Total Cost of Ownership Components
25% 175%
Illustrative
To Build CostAwareness
• Reveals the true cost of purchasing decisions to users and buyers
100%
25%
25%
• Comparing total cost of ownership
Awareness
To Identify Potential Areas for Improvement
for each product/service with benchmarks from companies of similar size helps identify and size improvements
Purchase Price
Landed Cost
Carrying Cost
Administrative Cost
TCO
To Structure Price Comparison of Supplier
Offers
• Delineating costs in standard components facilitates accurate evaluation/comparison of supplier offers during RFP evaluationsPrice Cost Cost Cost
• Transportation• Customs• Insurance• Taxes
R i i
• Cost of Capital• Inspection• Handling• Storage
W t
• R&D• Supplier
Management• Manufacturing
S t
offers during RFP evaluations
13
• Receiving • Warranty• Field Failures• Disposal
Support• Technology
Access• Opportunity Cost
2. Assess the Supply Chain
Supply chain data on existing processes organizational structures compliance and monitoring capabilities tools and
IllustrativeSupply Chain Landscape
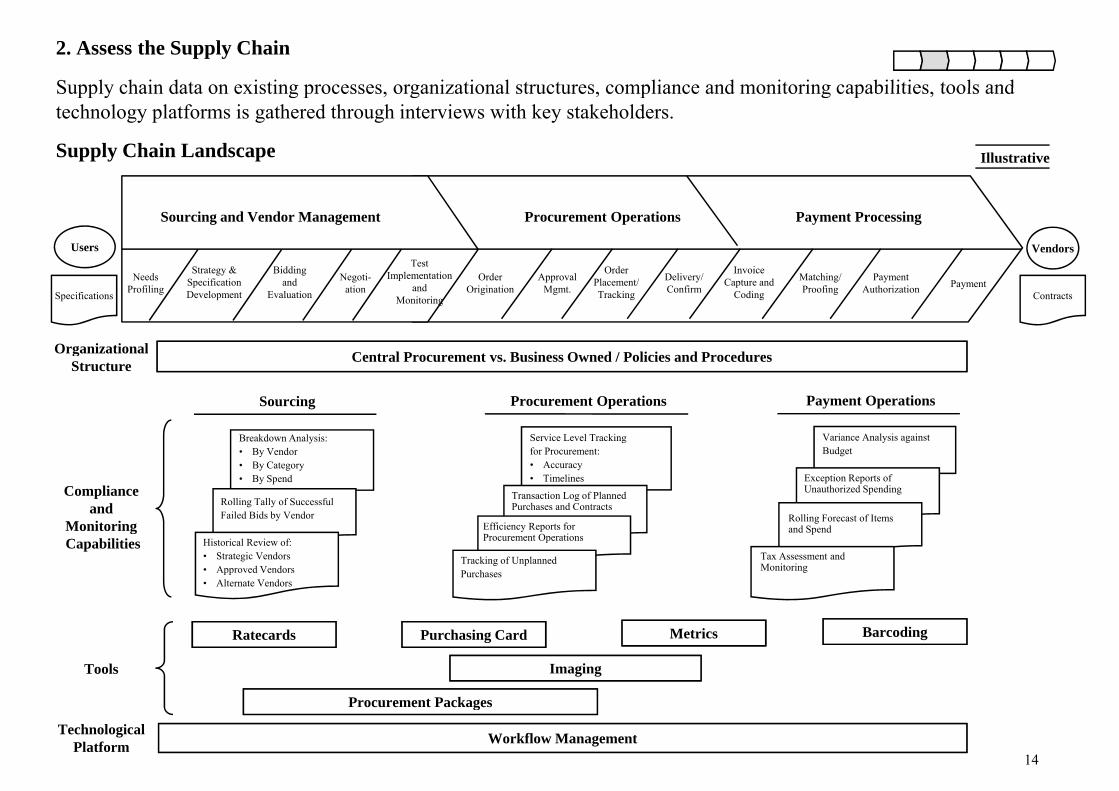
Supply chain data on existing processes, organizational structures, compliance and monitoring capabilities, tools and technology platforms is gathered through interviews with key stakeholders.
Users Vendors
Sourcing and Vendor Management
Test
Payment ProcessingProcurement Operations
NeedsProfiling
Strategy & Specification Development
Bidding and
Evaluation
Negoti-ation
Test Implementation
and Monitoring
Order Origination
Approval Mgmt.
Order Placement/ Tracking
Delivery/ Confirm
Invoice Capture and
Coding
Matching/ Proofing
Payment Authorization Payment
Organizational
Specifications Contracts
Breakdown Analysis:
Sourcing
Service Level Tracking
Procurement Operations
Variance Analysis against
Payment Operations
Central Procurement vs. Business Owned / Policies and ProceduresOrganizationalStructure
Breakdown Analysis:• By Vendor• By Category• By Spend
Rolling Tally of SuccessfulFailed Bids by Vendor
Compliance and
Monitoring
Service Level Tracking for Procurement:• Accuracy• Timelines
Transaction Log of Planned Purchases and Contracts
Variance Analysis against Budget
Exception Reports of Unauthorized Spending
Rolling Forecast of Items d S dEfficiency Reports for
Historical Review of:• Strategic Vendors• Approved Vendors• Alternate Vendors
MonitoringCapabilities
and Spend Efficiency Reports for Procurement Operations
Tracking of Unplanned Purchases
Tax Assessment and Monitoring
Ratecards Purchasing Card Metrics Barcoding
Imaging
Procurement Packages
Tools
14
Procurement Packages
Workflow ManagementTechnologicalPlatform
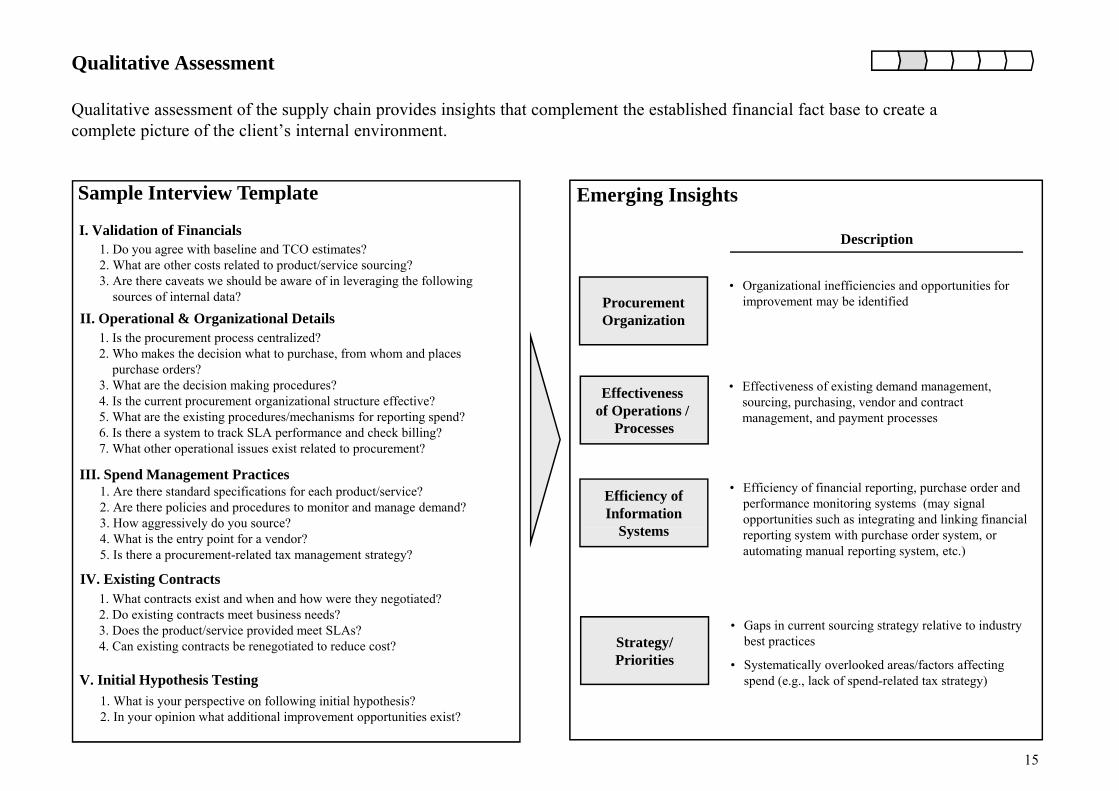
Qualitative Assessment
Qualitative assessment of the supply chain provides insights that complement the established financial fact base to create a complete picture of the client’s internal environment.
Description1. Do you agree with baseline and TCO estimates?2 What are other costs related to product/service sourcing?
Sample Interview Template Emerging InsightsI. Validation of Financials
Procurement Organization
• Organizational inefficiencies and opportunities for improvement may be identified
2. What are other costs related to product/service sourcing?3. Are there caveats we should be aware of in leveraging the following
sources of internal data?
1. Is the procurement process centralized?2 Wh k th d i i h t t h f h d l
II. Operational & Organizational Details
Effectiveness of Operations /
Processes
• Effectiveness of existing demand management, sourcing, purchasing, vendor and contract management, and payment processes
2. Who makes the decision what to purchase, from whom and places purchase orders?
3. What are the decision making procedures?4. Is the current procurement organizational structure effective?5. What are the existing procedures/mechanisms for reporting spend?6. Is there a system to track SLA performance and check billing?
Efficiency of Information
S t
• Efficiency of financial reporting, purchase order and performance monitoring systems (may signal opportunities such as integrating and linking financial
y p g7. What other operational issues exist related to procurement?
1. Are there standard specifications for each product/service?2. Are there policies and procedures to monitor and manage demand?3. How aggressively do you source?
III. Spend Management Practices
Systems reporting system with purchase order system, or automating manual reporting system, etc.)
3. How aggressively do you source?4. What is the entry point for a vendor?5. Is there a procurement-related tax management strategy?
1. What contracts exist and when and how were they negotiated?2 Do existing contracts meet business needs?
IV. Existing Contracts
Strategy/Priorities
• Gaps in current sourcing strategy relative to industry best practices
• Systematically overlooked areas/factors affecting spend (e.g., lack of spend-related tax strategy)
2. Do existing contracts meet business needs?3. Does the product/service provided meet SLAs?4. Can existing contracts be renegotiated to reduce cost?
1 What is your perspective on following initial hypothesis?V. Initial Hypothesis Testing
15
1. What is your perspective on following initial hypothesis?2. In your opinion what additional improvement opportunities exist?
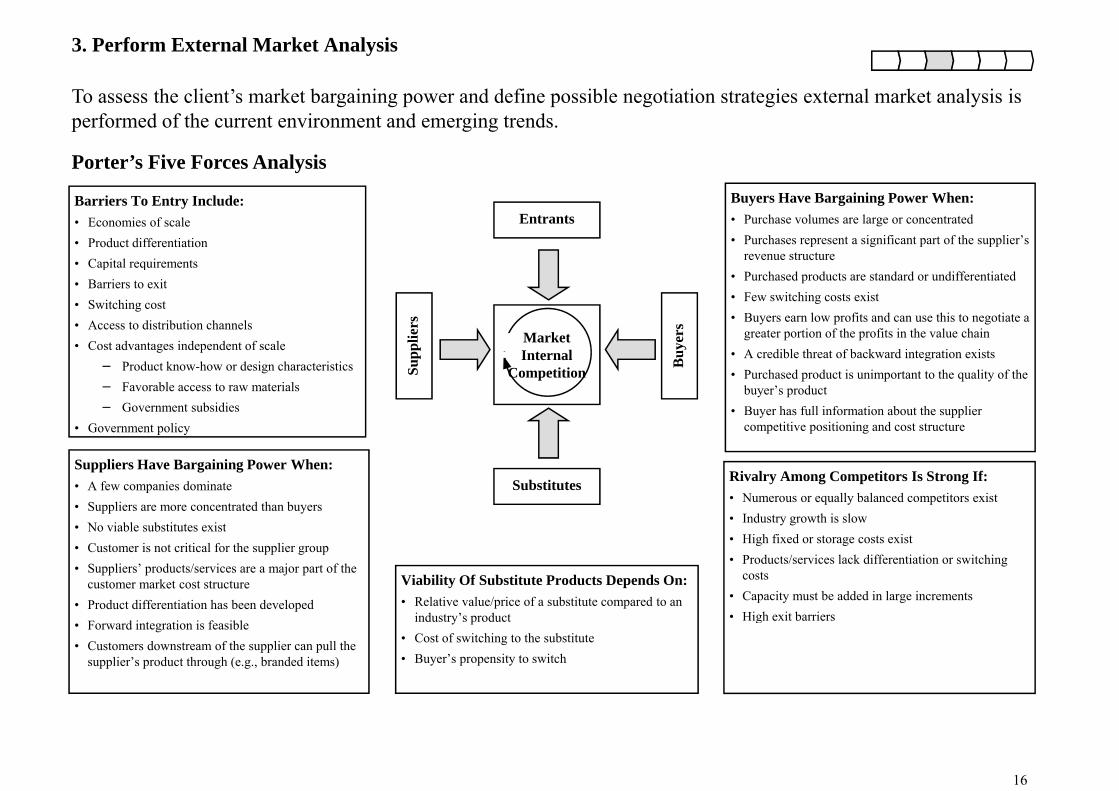
3. Perform External Market Analysis
Porter’s Five Forces Analysis
To assess the client’s market bargaining power and define possible negotiation strategies external market analysis is performed of the current environment and emerging trends.
Buyers Have Bargaining Power When:• Purchase volumes are large or concentrated• Purchases represent a significant part of the supplier’s
revenue structure
Barriers To Entry Include:• Economies of scale• Product differentiation• Capital requirements
Entrants
• Purchased products are standard or undifferentiated• Few switching costs exist• Buyers earn low profits and can use this to negotiate a
greater portion of the profits in the value chainA dibl th t f b k d i t ti i t
• Capital requirements• Barriers to exit• Switching cost• Access to distribution channels• Cost advantages independent of scale Market
I t lplie
rs
uyer
s
• A credible threat of backward integration exists• Purchased product is unimportant to the quality of the
buyer’s product• Buyer has full information about the supplier
competitive positioning and cost structure
g p− Product know-how or design characteristics− Favorable access to raw materials− Government subsidies
• Government policy
Internal CompetitionSu
p Bu
Rivalry Among Competitors Is Strong If:• Numerous or equally balanced competitors exist• Industry growth is slow
Suppliers Have Bargaining Power When:• A few companies dominate• Suppliers are more concentrated than buyers• No viable substitutes exist
Substitutes
• High fixed or storage costs exist• Products/services lack differentiation or switching
costs• Capacity must be added in large increments• High exit barriers
• No viable substitutes exist• Customer is not critical for the supplier group• Suppliers’ products/services are a major part of the
customer market cost structure• Product differentiation has been developed
Viability Of Substitute Products Depends On:• Relative value/price of a substitute compared to an
i d t ’ d t • High exit barriers• Forward integration is feasible• Customers downstream of the supplier can pull the
supplier’s product through (e.g., branded items)
industry’s product• Cost of switching to the substitute• Buyer’s propensity to switch
16
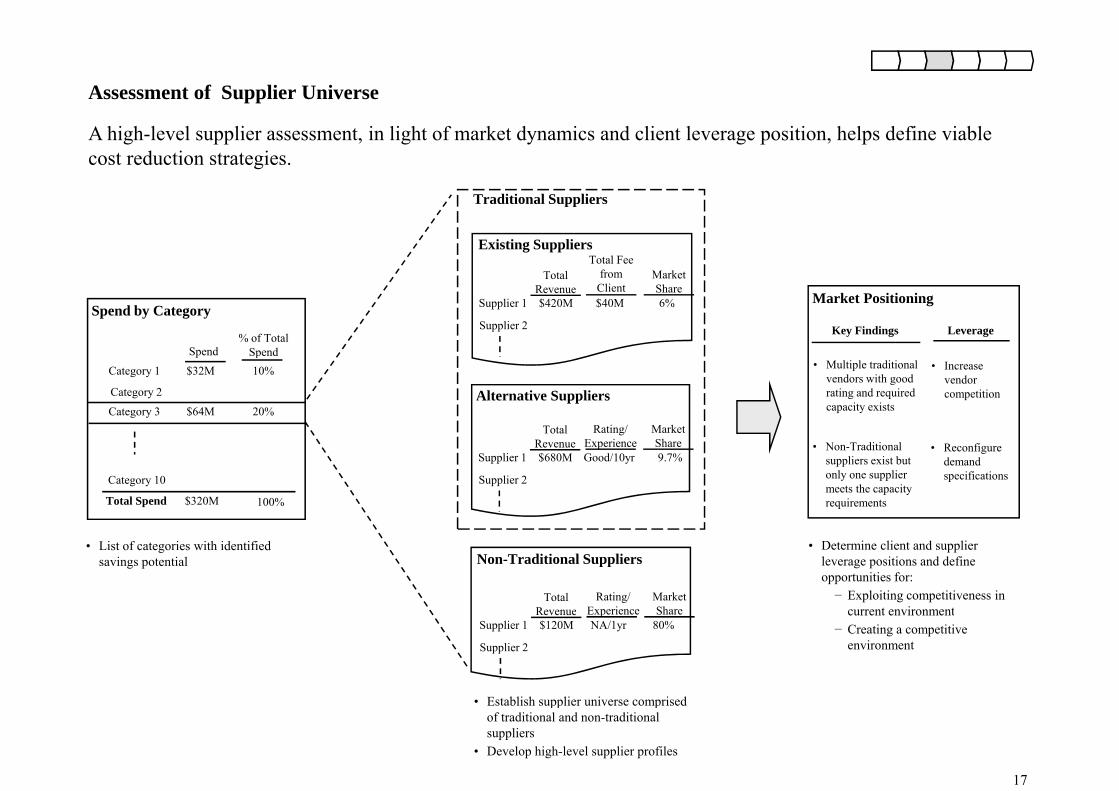
A t f S li U iAssessment of Supplier Universe
A high-level supplier assessment, in light of market dynamics and client leverage position, helps define viable cost reduction strategies.
Traditional Suppliers
Existing SuppliersTotal Fee
Spend by Category
Spend% of Total
Spend
Total Revenue
Total Fee from
ClientMarket Share
Supplier 1 $420M $40M 6%
Supplier 2
Market Positioning
Key Findings Leverage
Category 1 $32M 10%
Spend Spend
Category 2
Category 3 $64M 20%Alternative Suppliers
Total Rating/ E i
Market Sh
• Multiple traditional vendors with good rating and required capacity exists
• Increase vendor competition
Category 10
Total Spend $320M 100%
Revenue Experience ShareSupplier 1 $680M Good/10yr 9.7%
Supplier 2
• Non-Traditional suppliers exist but only one supplier meets the capacity requirements
• Reconfigure demand specifications
Non-Traditional Suppliers
Total Revenue
Rating/ Experience
Market Share
• Determine client and supplier leverage positions and define opportunities for:− Exploiting competitiveness in
current environment
• List of categories with identified savings potential
Revenue pSupplier 1 $120M NA/1yr 80%
Supplier 2
current environment− Creating a competitive
environment
• Establish supplier universe comprised
17
Establish supplier universe comprised of traditional and non-traditional suppliers
• Develop high-level supplier profiles
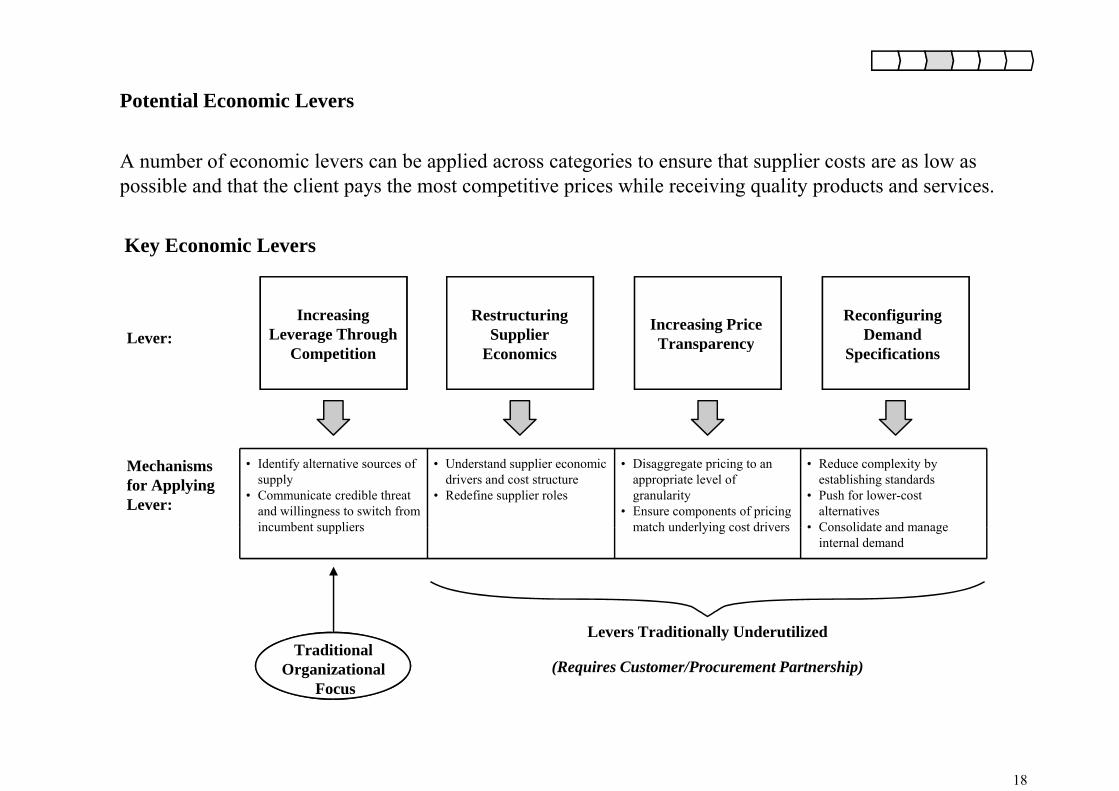
Potential Economic Levers
A number of economic levers can be applied across categories to ensure that supplier costs are as low as
Key Economic Levers
possible and that the client pays the most competitive prices while receiving quality products and services.
IncreasingLeverage Through
CompetitionLever:
Restructuring Supplier
E i
Increasing PriceTransparency
Reconfiguring Demand
S ifi tiCompetition Economics p y Specifications
Mechanisms for Applying Lever:
• Identify alternative sources of supply
• Communicate credible threat and willingness to switch from incumbent suppliers
• Understand supplier economic drivers and cost structure
• Redefine supplier roles
• Disaggregate pricing to an appropriate level of granularity
• Ensure components of pricing match underlying cost drivers
• Reduce complexity by establishing standards
• Push for lower-cost alternatives
• Consolidate and manageincumbent suppliers match underlying cost drivers • Consolidate and manage internal demand
Levers Traditionally Underutilized
(Requires Customer/Procurement Partnership)Traditional
OrganizationalFocus
18
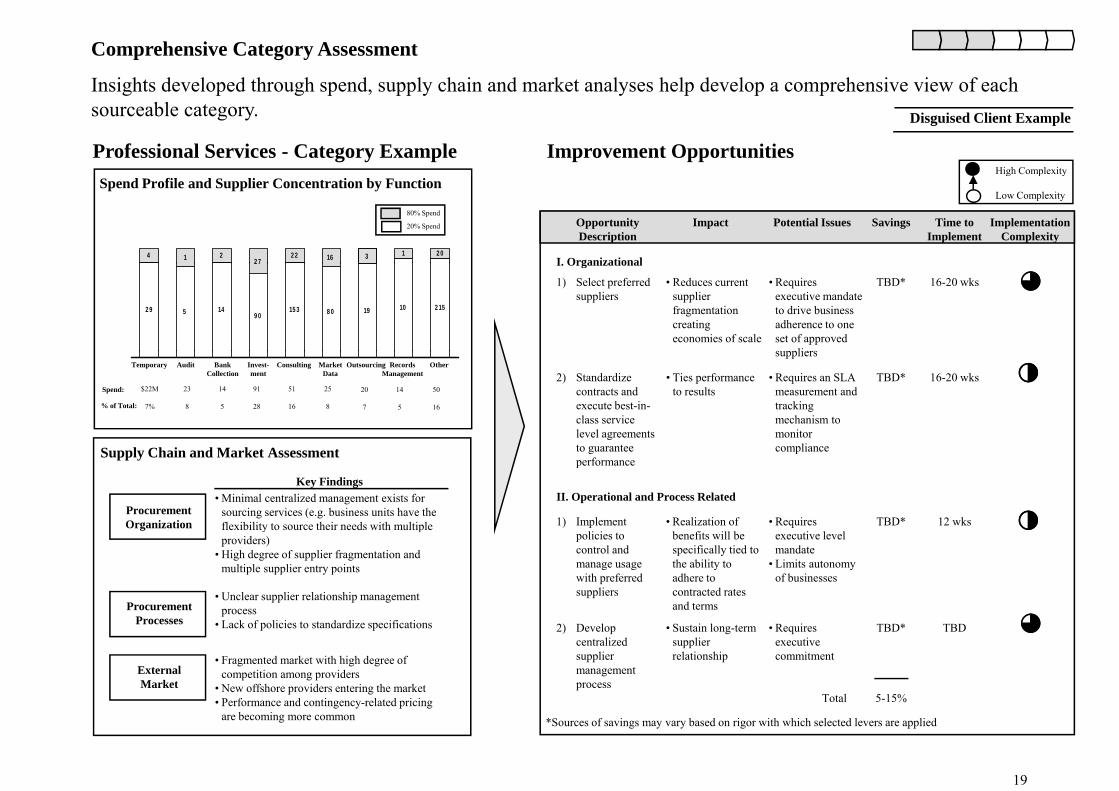
Comprehensive Category Assessment
Insights developed through spend supply chain and market analyses help develop a comprehensive view of each
Professional Services - Category Example
Disguised Client Example
Improvement OpportunitiesHigh Complexity
Insights developed through spend, supply chain and market analyses help develop a comprehensive view of each sourceable category.
Spend Profile and Supplier Concentration by Function
80% Spend
20% Spend
I Organizational
Implementation Complexity
Time to Implement
SavingsPotential IssuesImpactOpportunity Description
2 013162 7214 2 2
g p y
Low Complexity
16-20 wksTBD*• Requires executive mandate to drive business adherence to one set of approved suppliers
• Reduces current supplier fragmentation creating economies of scale
1) Select preferred suppliers
I. Organizational
2 9 5 149 0
15 3 8 0 19 10 2 15
2 7
Temporary Audit BankCollection
Invest-ment
Consulting MarketData
Outsourcing RecordsManagement
Other
Spend: $22M 23 14 91 51 25 20 14 50
% of Total: 7% 8 5 28 16 8 7 5 16
16-20 wksTBD*• Requires an SLA measurement and tracking mechanism to monitor
• Ties performance to results
2) Standardize contracts and execute best-in-class service level agreements
suppliers
Supply Chain and Market Assessment
Key Findings
Procurement Organization
• Minimal centralized management exists for sourcing services (e.g. business units have the flexibility to source their needs with multiple
II. Operational and Process Related
12 wksTBD*• Requires • Realization of 1) Implement
complianceg
to guarantee performance
Organization
Procurement
flexibility to source their needs with multiple providers)
• High degree of supplier fragmentation and multiple supplier entry points
• Unclear supplier relationship management process
qexecutive level mandate
• Limits autonomy of businesses
benefits will be specifically tied to the ability to adhere to contracted rates and terms
) ppolicies to control and manage usage with preferred suppliers
Processes
External Market
p• Lack of policies to standardize specifications
• Fragmented market with high degree of competition among providers
• New offshore providers entering the market• Performance and contingency related pricing
TBDTBD*
5-15%
• Requires executive commitment
Total
• Sustain long-term supplier relationship
2) Develop centralized supplier management process
19
• Performance and contingency-related pricing are becoming more common *Sources of savings may vary based on rigor with which selected levers are applied
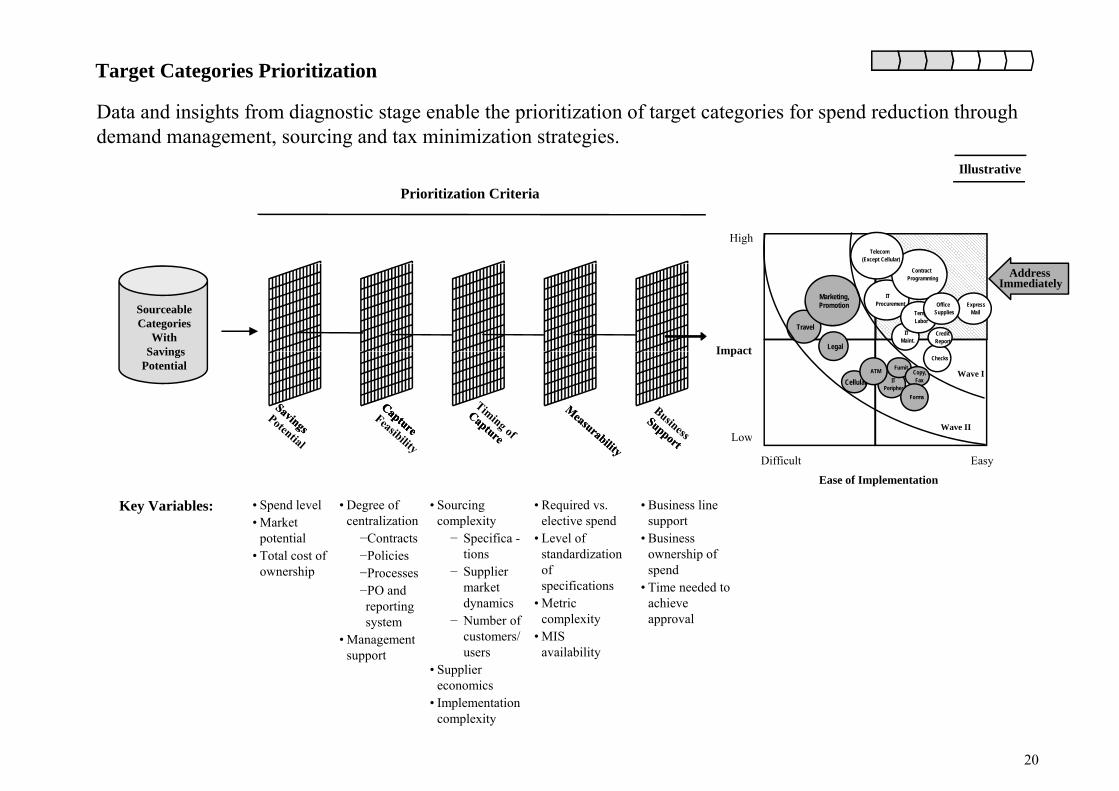
Target Categories Prioritization
Illustrative
Data and insights from diagnostic stage enable the prioritization of target categories for spend reduction through demand management, sourcing and tax minimization strategies.
Prioritization Criteria
HighTelecom
(Except Cellular)
Sourceable Categories
WithSavings Impact
ExpressMail
Travel
Marketing,Promotion
IT Procurement
Contract Programming
IT Maint.
AddressImmediately
CreditReport
Temp.Labor
Office Supplies
LegalSavings Potential
Impact
Low
CellularWave I
Wave II
ITPeripher..
ChecksFurnit.
Copy,Fax
ATM
Forms
Key Variables:
Low
Ease of Implementation
Difficult Easy
• Spend level• Market
• Degree of centralization
• Sourcing complexity
• Required vs. elective spend
• Business line support
potential• Total cost of
ownership
−Contracts−Policies−Processes−PO and reporting
p y− Specifica -
tions− Supplier
market dynamics
p• Level of
standardization of specifications
• Metric l i
pp• Business
ownership of spend
• Time needed to achieve
lsystem• Management
support
− Number of customers/ users
• Supplier economics
• Implementation
complexity• MIS
availability
approval
20
• Implementation complexity
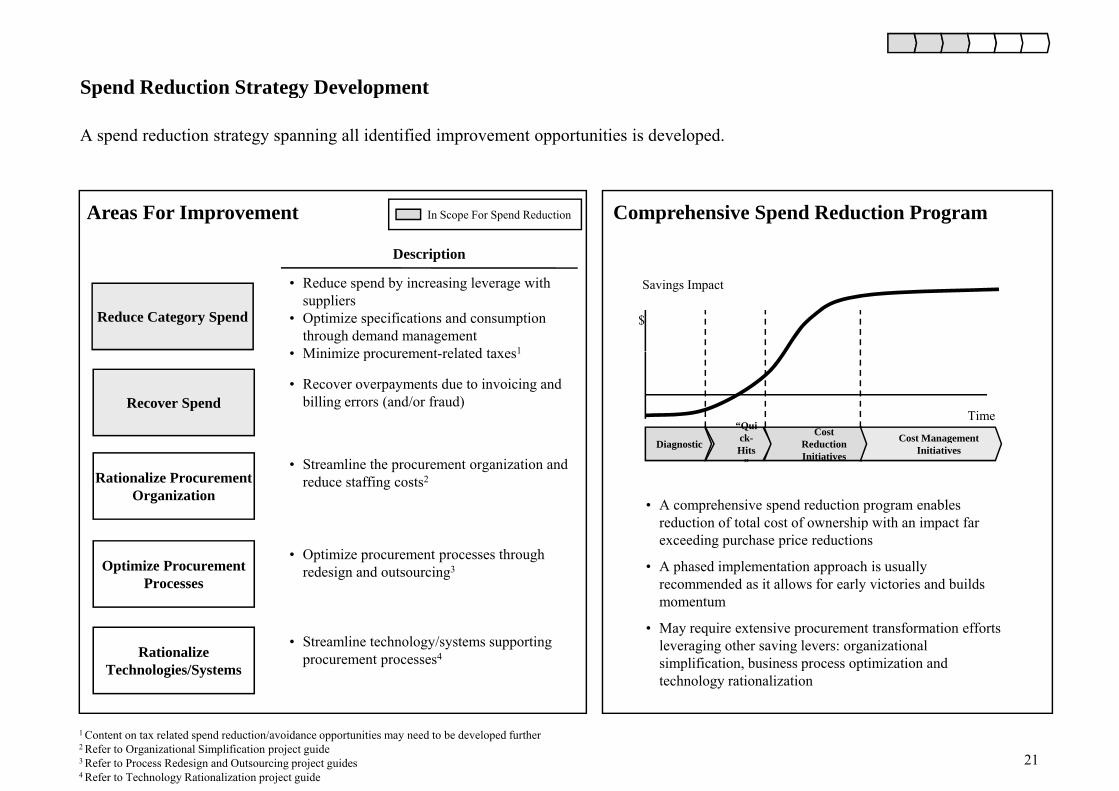
Spend Reduction Strategy Development
A spend reduction strategy spanning all identified improvement opportunities is developed.
Spend Reduction Strategy Development
Areas For Improvement
Description
Comprehensive Spend Reduction ProgramIn Scope For Spend Reduction
Reduce Category Spend $
• Reduce spend by increasing leverage with suppliers
• Optimize specifications and consumption through demand management
• Minimize procurement related taxes1
Savings Impact
Recover Spend“Quick- Cost Cost Management
Time
• Minimize procurement-related taxes1
• Recover overpayments due to invoicing and billing errors (and/or fraud)
Rationalize Procurement Organization
Diagnostic ck-Hits
”
Reduction Initiatives
Cost Management Initiatives
• Streamline the procurement organization and reduce staffing costs2
• A comprehensive spend reduction program enables reduction of total cost of ownership with an impact far
Optimize Procurement Processes
• Optimize procurement processes through redesign and outsourcing3
reduction of total cost of ownership with an impact far exceeding purchase price reductions
• A phased implementation approach is usually recommended as it allows for early victories and builds momentum
Rationalize Technologies/Systems
• Streamline technology/systems supporting procurement processes4
• May require extensive procurement transformation efforts leveraging other saving levers: organizational simplification, business process optimization and technology rationalization
21
1 Content on tax related spend reduction/avoidance opportunities may need to be developed further2 Refer to Organizational Simplification project guide3 Refer to Process Redesign and Outsourcing project guides4 Refer to Technology Rationalization project guide
ii. Implement Improvements
During the implementation phase the set of improvement opportunities identified and prioritized in theDuring the implementation phase, the set of improvement opportunities identified and prioritized in the diagnostic phase are investigated in more detail, refined and rolled out to the business(es). In the following pages we describe how to:
4 R ti li C t S d* Eff t t ti li t d i l d4. Rationalize Category Spend*. Efforts to rationalize category spend include:a. Demand Rationalization: reconfiguring of product/service specifications and optimization of
usageb Strategic Sourcing: reduction of costs by increasing leverage with vendorsb. Strategic Sourcing: reduction of costs by increasing leverage with vendorsc. Procurement Tax Optimization: minimization of procurement-related tax spend
While demand focused activities often precede supplier sourcing, both types of efforts should not be pursued in isolation of each other Tax strategies can be pursued in conjunction with demandpursued in isolation of each other. Tax strategies can be pursued in conjunction with demand management and sourcing or as part of an independent tax minimization initiative.
5. Recover Spend. In addition to reducing the operating expense base going forward, very often the opportunity exists to recover certain types of spend that have been incurred in the past due toopportunity exists to recover certain types of spend that have been incurred in the past due to errors/inefficiencies in the billing, payment and tax assessment processes.
6. Implement Improvements. When executing against a broad spectrum of spend reduction initiatives, ongoing organizational commitment and rigorous management against savings targets ensure successongoing organizational commitment and rigorous management against savings targets ensure success.
22* Content on tax related spend reduction/avoidance opportunities may need to be developed further
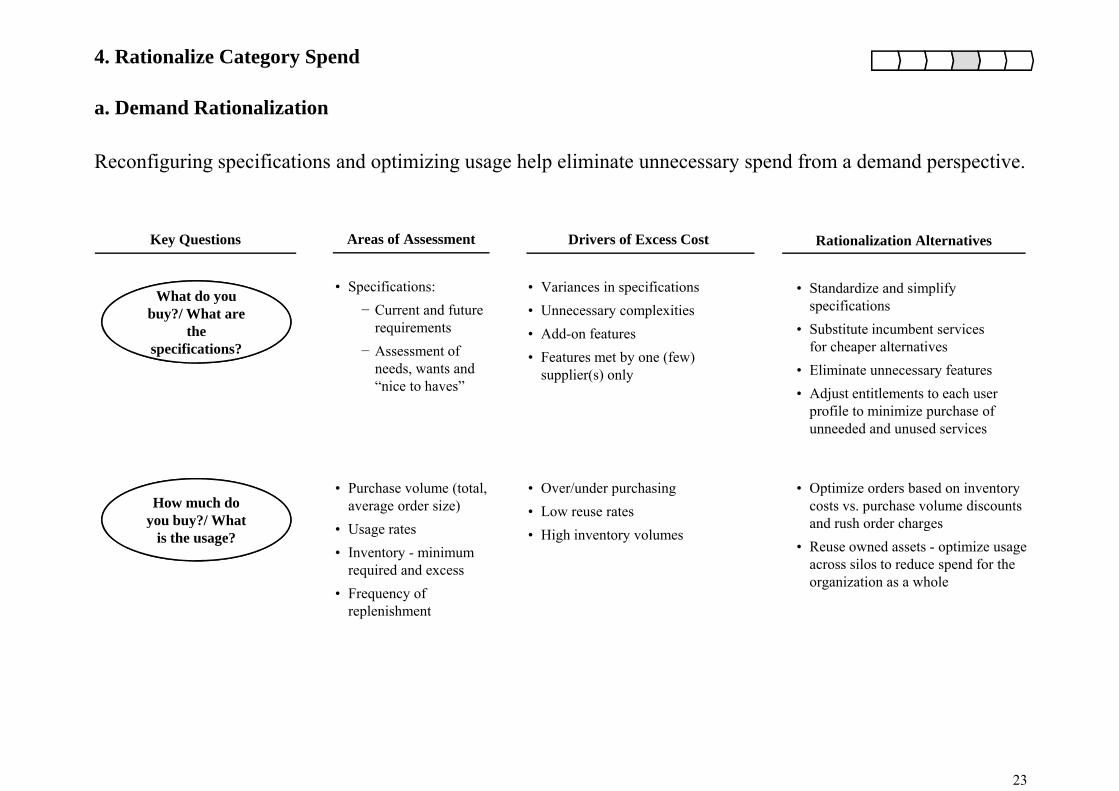
4. Rationalize Category Spend
Reconfiguring specifications and optimizing usage help eliminate unnecessary spend from a demand perspective.
a. Demand Rationalization
Key Questions Drivers of Excess Cost Rationalization AlternativesAreas of Assessment
What do you buy?/ What are
the specifications?
• Variances in specifications• Unnecessary complexities• Add-on features
• Standardize and simplify specifications
• Substitute incumbent services for cheaper alternatives
• Specifications:− Current and future
requirements− Assessment ofspecifications? • Features met by one (few)
supplier(s) only
o c eape a te at ves• Eliminate unnecessary features• Adjust entitlements to each user
profile to minimize purchase of unneeded and unused services
Assessment of needs, wants and “nice to haves”
How much do you buy?/ What
• Purchase volume (total, average order size)
• Usage rates
• Over/under purchasing• Low reuse rates
• Optimize orders based on inventory costs vs. purchase volume discounts and rush order chargesy y
is the usage? • Usage rates• Inventory - minimum
required and excess • Frequency of
replenishment
• High inventory volumesand rush order charges
• Reuse owned assets - optimize usage across silos to reduce spend for the organization as a whole
replenishment
23
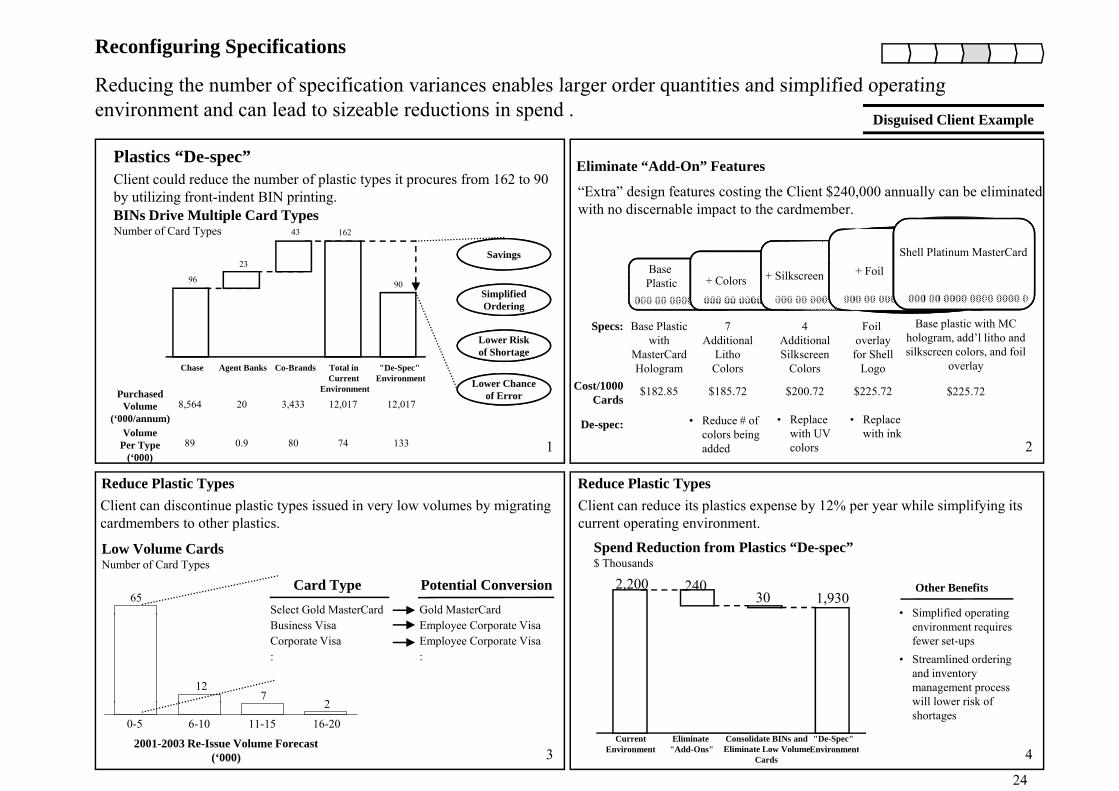
Reconfiguring Specifications
Reducing the number of specification variances enables larger order quantities and simplified operatingReducing the number of specification variances enables larger order quantities and simplified operating environment and can lead to sizeable reductions in spend .
Eliminate “Add-On” FeaturesPlastics “De-spec”Cli t ld d th b f l ti t it f 162 t 90
Disguised Client Example
“Extra” design features costing the Client $240,000 annually can be eliminated with no discernable impact to the cardmember.
Shell Platinum MasterCard
Client could reduce the number of plastic types it procures from 162 to 90 by utilizing front-indent BIN printing.BINs Drive Multiple Card TypesNumber of Card Types
23
16243
Savings
Specs:
000 00 0000 0000 0000 00 0000 0000 0000 00 0000 0000 0000 00 0000 0000 0000 00 0000 0000 0000 0
Base Plasticwith
M t C d
7Additional
Lith
4AdditionalSilk
Foil overlayf Sh ll
BasePlastic + Colors + Silkscreen + Foil
Base plastic with MC hologram, add’l litho and silkscreen colors and foil
96
23
90SimplifiedOrdering
Lower Riskof Shortage
Cost/1000Cards
$182.85
MasterCardHologram
LithoColors
SilkscreenColors
for ShellLogo
$185.72 $200.72 $225.72 $225.72
silkscreen colors, and foil overlay
• Replace with ink
• Replace with UV
• Reduce # of colors being
De-spec:
PurchasedVolume
(‘000/annum)Volume
8,564 20 3,433 12,017 12,017
Chase Agent Banks Co-Brands Total in Current
Environment
"De-Spec" Environment
of Shortage
Lower ChanceLower Chanceof Error
Client can reduce its plastics expense by 12% per year while simplifying its current operating environment.
colorsg
added
Client can discontinue plastic types issued in very low volumes by migrating cardmembers to other plastics.
Reduce Plastic Types Reduce Plastic Types
Per Type(‘000)
89 0.9 80 74 133 1 2
Spend Reduction from Plastics “De-spec”$ Thousands
current operating environment.
2,200 24030 1,930
• Simplified operating
Other Benefits
Low Volume CardsNumber of Card Types
cardmembers to other plastics.
65Select Gold MasterCard
Card Type Potential ConversionGold MasterCard Simplified operating
environment requires fewer set-ups
• Streamlined ordering and inventory management process will lower risk of
127
2
Business VisaCorporate Visa :
Employee Corporate VisaEmployee Corporate Visa:
24
Eliminate Low VolumeCurrent
Environment Eliminate
"Add-Ons"Consolidate BINs and
Cards
"De-Spec" Environment
will lower risk of shortages
2001-2003 Re-Issue Volume Forecast(‘000)
2
0-5 6-10 11-15 16-20
3 4
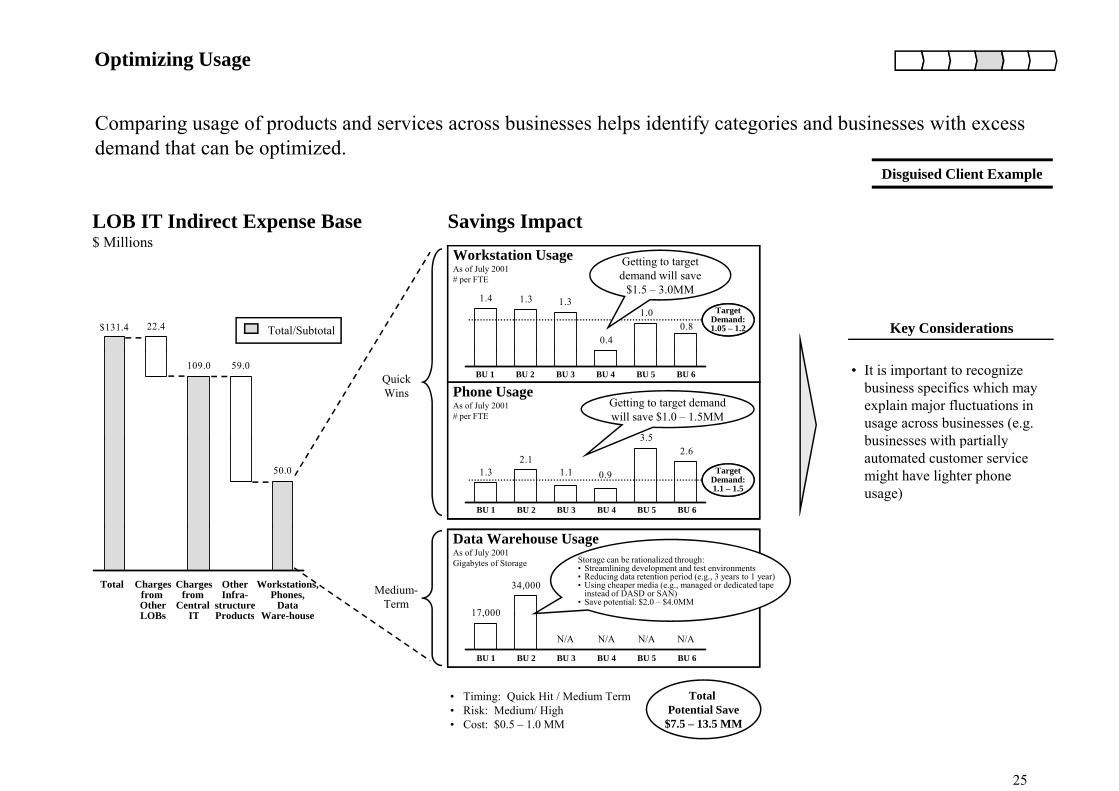
Optimizing Usage
Comparing usage of products and services across businesses helps identify categories and businesses with excess demand that can be optimized.
Disguised Client ExampleDisguised Client Example
LOB IT Indirect Expense Base$ Millions
Workstation Usage Getting to target
Savings Impact
Key Considerations22.4$131.4 Total/Subtotal
As of July 2001# per FTE
0.81.0
0.4
1.31.31.4Target
1.05 1.2
TargetDemand:1.05 – 1.2
Getting to target demand will save
$1.5 – 3.0MM
• It is important to recognize business specifics which may explain major fluctuations in usage across businesses (e.g. businesses with partially
59.0109.0BU 1 BU 2 BU 3 BU 4 BU 5 BU 6
Phone UsageAs of July 2001# per FTE
3 5
Getting to target demand will save $1.0 – 1.5MM
QuickWins
businesses with partially automated customer service might have lighter phone usage)
50.0
2.63.5
0.91.12.1
1.3 Target
1.1 1.5
TargetDemand:1.1 – 1.5
BU 1 BU 2 BU 3 BU 4 BU 5 BU 6
Total Chargesfrom OtherLOBs
Chargesfrom
Central IT
OtherInfra-
structureProducts
Workstations,Phones,
DataWare house
Data Warehouse UsageAs of July 2001Gigabytes of Storage
34,000
17,000
Storage can be rationalized through:• Streamlining development and test environments• Reducing data retention period (e.g., 3 years to 1 year)• Using cheaper media (e.g., managed or dedicated tape
instead of DASD or SAN)• Save potential: $2.0 – $4.0MM
Medium-Term
LOBs IT Products Ware-house
N/AN/AN/AN/A
17,000
BU 1 BU 2 BU 3 BU 4 BU 5 BU 6
• Timing: Quick Hit / Medium Term Total
25
• Risk: Medium/ High• Cost: $0.5 – 1.0 MM
Potential Save$7.5 – 13.5 MM
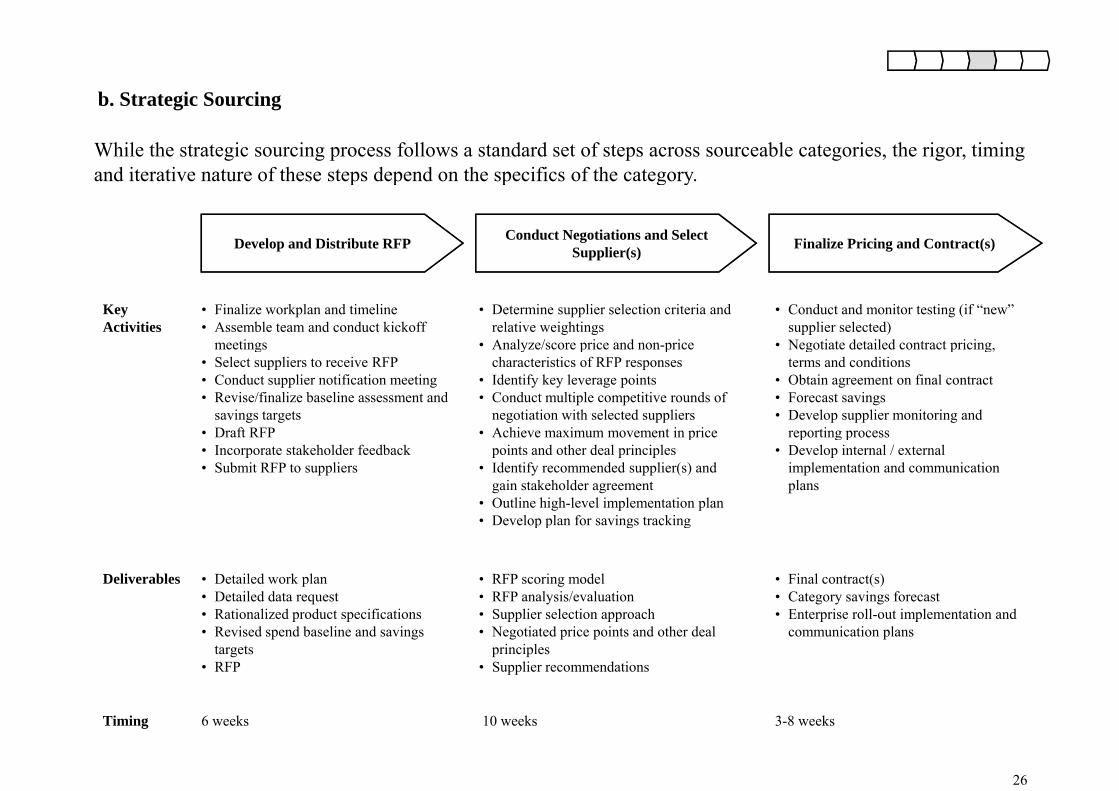
While the strategic sourcing process follows a standard set of steps across sourceable categories, the rigor, timing and iterative nature of these steps depend on the specifics of the category
b. Strategic Sourcing
and iterative nature of these steps depend on the specifics of the category.
Conduct Negotiations and Select Supplier(s) Finalize Pricing and Contract(s)Develop and Distribute RFP
• Finalize workplan and timeline• Assemble team and conduct kickoff
meetings
• Determine supplier selection criteria and relative weightings
• Analyze/score price and non-price
• Conduct and monitor testing (if “new” supplier selected)
• Negotiate detailed contract pricing,
Key Activities
g• Select suppliers to receive RFP• Conduct supplier notification meeting• Revise/finalize baseline assessment and
savings targets• Draft RFP
y p pcharacteristics of RFP responses
• Identify key leverage points • Conduct multiple competitive rounds of
negotiation with selected suppliers• Achieve maximum movement in price
g p g,terms and conditions
• Obtain agreement on final contract• Forecast savings• Develop supplier monitoring and
reporting process• Incorporate stakeholder feedback• Submit RFP to suppliers
ppoints and other deal principles
• Identify recommended supplier(s) and gain stakeholder agreement
• Outline high-level implementation plan• Develop plan for savings tracking
p g p• Develop internal / external
implementation and communication plans
Deliverables • Detailed work plan• Detailed data request• Rationalized product specifications
• RFP scoring model• RFP analysis/evaluation • Supplier selection approach
p p g g
• Final contract(s)• Category savings forecast• Enterprise roll-out implementation and• Rationalized product specifications
• Revised spend baseline and savings targets
• RFP
• Supplier selection approach• Negotiated price points and other deal
principles• Supplier recommendations
• Enterprise roll-out implementation and communication plans
26
Timing 6 weeks 10 weeks 3-8 weeks
Conduct high level assessment of supplier capabilities and select suppliers to be included in RFP process
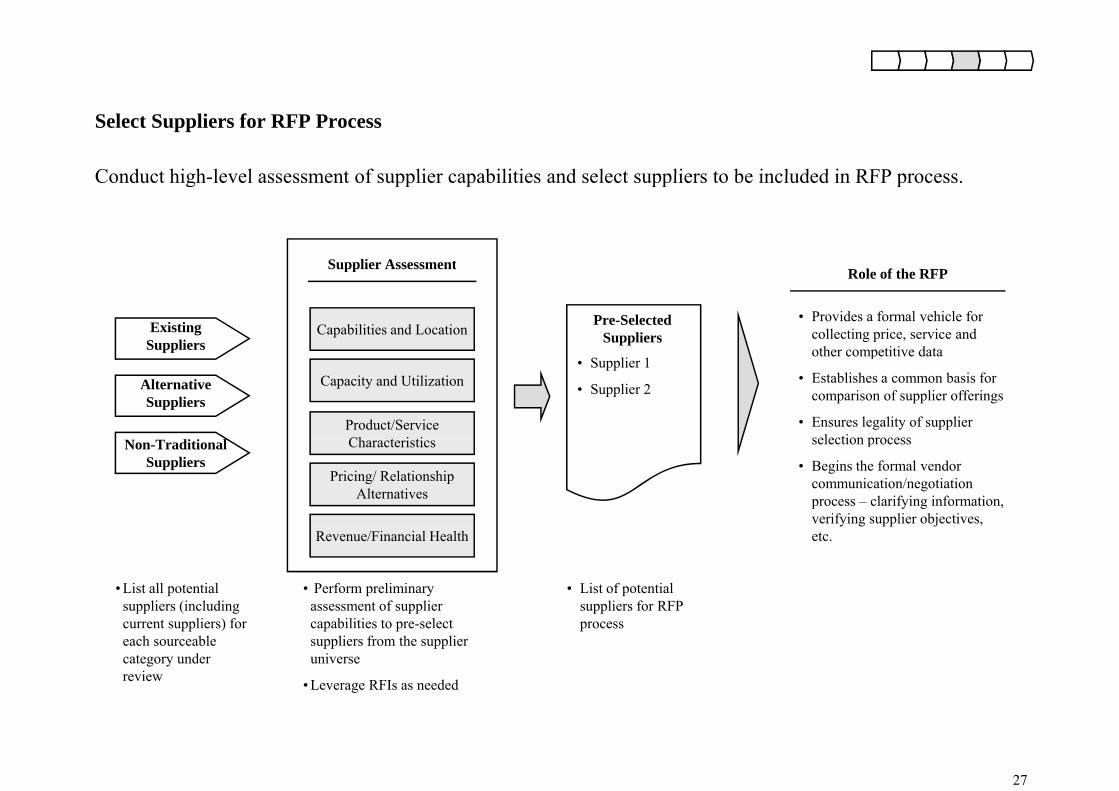
Select Suppliers for RFP Process
Conduct high-level assessment of supplier capabilities and select suppliers to be included in RFP process.
Supplier Assessment
Capabilities and Location
Supplier Assessment
Existing Suppliers
Role of the RFP
• Provides a formal vehicle for collecting price, service and other competitive data
Pre-Selected Suppliers
Capacity and Utilization
Product/Service Ch t i ti
pp
Alternative Suppliers
other competitive data
• Establishes a common basis for comparison of supplier offerings
• Ensures legality of supplier selection process
• Supplier 1
• Supplier 2
Pricing/ Relationship Alternatives
CharacteristicsNon-Traditional Suppliers
selection process
• Begins the formal vendor communication/negotiation process – clarifying information, verifying supplier objectives,
• List all potential suppliers (including
Revenue/Financial Health
• List of potential suppliers for RFP
• Perform preliminary assessment of supplier
etc.
current suppliers) for each sourceable category under review
processcapabilities to pre-select suppliers from the supplier universe
• Leverage RFIs as needed
27
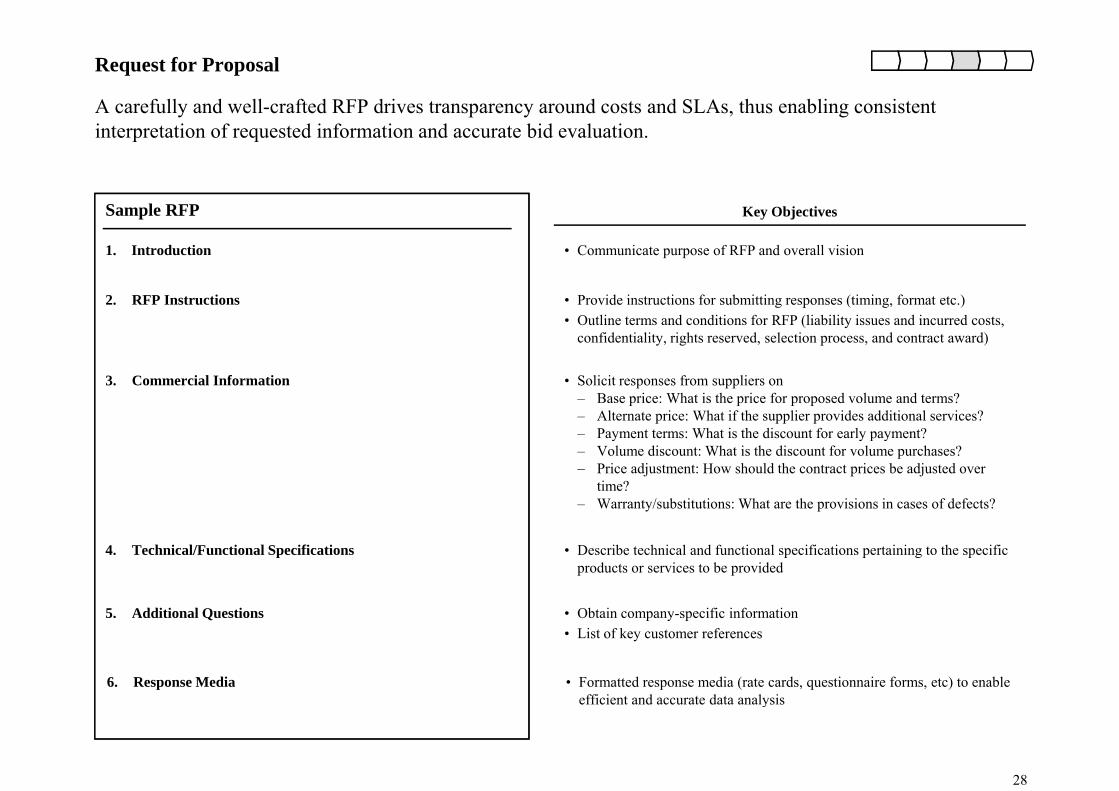
Request for Proposal
A carefully and well-crafted RFP drives transparency around costs and SLAs, thus enabling consistent interpretation of requested information and accurate bid evaluation.
Sample RFP
1. Introduction
Key Objectives
• Communicate purpose of RFP and overall vision
2. RFP Instructions • Provide instructions for submitting responses (timing, format etc.)• Outline terms and conditions for RFP (liability issues and incurred costs,
confidentiality, rights reserved, selection process, and contract award)
3. Commercial Information • Solicit responses from suppliers on– Base price: What is the price for proposed volume and terms?– Alternate price: What if the supplier provides additional services?– Payment terms: What is the discount for early payment?y y p y– Volume discount: What is the discount for volume purchases? – Price adjustment: How should the contract prices be adjusted over
time?– Warranty/substitutions: What are the provisions in cases of defects?
4. Technical/Functional Specifications
5 Additional Questions
• Describe technical and functional specifications pertaining to the specific products or services to be provided
• Obtain company-specific information5. Additional Questions Obtain company-specific information• List of key customer references
6. Response Media • Formatted response media (rate cards, questionnaire forms, etc) to enable efficient and accurate data analysis
28
efficient and accurate data analysis
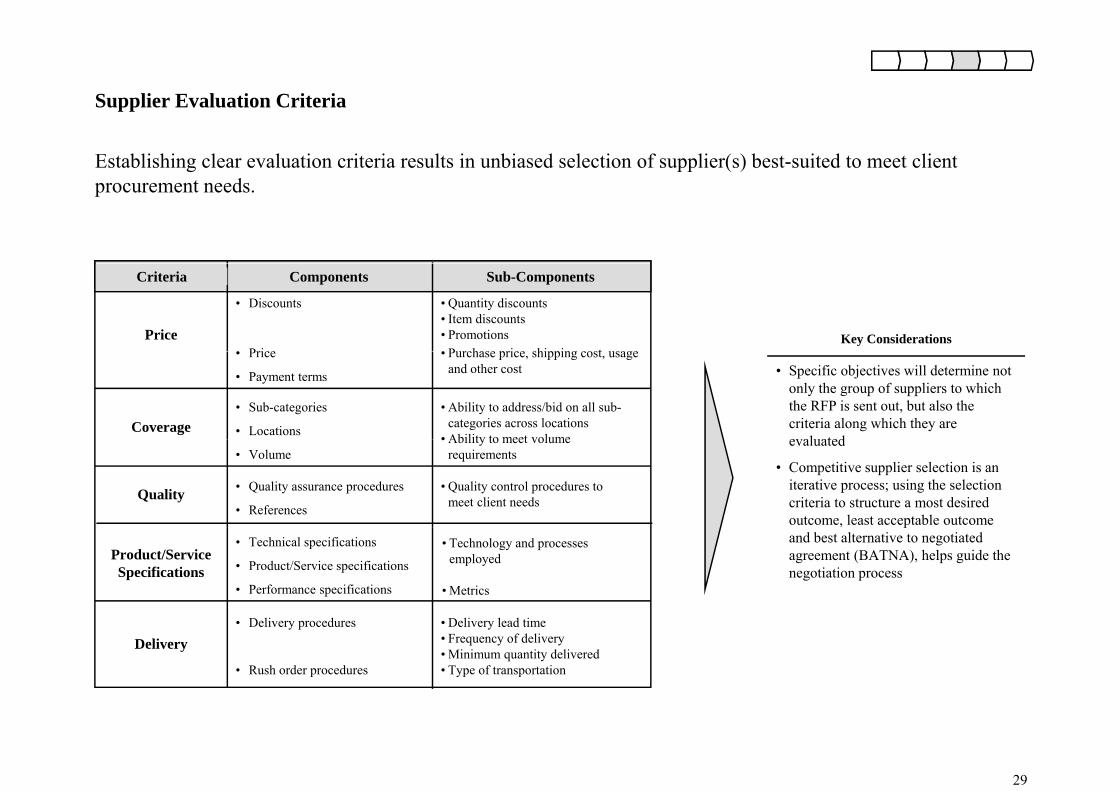
Supplier Evaluation Criteria
Establishing clear evaluation criteria results in unbiased selection of supplier(s) best-suited to meet client procurement needs.
Criteria Components Sub-Components
Price
• Discounts • Quantity discounts• Item discounts• Promotions Key Considerations• Purchase price shipping cost usage• Price
Coverage• Sub-categories
• Locations
• Ability to address/bid on all sub-categories across locations
• Ability to meet volume
• Specific objectives will determine not only the group of suppliers to which the RFP is sent out, but also the criteria along which they are evaluated
• Purchase price, shipping cost, usage and other cost
• Price
• Payment terms
• Volume• Ability to meet volume
requirementsevaluated
• Competitive supplier selection is an iterative process; using the selection criteria to structure a most desired outcome, least acceptable outcome
Quality • Quality assurance procedures
• References
• Quality control procedures to meet client needs
Product/Service Specifications
• Technical specifications
• Product/Service specifications
• Performance specifications
, pand best alternative to negotiated agreement (BATNA), helps guide the negotiation process
• Technology and processes employed
• Metrics
Delivery• Delivery procedures
• Rush order procedures
• Delivery lead time• Frequency of delivery• Minimum quantity delivered• Type of transportation
29
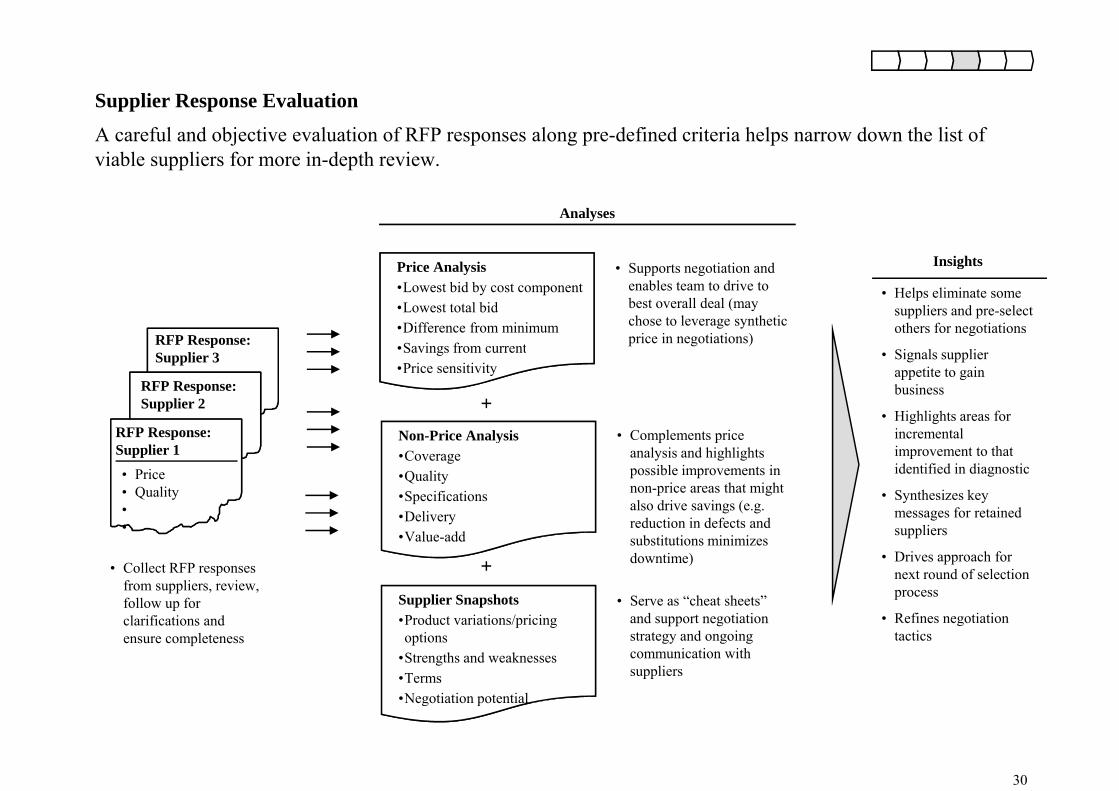
Supplier Response Evaluation
A careful and objective evaluation of RFP responses along pre-defined criteria helps narrow down the list of viable suppliers for more in-depth review.
S i i d
Analyses
P i A l i Insights• Supports negotiation and enables team to drive to best overall deal (may chose to leverage synthetic price in negotiations)RFP Response:
Price Analysis•Lowest bid by cost component•Lowest total bid•Difference from minimum•Savings from current
Insights
• Helps eliminate some suppliers and pre-select others for negotiations
Si l li
• Price• Quality ••
Supplier 3Savings from current
•Price sensitivity
• Price
RFP Response: Supplier 2
RFP Response:
• Signals supplier appetite to gain business
• Highlights areas for incremental • Complements priceNon-Price Analysis
+
• Quality ••• Price
• Quality ••
pSupplier 1 improvement to that
identified in diagnostic
• Synthesizes key messages for retained
li
Complements price analysis and highlights possible improvements in non-price areas that might also drive savings (e.g. reduction in defects and
Non Price Analysis•Coverage •Quality•Specifications•Delivery
• Collect RFP responses from suppliers, review, follow up for
• suppliers
• Drives approach for next round of selection process
R fi ti ti
reduction in defects and substitutions minimizes downtime)
•Value-add
• Serve as “cheat sheets” d t ti ti
Supplier Snapshotsd i i / i i
+
clarifications and ensure completeness
• Refines negotiation tactics
and support negotiation strategy and ongoing communication with suppliers
•Product variations/pricing options
•Strengths and weaknesses•Terms•Negotiation potential
30
Negotiation potential
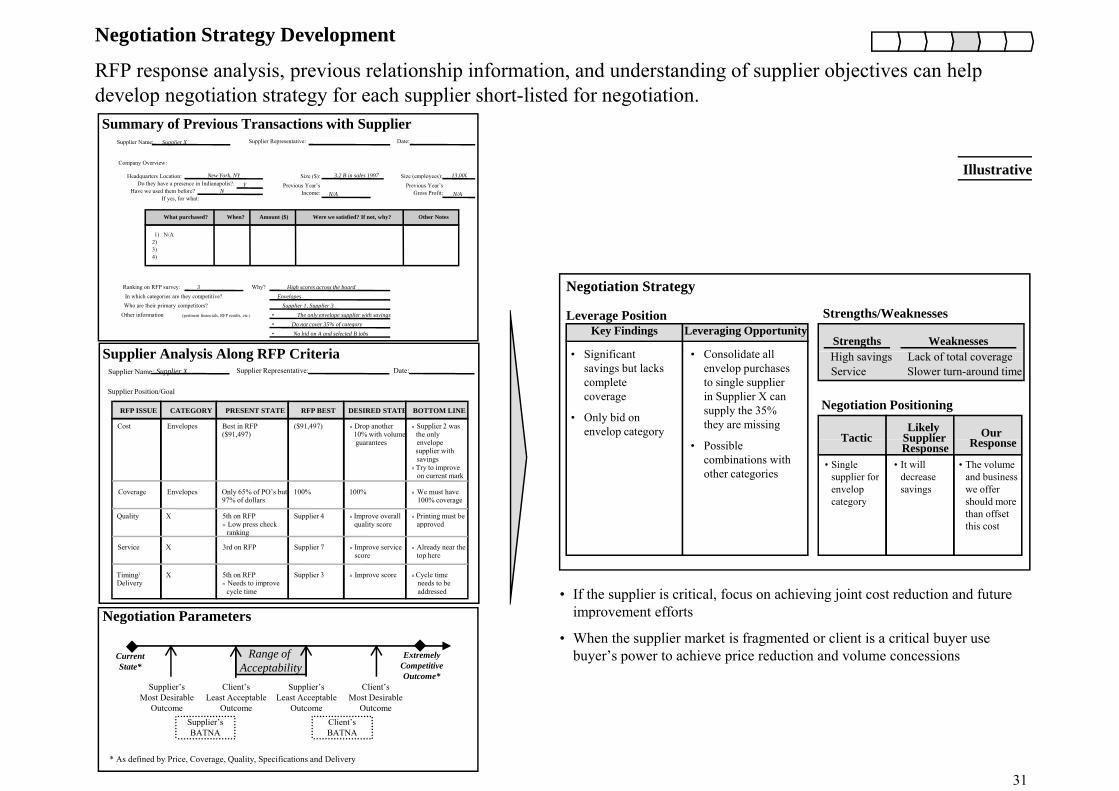
Negotiation Strategy Development
RFP response analysis, previous relationship information, and understanding of supplier objectives can help d l i i f h li h li d f i idevelop negotiation strategy for each supplier short-listed for negotiation. Summary of Previous Transactions with Supplier
Supplier Name: Supplier X Supplier Representative: Date:
Company Overview:
Headquarters Location: Size ($): Size (employees):New York NY 3 2 B in sales 1997 13 000 IllustrativeHeadquarters Location:Do they have a presence in Indianapolis?:
Have we used them before?If yes, for what:
Size ($):Previous Year’s
Income:
Size (employees):Previous Year’s
Gross Profit:
New York, NYY
N
3.2 B in sales 1997
N/AN/A
13,000
What purchased? When? Amount ($) Were we satisfied? If not, why? Other Notes
1) N/A2)3)4)
Negotiation Strategy Ranking on RFP survey:In which categories are they competitive?Who are their primary competitors?
Other information (pertinent financials, RFP results, etc.)
Why? High scores across the boardEnvelopes
Supplier 1, Supplier 3• The only envelope supplier with savings• Do not cover 35% of category• No bid on A and selected B jobs
3
S li A l i Al RFP C it i
Key Findings Leveraging OpportunityLeverage Position Strengths/Weaknesses
Strengths WeaknessesSi ifi t C lid t llSupplier Analysis Along RFP Criteria
TacticLikely
Supplier OurR
Negotiation Positioning
High savingsService
Lack of total coverageSlower turn-around timeSupplier Name: Supplier X Supplier Representative: Date:
Supplier Position/Goal
RFP ISSUE CATEGORY PRESENT STATE RFP BEST DESIRED STATE BOTTOM LINE
Cost Envelopes Best in RFP($91,497)
($91,497) n Drop another10% with volume
n Supplier 2 wasthe only
• Significant savings but lacks complete coverage
• Only bid on envelop category
• Consolidate all envelop purchases to single supplier in Supplier X can supply the 35% they are missing
Tactic SupplierResponse Responseguarantees envelope
supplier withsavings
n Try to improveon current mark
Coverage Envelopes Only 65% of PO’s but97% of dollars
100% 100% n We must have100% coverage
Quality X Supplier 4 n Printing must beapproved
n Improve overallquality score
5th on RFPn Low press check
• Possible combinations with other categories
• Single supplier for envelop category
• It will decrease savings
• The volume and business we offer should more than offset this cost
• If the supplier is critical, focus on achieving joint cost reduction and future improvement efforts
5th on RFPn Needs to improve
cycle time
ppq y
Service X 3rd on RFP Supplier 7 n Already near thetop here
n Improve servicescore
Timing/Delivery
X Supplier 3 n Cycle timeneeds to beaddressed
n Improve score
pranking
this cost
Negotiation Parameters improvement efforts
• When the supplier market is fragmented or client is a critical buyer use buyer’s power to achieve price reduction and volume concessions
Negotiation Parameters
Current State*
ExtremelyCompetitive Outcome*
Client’s Most Desirable
Supplier’sLeast Acceptable
Client’s Least Acceptable
Supplier’sMost Desirable
Range of Acceptability
31
OutcomeOutcomeOutcomeOutcomeClient’s BATNA
Supplier’sBATNA
* As defined by Price, Coverage, Quality, Specifications and Delivery
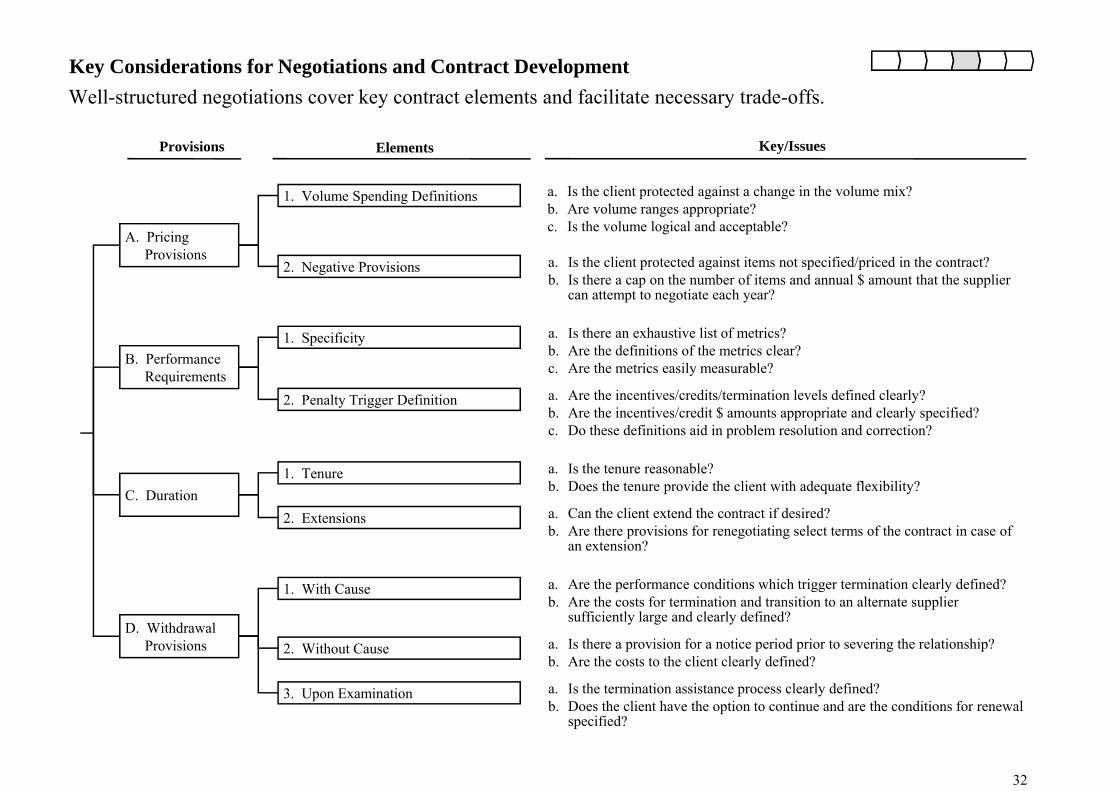
Key Considerations for Negotiations and Contract Development
Provisions Elements Key/Issues
Well-structured negotiations cover key contract elements and facilitate necessary trade-offs.
A. Pricing Provisions
a. Is the client protected against a change in the volume mix?b. Are volume ranges appropriate?c. Is the volume logical and acceptable?
1. Volume Spending Definitions
2 N ti P i i a Is the client protected against items not specified/priced in the contract?2. Negative Provisions a. Is the client protected against items not specified/priced in the contract?b. Is there a cap on the number of items and annual $ amount that the supplier
can attempt to negotiate each year?
1. Specificity a. Is there an exhaustive list of metrics?b Are the definitions of the metrics clear?B. Performance
Requirements
b. Are the definitions of the metrics clear?c. Are the metrics easily measurable?
2. Penalty Trigger Definition a. Are the incentives/credits/termination levels defined clearly?b. Are the incentives/credit $ amounts appropriate and clearly specified?c. Do these definitions aid in problem resolution and correction?
C. Duration1. Tenure a. Is the tenure reasonable?
b. Does the tenure provide the client with adequate flexibility?
2. Extensions a. Can the client extend the contract if desired?b A th i i f ti ti l t t f th t t i fb. Are there provisions for renegotiating select terms of the contract in case of
an extension?
1. With Cause a. Are the performance conditions which trigger termination clearly defined?b. Are the costs for termination and transition to an alternate supplier
sufficiently large and clearly defined?D. Withdrawal
Provisions
sufficiently large and clearly defined?
2. Without Cause a. Is there a provision for a notice period prior to severing the relationship?b. Are the costs to the client clearly defined?
3. Upon Examination a. Is the termination assistance process clearly defined?b D th li t h th ti t ti d th diti f l
32
b. Does the client have the option to continue and are the conditions for renewal specified?
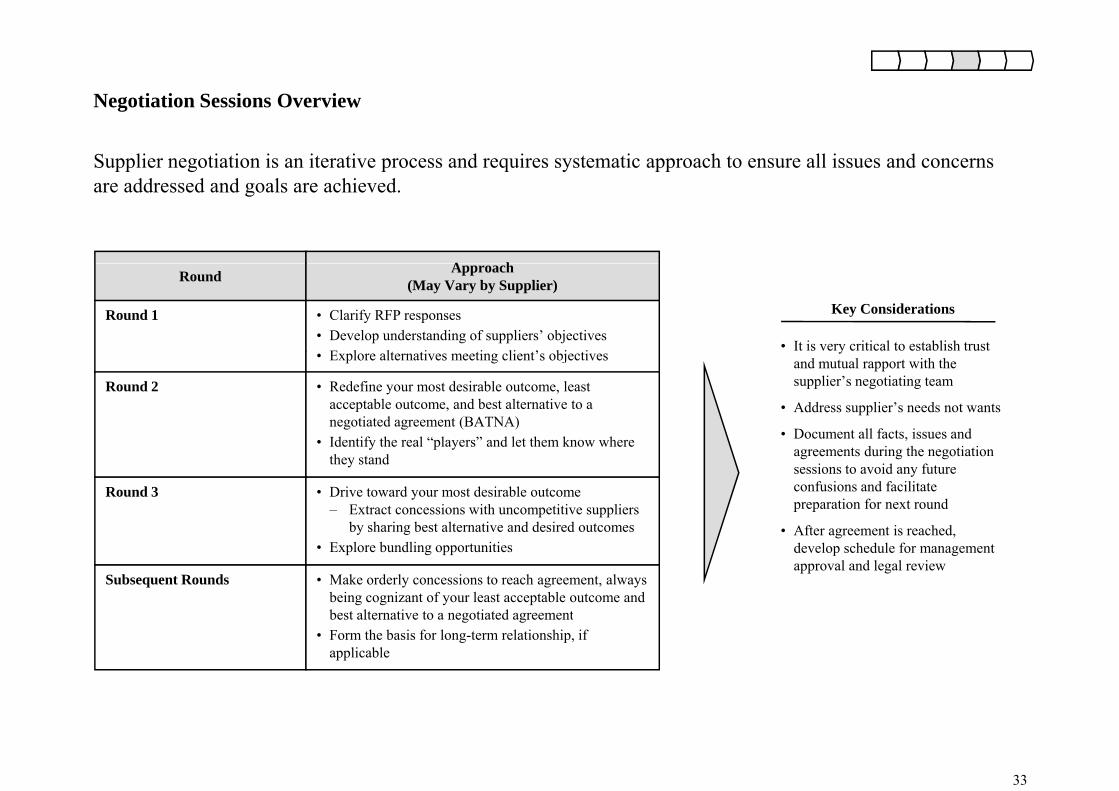
Negotiation Sessions Overview
Supplier negotiation is an iterative process and requires systematic approach to ensure all issues and concerns are addressed and goals are achieved.
A h
Key Considerations
• It is very critical to establish trust
Round 1
Round
• Clarify RFP responses• Develop understanding of suppliers’ objectives
E l l i i li ’ bj i
Approach(May Vary by Supplier)
yand mutual rapport with the supplier’s negotiating team
• Address supplier’s needs not wants
• Document all facts, issues and
• Explore alternatives meeting client’s objectives
Round 2 • Redefine your most desirable outcome, least acceptable outcome, and best alternative to a negotiated agreement (BATNA)Id tif th l “ l ” d l t th k h ,
agreements during the negotiation sessions to avoid any future confusions and facilitate preparation for next round
Aft t i h d
• Identify the real “players” and let them know where they stand
Round 3 • Drive toward your most desirable outcome – Extract concessions with uncompetitive suppliers
by sharing best alternative and desired outcomes • After agreement is reached, develop schedule for management approval and legal review
by sharing best alternative and desired outcomes• Explore bundling opportunities
Subsequent Rounds • Make orderly concessions to reach agreement, always being cognizant of your least acceptable outcome and best alternative to a negotiated agreementbest alternative to a negotiated agreement
• Form the basis for long-term relationship, if applicable
33
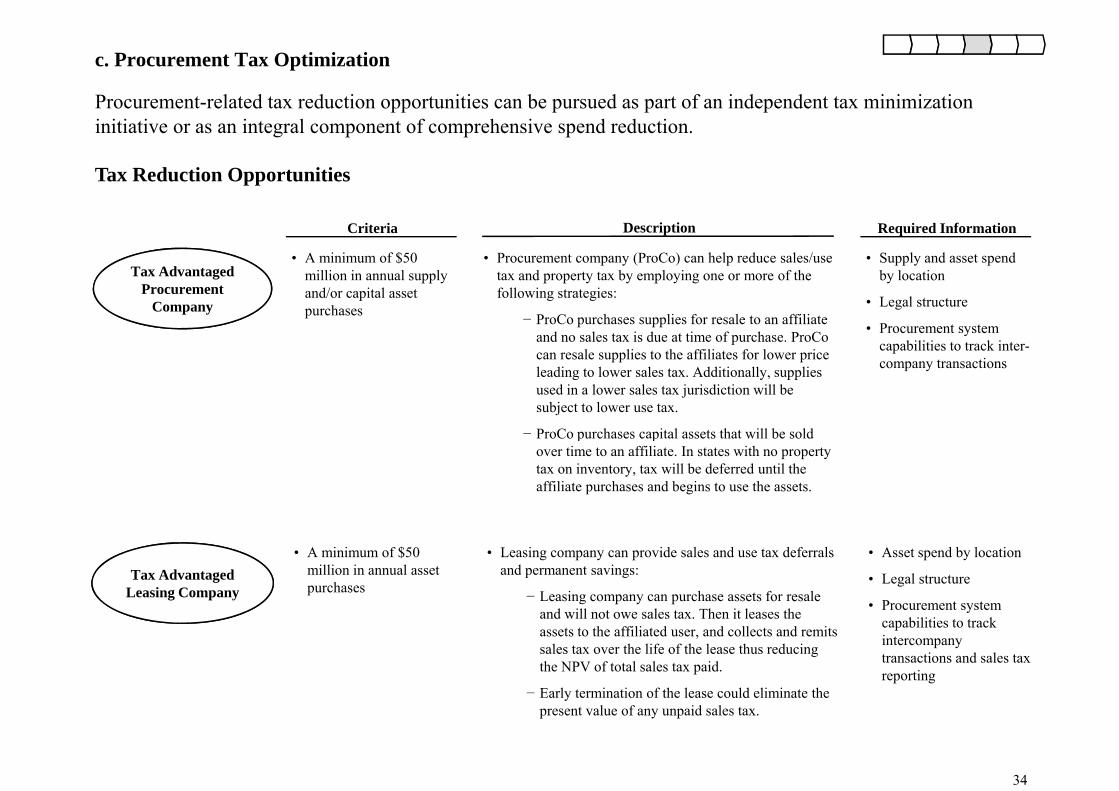
c. Procurement Tax Optimization
Procurement-related tax reduction opportunities can be pursued as part of an independent tax minimization initiative or as an integral component of comprehensive spend reduction.
Tax Reduction Opportunities
Criteria
• A minimum of $50
Description
• Procurement company (ProCo) can help reduce sales/use
Required Information
• Supply and asset spend
Tax Reduction Opportunities
Tax Advantaged Procurement
Company
$million in annual supply and/or capital asset purchases
p y ( ) ptax and property tax by employing one or more of the following strategies:
− ProCo purchases supplies for resale to an affiliate and no sales tax is due at time of purchase. ProCo
l li t th ffili t f l i
pp y pby location
• Legal structure
• Procurement system capabilities to track inter-can resale supplies to the affiliates for lower price
leading to lower sales tax. Additionally, supplies used in a lower sales tax jurisdiction will be subject to lower use tax.
− ProCo purchases capital assets that will be sold
pcompany transactions
p pover time to an affiliate. In states with no property tax on inventory, tax will be deferred until the affiliate purchases and begins to use the assets.
• A minimum of $50 million in annual asset purchases
• Leasing company can provide sales and use tax deferrals and permanent savings:
− Leasing company can purchase assets for resale and will not owe sales tax Then it leases the
• Asset spend by location
• Legal structure
• Procurement system
Tax Advantaged Leasing Company
and will not owe sales tax. Then it leases the assets to the affiliated user, and collects and remits sales tax over the life of the lease thus reducing the NPV of total sales tax paid.
− Early termination of the lease could eliminate the
capabilities to track intercompany transactions and sales tax reporting
34
present value of any unpaid sales tax.
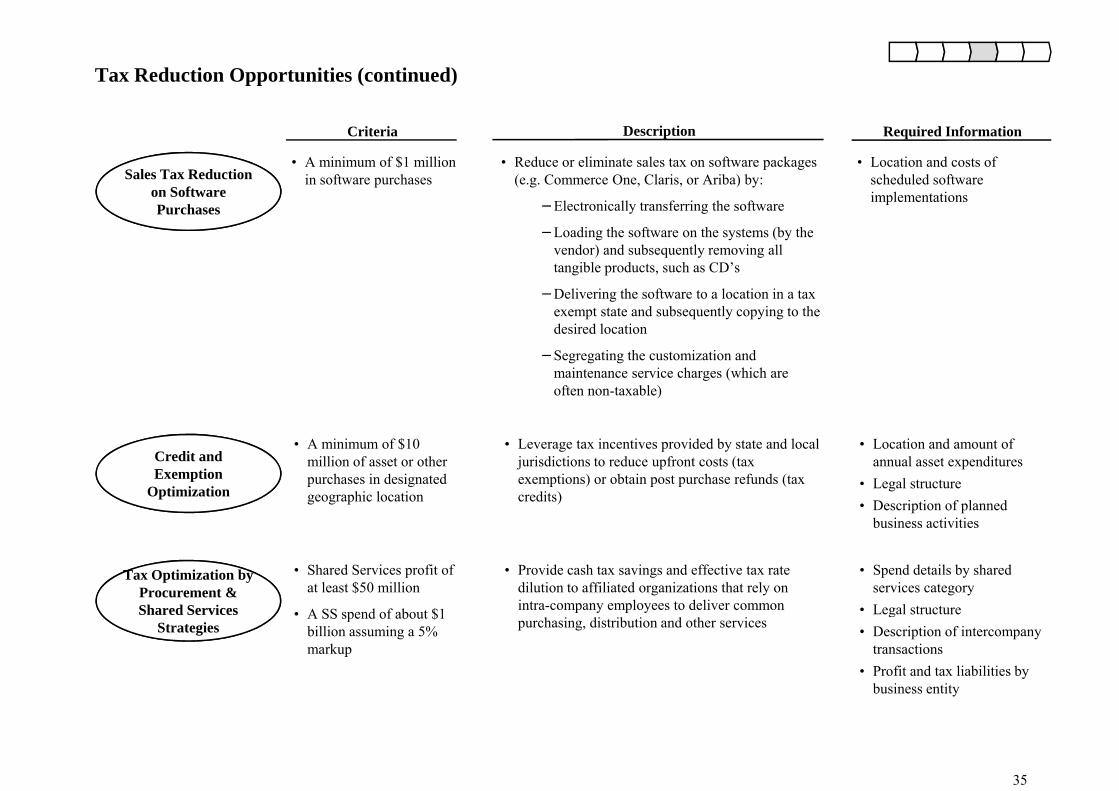
Tax Reduction Opportunities (continued)
Sales Tax Reduction
Criteria
• A minimum of $1 million i ft h
Description
• Reduce or eliminate sales tax on software packages ( C O Cl i A ib ) b
Required Information
• Location and costs of h d l d ftSales Tax Reduction
on Software Purchases
in software purchases (e.g. Commerce One, Claris, or Ariba) by:
−Electronically transferring the software
−Loading the software on the systems (by the vendor) and subsequently removing all t ibl d t h CD’
scheduled software implementations
tangible products, such as CD’s
−Delivering the software to a location in a tax exempt state and subsequently copying to the desired location
S ti th t i ti d
A i i f $10
−Segregating the customization and maintenance service charges (which are often non-taxable)
L i i id d b d l l L i d f• A minimum of $10 million of asset or other purchases in designated geographic location
• Leverage tax incentives provided by state and local jurisdictions to reduce upfront costs (tax exemptions) or obtain post purchase refunds (tax credits)
• Location and amount of annual asset expenditures
• Legal structure• Description of planned
business activities
Credit and Exemption
Optimization
business activities
• Shared Services profit of at least $50 million
• A SS spend of about $1
• Provide cash tax savings and effective tax rate dilution to affiliated organizations that rely on intra-company employees to deliver common
• Spend details by shared services category
• Legal structure
Tax Optimization by Tax Optimization by Procurement & Shared Services • A SS spend of about $1
billion assuming a 5% markup
purchasing, distribution and other servicesg
• Description of intercompany transactions
• Profit and tax liabilities by business entity
S ed Se v cesStrategies
35
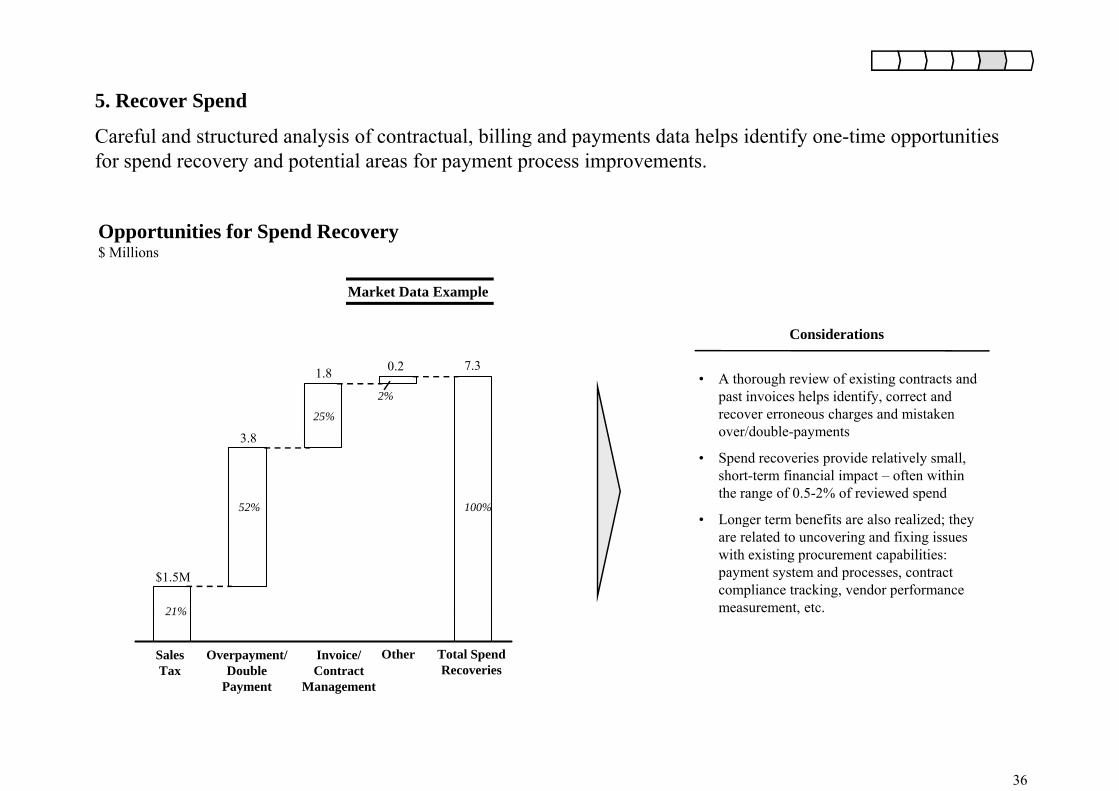
5. Recover Spend
Careful and structured analysis of contractual, billing and payments data helps identify one-time opportunities for spend recovery and potential areas for payment process improvements.
Opportunities for Spend Recovery$ Millions
Considerations
Market Data Example
3 8
1.8 0.2 7.3• A thorough review of existing contracts and
past invoices helps identify, correct and recover erroneous charges and mistaken over/double-payments
25%
2%
3.8 p y
• Spend recoveries provide relatively small, short-term financial impact – often within the range of 0.5-2% of reviewed spend
• Longer term benefits are also realized; they 52% 100%
$1.5M
g yare related to uncovering and fixing issues with existing procurement capabilities: payment system and processes, contract compliance tracking, vendor performance measurement, etc.21%
Sales Tax
Overpayment/Double
Payment
Invoice/ Contract
Management
Other Total Spend Recoveries
21%
36
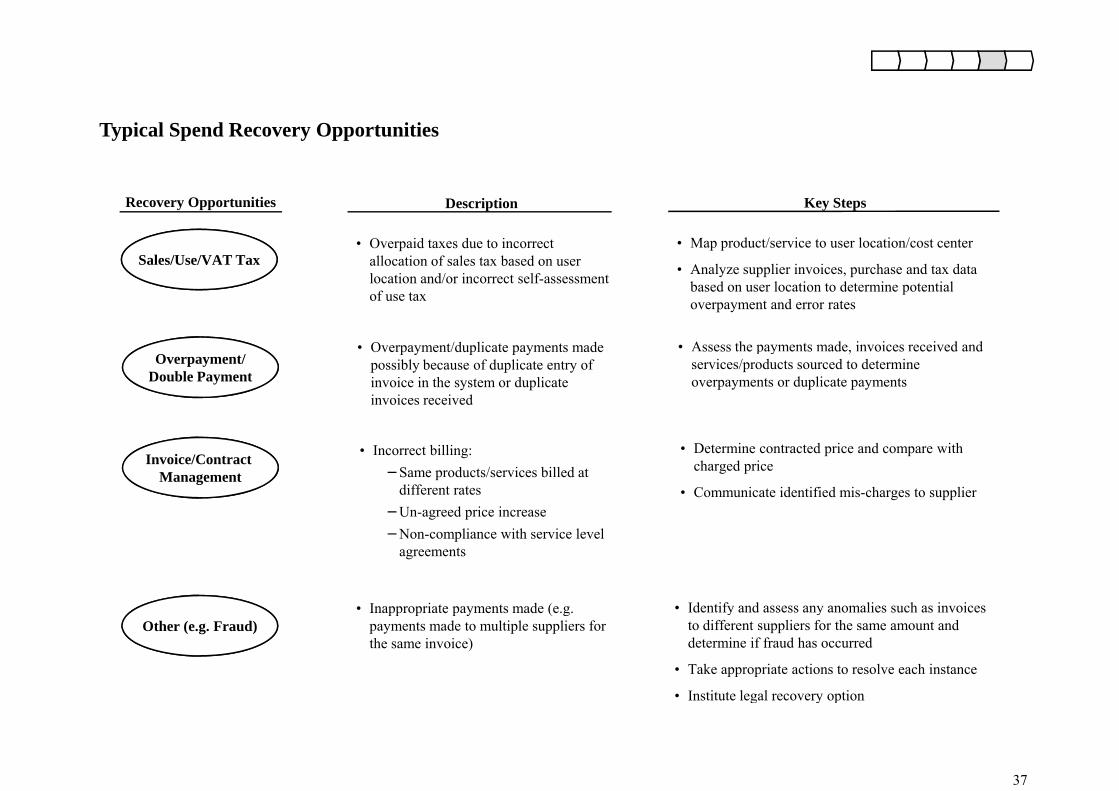
Typical Spend Recovery Opportunities
Recovery Opportunities
Sales/Use/VAT Tax
Description
• Overpaid taxes due to incorrect allocation of sales tax based on user
Key Steps
• Map product/service to user location/cost centerSales/Use/VAT Tax allocation of sales tax based on user
location and/or incorrect self-assessment of use tax
• Overpayment/duplicate payments made
• Analyze supplier invoices, purchase and tax data based on user location to determine potential overpayment and error rates
• Assess the payments made, invoices received and Overpayment/
Double Payment
Overpayment/duplicate payments made possibly because of duplicate entry of invoice in the system or duplicate invoices received
ssess t e pay e ts ade, vo ces ece ved a dservices/products sourced to determine overpayments or duplicate payments
Invoice/Contract Management
• Incorrect billing:−Same products/services billed at
different rates−Un-agreed price increase
• Determine contracted price and compare with charged price
• Communicate identified mis-charges to supplier
−Non-compliance with service level agreements
• Inappropriate payments made (e.g. • Identify and assess any anomalies such as invoices Other (e.g. Fraud)
pp p p y ( gpayments made to multiple suppliers for the same invoice)
y yto different suppliers for the same amount and determine if fraud has occurred
• Take appropriate actions to resolve each instance
• Institute legal recovery option
37
g y p
6. Implement and Capture Savings
Capturing full benefits of identified spend reduction opportunities requires detailed implementation planning, continued organizational commitment, and regular communication and follow-up.p g, g , g p
Implementation/Transition Plan. A fully dedicated implementation team with clear responsibilities and ownership should be selected to execute against a detailed plan outliningresponsibilities and ownership should be selected to execute against a detailed plan outlining (1) the transition from old to new suppliers and (2) the communication of the new sourcing strategy, policies and procedures to all affected people.
Savings Tracking Mechanism As improvements are implemented a tracking mechanismSavings Tracking Mechanism. As improvements are implemented, a tracking mechanism should be established to monitor the actual savings and timeline compared to the original estimates. Implementation progress should be communicated to the organization on a periodic basis.
Supplier Relationship Management. A core team/function with clear responsibilities should be established to manage supplier relationships, monitor performance and drive continuous efficiency improvements.
38
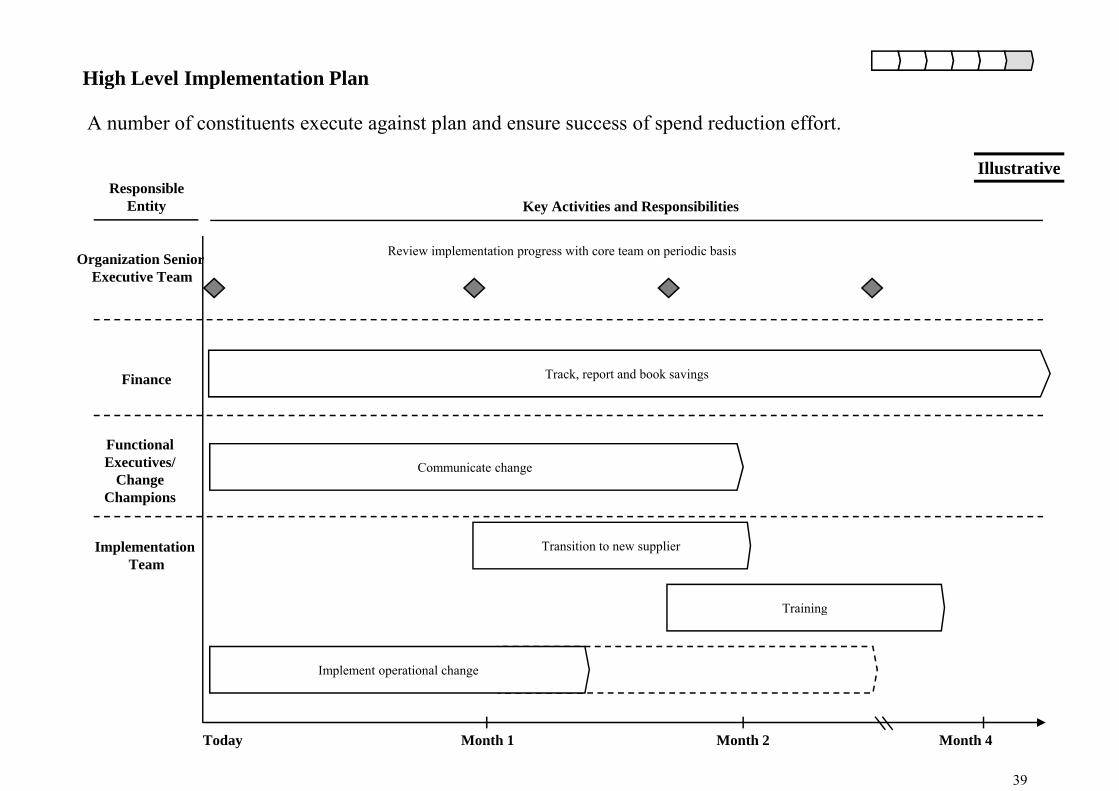
High Level Implementation Plang p
Illustrative
A number of constituents execute against plan and ensure success of spend reduction effort.
Responsible Entity Key Activities and Responsibilities
Organization Senior Review implementation progress with core team on periodic basisOrganization Senior Executive Team
Finance Track, report and book savings
Functional Executives/
Change Champions
Communicate change
Implementation Team
Transition to new supplier
Trainingg
Implement operational change
39
Today Month 1 Month 2 Month 4
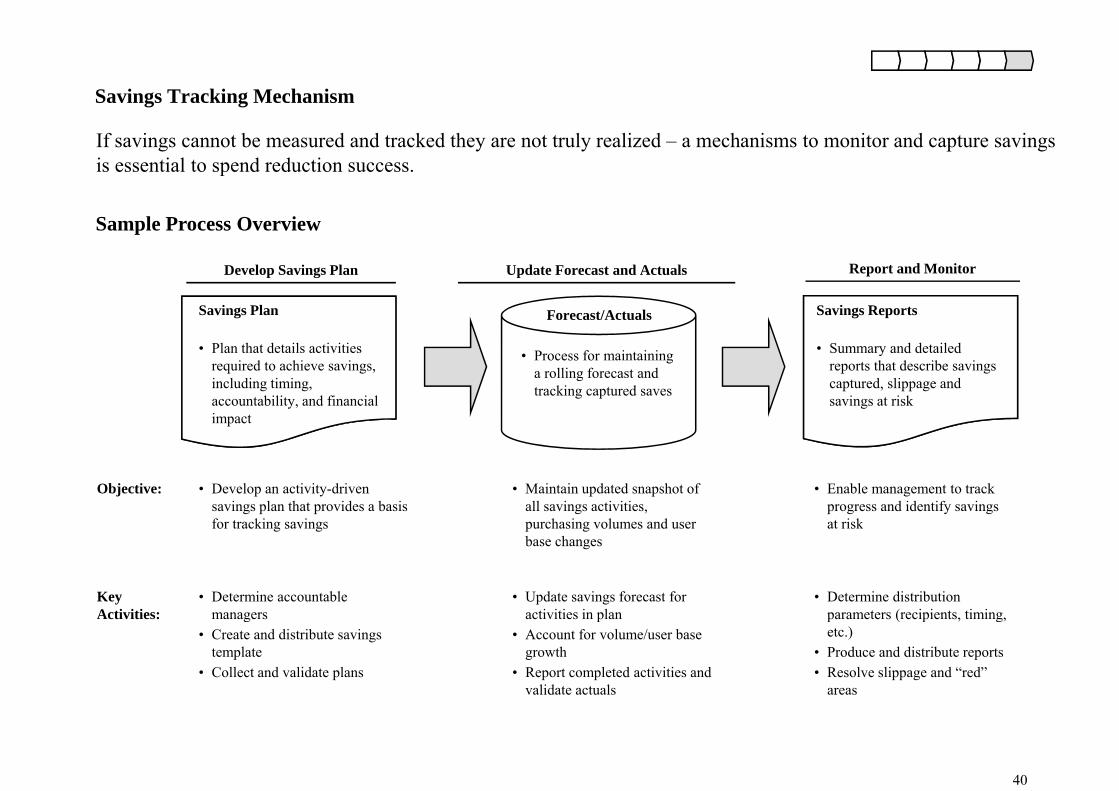
Savings Tracking Mechanism
If savings cannot be measured and tracked they are not truly realized – a mechanisms to monitor and capture savings is essential to spend reduction success.
Sample Process Overview
i
p
Develop Savings Plan Update Forecast and Actuals Report and Monitor
Savings Plan
• Plan that details activities
Savings Reports
• Summary and detailed
Forecast/Actuals
P f i i iPlan that details activities required to achieve savings, including timing, accountability, and financial impact
Summary and detailed reports that describe savings captured, slippage and savings at risk
• Process for maintaining a rolling forecast and tracking captured saves
Objective: • Develop an activity-driven savings plan that provides a basis for tracking savings
• Maintain updated snapshot of all savings activities, purchasing volumes and user
• Enable management to track progress and identify savings at risk
KeyActivities:
for tracking savings purchasing volumes and user base changes
at risk
• Determine accountable managers
• Update savings forecast for activities in plan
• Determine distribution parameters (recipients timingActivities: managers
• Create and distribute savings template
• Collect and validate plans
activities in plan• Account for volume/user base
growth • Report completed activities and
validate actuals
parameters (recipients, timing, etc.)
• Produce and distribute reports • Resolve slippage and “red”
areas
40
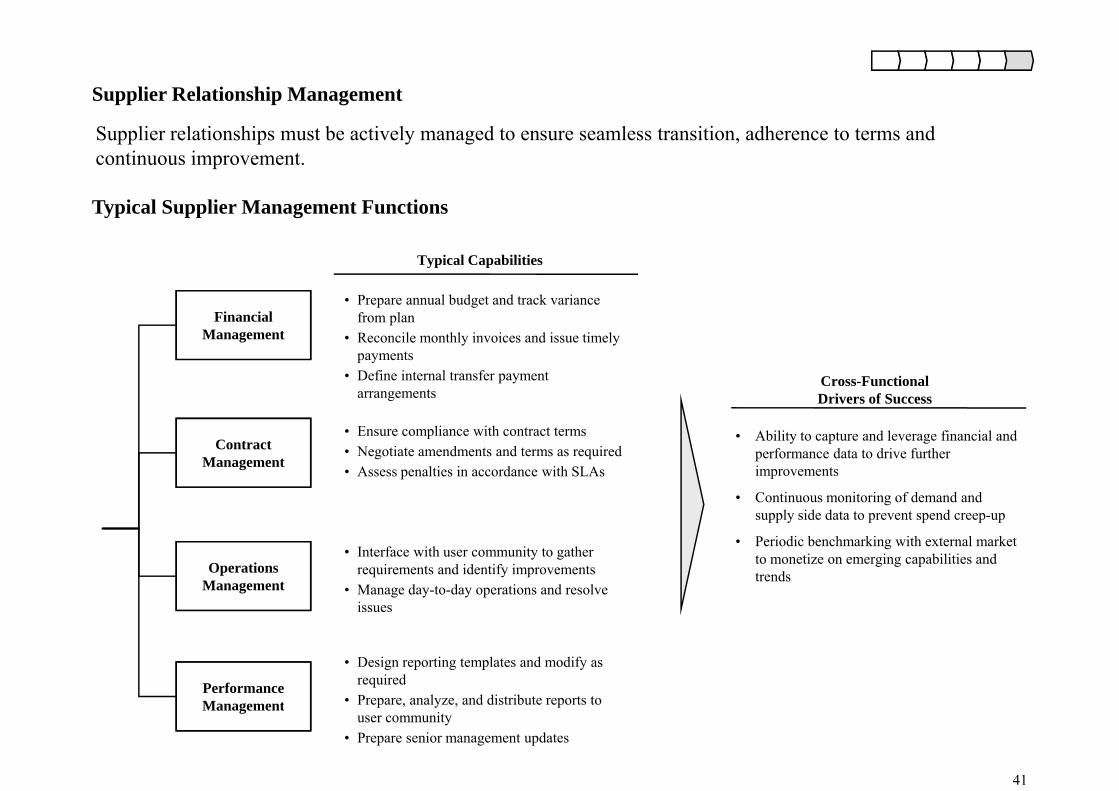
S li R l i hi M
Supplier relationships must be actively managed to ensure seamless transition, adherence to terms and continuous improvement.
Supplier Relationship Management
Typical Capabilities
Typical Supplier Management Functions
• Prepare annual budget and track variance from plan
• Reconcile monthly invoices and issue timely t
Typical Capabilities
Financial Management
payments• Define internal transfer payment
arrangements
• Ensure compliance with contract terms • Ability to capture and leverage financial and
Cross-Functional Drivers of Success
• Negotiate amendments and terms as required• Assess penalties in accordance with SLAs
Contract Management
Ability to capture and leverage financial and performance data to drive further improvements
• Continuous monitoring of demand and supply side data to prevent spend creep-up
• Interface with user community to gather requirements and identify improvements
• Manage day-to-day operations and resolve issues
Operations Management
• Periodic benchmarking with external market to monetize on emerging capabilities and trends
• Design reporting templates and modify as required
• Prepare analyze and distribute reports toPerformance M t
41
Prepare, analyze, and distribute reports to user community
• Prepare senior management updates
Management
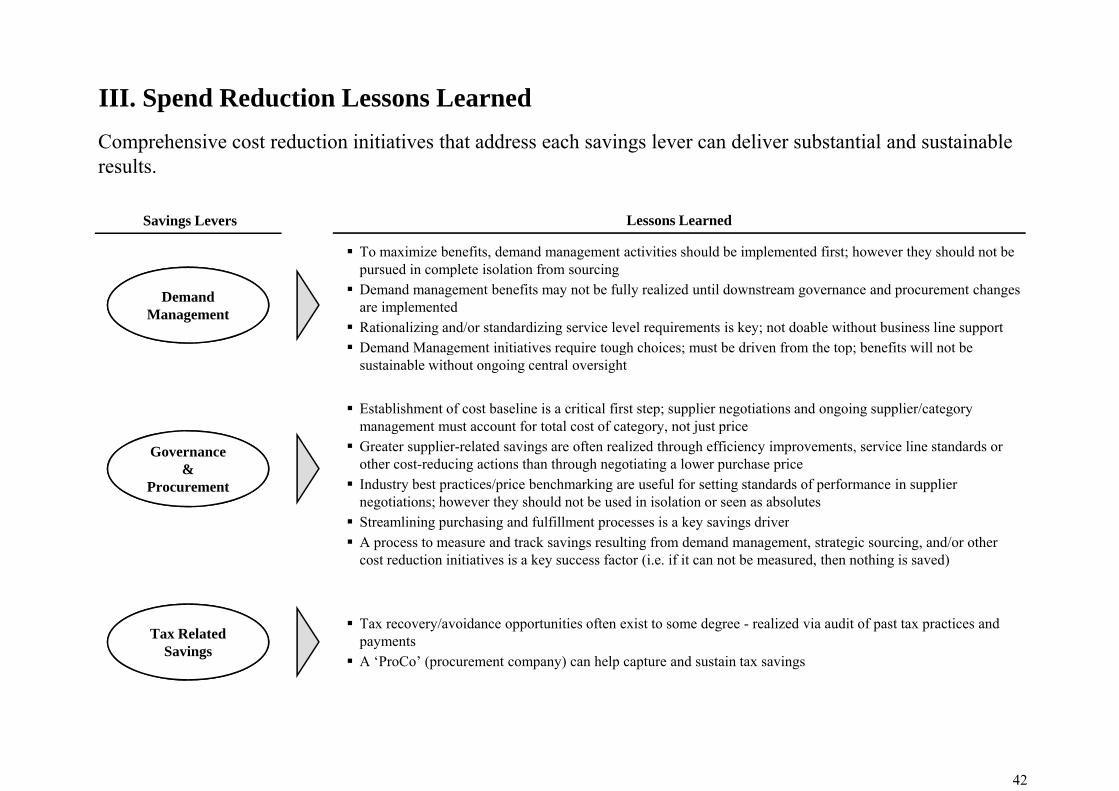
Comprehensive cost reduction initiatives that address each savings lever can deliver substantial and sustainable results.
III. Spend Reduction Lessons Learned
Lessons LearnedSavings Levers
To maximize benefits, demand management activities should be implemented first; however they should not be pursued in complete isolation from sourcingDemand management benefits may not be fully realized until downstream governance and procurement changes are implementedRationalizing and/or standardizing service level requirements is key; not doable without business line supportDemand Management initiatives require tough choices; must be driven from the top; benefits will not be
DemandManagement
Establishment of cost baseline is a critical first step; supplier negotiations and ongoing supplier/category management must account for total cost of category, not just price
Demand Management initiatives require tough choices; must be driven from the top; benefits will not be sustainable without ongoing central oversight
Governance&
Procurement
Greater supplier-related savings are often realized through efficiency improvements, service line standards or other cost-reducing actions than through negotiating a lower purchase price Industry best practices/price benchmarking are useful for setting standards of performance in supplier negotiations; however they should not be used in isolation or seen as absolutesStreamlining purchasing and fulfillment processes is a key savings driverg p g p y gA process to measure and track savings resulting from demand management, strategic sourcing, and/or other cost reduction initiatives is a key success factor (i.e. if it can not be measured, then nothing is saved)
Tax RelatedSavings
Tax recovery/avoidance opportunities often exist to some degree - realized via audit of past tax practices and payments A ‘ProCo’ (procurement company) can help capture and sustain tax savings
42
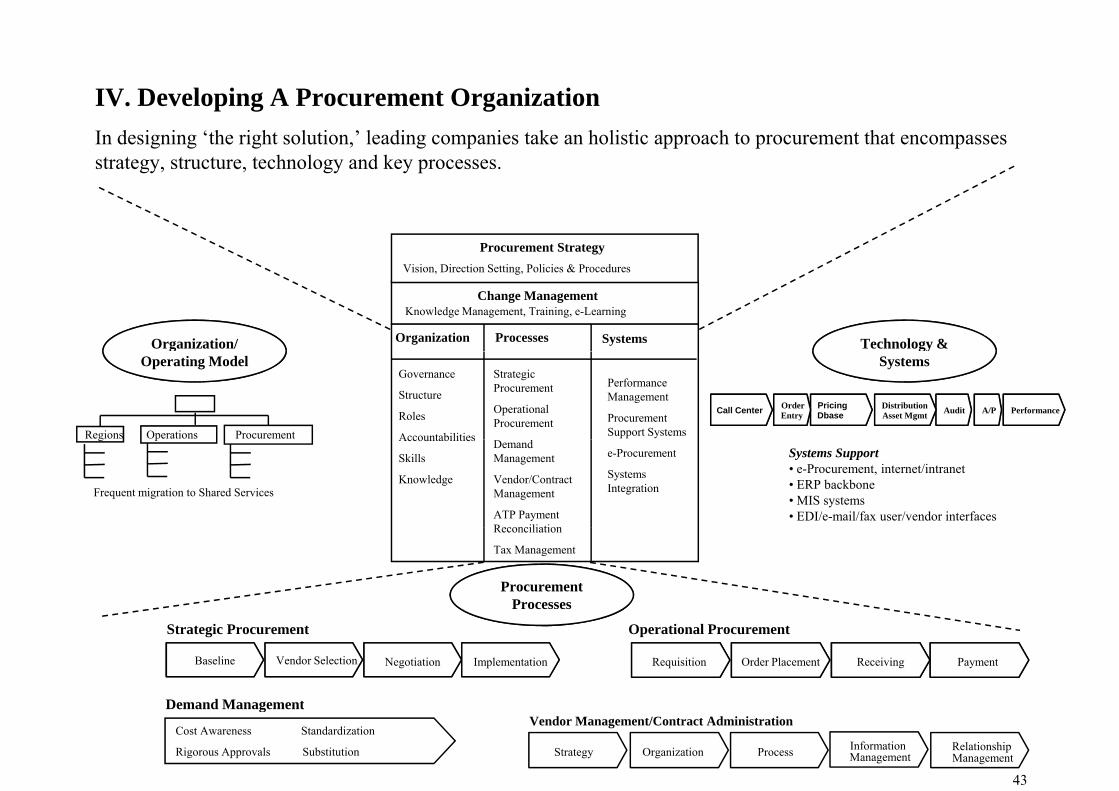
IV. Developing A Procurement OrganizationIn designing ‘the right solution,’ leading companies take an holistic approach to procurement that encompasses strategy, structure, technology and key processes.
Procurement Strategy
Organization Processes Systems
Change Management
Vision, Direction Setting, Policies & Procedures
Organization/
Knowledge Management, Training, e-Learning
Technology &
Governance
Structure
Roles
Accountabilities
Strategic Procurement
Operational Procurement
Performance Management
Procurement Support Systems
gOperating Model
Regions Procurement
Audit Performance A/PDistributionAsset Mgmt
OrderEntry Audit Performance A/PDistribution
Asset Mgmt OrderEntryCall Center Pricing
Dbase
Operations
gySystems
Accountabilities
Skills
Knowledge
Demand Management
Vendor/Contract Management
ATP Payment Reconciliation
e-Procurement
Systems Integration
g
Frequent migration to Shared Services
Systems Support • e-Procurement, internet/intranet• ERP backbone• MIS systems• EDI/e-mail/fax user/vendor interfaces
p
Reconciliation
Tax Management
Procurement Processes
Strategic Procurement Operational Procurement
Demand Management
Baseline Implementation Payment ReceivingOrder PlacementRequisition Vendor Selection Negotiation
43
Demand ManagementVendor Management/Contract Administration
Cost Awareness Standardization
Rigorous Approvals Substitution RelationshipManagement Process Strategy Organization Information
Management
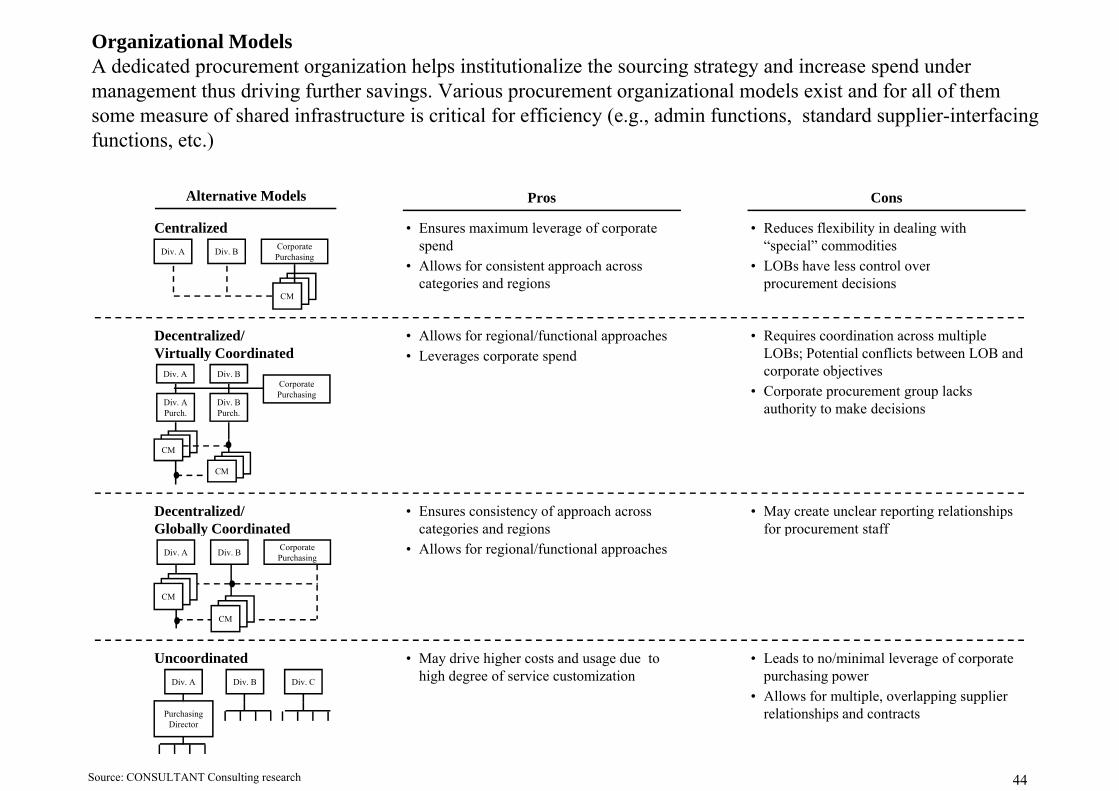
Organizational ModelsA dedicated procurement organization helps institutionalize the sourcing strategy and increase spend under
t th d i i f th i V i t i ti l d l i t d f ll f thmanagement thus driving further savings. Various procurement organizational models exist and for all of them some measure of shared infrastructure is critical for efficiency (e.g., admin functions, standard supplier-interfacing functions, etc.)
Cons
• Reduces flexibility in dealing with “special” commoditiesLOB h l t l
Pros
• Ensures maximum leverage of corporate spendAll f i t t h
Div. A Div. B Corporate Purchasing
Centralized
Alternative Models
• LOBs have less control overprocurement decisions
• Requires coordination across multiple LOBs; Potential conflicts between LOB and
• Allows for consistent approach across categories and regions
• Allows for regional/functional approachesL d
CM
Decentralized/Virtually Coordinated LOBs; Potential conflicts between LOB and
corporate objectives• Corporate procurement group lacks
authority to make decisions
• Leverages corporate spend
Div. APurch.
Div. BPurch.
Corporate Purchasing
Div. A Div. B
Virtually Coordinated
• May create unclear reporting relationships for procurement staff
• Ensures consistency of approach across categories and regions
CM
CM
Decentralized/Globally Coordinated for procurement staffcategories and regions
• Allows for regional/functional approachesDiv. A Div. B Corporate Purchasing
CM
Globally Coordinated
• Leads to no/minimal leverage of corporate purchasing power
• Allows for multiple, overlapping supplier
• May drive higher costs and usage due to high degree of service customization
CM
Div. A Div. B Div. C
Uncoordinated
44
p , pp g pprelationships and contracts
Source: CONSULTANT Consulting research
Purchasing Director
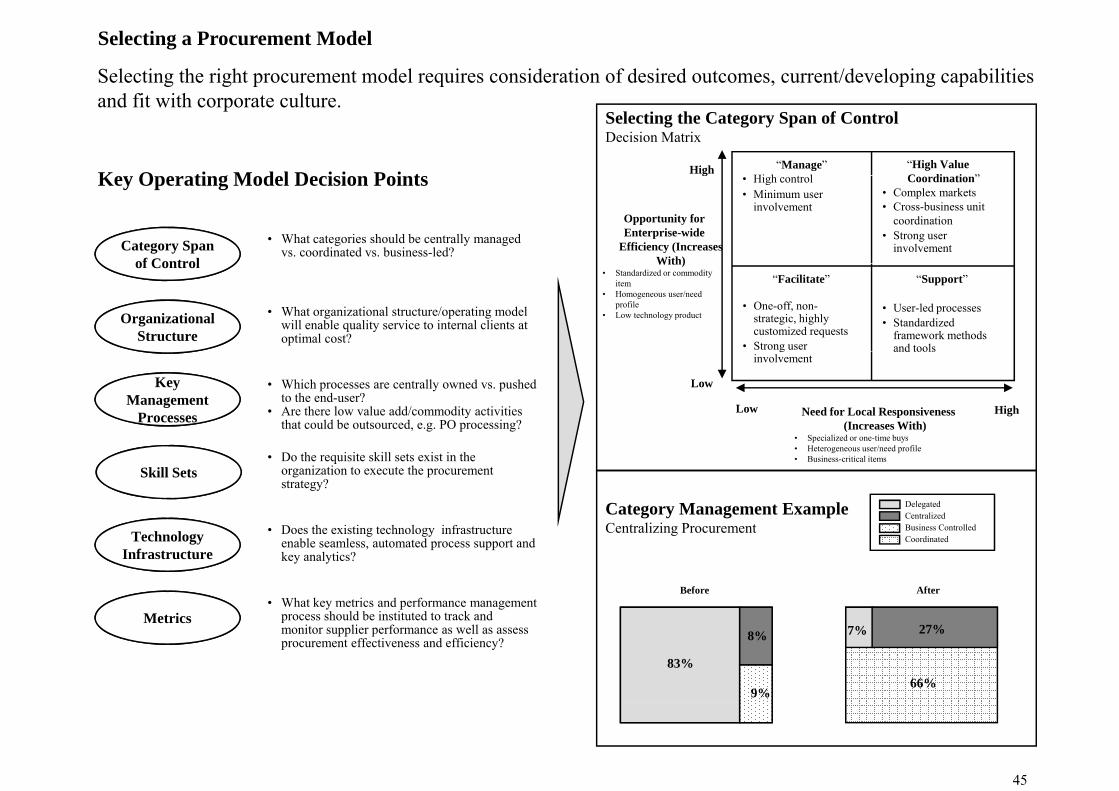
Selecting the right procurement model requires consideration of desired outcomes, current/developing capabilities
Selecting a Procurement Model
High “Manage”Hi h t l
“High Value C di ti ”
Selecting the Category Span of ControlDecision Matrix
and fit with corporate culture.
K O ti M d l D i i P i t
Opportunity for Enterprise-wide
Efficiency (Increases With)
g• High control• Minimum user
involvement
Coordination”• Complex markets• Cross-business unit
coordination• Strong user
involvement • What categories should be centrally managed
vs. coordinated vs. business-led?
Key Operating Model Decision Points
Category Span of Control With)
• Standardized or commodity item
• Homogeneous user/need profile
• Low technology product
“Support”
• User-led processes• Standardized
framework methods and tools
“Facilitate”
• One-off, non-strategic, highly customized requests
• Strong user
• What organizational structure/operating model will enable quality service to internal clients at optimal cost?
of Control
Organizational Structure
Low
Low
High
and tools
Need for Local Responsiveness (Increases With)
• Specialized or one-time buys
ginvolvement
• Which processes are centrally owned vs. pushed to the end-user?
• Are there low value add/commodity activities that could be outsourced, e.g. PO processing? Processes
Key Management
ProcessesSpecialized or one time buys
• Heterogeneous user/need profile• Business-critical items• Do the requisite skill sets exist in the
organization to execute the procurement strategy?
D th i ti t h l i f t t
Skill Sets
DelegatedCentralizedBusiness Controlled
Category Management Example Centralizing Procurement• Does the existing technology infrastructure
enable seamless, automated process support and key analytics?
• What key metrics and performance management process should be instituted to track and
Technology Infrastructure
M t i
Business ControlledCoordinated
After Before
Centralizing Procurement
process should be instituted to track and monitor supplier performance as well as assess procurement effectiveness and efficiency?
Metrics
66%83%
8%
9%
27%7%
45
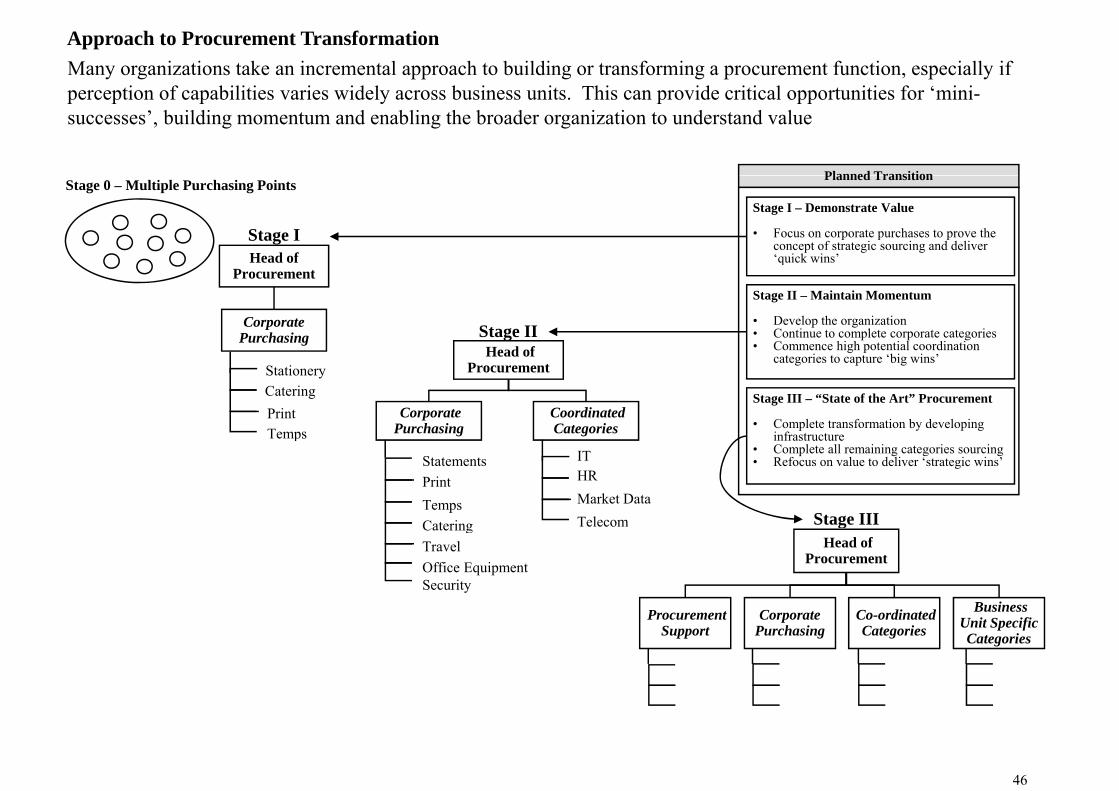
Many organizations take an incremental approach to building or transforming a procurement function, especially if ti f biliti i id l b i it Thi id iti l t iti f ‘ i i
Approach to Procurement Transformation
Planned Transition
perception of capabilities varies widely across business units. This can provide critical opportunities for ‘mini-successes’, building momentum and enabling the broader organization to understand value
Planned Transition
Stage I – Demonstrate Value
• Focus on corporate purchases to prove the concept of strategic sourcing and deliver ‘quick wins’
Stage IHead of
Stage 0 – Multiple Purchasing Points
Stage IIHead of
q
Stage II – Maintain Momentum
• Develop the organization• Continue to complete corporate categories• Commence high potential coordination
Procurement
CorporatePurchasing
CorporatePurchasing
CoordinatedCategories
Head ofProcurement
g pcategories to capture ‘big wins’
Stage III – “State of the Art” Procurement
• Complete transformation by developing infrastructure
StationeryCateringPrintTemps
StatementsPrintTempsCatering Stage III
infrastructure• Complete all remaining categories sourcing• Refocus on value to deliver ‘strategic wins’
p
HRIT
Market DataTelecomCatering
TravelOffice EquipmentSecurity
g
Procurement
Head ofProcurement
Corporate Co ordinated Business ProcurementSupport
CorporatePurchasing
Co-ordinatedCategories Unit Specific
Categories
46
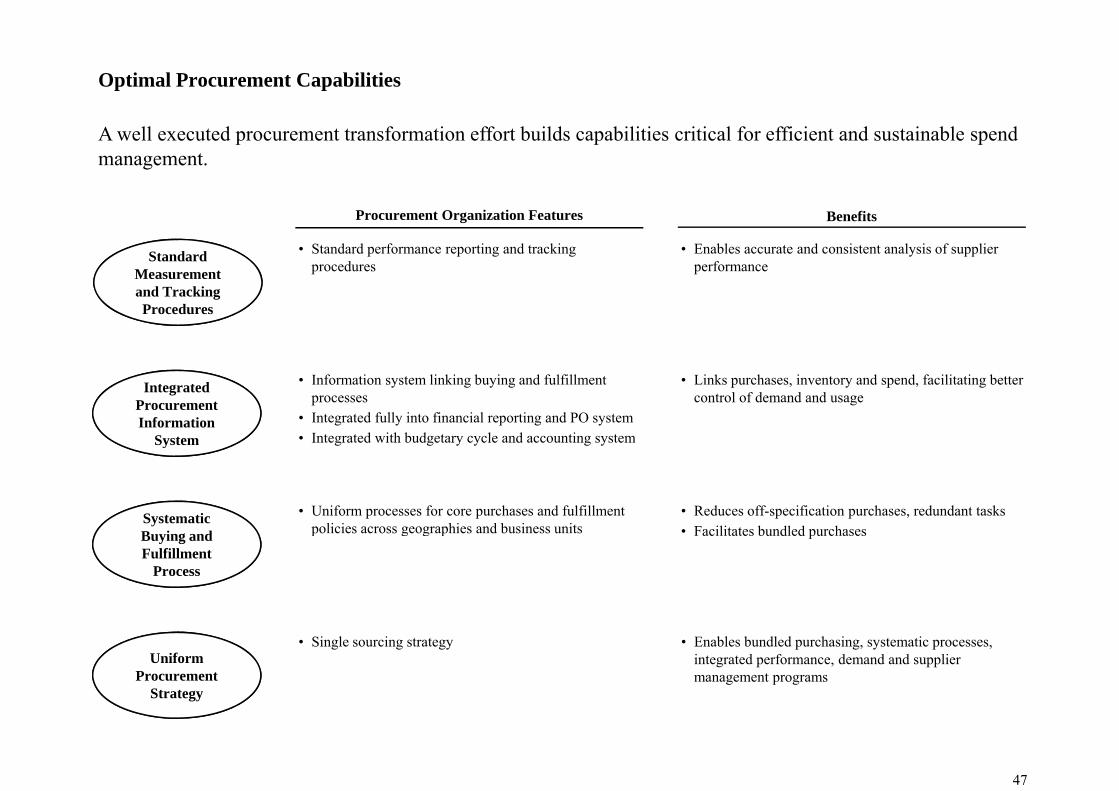
Optimal Procurement Capabilitiesp p
A well executed procurement transformation effort builds capabilities critical for efficient and sustainable spend management.
Procurement Organization Features Benefits
Standard • Standard performance reporting and tracking d
• Enables accurate and consistent analysis of supplier fMeasurement
and Tracking Procedures
procedures performance
Integrated Procurement Information
System
• Information system linking buying and fulfillment processes
• Integrated fully into financial reporting and PO system• Integrated with budgetary cycle and accounting system
• Links purchases, inventory and spend, facilitating better control of demand and usage
System • Integrated with budgetary cycle and accounting system
Systematic • Uniform processes for core purchases and fulfillment policies across geographies and business units
• Reduces off-specification purchases, redundant tasksF ilit t b dl d hBuying and
Fulfillment Process
policies across geographies and business units • Facilitates bundled purchases
Uniform Procurement
Strategy
• Single sourcing strategy • Enables bundled purchasing, systematic processes, integrated performance, demand and supplier management programs
47
A diAppendix1. Sourcing and Procurement Tools2. A Spend Recovery Tool 3. Qualifications4. Case Studies:
a. Cash Servicesb. Market Data
1. Sourcing and Procurement ToolsCONSULTANT leverages a proprietary set of spend management cost reduction tools that help us streamline engagements and expedite benefit capture.
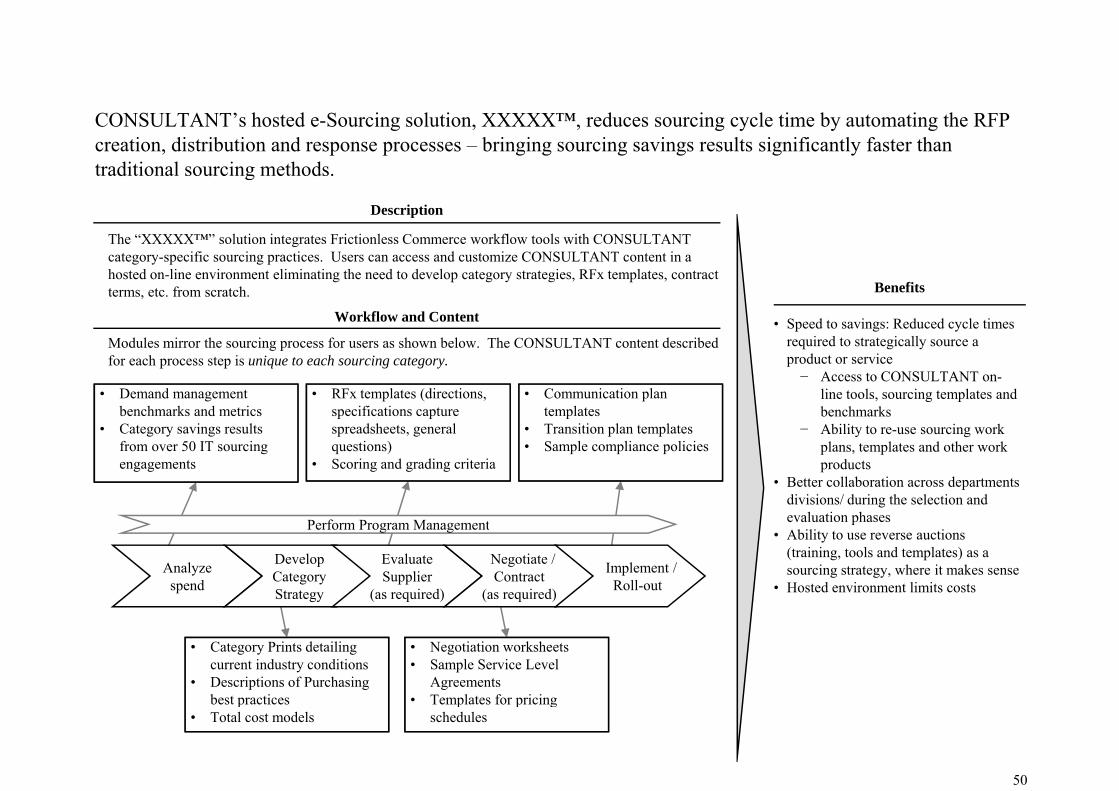
CONSULTANT’s hosted e-Sourcing solution, XXXXX™, reduces sourcing cycle time by automating the RFP creation, distribution and response processes – bringing sourcing savings results significantly faster than traditional sourcing methods.
The “XXXXX™” solution integrates Frictionless Commerce workflow tools with CONSULTANT category-specific sourcing practices. Users can access and customize CONSULTANT content in a
Description
traditional sourcing methods.
g y p g phosted on-line environment eliminating the need to develop category strategies, RFx templates, contract terms, etc. from scratch.
• Speed to savings: Reduced cycle times required to strategically source a
Benefits
Workflow and Content
Modules mirror the sourcing process for users as shown below. The CONSULTANT content described product or service− Access to CONSULTANT on-
line tools, sourcing templates and benchmarks
− Ability to re-use sourcing work
• Demand management benchmarks and metrics
• Category savings results
for each process step is unique to each sourcing category.
• RFx templates (directions, specifications capture spreadsheets, general
• Communication plan templates
• Transition plan templates
Perform Program Management
plans, templates and other work products
• Better collaboration across departments divisions/ during the selection and evaluation phases
from over 50 IT sourcing engagements
questions)• Scoring and grading criteria
• Sample compliance policies
Analyzespend
DevelopCategoryStrategy
EvaluateSupplier
(as required)
Negotiate /Contract
(as required)
Implement / Roll-out
Perform Program Management• Ability to use reverse auctions
(training, tools and templates) as a sourcing strategy, where it makes sense
• Hosted environment limits costs
• Category Prints detailing current industry conditions
• Descriptions of Purchasing best practices
• Negotiation worksheets• Sample Service Level
Agreements• Templates for pricing
50
best practices • Total cost models
Templates for pricing schedules
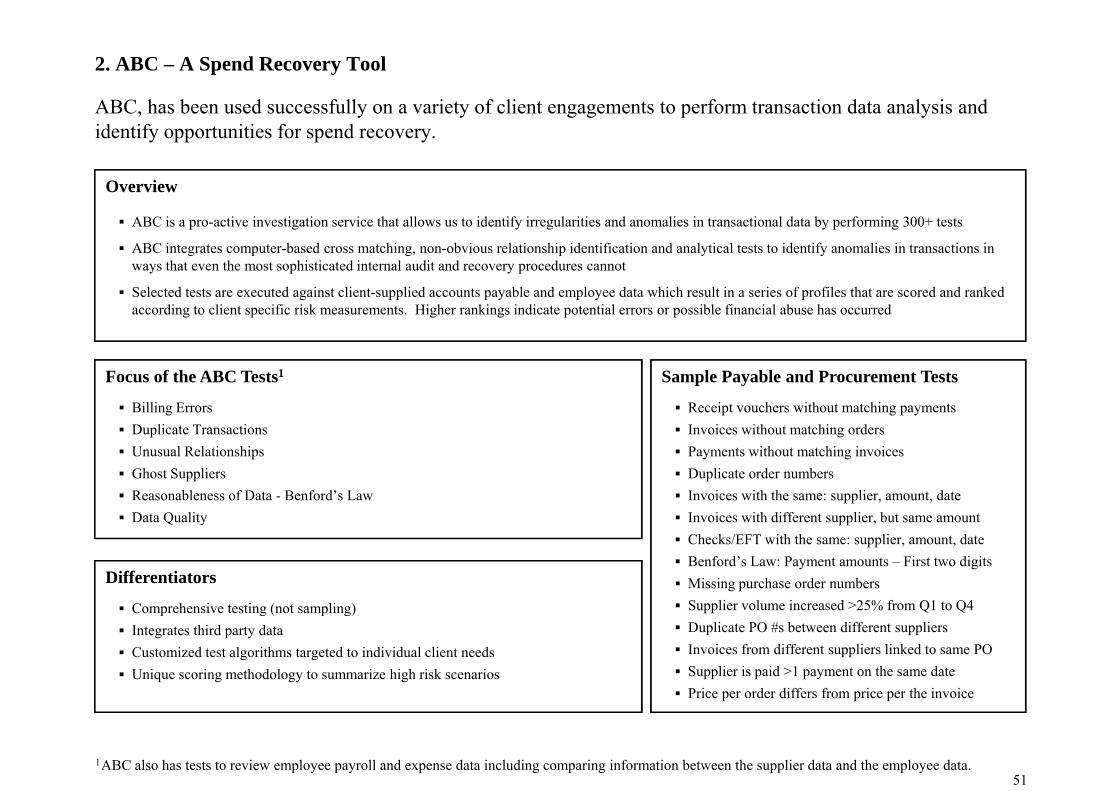
2. ABC – A Spend Recovery Tool
ABC, has been used successfully on a variety of client engagements to perform transaction data analysis and identify opportunities for spend recovery.
Overview
ABC is a pro-active investigation service that allows us to identify irregularities and anomalies in transactional data by performing 300+ tests
ABC integrates computer-based cross matching, non-obvious relationship identification and analytical tests to identify anomalies in transactions in th t th t hi ti t d i t l dit d d tways that even the most sophisticated internal audit and recovery procedures cannot
Selected tests are executed against client-supplied accounts payable and employee data which result in a series of profiles that are scored and ranked according to client specific risk measurements. Higher rankings indicate potential errors or possible financial abuse has occurred
Focus of the ABC Tests1
Billing ErrorsDuplicate Transactions
Sample Payable and Procurement Tests
Receipt vouchers without matching payments Invoices without matching orders
Unusual RelationshipsGhost Suppliers Reasonableness of Data - Benford’s LawData Quality
Payments without matching invoices Duplicate order numbersInvoices with the same: supplier, amount, dateInvoices with different supplier, but same amount
Differentiators
Comprehensive testing (not sampling)
Checks/EFT with the same: supplier, amount, dateBenford’s Law: Payment amounts – First two digitsMissing purchase order numbersSupplier volume increased >25% from Q1 to Q4p g ( p g)
Integrates third party dataCustomized test algorithms targeted to individual client needsUnique scoring methodology to summarize high risk scenarios
Duplicate PO #s between different suppliersInvoices from different suppliers linked to same POSupplier is paid >1 payment on the same datePrice per order differs from price per the invoice
511ABC also has tests to review employee payroll and expense data including comparing information between the supplier data and the employee data.
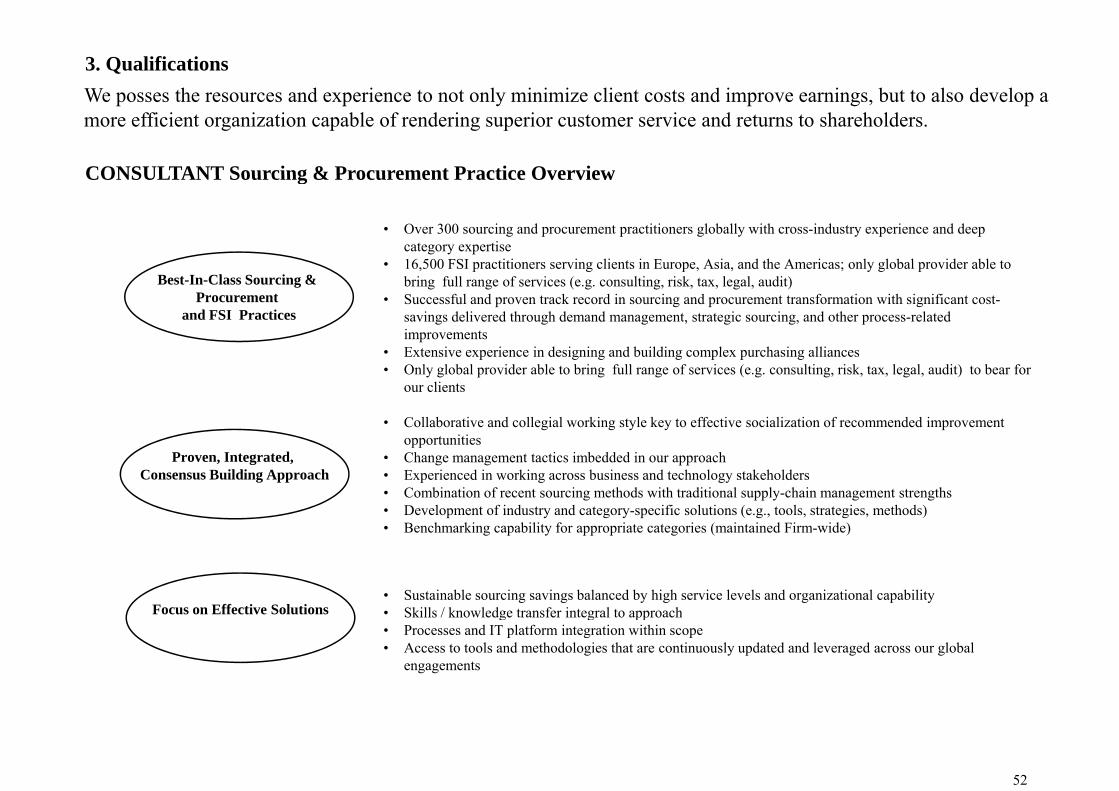
h d i l i i i li d i i b l d l3. QualificationsWe posses the resources and experience to not only minimize client costs and improve earnings, but to also develop a more efficient organization capable of rendering superior customer service and returns to shareholders.
CONSULTANT Sourcing & Procurement Practice Overview
• Over 300 sourcing and procurement practitioners globally with cross-industry experience and deep category expertise
• 16 500 FSI practitioners serving clients in Europe Asia and the Americas; only global provider able to
CONSULTANT Sourcing & Procurement Practice Overview
• 16,500 FSI practitioners serving clients in Europe, Asia, and the Americas; only global provider able to bring full range of services (e.g. consulting, risk, tax, legal, audit)
• Successful and proven track record in sourcing and procurement transformation with significant cost-savings delivered through demand management, strategic sourcing, and other process-related improvements
• Extensive experience in designing and building complex purchasing alliances
Best-In-Class Sourcing & Procurement
and FSI Practices
• Extensive experience in designing and building complex purchasing alliances• Only global provider able to bring full range of services (e.g. consulting, risk, tax, legal, audit) to bear for
our clients
• Collaborative and collegial working style key to effective socialization of recommended improvement opportunitiesopportunities
• Change management tactics imbedded in our approach• Experienced in working across business and technology stakeholders• Combination of recent sourcing methods with traditional supply-chain management strengths• Development of industry and category-specific solutions (e.g., tools, strategies, methods)• Benchmarking capability for appropriate categories (maintained Firm wide)
Proven, Integrated, Consensus Building Approach
• Benchmarking capability for appropriate categories (maintained Firm-wide)
• Sustainable sourcing savings balanced by high service levels and organizational capability• Skills / knowledge transfer integral to approachFocus on Effective Solutions Skills / knowledge transfer integral to approach• Processes and IT platform integration within scope• Access to tools and methodologies that are continuously updated and leveraged across our global
engagements
52
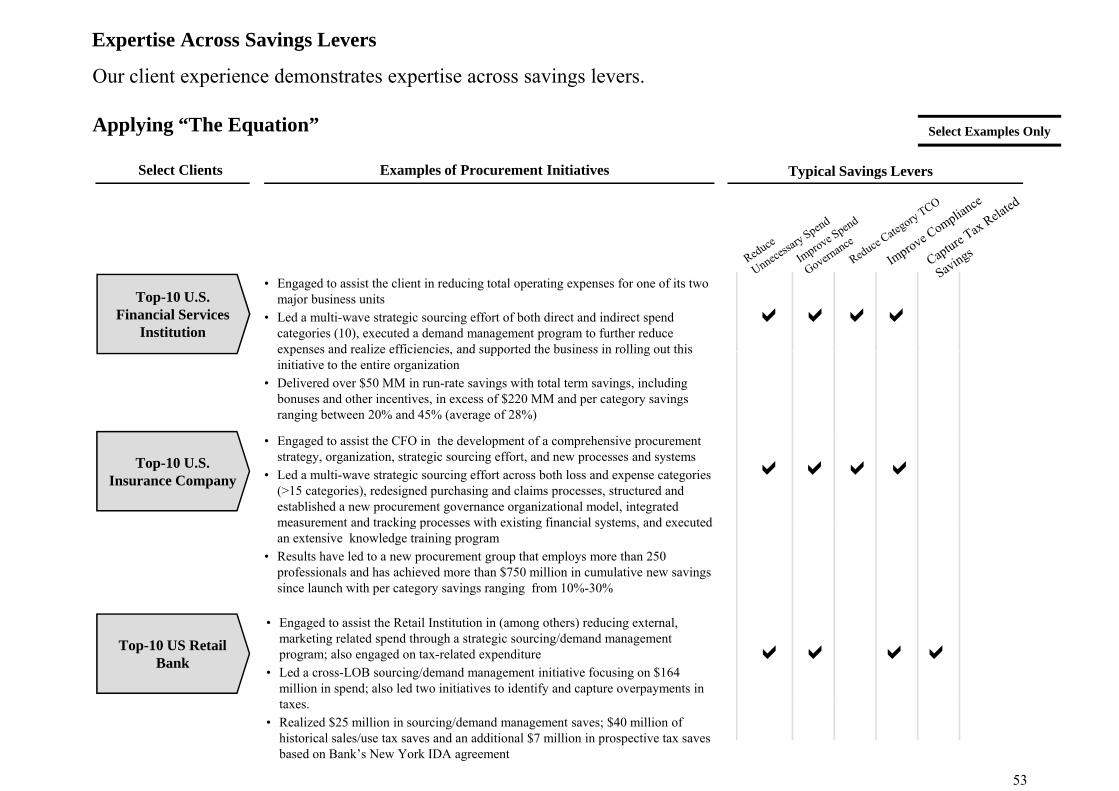
Expertise Across Savings Levers
Our client experience demonstrates expertise across savings levers.
Examples of Procurement InitiativesSelect Clients Typical Savings Levers
Select Examples OnlyApplying “The Equation”
p Typical Savings Levers
aTop-10 U.S.
Financial Services Institution aa
• Engaged to assist the client in reducing total operating expenses for one of its two major business units
• Led a multi-wave strategic sourcing effort of both direct and indirect spend categories (10), executed a demand management program to further reduce expenses and realize efficiencies and supported the business in rolling out this
aexpenses and realize efficiencies, and supported the business in rolling out this initiative to the entire organization
• Delivered over $50 MM in run-rate savings with total term savings, including bonuses and other incentives, in excess of $220 MM and per category savings ranging between 20% and 45% (average of 28%)
• Engaged to assist the CFO in the development of a comprehensive procurement
Top-10 U.S. Insurance Company
• Engaged to assist the CFO in the development of a comprehensive procurement strategy, organization, strategic sourcing effort, and new processes and systems
• Led a multi-wave strategic sourcing effort across both loss and expense categories (>15 categories), redesigned purchasing and claims processes, structured and established a new procurement governance organizational model, integrated measurement and tracking processes with existing financial systems, and executed
aa aa
g p g y ,an extensive knowledge training program
• Results have led to a new procurement group that employs more than 250 professionals and has achieved more than $750 million in cumulative new savings since launch with per category savings ranging from 10%-30%
Top-10 US Retail Bank a
• Engaged to assist the Retail Institution in (among others) reducing external, marketing related spend through a strategic sourcing/demand management program; also engaged on tax-related expenditure
• Led a cross-LOB sourcing/demand management initiative focusing on $164 million in spend; also led two initiatives to identify and capture overpayments in taxes
aaa
53
taxes. • Realized $25 million in sourcing/demand management saves; $40 million of
historical sales/use tax saves and an additional $7 million in prospective tax saves based on Bank’s New York IDA agreement
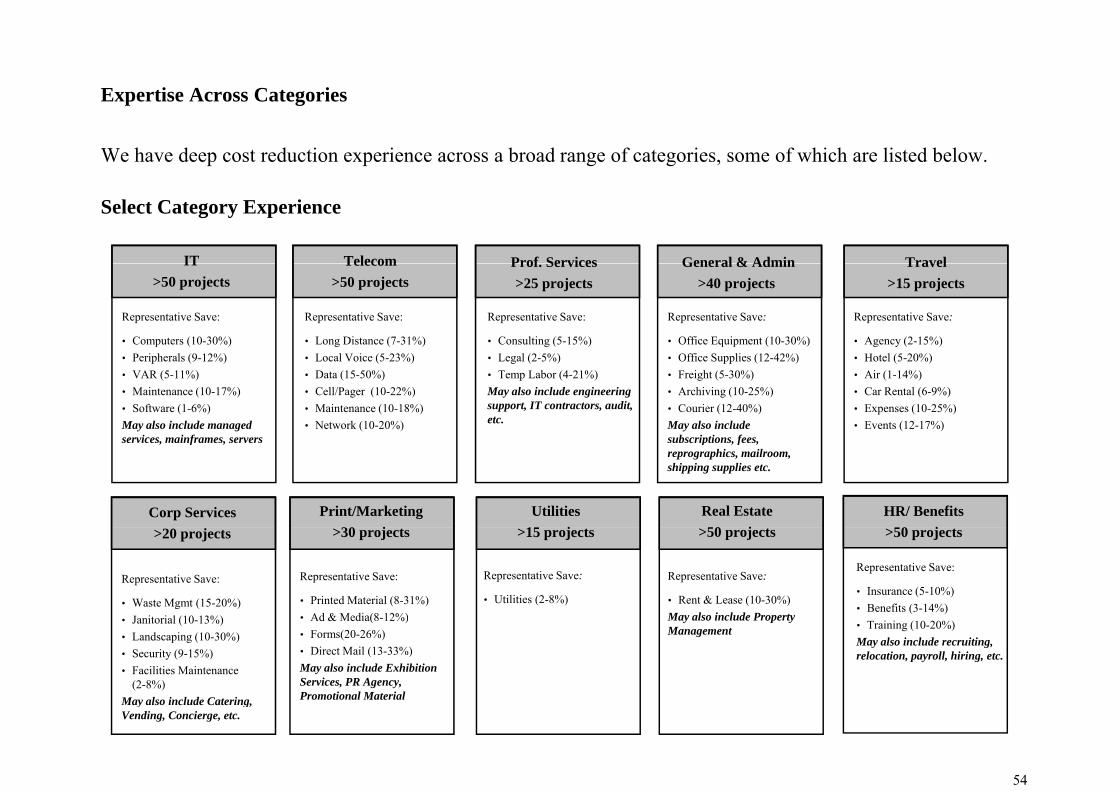
E i A C i
We have deep cost reduction experience across a broad range of categories, some of which are listed below.
Expertise Across Categories
Select Category Experience
General & Admin TravelIT Telecom Prof Services General & Admin>40 projects
Travel>15 projects
Representative Save:
• Office Equipment (10-30%)
Representative Save:
• Agency (2-15%)
IT>50 projects
Representative Save:
• Computers (10-30%)
Telecom>50 projects
Prof. Services>25 projects
Representative Save:
• Consulting (5-15%)
Representative Save:
• Long Distance (7-31%)• Office Supplies (12-42%) • Freight (5-30%)• Archiving (10-25%)• Courier (12-40%)May also include subscriptions fees
• Hotel (5-20%)• Air (1-14%)• Car Rental (6-9%)• Expenses (10-25%)• Events (12-17%)
• Peripherals (9-12%)• VAR (5-11%)• Maintenance (10-17%) • Software (1-6%)May also include managed services mainframes servers
• Legal (2-5%)• Temp Labor (4-21%)May also include engineering support, IT contractors, audit, etc.
• Local Voice (5-23%)• Data (15-50%)• Cell/Pager (10-22%)• Maintenance (10-18%)• Network (10-20%)
Corp Services HR/ Benefits0 j
Print/Marketing30 j
Utilities1 j
subscriptions, fees, reprographics, mailroom, shipping supplies etc.
services, mainframes, servers
Real Estate50 j>20 projects >50 projects>30 projects >15 projects
Representative Save:
• Waste Mgmt (15-20%)
Representative Save:
• Insurance (5-10%)• Benefits (3-14%)
Representative Save:
• Printed Material (8-31%) Ad & M di (8 12%)
Representative Save:
• Utilities (2-8%)
Representative Save:
• Rent & Lease (10-30%)M l i l d P t
>50 projects
• Janitorial (10-13%)• Landscaping (10-30%)• Security (9-15%)• Facilities Maintenance
(2-8%)May also include Catering
• Training (10-20%)May also include recruiting, relocation, payroll, hiring, etc.
• Ad & Media(8-12%)• Forms(20-26%)• Direct Mail (13-33%)May also include Exhibition Services, PR Agency, Promotional Material
May also include Property Management
54
May also include Catering, Vending, Concierge, etc.
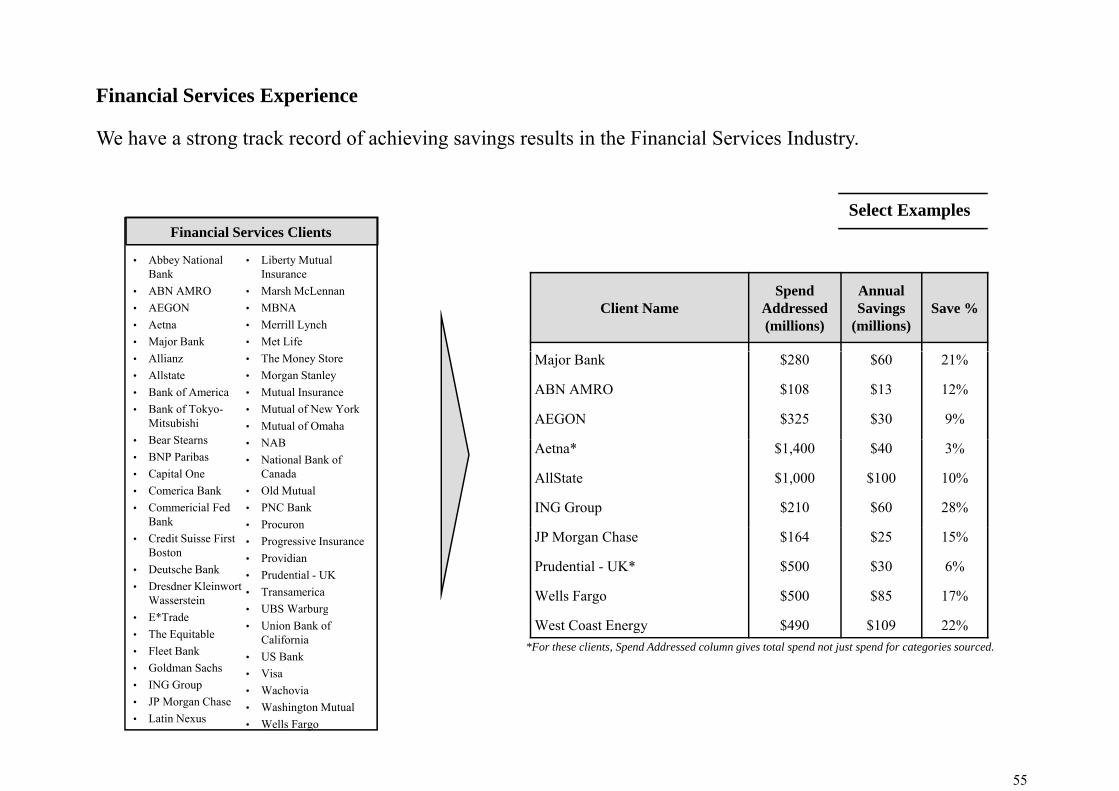
Financial Services Experience
We have a strong track record of achieving savings results in the Financial Services Industry.
Financial Services Clients
• Abbey National • Liberty Mutual
Select Examples
Client NameSpend
Addressed(millions)
AnnualSavings
(millions)Save %
Abbey National Bank
• ABN AMRO• AEGON• Aetna• Major Bank
Liberty Mutual Insurance
• Marsh McLennan• MBNA• Merrill Lynch• Met Life
Major Bank $280 $60 21%
ABN AMRO $108 $13 12%
AEGON $325 $30 9%
• Allianz• Allstate• Bank of America• Bank of Tokyo-
Mitsubishi• Bear Stearns
• The Money Store• Morgan Stanley• Mutual Insurance• Mutual of New York• Mutual of Omaha
NAB Aetna* $1,400 $40 3%
AllState $1,000 $100 10%
ING Group $210 $60 28%
• Bear Stearns• BNP Paribas• Capital One• Comerica Bank• Commericial Fed
Bank
• NAB• National Bank of
Canada• Old Mutual• PNC Bank• Procuron
JP Morgan Chase $164 $25 15%
Prudential - UK* $500 $30 6%
Wells Fargo $500 $85 17%
• Credit Suisse First Boston
• Deutsche Bank• Dresdner Kleinwort
WassersteinE*T d
Procuron• Progressive Insurance• Providian• Prudential - UK• Transamerica• UBS Warburg
West Coast Energy $490 $109 22%• E*Trade• The Equitable• Fleet Bank• Goldman Sachs• ING Group• JP Morgan Chase
g• Union Bank of
California• US Bank• Visa• Wachovia
hi l
*For these clients, Spend Addressed column gives total spend not just spend for categories sourced.
55
• JP Morgan Chase• Latin Nexus
• Washington Mutual• Wells Fargo
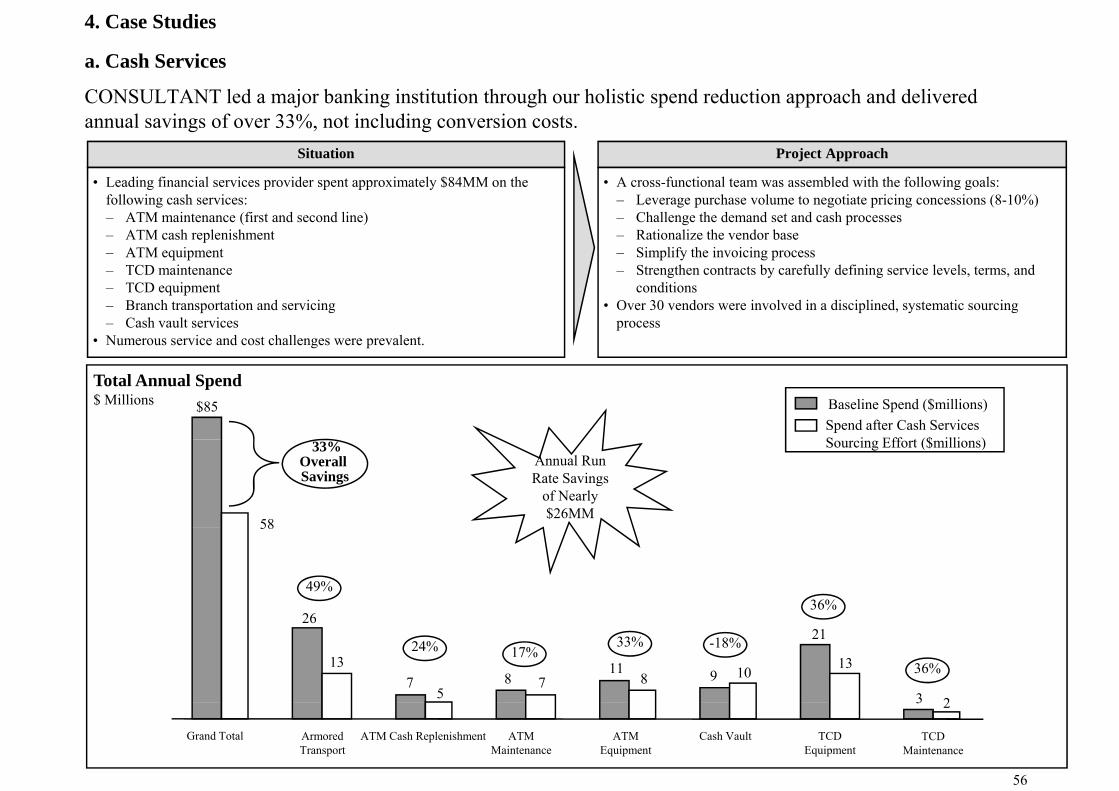
4. Case Studies
a. Cash Services
CONSULTANT led a major banking institution through our holistic spend reduction approach and delivered annual savings of over 33%, not including conversion costs.
Situation Project Approach
• Leading financial services provider spent approximately $84MM on the following cash services: – ATM maintenance (first and second line)– ATM cash replenishment– ATM equipment
• A cross-functional team was assembled with the following goals:– Leverage purchase volume to negotiate pricing concessions (8-10%)– Challenge the demand set and cash processes– Rationalize the vendor base– Simplify the invoicing process
– TCD maintenance– TCD equipment– Branch transportation and servicing– Cash vault services
• Numerous service and cost challenges were prevalent.
– Strengthen contracts by carefully defining service levels, terms, and conditions
• Over 30 vendors were involved in a disciplined, systematic sourcing process
Total Annual Spend$ Millions Baseline Spend ($millions)
Spend after Cash Services S i Eff t ($ illi )
$85
Sourcing Effort ($millions)
58
33%Overall Savings
Annual Run Rate Savings
of Nearly $26MM
26
58
49%36%
26
7 811 9
21
3
13
57 8 10 13
2
24% -18%33%17%
36%
56
3 2
Grand Total ArmoredTransport
ATM Cash Replenishment ATMMaintenance
ATMEquipment
Cash Vault TCDEquipment
TCDMaintenance
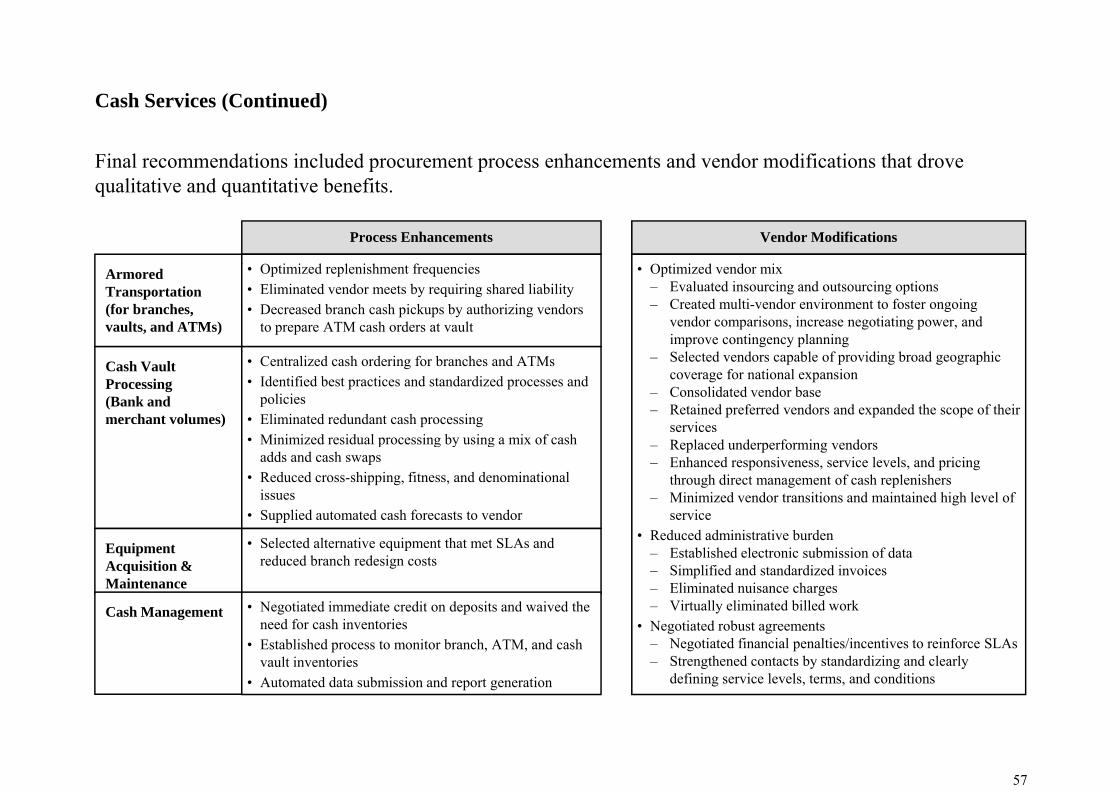
Cash Services (Continued)
Final recommendations included procurement process enhancements and vendor modifications that drove
Process Enhancements Vendor Modifications
i i d l i h f i i i d d i
qualitative and quantitative benefits.
Armored Transportation(for branches, vaults, and ATMs)
• Optimized replenishment frequencies• Eliminated vendor meets by requiring shared liability• Decreased branch cash pickups by authorizing vendors
to prepare ATM cash orders at vault
• Optimized vendor mix– Evaluated insourcing and outsourcing options– Created multi-vendor environment to foster ongoing
vendor comparisons, increase negotiating power, and improve contingency planning
l d d bl f idi b d hi– Selected vendors capable of providing broad geographic coverage for national expansion
– Consolidated vendor base– Retained preferred vendors and expanded the scope of their
services
Cash Vault Processing(Bank and merchant volumes)
• Centralized cash ordering for branches and ATMs• Identified best practices and standardized processes and
policies• Eliminated redundant cash processing• Minimized residual processing by using a mix of cash – Replaced underperforming vendors
– Enhanced responsiveness, service levels, and pricing through direct management of cash replenishers
– Minimized vendor transitions and maintained high level of service
• Minimized residual processing by using a mix of cash adds and cash swaps
• Reduced cross-shipping, fitness, and denominational issues
• Supplied automated cash forecasts to vendor • Reduced administrative burden
– Established electronic submission of data– Simplified and standardized invoices – Eliminated nuisance charges– Virtually eliminated billed work
Equipment Acquisition & Maintenance
• Selected alternative equipment that met SLAs and reduced branch redesign costs
Cash Management • Negotiated immediate credit on deposits and waived the • Negotiated robust agreements
– Negotiated financial penalties/incentives to reinforce SLAs– Strengthened contacts by standardizing and clearly
defining service levels, terms, and conditions
Cash Managementneed for cash inventories
• Established process to monitor branch, ATM, and cash vault inventories
• Automated data submission and report generation
57
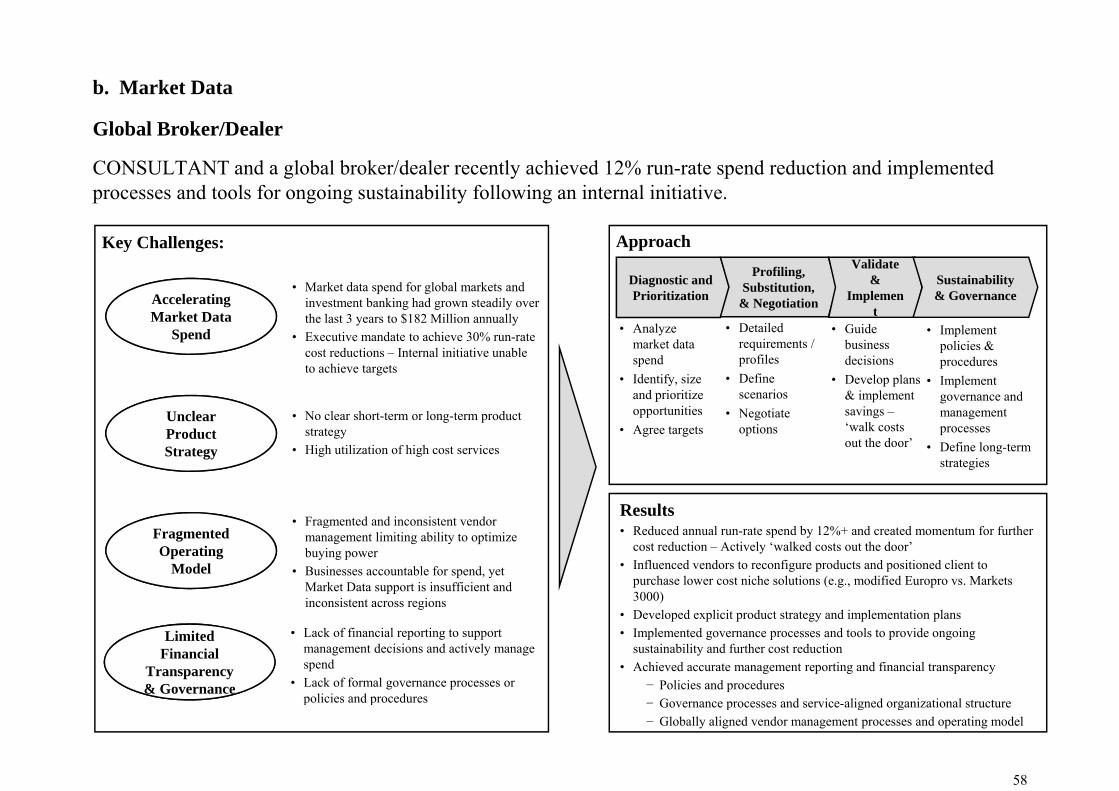
b Market Data
CONSULTANT and a global broker/dealer recently achieved 12% run-rate spend reduction and implemented
Global Broker/Dealer
b. Market Data
g y p pprocesses and tools for ongoing sustainability following an internal initiative.
Key Challenges: ApproachValidate
• Market data spend for global markets and investment banking had grown steadily over the last 3 years to $182 Million annually
• Executive mandate to achieve 30% run-rate cost reductions Internal initiative unable
Diagnostic and Prioritization
Profiling, Substitution,
& Negotiation
Validate &
Implement
Sustainability & Governance
• Analyze market data
• Detailed requirements /
• Guide business
• Implement policies &
Accelerating Market Data
Spendcost reductions – Internal initiative unable to achieve targets
Unclear Product
spend• Identify, size
and prioritize opportunities
• Agree targets
profiles• Define
scenarios• Negotiate
options
decisions• Develop plans
& implement savings –‘walk costs
t th d ’
pprocedures
• Implement governance and management processes
• No clear short-term or long-term product strategy
Strategy out the door’ • Define long-term strategies
• High utilization of high cost services
• Fragmented and inconsistent vendor Results
R d d l t d b 12%+ d t d t f f thFragmented Operating
Model
gmanagement limiting ability to optimize buying power
• Businesses accountable for spend, yet Market Data support is insufficient and inconsistent across regions
• Reduced annual run-rate spend by 12%+ and created momentum for further cost reduction – Actively ‘walked costs out the door’
• Influenced vendors to reconfigure products and positioned client to purchase lower cost niche solutions (e.g., modified Europro vs. Markets 3000)
• Developed explicit product strategy and implementation plans• Developed explicit product strategy and implementation plans• Implemented governance processes and tools to provide ongoing
sustainability and further cost reduction• Achieved accurate management reporting and financial transparency
− Policies and procedures− Governance processes and service aligned organizational structure
& Governance
Limited Financial
Transparency & Governance
• Lack of financial reporting to support management decisions and actively manage spend
• Lack of formal governance processes or policies and procedures
58
− Governance processes and service-aligned organizational structure− Globally aligned vendor management processes and operating model
p p
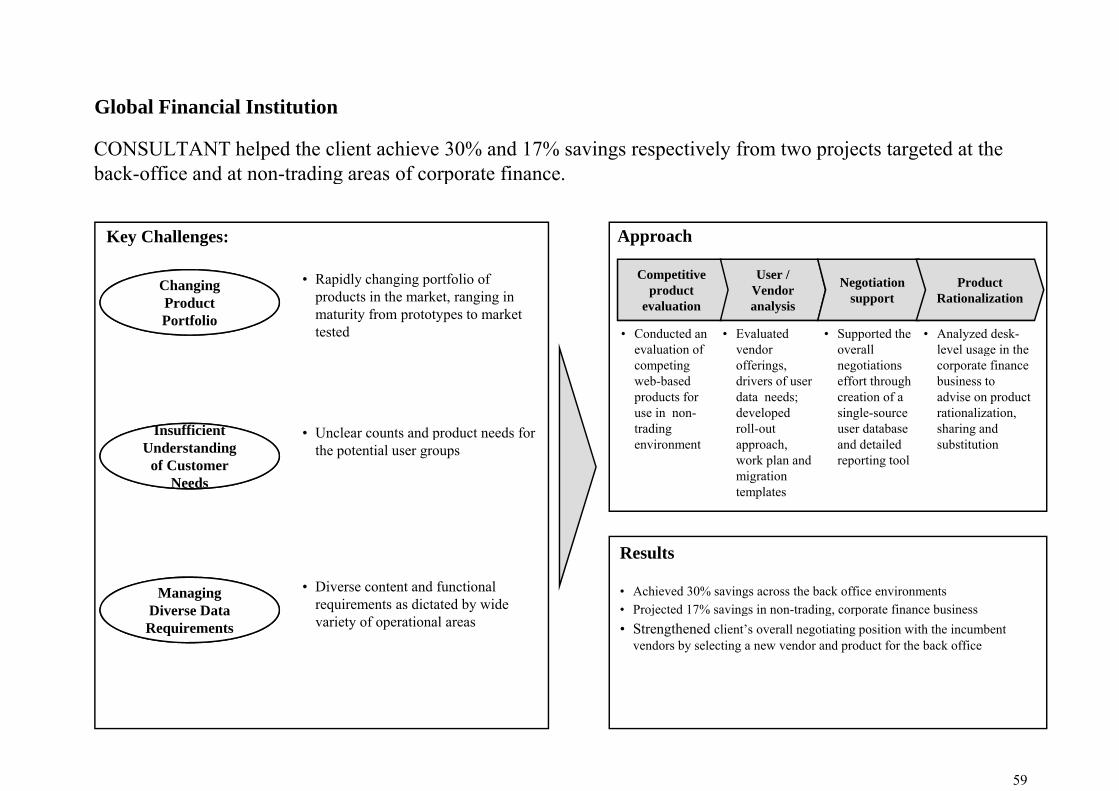
CONSULTANT helped the client achieve 30% and 17% savings respectively from two projects targeted at the back-office and at non-trading areas of corporate finance
Global Financial Institution
back-office and at non-trading areas of corporate finance.
Key Challenges: Approach
• Rapidly changing portfolio of products in the market, ranging in maturity from prototypes to market tested
Competitive product
evaluation
User / Vendor analysis
Negotiation support
• Conducted an evaluation of
• Evaluated vendor
• Supported the overall
• Analyzed desk-level usage in the
Changing Product Portfolio
Product Rationalization
evaluation of competing web-based products for use in non-trading
vendor offerings, drivers of user data needs; developed roll-out
overall negotiations effort through creation of a single-source user database
level usage in the corporate finance business to advise on product rationalization, sharing and Insufficient Insufficient • Unclear counts and product needs for
environment approach, work plan and migration templates
and detailed reporting tool
substitution
Needs
Understanding of Customer
Needs
pthe potential user groups
Results
• Achieved 30% savings across the back office environments • Projected 17% savings in non-trading, corporate finance business
Managing Diverse Data
• Diverse content and functional requirements as dictated by wide j g g, p
• Strengthened client’s overall negotiating position with the incumbent vendors by selecting a new vendor and product for the back office
Diverse Data Requirements variety of operational areas
59