Embed Size (px)
Citation preview
Beyond the Arab Awakening:Policies and Investments for Poverty Reduction
and Food SecurityClemens Breisinger, Olivier Ecker, Perrihan Al-Riffai, Bingxin Yu
Development Strategy and Governance DivisionInternational Food Policy Research Institute
USAID
Washington D.C., November 22, 2011
Causes of the Arab Awakening
• Political Lack of democracy and justice
• Sociological Lack of dignity and freedom
• Economics Official numbers looked promising in many
countries…
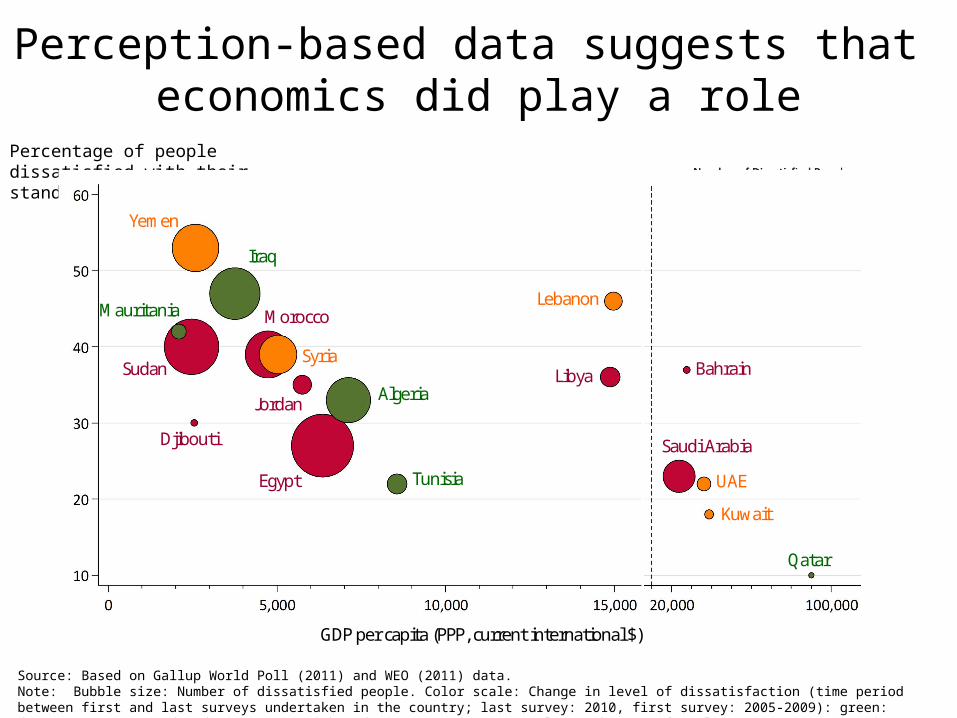
Perception-based data suggests that economics did play a role
Yemen
Iraq
Sudan
Djibouti
Morocco
Jordan Algeria
Syria
Tunisia Egypt
Mauritania Lebanon
Libya Bahrain
Saudi Arabia
UAE
Kuwait
Qatar
GDP per capita (PPP, current international $)
Source: Based on Gallup World Poll (2011) and WEO (2011) data.Note: Bubble size: Number of dissatisfied people. Color scale: Change in level of dissatisfaction (time period between first and last surveys undertaken in the country; last survey: 2010, first survey: 2005-2009): green: decrease; orange and red: increase, with red: increase at an annual growth rate of at least 2 percentage points.
Percentage of people dissatisfied with their standard of living
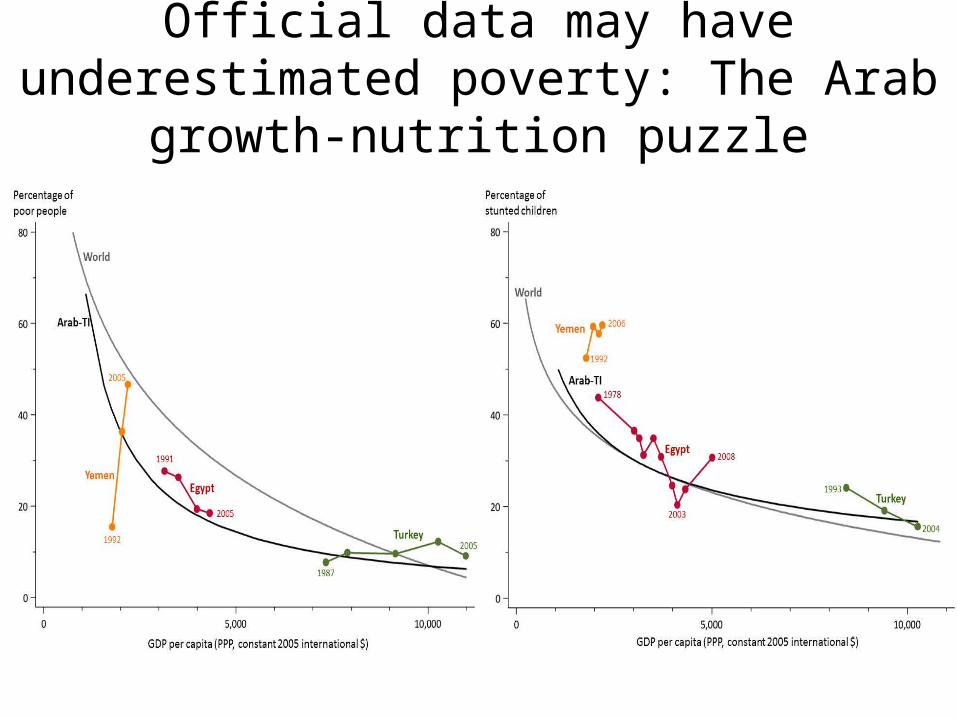
Official data may have underestimated poverty: The Arab growth-nutrition puzzle
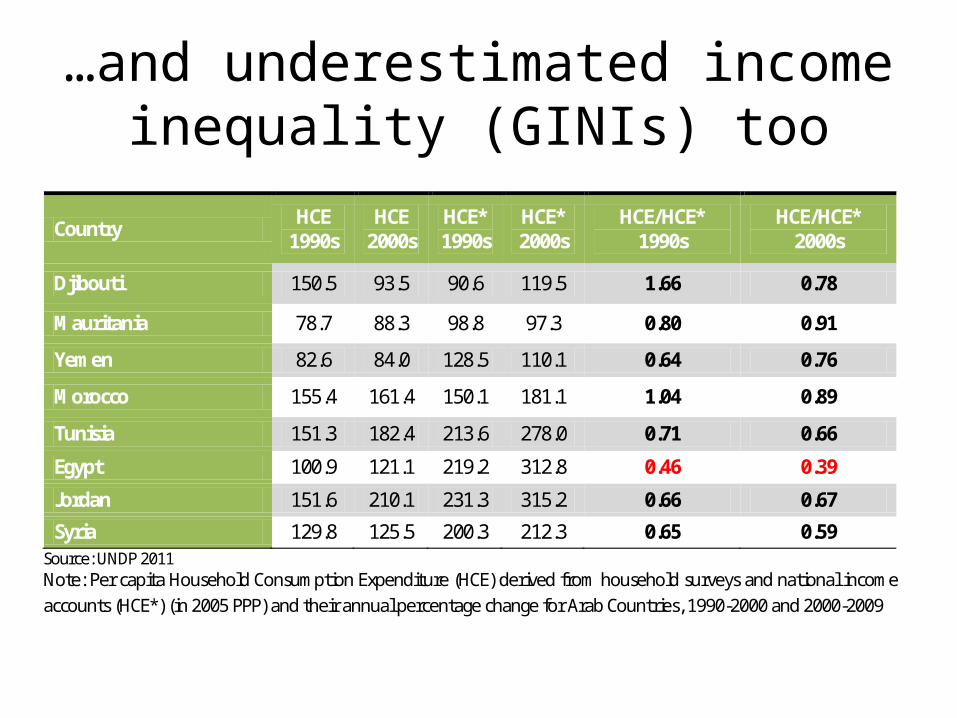
…and underestimated income inequality (GINIs) too
Country HCE 1990s
HCE 2000s
HCE* 1990s
HCE* 2000s
HCE/HCE* 1990s
HCE/HCE* 2000s
Djibouti 150.5 93.5 90.6 119.5 1.66 0.78
Mauritania 78.7 88.3 98.8 97.3 0.80 0.91
Yemen 82.6 84.0 128.5 110.1 0.64 0.76
Morocco 155.4 161.4 150.1 181.1 1.04 0.89
Tunisia 151.3 182.4 213.6 278.0 0.71 0.66
Egypt 100.9 121.1 219.2 312.8 0.46 0.39
Jordan 151.6 210.1 231.3 315.2 0.66 0.67
Syria 129.8 125.5 200.3 212.3 0.65 0.59 Source: UNDP 2011 Note: Per capita Household Consumption Expenditure (HCE) derived from household surveys and national income accounts (HCE*) (in 2005 PPP) and their annual percentage change for Arab Countries, 1990-2000 and 2000-2009
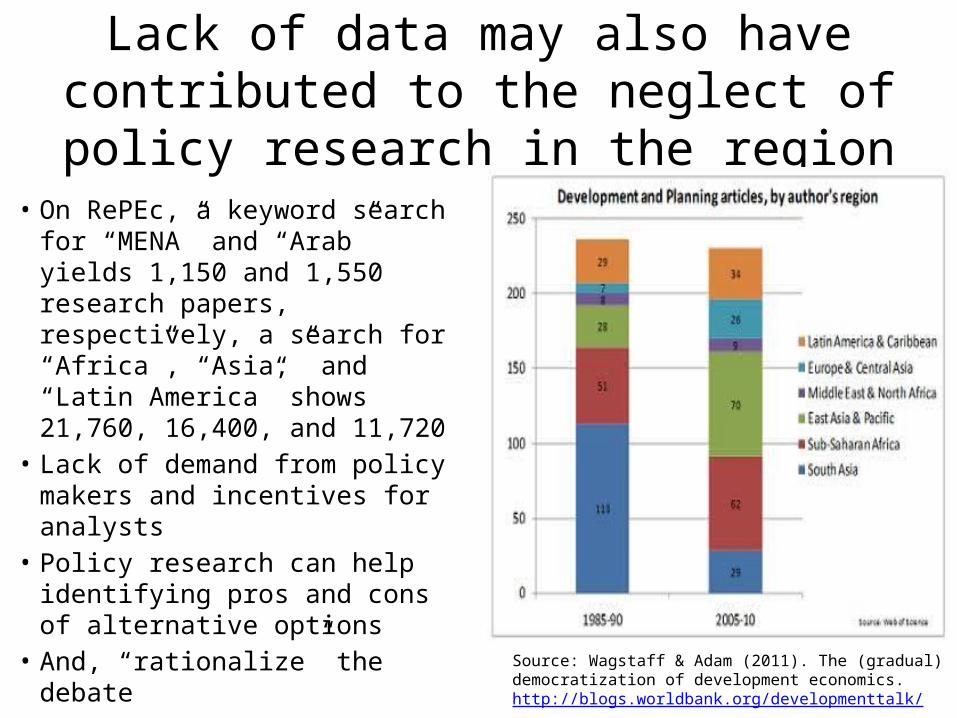
Lack of data may also have contributed to the neglect of policy research in the region
• On RePEc, a keyword search for “MENA” and “Arab” yields 1,150 and 1,550 research papers, respectively, a search for “Africa”, “Asia,” and “Latin America” shows 21,760, 16,400, and 11,720
• Lack of demand from policy makers and incentives for analysts
• Policy research can help identifying pros and cons of alternative options
• And, “rationalize” the debate
Source: Wagstaff & Adam (2011). The (gradual) democratization of development economics. http://blogs.worldbank.org/developmenttalk/
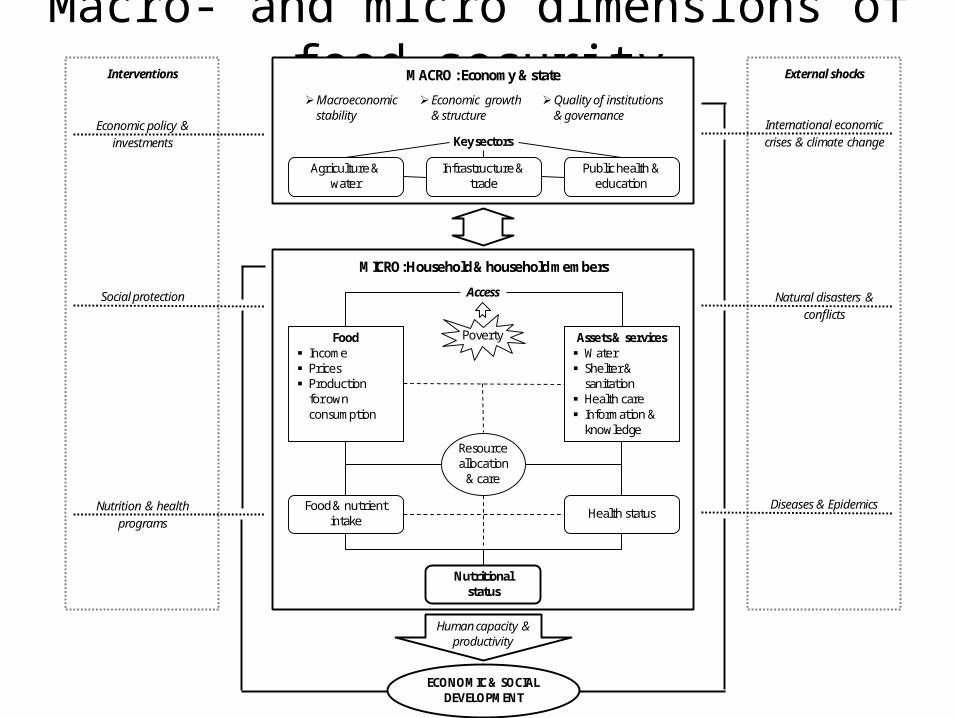
Macro- and micro dimensions of food securityMACRO : Economy & state
Infrastructure & trade
Public health & education
Agriculture & water
MICRO: Household & household members
Food Income Prices Production
for own consumption
Assets & services Water Shelter &
sanitation Health care Information &
knowledge
Access
Food & nutrient intake
Health status
Nutritional status
Human capacity & productivity
ECONOMIC & SOCIAL DEVELOPMENT
Interventions External shocks
Economic policy & investments
Social protection
Nutrition & health programs
International economic crises & climate change
Natural disasters & conflicts
Diseases & Epidemics
Resource allocation
& care
Quality of institutions & governance
Economic growth & structure
Key sectors
Poverty
Macroeconomic stability
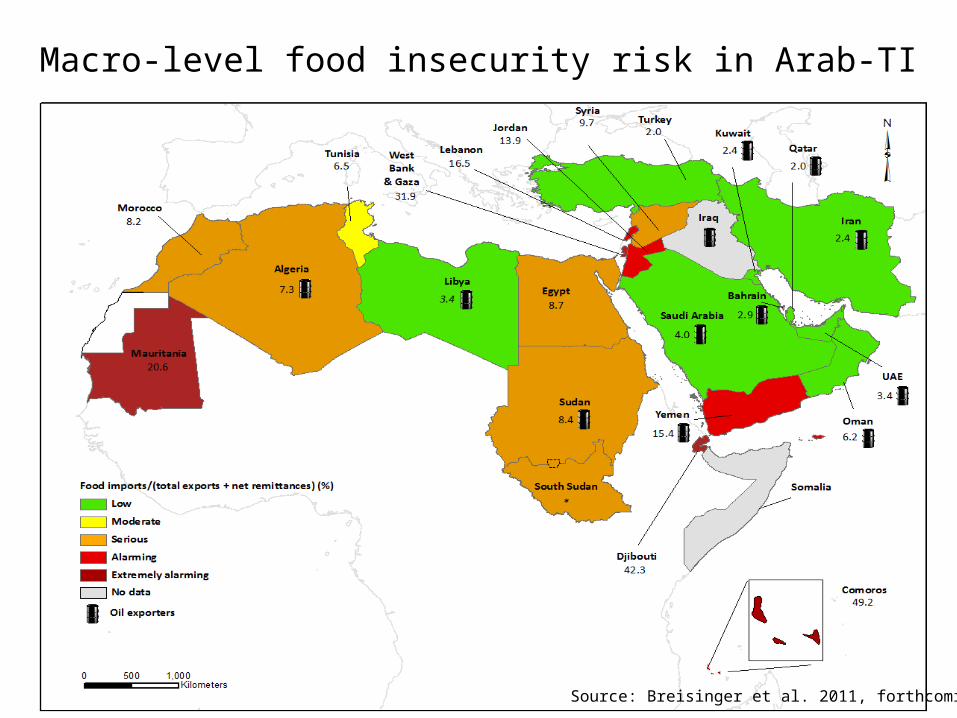
Macro-level food insecurity risk in Arab-TI
Source: Breisinger et al. 2011, forthcoming
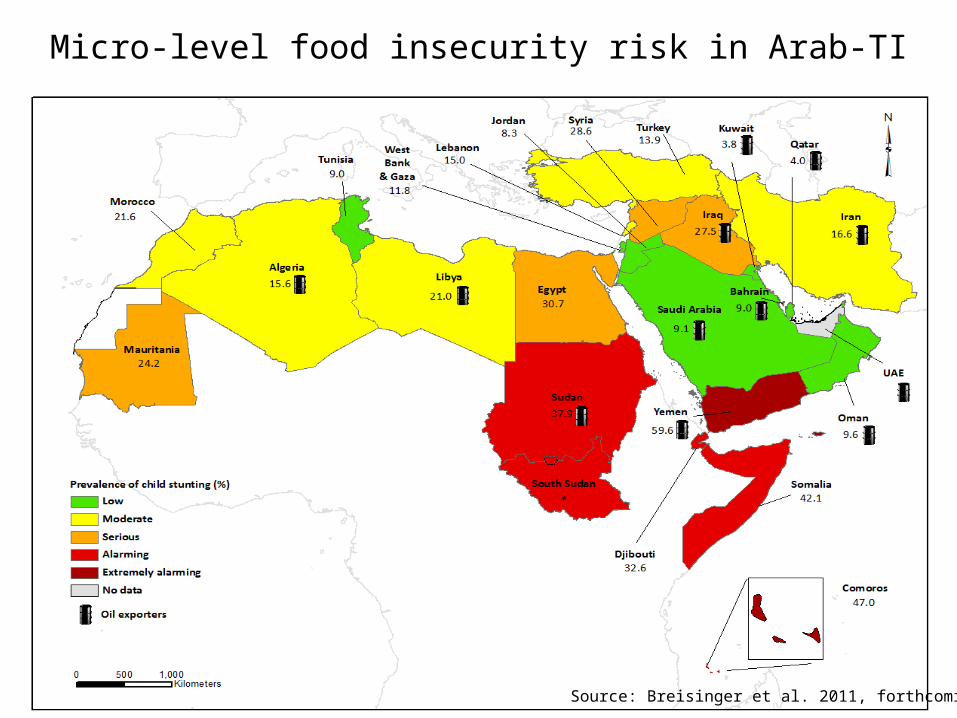
Micro-level food insecurity risk in Arab-TI
Source: Breisinger et al. 2011, forthcoming
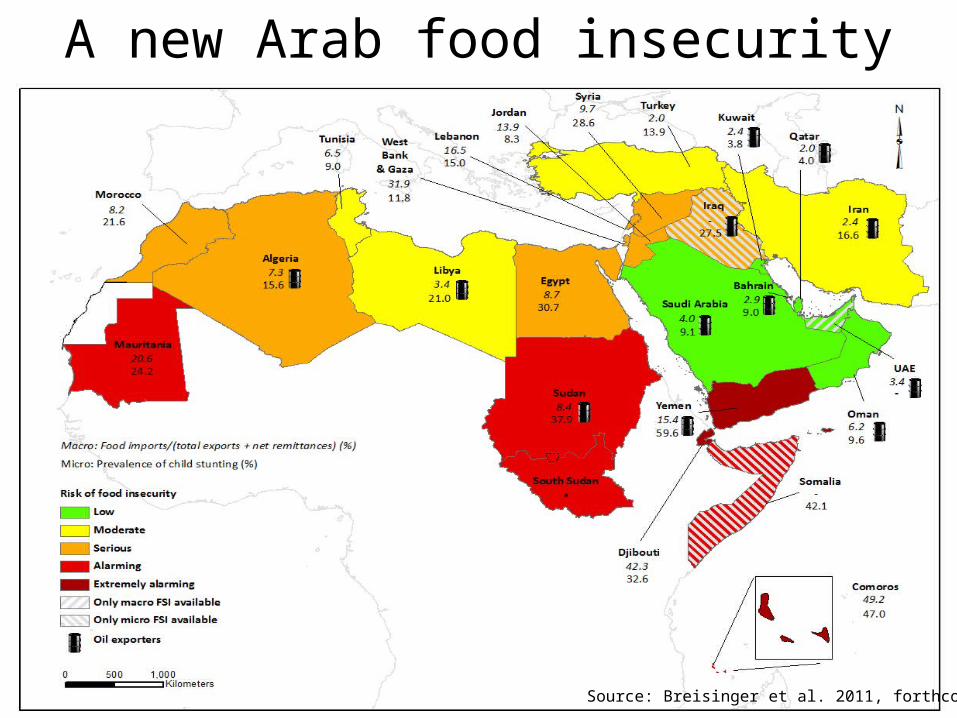
A new Arab food insecurity risk map
Source: Breisinger et al. 2011, forthcoming
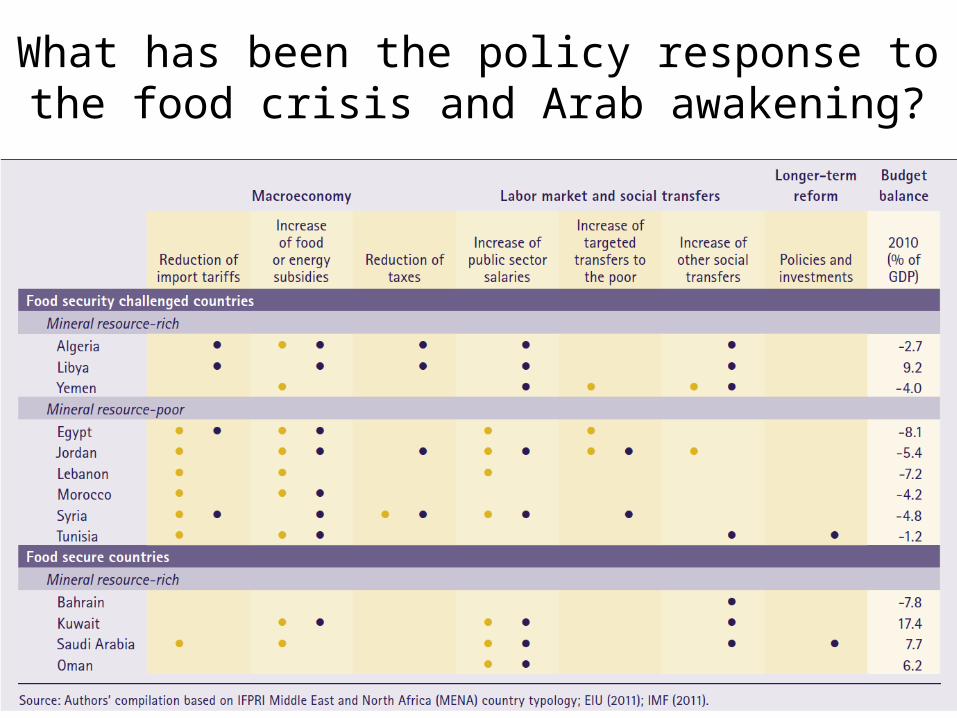
What has been the policy response to the food crisis and Arab awakening?
How to improve food security sustainably?
• For countries with macro-challenges– Export-led economic growth to generate foreign
exchange? – What is the role of agriculture?
• For countries with micro-challenges– Pro-poor and job-creating growth, in which
sectors?– Public spending, for example targeted transfers to
households?
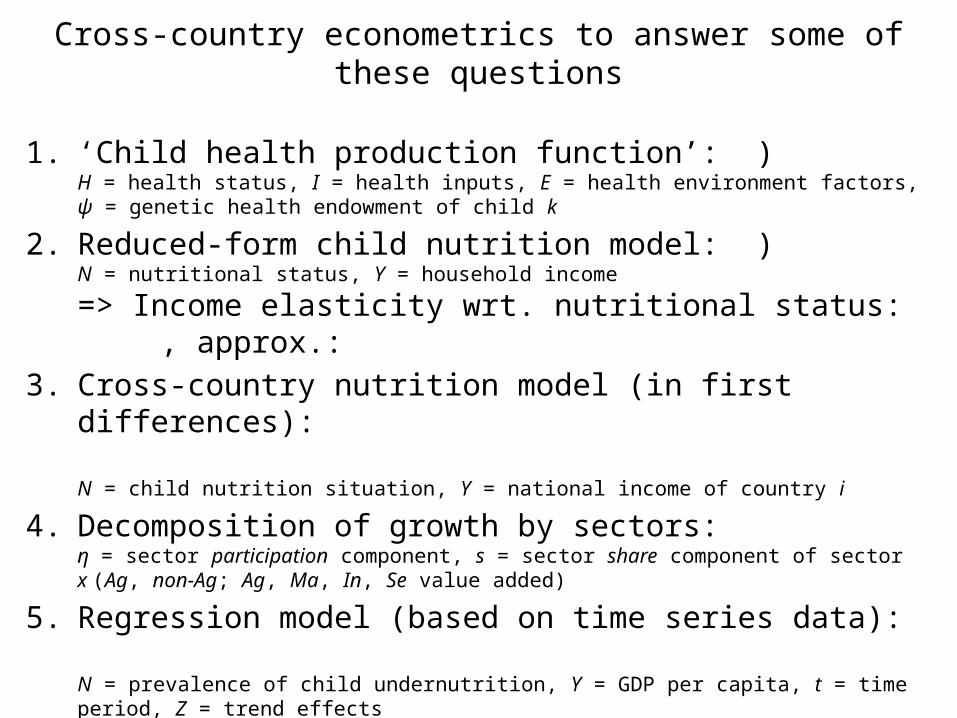
Cross-country econometrics to answer some of these questions
1. ‘Child health production function’: )H = health status, I = health inputs, E = health environment factors, ψ = genetic health endowment of child k
2. Reduced-form child nutrition model: )N = nutritional status, Y = household income
=> Income elasticity wrt. nutritional status: , approx.: 3. Cross-country nutrition model (in first differences):
N = child nutrition situation, Y = national income of country i
4. Decomposition of growth by sectors: η = sector participation component, s = sector share component of sector x (Ag, non-Ag; Ag, Ma, In, Se value added)
5. Regression model (based on time series data):
N = prevalence of child undernutrition, Y = GDP per capita, t = time period, Z = trend effects
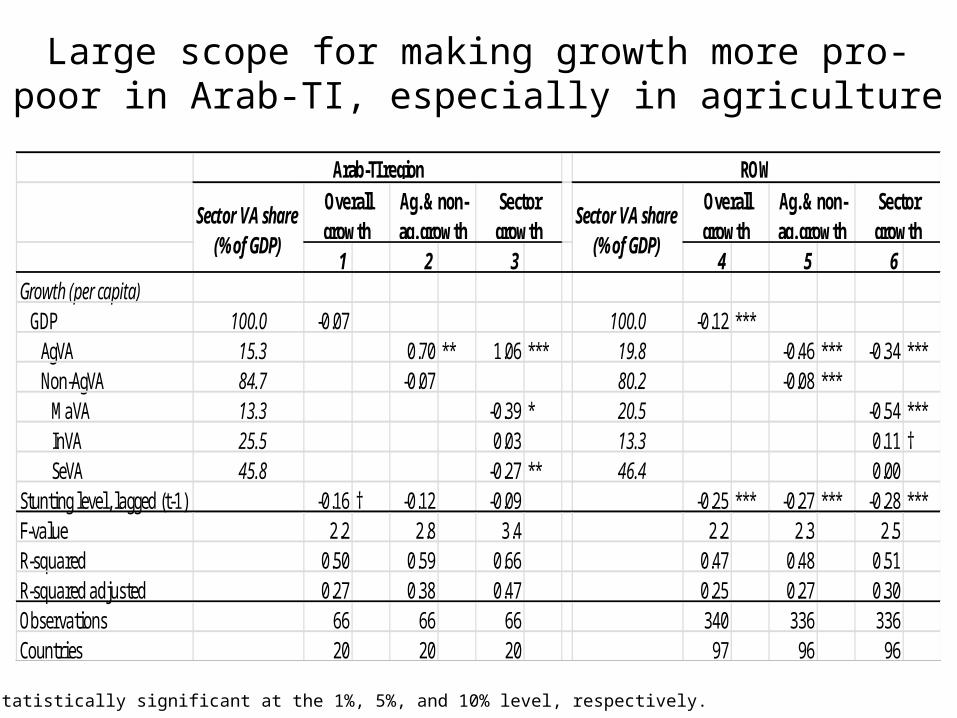
***, **, * statistically significant at the 1%, 5%, and 10% level, respectively.
Large scope for making growth more pro-poor in Arab-TI, especially in agriculture
1 2 3 4 5 6Growth (per capita)
GDP 100.0 -0.07 100.0 -0.12 ***AgVA 15.3 0.70 ** 1.06 *** 19.8 -0.46 *** -0.34 ***Non-AgVA 84.7 -0.07 80.2 -0.08 ***
MaVA 13.3 -0.39 * 20.5 -0.54 ***InVA 25.5 0.03 13.3 0.11 †SeVA 45.8 -0.27 ** 46.4 0.00
Stunting level, lagged (t-1) -0.16 † -0.12 -0.09 -0.25 *** -0.27 *** -0.28 ***F-value 2.2 2.8 3.4 2.2 2.3 2.5R-squared 0.50 0.59 0.66 0.47 0.48 0.51R-squared adjusted 0.27 0.38 0.47 0.25 0.27 0.30Observations 66 66 66 340 336 336Countries 20 20 20 97 96 96
Ag. & non-ag. growth
Sector growth
Arab-TI region ROWOverall growth
Ag. & non-ag. growth
Sector growth
Sector VA share (% of GDP)
Overall growth
Sector VA share (% of GDP)
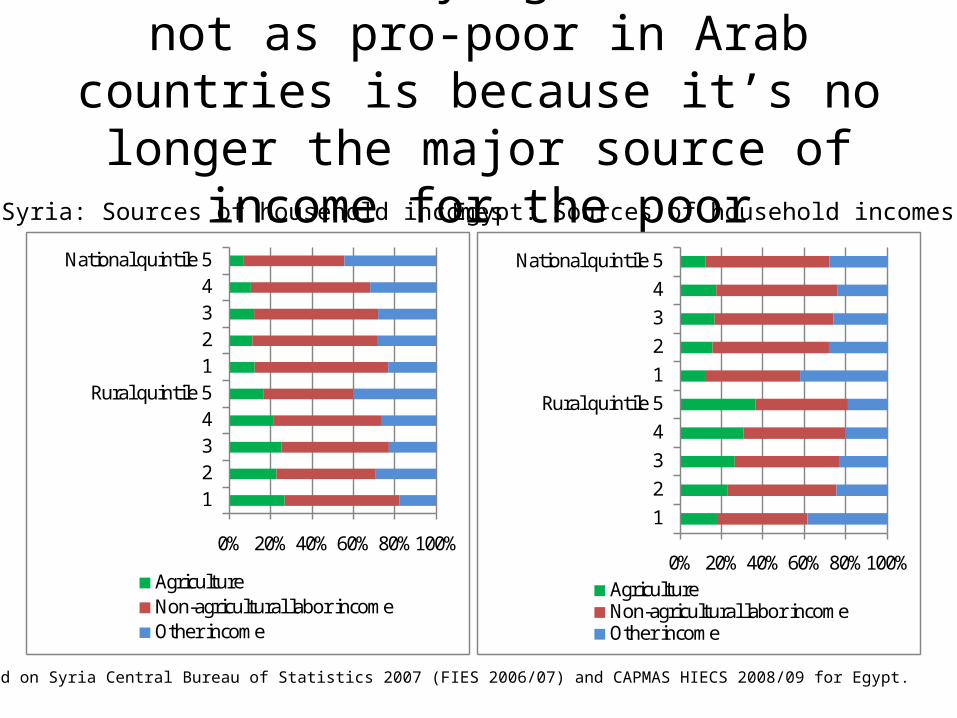
One reason why agriculture is not as pro-poor in Arab countries is because it’s no longer the
major source of income for the poor
0% 20% 40% 60% 80% 100%
1234
Rural quintile 51234
National quintile 5
AgricultureNon-agricultural labor incomeOther income
0% 20% 40% 60% 80% 100%
1234
Rural quintile 51234
National quintile 5
AgricultureNon-agricultural labor incomeOther income
Syria: Sources of household incomes Egypt: Sources of household incomes
Source: Based on Syria Central Bureau of Statistics 2007 (FIES 2006/07) and CAPMAS HIECS 2008/09 for Egypt.
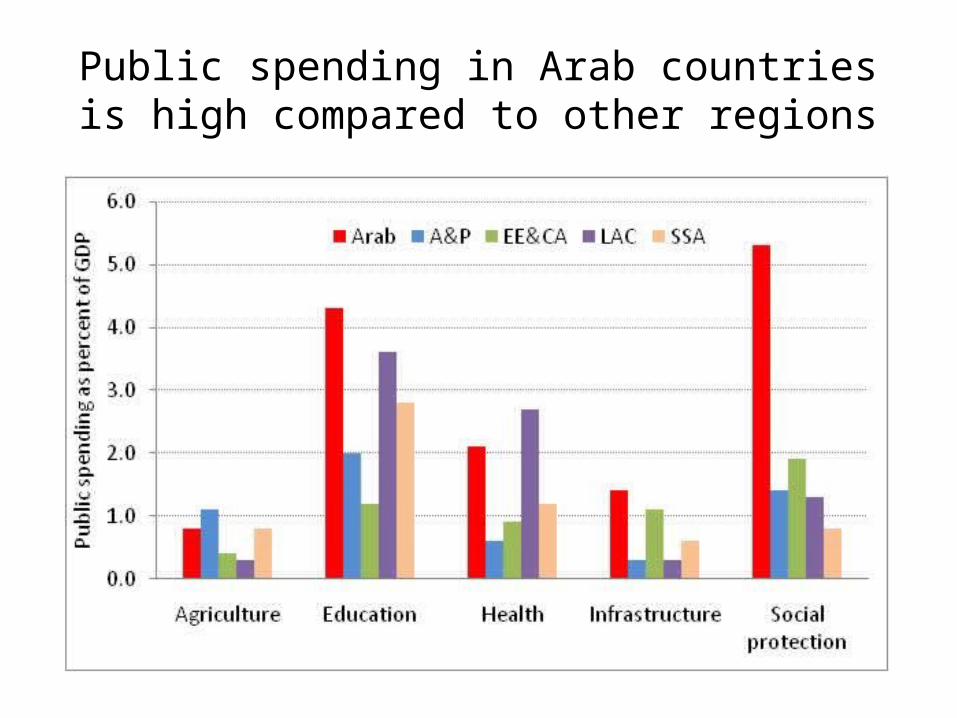
Public spending in Arab countries is high compared to other regions
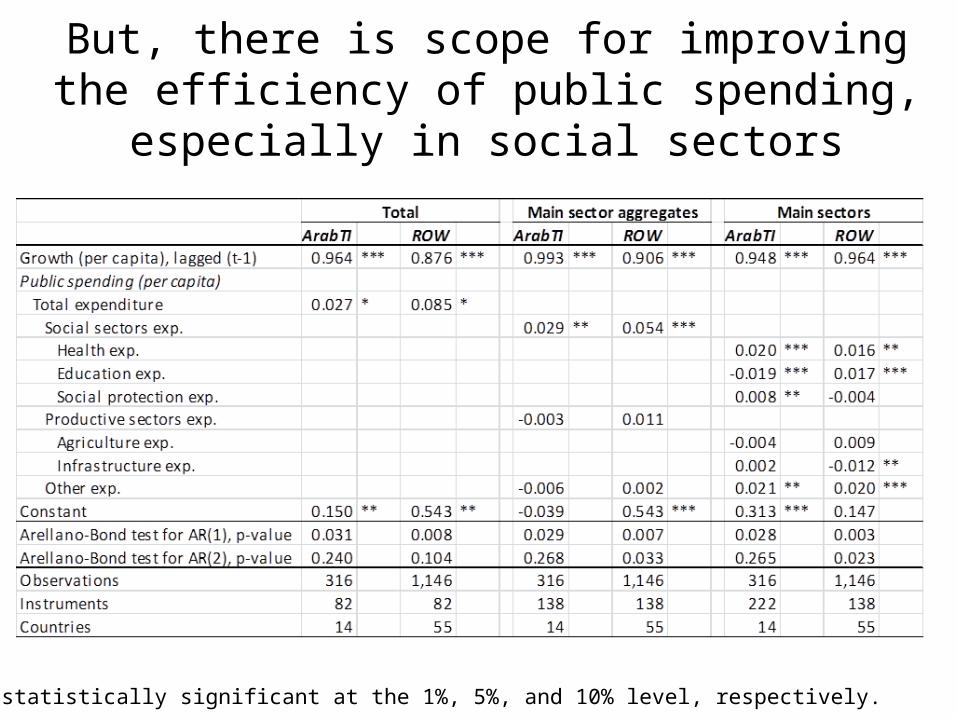
But, there is scope for improving the efficiency of public spending, especially in social sectors
***, **, * statistically significant at the 1%, 5%, and 10% level, respectively.
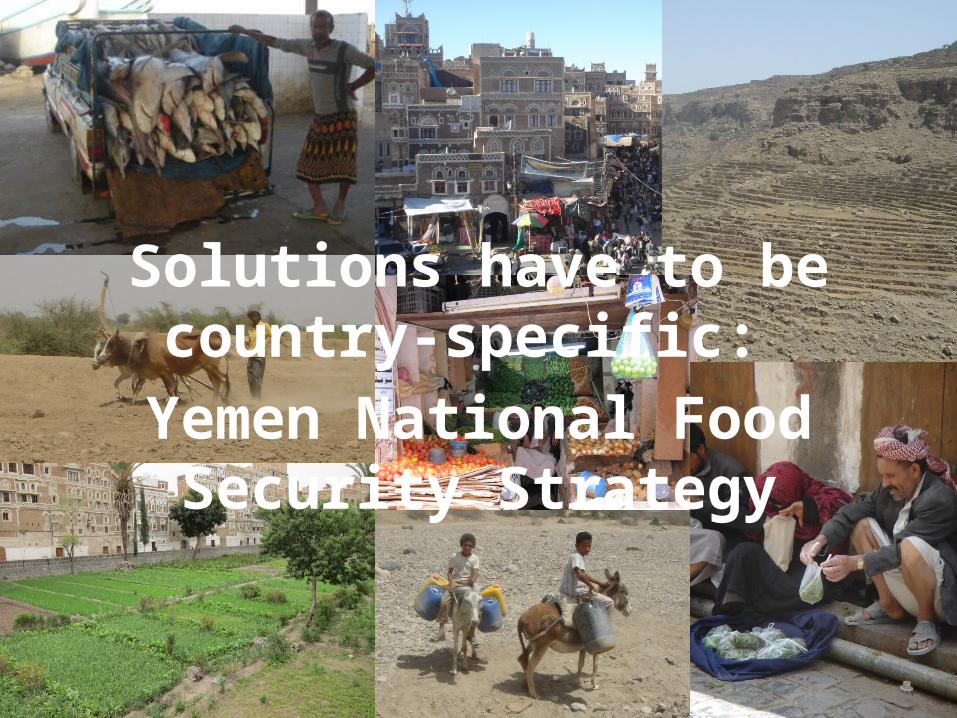
Solutions have to be country-specific: Yemen National Food Security
Strategy
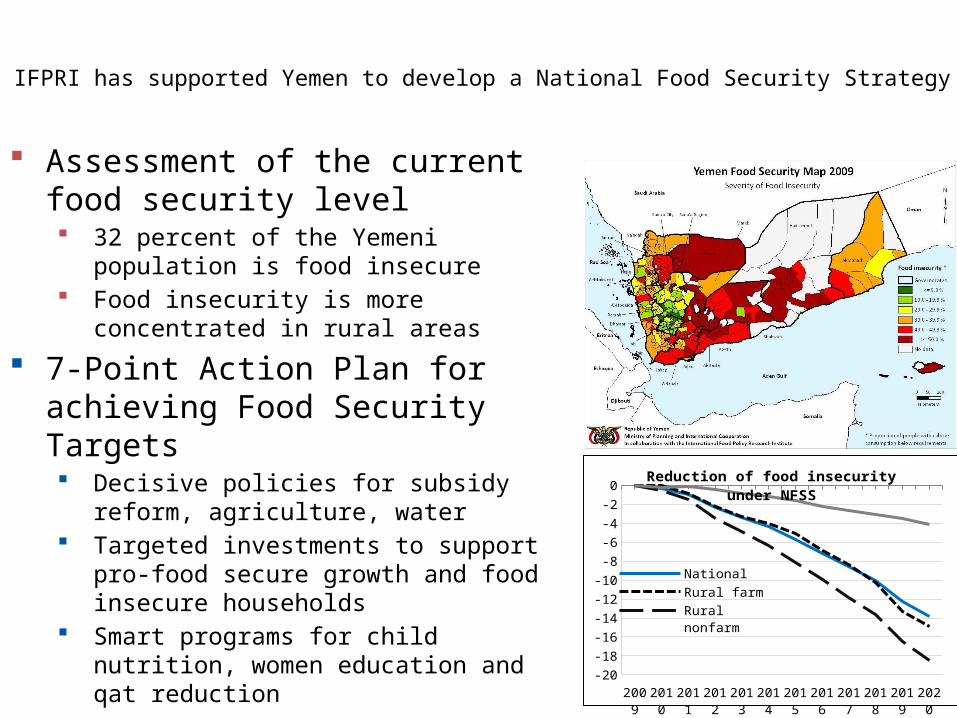
IFPRI has supported Yemen to develop a National Food Security Strategy
Assessment of the current food security level 32 percent of the Yemeni population is food
insecure Food insecurity is more concentrated in rural
areas
7-Point Action Plan for achieving Food Security Targets Decisive policies for subsidy reform, agriculture,
water Targeted investments to support pro-food secure
growth and food insecure households Smart programs for child nutrition, women
education and qat reduction
Digital Food Security Atlas
2009
2010
2011
2012
2013
2014
2015
2016
2017
2018
2019
2020
-20-18-16-14-12-10
-8-6-4-20
Reduction of food insecurity under NFSS
NationalRural farmRural nonfarmUrban
Other country examples of IFPRI’s work in MENA
• Egypt - Nile river water allocation• Syria and Yemen - Impacts of climate change• Morocco - Impacts of global food crisis• Somalia – Effect of droughts on conflict
• Improving resilience to conflict in MENA, with examples from Somalia, Sudan, Yemen and Egypt
Discussion of next steps for IFPRI and partners
• Conference “Priority setting for food security and poverty reduction in the Arab World” in Alexandria
• Support data collection and analysis to foster evidence-based decision making (example: ReSAKSS)
• Research on key issues, such as food security, growth-nutrition puzzle, role of agriculture, public spending efficiency, pro-poor growth strategies etc.(example: Country Strategy Support Programs)
• Food Policy Partnerships(example: CAADP)