Embed Size (px)
DESCRIPTION
Citation preview

1Q14 Conference Call Presentation
May 15, 2014

• Gross revenues of R$929.3 million, an increase of 15.7% over 1Q13
• Gross Margin of 18.8%, over gross revenues
• Total SSS of 15.8%, with 12.2% for mature stores
• EBITDA of R$-141.0 million, with EBITDA margin of -15.2%
• Net loss of R$185.3 million
• Opening of 2 new owned stores and 15 franchises, ending 1Q14 with 1,223 stores
Operational & Financial

251 Owned stores
128 Owned stores
154 Owned stores
500 Franchises
190 Owned stores
723 Owned stores
500 Franchises
1,223 stores
REGIONS
Owned stores
North 131
Northeast 255
Midwest 147
Southeast
South 190
15
3
121 20
15
33
16
179
9
63
128
5
11
5 Distribution centers
98
7
National Footprint

2 openings and 12 closings in 1Q14
35.1% of owned stores not yet at mature stage
8.0%
10.9%
16.2%
64.9%
Stores with up to 12 months
Stores with 12 to 24 months
Stores with 24 to 36 months
Stores with more than 36 months

• 17 openings in 1Q14 (2 closings)
• Accelerated store opening strategy for 2014, with expansion into other states
• Gain of scale (for franchisees and Brasil Pharma)

Healthy growth trend, above inflation

Generic penetration in
medicine sales
37.9% 37.6% 38.4% 40.3% 39.4%
16.5% 16.9% 15.8% 13.9% 13.8%
45.6% 45.5% 45.8% 45.8% 46.8%
1Q13 2Q13 3Q13 4Q13 1Q14
Non-medicines Generic Medicine Branded medicine
32.4
36.9
1Q13 1Q14
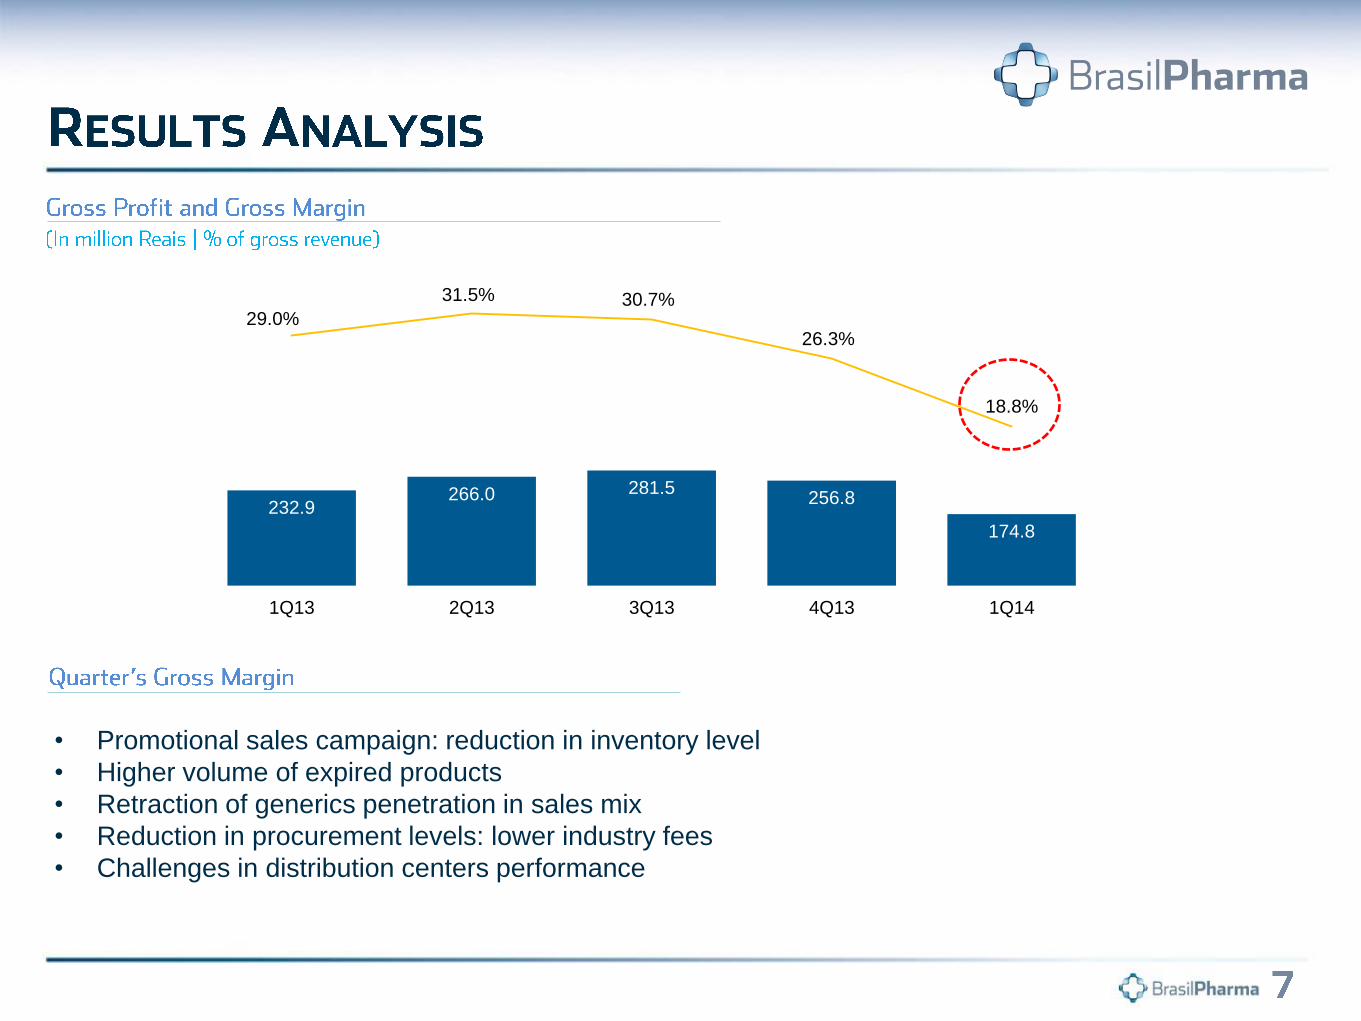
• Promotional sales campaign: reduction in inventory level
• Higher volume of expired products
• Retraction of generics penetration in sales mix
• Reduction in procurement levels: lower industry fees
• Challenges in distribution centers performance
232.9 266.0 281.5
256.8
174.8
29.0%
31.5% 30.7%
26.3%
18.8%
1Q13 2Q13 3Q13 4Q13 1Q14

150.0 166.6 174.6
188.5
225.1 18.7% 19.7% 19.1% 19.3%
24.2%
1Q13 2Q13 3Q13 4Q13 1Q14
48.1 51.0 52.1 53.0 66.7
6.0% 6.0% 5.7% 5.4%
7.2%
1Q13 2Q13 3Q13 4Q13 1Q14
• Increase in stores/DC staffs
• New DCs
• Higher comission on sales
• Sistems implementation
• Increase in staff
• Service contracts

• The Company did not record any non-recurring expenses in 1Q14 nor adjusted the results for non-
cash items such as stock option plan during the period.
• R$23.2 million in 1Q14 primarily related to:
• write-off of commercial agreements receivables
• write-off of fixed assets due to store closings

1 - Portion related to commercial establishments amortization (2013 only).
Net income (loss) (6,985) (185,296)
(-) Income tax and social contribution 566 11,152
(-) Financial result (18,920) (24,996)
(-) Depreciation and amortization (16,462) (28,591)
EBITDA 27,830 (142,861)
(-) Results from equity accounting (1,523) (1,856)
(-) SOP expenses (2,816) -
(-) Non recurring income/expenses (2,594) -
Adjusted EBITDA 34,763 (141,005)
% Adjusted EBITDA margin 4.3% -15.2%
EBITDA reconciliation (R$'000) 1Q13 1Q14
Net income (loss) (6,985) (185,296)
% Net margin -0.9% -19.9%
(-) Non recurring expenses 2,594 -
(-) SOP expenses 2,816 -
(-) D&A Commercial establishments¹ 4,160 -
Adjusted Net Income (loss) 2,585 (185,296)
% Adjusted net margin 0.3% -19.9%
Net Income reconciliation (R$'000) 1Q13 1Q14

Cash position and indebtedness (R$'000) 1Q13 2Q13 3Q13 4Q13 1Q14
(+) Loans and financing 169,079 160,228 247,170 209,490 204,884
Short term 44,864 41,694 150,963 124,507 125,800
Long term 124,215 118,534 96,207 84,983 79,084
(+) Debentures 258,937 253,964 260,704 549,809 555,276
Short term 10,427 5,348 11,982 15,249 555,276
Long term 248,510 248,616 248,722 534,560 0
(+) Accounts payable for investment acquisition 264,430 232,581 179,652 147,837 156,615
Short term 82,833 81,986 82,681 70,300 108,039
Long term 181,597 150,595 96,971 77,537 48,576
(=) Total Indebtedness 692,446 646,773 687,526 907,136 916,775
Short term (%) 19.9% 19.9% 35.7% 23.2% 86.1%
Long term (%) 80.1% 80.1% 64.3% 76.8% 13.9%
(-) Cash and cash equivalents (183,870) (162,205) (213,132) (405,914) (98,131)
(=) Net Debt 508,576 484,568 474,394 501,222 818,644
Net debt/Adjusted EBITDA (LTM) 2.7 X 2.5 X 2.5 X 3.3 X NA
• EBITDA LTM of R$-24,9 million impacted mainly by the results of the last 2 quarters;
• Non compliance in covenants and reclassification of debentures for short term debt;
• Undergoing negotiations with bondholders: wavers on next quarters;
• Capital increase was approved on May 6.

DC/Logistics Capex Others Reform SAP/IT Organic growth
Working capital 1Q13 4Q13 1Q14
Accounts receivable 24 6 15
Inventories 108 107 88
Suppliers 56 77 57
Working capital in days 76 36 46

1- The variation in working capital includes the change in accounts receivable, inventories and suppliers.
Cash flow Statement (R$'000) 1Q13 1Q14
EBT (7,553) (196,448)
(+) Depreciation and amortization 16,462 28,591
(+/-) Others 24,389 19,572
Operating cash generation 33,298 (148,285)
(+/-) Change in working capital¹ (83,142) (110,467)
(+/-) Change in other assets and liabilities (13,181) (10,682)
Cash consumption (96,322) (121,149)
Income Tax & Social Contribution payed (600) (1,235)
Net cash generated by operating activities (63,625) (270,669)
(-) Capex from operations (24,922) (33,934)
(-) Acquisitions (80,903) 3,688
Net Cash from investing activities (105,825) (30,246)
(+/-) Loans and financing (15,431) (7,167)
(+/-) Equity funding / Dividends - 299
Net Cash from financing activities (15,431) (6,868)
Change in cash and cash equivalents (184,881) (307,783)
Cash and cash equivalents - opening balance 368,751 405,914
Cash and cash equivalents - closing balance 183,870 98,131

Source: Bloomberg, as of March 31st, 2014.
Company’s IPO on June 24, 2011.
BPHA3 31.03.14 Market closure
Shares outstanding 256,384,419
Price (R$/share) 3.85
Annual Performance -43.0%
Ibovespa Index -2.1
Perfomance since IPO¹ -21.6%
Ibovespa Index -17.4
Market Cap (R$ Million) 987.1
Average daily trading volume in 2014 (R$ million) 4.4
Jun-1
1
Sep-1
1
Dec-1
1
Mar-
12
Jun-1
2
Sep-1
2
Dec-1
2
Mar-
13
Ju
n-1
3
Sep-1
3
Dec-1
3
Mar-
14
Brasil Pharma IBOV
• Non-unified and unstable IT systems
• Quality/consistency of information
• Substitution of 4 distribution centers
• Working capital management
• Challenges in inventory control
• High leverage
• Sub-optimal commercial approach
• Fiscal inefficiencies
• Mais Econômica positioning

VP of Operations Álvaro Jr.
CEO José Ricardo
Board of Directors
IR Otavio Lyra
GESTÃO Rodrigo Silveira
LEGAL Cristina Caiuby
Risk Management TBD
HR TBD
Financial VP TBD
Controller TBD
Strategic Planning Sara Rezende
IT Rogério Segala
Commercial Dir. TBD
Operations Dir. Renato Lobo
BIG BEN Raul Aguilera

• New organizational structure: reducing corporate costs;
• Platforms “accountability”: reducing indirect costs, new committee for the
approval of new products;
P&L
P&L
P&L
P&L
CORPORATE
Operations
Mid-West South Bahia North/NE
Targets for regional chains set over
sales and organic expansion;
CORPORATE
Operations
Mid-West South Bahia North/NE
Resourses came from Corporate Level
whenever requested.
Targets set over margins;
Regional Managers are responsible for their
own P&L.

• Stabilization of distribution centers: reducing indirect costs and optimizing
inventories at store level;
• Systems’ stabilization: procurement and inventory level optimization;
• New financial structure: accurate control of industry’s marketing fees, higher
control over PBM’s sales (replenishment and discounting) and procurement
(volumes and commercial discounts), optimization of indirect taxes, stronger
viability and profitability control over store openings.
• Reevaluation of active service contracts;
• New focus on training offered to our sales force given mix of products
orientation.