Embed Size (px)
Citation preview
Center for Social and Economic Research
CASE Reports
Non-tariff barriersin Ukrainian export
to the EU
Ma³gorzata JakubiakMaryla Maliszewska
Irina OrlovaMagdalena RokickaVitaliy Vavryschuk
Warsaw 2006No.
68/
2006
CASE Reports No. 68
The views and opinions expressed here reflect the authors' point of view and notnecessarily those of the CASE.
Publication was financed by the 2006 foreign aid programme of the Ministry of ForeignAffairs of the Republic of Poland
Keywords: Ukraine, EU neighbourhood, trade, non-tariff barriers to trade (NTBs),technical barriers to trade (TBTs)
© CASE – Center for Social and Economic Research, Warsaw 2006
ISBN 978-83-7178-421-7EAN 9788371784217
Publisher:CASE – Center for Social and Economic Research12 Sienkiewicza, 00-010 Warsaw, Polandtel.: (48 22) 622 66 27, 828 61 33, fax: (48 22) 828 60 69e-mail: [email protected]://www.case.com.pl/
Table of Contents
Introduction. . . . . . . . . . . . . . . . . . . . . . . . . . . . . . . . . . . . . . . . . . . . . . . . . . . . . . . . . 7
1. Ukraine's trade policy: an overview . . . . . . . . . . . . . . . . . . . . . . . . . . . . . . . . . . . . . 91.1. Trade policy vis-à-vis the EU . . . . . . . . . . . . . . . . . . . . . . . . . . . . . . . . . . . . . . . . 111.2. Key trade-related institutions in Ukraine. . . . . . . . . . . . . . . . . . . . . . . . . . . . . . . 12
2. Ukraine's trade with the European Union . . . . . . . . . . . . . . . . . . . . . . . . . . . . . . . 15
3. NTBs faced by Ukrainian exporters – results from other studies. . . . . . . . . . . . . . 17
4. Experience of current new members: non tariff barriers between CEECsand the EU . . . . . . . . . . . . . . . . . . . . . . . . . . . . . . . . . . . . . . . . . . . . . . . . . . . 19
4.1. Legal framework for harmonisation of standards and technical regulation. . . . . 194.2. Non-tariff barriers to trade with the EU in 1990s . . . . . . . . . . . . . . . . . . . . . . . . 204.3. Technical barriers . . . . . . . . . . . . . . . . . . . . . . . . . . . . . . . . . . . . . . . . . . . . . . . . 214.4. What happened after accession . . . . . . . . . . . . . . . . . . . . . . . . . . . . . . . . . . . . . . 22
5. NTBs faced by Ukrainian exporters to the EU – survey results . . . . . . . . . . . . . . . 255.1. Description of sample . . . . . . . . . . . . . . . . . . . . . . . . . . . . . . . . . . . . . . . . . . . . . 265.2. Certifying origin of goods . . . . . . . . . . . . . . . . . . . . . . . . . . . . . . . . . . . . . . . . . . 295.3. Customs procedures . . . . . . . . . . . . . . . . . . . . . . . . . . . . . . . . . . . . . . . . . . . . . . 335.4. Technical standards. . . . . . . . . . . . . . . . . . . . . . . . . . . . . . . . . . . . . . . . . . . . . . . 365.5. Other NTBs . . . . . . . . . . . . . . . . . . . . . . . . . . . . . . . . . . . . . . . . . . . . . . . . . . . . . 47
6. Conclusions and policy recommendations . . . . . . . . . . . . . . . . . . . . . . . . . . . . . . . 49
Appendix 1: Selected descriptive statistics . . . . . . . . . . . . . . . . . . . . . . . . . . . . . . . . . 53
Appendix 2: Questionnaire. . . . . . . . . . . . . . . . . . . . . . . . . . . . . . . . . . . . . . . . . . . . . 55
List of Tables . . . . . . . . . . . . . . . . . . . . . . . . . . . . . . . . . . . . . . . . . . . . . . . . . . . . . . . 65List of Figures . . . . . . . . . . . . . . . . . . . . . . . . . . . . . . . . . . . . . . . . . . . . . . . . . . . . . . 65
References . . . . . . . . . . . . . . . . . . . . . . . . . . . . . . . . . . . . . . . . . . . . . . . . . . . . . . . . 67
3CASE Reports No. 68
The Authors
Małgorzata Jakubiak graduated from the University of Sussex (UK; 1997) and theDepartment of Economics at the University of Warsaw (1998). Her main areas ofinterest include foreign trade and macroeconomics. She has published articles ontrade flows, exchange rates, savings and investments in Poland and other CEEcountries. During 2000-2001 she was working at the CASE mission in Ukraine asresident consultant. Since 2002 she has been working on the doctoral thesis entitled"Role of trade and foreign investment in the transmission of innovation into Poland".She has collaborated with the CASE Foundation since 1997.
Maryla Maliszewska has been working with the CASE Foundation since 1996. Herresearch interests cover modelling of international trade flows, determinants of realexchange rate, location of production and agglomeration externalities in transition.Her study on the impact of Poland's accession to the EU within a computable generalequilibrium framework was rewarded with the second prize at the annual GDN'sResearch Medals Competition for "Outstanding Research in Development" in January2004. Between 1997-98 and in 1999, she worked as a CASE representative in theProDemocratia advisory mission in Romania. In 2000 she was a summer intern at theWorld Bank, Washington DC. Maryla Maliszewska graduated from the University ofSussex (1996) and Warsaw University's Department of Economics (1997). Shesuccessfully defended her DPhil thesis at the University of Sussex in 2004.
Irina Orlova has been working with CASE Ukraine since September 2006. She is agraduate of Economics Education and Research Consortium (EERC) ‘2005, MAProgram in Economics at National University of "Kyiv-Mohyla Academy". Irina'sresearch interests lie in the areas of International Trade, Capital Flows, TransitionEconomies. Her studies presented at the international conferences include: "TradingPartners and Economic Growth in Transition Economies", "The Effect of Policies onFDI Flows: The Case of Transition Countries".
Magdalena Rokicka graduated from Warsaw University, Department of Economics in2001. In 2002 she continued her study at University of Nantes. In 2006 she accomplishedat Warsaw University post graduate programme in cross cultural relations. Her mainarea of interest consist on: economic growth, FDI, education and macroeconomics.Since 2004 she has been working at CASE, as a member of application team, currently,as junior researcher, she is taking part in several research projects.
4
Jakubiak M., Maliszewska M., Orlova I., Rokicka M., Vavryschuk V.
CASE Reports No. 68
Vitaliy Vavryschuk is an economist at CASE Ukraine since 2003. He graduated fromEERC program at National University of "Kyiv-Mohyla Academy" and obtained MAdegree in economics. Fields of specialization: foreign trade and WTO, Europeanintegration, macroeconomics.
5
NON-TARIFF BARRIERS IN UKRAINIAN EXPORT TO THE EU
CASE Reports No. 68
List of abbreviations
6
Jakubiak M., Maliszewska M., Orlova I., Rokicka M., Vavryschuk V.
CASE Reports No. 68
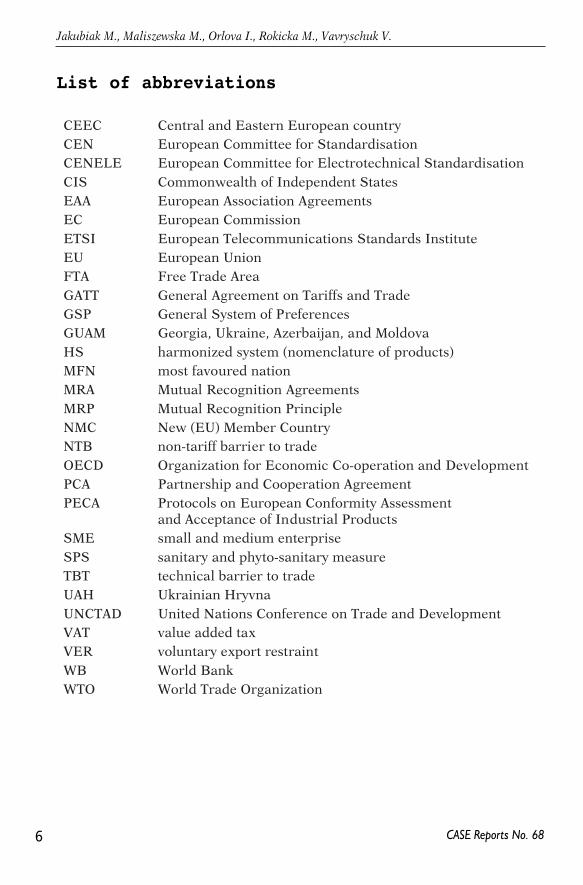
CEEC Central and Eastern European countryCEN European Committee for StandardisationCENELE European Committee for Electrotechnical StandardisationCIS Commonwealth of Independent StatesEAA European Association AgreementsEC European CommissionETSI European Telecommunications Standards InstituteEU European UnionFTA Free Trade AreaGATT General Agreement on Tariffs and TradeGSP General System of PreferencesGUAM Georgia, Ukraine, Azerbaijan, and MoldovaHS harmonized system (nomenclature of products)MFN most favoured nationMRA Mutual Recognition AgreementsMRP Mutual Recognition PrincipleNMC New (EU) Member CountryNTB non-tariff barrier to tradeOECD Organization for Economic Co-operation and DevelopmentPCA Partnership and Cooperation AgreementPECA Protocols on European Conformity Assessment
and Acceptance of Industrial ProductsSME small and medium enterpriseSPS sanitary and phyto-sanitary measureTBT technical barrier to tradeUAH Ukrainian Hryvna UNCTAD United Nations Conference on Trade and Development VAT value added taxVER voluntary export restraintWB World BankWTO World Trade Organization
The economic relations between the EU and Ukraine have intensified in recentyears. Following the 2004 enlargement, Ukraine became the direct neighbour of theEU. At the same time, the country has been developing rapidly and both localproduction capacities and demand for foreign produce have been increasing. Ukrainealso become more open to external partners. All this is reflected in the gradualeffective trade integration with the EU; i.e. in growing bilateral trade flows.
The overall EU tariffs for Ukrainian products are rather low and other traditionprotection measures apply to selective sectors only. Moreover they are expected todisappear gradually within the next few years, following Ukraine WTO entry andexpected establishment of the free trade area in manufacturing goods between the EUand Ukraine. However, there exist other so called ‘non-tariff’ barriers to trade thatprotect and will protect the EU market. For a relatively poorer country these barriersmay turn to be prohibitive. This is probably the cause that there is general perceptionabout Ukrainian export to the EU still being below its potential. The goal of this reportis to explore whether the non-tariff barriers impede Ukrainian export to the EU andto what extent.
This report is published about the time when the free trade agreement betweenthe EU and Ukraine is negotiated. The authors hope that the findings will turn usefulfor designing the extent of this agreement and contribute to the discussion about it byshowing the extent of non-tariff barriers faced currently by Ukrainian exporters.
The report starts from the overview of Ukraine trade policy (chapter 1), with thespecial emphasis put on economic relations between the EU and Ukraine. Evolutionof bilateral trade flows is discussed next (chapter 2). This is supplemented with thebrief discussion of recently conducted surveys on barriers hampering Ukrainianexports (chapter 3).
The experience of some current EU members from Central and Eastern Europe,which together with gradual phasing out of tariff and traditional protection measuresin the 1990s faced growing non-tariff barriers to trade with the EU, seems to berelevant for Ukraine. Chapter 4 reviews the exposure of CEECs exports to the EU’snon-tariff barriers, and describes how the countries were changing its trade-relatedlegislation towards the EU laws in order to tackle these barriers. Chapter 4 also shows
7CASE Reports No. 68
Introduction
the extent of the EU’s technical barriers to trade in different sectors and how wellCEE enterprises were prepared to meet them, once the EU commodity marketsopened up completely for the new EU members in 2004.
Results of the survey on non-tariff barriers to trade that are faced by Ukrainianexporters to the EU are presented in chapter 5. This is the main empirical contributionand the focus of this paper. The survey covered such areas as certification of origin,customs procedures and technical standards. Finally, chapter 6 concludes with policyrecommendations.
The authors are grateful for the assistance received from the State Committee ofUkraine for Technical Regulation and Consumer Policy and Association of LightIndustry Producers of Ukraine. This publication was made possible due to thefinancial support provided by the 2006 Foreign Aid Programme of the Ministry ofForeign Affairs of Poland.
8
Jakubiak M., Maliszewska M., Orlova I., Rokicka M., Vavryschuk V.
CASE Reports No. 68
Since 1991 Ukraine gained freedom to conduct external trade policy. Thiscoincided with the beginning of severe economic crisis following collapse of thecommand economy. In the early 1990s protectionist approach prevailed andgovernment was very cautious in liberalizing external trade. However, since mid1990s Ukrainian government switched to systemic and comprehensiveliberalization of procedures connected with economic activities abroad and newinstitutional setup for foreign economic activities has been established. On the onehand, opening of the market was motivated by the necessity to obtain symmetricconcessions from the major trading partners. On the other hand, it becameincreasingly obvious that higher competition induced by importers hadsubstantial positive externalities at the domestic market.
Export sector remained the main driving force of economic growth in Ukrainesince 2000 and barrier-free access of Ukrainian producers to international markets isvitally important for sustainable economic development. Companies selling abroad(especially to developed countries) are motivated to improve quality and safety of theirproducts through investing in enlarging their production capacities and in newtechnologies. Thus, government priorities were to facilitate access of Ukrainiancommodities and services to the markets of Ukraine’s trading partners.
After disintegration of the Soviet Union the newly-independent countries madeattempts to restore barrier-free trade regime within the Commonwealth ofIndependent States (CIS) by forming free-trade zone. However, these plans havenever resulted in a multilateral agreement. The CIS countries switched to bilateralfree trade zones. Currently (2006) Ukraine has free trade agreements with all the CIScountries and Macedonia1. Until 2004 Ukraine had free trade agreements also withthree Baltic states2. However, these had to be abolished when the partner countriesentered the EU (common customs territory). As a rule, a number of commodities areexcluded from the Ukrainian free trade regimes (i.e. sugar, spirits, confectionary etc.)under bilateral agreements with trading partners.
9
NON-TARIFF BARRIERS IN UKRAINIAN EXPORT TO THE EU
CASE Reports No. 68
1 In it’s essence the free trade agreement with Macedonia envisages preferential trade regime, i.e. not all tariffbarriers are removed for trade between the countries.
2 Estonia, Latvia, and Lithuania.
1. Ukraine's trade policy: an overview
In 2004 Ukraine joined Common Economic Area – economic agreement betweenfour CIS member countries envisaging formation of economic union in the long runperspective. As of January 2007 the progress was rather moderate and countries didnot manage to implement any provision to ensure deeper economic integration of themembers’ economies. At the same time Ukraine actively participated in GUAM –organization of Georgia, Ukraine, Azerbaijan and Moldova designed to promotepolitical and economic relations among the members. The four countries formallysigned multilateral free trade agreement in May 2006.
Ukraine applied for the WTO membership in 1993 but the negotiating process wasfrozen until 2000. As of January 2007 the country managed to complete bilateralnegotiations with all members of the Working Party except for Kyrgyzstan. The mostawaited bilateral protocols with the EU were signed in March 2003, with the USA andAustralia in early 2006. The reforms of Ukraine’s trade regime were much driven bythe necessity to ensure fulfilment of commitments under bilateral protocols andharmonization of national legislation with the WTO multilateral agreements.
Until now the country has implemented majority of reforms in order to fulfilcommitments fixed in bilateral protocols and to comply with the WTO agreements. Inparticular, since 2004 the parliament passed a dozen of laws harmonizing trade-related legislation with the WTO norms. Adopted laws and regulatory acts refer totechnical standards, antidumping and countervailing practices, customs valuation,intellectual property rights etc. During 2005 the parliament amended the law ‘OnCustoms Tariffs’ three times lowering rates for over 70% of lines of the HarmonizedSystem. Some of the active tariffs are lower than maximum values under the schedule.Ukraine also abolished all restrictions as to the share of foreign capital in statutoryfunds of companies. Two remaining restrictions apply to news agencies (share offoreign capital in their statutory funds cannot exceed 35%), and companies distributingprinted editions (the limit for foreign capital is 30%). The former restriction will bepreserved; however, the latter should be abolished upon accession to WTO.
Ukraine’s commitments and concessions fixed in bilateral protocols covereffectively the whole nomenclature of commodities and service sectors. According to theMinistry of Economy, import tariffs for industrial products will be tied at the averagelevel of about 5% by the end of transition period. The average tariff level for agriculturalproducts will be more than twice higher. Ukraine will maintain export duties oncommodities that are subject to export charges today: scrap of ferrous metals andalloyed steel, sunflower seeds, live animals, and skins of cattle. Substantial concessionswill be made in service sector. Ukraine committed to fully liberalize cross border supplyof services as well as provision of services through consumption abroad. Besides, thesupply of services through mode 3 (commercial presence) will be completely liberalizedin 139 out of 155 sectors. Among others Ukraine will open the banking market by
10
Jakubiak M., Maliszewska M., Orlova I., Rokicka M., Vavryschuk V.
CASE Reports No. 68
allowing branches of foreign banks to operate in the country and insurance market byallowing non-resident re-insurers dealing with certain kinds of risks.
The milestone event for Ukraine was granting of the full-fledged market economystatus by the EU (December 2005) and the USA (February 2006). The market economystatus enhances position of Ukrainian producers in antidumping investigationsconducted by the authorities of the partner countries.
1.1. Trade policy vis-à-vis the EU
Trade relations between Ukraine and the EU have been formalized in 1994through the Partnership and Cooperation Agreement (PCA) which entered into forceonly in 1998 (EC 1998b). The agreement envisaged, among others, basic rules ofbilateral trade in goods and services. In particular, parties agreed to grant each othermost-favoured nation treatment in accordance with the GATT provisions. Goodsoriginating in Ukraine and the EU were granted access to the market of the otherparty free of quantitative restrictions. Special rules were initially established for tradein textiles and steel products through separate agreements. PCA also mentioned theestablishment of EU-Ukraine free trade area in manufacturing products in the future.
The textile agreement signed between the parties in 2000 required Ukraine to lowerthe import tariffs on textile and clothing products. In its turn, the EU lifted quotas onUkrainian apparel (Council of the EU 2000). Bilateral agreement provided a good basisfor successful and systemic dismantling of trade barriers in this sector. Gradualliberalization of textile trade created preconditions for smooth adaptation of the economytowards functioning under terms agreed during the WTO accession negotiations.
Supply of steel from Ukraine to the EU market is subject to quotas. The size of thequota is negotiated annually and equals about 1.32 million tons for 2007. Quotas havebeen risen for 2005-2006, following the 2004 enlargement (from 0.61 million tons in2004, to 0.98 million tonnes in 2005, after EC 2004, EC 2005b). The situation on theEU quota front may improve further if Ukraine accedes to the WTO, which will leadto removal of the quantitative restrictions in bilateral trade, steel sector including.
Access of Ukrainian producers to the EU market has been liberalized and currenttariffs are not a binding obstacle to exports from Ukraine to the EU. According to theWorld Bank estimates, Ukraine benefits substantially from the preferences granted bythe EU under the Generalized System of Preferences (WB 2004). About one third ofexports to the EU are tariff-free under the Generalised System of Tariff Preferences(GSP), one third is subject to preferential tariffs under the GSP, and only one third issubject to MFN rates.
11
NON-TARIFF BARRIERS IN UKRAINIAN EXPORT TO THE EU
CASE Reports No. 68
The PCA has been concluded for the period of ten years (till the end of 2007) andcurrently the parties have an opportunity to negotiate a new framework agreementenvisaging deeper economic integration. According to the Ukrainian and the EUofficials, the future agreement will envisage free trade zone in manufacturing goods.Simultaneously the parties may negotiate formation of deeper free trade zone (FTA+).The FTA+ can envisage several dimensions of possible integration besides abolishmentof tariffs – reduction of non-tariff barriers, liberalization of trade in services,harmonization of trade policy in key spheres, etc. The FTA+ is perceived as a steptoward full-fledged integration of economies; however it may take as much as twodecades to implement the plans. Informal consultations on an FTA started in 2006, butthe EU expects Ukraine to enter the WTO first in order to formally launch the process(Kyiv Weekly 2006).
The EU-Ukraine Action Plan was approved as an element of the EuropeanNeighbourhood Policy in February 2005 (EC 2005a). The document has beenconcluded for an initial period of three years and identifies key spheres of reforms inUkraine. By signing the document Ukraine committed to accelerate reformsnecessary for closer relations with the EU. Trade issues are given proper attention inthe document. As of the end of 2006 the fulfilment of the action plan was especiallysuccessful in the area of trade policy. Ukraine made progress in reforming thecustoms service, aligning technical standards with the EU regulations, improvingsanitary and phyto-sanitary institutions. However, much remains to be done by theend of the implementation period (Jakubiak, Kolesnichenko 2006).
1.2. Key trade-related institutions in Ukraine
Bodies responsible for trade policy. Ministry of the Economy of Ukraine is themain body of executive branch dealing with external trade issues. In particular, itnegotiates trade agreements, leads WTO accession negotiation, conducts economicanalysis of trade-related decisions and represents Ukrainian producers’ interests inother countries. Also, Cabinet of Ministers forms Inter-Agency Trade Commissionresponsible for antidumping and countervailing investigations.
Customs tariffs. Import tariffs in Ukraine are set by the law ‘On Customs Tariff ofUkraine’. Tariffs are set for every commodity at a 10 digit level of classification basedon HS. The law envisages two different types of import tariffs: privileged rates (oncommodities subject to MFN regime) and full rates (applicable toward othercommodities). Export tariffs are set by special laws; currently Ukraine charges exporttariffs on four commodities: live animals and skins of cattle, scrap of ferrous metals,
12
Jakubiak M., Maliszewska M., Orlova I., Rokicka M., Vavryschuk V.
CASE Reports No. 68
scraps of non-ferrous metals and sunflower seeds. The State Customs Service ofUkraine, which is responsible for customs control is an agency within Ukrainiangovernment. The head of the Service is appointed by the President. The customsservice is responsible for customs clearance of traded services and commodities.Currently about 92 inland and 220 border customs offices function in Ukraine.
Technical regulation. The law ‘On Standards, Technical Regulations andConformity Evaluation Procedures’ (adopted in 2005) is the main normative act in thesphere of technical regulation in Ukraine. It states that The State Committee ofUkraine for Technical Regulation and Consumer Policy (Derzhspozhyvstandart) isresponsible for the state policy in the sphere of technical regulation. It is authorizedto develop technical regulations (obligatory rules specifying commodity andproduction process characteristics) which are to be approved by the Cabinet ofMinisters. Derzhspozhyvstandard is also responsible for assessment of productcharacteristics’ conformity with technical regulations. The assessment is implementedthrough UkeSEPRO (��������) certification system covering about 120 bodiesthroughout Ukraine.
Rules of origin. The Customs Code of Ukraine envisages the key provisions oncertification of rules of origin. The rules of origin are used to identify commoditieswhich are subject to preferential customs treatment. Cabinet of Ministers delegatedthe right to certify origin of commodities in Ukraine to the Chamber of Commerce.The rule of origin certificate is provided for every delivery of commodities.
Sanitary and phytosanitary regulations. The sphere is regulated by two key laws:‘Law on Quality and Safety of Foodstuff and Food Materials’ (the latest versionapproved in September 2006) and law ‘On Veterinary Medicine’ (the latest versionapproved in November 2006). The laws contain provisions on functioning of systemof sanitary and phyto-sanitary control in Ukraine. The key bodies responsible forimplementation of the policy in Ukraine are State Department for VeterinaryMedicine and State Sanitary-Epidemiologic Service of Ukraine.
13
NON-TARIFF BARRIERS IN UKRAINIAN EXPORT TO THE EU
CASE Reports No. 68
14
Jakubiak M., Maliszewska M., Orlova I., Rokicka M., Vavryschuk V.
CASE Reports No. 68
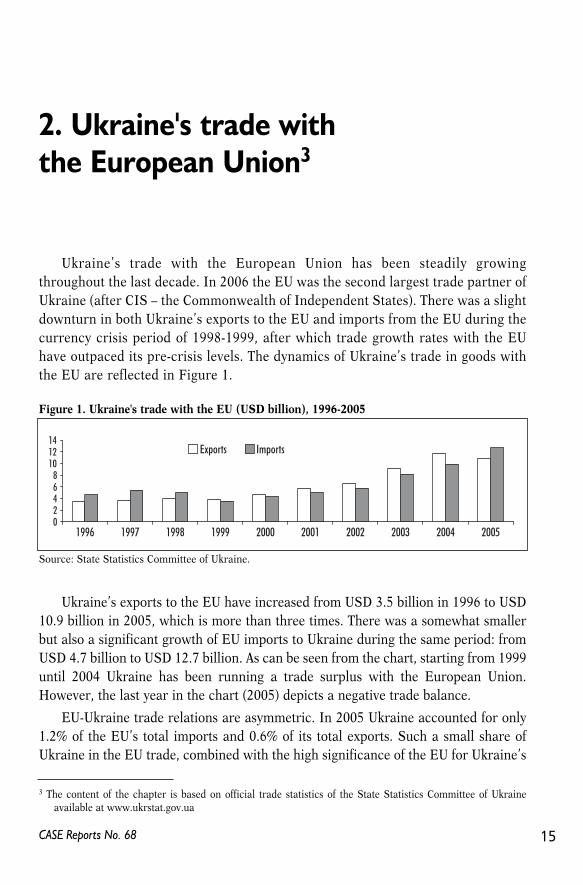
Ukraine’s trade with the European Union has been steadily growingthroughout the last decade. In 2006 the EU was the second largest trade partner ofUkraine (after CIS – the Commonwealth of Independent States). There was a slightdownturn in both Ukraine’s exports to the EU and imports from the EU during thecurrency crisis period of 1998-1999, after which trade growth rates with the EUhave outpaced its pre-crisis levels. The dynamics of Ukraine’s trade in goods withthe EU are reflected in Figure 1.
Ukraine’s exports to the EU have increased from USD 3.5 billion in 1996 to USD10.9 billion in 2005, which is more than three times. There was a somewhat smallerbut also a significant growth of EU imports to Ukraine during the same period: fromUSD 4.7 billion to USD 12.7 billion. As can be seen from the chart, starting from 1999until 2004 Ukraine has been running a trade surplus with the European Union.However, the last year in the chart (2005) depicts a negative trade balance.
EU-Ukraine trade relations are asymmetric. In 2005 Ukraine accounted for only1.2% of the EU’s total imports and 0.6% of its total exports. Such a small share ofUkraine in the EU trade, combined with the high significance of the EU for Ukraine’s
15CASE Reports No. 68
3 The content of the chapter is based on official trade statistics of the State Statistics Committee of Ukraineavailable at www.ukrstat.gov.ua
2. Ukraine's trade withthe European Union3
Source: State Statistics Committee of Ukraine.
Figure 1. Ukraine's trade with the EU (USD billion), 1996-2005
02468
101214
1996 1997 1998 1999 2000 2001 2002 2003 2004 2005
Exports Imports
trade (i.e. 32% in 2005) means that Ukraine will feel much stronger any benefits orlosses from closer economic cooperation than the EU.
For the purposes of comparison, we provide some statistics of Ukraine’s tradewith CIS countries for the same period of 1996-2005. In 1996, Ukrainian exports toCIS constituted USD 7.4 billion, which was more than twice as much as its exports tothe EU. However, throughout the reference period exports to CIS show a decliningpattern up till 2003 when a significant (almost 140%) increase occurs. As a result, in2005 exports to CIS reach USD 10.7 billion, which is less than Ukraine’s exports tothe EU in the same year. As a matter of fact, starting from 1999 Ukraine has beensteadily exporting more to the EU than to CIS. The share of exports to the EU in totalUkrainian exports has increased from 24% in 1996 to 32% in 2005, reaching itsmaximum of 40% in 2003. Whereas the share of exports to CIS has changed in theopposite direction: from 51% in 1996 to 31% in 2005. With imports the situation is abit different because of Ukraine’s dependence on gas imports from the RussianFederation. The share of imports from CIS in total Ukrainian imports never wentbelow 50% in the reference period, except for the year 2005 (47%); while importsfrom the EU in 2005 comprised only 35% of total imports.
In 2005, the main trading partners (among EU countries) of Ukraine were Italy,Germany and Poland. For example, exports to Italy in 2005 increased by 16.9%compared to 2004; however, exports to Germany decreased by 32%. Ukrainianimports in 2005 increased from all EU countries except for Malta.
The largest share in Ukrainian exports to the EU is taken by ferrous metals –21.2%, followed by energy-intensive goods, petroleum products – 19.3%, otherminerals – 6.9%, textiles – 5.7%, wood and wood products – 4%, and ferrous metalproducts – 3.9%. The largest part of ferrous metals export goes to Italy, Germany, andPoland; energy-intensive goods, petroleum products – to Italy, Germany, and Cyprus;other minerals – Slovakia, Czech Republic, Austria; textiles – Germany, France,United Kingdom; wood and wood products – Hungary, Poland, Italy; ferrous metalproducts – Spain, Germany, and Italy.
As for the structure of Ukrainian imports from the EU, here the largest sharecomprises of mechanical equipment – 18.2%; followed by electric machinery andequipment – 11.8%; transport equipment – 10.6%; plastic products – 7.1%;pharmaceuticals – 6%; paper and cardboard – 4.8%. Mechanical equipment is mostlyimported from Germany, Italy, and France; electric machinery – from Germany,Sweden, and Czech Republic; transport equipment – Germany, Poland, Hungary;plastic products – also Germany, Poland, and Hungary; pharmaceuticals – Germany,France, Hungary; paper and cardboard – Poland, Finland, Germany.
16
Jakubiak M., Maliszewska M., Orlova I., Rokicka M., Vavryschuk V.
CASE Reports No. 68
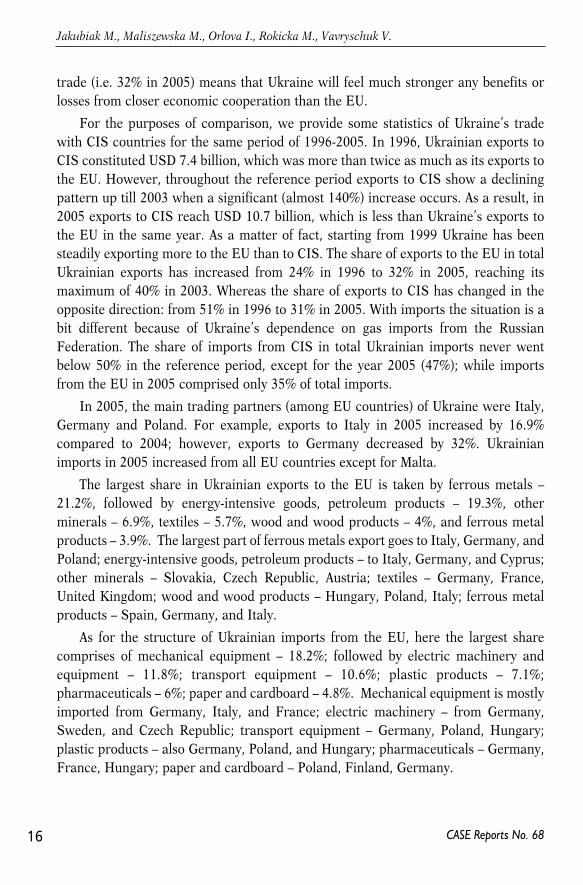
To our best knowledge the issue of non-tariff barriers to trade for Ukrainianexporters was not studied in depth in known academic papers. The only study coveringissues of barriers to exports is ‘Doing Business’ conducted in 2005 and 2006 by theWorld Bank4. It gives two indicators (time and cost) of different procedures related toexport activities: preparation of documents for exports, inland transportation andhandling, customs clearance and technical control, ports and terminal handling. Thetables below summarize the main findings of the study for 2006.
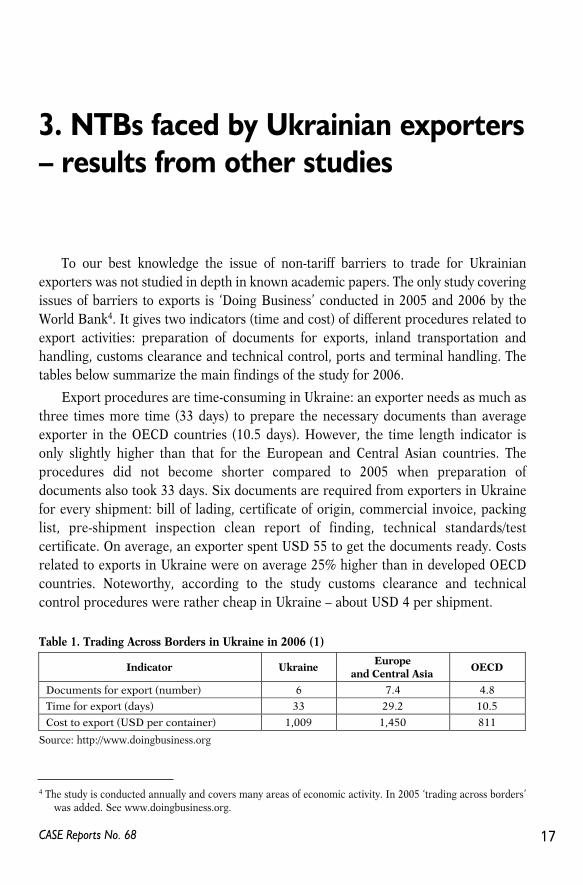
Export procedures are time-consuming in Ukraine: an exporter needs as much asthree times more time (33 days) to prepare the necessary documents than averageexporter in the OECD countries (10.5 days). However, the time length indicator isonly slightly higher than that for the European and Central Asian countries. Theprocedures did not become shorter compared to 2005 when preparation ofdocuments also took 33 days. Six documents are required from exporters in Ukrainefor every shipment: bill of lading, certificate of origin, commercial invoice, packinglist, pre-shipment inspection clean report of finding, technical standards/testcertificate. On average, an exporter spent USD 55 to get the documents ready. Costsrelated to exports in Ukraine were on average 25% higher than in developed OECDcountries. Noteworthy, according to the study customs clearance and technicalcontrol procedures were rather cheap in Ukraine – about USD 4 per shipment.
17CASE Reports No. 68
4 The study is conducted annually and covers many areas of economic activity. In 2005 ‘trading across borders’was added. See www.doingbusiness.org.
3. NTBs faced by Ukrainian exporters– results from other studies
Source: http://www.doingbusiness.org
Table 1. Trading Across Borders in Ukraine in 2006 (1)
Indicator UkraineEurope
and Central AsiaOECD
Documents for export (number) 6 7.4 4.8
Time for export (days) 33 29.2 10.5
Cost to export (USD per container) 1,009 1,450 811
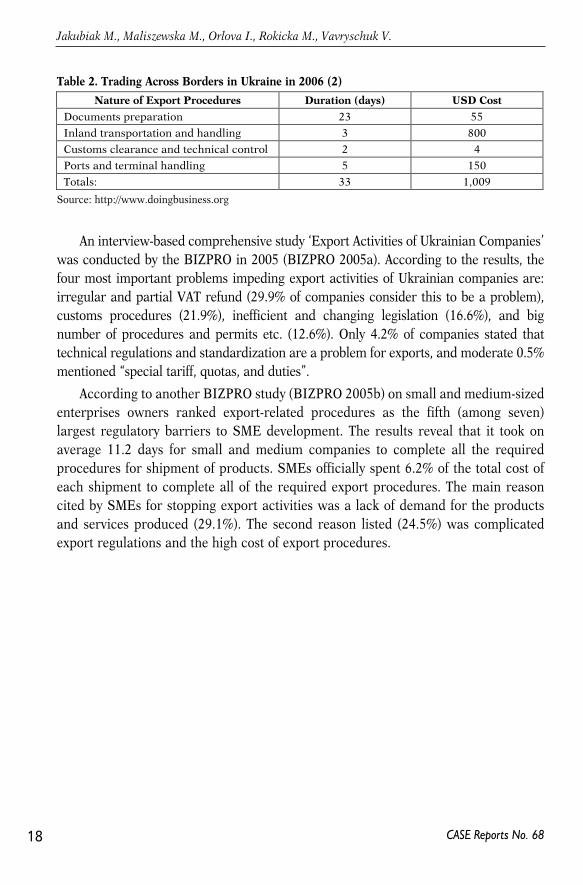
An interview-based comprehensive study ‘Export Activities of Ukrainian Companies’was conducted by the BIZPRO in 2005 (BIZPRO 2005a). According to the results, thefour most important problems impeding export activities of Ukrainian companies are:irregular and partial VAT refund (29.9% of companies consider this to be a problem),customs procedures (21.9%), inefficient and changing legislation (16.6%), and bignumber of procedures and permits etc. (12.6%). Only 4.2% of companies stated thattechnical regulations and standardization are a problem for exports, and moderate 0.5%mentioned “special tariff, quotas, and duties”.
According to another BIZPRO study (BIZPRO 2005b) on small and medium-sizedenterprises owners ranked export-related procedures as the fifth (among seven)largest regulatory barriers to SME development. The results reveal that it took onaverage 11.2 days for small and medium companies to complete all the requiredprocedures for shipment of products. SMEs officially spent 6.2% of the total cost ofeach shipment to complete all of the required export procedures. The main reasoncited by SMEs for stopping export activities was a lack of demand for the productsand services produced (29.1%). The second reason listed (24.5%) was complicatedexport regulations and the high cost of export procedures.
18
Jakubiak M., Maliszewska M., Orlova I., Rokicka M., Vavryschuk V.
CASE Reports No. 68
Source: http://www.doingbusiness.org
Table 2. Trading Across Borders in Ukraine in 2006 (2)
Nature of Export Procedures Duration (days) USD Cost
Documents preparation 23 55Inland transportation and handling 3 800Customs clearance and technical control 2 4Ports and terminal handling 5 150Totals: 33 1,009
Process of transformation of Central and Eastern European countries (CEECs5)resulted in the significant adjustment of their trade structure. Not only the scope ofproducts for export changed but also its geographical destination. The fall of sovietblock naturally caused the shift of the CEECs export towards EU countries. Thesechanges have been accompanied by the growing liberalisation of trade, and thedecreasing importance of the traditional protection measures like: tariffs, quotas, andvoluntary export restraint (VER) agreements. As a result non tariffs barriers to trade,mainly: technical regulations and standards (TBT), sanitary and phyto-sanitary (SPS)measures, rules of origin, customs rules and procedures, and other administrativeprocedures have become the main impediment for exporters from CEECs countries,willing to enter EU market.
4.1. Legal framework for harmonisation of standards and technical
regulation
The process of adjustments and trade liberalisation between CEECs and the EUwas set in motion by the signature of the European Association Agreements (EAA) in1992. These documents established a new framework for CEECs and EU economicrelationship, including a free trade regime for industrial products and improved accessfor agricultural products. In addition, the EU committed itself to gradually eliminatingtariffs and increasing quotas on ‘sensitive’ products-mainly textiles, iron, and steel.
With regard to the technical barriers the EAAs provided that candidate countrieswould set up rules and procedures equivalent to those applied in the EU. It is worth
19CASE Reports No. 68
5 Term CEECs here refers mainly to the 8 new EU members that joined the Union in 2004 (Czech Republic,Estonia, Hungary, Latvia, Lithuania, Poland, Slovakia and Slovenia).
4. Experience of currentnew members: non tariff barriersbetween CEECs and the EU
to mention that EU approach toward technical regulation and certification is basedon Mutual Recognition Principle (MRP)6, the new harmonisation approach7
implemented in 1985, and old approach (detailed harmonisation)8. Beside nationalinstitutes three European bodies are dealing with the standardisation issues on theEuropean level: European Committee for Electrotechnical Standardization –CENELEC, European Telecommunications Standards Institute – ETSI, TheEuropean Committee for Standardization – CEN.
During 1994-1997, given the complex and non-homogenous EU rules, it wasclaimed that candidates countries used the EAA for protecting their own markets andimposing new standardisation norms for importers instead of facilitating the tradeflow. Seen as ineffective, the negotiations of technical harmonisation with candidatecountries on the product level were replaced by the introduction of Protocols onEuropean Conformity Assessment and Acceptance of Industrial Products (PECA)9.PECA were considered as the major instrument of the pre-accession strategy in thefield of the free movement of goods, they covered following sectors: machinery,electrical safety, electromagnetic compatibility, gas appliances, pressure equipment,hot water boilers, medical devices, good laboratory practice, and good manufacturingfor medicinal products, lifts, toys, and construction products. These protocols weresigned with majority of accession countries, as well as with Romania and Bulgaria.
4.2. Non-tariff barriers to trade with the EU in 1990s
Kaminski (1999) evaluated the impact of EAA on Polish and CEE exports. Usingthe UNCTAD classification of non-tariff barriers10 he made distinction between allNTBs11, and ‘narrow’ NTBs12, and then analysed various non tariff measures imposedby the EU on imports in 1995. He found that Poland and Hungary are the more
20
Jakubiak M., Maliszewska M., Orlova I., Rokicka M., Vavryschuk V.
CASE Reports No. 68
6 MRP – if product is produced and tested in accordance with the technical regulation of member state it shouldbe recognized by other member states, and circulated free within Single Market.
7 New harmonisation approach: instead of detailed case by case provisions of norms and standards, whichoccurred inefficient and unsatisfactory Community legislation is restricted to establishing the essentialrequirements that products must meet. These requirements fix thresholds or levels of protection for the wholeof the Community in the area of health and safety.
8 Old Approach: all agreements require unanimity and have forms of directives, which contain high degree oftechnical detail. Old approach applies mostly to chemicals, motor vehicles, pharmaceuticals, and foodstuff.
9 Following EC explanation: PECAs are agreements with candidate countries by which mutual recognitionoperates on the basis of the acquis communautaire (i.e., they differ from Mutual Recognition Agreements(MRAs) in that they make use of common technical rules and standards). They also provide for the mutualacceptance of industrial products that are legally placed on the market in the territory of the parties to them.
10 These are: para-tariff measures, price control measures, finance measures, automatic licensing measures,quantity control, monopolistic measures, and technical measures.
11 All mentioned above.
sensitive to NTBs of the EU, while comparable low level of exposure was observed forthe Czech Republic and Slovakia. It should be mentioned that the vulnerability toNTBs of each of the CEEC is closely related to its export basket.
While analysing in details the indices of NTB application to Polish export, he furtherrevealed that VERs (voluntary export restrictions) were most common NTBs followedby the ‘other extra charges’, which include product certification and standardisation. In1995 among the most NTBs affected sectors were:
• clothing, textiles (97% of trade affected)
• food (91% of trade affected)
• animal feeds (almost 65% of exported products were affected by (NTBs).
This was followed by oils and fats (56%), iron and steel production (49 %), andother Polish manufacturing products13 (EU NTBs applied only to 33% of Polishmanufacturing exports).
4.3. Technical barriers
Significant part of the non-tariff measures consists of technical barriers, which asmentioned previously are still seen as a major impediment to trade. According toBrenton (2000) almost 80% of the intra-EU trade were the subject of technicalregulations in 1996, and the cost associated with existing technical barriers to trade wasestimated to be as high as 2-2.4% of EU GDP (Cecchini, 1998; Emerson et al. 1988, EC1998a). The situation was even more complex with regard to candidate countriesexporting to the EU.
As the availability of the appropriate data for measuring the scope of technicalbarriers to trade (TBTs) for exporters to the EU are limited; several approximationswere made, and only the sectors generally considered as the most prone to technicalbarriers were analysed. According to the study by Brenton (2000; breakdown of EUimport for 1998) one third of EU import from Bulgaria and Latvia was carried outwithout any technical restrictions, as the exchange was mainly executed in sectorsfree of restrictions: non ferrous metals, footwear, sawing and processing of wood. Incontrast Slovenia exported mainly machinery, which was subject to the new approachharmonisation, therefore only one fifth of its export was exempted from technicalregulations. Estonia, Slovakia and Hungary were exporting to the EU mainly: motor
21
NON-TARIFF BARRIERS IN UKRAINIAN EXPORT TO THE EU
CASE Reports No. 68
12 Narrow NTBs exclude: antidumping and countervailing duties, licensing, price control, health and safetyregulation, technical standards.
13 All calculations refer to 1995.
vehicles and parts, prepared meat and petroleum products, which were regulated bythe harmonisation of the old approach14, and were highly affected by TBTs.
Sectors where technical barriers were not significant had rather high share of EUdirected sales from Balkans, Romania and Baltic states. Whereas export from theCzech Republic, Hungary, Poland and Slovenia was highly influenced by the EUtechnical regulations.
Changing export structure (move from predominantly low-technology goods inthe direction of ‘middle-technology intensive’ products) forced the degree of technicalrestrictions for at least some of the trading partners. As a result of overalldevelopment and better supply capacities Poland and Hungary shifted their exporttoward more technology-intensive sectors over the last decade. However, these werealso the sectors to which higher technical control applies and which are mainlyregulated by the new approach rules.
4.4. What happened after accession
After the EU enlargement in 2004, all tariff barriers were removed and freemovement of goods facilitated. Candidate countries adopted acquis communautaires,which led to technical harmonisation of production and significantly reduced the costof trade transactions. However adherence to new standards also imposed costs onproducers from new member states.
According to the results of the survey done in Poland for a sample of firmsproducing processed food, electrical appliances and chemical products, 6 monthsafter the accession (FEMISE, 2005) the benefits from better market access to the EUoutweighed costs of adjustment to the EU technical regulations. However the attitudetowards different TBTs varied by sectors.
Within food producer group, 54% of the firms claimed the increase of the cost ofcertification as a result of exporting to the EU market, 31% had to redesign theirproduct so that it would meet the EU requirements, and this change was alsoassociated with significant investments and costs. In addition cost of detailed labellingwas mentioned as high by 43% of food producers. Notwithstanding this, 48% of theexporters in the food industry claimed that the unification of standards in all the EUcountries was beneficial for their exports to the EU.
22
Jakubiak M., Maliszewska M., Orlova I., Rokicka M., Vavryschuk V.
CASE Reports No. 68
14 Old approach harmonisation covers following group of products: cosmetics, chemicals, motor vehicles,foodstuffs, pharmaceuticals.
Majority of Polish chemical firms did not meet any particular difficulties in tradeafter EU accession. Only 35% of the firms admitted that the cost of certification hasincreased since the implementation of the EU legislation. Also in case of food producers,57% of exporters perceived the unification of the technical requirements as beneficial.
Electrical sector seems to have been the most harmonized with the EU norms andstandards well before the accession. Only 1% of production was removed from the marketafter 2004, and more than 90% of all respondents admitted that after May 2004 (date ofthe accession) they have not faced any particular difficulties in exporting to EU market.
In spite of this and similar studies at micro level, various macroeconomic estimationsbased on econometric analysis and equilibrium models were done to measure the impactof EU accession for new member states, considering harmonisation of standards andlowering of TBTs. According to one simulation (FEMISE 2005) changes instandardization policy have large welfare effects, which varied between countries and areclosely related to the sectoral structure of export. It is claimed that the largest increase ofGDP as a result of a decrease of the technical barriers to trade will be noticed inLithuania and Latvia. For the Czech Republic, Estonia, Slovakia and Slovenia thesimulated GDP increases are equal to 1.4% to 1.6%, while only 1% for Poland.
Although the elimination of NTBs, and especially TBTs is costly, it brings benefitswhich in the longer perspective can overcome the previous inconvenience andexpenditures. The importance of NTBs in trade with the EU is closely related tosectoral structure of the exchange. When analysing the future Ukrainian - EU traderelations in the context of NTBs the following of the CEEC’s features should be takeninto account:
• the lowest TBTs are generally present in the sectors of: raw materials, low-processed products (with the exemption of food and agriculture products)
• the TBTs remain high, even in intra-EU trade
• the changes of export structure influence level and type of technical barriers totrade that the country has to deal with. Shift from exporting low-technologyproducts to more technology-intensive goods (for example: more pharmaceutics,chemicals, machinery etc.) increases the number and the character of TBTs forexporting country.
• the harmonisation and mutual recognition of standards reduce non-tariffbarriers to trade
• reduction of non-tariff barriers is beneficiary for producers, although costly
• elimination of non-tariff barriers, especially through harmonisation of standardsleads to significant welfare gains.
23
NON-TARIFF BARRIERS IN UKRAINIAN EXPORT TO THE EU
CASE Reports No. 68

24
Jakubiak M., Maliszewska M., Orlova I., Rokicka M., Vavryschuk V.
CASE Reports No. 68
This section presents the results of the survey of about 500 companies that arelocated in Ukraine and have exported to the EU. The representatives of the companieswere asked identical questions about their perceptions of non-tariff barriers in the EU.The survey was conducted in November and December 200615.
While drafting the questionnaire (attached as Appendix 2 to this report), existingmethodologies and results of the research conducted so far for Ukraine, CEECs andother countries were used as a starting point. The research team went throughrelatively recent surveys on NTBs such as Wilson and Otsuki (2004) done for 17developing countries including some CEECs, and Cottier et al (2004) conducted forBalkan countries. The findings regarding NTBs from WB (2006) and BIZPRO (2005aand 2005b) for Ukraine and from Michalek (2005) for the CEECs were also consideredwhen drafting particular parts.
The questions initially covered rules of origin of goods, functioning of customs,adherence to technical regulations and standards, sanitary and phyto-sanitary measuresand other NTBs. After some pilot interviews, questions regarding phyto-sanitary normswere dropped, for the reason that they mainly referred to agricultural trade and heremainly manufacturing exporters were interviewed. As the vast majority of respondentswere not obliged to comply with phyto-sanitary measures, they did not understand therelevant questions and had troubles answering them. Moreover, liberalisation ofagricultural trade between Ukraine and the EU is not likely to happen very soon,contrary to manufacturing trade. Hence the survey focused on questions relevantmainly for exporters of manufacturing goods16. Firms were also asked to providegeneral information about the company and about their export markets. The majority ofthe questions have ‘closed’ character, i.e. a respondent was given options to choose
25CASE Reports No. 68
15 The survey was conducted by GFK Ukraine by the method of telephone interview.16 The sample consisted also of 57 companies exporting agricultural products (groups 1-14 of the Harmonised
System). However, these exporters treated technical and sanitary norms as one group of barriers and it wasdifficult for the interviewers to get separate information on these two set of norms. As a result, the questionsregarding sanitary norms were dropped. However, the interpretation of technical standards with regard tothe exporters of the agricultural goods presented later in this report takes into account the fact, that some ofthe answers refer to sanitary and phyto-sanitary norms.
5. NTBs faced by Ukrainianexporters to the EU – survey results
from. Also, there was a space for comments. There were also some questions askingabout numerical estimate of costs (measured in money or time spent) of a particularbarrier17. The reader is directed to the Appendix 2 for more details.
5.1. Description of sample
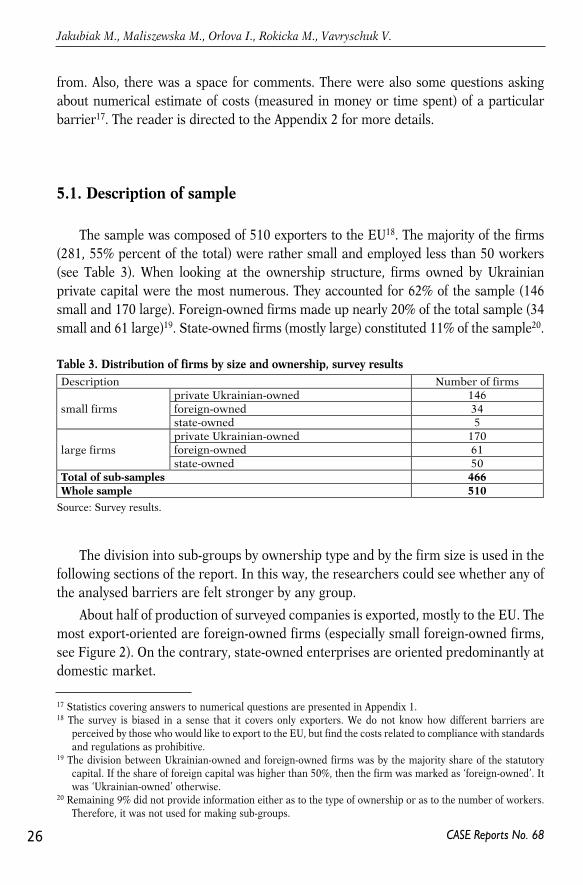
The sample was composed of 510 exporters to the EU18. The majority of the firms(281, 55% percent of the total) were rather small and employed less than 50 workers(see Table 3). When looking at the ownership structure, firms owned by Ukrainianprivate capital were the most numerous. They accounted for 62% of the sample (146small and 170 large). Foreign-owned firms made up nearly 20% of the total sample (34small and 61 large)19. State-owned firms (mostly large) constituted 11% of the sample20.
The division into sub-groups by ownership type and by the firm size is used in thefollowing sections of the report. In this way, the researchers could see whether any ofthe analysed barriers are felt stronger by any group.
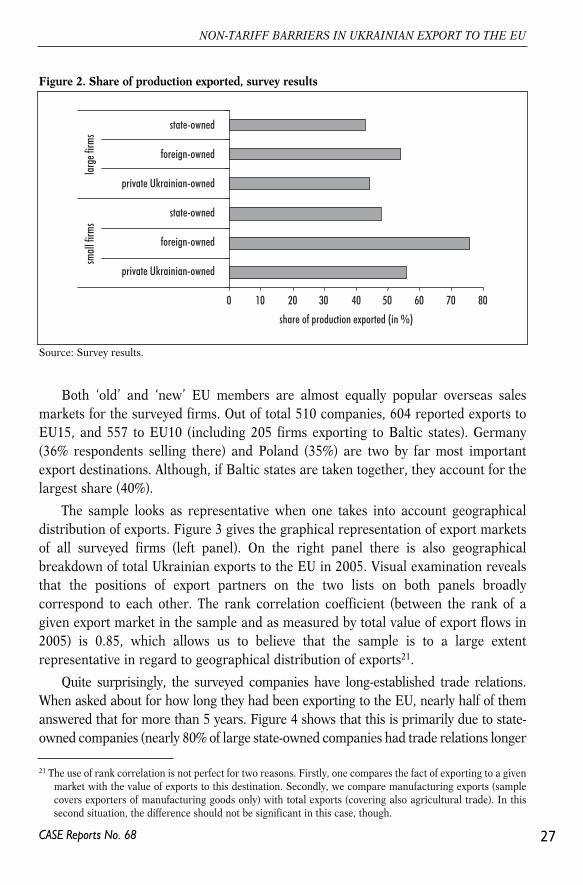
About half of production of surveyed companies is exported, mostly to the EU. Themost export-oriented are foreign-owned firms (especially small foreign-owned firms,see Figure 2). On the contrary, state-owned enterprises are oriented predominantly atdomestic market.
26
Jakubiak M., Maliszewska M., Orlova I., Rokicka M., Vavryschuk V.
CASE Reports No. 68
17 Statistics covering answers to numerical questions are presented in Appendix 1.18 The survey is biased in a sense that it covers only exporters. We do not know how different barriers are
perceived by those who would like to export to the EU, but find the costs related to compliance with standardsand regulations as prohibitive.
19 The division between Ukrainian-owned and foreign-owned firms was by the majority share of the statutorycapital. If the share of foreign capital was higher than 50%, then the firm was marked as ‘foreign-owned’. Itwas ‘Ukrainian-owned’ otherwise.
20 Remaining 9% did not provide information either as to the type of ownership or as to the number of workers.Therefore, it was not used for making sub-groups.
Source: Survey results.
Table 3. Distribution of firms by size and ownership, survey resultsDescription Number of firms
private Ukrainian-owned 146foreign-owned 34small firmsstate-owned 5private Ukrainian-owned 170foreign-owned 61large firmsstate-owned 50
Total of sub-samples 466Whole sample 510
Both ‘old’ and ‘new’ EU members are almost equally popular overseas salesmarkets for the surveyed firms. Out of total 510 companies, 604 reported exports toEU15, and 557 to EU10 (including 205 firms exporting to Baltic states). Germany(36% respondents selling there) and Poland (35%) are two by far most importantexport destinations. Although, if Baltic states are taken together, they account for thelargest share (40%).
The sample looks as representative when one takes into account geographicaldistribution of exports. Figure 3 gives the graphical representation of export marketsof all surveyed firms (left panel). On the right panel there is also geographicalbreakdown of total Ukrainian exports to the EU in 2005. Visual examination revealsthat the positions of export partners on the two lists on both panels broadlycorrespond to each other. The rank correlation coefficient (between the rank of agiven export market in the sample and as measured by total value of export flows in2005) is 0.85, which allows us to believe that the sample is to a large extentrepresentative in regard to geographical distribution of exports21.
Quite surprisingly, the surveyed companies have long-established trade relations.When asked about for how long they had been exporting to the EU, nearly half of themanswered that for more than 5 years. Figure 4 shows that this is primarily due to state-owned companies (nearly 80% of large state-owned companies had trade relations longer
27
NON-TARIFF BARRIERS IN UKRAINIAN EXPORT TO THE EU
CASE Reports No. 68
Source: Survey results.
Figure 2. Share of production exported, survey results
0 10 20 30 40 50 60 70 80
state-owned
foreign-owned
private Ukrainian-owned
state-owned
foreign-owned
private Ukrainian-owned
small
firm
s
l
arge
firm
s
share of production exported (in %)
21 The use of rank correlation is not perfect for two reasons. Firstly, one compares the fact of exporting to a givenmarket with the value of exports to this destination. Secondly, we compare manufacturing exports (samplecovers exporters of manufacturing goods only) with total exports (covering also agricultural trade). In thissecond situation, the difference should not be significant in this case, though.
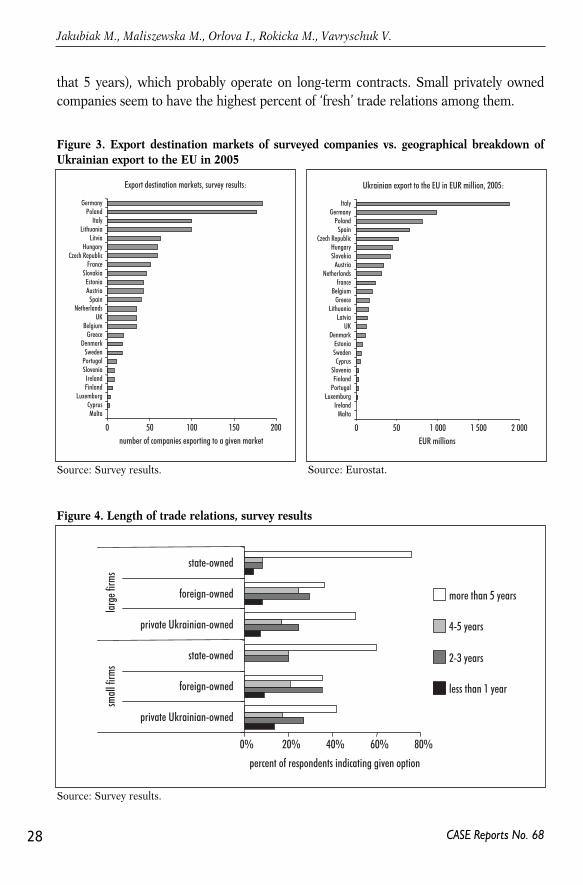
that 5 years), which probably operate on long-term contracts. Small privately ownedcompanies seem to have the highest percent of ‘fresh’ trade relations among them.
28
Jakubiak M., Maliszewska M., Orlova I., Rokicka M., Vavryschuk V.
CASE Reports No. 68
Source: Survey results.
Figure 3. Export destination markets of surveyed companies vs. geographical breakdown ofUkrainian export to the EU in 2005
0 50 100 150 200
GermanyPoland
ItalyLithuania
LitviaHungary
Czech RepublicFrance
SlovakiaEstoniaAustria
SpainNetherlands
UKBelgium
GreeceDenmark
SwedenPortugalSlovenia
IrelandFinland
LuxemburgCyprusMalta
number of companies exporting to a given market
Export destination markets, survey results:
0 50 1 000 1 500 2 000
ItalyGermany
PolandSpain
Czech RepublicHungarySlovakia
AustriaNetherlands
franceBelgium
GreeceLithuania
LatviaUK
DenmarkEstoniaSwedenCyprus
SloveniaFinland
PortugalLuxemburg
IrelandMalta
EUR millions
Ukrainian export to the EU in EUR million, 2005:
Source: Eurostat.
Source: Survey results.
Figure 4. Length of trade relations, survey results
0% 20% 40% 60% 80%
percent of respondents indicating given option
more than 5 years
4-5 years
2-3 years
less than 1 year
state-owned
foreign-owned
private Ukrainian-owned
state-owned
foreign-owned
private Ukrainian-owned
small
firm
s
larg
e firm
s
5.2. Certifying origin of goods
Significant proportion of Ukrainian goods entering the EU market benefit fromthe General System of Preferences (see also section 1 of this report on Ukraine tradepolicy). The EU's General System of Preferences (GSP) facilitates the access to EUmarket for certain countries, and for specific products. It allows to apply reduced,preferential or zero tariffs to goods which were produced or manufactured in abeneficiary country. In order to benefit from the EU GSP upon importation into theEU, the following conditions must be fulfilled:
• goods must originate in a beneficiary country in accordance with the EU GSP,
• goods must be transported directly from the beneficiary country to the EU, and
• valid proof of origin must be submitted (certificate of origin – issued by thecompetent authorities in the beneficiary country or invoice declaration).
While interviewing companies, the researchers were trying to find out if exportingcompanies from Ukraine have experienced any difficulties in regards to the above,and whether these regulations constituted a nuisance in terms of time and expenses.
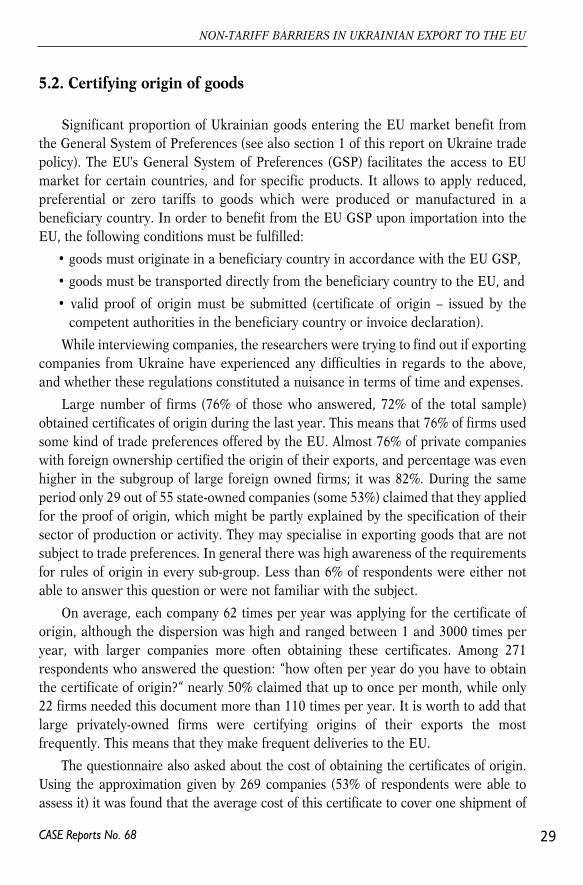
Large number of firms (76% of those who answered, 72% of the total sample)obtained certificates of origin during the last year. This means that 76% of firms usedsome kind of trade preferences offered by the EU. Almost 76% of private companieswith foreign ownership certified the origin of their exports, and percentage was evenhigher in the subgroup of large foreign owned firms; it was 82%. During the sameperiod only 29 out of 55 state-owned companies (some 53%) claimed that they appliedfor the proof of origin, which might be partly explained by the specification of theirsector of production or activity. They may specialise in exporting goods that are notsubject to trade preferences. In general there was high awareness of the requirementsfor rules of origin in every sub-group. Less than 6% of respondents were either notable to answer this question or were not familiar with the subject.
On average, each company 62 times per year was applying for the certificate oforigin, although the dispersion was high and ranged between 1 and 3000 times peryear, with larger companies more often obtaining these certificates. Among 271respondents who answered the question: “how often per year do you have to obtainthe certificate of origin?“ nearly 50% claimed that up to once per month, while only22 firms needed this document more than 110 times per year. It is worth to add thatlarge privately-owned firms were certifying origins of their exports the mostfrequently. This means that they make frequent deliveries to the EU.
The questionnaire also asked about the cost of obtaining the certificates of origin.Using the approximation given by 269 companies (53% of respondents were able toassess it) it was found that the average cost of this certificate to cover one shipment of
29
NON-TARIFF BARRIERS IN UKRAINIAN EXPORT TO THE EU
CASE Reports No. 68
the goods reached the level of UAH 273. The distribution was skewed towards lowervalues. For 133 companies the cost of obtaining certificates of rules of origin was lessthan UAH 200 per delivery. At the other end, only 5 companies (2% of those whoanswered) reported that the cost was higher than UAH 1000. In general significantdifferences with regard to the cost of certifying origin of goods between large and smallcompanies was noticed. Among the exporters employing less than 50 workers, privateUkrainian firms spent the most, on average UAH 366 for certifying each delivery of theirgoods22. According to the respondents from large state owned companies the averagecost of the proof of origin was about UAH 180, while in large privately owned firms(both Ukrainian and foreign) these costs were a bit higher, and oscillated around UAH245 per certificate obtained for one transport of goods. The results suggest that largerfirms use economies of scale and deliver large quantities of rather homogenous products(low costs of getting certificates of origins connected with frequent deliveries). Whilesmall firms cannot deliver as frequently as the large ones (probably because of supply-side constraints), but nevertheless face higher costs of certifying origin (meaning eithermore heterogeneous deliveries or higher unofficial payments or both)23.
30
Jakubiak M., Maliszewska M., Orlova I., Rokicka M., Vavryschuk V.
CASE Reports No. 68
22 In fact, the highest average cost was obtained for small state-owned companies. But this result was due to oneobservation only, so it is treated here as an outlier.
23 Checking for the relative costs of certifying origins (for example in terms of share in total production) can bemore informative here. It can indicate the effective barrier to trade connected with certificates of origins. Thisbarrier could be lower if, for example, a company would export high-quality goods sold at a higher price. Andin fact it can be better indicator than a nominal value. However, this requires information on total productionsold, or turnover. Although the companies were asked about their turnovers (see questionnaire in Appendix
Note: Results for small state-owned companies should be treated with caution as the size of sample wasrather small in comparison to other subgroups.
Source: Survey results, own calculations.
Figure 5. Share of companies certifying origin of their export, survey results
0% 20% 40% 60% 80% 100%% of respondents from each group
state-owned
private foreign-owned
private Ukrainian-owned
state-owned
private foreign-owned
private Ukrainian-owned
small
firm
s
la
rge f
irms
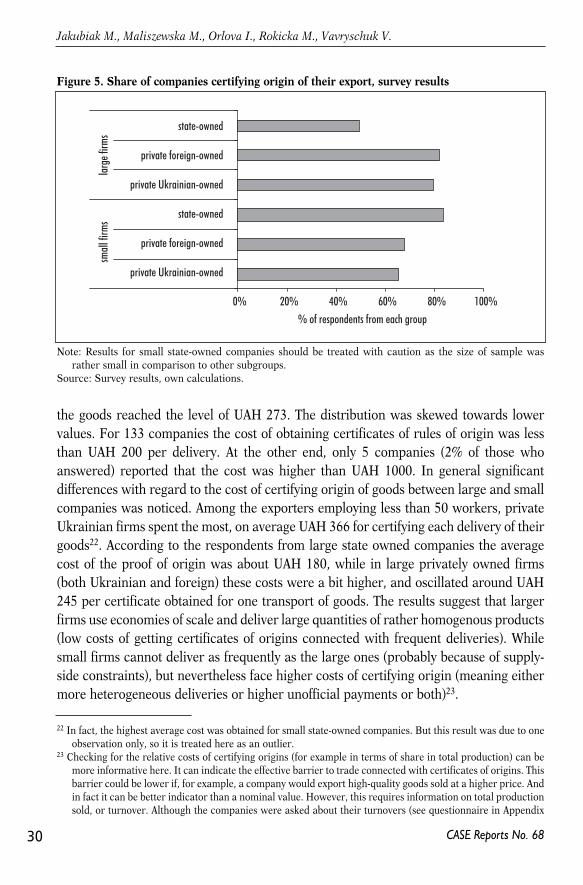
While asked about perceptions of costs of certifying origins, large number ofinterviewed companies replied that these costs were insignificant. Only 13 firms (3%)reported that those costs were very high and additional 10% claimed that they werehigh. Mostly, these were large firms (see Figure 6).
The costs of certificates seems to be perceived as the least disturbing by the state-owned enterprises (see Figure 6). This comes in line with state-owned enterprisescertifying origins of their exports relatively infrequently, and with low costs of it perdelivery. At the other end lie foreign-owned firms, which are the least optimistic whenassessing costs of certifying origin. This is the only ownership group where costs ofcertifying origin are considered as small by less than 50% respondents. As a rule,small firms assess the costs of certificates as lower than the large firms do, in everycategory of ownership. It is rather unexpected, since it was shown that in fact smallerfirms pay more per one delivery24.
When asked about indicating difficulties connected with getting certificates oforigin, 71% of the respondents (364 firms) answered. Out of this number, only 28%(102 companies) faced some difficulties with respect to getting certificates of origin.Those firms that faced some difficulties while obtaining documents of origin usually
31
NON-TARIFF BARRIERS IN UKRAINIAN EXPORT TO THE EU
CASE Reports No. 68
2), the response rate was low. So it was impossible to obtain information on the magnitude of effective barrierto trade in the form of getting the certificates of origins.
24 Perhaps smaller firms sell their products at higher prices (see the previous footnote). Then this barrier may belower for them in relative terms. However, it was impossible to measure here.
Note: Results for small state-owned companies should be treated with caution as the size of sample wasrather small in comparison to other subgroups.
Source: Survey results, own calculations.
Figure 6. Perceptions of costs of certifying origin, survey results
0% 20% 40% 60% 80%
% of companies that foundthe cost of obtaining certificateof origin high
% of companies that foundthe cost of obtaining certificateof origin small
state-owned
private foreign-owned
private Ukrainian-owned
state-owned
private foreign-owned
private Ukrainian-owned
small
firm
s
larg
e firm
s
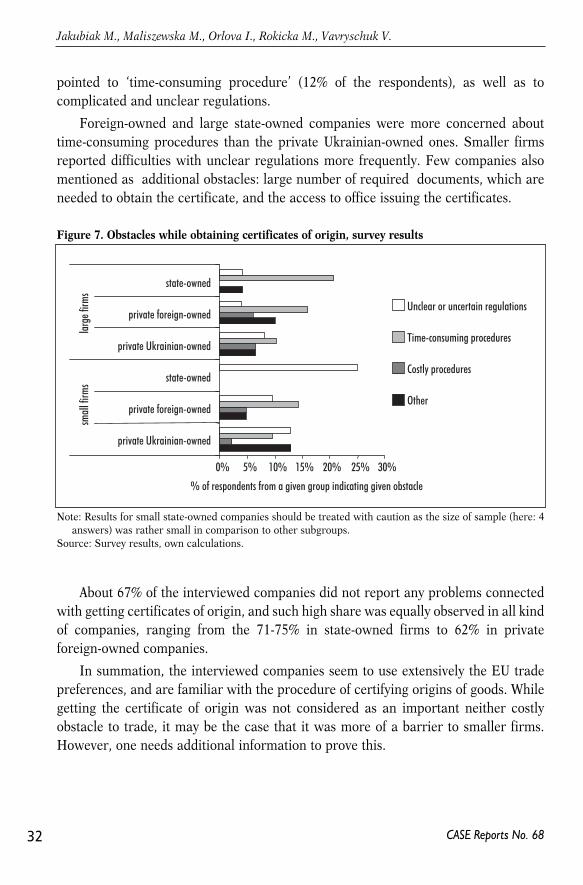
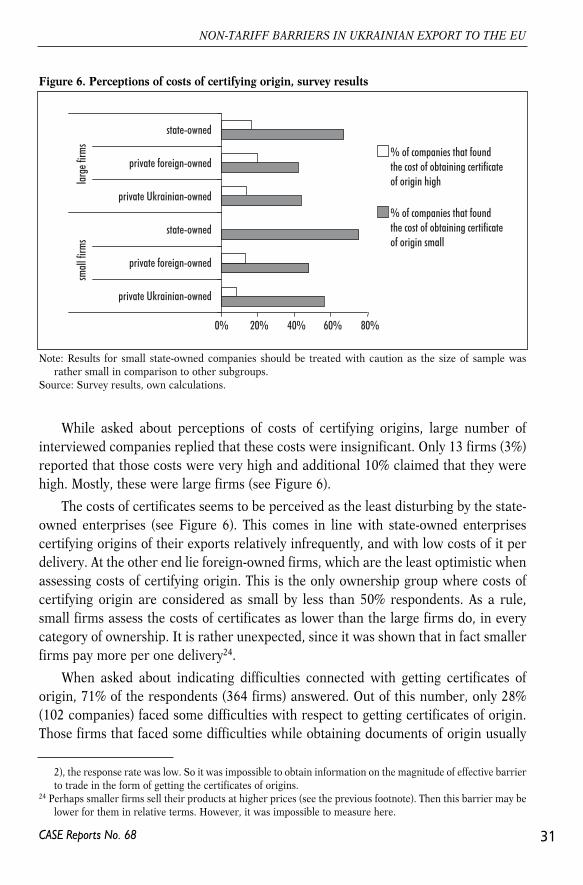
pointed to ‘time-consuming procedure’ (12% of the respondents), as well as tocomplicated and unclear regulations.
Foreign-owned and large state-owned companies were more concerned abouttime-consuming procedures than the private Ukrainian-owned ones. Smaller firmsreported difficulties with unclear regulations more frequently. Few companies alsomentioned as additional obstacles: large number of required documents, which areneeded to obtain the certificate, and the access to office issuing the certificates.
About 67% of the interviewed companies did not report any problems connectedwith getting certificates of origin, and such high share was equally observed in all kindof companies, ranging from the 71-75% in state-owned firms to 62% in privateforeign-owned companies.
In summation, the interviewed companies seem to use extensively the EU tradepreferences, and are familiar with the procedure of certifying origins of goods. Whilegetting the certificate of origin was not considered as an important neither costlyobstacle to trade, it may be the case that it was more of a barrier to smaller firms.However, one needs additional information to prove this.
32
Jakubiak M., Maliszewska M., Orlova I., Rokicka M., Vavryschuk V.
CASE Reports No. 68
Note: Results for small state-owned companies should be treated with caution as the size of sample (here: 4answers) was rather small in comparison to other subgroups.
Source: Survey results, own calculations.
Figure 7. Obstacles while obtaining certificates of origin, survey results
0% 5% 10% 15% 20% 25% 30%
% of respondents from a given group indicating given obstacle
Unclear or uncertain regulations
Time-consuming procedures
Costly procedures
Other
state-owned
private foreign-owned
private Ukrainian-owned
state-owned
private foreign-owned
private Ukrainian-owned
small
firm
s
large
firm
s
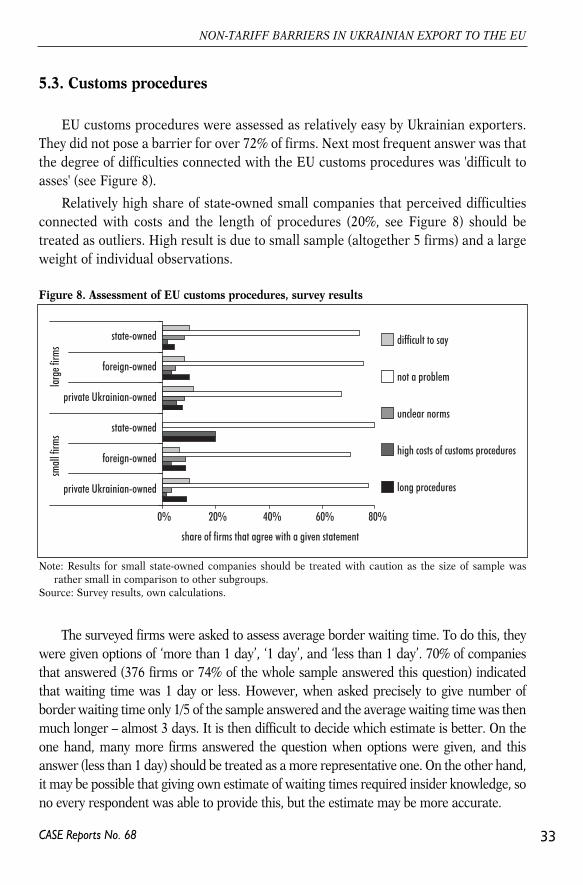
5.3. Customs procedures
EU customs procedures were assessed as relatively easy by Ukrainian exporters.They did not pose a barrier for over 72% of firms. Next most frequent answer was thatthe degree of difficulties connected with the EU customs procedures was 'difficult toasses' (see Figure 8).
Relatively high share of state-owned small companies that perceived difficultiesconnected with costs and the length of procedures (20%, see Figure 8) should betreated as outliers. High result is due to small sample (altogether 5 firms) and a largeweight of individual observations.
The surveyed firms were asked to assess average border waiting time. To do this, theywere given options of ‘more than 1 day’, ‘1 day’, and ‘less than 1 day’. 70% of companiesthat answered (376 firms or 74% of the whole sample answered this question) indicatedthat waiting time was 1 day or less. However, when asked precisely to give number ofborder waiting time only 1/5 of the sample answered and the average waiting time was thenmuch longer – almost 3 days. It is then difficult to decide which estimate is better. On theone hand, many more firms answered the question when options were given, and thisanswer (less than 1 day) should be treated as a more representative one. On the other hand,it may be possible that giving own estimate of waiting times required insider knowledge, sono every respondent was able to provide this, but the estimate may be more accurate.
33
NON-TARIFF BARRIERS IN UKRAINIAN EXPORT TO THE EU
CASE Reports No. 68
Note: Results for small state-owned companies should be treated with caution as the size of sample wasrather small in comparison to other subgroups.
Source: Survey results, own calculations.
Figure 8. Assessment of EU customs procedures, survey results
0% 20% 40% 60% 80%
share of firms that agree with a given statement
difficult to say
not a problem
unclear norms
high costs of customs procedures
long procedures
small
firm
s
l
arge
firm
s
state-owned
foreign-owned
private Ukrainian-owned
state-owned
foreign-owned
private Ukrainian-owned
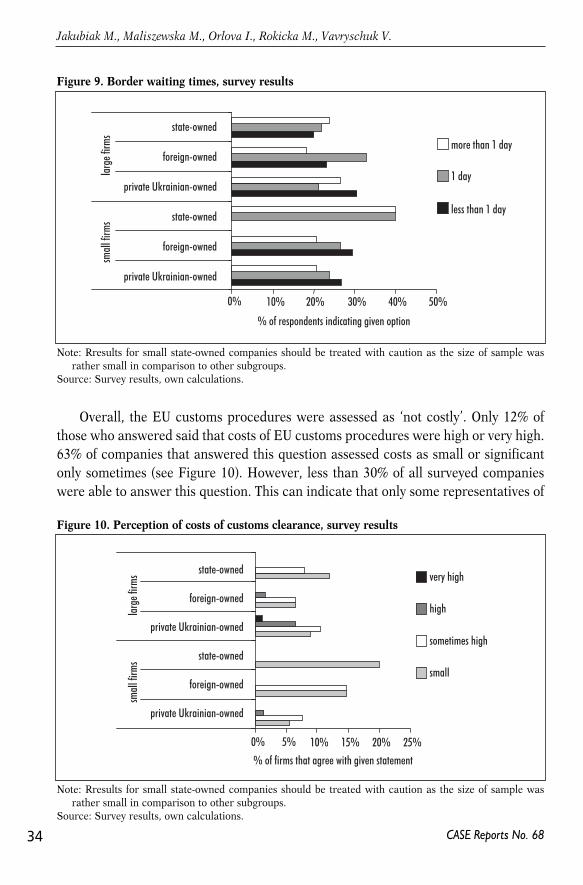
Overall, the EU customs procedures were assessed as ‘not costly’. Only 12% ofthose who answered said that costs of EU customs procedures were high or very high.63% of companies that answered this question assessed costs as small or significantonly sometimes (see Figure 10). However, less than 30% of all surveyed companieswere able to answer this question. This can indicate that only some representatives of
34
Jakubiak M., Maliszewska M., Orlova I., Rokicka M., Vavryschuk V.
CASE Reports No. 68
Note: Rresults for small state-owned companies should be treated with caution as the size of sample wasrather small in comparison to other subgroups.
Source: Survey results, own calculations.
Figure 9. Border waiting times, survey results
0% 10% 20% 30% 40% 50%
% of respondents indicating given option
more than 1 day
1 day
less than 1 day
small
firm
s
la
rge f
irms
state-owned
foreign-owned
private Ukrainian-owned
state-owned
foreign-owned
private Ukrainian-owned
Note: Rresults for small state-owned companies should be treated with caution as the size of sample wasrather small in comparison to other subgroups.
Source: Survey results, own calculations.
Figure 10. Perception of costs of customs clearance, survey results
0% 5% 10% 15% 20% 25%
% of firms that agree with given statement
very high
high
sometimes high
small
small
firm
s
la
rge f
irms state-owned
foreign-owned
private Ukrainian-owned
state-owned
foreign-owned
private Ukrainian-owned
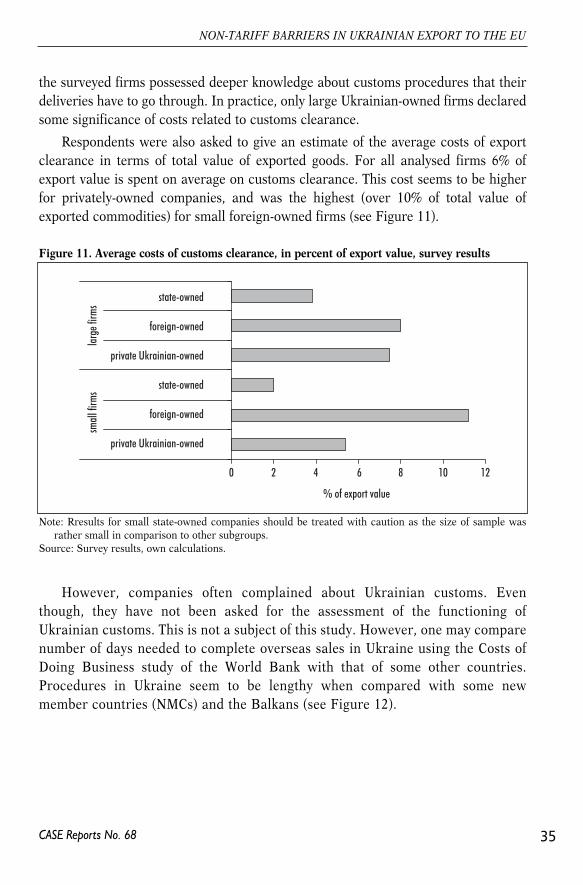
the surveyed firms possessed deeper knowledge about customs procedures that theirdeliveries have to go through. In practice, only large Ukrainian-owned firms declaredsome significance of costs related to customs clearance.
Respondents were also asked to give an estimate of the average costs of exportclearance in terms of total value of exported goods. For all analysed firms 6% ofexport value is spent on average on customs clearance. This cost seems to be higherfor privately-owned companies, and was the highest (over 10% of total value ofexported commodities) for small foreign-owned firms (see Figure 11).
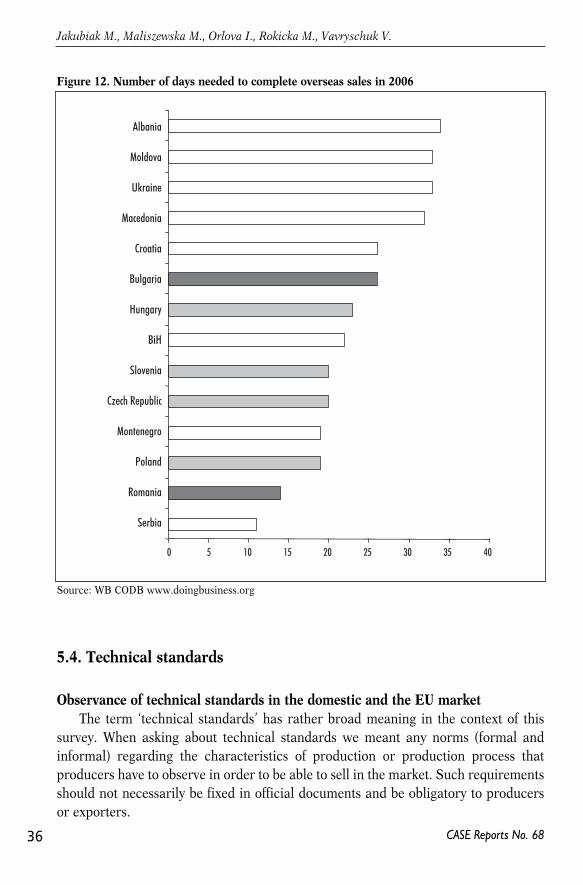
However, companies often complained about Ukrainian customs. Eventhough, they have not been asked for the assessment of the functioning ofUkrainian customs. This is not a subject of this study. However, one may comparenumber of days needed to complete overseas sales in Ukraine using the Costs ofDoing Business study of the World Bank with that of some other countries.Procedures in Ukraine seem to be lengthy when compared with some newmember countries (NMCs) and the Balkans (see Figure 12).
35
NON-TARIFF BARRIERS IN UKRAINIAN EXPORT TO THE EU
CASE Reports No. 68
Note: Rresults for small state-owned companies should be treated with caution as the size of sample wasrather small in comparison to other subgroups.
Source: Survey results, own calculations.
Figure 11. Average costs of customs clearance, in percent of export value, survey results
0 2 4 6 8 10 12
% of export value
small
firm
s
la
rge f
irms
state-owned
foreign-owned
private Ukrainian-owned
state-owned
foreign-owned
private Ukrainian-owned
5.4. Technical standards
Observance of technical standards in the domestic and the EU marketThe term ‘technical standards’ has rather broad meaning in the context of this
survey. When asking about technical standards we meant any norms (formal andinformal) regarding the characteristics of production or production process thatproducers have to observe in order to be able to sell in the market. Such requirementsshould not necessarily be fixed in official documents and be obligatory to producersor exporters.
36
Jakubiak M., Maliszewska M., Orlova I., Rokicka M., Vavryschuk V.
CASE Reports No. 68
Source: WB CODB www.doingbusiness.org
Figure 12. Number of days needed to complete overseas sales in 2006
0 5 10 15 20 25 30 35 40
Albania
Moldova
Ukraine
Macedonia
Croatia
Bulgaria
Hungary
BiH
Slovenia
Czech Republic
Montenegro
Poland
Romania
Serbia
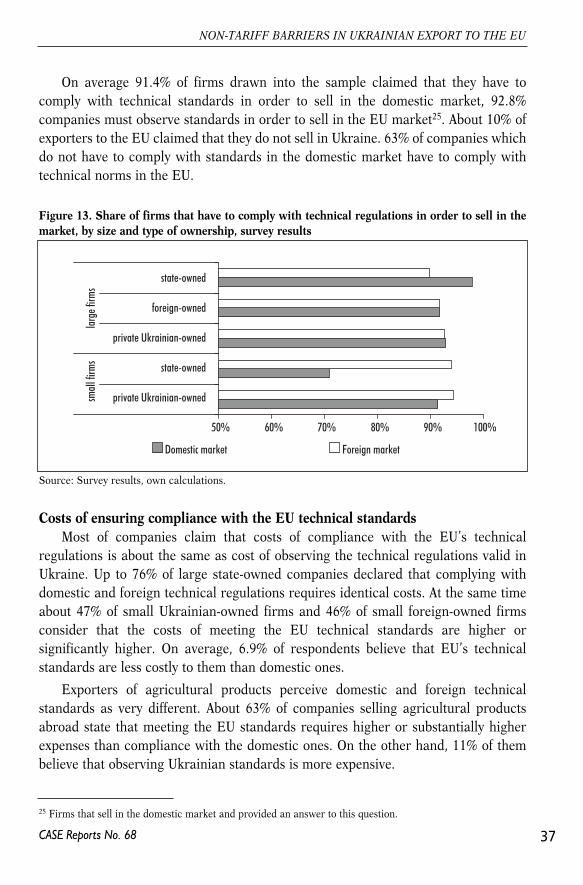
On average 91.4% of firms drawn into the sample claimed that they have tocomply with technical standards in order to sell in the domestic market, 92.8%companies must observe standards in order to sell in the EU market25. About 10% ofexporters to the EU claimed that they do not sell in Ukraine. 63% of companies whichdo not have to comply with standards in the domestic market have to comply withtechnical norms in the EU.
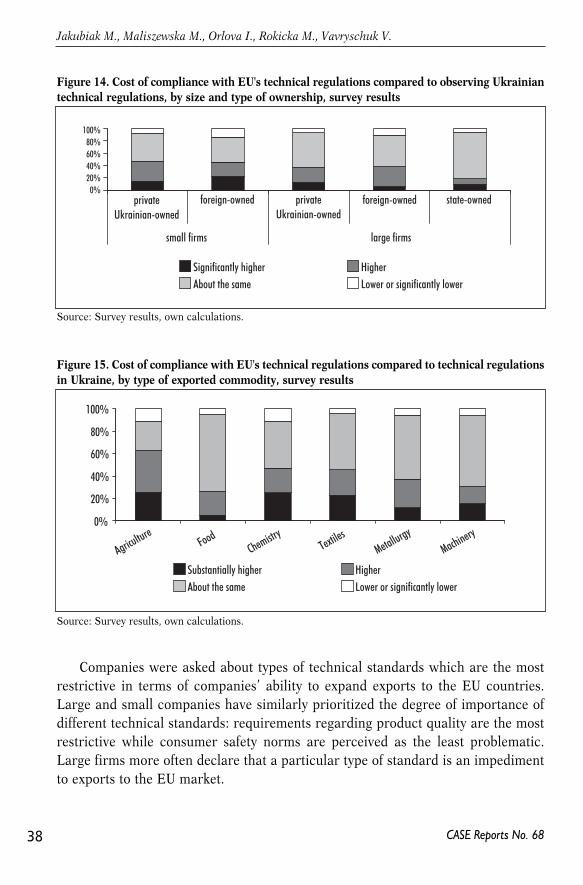
Costs of ensuring compliance with the EU technical standardsMost of companies claim that costs of compliance with the EU’s technical
regulations is about the same as cost of observing the technical regulations valid inUkraine. Up to 76% of large state-owned companies declared that complying withdomestic and foreign technical regulations requires identical costs. At the same timeabout 47% of small Ukrainian-owned firms and 46% of small foreign-owned firmsconsider that the costs of meeting the EU technical standards are higher orsignificantly higher. On average, 6.9% of respondents believe that EU’s technicalstandards are less costly to them than domestic ones.
Exporters of agricultural products perceive domestic and foreign technicalstandards as very different. About 63% of companies selling agricultural productsabroad state that meeting the EU standards requires higher or substantially higherexpenses than compliance with the domestic ones. On the other hand, 11% of thembelieve that observing Ukrainian standards is more expensive.
37
NON-TARIFF BARRIERS IN UKRAINIAN EXPORT TO THE EU
CASE Reports No. 68
25 Firms that sell in the domestic market and provided an answer to this question.
Source: Survey results, own calculations.
Figure 13. Share of firms that have to comply with technical regulations in order to sell in themarket, by size and type of ownership, survey results
50% 60% 70% 80% 90% 100%
Domestic market Foreign market
small
firm
s
large
firm
s
state-owned
foreign-owned
private Ukrainian-owned
state-owned
private Ukrainian-owned
Companies were asked about types of technical standards which are the mostrestrictive in terms of companies’ ability to expand exports to the EU countries.Large and small companies have similarly prioritized the degree of importance ofdifferent technical standards: requirements regarding product quality are the mostrestrictive while consumer safety norms are perceived as the least problematic.Large firms more often declare that a particular type of standard is an impedimentto exports to the EU market.
38
Jakubiak M., Maliszewska M., Orlova I., Rokicka M., Vavryschuk V.
CASE Reports No. 68
Source: Survey results, own calculations.
Figure 14. Cost of compliance with EU's technical regulations compared to observing Ukrainiantechnical regulations, by size and type of ownership, survey results
small firms large firms
Significantly higher HigherAbout the same Lower or significantly lower
100%80%60%40%20%0%
private Ukrainian-owned
foreign-owned state-owned private Ukrainian-owned
foreign-owned
Source: Survey results, own calculations.
Figure 15. Cost of compliance with EU's technical regulations compared to technical regulationsin Ukraine, by type of exported commodity, survey results
0%
20%
40%
60%
80%
100%
AgricultureFood
Chemistry Textiles
MetallurgyMachinery
Substantially higher HigherAbout the same Lower or significantly lower
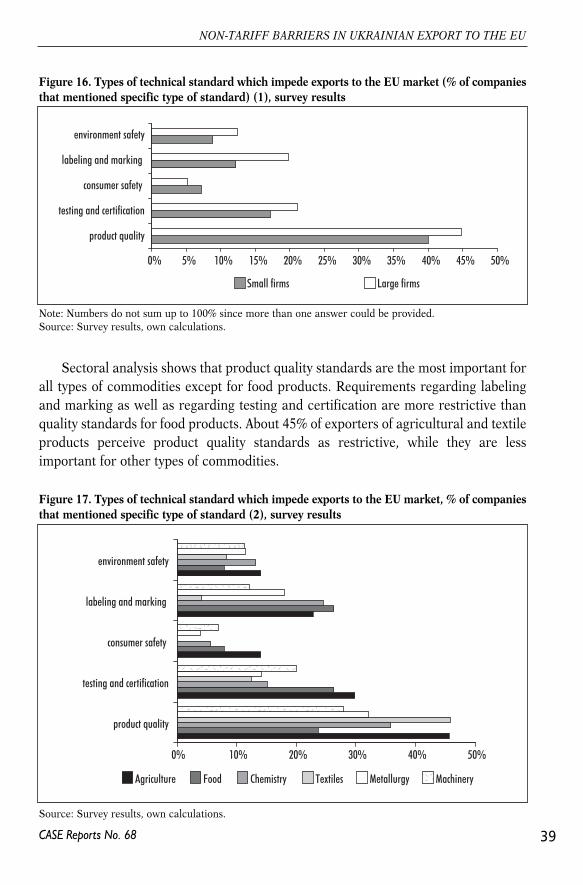
Sectoral analysis shows that product quality standards are the most important forall types of commodities except for food products. Requirements regarding labelingand marking as well as regarding testing and certification are more restrictive thanquality standards for food products. About 45% of exporters of agricultural and textileproducts perceive product quality standards as restrictive, while they are lessimportant for other types of commodities.
39
NON-TARIFF BARRIERS IN UKRAINIAN EXPORT TO THE EU
CASE Reports No. 68
Note: Numbers do not sum up to 100% since more than one answer could be provided.Source: Survey results, own calculations.
Figure 16. Types of technical standard which impede exports to the EU market (% of companiesthat mentioned specific type of standard) (1), survey results
0% 5% 10% 15% 20% 25% 30% 35% 40% 45% 50%
environment safety
labeling and marking
consumer safety
testing and certification
product quality
Small firms Large firms
Source: Survey results, own calculations.
Figure 17. Types of technical standard which impede exports to the EU market, % of companiesthat mentioned specific type of standard (2), survey results
0% 10% 20% 30% 40% 50%
Agriculture Food Chemistry Textiles Metallurgy Machinery
environment safety
labeling and marking
consumer safety
testing and certification
product quality
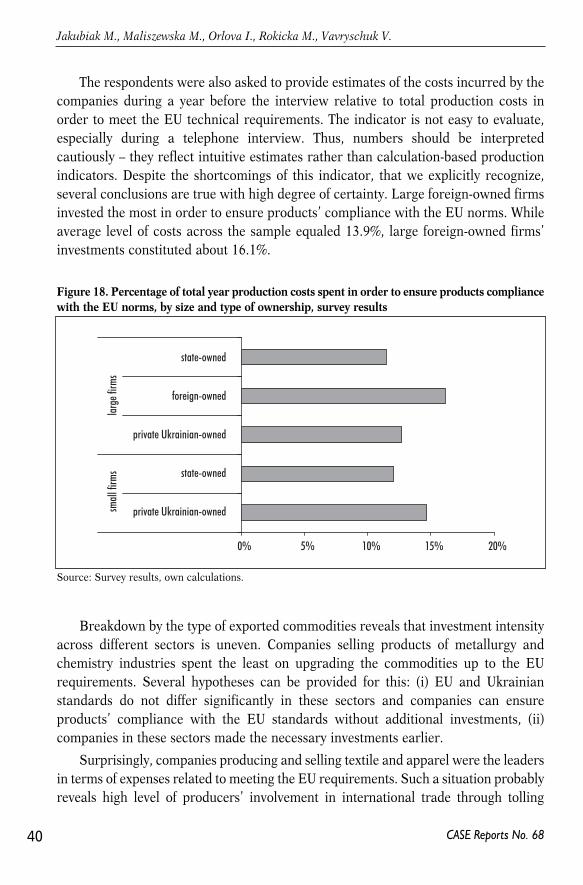
The respondents were also asked to provide estimates of the costs incurred by thecompanies during a year before the interview relative to total production costs inorder to meet the EU technical requirements. The indicator is not easy to evaluate,especially during a telephone interview. Thus, numbers should be interpretedcautiously – they reflect intuitive estimates rather than calculation-based productionindicators. Despite the shortcomings of this indicator, that we explicitly recognize,several conclusions are true with high degree of certainty. Large foreign-owned firmsinvested the most in order to ensure products’ compliance with the EU norms. Whileaverage level of costs across the sample equaled 13.9%, large foreign-owned firms’investments constituted about 16.1%.
Breakdown by the type of exported commodities reveals that investment intensityacross different sectors is uneven. Companies selling products of metallurgy andchemistry industries spent the least on upgrading the commodities up to the EUrequirements. Several hypotheses can be provided for this: (i) EU and Ukrainianstandards do not differ significantly in these sectors and companies can ensureproducts’ compliance with the EU standards without additional investments, (ii)companies in these sectors made the necessary investments earlier.
Surprisingly, companies producing and selling textile and apparel were the leadersin terms of expenses related to meeting the EU requirements. Such a situation probablyreveals high level of producers’ involvement in international trade through tolling
40
Jakubiak M., Maliszewska M., Orlova I., Rokicka M., Vavryschuk V.
CASE Reports No. 68
Source: Survey results, own calculations.
Figure 18. Percentage of total year production costs spent in order to ensure products compliancewith the EU norms, by size and type of ownership, survey results
0% 5% 10% 15% 20%
small
firm
s
larg
e firm
s
state-owned
foreign-owned
private Ukrainian-owned
state-owned
private Ukrainian-owned
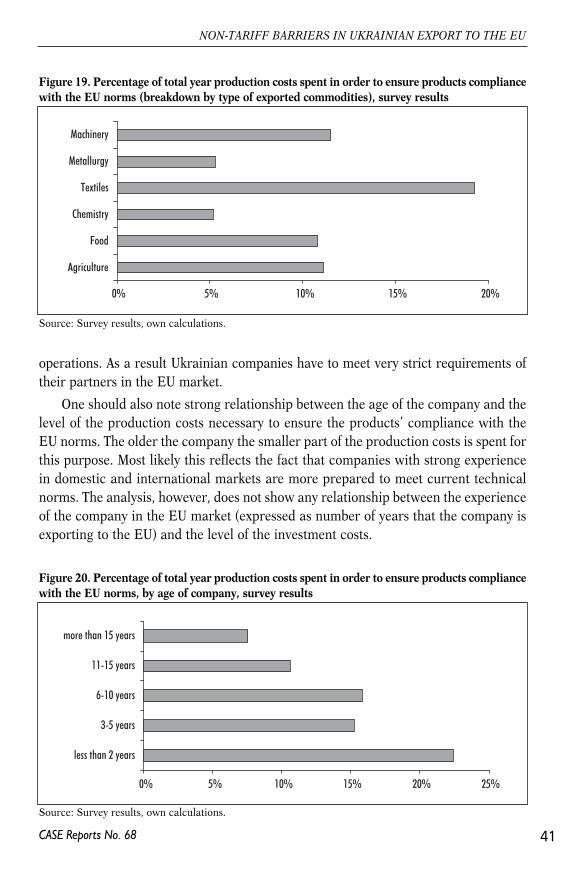
operations. As a result Ukrainian companies have to meet very strict requirements oftheir partners in the EU market.
One should also note strong relationship between the age of the company and thelevel of the production costs necessary to ensure the products’ compliance with theEU norms. The older the company the smaller part of the production costs is spent forthis purpose. Most likely this reflects the fact that companies with strong experiencein domestic and international markets are more prepared to meet current technicalnorms. The analysis, however, does not show any relationship between the experienceof the company in the EU market (expressed as number of years that the company isexporting to the EU) and the level of the investment costs.
41
NON-TARIFF BARRIERS IN UKRAINIAN EXPORT TO THE EU
CASE Reports No. 68
Source: Survey results, own calculations.
Figure 19. Percentage of total year production costs spent in order to ensure products compliancewith the EU norms (breakdown by type of exported commodities), survey results
0% 5% 10% 15% 20%
Machinery
Metallurgy
Textiles
Chemistry
Food
Agriculture
Source: Survey results, own calculations.
Figure 20. Percentage of total year production costs spent in order to ensure products compliancewith the EU norms, by age of company, survey results
0% 5% 10% 15% 20% 25%
more than 15 years
11-15 years
6-10 years
3-5 years
less than 2 years
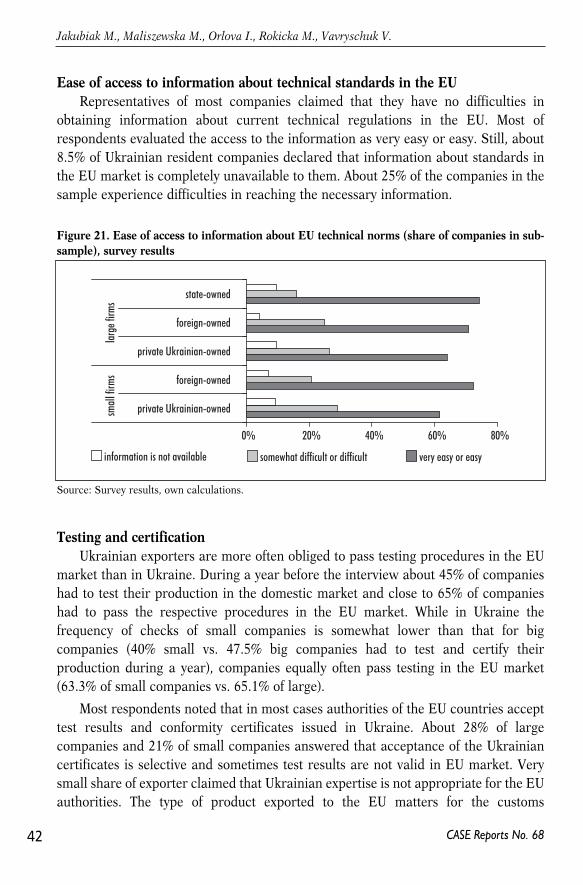
Ease of access to information about technical standards in the EURepresentatives of most companies claimed that they have no difficulties in
obtaining information about current technical regulations in the EU. Most ofrespondents evaluated the access to the information as very easy or easy. Still, about8.5% of Ukrainian resident companies declared that information about standards inthe EU market is completely unavailable to them. About 25% of the companies in thesample experience difficulties in reaching the necessary information.
Testing and certificationUkrainian exporters are more often obliged to pass testing procedures in the EU
market than in Ukraine. During a year before the interview about 45% of companieshad to test their production in the domestic market and close to 65% of companieshad to pass the respective procedures in the EU market. While in Ukraine thefrequency of checks of small companies is somewhat lower than that for bigcompanies (40% small vs. 47.5% big companies had to test and certify theirproduction during a year), companies equally often pass testing in the EU market(63.3% of small companies vs. 65.1% of large).
Most respondents noted that in most cases authorities of the EU countries accepttest results and conformity certificates issued in Ukraine. About 28% of largecompanies and 21% of small companies answered that acceptance of the Ukrainiancertificates is selective and sometimes test results are not valid in EU market. Verysmall share of exporter claimed that Ukrainian expertise is not appropriate for the EUauthorities. The type of product exported to the EU matters for the customs
42
Jakubiak M., Maliszewska M., Orlova I., Rokicka M., Vavryschuk V.
CASE Reports No. 68
Source: Survey results, own calculations.
Figure 21. Ease of access to information about EU technical norms (share of companies in sub-sample), survey results
0% 20% 40% 60% 80%
very easy or easysomewhat difficult or difficultinformation is not available
small
firm
s
large
firm
s
state-owned
foreign-owned
private Ukrainian-owned
foreign-owned
private Ukrainian-owned
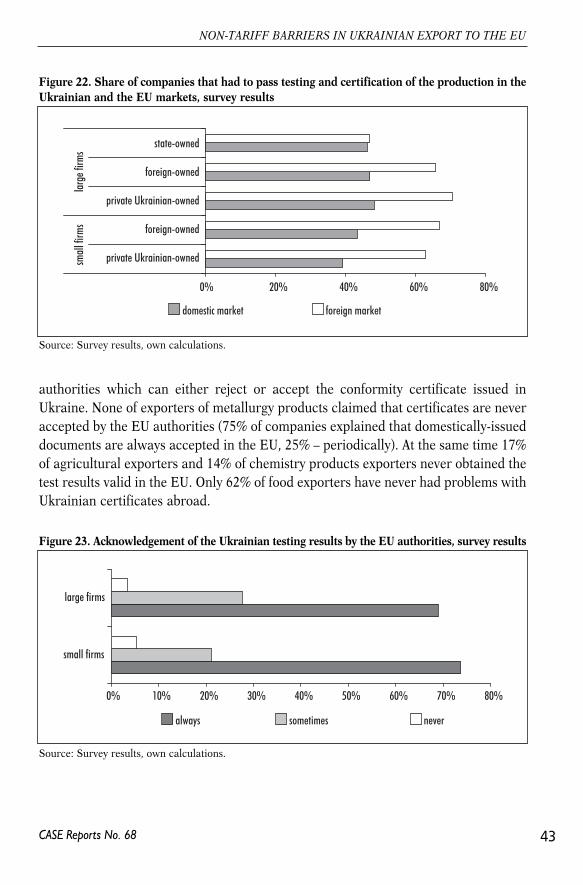
authorities which can either reject or accept the conformity certificate issued inUkraine. None of exporters of metallurgy products claimed that certificates are neveraccepted by the EU authorities (75% of companies explained that domestically-issueddocuments are always accepted in the EU, 25% – periodically). At the same time 17%of agricultural exporters and 14% of chemistry products exporters never obtained thetest results valid in the EU. Only 62% of food exporters have never had problems withUkrainian certificates abroad.
43
NON-TARIFF BARRIERS IN UKRAINIAN EXPORT TO THE EU
CASE Reports No. 68
Source: Survey results, own calculations.
Figure 22. Share of companies that had to pass testing and certification of the production in theUkrainian and the EU markets, survey results
0% 20% 40% 60% 80%
domestic market foreign market
small
firm
s
large
firm
s
state-owned
foreign-owned
private Ukrainian-owned
foreign-owned
private Ukrainian-owned
Source: Survey results, own calculations.
Figure 23. Acknowledgement of the Ukrainian testing results by the EU authorities, survey results
0% 10% 20% 30% 40% 50% 60% 70% 80%
small firms
large firms
always sometimes never
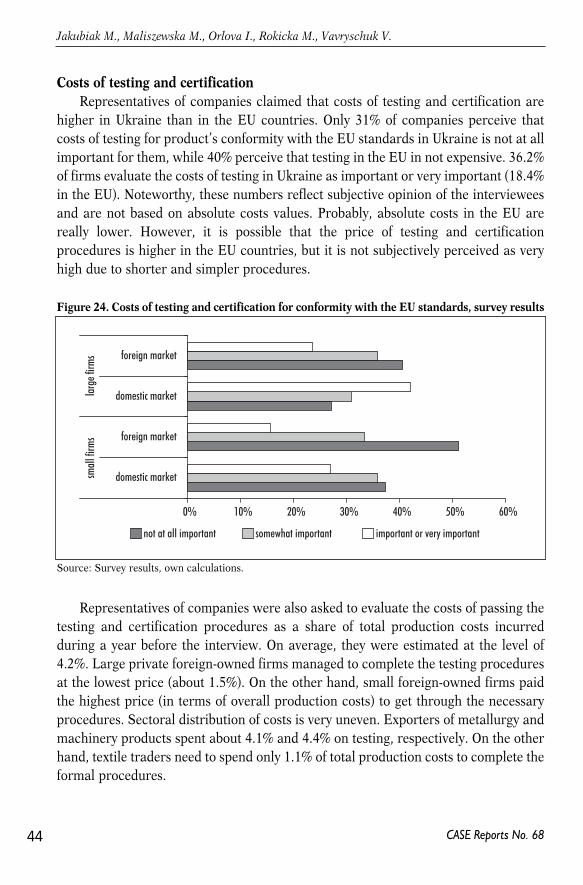
Costs of testing and certificationRepresentatives of companies claimed that costs of testing and certification are
higher in Ukraine than in the EU countries. Only 31% of companies perceive thatcosts of testing for product’s conformity with the EU standards in Ukraine is not at allimportant for them, while 40% perceive that testing in the EU in not expensive. 36.2%of firms evaluate the costs of testing in Ukraine as important or very important (18.4%in the EU). Noteworthy, these numbers reflect subjective opinion of the intervieweesand are not based on absolute costs values. Probably, absolute costs in the EU arereally lower. However, it is possible that the price of testing and certificationprocedures is higher in the EU countries, but it is not subjectively perceived as veryhigh due to shorter and simpler procedures.
Representatives of companies were also asked to evaluate the costs of passing thetesting and certification procedures as a share of total production costs incurredduring a year before the interview. On average, they were estimated at the level of4.2%. Large private foreign-owned firms managed to complete the testing proceduresat the lowest price (about 1.5%). On the other hand, small foreign-owned firms paidthe highest price (in terms of overall production costs) to get through the necessaryprocedures. Sectoral distribution of costs is very uneven. Exporters of metallurgy andmachinery products spent about 4.1% and 4.4% on testing, respectively. On the otherhand, textile traders need to spend only 1.1% of total production costs to complete theformal procedures.
44
Jakubiak M., Maliszewska M., Orlova I., Rokicka M., Vavryschuk V.
CASE Reports No. 68
Source: Survey results, own calculations.
Figure 24. Costs of testing and certification for conformity with the EU standards, survey results
0% 10% 20% 30% 40% 50% 60%
not at all important somewhat important important or very important
foreign market
domestic market
foreign market
domestic marketsmall
firm
s
lar
ge fi
rms
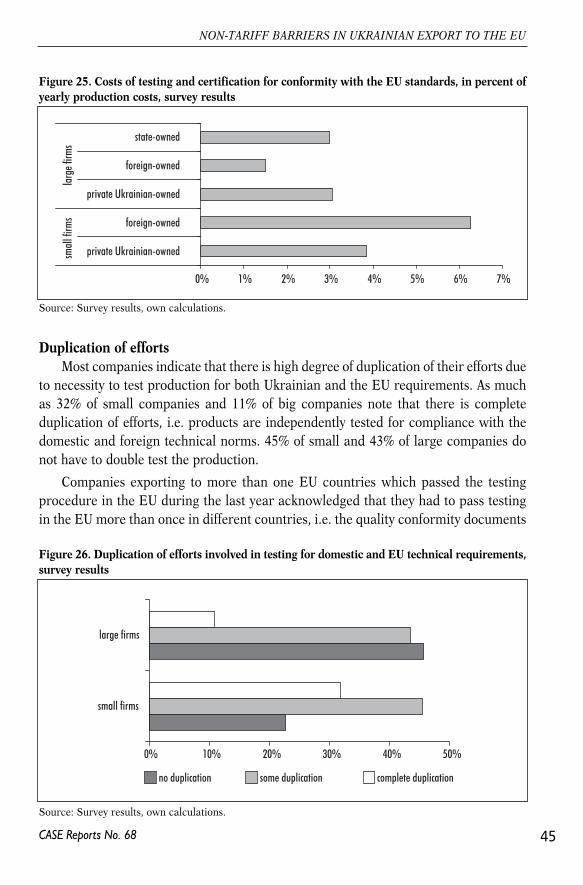
Duplication of effortsMost companies indicate that there is high degree of duplication of their efforts due
to necessity to test production for both Ukrainian and the EU requirements. As muchas 32% of small companies and 11% of big companies note that there is completeduplication of efforts, i.e. products are independently tested for compliance with thedomestic and foreign technical norms. 45% of small and 43% of large companies donot have to double test the production.
Companies exporting to more than one EU countries which passed the testingprocedure in the EU during the last year acknowledged that they had to pass testingin the EU more than once in different countries, i.e. the quality conformity documents
45
NON-TARIFF BARRIERS IN UKRAINIAN EXPORT TO THE EU
CASE Reports No. 68
Source: Survey results, own calculations.
Figure 25. Costs of testing and certification for conformity with the EU standards, in percent ofyearly production costs, survey results
0% 1% 2% 3% 4% 5% 6% 7%
small
firm
s
large
firm
s
state-owned
foreign-owned
private Ukrainian-owned
foreign-owned
private Ukrainian-owned
Source: Survey results, own calculations.
Figure 26. Duplication of efforts involved in testing for domestic and EU technical requirements,survey results
0% 10% 20% 30% 40% 50%
small firms
large firms
no duplication some duplication complete duplication
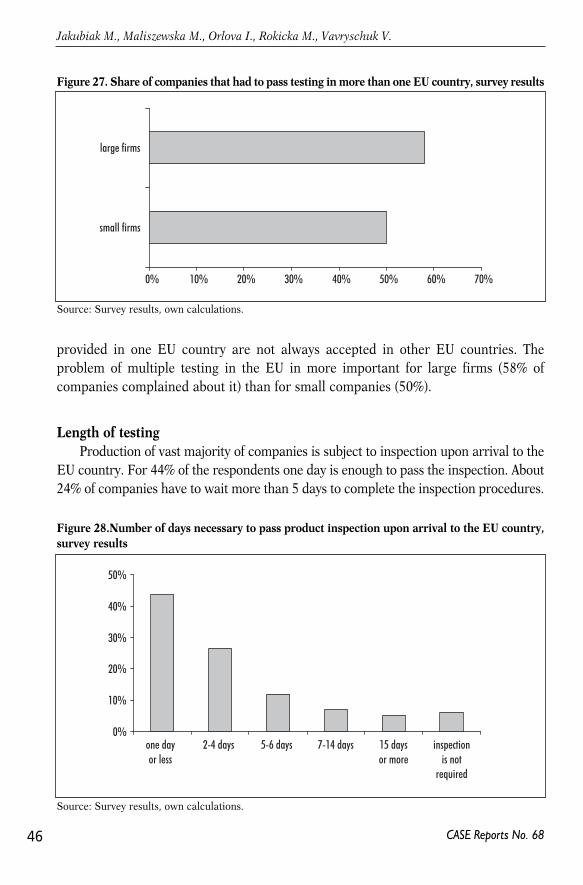
provided in one EU country are not always accepted in other EU countries. Theproblem of multiple testing in the EU in more important for large firms (58% ofcompanies complained about it) than for small companies (50%).
Length of testingProduction of vast majority of companies is subject to inspection upon arrival to the
EU country. For 44% of the respondents one day is enough to pass the inspection. About24% of companies have to wait more than 5 days to complete the inspection procedures.
46
Jakubiak M., Maliszewska M., Orlova I., Rokicka M., Vavryschuk V.
CASE Reports No. 68
Source: Survey results, own calculations.
Figure 27. Share of companies that had to pass testing in more than one EU country, survey results
0% 10% 20% 30% 40% 50% 60% 70%
small firms
large firms
Source: Survey results, own calculations.
Figure 28.Number of days necessary to pass product inspection upon arrival to the EU country,survey results
0%
10%
20%
30%
40%
50%
one dayor less
2-4 days 5-6 days 7-14 days 15 daysor more
inspectionis not
required
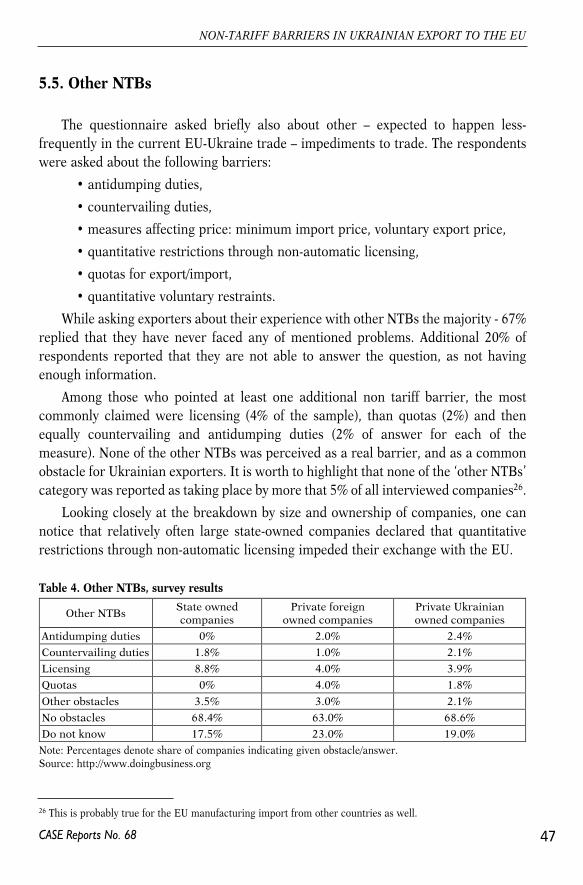
5.5. Other NTBs
The questionnaire asked briefly also about other – expected to happen less-frequently in the current EU-Ukraine trade – impediments to trade. The respondentswere asked about the following barriers:
• antidumping duties,
• countervailing duties,
• measures affecting price: minimum import price, voluntary export price,
• quantitative restrictions through non-automatic licensing,
• quotas for export/import,
• quantitative voluntary restraints.
While asking exporters about their experience with other NTBs the majority - 67%replied that they have never faced any of mentioned problems. Additional 20% ofrespondents reported that they are not able to answer the question, as not havingenough information.
Among those who pointed at least one additional non tariff barrier, the mostcommonly claimed were licensing (4% of the sample), than quotas (2%) and thenequally countervailing and antidumping duties (2% of answer for each of themeasure). None of the other NTBs was perceived as a real barrier, and as a commonobstacle for Ukrainian exporters. It is worth to highlight that none of the ‘other NTBs’category was reported as taking place by more that 5% of all interviewed companies26.
Looking closely at the breakdown by size and ownership of companies, one cannotice that relatively often large state-owned companies declared that quantitativerestrictions through non-automatic licensing impeded their exchange with the EU.
47
NON-TARIFF BARRIERS IN UKRAINIAN EXPORT TO THE EU
CASE Reports No. 68
26 This is probably true for the EU manufacturing import from other countries as well.
Note: Percentages denote share of companies indicating given obstacle/answer.Source: http://www.doingbusiness.org
Table 4. Other NTBs, survey results
Other NTBsState ownedcompanies
Private foreignowned companies
Private Ukrainianowned companies
Antidumping duties 0% 2.0% 2.4%Countervailing duties 1.8% 1.0% 2.1%Licensing 8.8% 4.0% 3.9%Quotas 0% 4.0% 1.8%
Other obstacles 3.5% 3.0% 2.1%No obstacles 68.4% 63.0% 68.6%Do not know 17.5% 23.0% 19.0%
Those who mentioned having some troubles with other NTBs were asked to gradethe restrictiveness of each of the barrier. Licensing was pointed by the largest groupof companies as important obstacle, while anti-dumping duties were reported by 27%of the firms as not very problematic. With regard to countervailing duties, 4 firms(36% of those reporting the existence of ‘other NTBs’) assessed it negatively, andquotas were seen as the essential barriers for EU trade by 2 firms out of those whopreviously reported it as a barrier. The small amount of firms claiming the existenceof ‘other NTBs’ does not allow to draw any further conclusions.
48
Jakubiak M., Maliszewska M., Orlova I., Rokicka M., Vavryschuk V.
CASE Reports No. 68
This section briefly summarises policy recommendations for short- and medium-term arising from findings of this report. The recommendations can be formulated forboth external and domestic policies.
Domestic policies should be formulated in such a way that they are able toprepare Ukrainian private sector to withstand high competition from the EUenterprises. This means both the competition at the EU market, which will soonbecome more accessible for Ukrainian companies, as well as at the domestic market,which will be more penetrated by the EU products in the coming years27. In this view,the policies should be based on sound legal system harmonized in trade-related areaswith the EU laws. This is for the reason that already at the moment trade with the EUhas relatively high share, and that the EU norms can anchor reforms and economicdevelopment of Ukraine.
As the survey results demonstrate, inconsistency of Ukrainian and EU technicalnorms may be a substantial impediment for Ukrainian companies to expand theirexports to the EU market. Although majority of the companies do not experiencedifficulties connected with meeting technical standards at different stages of overseassales, many respondents claimed that particular trade-related technical regulationsare burdensome for them. Moreover, the experience of current new EU membercountries from Central and Eastern Europe shows that together with thedevelopment of the country and the changing structure of production (and export)towards more technologically-advanced products, Ukraine’s exporters will be moreexposed to the EU technical standards. The standards will be more important inrelative terms also because of the expected elimination of the traditional protectionmeasures like tariffs. This is to say that various EU technical norms may be evenmore of a barrier than they are now.
There is lot of room to make export-related technical regulations easier and moretransparent. In particular, the government should ensure that the system of technical
49CASE Reports No. 68
27 Following the expected gradual fall of protection of the domestic market connected with the WTO entry andFTA agreement with the EU.
6. Conclusionsand policy recommendations
regulation is consistent with the WTO Agreement on Technical Barriers to Trade aswell as its compliance with the EU regulations.
This proposition is backed not only by the necessity (as a precondition for theexpansion of exports) and due to expected increase of importance of technicalbarriers to trade. It should also be pursued because Ukraine already committed toensure alignment with the EU and international regulatory and administrativepractices in the sphere of standards, technical regulation and conformityassessment by signing the EU-Ukraine Action Plan. In particular, Ukraine and theEU have to jointly identify priority sectors for alignment with the EU laws as wellas possible inclusion in an Agreement on Conformity Assessment and Acceptance ofIndustrial Products. This can also be fulfilled with the financial support of theEuropean Commission already committed to provide technical assistance withinshort term TAIEX program.
Moreover, the long term strategy of the adaptation of the technical standards ofthe EU is approved by the Decree of the Cabinet of Ministers of Ukraine ‘On the StateProgram for Standardization for 2006-2010’. The document envisages thatthroughout the implementation period 8570 standard should be developed orharmonized in line with the requirements of the EU.
While designing the harmonization measures policy-makers should rememberthat implementation of new standards may become a challenge for producers. Formost companies compliance with the EU norms is more expensive than costs ofobserving Ukrainian standards. Thus, implementation of new standards may requirefrom companies substantial upfront investment. On average, producers exporting tothe EU estimated costs incurred in order to ensure compliance with the EUrequirements at the level of 14% of their total production costs. It can be assumed thatcurrent exporters to the EU have more advanced technologies and quality controlsystems than producers selling either at domestic or the CIS markets. Thus, costs ofmeeting the EU technical norms for the companies out of the sample covered by oursurvey may be substantially higher. Therefore, any actions that may increase theunderstanding of the EU norms and transparency of the work of standardisationbodies are worth pursuing, since they reduce certification costs for entrepreneurs.
One more thing which requires proper attention of the authorities is producttesting procedures. Producers acknowledge that costs related to testing in the EU arelower than in Ukraine. Although absolute numbers are not known from the survey, theperception of the authors of this report is that costs of passing the testing proceduresare high or very high. All in all producers spent about 4% of their total productioncosts to pass the necessary testing procedures in Ukraine and in the EU. In this view,it is recommended that the effort is put into the proper functioning of internationallyrecognizable laboratories certifying production in Ukraine.
50
Jakubiak M., Maliszewska M., Orlova I., Rokicka M., Vavryschuk V.
CASE Reports No. 68
Another action worth to be put for is to stimulate implementation of the EUstandards among producers in Ukraine. Many producers working for domesticmarket have no incentives to improve the quality of products since compliance withdomestic norms in enough to stay afloat. The government should develop a credibleand realistic schedule of the implementation and harmonization of technical normsconsistent with the EU requirements. This will give producers and exporters a clearunderstanding about how long the transition period may last and by how much theyshould intensify investment activities in order to ensure timely and comfortableacceptance of the new regulations.
There is also a need to improve dissemination of information on existingUkrainian and international (EU) standards among local producers. Ukraine alreadystarted to systemically implement measures to facilitate access to basic informationon domestic and foreign technical requirements. Establishment of the WTO EnquiryOffice at the Ministry of Economy of Ukraine may help in making the access toinformation easier and cheaper. The office accumulates drafts on trade-relatednormative acts of the trading partners and disseminates them among interestedUkrainian parties28. However, the office deals mostly with enquiries of the WTO andWTO members and local producers do not have an opportunity to enquire aboutinformation. It seems that the government should consider establishing a specializedagency responsible for full and timely dissemination of information on technicalnorms among all interested parties (which is also a requirement of the WTO).
Although agricultural trade was not a subject of this study, it is worth toconsider implementation of at least some EU sanitary and phytosanitary norms.Ukraine possesses comparative advantage in agricultural trade with the EU, andthis potential seems to be significantly underutilised. Even though the EU marketwill be for some time still highly protected by tariff and other traditional tradebarriers, the adoption of sanitary and phytosanitary norms may make totaleffective protection lower, and allow more firms to expand their sales to the EU.Taking into account Ukraine's agriculture production (and potential), it may resultin visible expansion of export.
There is also a scope for moves in the sphere of simplifying the procedures ofgranting rules of origins. The results of the survey show that although the procedureis not perceived as very costly, it is more of a barrier for small firms.
The reform of the Ukrainian customs service, with its lengthy proceduresconstituting an important obstacle to trade, should be continued. This would shortenborder waiting times, ensure better cooperation with EU customs and limitpossibilities for corruption. It seems highly desirable that the EU supports these
51
NON-TARIFF BARRIERS IN UKRAINIAN EXPORT TO THE EU
CASE Reports No. 68
28 The information on the Center is available at:http://www.me.gov.ua/control/uk/publish/category/main?cat_id=90016
reforms. At the moment, it seems particularly important to adopt regulations oncustoms valuation, provide trainings and increase computerisation of customs posts.
Some of the firms claimed existence of troublesome non-automatic licensing inUkraine. It seems that perhaps a closer look should be given to this restriction andperhaps it can be eliminated.
There can also be a scope for export-support policies. However, one should notethat the increase in overseas sales is primarily for the private sector to solve.Nevertheless, some actions may be worth considering. Among them are programsraising export potential awareness among producers, and stimulating trade activity ofSMEs. Another potential action is an effective support in the form of providinginsurance to export credits or providing credit guarantees to SMEs, which oftenoperate on tight margins and cannot insure their deliveries. The government can alsosupport provision of regular information on trade events and changes in tradeconditions for enterprises and business associations.
The recommendation for external policies arising from this report are reduced totwo issues. The first one is to ensure WTO accession in 2007. The second issue relatesto the coming negotiations on the shape of the EU-Ukraine free trade agreement. Inits core, the agreement will deal with the gradual liberalisation of tariffs andtraditional protection measures in manufacturing trade between the two sides. Itseems desirable, for the reasons listed above, to strengthen it with commitments onharmonisation and some reforms to the maximum possible extent. In particular, itseems desirable that the agreement covers also support to customs service reform.Moreover, it should also relate to harmonisation and mutual recognition of standardsand to adoption of EU agri-food standards by Ukraine. Liberalisation of Ukraine’sfinancial intermediation sector could also be included, as it supports the developmentof companies and enlarges country’s supply capacity.
52
Jakubiak M., Maliszewska M., Orlova I., Rokicka M., Vavryschuk V.
CASE Reports No. 68
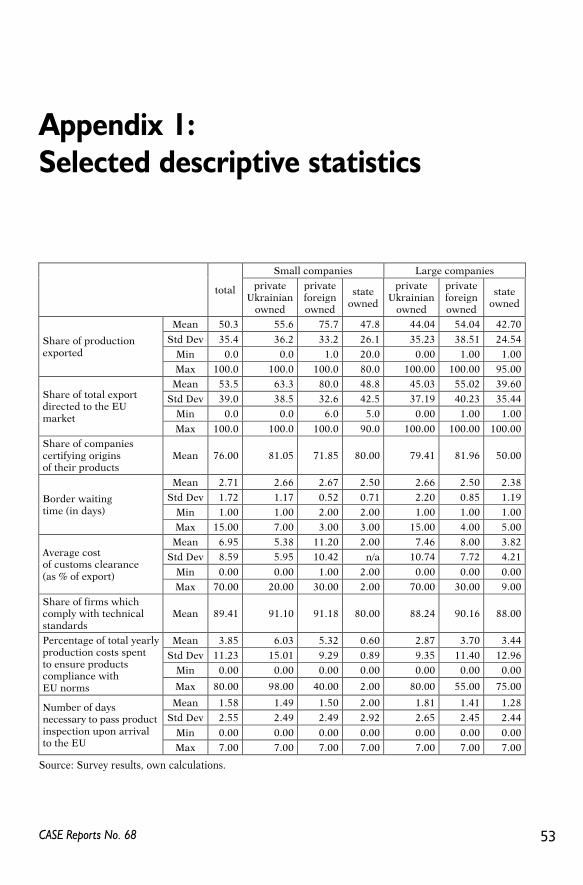
53CASE Reports No. 68
Appendix 1:Selected descriptive statistics
Source: Survey results, own calculations.
Small companies Large companies
total privateUkrainian
owned
privateforeignowned
stateowned
privateUkrainian
owned
privateforeignowned
stateowned
Mean 50.3 55.6 75.7 47.8 44.04 54.04 42.70
Std Dev 35.4 36.2 33.2 26.1 35.23 38.51 24.54Min 0.0 0.0 1.0 20.0 0.00 1.00 1.00
Share of productionexported
Max 100.0 100.0 100.0 80.0 100.00 100.00 95.00Mean 53.5 63.3 80.0 48.8 45.03 55.02 39.60
Std Dev 39.0 38.5 32.6 42.5 37.19 40.23 35.44Min 0.0 0.0 6.0 5.0 0.00 1.00 1.00
Share of total exportdirected to the EUmarket
Max 100.0 100.0 100.0 90.0 100.00 100.00 100.00Share of companiescertifying originsof their products
Mean 76.00 81.05 71.85 80.00 79.41 81.96 50.00
Mean 2.71 2.66 2.67 2.50 2.66 2.50 2.38Std Dev 1.72 1.17 0.52 0.71 2.20 0.85 1.19
Min 1.00 1.00 2.00 2.00 1.00 1.00 1.00Border waitingtime (in days)
Max 15.00 7.00 3.00 3.00 15.00 4.00 5.00Mean 6.95 5.38 11.20 2.00 7.46 8.00 3.82
Std Dev 8.59 5.95 10.42 n/a 10.74 7.72 4.21
Min 0.00 0.00 1.00 2.00 0.00 0.00 0.00
Average costof customs clearance(as % of export)
Max 70.00 20.00 30.00 2.00 70.00 30.00 9.00Share of firms whichcomply with technicalstandards
Mean 89.41 91.10 91.18 80.00 88.24 90.16 88.00
Mean 3.85 6.03 5.32 0.60 2.87 3.70 3.44Std Dev 11.23 15.01 9.29 0.89 9.35 11.40 12.96
Min 0.00 0.00 0.00 0.00 0.00 0.00 0.00
Percentage of total yearlyproduction costs spentto ensure productscompliance withEU norms Max 80.00 98.00 40.00 2.00 80.00 55.00 75.00
Mean 1.58 1.49 1.50 2.00 1.81 1.41 1.28Std Dev 2.55 2.49 2.49 2.92 2.65 2.45 2.44
Min 0.00 0.00 0.00 0.00 0.00 0.00 0.00
Number of daysnecessary to pass productinspection upon arrivalto the EU Max 7.00 7.00 7.00 7.00 7.00 7.00 7.00

54
Jakubiak M., Maliszewska M., Orlova I., Rokicka M., Vavryschuk V.
CASE Reports No. 68
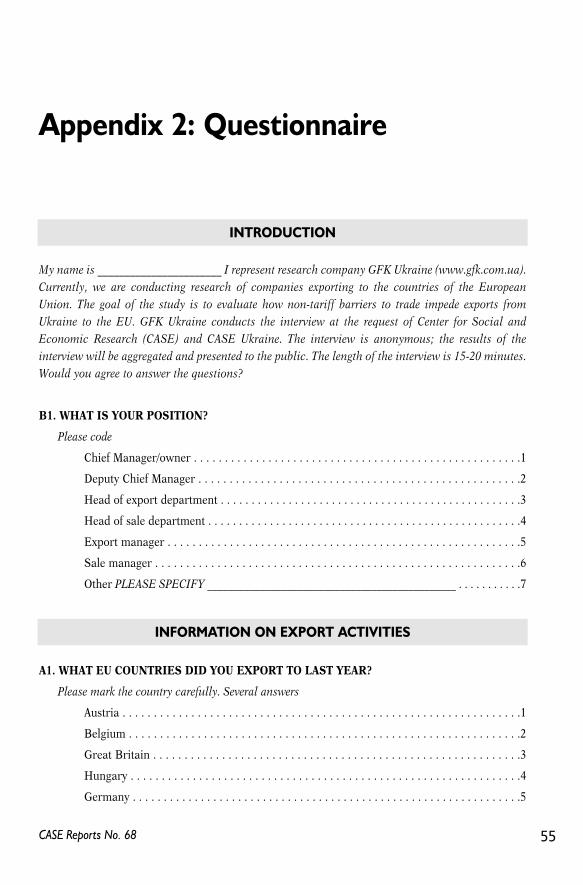
My name is _______________________ I represent research company GFK Ukraine (www.gfk.com.ua).Currently, we are conducting research of companies exporting to the countries of the EuropeanUnion. The goal of the study is to evaluate how non-tariff barriers to trade impede exports fromUkraine to the EU. GFK Ukraine conducts the interview at the request of Center for Social andEconomic Research (CASE) and CASE Ukraine. The interview is anonymous; the results of theinterview will be aggregated and presented to the public. The length of the interview is 15-20 minutes.Would you agree to answer the questions?
B1. WHAT IS YOUR POSITION?
Please code
Chief Manager/owner . . . . . . . . . . . . . . . . . . . . . . . . . . . . . . . . . . . . . . . . . . . . . . . . . . . . .1
Deputy Chief Manager . . . . . . . . . . . . . . . . . . . . . . . . . . . . . . . . . . . . . . . . . . . . . . . . . . . .2
Head of export department . . . . . . . . . . . . . . . . . . . . . . . . . . . . . . . . . . . . . . . . . . . . . . . . .3
Head of sale department . . . . . . . . . . . . . . . . . . . . . . . . . . . . . . . . . . . . . . . . . . . . . . . . . . .4
Export manager . . . . . . . . . . . . . . . . . . . . . . . . . . . . . . . . . . . . . . . . . . . . . . . . . . . . . . . . .5
Sale manager . . . . . . . . . . . . . . . . . . . . . . . . . . . . . . . . . . . . . . . . . . . . . . . . . . . . . . . . . . .6
Other PLEASE SPECIFY _______________________________________________ . . . . . . . . . . .7
A1. WHAT EU COUNTRIES DID YOU EXPORT TO LAST YEAR?
Please mark the country carefully. Several answers
Austria . . . . . . . . . . . . . . . . . . . . . . . . . . . . . . . . . . . . . . . . . . . . . . . . . . . . . . . . . . . . . . . .1
Belgium . . . . . . . . . . . . . . . . . . . . . . . . . . . . . . . . . . . . . . . . . . . . . . . . . . . . . . . . . . . . . . .2
Great Britain . . . . . . . . . . . . . . . . . . . . . . . . . . . . . . . . . . . . . . . . . . . . . . . . . . . . . . . . . . .3
Hungary . . . . . . . . . . . . . . . . . . . . . . . . . . . . . . . . . . . . . . . . . . . . . . . . . . . . . . . . . . . . . . .4
Germany . . . . . . . . . . . . . . . . . . . . . . . . . . . . . . . . . . . . . . . . . . . . . . . . . . . . . . . . . . . . . . .5
55CASE Reports No. 68
Appendix 2: Questionnaire
INTRODUCTION
INFORMATION ON EXPORT ACTIVITIES
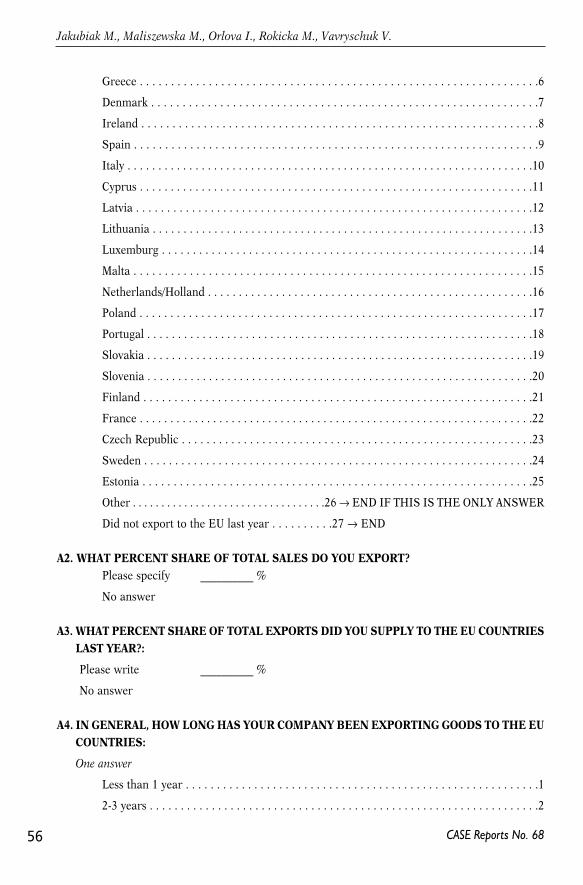
Greece . . . . . . . . . . . . . . . . . . . . . . . . . . . . . . . . . . . . . . . . . . . . . . . . . . . . . . . . . . . . . . . .6
Denmark . . . . . . . . . . . . . . . . . . . . . . . . . . . . . . . . . . . . . . . . . . . . . . . . . . . . . . . . . . . . . .7
Ireland . . . . . . . . . . . . . . . . . . . . . . . . . . . . . . . . . . . . . . . . . . . . . . . . . . . . . . . . . . . . . . . .8
Spain . . . . . . . . . . . . . . . . . . . . . . . . . . . . . . . . . . . . . . . . . . . . . . . . . . . . . . . . . . . . . . . . .9
Italy . . . . . . . . . . . . . . . . . . . . . . . . . . . . . . . . . . . . . . . . . . . . . . . . . . . . . . . . . . . . . . . . . .10
Cyprus . . . . . . . . . . . . . . . . . . . . . . . . . . . . . . . . . . . . . . . . . . . . . . . . . . . . . . . . . . . . . . . .11
Latvia . . . . . . . . . . . . . . . . . . . . . . . . . . . . . . . . . . . . . . . . . . . . . . . . . . . . . . . . . . . . . . . .12
Lithuania . . . . . . . . . . . . . . . . . . . . . . . . . . . . . . . . . . . . . . . . . . . . . . . . . . . . . . . . . . . . . .13
Luxemburg . . . . . . . . . . . . . . . . . . . . . . . . . . . . . . . . . . . . . . . . . . . . . . . . . . . . . . . . . . . .14
Malta . . . . . . . . . . . . . . . . . . . . . . . . . . . . . . . . . . . . . . . . . . . . . . . . . . . . . . . . . . . . . . . .15
Netherlands/Holland . . . . . . . . . . . . . . . . . . . . . . . . . . . . . . . . . . . . . . . . . . . . . . . . . . . . .16
Poland . . . . . . . . . . . . . . . . . . . . . . . . . . . . . . . . . . . . . . . . . . . . . . . . . . . . . . . . . . . . . . . .17
Portugal . . . . . . . . . . . . . . . . . . . . . . . . . . . . . . . . . . . . . . . . . . . . . . . . . . . . . . . . . . . . . . .18
Slovakia . . . . . . . . . . . . . . . . . . . . . . . . . . . . . . . . . . . . . . . . . . . . . . . . . . . . . . . . . . . . . . .19
Slovenia . . . . . . . . . . . . . . . . . . . . . . . . . . . . . . . . . . . . . . . . . . . . . . . . . . . . . . . . . . . . . . .20
Finland . . . . . . . . . . . . . . . . . . . . . . . . . . . . . . . . . . . . . . . . . . . . . . . . . . . . . . . . . . . . . . .21
France . . . . . . . . . . . . . . . . . . . . . . . . . . . . . . . . . . . . . . . . . . . . . . . . . . . . . . . . . . . . . . . .22
Czech Republic . . . . . . . . . . . . . . . . . . . . . . . . . . . . . . . . . . . . . . . . . . . . . . . . . . . . . . . . .23
Sweden . . . . . . . . . . . . . . . . . . . . . . . . . . . . . . . . . . . . . . . . . . . . . . . . . . . . . . . . . . . . . . .24
Estonia . . . . . . . . . . . . . . . . . . . . . . . . . . . . . . . . . . . . . . . . . . . . . . . . . . . . . . . . . . . . . . .25
Other . . . . . . . . . . . . . . . . . . . . . . . . . . . . . . . . . .26 → END IF THIS IS THE ONLY ANSWER
Did not export to the EU last year . . . . . . . . . .27 → END
A2. WHAT PERCENT SHARE OF TOTAL SALES DO YOU EXPORT?Please specify __________ %
No answer
A3. WHAT PERCENT SHARE OF TOTAL EXPORTS DID YOU SUPPLY TO THE EU COUNTRIESLAST YEAR?:
Please write __________ %
No answer
A4. IN GENERAL, HOW LONG HAS YOUR COMPANY BEEN EXPORTING GOODS TO THE EUCOUNTRIES:
One answer
Less than 1 year . . . . . . . . . . . . . . . . . . . . . . . . . . . . . . . . . . . . . . . . . . . . . . . . . . . . . . . . .1
2-3 years . . . . . . . . . . . . . . . . . . . . . . . . . . . . . . . . . . . . . . . . . . . . . . . . . . . . . . . . . . . . . . .2
56
Jakubiak M., Maliszewska M., Orlova I., Rokicka M., Vavryschuk V.
CASE Reports No. 68
4-5 years . . . . . . . . . . . . . . . . . . . . . . . . . . . . . . . . . . . . . . . . . . . . . . . . . . . . . . . . . . . . . . .3
More than 5 years . . . . . . . . . . . . . . . . . . . . . . . . . . . . . . . . . . . . . . . . . . . . . . . . . . . . . . . .4
No answer . . . . . . . . . . . . . . . . . . . . . . . . . . . . . . . . . . . . . . . . . . . . . . . . . . . . . . . . . . . . .5
A5. DID YOU OBTAINE A RULE OF ORIGIN CERTIFICATE VALID IN EU MARKET ISSUEDBY THE CHAMBER OF COMMERCE LAST YEAR:
Yes . . . . . . . . . . . . . . . . . . . . . . . . . . . . . . . . . . . . . . . . . . . . . . . . . . . .1
No . . . . . . . . . . . . . . . . . . . . . . . . . . . . . . . . . . . . . . . . . . . . . . . . . . . . .2 → TOWARDS A10
Do not know/Do not know about this certificate . . . . . . . . . . . . . . . . . . .3 → TOWARDS A10
A6. HOW MANY TIMES DURING A YEAR DO YOU HAVE TO OBTAIN A RULE OF ORIGINCERTIFICATE?
Please write down _________________ times
A7. HOW MUCH ON AVARAGE DOES A RULE OF ORIGIN CERTIFICATE FOR ONEDELIVERY COST TO YOUR COMPANY?
Please write down _________________ UAH
A8. IN YOUR OPINION, HOW IMPORTANT ARE THE COSTS OF OBTAINING THE RULES OFORIGIN CERTIFICATE FOR YOUR COMPANY?
Not at all important . . . . . . . . . . . . . . . . . . . . . . . . . . . . . . . . . . . . . . . . . . . . . . . . . . . . . .1
Somewhat important . . . . . . . . . . . . . . . . . . . . . . . . . . . . . . . . . . . . . . . . . . . . . . . . . . . . .2
Important . . . . . . . . . . . . . . . . . . . . . . . . . . . . . . . . . . . . . . . . . . . . . . . . . . . . . . . . . . . . . .3
Very important . . . . . . . . . . . . . . . . . . . . . . . . . . . . . . . . . . . . . . . . . . . . . . . . . . . . . . . . . .4
Cannot say . . . . . . . . . . . . . . . . . . . . . . . . . . . . . . . . . . . . . . . . . . . . . . . . . . . . . . . . . . . . .5
A9. WHAT OBSTACLES DO YOU ENCOUNTER WHILE OBTAINING THE RULE OF ORIGINCERTIFICATE VALID ON THE EU MARKET:
Several answers
Time-consuming procedure . . . . . . . . . . . . . . . . . . . . . . . . . . . . . . . . . . . . . . . . . . . . . . . .1
Costly procedures . . . . . . . . . . . . . . . . . . . . . . . . . . . . . . . . . . . . . . . . . . . . . . . . . . . . . . . .2
Unclear or uncertain regulations . . . . . . . . . . . . . . . . . . . . . . . . . . . . . . . . . . . . . . . . . . . .3
Other PLEASE SPECIFY ___________ . . . . . . . . . . . . . . . . . . . . . . . . . . . . . . . . . . . . . . . . .4
Encountered no obstacles . . . . . . . . . . . . . . . . . . . . . . . . . . . . . . . . . . . . . . . . . . . . . . . . . .5
Cannot say . . . . . . . . . . . . . . . . . . . . . . . . . . . . . . . . . . . . . . . . . . . . . . . . . . . . . . . . . . . . .6
57
NON-TARIFF BARRIERS IN UKRAINIAN EXPORT TO THE EU
CASE Reports No. 68
RULES OF ORIGIN
A10. WHAT OBSTACLES DO YOU ENCOUNTER WHILE PASSING IMPORT CUSTOMSPROCEDURES IN THE EU COUNTRIES:
Several answers
Time-consuming procedure . . . . . . . . . . . . . . . . . . . . . . . . . . . . . . . . . . . . . . . . . . . . . . . .1
Costly procedures . . . . . . . . . . . . . . . . . . . . . . . . . . . . . . . . . . . . . . . . . . . . . . . . . . . . . . . .2
Unclear or uncertain regulations . . . . . . . . . . . . . . . . . . . . . . . . . . . . . . . . . . . . . . . . . . . .3
Other PLEASE SPECIFY ___________ . . . . . . . . . . . . . . . . . . . . . . . . . . . . . . . . . . . . . . . . .4
No problems encountered . . . . . . . . . . . . . . . . . . . . . . . . . . . . . . . . . . . . . . . . . . . . . . . . .5
Cannot say . . . . . . . . . . . . . . . . . . . . . . . . . . . . . . . . . . . . . . . . . . . . . . . . . . . . . . . . . . . . .6
A11. ASSUME THE VALUE OF YOUR EXPORTS TO THE EU IS 100%, WHAT SHARE OF YOURTOTAL EXPORT VALUE IS SPENT TO PASS IMPORT CUSTOMS PROCEDURES IN THEEU COUNTRIES?
Please write down _______________ %
A12. IN YOUR OPINION HOW IMPORTANT ARE THE COSTS OF PASSING IMPORT CUSTOMSPROCEDURES IN THE EU COUNTRIES?
Not at all important . . . . . . . . . . . . . . . . . . . . . . . . . . . . . . . . . . . . . . . . . . . . . . . . . . . . . .1
Somewhat important . . . . . . . . . . . . . . . . . . . . . . . . . . . . . . . . . . . . . . . . . . . . . . . . . . . . .2
Important . . . . . . . . . . . . . . . . . . . . . . . . . . . . . . . . . . . . . . . . . . . . . . . . . . . . . . . . . . . . . .3
Very important . . . . . . . . . . . . . . . . . . . . . . . . . . . . . . . . . . . . . . . . . . . . . . . . . . . . . . . . . .4
Cannot say . . . . . . . . . . . . . . . . . . . . . . . . . . . . . . . . . . . . . . . . . . . . . . . . . . . . . . . . . . . . .5
A13. HOW MUCH TIME ON AVERAGE DOES YOUR CARRIER SPEND AT THE BORDER WITHEU COUNTRIES WHEN EXPORTING GOODS?
Less than 24 hours . . . . . . . . . . . . . . . . . . . . . . . . . . . . . . . . . . . . . . . . . . . . . . . . . .1 → A15
24 hours . . . . . . . . . . . . . . . . . . . . . . . . . . . . . . . . . . . . . . . . . . . . . . . . . . . . . . . . . .2 → A15
More than 24 hours . . . . . . . . . . . . . . . . . . . . . . . . . . . . . . . . . . . . . . . . . . . . . . . . .3 → A14
A14. HOW MANY DAYS ON AVERAGE?
Please write down ______________________
58
Jakubiak M., Maliszewska M., Orlova I., Rokicka M., Vavryschuk V.
CASE Reports No. 68
CUSTOM PROCEDURES
A15. MUST YOUR COMPANY MEET DOMESTIC TECHNICAL REGULATIONS IN ORDER TOSELL IN DOMESTIC MARKET?
Do not read
Yes . . . . . . . . . . . . . . . . . . . . . . . . . . . . . . . . . . . . . . . . . . . . . . . . . . . . . . . . . . . . . . . . . . .1
No . . . . . . . . . . . . . . . . . . . . . . . . . . . . . . . . . . . . . . . . . . . . . . . . . . . . . . . . . . . . . . . . . . .2
Do not sell in domestic market . . . . . . . . . . . . . . . . . . . . . . . . . . . . . . . . . . . . . . . . . . . . . .3
Do not know . . . . . . . . . . . . . . . . . . . . . . . . . . . . . . . . . . . . . . . . . . . . . . . . . . . . . . . . . . . .4
A16. MUST YOUR COMPANY MEET DOMESTIC TECHNICAL REGULATIONS IN ORDER TOSELL IN THE EU MARKET?
Yes . . . . . . . . . . . . . . . . . . . . . . . . . . . . . . . . . . . . . . . . . . . . . . . . . . . . . . . . . . . . .1
No . . . . . . . . . . . . . . . . . . . . . . . . . . . . . . . . . . . . . . . . . . . . . . . . . . . . . . . . . . . . . . .2 → A30
Do not know . . . . . . . . . . . . . . . . . . . . . . . . . . . . . . . . . . . . . . . . . . . . . . . . . . . . . .3 → A30
A17. HOW EXPENSIVE IS THE COMPLIANCE WITH THE UKRAINE’S TECHNICALREGULATIONS COMPARED TO EU’S TECHNICAL REGULATIONS. COMPLIANCE WITHEU’S COUNTRIES TECHNICAL REGULATIONS:
Much more expensive . . . . . . . . . . . . . . . . . . . . . . . . . . . . . . . . . . . . . . . . . . . . . . . . . . . . .1
More expensive . . . . . . . . . . . . . . . . . . . . . . . . . . . . . . . . . . . . . . . . . . . . . . . . . . . . . . . . . .2
About the same . . . . . . . . . . . . . . . . . . . . . . . . . . . . . . . . . . . . . . . . . . . . . . . . . . . . . . . . . .3
Less expensive . . . . . . . . . . . . . . . . . . . . . . . . . . . . . . . . . . . . . . . . . . . . . . . . . . . . . . . . . .4
Much less expensive . . . . . . . . . . . . . . . . . . . . . . . . . . . . . . . . . . . . . . . . . . . . . . . . . . . . . .5
Cannot say . . . . . . . . . . . . . . . . . . . . . . . . . . . . . . . . . . . . . . . . . . . . . . . . . . . . . . . . . . . . .6
A18. WHAT TYPES OF TECHNICAL STANDARDS ARE THE MOST BURDENSOME ANDEXPENSIVE FOR YOUR COMPANY? STANDARDS WHICH RELATE TO:
Product quality . . . . . . . . . . . . . . . . . . . . . . . . . . . . . . . . . . . . . . . . . . . . . . . . . . . . . . . . . .1
Testing and certification . . . . . . . . . . . . . . . . . . . . . . . . . . . . . . . . . . . . . . . . . . . . . . . . . . .2
Consumer safety . . . . . . . . . . . . . . . . . . . . . . . . . . . . . . . . . . . . . . . . . . . . . . . . . . . . . . . . .3
Labeling and packaging . . . . . . . . . . . . . . . . . . . . . . . . . . . . . . . . . . . . . . . . . . . . . . . . . . .4
Environment protection . . . . . . . . . . . . . . . . . . . . . . . . . . . . . . . . . . . . . . . . . . . . . . . . . . .5
Other . . . . . . . . . . . . . . . . . . . . . . . . . . . . . . . . . . . . . . . . . . . . . . . . . . . . . . . . . . . . . . . . .6
Cannot say . . . . . . . . . . . . . . . . . . . . . . . . . . . . . . . . . . . . . . . . . . . . . . . . . . . . . . . . . . . . .7
59
NON-TARIFF BARRIERS IN UKRAINIAN EXPORT TO THE EU
CASE Reports No. 68
TECHNICAL REGULATIONS
A19. WHAT WAS THE APPROXIMATE COST OF MEETING THE EU TECHNICALREGULATIONS REQUIREMENTS AS A PERCENTAGE OF YOUR TOTAL PRODUCTIONCOSTS OVER THE LAST YEAR?
Please write down _________ %
A20. DO YOU HAVE DIFFICULTY IN OBTAINING INFORMATION ABOUT APPLICABLETECHNICAL REGULATIONS IN THE EU COUNTRIES? HOW WOULD YOU EVALUATETHE EASE OF ACCESS TO THE NECESSARY INFORMATION:
Easy . . . . . . . . . . . . . . . . . . . . . . . . . . . . . . . . . . . . . . . . . . . . . . . . . . . . . . . . . . . . . . . . . .1
Not very difficult . . . . . . . . . . . . . . . . . . . . . . . . . . . . . . . . . . . . . . . . . . . . . . . . . . . . . . . .2
Not very easy . . . . . . . . . . . . . . . . . . . . . . . . . . . . . . . . . . . . . . . . . . . . . . . . . . . . . . . . . . .3
Difficult . . . . . . . . . . . . . . . . . . . . . . . . . . . . . . . . . . . . . . . . . . . . . . . . . . . . . . . . . . . . . . .4
Information is not available . . . . . . . . . . . . . . . . . . . . . . . . . . . . . . . . . . . . . . . . . . . . . . . .5
Can not say . . . . . . . . . . . . . . . . . . . . . . . . . . . . . . . . . . . . . . . . . . . . . . . . . . . . . . . . . . . . .6
A21. WERE YOUR PRODUCTS TESTED FOR CONFORMITY WITH THE EU’S TECHNICALREGULATIONS IN UKRAINE OVER THE LAST YEAR?
Yes . . . . . . . . . . . . . . . . . . . . . . . . . . . . . . . . . . . . . . . . . . . . . . . . . . . . . . . . . . . . . . . . . . .1
No . . . . . . . . . . . . . . . . . . . . . . . . . . . . . . . . . . . . . . . . . . . . . . . . . . . . . . . . . .2 → go to A24
Do not know . . . . . . . . . . . . . . . . . . . . . . . . . . . . . . . . . . . . . . . . . . . . . . . . .3 → go to A24
A22. IN YOUR OPINION HOW IMPORTANT ARE THE COSTS OF TESTING FOR CONFORMITYWITH THE EU’S TECHNICAL REGULATIONS IN UKRAINE FOR YOUR COMPANY?
Not at all important . . . . . . . . . . . . . . . . . . . . . . . . . . . . . . . . . . . . . . . . . . . . . . . . . . . . . .1
Somewhat important . . . . . . . . . . . . . . . . . . . . . . . . . . . . . . . . . . . . . . . . . . . . . . . . . . . . .2
Important . . . . . . . . . . . . . . . . . . . . . . . . . . . . . . . . . . . . . . . . . . . . . . . . . . . . . . . . . . . . . .3
Very important . . . . . . . . . . . . . . . . . . . . . . . . . . . . . . . . . . . . . . . . . . . . . . . . . . . . . . . . . .4
Cannot say . . . . . . . . . . . . . . . . . . . . . . . . . . . . . . . . . . . . . . . . . . . . . . . . . . . . . . . . . . . . .5
A23. BASED ON YOUR EXPERIENCE, ARE TEST RESULTS AND CONFORMITY CERTIFICATESISSUED IN UKRAINE ACCEPTED BY CUSTOM BODIES OF THE EU COUNTIRES?
Always . . . . . . . . . . . . . . . . . . . . . . . . . . . . . . . . . . . . . . . . . . . . . . . . . . . . . . . . . . . . . . . .1
Sometimes . . . . . . . . . . . . . . . . . . . . . . . . . . . . . . . . . . . . . . . . . . . . . . . . . . . . . . . . . . . . .2
Never . . . . . . . . . . . . . . . . . . . . . . . . . . . . . . . . . . . . . . . . . . . . . . . . . . . . . . . . . . . . . . . . .3
Do not know . . . . . . . . . . . . . . . . . . . . . . . . . . . . . . . . . . . . . . . . . . . . . . . . . . . . . . . . . . . .4
60
Jakubiak M., Maliszewska M., Orlova I., Rokicka M., Vavryschuk V.
CASE Reports No. 68
TESTING FOR CONFORMITY WITH TECHNICAL REGULATIONS
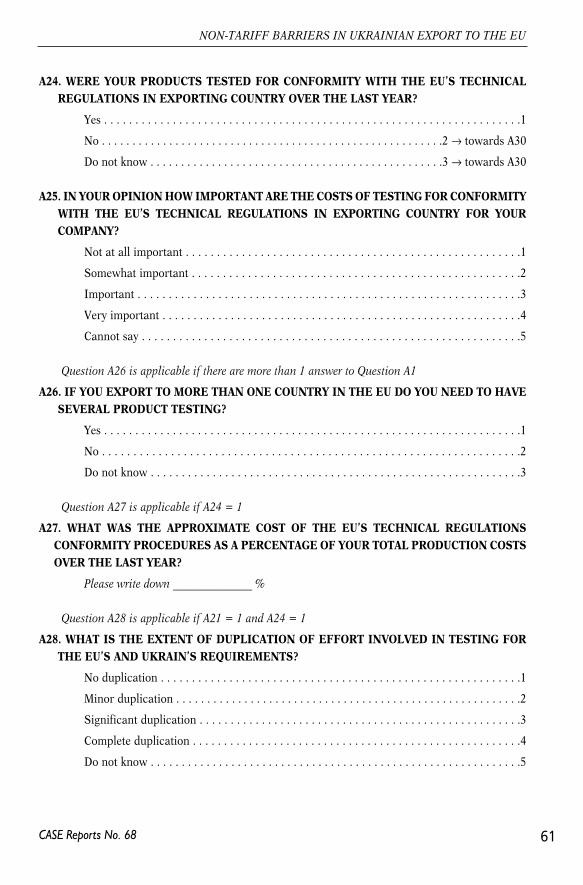
A24. WERE YOUR PRODUCTS TESTED FOR CONFORMITY WITH THE EU’S TECHNICALREGULATIONS IN EXPORTING COUNTRY OVER THE LAST YEAR?
Yes . . . . . . . . . . . . . . . . . . . . . . . . . . . . . . . . . . . . . . . . . . . . . . . . . . . . . . . . . . . . . . . . . . .1
No . . . . . . . . . . . . . . . . . . . . . . . . . . . . . . . . . . . . . . . . . . . . . . . . . . . . . . . .2 → towards A30
Do not know . . . . . . . . . . . . . . . . . . . . . . . . . . . . . . . . . . . . . . . . . . . . . . . .3 → towards A30
A25. IN YOUR OPINION HOW IMPORTANT ARE THE COSTS OF TESTING FOR CONFORMITYWITH THE EU’S TECHNICAL REGULATIONS IN EXPORTING COUNTRY FOR YOURCOMPANY?
Not at all important . . . . . . . . . . . . . . . . . . . . . . . . . . . . . . . . . . . . . . . . . . . . . . . . . . . . . .1
Somewhat important . . . . . . . . . . . . . . . . . . . . . . . . . . . . . . . . . . . . . . . . . . . . . . . . . . . . .2
Important . . . . . . . . . . . . . . . . . . . . . . . . . . . . . . . . . . . . . . . . . . . . . . . . . . . . . . . . . . . . . .3
Very important . . . . . . . . . . . . . . . . . . . . . . . . . . . . . . . . . . . . . . . . . . . . . . . . . . . . . . . . . .4
Cannot say . . . . . . . . . . . . . . . . . . . . . . . . . . . . . . . . . . . . . . . . . . . . . . . . . . . . . . . . . . . . .5
Question A26 is applicable if there are more than 1 answer to Question A1
A26. IF YOU EXPORT TO MORE THAN ONE COUNTRY IN THE EU DO YOU NEED TO HAVESEVERAL PRODUCT TESTING?
Yes . . . . . . . . . . . . . . . . . . . . . . . . . . . . . . . . . . . . . . . . . . . . . . . . . . . . . . . . . . . . . . . . . . .1
No . . . . . . . . . . . . . . . . . . . . . . . . . . . . . . . . . . . . . . . . . . . . . . . . . . . . . . . . . . . . . . . . . . .2
Do not know . . . . . . . . . . . . . . . . . . . . . . . . . . . . . . . . . . . . . . . . . . . . . . . . . . . . . . . . . . . .3
Question A27 is applicable if A24 = 1
A27. WHAT WAS THE APPROXIMATE COST OF THE EU’S TECHNICAL REGULATIONSCONFORMITY PROCEDURES AS A PERCENTAGE OF YOUR TOTAL PRODUCTION COSTSOVER THE LAST YEAR?
Please write down _______________ %
Question A28 is applicable if A21 = 1 and A24 = 1
A28. WHAT IS THE EXTENT OF DUPLICATION OF EFFORT INVOLVED IN TESTING FORTHE EU’S AND UKRAIN’S REQUIREMENTS?
No duplication . . . . . . . . . . . . . . . . . . . . . . . . . . . . . . . . . . . . . . . . . . . . . . . . . . . . . . . . . .1
Minor duplication . . . . . . . . . . . . . . . . . . . . . . . . . . . . . . . . . . . . . . . . . . . . . . . . . . . . . . . .2
Significant duplication . . . . . . . . . . . . . . . . . . . . . . . . . . . . . . . . . . . . . . . . . . . . . . . . . . . .3
Complete duplication . . . . . . . . . . . . . . . . . . . . . . . . . . . . . . . . . . . . . . . . . . . . . . . . . . . . .4
Do not know . . . . . . . . . . . . . . . . . . . . . . . . . . . . . . . . . . . . . . . . . . . . . . . . . . . . . . . . . . . .5
61
NON-TARIFF BARRIERS IN UKRAINIAN EXPORT TO THE EU
CASE Reports No. 68
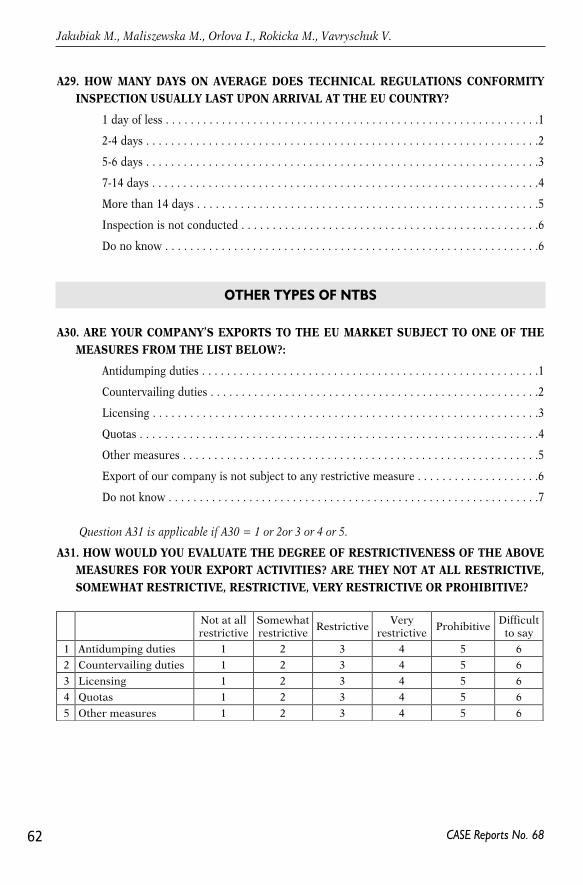
A29. HOW MANY DAYS ON AVERAGE DOES TECHNICAL REGULATIONS CONFORMITYINSPECTION USUALLY LAST UPON ARRIVAL AT THE EU COUNTRY?
1 day of less . . . . . . . . . . . . . . . . . . . . . . . . . . . . . . . . . . . . . . . . . . . . . . . . . . . . . . . . . . . .1
2-4 days . . . . . . . . . . . . . . . . . . . . . . . . . . . . . . . . . . . . . . . . . . . . . . . . . . . . . . . . . . . . . . .2
5-6 days . . . . . . . . . . . . . . . . . . . . . . . . . . . . . . . . . . . . . . . . . . . . . . . . . . . . . . . . . . . . . . .3
7-14 days . . . . . . . . . . . . . . . . . . . . . . . . . . . . . . . . . . . . . . . . . . . . . . . . . . . . . . . . . . . . . .4
More than 14 days . . . . . . . . . . . . . . . . . . . . . . . . . . . . . . . . . . . . . . . . . . . . . . . . . . . . . . .5
Inspection is not conducted . . . . . . . . . . . . . . . . . . . . . . . . . . . . . . . . . . . . . . . . . . . . . . . .6
Do no know . . . . . . . . . . . . . . . . . . . . . . . . . . . . . . . . . . . . . . . . . . . . . . . . . . . . . . . . . . . .6
A30. ARE YOUR COMPANY’S EXPORTS TO THE EU MARKET SUBJECT TO ONE OF THEMEASURES FROM THE LIST BELOW?:
Antidumping duties . . . . . . . . . . . . . . . . . . . . . . . . . . . . . . . . . . . . . . . . . . . . . . . . . . . . . .1
Countervailing duties . . . . . . . . . . . . . . . . . . . . . . . . . . . . . . . . . . . . . . . . . . . . . . . . . . . . .2
Licensing . . . . . . . . . . . . . . . . . . . . . . . . . . . . . . . . . . . . . . . . . . . . . . . . . . . . . . . . . . . . . .3
Quotas . . . . . . . . . . . . . . . . . . . . . . . . . . . . . . . . . . . . . . . . . . . . . . . . . . . . . . . . . . . . . . . .4
Other measures . . . . . . . . . . . . . . . . . . . . . . . . . . . . . . . . . . . . . . . . . . . . . . . . . . . . . . . . .5
Export of our company is not subject to any restrictive measure . . . . . . . . . . . . . . . . . . . .6
Do not know . . . . . . . . . . . . . . . . . . . . . . . . . . . . . . . . . . . . . . . . . . . . . . . . . . . . . . . . . . . .7
Question A31 is applicable if A30 = 1 or 2or 3 or 4 or 5.
A31. HOW WOULD YOU EVALUATE THE DEGREE OF RESTRICTIVENESS OF THE ABOVEMEASURES FOR YOUR EXPORT ACTIVITIES? ARE THEY NOT AT ALL RESTRICTIVE,SOMEWHAT RESTRICTIVE, RESTRICTIVE, VERY RESTRICTIVE OR PROHIBITIVE?
62
Jakubiak M., Maliszewska M., Orlova I., Rokicka M., Vavryschuk V.
CASE Reports No. 68
OTHER TYPES OF NTBS
Not at allrestrictive
Somewhatrestrictive
RestrictiveVery
restrictiveProhibitive
Difficultto say
1 Antidumping duties 1 2 3 4 5 62 Countervailing duties 1 2 3 4 5 63 Licensing 1 2 3 4 5 64 Quotas 1 2 3 4 5 6
5 Other measures 1 2 3 4 5 6
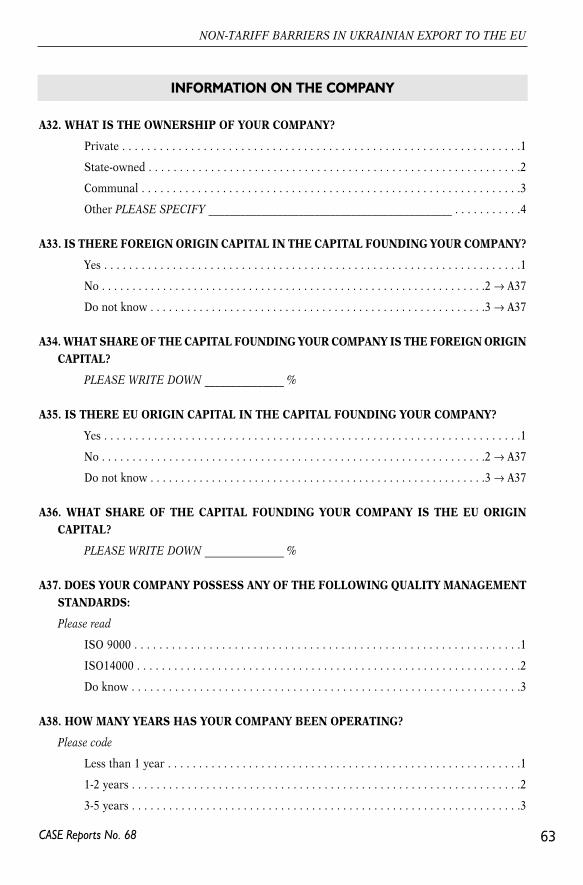
A32. WHAT IS THE OWNERSHIP OF YOUR COMPANY?
Private . . . . . . . . . . . . . . . . . . . . . . . . . . . . . . . . . . . . . . . . . . . . . . . . . . . . . . . . . . . . . . . .1
State-owned . . . . . . . . . . . . . . . . . . . . . . . . . . . . . . . . . . . . . . . . . . . . . . . . . . . . . . . . . . . .2
Communal . . . . . . . . . . . . . . . . . . . . . . . . . . . . . . . . . . . . . . . . . . . . . . . . . . . . . . . . . . . . .3
Other PLEASE SPECIFY ______________________________________________ . . . . . . . . . . .4
A33. IS THERE FOREIGN ORIGIN CAPITAL IN THE CAPITAL FOUNDING YOUR COMPANY?
Yes . . . . . . . . . . . . . . . . . . . . . . . . . . . . . . . . . . . . . . . . . . . . . . . . . . . . . . . . . . . . . . . . . . .1
No . . . . . . . . . . . . . . . . . . . . . . . . . . . . . . . . . . . . . . . . . . . . . . . . . . . . . . . . . . . . . . .2 → A37
Do not know . . . . . . . . . . . . . . . . . . . . . . . . . . . . . . . . . . . . . . . . . . . . . . . . . . . . . . .3 → A37
A34. WHAT SHARE OF THE CAPITAL FOUNDING YOUR COMPANY IS THE FOREIGN ORIGINCAPITAL?
PLEASE WRITE DOWN _______________ %
A35. IS THERE EU ORIGIN CAPITAL IN THE CAPITAL FOUNDING YOUR COMPANY?
Yes . . . . . . . . . . . . . . . . . . . . . . . . . . . . . . . . . . . . . . . . . . . . . . . . . . . . . . . . . . . . . . . . . . .1
No . . . . . . . . . . . . . . . . . . . . . . . . . . . . . . . . . . . . . . . . . . . . . . . . . . . . . . . . . . . . . . .2 → A37
Do not know . . . . . . . . . . . . . . . . . . . . . . . . . . . . . . . . . . . . . . . . . . . . . . . . . . . . . . .3 → A37
A36. WHAT SHARE OF THE CAPITAL FOUNDING YOUR COMPANY IS THE EU ORIGINCAPITAL?
PLEASE WRITE DOWN _______________ %
A37. DOES YOUR COMPANY POSSESS ANY OF THE FOLLOWING QUALITY MANAGEMENTSTANDARDS:
Please read
ISO 9000 . . . . . . . . . . . . . . . . . . . . . . . . . . . . . . . . . . . . . . . . . . . . . . . . . . . . . . . . . . . . . .1
ISO14000 . . . . . . . . . . . . . . . . . . . . . . . . . . . . . . . . . . . . . . . . . . . . . . . . . . . . . . . . . . . . . .2
Do know . . . . . . . . . . . . . . . . . . . . . . . . . . . . . . . . . . . . . . . . . . . . . . . . . . . . . . . . . . . . . . .3
A38. HOW MANY YEARS HAS YOUR COMPANY BEEN OPERATING?
Please code
Less than 1 year . . . . . . . . . . . . . . . . . . . . . . . . . . . . . . . . . . . . . . . . . . . . . . . . . . . . . . . . .1
1-2 years . . . . . . . . . . . . . . . . . . . . . . . . . . . . . . . . . . . . . . . . . . . . . . . . . . . . . . . . . . . . . . .2
3-5 years . . . . . . . . . . . . . . . . . . . . . . . . . . . . . . . . . . . . . . . . . . . . . . . . . . . . . . . . . . . . . . .3
63
NON-TARIFF BARRIERS IN UKRAINIAN EXPORT TO THE EU
CASE Reports No. 68
INFORMATION ON THE COMPANY
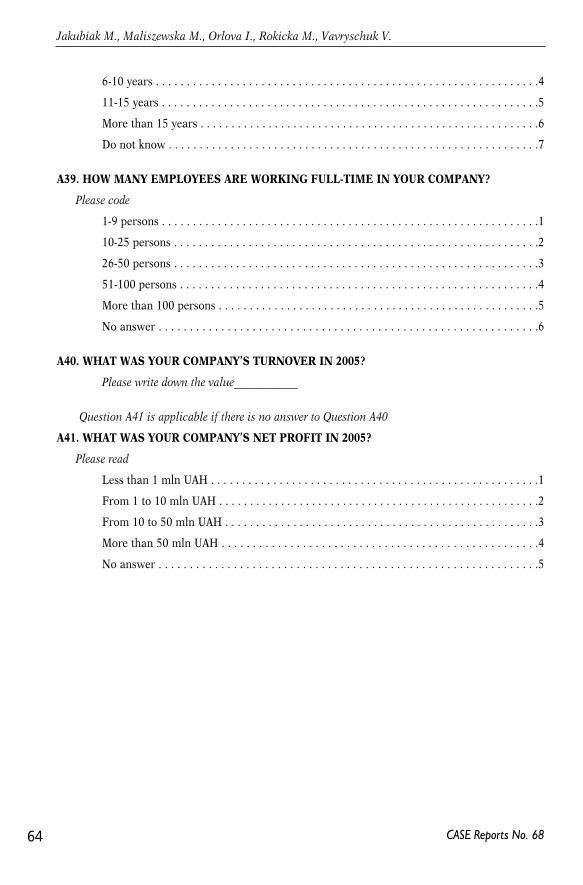
6-10 years . . . . . . . . . . . . . . . . . . . . . . . . . . . . . . . . . . . . . . . . . . . . . . . . . . . . . . . . . . . . . .4
11-15 years . . . . . . . . . . . . . . . . . . . . . . . . . . . . . . . . . . . . . . . . . . . . . . . . . . . . . . . . . . . . .5
More than 15 years . . . . . . . . . . . . . . . . . . . . . . . . . . . . . . . . . . . . . . . . . . . . . . . . . . . . . . .6
Do not know . . . . . . . . . . . . . . . . . . . . . . . . . . . . . . . . . . . . . . . . . . . . . . . . . . . . . . . . . . . .7
A39. HOW MANY EMPLOYEES ARE WORKING FULL-TIME IN YOUR COMPANY?
Please code
1-9 persons . . . . . . . . . . . . . . . . . . . . . . . . . . . . . . . . . . . . . . . . . . . . . . . . . . . . . . . . . . . . .1
10-25 persons . . . . . . . . . . . . . . . . . . . . . . . . . . . . . . . . . . . . . . . . . . . . . . . . . . . . . . . . . . .2
26-50 persons . . . . . . . . . . . . . . . . . . . . . . . . . . . . . . . . . . . . . . . . . . . . . . . . . . . . . . . . . . .3
51-100 persons . . . . . . . . . . . . . . . . . . . . . . . . . . . . . . . . . . . . . . . . . . . . . . . . . . . . . . . . . .4
More than 100 persons . . . . . . . . . . . . . . . . . . . . . . . . . . . . . . . . . . . . . . . . . . . . . . . . . . . .5
No answer . . . . . . . . . . . . . . . . . . . . . . . . . . . . . . . . . . . . . . . . . . . . . . . . . . . . . . . . . . . . .6
A40. WHAT WAS YOUR COMPANY’S TURNOVER IN 2005?
Please write down the value____________
Question A41 is applicable if there is no answer to Question A40
A41. WHAT WAS YOUR COMPANY’S NET PROFIT IN 2005?
Please read
Less than 1 mln UAH . . . . . . . . . . . . . . . . . . . . . . . . . . . . . . . . . . . . . . . . . . . . . . . . . . . . .1
From 1 to 10 mln UAH . . . . . . . . . . . . . . . . . . . . . . . . . . . . . . . . . . . . . . . . . . . . . . . . . . . .2
From 10 to 50 mln UAH . . . . . . . . . . . . . . . . . . . . . . . . . . . . . . . . . . . . . . . . . . . . . . . . . . .3
More than 50 mln UAH . . . . . . . . . . . . . . . . . . . . . . . . . . . . . . . . . . . . . . . . . . . . . . . . . . .4
No answer . . . . . . . . . . . . . . . . . . . . . . . . . . . . . . . . . . . . . . . . . . . . . . . . . . . . . . . . . . . . .5
64
Jakubiak M., Maliszewska M., Orlova I., Rokicka M., Vavryschuk V.
CASE Reports No. 68
List of Tables
Table 1. Trading Across Borders in Ukraine in 2006 (1) 17
Table 2. Trading Across Borders in Ukraine in 2006 (2) 18
Table 3. Distribution of firms by size and ownership, survey results 26
Table 4. Other NTBs, survey results 47
List of Figures
Figure 1. Ukraine's trade with the EU (USD billion), 1996-2005 15
Figure 2. Share of production exported, survey results 27
Figure 3. Export destination markets of surveyed companies vs. geographical
breakdown of Ukrainian export to the EU in 2005 28
Figure 4. Length of trade relations, survey results 28
Figure 5. Share of companies certifying origin of their export, survey results 30
Figure 6. Perceptions about costs of certifying origin, survey results 31
Figure 7. Obstacles while obtaining certificates of origin, survey results 32
Figure 8. Assessment of EU customs procedures, survey results 33
Figure 9. Border waiting times, survey results 34
Figure 10. Perception of costs of customs clearance, survey results 34
Figure 11. Average costs of customs clearance, in percent of export value,
survey results 35
Figure 12. Number of days needed to complete overseas sales in 2006 36
Figure 13. Share of firms that have to comply with technical regulations in order
to sell in the market, by size and type of ownership, survey results 37
Figure 14. Cost of compliance with EU's technical regulations compared to observing
Ukrainian technical regulations, by size and type of ownership, survey results 38
Figure 15. Cost of compliance with EU's technical regulations compared to technical
regulations in Ukraine, by type of exported commodity, survey results 38
Figure 16. Types of technical standard which impede exports to the EU market
(% of companies that mentioned specific type of standard) (1), survey results 39
Figure 17. Types of technical standard which impede exports to the EU market,
% of companies that mentioned specific type of standard (2), survey results 39
Figure 18. Percentage of total year production costs spent in order to ensure
products compliance with the EU norms, by size and type of ownership,
survey results 40
Figure 19. Percentage of total year production costs spent in order to ensure products
compliance with the EU norms (breakdown by type of exported commodities),
survey results 41
65CASE Reports No. 68
NON-TARIFF BARRIERS IN UKRAINIAN EXPORT TO THE EU
Figure 20. Percentage of total year production costs spent in order to ensure
products compliance with the EU norms, by age of company, survey results 41
Figure 21. Ease of access to information about EU technical norms
(share of companies in sub-sample), survey results 42
Figure 22. Share of companies that had to pass testing and certification
of the production in the Ukrainian and the EU markets, survey results 43
Figure 23. Acknowledgement of the Ukrainian testing results by the EU authorities,
survey results 43
Figure 24. Costs of testing and certification for conformity with the EU standards,
survey results 44
Figure 25. Costs of testing and certification for conformity with the EU standards,
in percent of yearly production costs, survey results 45
Figure 26. Duplication of efforts involved in testing for domestic and EU technical
requirements, survey results 45
Figure 27. Share of companies that had to pass testing in more than one EU country,
survey results 46
Figure 28. Number of days necessary to pass product inspection upon arrival
to the EU country, survey results 46
66
Jakubiak M., Maliszewska M., Orlova I., Rokicka M., Vavryschuk V.
CASE Reports No. 68
BIZPRO (2005a), Export Activities of Ukrainian Companies, at www.bizpro.com.ua
BIZPRO (2005b), Small and Medium-Sized Enterprises in Ukraine: Performance Indicators and
Strategies for Development, at www.bizpro.com.ua
Brenton P., Sheehy J., Vancauteren M. (2000), Technical Barriers to Trade in the European Union:
Importance for Accession Countries, CEPS Working Document No. 144, April 2000
CEC (1998), Technical barriers to Trade, Single Market Review, CEC, 1998
Cecchini, P., (1988), The European Challenge, Commission of the European Communities, Gower
Press, Brookfield
Chevassus-Lozza E., Majkovic D., Persillet V., Unguru M.(2004), Technical barriers to Trade in the
European Union: Importance for the new EU members. An assessment for agricultural and food
products. Paper prepared for EAAE conference, August 2005
Cottier T., Bürgi E., Wüger D., Foltea M. (2004), Helping to tackle non-tariff barriers in South Eastern
Europe (SEE). EC-SECO Final Recommendations and NTBs Lists, World Trade Institute Berne.
Council of the European Union (2000), Council Decision ą 2005/196/EC of 21 February 2005 on the
signing and provisional application of the agreement in the form of an Exchange of Letters
between the European Community and Ukraine concerning the extension and amendment of the
Agreement between the European Community and Ukraine on trade in textile products.
Emerson, M., M. Aujean, M. Catinat, P. Goybet and A. Jacquemin (1988) The Economics of 1992,
Oxford University Press, Oxford.
European Commission (2005a), EU/Ukraine Action Plan at:
http://ec.europa.eu/world/enp/pdf/action_plans/ukraine_enp_ap_final_en.pdf
European Commission (2005b), Trade Issues: Sectoral Issues, Steel sector, information at
http://ec.europa.eu/trade/issues/sectoral/industry/steel/index_en.htm
European Commission (2004), Steel: EU concludes steel agreement with Ukraine, press release No.
IP/04/786, date 23/06/2004, at www.europa.eu
European Commission (1998a), Report of 13 May 1998 from the Commission to the Council and
Parliament: Efficiency and Accountability in European Standardisation under the New Approach
final – (Not published in the Official Journal)
European Commission (1998b), Partnership and co-operation agreement between the European
Communities and their member states, and Ukraine at:
http://ec.europa.eu/comm/external_relations/ukraine/intro/index.htm
67CASE Reports No. 68
References
FEMISE, FEM 22-03 (2005), Comparative analysis of importance of technical barriers to trade (TBT)
for Central and Eastern European Countries’ and Mediterranean Partner Countries’ exports to the
EU, FEMISE Research Programme, September 2005
Hagemejer J., Michałek J. (2004), The Significance of Technical Barriers to Trade for Poland and other
CEEC’s Acceding to the EU: Reconsidering the Evidence in: EMERGO: Journal of transforming
economies and societies, pp. 36-52, vol. XI, no. 1(39).
Jakubiak, M., Kolesnichenko, A. (eds.) (2006), Prospects for EU-Ukraine Economic Relations, CASE
Report No. 66, at www.case.com.pl
Kamiński, B.(1999), The role of Foreign Direct Investment and Trade Policies in Poland’ Accession to
the European Union, World Bank Technical Paper no 442
Kyiv Weekly (2006), Interview by Ian Boag, Ambassador, Head of the Delegation of the European
Commission to Ukraine and Belarus, available at:
http://www.delukr.ec.europa.eu/page41757.html
Maskus, K. E., John S. Wilson, Tsunehiro Otsuki (2000), Quantifying the Impact of Technical Barriers
to Trade, World Bank Policy Research Working Paper no 2512.
Michalek, J.J. (ed) (2005), Comparative analysis of importance of technical barriers to trade (TBT) for
Central and Eastern European Countries’ and Mediterranean Partner Countries’ exports to the EU,
FEMISE Research Network, Research n°FEM22-03, at www.femise.org
OECD (2003), Overview of non-tariff barriers: findings from existing business surveys, Working party
of the Trade Committee, TD/TC/WP(2002)38.
Wilson, J. S. and T. Otsuki (2004). Standards and Technical Regulations and Firms in Developing
Countries: New Evidence from A World Bank Technical Barriers to Trade Survey. The World Bank. At:
http://web.worldbank.org/WBSITE/EXTERNAL/TOPICS/TRADE/0,,contentMDK:20234189~
menuPK:222955~pagePK:148956~piPK:216618~theSitePK:239071,00.html
World Bank (2004). Ukraine Trade Policy Study, available at www.worldbank.org.ua
World Bank (2006). Costs of Doing Business Database, at www.doingbusiness.org
68
Jakubiak M., Maliszewska M., Orlova I., Rokicka M., Vavryschuk V.
CASE Reports No. 68