Embed Size (px)
Citation preview

Group 6_Zircon:
Jerry Jose – 1420414
Rajat Kumar Mehta N. – 1420421
Rohit S.B. - 1420423
Saquib Anwer – 1420428
Debleena Bose – 1420440
Deepti N Mitty – 1420442
Allen Rossairo Antony - 1420403

•
•
•
•

•
•
•
•
•
•

•
•
•
•
•
•

•
•
•
•
•
•

Basis of Comparison Germany India
Continent Europe Asia
Primary Language German Hindi
Currency Euro Indian Rupee
Capital City Berlin New Delhi
Government Type Federal Republic Constitutional, Federal &
Republic
Legislature size 667 790
Voting Age 18 18
OECD member Yes Yes
UN member Yes Yes
GINI Co – efficient 27 36.8
Population 81.3 Million 1.22 Billion
Median Age 45.3 years old 26.7 years old
Average Sex Ratio 0.97 males per female 1.08 males per female
Literacy Rate 99% 62.8%
Source: http://country-facts.findthebest.com/compare/29-122/Germany-vs-India

Basis of Comparison Germany India
Life Expectancy 83.2 years 67 years
Central Bank Deutsche Bundesbank Reserve Bank of India
Net Migration Rate 0.71 per 1000 people -0.05 per 1000 people
Infant Mortality Rate 3.48 deaths/1000 children 44.6 deaths/1000 children
Military spending % of GDP 1.4% 1.8%
Trade % of GDP 97.57% 55.36%
Public debt % of GDP 81% 50%
Inflation 2.1% 9.3%
Current Account Balance $204 Billion $-46.9 Billion
Source: http://country-facts.findthebest.com/compare/29-122/Germany-vs-India

Basis of Comparison Germany India
Budget – Revenues $1.53 trillion ( Ranked 4th, 9
times more than India)
$172.10 Billion (Ranked 23rd)
Exports $1.46 trillion (Ranked 3rd, 5
times more than India)
$301.90 Billion (Ranked 19th)
Fiscal Year Calendar Year Financial Year
GDP $3.40 trillion (Ranked 5th, 85%
more than India
$1.84 trillion (Ranked 11th)
Industrial growth % of GDP 28.1% (Ranked 92nd, 56%
more than India)
18% (Ranked 169th)
GDP – Per Capita $34065, 12 per Capita
(Ranked 22nd, 13 times more
than India
$2625.09 per Capita (Ranked
130th)
GDP – Per Capita in terms of
PPP
$38700.00 (Ranked 17th, 10
times more than India)
$3800.00 (Ranked 132nd)
Source: http://www.nationmaster.com/country-info/compare/Germany/India/Economy

Basis of Comparison Germany India
GDP – Purchasing Power
Parity
$3.17 trillion (Ranked 5th) $4.72 trillion (Ranked 3rd, 49%
more than Germany)
GDP – Real Growth Rate 0.9% (Ranked 142nd) 3.2% (Ranked 96th, 4 times
more than Germany)
GDP per Capita in real terms $41,514.17 billion (Ranked
18th, 28 times more than
India)
$1489.24 billion (Ranked 135th)
Gross National Income $1.94 trillion (Ranked 3rd, 4
times more than India)
$477.00 billion (Ranked 12th)
Population below poverty line 15.5% (Ranked 33th) 29.8% (Ranked 19th, 92% more
than Germany)
Public debt 81% of GDP (Ranked 27th, 57%
more than India)
51.7% of GDP (Ranked 61st)
Unemployment Rate 5.5% (Ranked 81st) 8.5% (Ranked 46th, 55% more
than Germany)
Source: http://www.nationmaster.com/country-info/compare/Germany/India/Economy

Basis of Comparison Germany India
Expenditures $1.53 trillion (Ranked 4th, 6
times more than India)
$263.80 billion (Ranked 17th)
GDP Deflator 105.03 (Ranked 161st) 125.5 (Ranked 121st, 19%
more than Germany)
Government Spending $398.05 billion(Ranked 4th, 4
times more than India)
$98.9 billion (Ranked 13th)
Expenditures per Capita $18538.24 (Ranked 12th, 87
times more than India)
$213.50 (Ranked 121st)
Expenditures % of GDP 46.16% (Ranked 21st, 3 times
more than India)
15.04% (Ranked 137th)
Source: http://www.nationmaster.com/country-info/compare/Germany/India/Economy
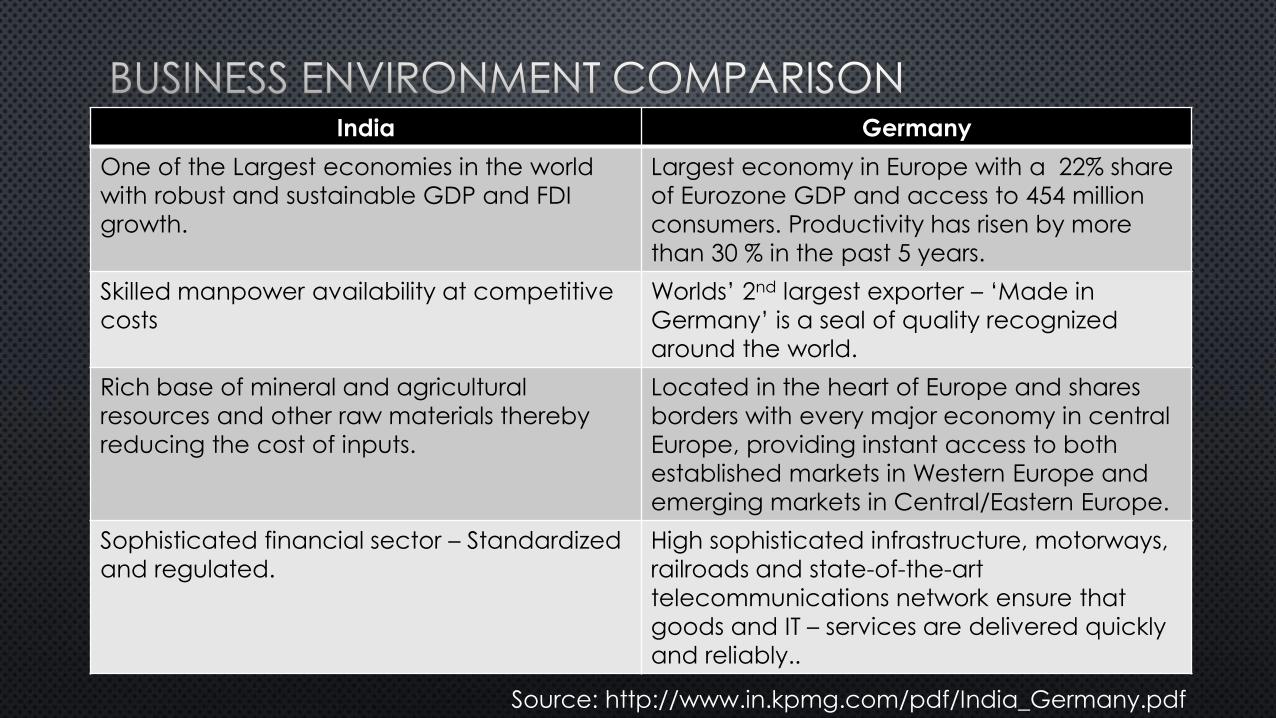
India Germany
One of the Largest economies in the world
with robust and sustainable GDP and FDI
growth.
Largest economy in Europe with a 22% share
of Eurozone GDP and access to 454 million
consumers. Productivity has risen by more
than 30 % in the past 5 years.
Skilled manpower availability at competitive
costs
Worlds’ 2nd largest exporter – ‘Made in
Germany’ is a seal of quality recognized
around the world.
Rich base of mineral and agricultural
resources and other raw materials thereby
reducing the cost of inputs.
Located in the heart of Europe and shares
borders with every major economy in central
Europe, providing instant access to both
established markets in Western Europe and
emerging markets in Central/Eastern Europe.
Sophisticated financial sector – Standardized
and regulated.
High sophisticated infrastructure, motorways,
railroads and state-of-the-art
telecommunications network ensure that
goods and IT – services are delivered quickly
and reliably..
Source: http://www.in.kpmg.com/pdf/India_Germany.pdf

India Germany
Government’s proven commitment to the
deregulation process, lifting up of import
duties and tax curbs.
Most Innovative nation in Europe (more than
20% of European patents are held by
Germans.
Well balanced packages of fiscal incentives International capital market, a liberal and
stable social market and financial services
are its distinct advantages.
Strategic trade location – access to the vast
domestic and South Asian market.
Over 22,000 foreign companies operate in
Germany, employing in excess of 2.1 million
staff, generating trillion of euros in turnover.
English widely spoken and understood World class manufacturing center for
Automobiles (Audit, BMW, Mercedes – Benz,
Porsche,, Volkswagen etc.)
Growing consumerism, with increasing
affluent and growing middle income
class/groups.
The WEF ranks Germany 3rd in its Business
Competitiveness Index.
Source: http://www.in.kpmg.com/pdf/India_Germany.pdf

Gross Domestic Product
8.1
5.5
9.6 9.4 9.6
5.8
7.7
9.2
6
4.44.7
0.2 0.1
1.6
4.3
1.6
-0.2
-1.3
3.8
1.6
-0.3
1.0
-2
0
2
4
6
8
10
12
2003 2004 2005 2006 2007 2008 2009 2010 2011 2012 2013
Annual GDP Growth %
India Germany
617.6721.6
834.2949.1
1238.7 1224.11365.4
1710.91880.1 1858.7 1876.8
2423.8
2726.3 2766.32902.8
3323.8
3623.7
3298.2 3304.44
3628.11
3425.95
3634.82
0
500
1000
1500
2000
2500
3000
3500
4000
2002 2004 2006 2008 2010 2012 2014
GDP in Amount $ Bn
India Germany

Inflation
0.47
3.48
5.16
3.23.72 3.78
5.57
6.53
5.51
9.7
14.97
9.47
6.49
11.17
9.13
0
2
4
6
8
10
12
14
16
1999 2000 2001 2002 2003 2004 2005 2006 2007 2008 2009 2010 2011 2012 2013
India - Inflation: percent change in the Consumer Price Index
1.19
2
1.61
1.14 1.12
2.22
1.41 1.39
3.17
1.13
0.81
1.31
1.98 2.04
1.43
0
0.5
1
1.5
2
2.5
3
3.5
1999 2000 2001 2002 2003 2004 2005 2006 2007 2008 2009 2010 2011 2012 2013
Germany - Inflation: percent change in the Consumer Price Index

Exchange Rate
45.25 44.50 46.25 44.75
40.00
47.00 46.80 46.50
53.00 55.00
63.00
1.26 1.33 1.18 1.33 1.45 1.25 1.43 1.35 1.30 1.32 1.37
-
10.00
20.00
30.00
40.00
50.00
60.00
70.00
2002 2004 2006 2008 2010 2012 2014
Exchange Rate
Rupee vs $ EURO vs $

Unemployment Rate
8.35 8.35 8.35 8.00
8.00
9.40 9.40 9.40
6.30
5.20
5.10
10.40 10.80
11.10
9.60
8.30
7.50 7.40
6.60
5.60 5.40 5.10
-
2.00
4.00
6.00
8.00
10.00
12.00
2003 2004 2005 2006 2007 2008 2009 2010 2011 2012 2013
Unemployment Rate in %
India Germany

Budget Revenues
(6,000.00)
(5,000.00)
(4,000.00)
(3,000.00)
(2,000.00)
(1,000.00)
-
2003 2004 2005 2006 2007 2008 2009 2010 2011 2012 2013
India - Budget revenues in $ Bn
(35.00)
(30.00)
(25.00)
(20.00)
(15.00)
(10.00)
(5.00)
-
5.00
10.00
15.00
20.00
2003 2004 2005 2006 2007 2008 2009 2010 2011 2012 2013
Germany - Budget revenues in EUR bn

Government Debt to GDP
84.3 84.06 81.7678.49
75.44 74.72
72.567.5 66.7 66.6 67.72
63.9 65.7 68 67.664.9 66.8
74.580.3
77.6 79 76.9
0
10
20
30
40
50
60
70
80
90
2002 2004 2006 2008 2010 2012 2014
Government Debt to GDP
India Germany

Sector Wise Contribution to GDP
17.30%
25.80%56.90%
India - Sector wise contribution to GDP
Agriculture
Manufacturing
Services
0.80%
30.20%
69%
Germany - Sector wise contribution to GDP
Agriculture
Manufacturing
Services

•
•
•
•
•
•
•

•
•

• WWW.GOOGLE.COM
• HTTP://WWW.AAII.COM/INVESTING-BASICS/ARTICLE/THE-TOP-10-ECONOMIC-INDICATORS-WHAT-TO-WATCH-AND-WHY
• HTTP://WWW.INVESTOPEDIA.COM/TERMS/E/ECONOMIC_INDICATOR.ASP
• HTTP://WWW.MARKETS.COM/EDUCATION/FUNDAMENTAL-ANALYSIS/MAIN-ECONOMIC-INDICATORS.HTML
• HTTP://WWW.INFLATION.EU/INFLATION-RATES
• HTTP://WWW.TRADINGECONOMICS.COM/INDIA/GDP-GROWTH-ANNUAL
• HTTPS://WWW.CIA.GOV/LIBRARY/PUBLICATIONS/THE-WORLD-FACTBOOK/FIELDS/2012.HTML
• HTTP://WWW.ALLBANKINGSOLUTIONS.COM/BANKING-TUTOR/CHRONOLOGY-REPO-RATE-INDIA.SHT