Embed Size (px)
Citation preview
Q1QUARTERLY REPORT 2004
Cautionary statement regarding forward-looking informationThis Quarterly Report contains statements that constitute forward-looking statements. In addition, in the future we, and others on our behalf, may make statements thatconstitute forward-looking statements. Such forward-looking statements may include, without limitation, statements relating to our plans, objectives or goals; our futureeconomic performance or prospects; the potential effect on our future performance of certain contingencies; and assumptions underlying any such statements.
Words such as "believes," "anticipates," "expects," "intends" and "plans" and similar expressions are intended to identify forward-looking statements but are not theexclusive means of identifying such statements. We do not intend to update these forward-looking statements except as may be required by applicable laws.
By their very nature, forward-looking statements involve inherent risks and uncertainties, both general and specific, and risks exist that predictions, forecasts,projections and other outcomes described or implied in forward-looking statements will not be achieved. We caution you that a number of important factors could causeresults to differ materially from the plans, objectives, expectations, estimates and intentions expressed in such forward-looking statements. These factors include (i)market and interest rate fluctuations; (ii) the strength of the global economy in general and the strength of the economies of the countries in which we conduct ouroperations in particular; (iii) the ability of counterparties to meet their obligations to us; (iv) the effects of, and changes in, fiscal, monetary, trade and tax policies, andcurrency fluctuations; (v) political and social developments, including war, civil unrest or terrorist activity; (vi) the possibility of foreign exchange controls, expropriation,nationalization or confiscation of assets in countries in which we conduct our operations; (vii) the ability to maintain sufficient liquidity and access capital markets; (viii)operational factors such as systems failure, human error, or the failure to properly implement procedures; (ix) actions taken by regulators with respect to our business andpractices in one or more of the countries in which we conduct our operations; (x) the effects of changes in laws, regulations or accounting policies or practices; (xi)competition in geographic and business areas in which we conduct our operations; (xii) the ability to retain and recruit qualified personnel; (xiii) the ability to maintain ourreputation and promote our brands; (xiv) the ability to increase market share and control expenses; (xv) technological changes; (xvi) the timely development andacceptance of our new products and services and the perceived overall value of these products and services by users; (xvii) acquisitions, including the ability to integratesuccessfully acquired businesses; (xviii) the adverse resolution of litigation and other contingencies; and (xix) our success at managing the risks involved in the foregoing.
We caution you that the foregoing list of important factors is not exclusive; when evaluating forward-looking statements, you should carefully consider the foregoingfactors and other uncertainties and events, as well as the risks identified in our most recently filed Form 20-F and reports on Form 6-K furnished to the US Securitiesand Exchange Commission.
1 Editorial
2 Credit Suisse Group financial highlights Q1/2004
3 An overview of Credit Suisse Group
7 Risk management
12 Review of business units12 Credit Suisse Financial Services22 Credit Suisse First Boston
32 Condensed consolidated financial information32 Consolidated statements of income (unaudited)33 Consolidated balance sheets (unaudited)34 Consolidated changes in shareholders’ equity (unaudited)
35 Notes to the condensed consolidated financial information
44 Information for investors
Credit Suisse Group is a leading global financial services company headquartered in Zurich.
The business unit Credit Suisse Financial Services provides private clients and small and medium-sized
companies with private banking and financial advisory services, banking products, and pension and
insurance solutions from Winterthur. The business unit Credit Suisse First Boston, an investment bank,
serves global institutional, corporate, government and individual clients in its role as a financial intermediary.
Credit Suisse Group’s registered shares (CSGN) are listed in Switzerland and in the form of American
Depositary Shares (CSR) in New York. The Group employs around 60,000 staff worldwide.
www.credit-suisse.com 1
EDITORIAL
Dear shareholders, clients and colleagues
Credit Suisse Group reported net income of CHF 1.9billion in the first quarter of 2004. This positive result wasdriven primarily by increased revenues across allbusinesses, improved economic conditions and thecontinued focus on cost efficiency. The Group’s businessunits clearly demonstrated the strength of their clientfranchise, product innovation and operating leverage –meaning their ability to generate higher revenues withouta corresponding increase in costs.
Credit Suisse Financial Services achieved one of itsbest quarterly results ever, with net income of CHF 1.1billion in the first quarter of 2004, mainly reflecting higherrevenues as well as continued cost discipline. All foursegments reported very good net income, with aparticularly strong performance at Private Banking, whichachieved net income of CHF 681 million due mainly toan increased asset base, client activity and productissuance. The segment reported strong net new assetinflows of CHF 10.8 billion for the quarter, representing avery high annualized growth rate of 8.4%. Its grossmargin remained high. The good first quarter resultrecorded by Corporate & Retail Banking reflected solidunderlying revenues and the segment’s continuing focuson productivity. Moreover, both insurance segments –Life & Pensions and Non-Life – reported high investmentincome and further improvements in cost efficiency.
Credit Suisse First Boston recorded net income ofCHF 759 million in the first quarter of 2004,demonstrating the business unit’s operating leverage.This performance reflected higher revenues and improvedglobal capital markets. In the first quarter of 2004,Institutional Securities had strong results in the fixedincome and equity underwriting and trading businesses,due to more favorable capital markets and improvedcustomer-related activities and trading opportunities.Wealth & Asset Management increased its net income toCHF 136 million, largely on improved fee income andhigher asset levels. The solid first quarter performance
was reflected in its improved pre-tax margin and returnon average allocated capital. In the first quarter of 2004,Credit Suisse First Boston announced the creation of theAlternative Capital division, bringing together itsalternative investment activities, including the privateequity and private fund groups, in order to better alignCredit Suisse First Boston’s significant productcapabilities with the high level of market demand.
On January 1, 2004, Credit Suisse Group changedits primary accounting standard from Swiss GAAP to USGAAP. The first quarter of 2004 represents the firstperiod in which the business was operated in line withUS GAAP. Prior-period information has been presentedin accordance with US GAAP, although the business wasmanaged in line with Swiss GAAP until the end of 2003.
Credit Suisse Group started the year successfully,benefiting from progress achieved in all of its businessesand improved economic conditions. We remain optimisticabout 2004 given present levels of client activity andcurrent economic conditions.
John J. MackCo-CEO Credit Suisse GroupChief Executive OfficerCredit Suisse First Boston
Oswald J. GrübelCo-CEO Credit Suisse GroupChief Executive OfficerCredit Suisse Financial Services
Oswald J. Grübel John J. Mack
May 2004
2
CREDIT SUISSE GROUP F INANCIAL HIGHLIGHTS Q1/2004
Change Changein % from in % from
in CHF m, except where indicated 1Q2004 4Q2003 1Q2003 4Q2003 1Q2003
Consolidated income statementNet revenues 16,571 12,875 14,696 29 13Income from continuing operations before extraordinary
items and cumulative effect of accounting changes 1,930 834 736 131 162Net income 1,861 784 279 137 –
Return on equity 21.3% 9.2% 3.3% – –
Earnings per shareBasic earnings per share in CHF 1.61 0.66 0.24 – –Diluted earnings per share in CHF 1.48 0.64 0.24 – –
Net new assets in CHF bn 15.6 4.7 (1.5) – –
Changein % from
in CHF m, except where indicated 31.03.04 31.12.03 31.12.03
Assets under management in CHF bn 1,241.3 1,181.1 5
Consolidated balance sheetTotal assets 1,138,196 1,004,308 13Shareholders’ equity 35,338 33,991 4
Consolidated BIS capital data 1)
Risk-weighted assets 201,161 190,761 –Tier 1 ratio 11.5% 11.7% –Total capital ratio 16.4% 17.4% –
Number of employees Switzerland – banking segments 19,084 19,301 (1)Switzerland – insurance segments 6,154 6,426 (4)Outside Switzerland – banking segments 20,422 20,310 1Outside Switzerland – insurance segments 14,328 14,440 (1)
Number of employees (full-time equivalents) 59,988 60,477 (1)
Stock market dataMarket price per registered share in CHF 43.90 45.25 (3)Market price per American Depositary Share in USD 34.80 36.33 (4)Market capitalization 49,124 51,149 (4)Market capitalization in USD m 38,941 41,066 (5)Book value per share in CHF 31.58 30.07 5
Shares outstanding 1,118,998,681 1,130,362,948 (1)
1) All calculations through December 31, 2003, on the basis of Swiss GAAP. Further details see page 5.
Credit Suisse Group financial highlights
1009080
70
60
50
40
30
20
1999 2000 2001 2002 2003 2004
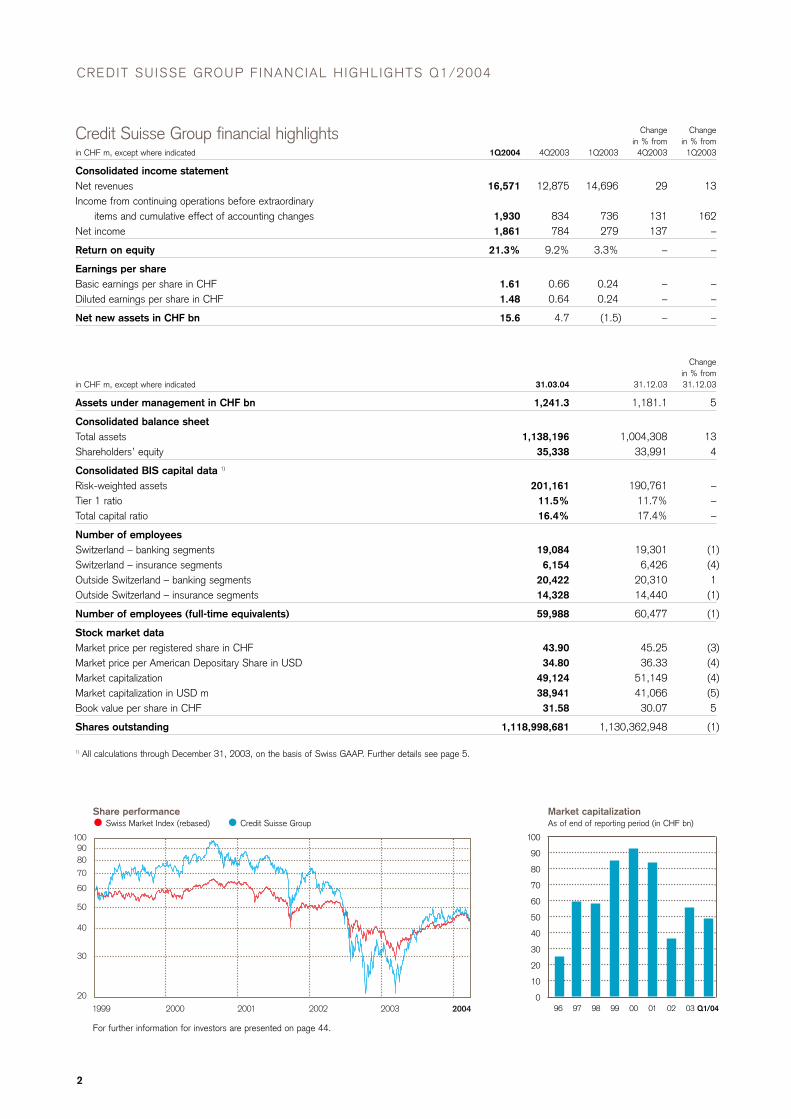
Share performanceSwiss Market Index (rebased) Credit Suisse Group
Market capitalizationAs of end of reporting period (in CHF bn)
100
90
80
70
60
50
40
30
20
10
096 97 98 99 00 01 02 03 Q1/04
For further information for investors are presented on page 44.
www.credit-suisse.com 3
AN OVERVIEW OF CREDIT SUISSE GROUP
Credit Suisse Group achieved a strong start to 2004, reporting net income of CHF 1.9billion in the first quarter of 2004, up CHF 1.6 billion compared to the first quarter of2003. Net revenues were up 13% to CHF 16.6 billion compared with the first quarter of2003. The result was driven by revenue growth in its banking business, continued stronginvestment performance at Winterthur, cost discipline and the improved overall globaleconomy. In the first quarter of 2004, Credit Suisse Financial Services reported net incomeof CHF 1.1 billion and Credit Suisse First Boston reported net income of CHF 759 million.
Corporate & Wealth & CreditPrivate Retail Life & Institutional Asset Corporate Suisse
1Q2004, in CHF m Banking Banking Pensions Non-Life Securities Management Center Group
Net revenues 1,940 787 6,036 3,125 3,997 866 (180) 16,571
Policyholder benefits, claims and dividends – – 5,380 2,214 – – – 7,594Provision for credit losses 6 48 (1) 0 (21) 0 2 34
Total benefits, claims and credit losses 6 48 5,379 2,214 (21) 0 2 7,628
Insurance underwriting, acquisition and administration expenses – – 401 661 – – (3) 1,059Banking compensation and benefits 582 275 – – 2,251 277 43 3,428Other expenses 493 219 59 67 847 347 (199) 1,833Restructuring charges (2) 0 2 4 0 0 0 4
Total operating expenses 1,073 494 462 732 3,098 624 (159) 6,324
Income from continuing operations before taxes, minority interests and cumulative effect of accounting changes 861 245 195 179 920 242 (23) 2,619
Income tax expense 175 56 50 14 257 38 (20) 570Minority interests, net of tax 5 0 7 (1) 40 68 0 119
Income from continuing operations beforecumulative effect of accounting changes 681 189 138 166 623 136 (3) 1,930
Income/(loss) from discontinued operations, net of tax 0 0 0 (63) 0 0 (1) (64)Cumulative effect of accounting changes, net of tax 0 0 1 0 0 0 (6) (5)
Net income 681 189 139 103 623 136 (10) 1,861
Overview of segment results
Credit Suisse Financial Services reported net income ofCHF 1.1 billion in the first quarter of 2004, compared toCHF 126 million in the first quarter of 2003, reflectinghigher revenues and efficiency improvements. All foursegments reported very strong net income. PrivateBanking reported net income of CHF 681 million, drivenmainly by high commissions and fees. Corporate & RetailBanking recorded net income of CHF 189 million, basedon solid underlying revenues, low credit provisions andlow operating expenses. Life & Pensions’ net income ofCHF 139 million was driven by high investment incomeand the continued containment of administrationexpenses. Non-Life reported net income of CHF 103million, reflecting significant premium growth, highinvestment income and further improvements in costefficiency.
Credit Suisse First Boston reported net income ofCHF 759 million in the first quarter of 2004, an increaseof 27% compared to the first quarter of 2003, reflectingclient-driven revenues, overall improvements in capital
markets activity and accompanied by continued costcontrol. The Institutional Securities segment reported netincome of CHF 623 million, an increase of 22%compared to the first quarter of 2003, reflectingincreased revenues across most business lines, whichwere partially offset by increased compensation andbenefits. Total investment banking revenues increased by3% compared to the first quarter of 2003, attributable todebt and equity underwriting. Total trading revenuesincreased by 12% due to improving global economicconditions. The Wealth & Asset Management segmentreported net income of CHF 136 million, an increase of56% from the first quarter of 2003, primarily reflectingimproved revenues from Credit Suisse AssetManagement.
Earnings per share in the first quarter of 2004 wereCHF 1.61, compared to CHF 0.24 in the first quarter of2003. The Group’s return on equity was 21.3% in thefirst quarter of 2004 versus 3.3% in the first quarter of2003.
4
AN OVERVIEW OF CREDIT SUISSE GROUP
Change in primary accounting standard On January 1, 2004, Credit Suisse Group changed itsprimary accounting standard from Swiss GAAP to USGAAP. This change was a result of its long-term plan tomove to an internationally recognized accountingstandard, as well as the requirement of the SwissExchange for large listed companies to adopt US GAAPor IFRS.
The first quarter of 2004 represents the first period inwhich the business was operated in line with US GAAP.Prior period information has been presented inaccordance with US GAAP, although the business wasmanaged in line with Swiss GAAP until the end of 2003.
Equity capital Credit Suisse Group’s consolidated BIS tier 1 ratio was11.5% as of March 31, 2004. Capital data for priorperiods was prepared on the basis of Swiss GAAP. TheGroup’s shareholders’ equity as of March 31, 2004,amounted to CHF 35.3 billion.
Winterthur solvencyWinterthur’s solvency position improved with itsconsolidated EU solvency ratio increasing from 142% asof December 31, 2002 to 168% as of December 31,2003. With effect from January 1, 2004, WinterthurGroup has agreed a new measure of consolidatedsolvency with the Swiss Federal Office of Private
Insurance (“BPV”). This method is based on the existingEU group solvency approach and the Swiss stand-alonesolvency regulations, but simplifies the calculation bybasing it predominantly on the Winterthur Group’sconsolidated financial statements. Surplus capital underthis revised approach was CHF 2.1 billion as ofDecember 31, 2003.
Winterthur’s shareholders’ equity was CHF 8.1 billionas of March 31, 2004, and CHF 7.8 billion as ofDecember 31, 2003. As of the same dates, minorityinterests – which are not included in shareholders’ equity– were CHF 704 million and CHF 618 million,respectively.
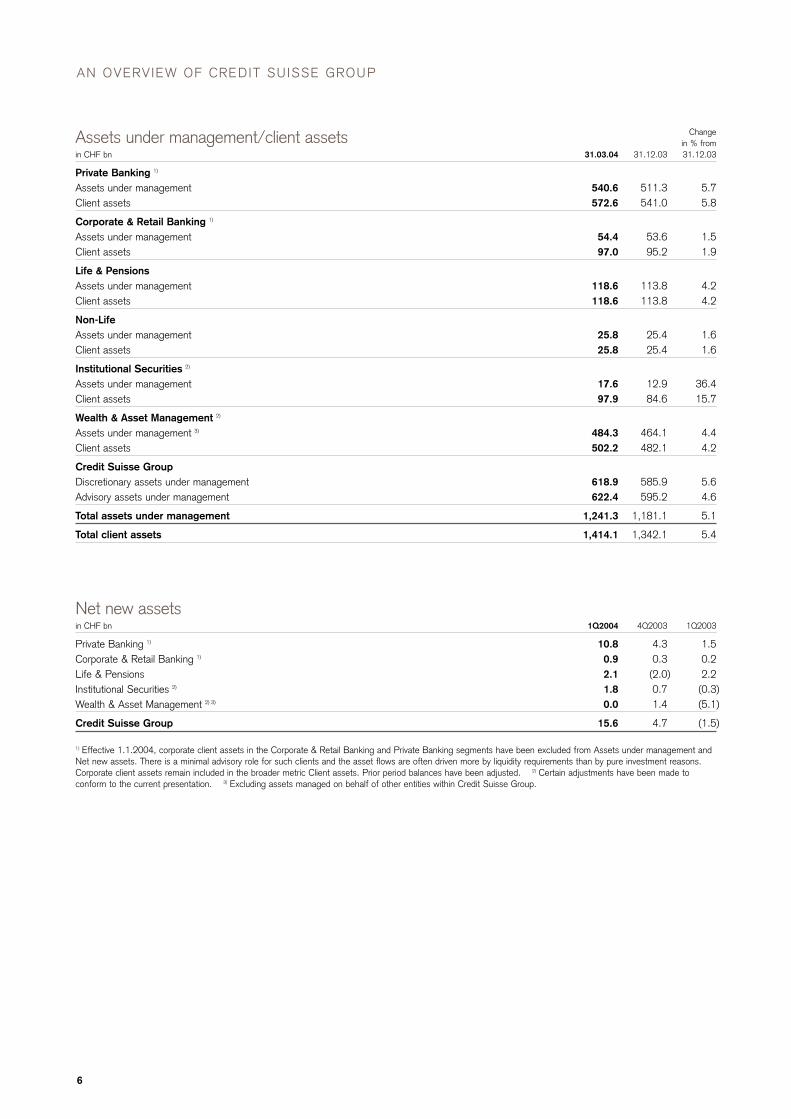
Net new assets The Group reported net new assets of CHF 15.6 billionin the first quarter of 2004, with Private Bankingcontributing net new assets of CHF 10.8 billion,representing a very high annualized growth rate of 8.4%.Corporate & Retail Banking and Life & Pensions reportednet new assets in the first quarter of 2004 of CHF 0.9billion and CHF 2.1 billion, respectively. A net new assetinflow of CHF 1.8 billion was recorded in InstitutionalSecurities.
As of March 31, 2004, the Group’s total assetsunder management were CHF 1,241.3 billion, anincrease of 5.1% compared to December 31, 2003.
Credit Suisse Group
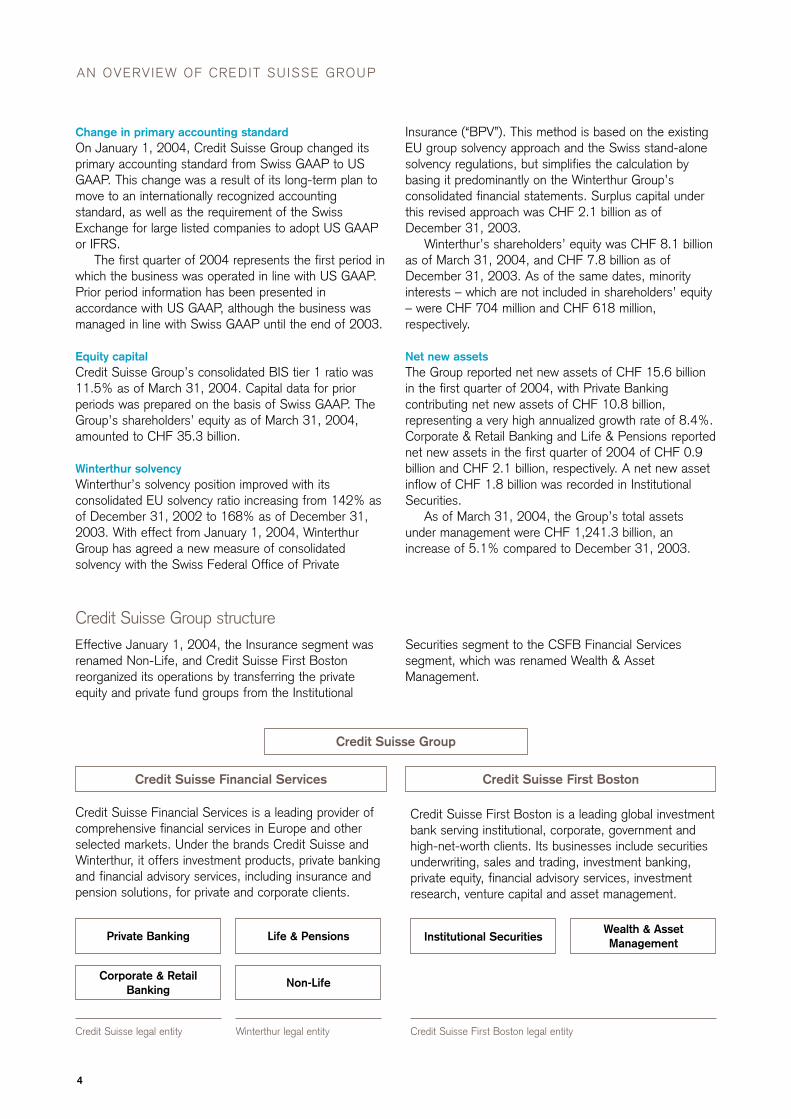
Credit Suisse Financial Services is a leading provider ofcomprehensive financial services in Europe and otherselected markets. Under the brands Credit Suisse andWinterthur, it offers investment products, private bankingand financial advisory services, including insurance andpension solutions, for private and corporate clients.
Credit Suisse First Boston is a leading global investmentbank serving institutional, corporate, government andhigh-net-worth clients. Its businesses include securitiesunderwriting, sales and trading, investment banking, private equity, financial advisory services, investmentresearch, venture capital and asset management.
Private Banking Life & Pensions
Corporate & RetailBanking
Non-Life
Institutional SecuritiesWealth & AssetManagement
Credit Suisse legal entity Credit Suisse First Boston legal entityWinterthur legal entity
Credit Suisse Financial Services Credit Suisse First Boston
Credit Suisse Group structureEffective January 1, 2004, the Insurance segment wasrenamed Non-Life, and Credit Suisse First Bostonreorganized its operations by transferring the privateequity and private fund groups from the Institutional
Securities segment to the CSFB Financial Servicessegment, which was renamed Wealth & AssetManagement.
www.credit-suisse.com 5
Credit Suisse Credit Suisse First Boston Credit Suisse Group
in CHF m, except where indicated 31.03.04 31.12.03 31.03.04 31.12.03 31.03.04 31.12.03
Risk-weighted positions 87,555 85,158 84,981 80,622 184,326 176,911Market risk equivalents 5,124 4,675 10,747 8,185 16,835 13,850
Risk-weighted assets 92,679 89,833 95,728 88,807 201,161 190,761
Tier 1 capital 7,374 7,362 11,204 12,062 23,040 22,287of which non-cumulative perpetual preferred securities 0 0 1,049 996 2,225 2,169
Tier 1 ratio 8.0% 8.2% 11.7% 13.6% 11.5% 11.7%
Total capital 10,624 10,630 20,503 20,968 33,049 33,207Total capital ratio 11.5% 11.8% 21.4% 23.6% 16.4% 17.4%
All calculations through December 31, 2003, on the basis of Swiss GAAP. In 2003, the method for capital treatment of Winterthur was adapted in line with the newrequirements defined by the Swiss regulator.
BIS capital data
Revenues and expenses Net revenues in the first quarter of 2004 were CHF 16.6billion, reflecting a 13% increase compared to the firstquarter of 2003. This increase in net revenues comparedto the first quarter of 2003 was largely due to an 8%increase in net revenues at Credit Suisse FinancialServices to CHF 11.9 billion, resulting mainly from strongresults achieved in the Private Banking and Non-Lifesegments. Credit Suisse First Boston increased its netrevenues by 15% compared to the first quarter of 2003to CHF 4.9 billion, mainly due to improved underwritingand trading results in the Institutional Securities segment.
Total operating expenses in the first quarter of 2004amounted to CHF 6.3 billion, up 5% compared to thefirst quarter of 2003. This increase resulted from a 17%increase in banking compensation and benefits in thefirst quarter of 2004 compared to the first quarter of2003, reflecting the better results. All non-compensationexpenses were lower compared to the first quarter of2003, whereby insurance underwriting, acquisition andadministration expenses decreased by 8%, primarily dueto efficiency improvements.
Policyholder benefits, claims and dividendsIn the insurance segments, total policyholder benefits,claims and dividends reported in the first quarter of 2004increased by 3% from the first quarter of 2003, mainlyas a result of higher claims in Non-Life as well aslegislation passed by the Swiss government on March24, 2004, which provides for mandatory participation inprofits to policyholders in respect of the regulatedemployee benefit business in Switzerland. Provisionsinitially recorded as a result of this legislation in the Life& Pensions segment amounted to CHF 117 millionbefore tax and CHF 91 million after tax.
Provision for credit losses Provision for credit losses in the first quarter of 2004amounted to CHF 34 million, compared to CHF 197million in the first quarter of 2003. This level reflects afavorable credit environment.
OutlookCredit Suisse Group started the year successfully,benefiting from progress achieved in all of its businessesand improved economic conditions. The Group remainsoptimistic about 2004 given present levels of clientactivity and current economic conditions.
6
AN OVERVIEW OF CREDIT SUISSE GROUP
Changein % from
in CHF bn 31.03.04 31.12.03 31.12.03
Private Banking 1)
Assets under management 540.6 511.3 5.7Client assets 572.6 541.0 5.8
Corporate & Retail Banking 1)
Assets under management 54.4 53.6 1.5Client assets 97.0 95.2 1.9
Life & PensionsAssets under management 118.6 113.8 4.2Client assets 118.6 113.8 4.2
Non-LifeAssets under management 25.8 25.4 1.6Client assets 25.8 25.4 1.6
Institutional Securities 2)
Assets under management 17.6 12.9 36.4Client assets 97.9 84.6 15.7
Wealth & Asset Management 2)
Assets under management 3) 484.3 464.1 4.4Client assets 502.2 482.1 4.2
Credit Suisse GroupDiscretionary assets under management 618.9 585.9 5.6Advisory assets under management 622.4 595.2 4.6
Total assets under management 1,241.3 1,181.1 5.1
Total client assets 1,414.1 1,342.1 5.4
Assets under management/client assets
in CHF bn 1Q2004 4Q2003 1Q2003
Private Banking 1) 10.8 4.3 1.5Corporate & Retail Banking 1) 0.9 0.3 0.2Life & Pensions 2.1 (2.0) 2.2Institutional Securities 2) 1.8 0.7 (0.3)Wealth & Asset Management 2) 3) 0.0 1.4 (5.1)
Credit Suisse Group 15.6 4.7 (1.5)
1) Effective 1.1.2004, corporate client assets in the Corporate & Retail Banking and Private Banking segments have been excluded from Assets under management andNet new assets. There is a minimal advisory role for such clients and the asset flows are often driven more by liquidity requirements than by pure investment reasons.Corporate client assets remain included in the broader metric Client assets. Prior period balances have been adjusted. 2) Certain adjustments have been made toconform to the current presentation. 3) Excluding assets managed on behalf of other entities within Credit Suisse Group.
Net new assets
www.credit-suisse.com 7
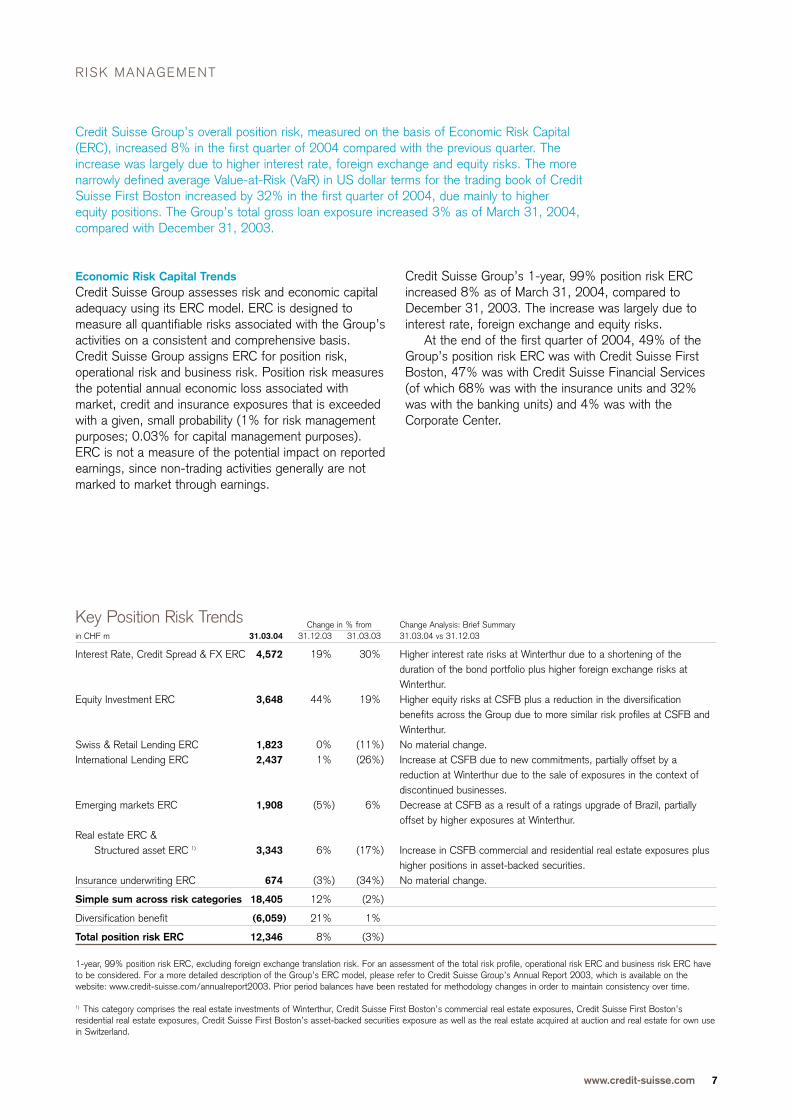
Credit Suisse Group’s overall position risk, measured on the basis of Economic Risk Capital(ERC), increased 8% in the first quarter of 2004 compared with the previous quarter. Theincrease was largely due to higher interest rate, foreign exchange and equity risks. The morenarrowly defined average Value-at-Risk (VaR) in US dollar terms for the trading book of CreditSuisse First Boston increased by 32% in the first quarter of 2004, due mainly to higherequity positions. The Group’s total gross loan exposure increased 3% as of March 31, 2004,compared with December 31, 2003.
Economic Risk Capital TrendsCredit Suisse Group assesses risk and economic capitaladequacy using its ERC model. ERC is designed tomeasure all quantifiable risks associated with the Group’sactivities on a consistent and comprehensive basis.Credit Suisse Group assigns ERC for position risk,operational risk and business risk. Position risk measuresthe potential annual economic loss associated withmarket, credit and insurance exposures that is exceededwith a given, small probability (1% for risk managementpurposes; 0.03% for capital management purposes).ERC is not a measure of the potential impact on reportedearnings, since non-trading activities generally are notmarked to market through earnings.
R ISK MANAGEMENT
Change Analysis: Brief SummaryChange in % fromin CHF m 31.03.04 31.12.03 31.03.03 31.03.04 vs 31.12.03
Interest Rate, Credit Spread & FX ERC 4,572 19% 30% Higher interest rate risks at Winterthur due to a shortening of theduration of the bond portfolio plus higher foreign exchange risks atWinterthur.
Equity Investment ERC 3,648 44% 19% Higher equity risks at CSFB plus a reduction in the diversificationbenefits across the Group due to more similar risk profiles at CSFB andWinterthur.
Swiss & Retail Lending ERC 1,823 0% (11%) No material change.International Lending ERC 2,437 1% (26%) Increase at CSFB due to new commitments, partially offset by a
reduction at Winterthur due to the sale of exposures in the context ofdiscontinued businesses.
Emerging markets ERC 1,908 (5%) 6% Decrease at CSFB as a result of a ratings upgrade of Brazil, partiallyoffset by higher exposures at Winterthur.
Real estate ERC &Structured asset ERC 1) 3,343 6% (17%) Increase in CSFB commercial and residential real estate exposures plus
higher positions in asset-backed securities.Insurance underwriting ERC 674 (3%) (34%) No material change.
Simple sum across risk categories 18,405 12% (2%)
Diversification benefit (6,059) 21% 1%
Total position risk ERC 12,346 8% (3%)
1-year, 99% position risk ERC, excluding foreign exchange translation risk. For an assessment of the total risk profile, operational risk ERC and business risk ERC haveto be considered. For a more detailed description of the Group’s ERC model, please refer to Credit Suisse Group’s Annual Report 2003, which is available on thewebsite: www.credit-suisse.com/annualreport2003. Prior period balances have been restated for methodology changes in order to maintain consistency over time.
1) This category comprises the real estate investments of Winterthur, Credit Suisse First Boston’s commercial real estate exposures, Credit Suisse First Boston’sresidential real estate exposures, Credit Suisse First Boston’s asset-backed securities exposure as well as the real estate acquired at auction and real estate for own usein Switzerland.
Key Position Risk Trends
Credit Suisse Group’s 1-year, 99% position risk ERCincreased 8% as of March 31, 2004, compared toDecember 31, 2003. The increase was largely due tointerest rate, foreign exchange and equity risks.
At the end of the first quarter of 2004, 49% of theGroup’s position risk ERC was with Credit Suisse FirstBoston, 47% was with Credit Suisse Financial Services(of which 68% was with the insurance units and 32%was with the banking units) and 4% was with theCorporate Center.
8
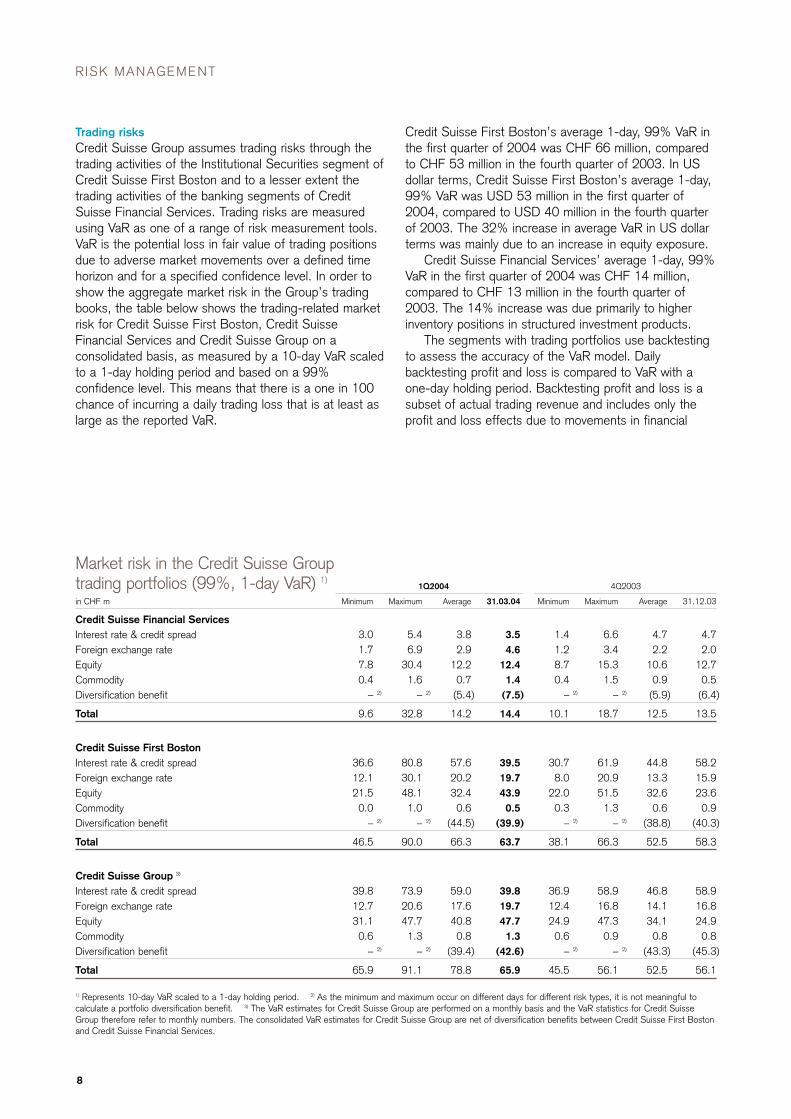
Trading risksCredit Suisse Group assumes trading risks through thetrading activities of the Institutional Securities segment ofCredit Suisse First Boston and to a lesser extent thetrading activities of the banking segments of CreditSuisse Financial Services. Trading risks are measuredusing VaR as one of a range of risk measurement tools.VaR is the potential loss in fair value of trading positionsdue to adverse market movements over a defined timehorizon and for a specified confidence level. In order toshow the aggregate market risk in the Group’s tradingbooks, the table below shows the trading-related marketrisk for Credit Suisse First Boston, Credit SuisseFinancial Services and Credit Suisse Group on aconsolidated basis, as measured by a 10-day VaR scaledto a 1-day holding period and based on a 99%confidence level. This means that there is a one in 100chance of incurring a daily trading loss that is at least aslarge as the reported VaR.
1Q2004 4Q2003
in CHF m Minimum Maximum Average 31.03.04 Minimum Maximum Average 31.12.03
Credit Suisse Financial ServicesInterest rate & credit spread 3.0 5.4 3.8 3.5 1.4 6.6 4.7 4.7Foreign exchange rate 1.7 6.9 2.9 4.6 1.2 3.4 2.2 2.0Equity 7.8 30.4 12.2 12.4 8.7 15.3 10.6 12.7Commodity 0.4 1.6 0.7 1.4 0.4 1.5 0.9 0.5Diversification benefit – 2) – 2) (5.4) (7.5) – 2) – 2) (5.9) (6.4)
Total 9.6 32.8 14.2 14.4 10.1 18.7 12.5 13.5
Credit Suisse First BostonInterest rate & credit spread 36.6 80.8 57.6 39.5 30.7 61.9 44.8 58.2Foreign exchange rate 12.1 30.1 20.2 19.7 8.0 20.9 13.3 15.9Equity 21.5 48.1 32.4 43.9 22.0 51.5 32.6 23.6Commodity 0.0 1.0 0.6 0.5 0.3 1.3 0.6 0.9Diversification benefit – 2) – 2) (44.5) (39.9) – 2) – 2) (38.8) (40.3)
Total 46.5 90.0 66.3 63.7 38.1 66.3 52.5 58.3
Credit Suisse Group 3)
Interest rate & credit spread 39.8 73.9 59.0 39.8 36.9 58.9 46.8 58.9Foreign exchange rate 12.7 20.6 17.6 19.7 12.4 16.8 14.1 16.8Equity 31.1 47.7 40.8 47.7 24.9 47.3 34.1 24.9Commodity 0.6 1.3 0.8 1.3 0.6 0.9 0.8 0.8Diversification benefit – 2) – 2) (39.4) (42.6) – 2) – 2) (43.3) (45.3)
Total 65.9 91.1 78.8 65.9 45.5 56.1 52.5 56.1
1) Represents 10-day VaR scaled to a 1-day holding period. 2) As the minimum and maximum occur on different days for different risk types, it is not meaningful tocalculate a portfolio diversification benefit. 3) The VaR estimates for Credit Suisse Group are performed on a monthly basis and the VaR statistics for Credit SuisseGroup therefore refer to monthly numbers. The consolidated VaR estimates for Credit Suisse Group are net of diversification benefits between Credit Suisse First Bostonand Credit Suisse Financial Services.
Market risk in the Credit Suisse Group trading portfolios (99%, 1-day VaR) 1)
Credit Suisse First Boston’s average 1-day, 99% VaR inthe first quarter of 2004 was CHF 66 million, comparedto CHF 53 million in the fourth quarter of 2003. In USdollar terms, Credit Suisse First Boston’s average 1-day,99% VaR was USD 53 million in the first quarter of2004, compared to USD 40 million in the fourth quarterof 2003. The 32% increase in average VaR in US dollarterms was mainly due to an increase in equity exposure.
Credit Suisse Financial Services’ average 1-day, 99%VaR in the first quarter of 2004 was CHF 14 million,compared to CHF 13 million in the fourth quarter of2003. The 14% increase was due primarily to higherinventory positions in structured investment products.
The segments with trading portfolios use backtestingto assess the accuracy of the VaR model. Dailybacktesting profit and loss is compared to VaR with aone-day holding period. Backtesting profit and loss is asubset of actual trading revenue and includes only theprofit and loss effects due to movements in financial
R ISK MANAGEMENT
www.credit-suisse.com 9
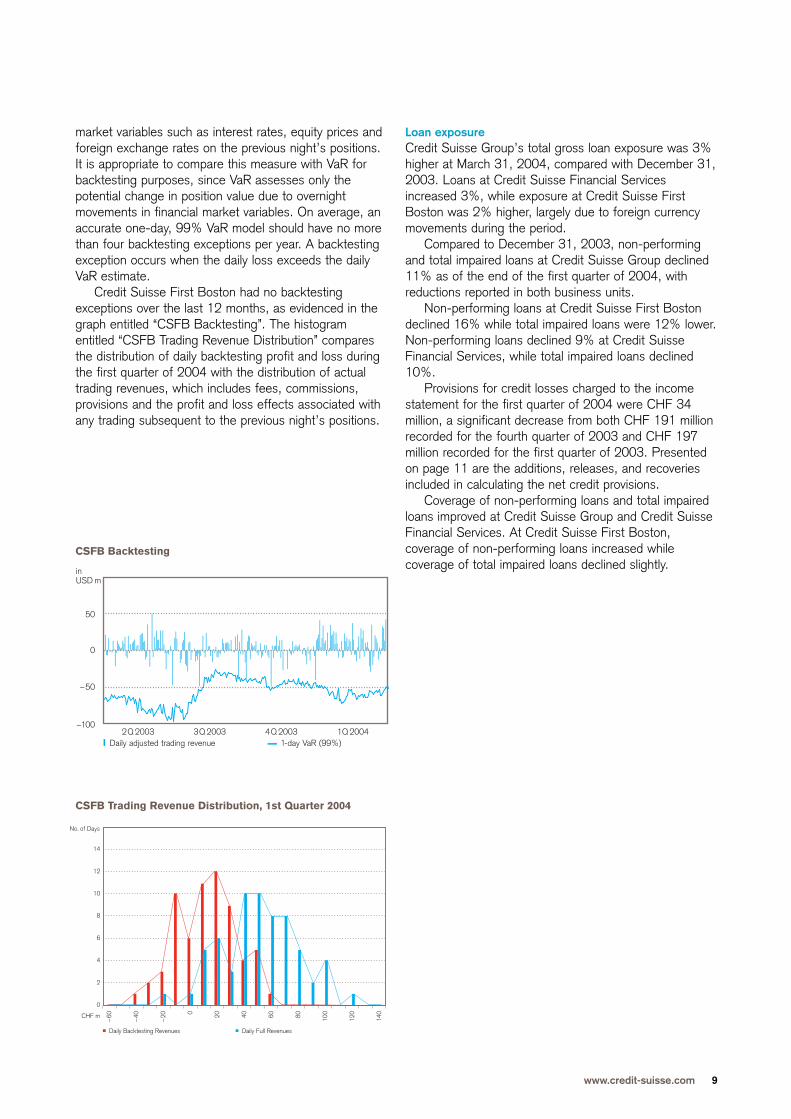
market variables such as interest rates, equity prices andforeign exchange rates on the previous night’s positions.It is appropriate to compare this measure with VaR forbacktesting purposes, since VaR assesses only thepotential change in position value due to overnightmovements in financial market variables. On average, anaccurate one-day, 99% VaR model should have no morethan four backtesting exceptions per year. A backtestingexception occurs when the daily loss exceeds the dailyVaR estimate.
Credit Suisse First Boston had no backtestingexceptions over the last 12 months, as evidenced in thegraph entitled “CSFB Backtesting”. The histogramentitled “CSFB Trading Revenue Distribution” comparesthe distribution of daily backtesting profit and loss duringthe first quarter of 2004 with the distribution of actualtrading revenues, which includes fees, commissions,provisions and the profit and loss effects associated withany trading subsequent to the previous night’s positions.
–60
–40
–20 0 20 40 60 80 10
0
120
140
Daily Backtesting Revenues Daily Full Revenues
No. of Days
14
12
10
8
6
4
2
0
CHF m
2Q 2003 3Q 2003 4Q 2003 1Q 2004Daily adjusted trading revenue 1-day VaR (99%)
in USD m
50
0
–50
–100
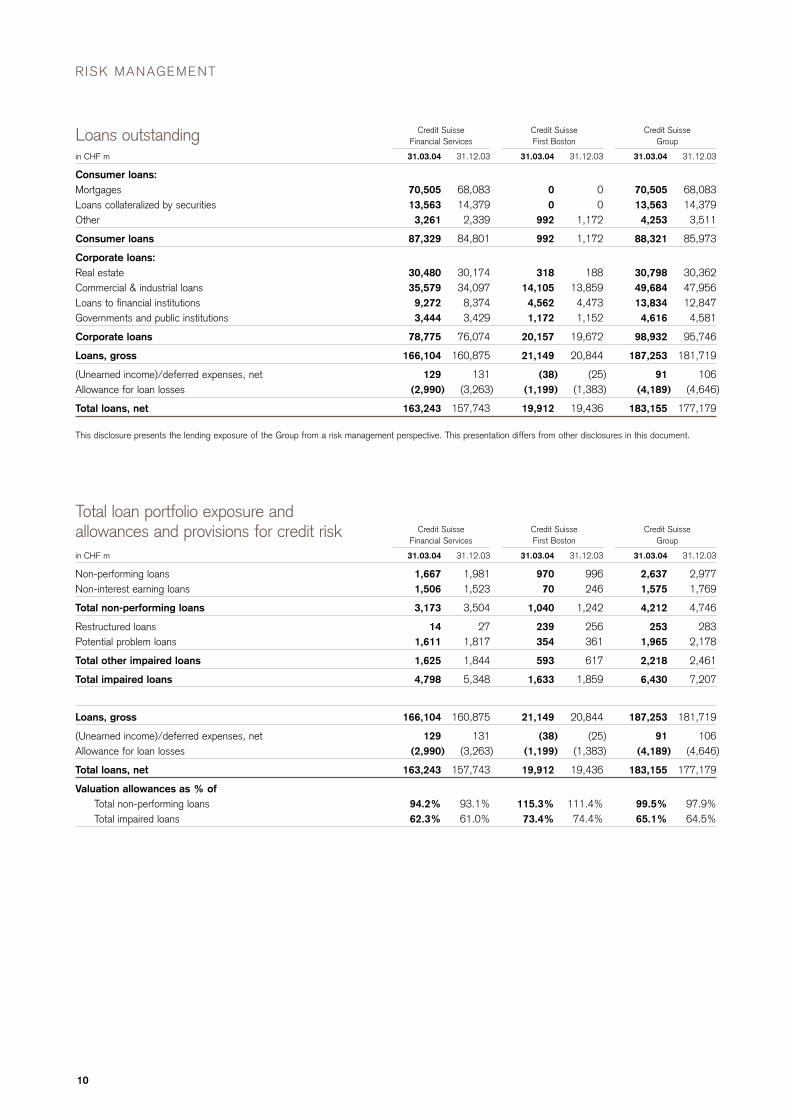
Loan exposureCredit Suisse Group’s total gross loan exposure was 3%higher at March 31, 2004, compared with December 31,2003. Loans at Credit Suisse Financial Servicesincreased 3%, while exposure at Credit Suisse FirstBoston was 2% higher, largely due to foreign currencymovements during the period.
Compared to December 31, 2003, non-performingand total impaired loans at Credit Suisse Group declined11% as of the end of the first quarter of 2004, withreductions reported in both business units.
Non-performing loans at Credit Suisse First Bostondeclined 16% while total impaired loans were 12% lower.Non-performing loans declined 9% at Credit SuisseFinancial Services, while total impaired loans declined10%.
Provisions for credit losses charged to the incomestatement for the first quarter of 2004 were CHF 34million, a significant decrease from both CHF 191 millionrecorded for the fourth quarter of 2003 and CHF 197million recorded for the first quarter of 2003. Presentedon page 11 are the additions, releases, and recoveriesincluded in calculating the net credit provisions.
Coverage of non-performing loans and total impairedloans improved at Credit Suisse Group and Credit SuisseFinancial Services. At Credit Suisse First Boston,coverage of non-performing loans increased whilecoverage of total impaired loans declined slightly.
CSFB Backtesting
CSFB Trading Revenue Distribution, 1st Quarter 2004
Credit Suisse Credit Suisse Credit SuisseFinancial Services First Boston Group
in CHF m 31.03.04 31.12.03 31.03.04 31.12.03 31.03.04 31.12.03
Non-performing loans 1,667 1,981 970 996 2,637 2,977Non-interest earning loans 1,506 1,523 70 246 1,575 1,769
Total non-performing loans 3,173 3,504 1,040 1,242 4,212 4,746
Restructured loans 14 27 239 256 253 283Potential problem loans 1,611 1,817 354 361 1,965 2,178
Total other impaired loans 1,625 1,844 593 617 2,218 2,461
Total impaired loans 4,798 5,348 1,633 1,859 6,430 7,207
Loans, gross 166,104 160,875 21,149 20,844 187,253 181,719
(Unearned income)/deferred expenses, net 129 131 (38) (25) 91 106Allowance for loan losses (2,990) (3,263) (1,199) (1,383) (4,189) (4,646)
Total loans, net 163,243 157,743 19,912 19,436 183,155 177,179
Valuation allowances as % ofTotal non-performing loans 94.2% 93.1% 115.3% 111.4% 99.5% 97.9%Total impaired loans 62.3% 61.0% 73.4% 74.4% 65.1% 64.5%
Total loan portfolio exposure and allowances and provisions for credit risk
RISK MANAGEMENT
10
Credit Suisse Credit Suisse Credit SuisseFinancial Services First Boston Group
in CHF m 31.03.04 31.12.03 31.03.04 31.12.03 31.03.04 31.12.03
Consumer loans:Mortgages 70,505 68,083 0 0 70,505 68,083Loans collateralized by securities 13,563 14,379 0 0 13,563 14,379Other 3,261 2,339 992 1,172 4,253 3,511
Consumer loans 87,329 84,801 992 1,172 88,321 85,973
Corporate loans:Real estate 30,480 30,174 318 188 30,798 30,362Commercial & industrial loans 35,579 34,097 14,105 13,859 49,684 47,956Loans to financial institutions 9,272 8,374 4,562 4,473 13,834 12,847Governments and public institutions 3,444 3,429 1,172 1,152 4,616 4,581
Corporate loans 78,775 76,074 20,157 19,672 98,932 95,746
Loans, gross 166,104 160,875 21,149 20,844 187,253 181,719
(Unearned income)/deferred expenses, net 129 131 (38) (25) 91 106Allowance for loan losses (2,990) (3,263) (1,199) (1,383) (4,189) (4,646)
Total loans, net 163,243 157,743 19,912 19,436 183,155 177,179
This disclosure presents the lending exposure of the Group from a risk management perspective. This presentation differs from other disclosures in this document.
Loans outstanding
www.credit-suisse.com 11
Credit Suisse Credit Suisse Credit SuisseFinancial Services First Boston Group
in CHF m 1Q2004 4Q2003 1Q2003 1Q2004 4Q2003 1Q2003 1Q2004 4Q2003 1Q2003
Balance beginning of period 3,263 3,190 4,159 1,383 2,654 3,268 4,646 5,844 7,427
New provisions 127 438 150 38 340 163 165 777 313Releases of provisions (64) (194) (88) (67) (392) (28) (131) (586) (116)
Net additions charged to income statement 63 244 62 (29) (52) 135 34 191 197
Gross write-offs (380) (169) (347) (210) (1,158) (356) (590) (1,328) (703)Recoveries 6 2 8 5 1 0 11 3 7
Net write-offs (374) (167) (339) (205) (1,157) (356) (579) (1,325) (696)
Allowances acquired 0 1 (1) 0 25 0 0 26 (1)Provisions for interest 10 5 12 13 52 30 24 57 42Foreign currency translation impact and
other adjustments, net 28 (10) (1) 37 (139) (94) 64 (147) (94)
Balance end of period 2,990 3,263 3,892 1,199 1,383 2,983 4,189 4,646 6,875
Allowance for loan losses
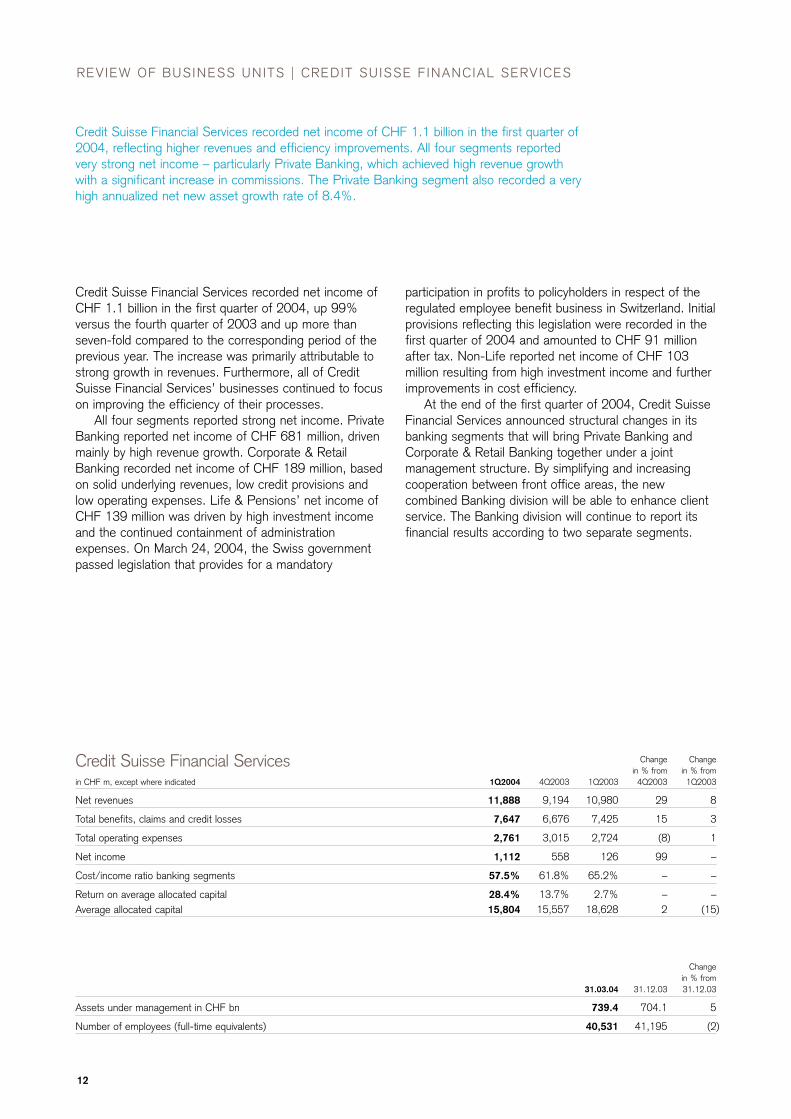
Credit Suisse Financial Services recorded net income of CHF 1.1 billion in the first quarter of2004, reflecting higher revenues and efficiency improvements. All four segments reportedvery strong net income – particularly Private Banking, which achieved high revenue growthwith a significant increase in commissions. The Private Banking segment also recorded a veryhigh annualized net new asset growth rate of 8.4%.
Change Changein % from in % from
in CHF m, except where indicated 1Q2004 4Q2003 1Q2003 4Q2003 1Q2003
Net revenues 11,888 9,194 10,980 29 8
Total benefits, claims and credit losses 7,647 6,676 7,425 15 3
Total operating expenses 2,761 3,015 2,724 (8) 1
Net income 1,112 558 126 99 –
Cost/income ratio banking segments 57.5% 61.8% 65.2% – –
Return on average allocated capital 28.4% 13.7% 2.7% – –Average allocated capital 15,804 15,557 18,628 2 (15)
Credit Suisse Financial Services
12
REVIEW OF BUSINESS UNITS | CREDIT SUISSE F INANCIAL SERVICES
Credit Suisse Financial Services recorded net income ofCHF 1.1 billion in the first quarter of 2004, up 99%versus the fourth quarter of 2003 and up more thanseven-fold compared to the corresponding period of theprevious year. The increase was primarily attributable tostrong growth in revenues. Furthermore, all of CreditSuisse Financial Services’ businesses continued to focuson improving the efficiency of their processes.
All four segments reported strong net income. PrivateBanking reported net income of CHF 681 million, drivenmainly by high revenue growth. Corporate & RetailBanking recorded net income of CHF 189 million, basedon solid underlying revenues, low credit provisions andlow operating expenses. Life & Pensions’ net income ofCHF 139 million was driven by high investment incomeand the continued containment of administrationexpenses. On March 24, 2004, the Swiss governmentpassed legislation that provides for a mandatory
participation in profits to policyholders in respect of theregulated employee benefit business in Switzerland. Initialprovisions reflecting this legislation were recorded in thefirst quarter of 2004 and amounted to CHF 91 millionafter tax. Non-Life reported net income of CHF 103million resulting from high investment income and furtherimprovements in cost efficiency.
At the end of the first quarter of 2004, Credit SuisseFinancial Services announced structural changes in itsbanking segments that will bring Private Banking andCorporate & Retail Banking together under a jointmanagement structure. By simplifying and increasingcooperation between front office areas, the newcombined Banking division will be able to enhance clientservice. The Banking division will continue to report itsfinancial results according to two separate segments.
Changein % from
31.03.04 31.12.03 31.12.03
Assets under management in CHF bn 739.4 704.1 5
Number of employees (full-time equivalents) 40,531 41,195 (2)
www.credit-suisse.com 13
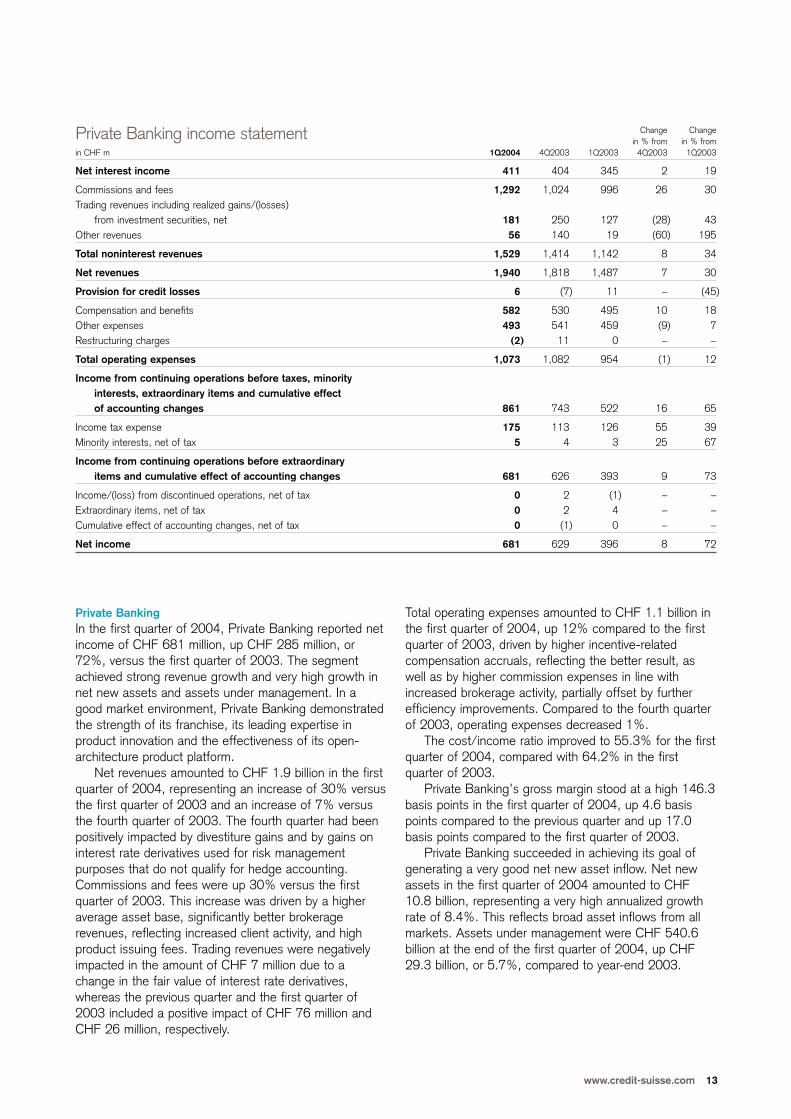
Private BankingIn the first quarter of 2004, Private Banking reported netincome of CHF 681 million, up CHF 285 million, or72%, versus the first quarter of 2003. The segmentachieved strong revenue growth and very high growth innet new assets and assets under management. In agood market environment, Private Banking demonstratedthe strength of its franchise, its leading expertise inproduct innovation and the effectiveness of its open-architecture product platform.
Net revenues amounted to CHF 1.9 billion in the firstquarter of 2004, representing an increase of 30% versusthe first quarter of 2003 and an increase of 7% versusthe fourth quarter of 2003. The fourth quarter had beenpositively impacted by divestiture gains and by gains oninterest rate derivatives used for risk managementpurposes that do not qualify for hedge accounting.Commissions and fees were up 30% versus the firstquarter of 2003. This increase was driven by a higheraverage asset base, significantly better brokeragerevenues, reflecting increased client activity, and highproduct issuing fees. Trading revenues were negativelyimpacted in the amount of CHF 7 million due to achange in the fair value of interest rate derivatives,whereas the previous quarter and the first quarter of2003 included a positive impact of CHF 76 million andCHF 26 million, respectively.
Change Changein % from in % from
in CHF m 1Q2004 4Q2003 1Q2003 4Q2003 1Q2003
Net interest income 411 404 345 2 19
Commissions and fees 1,292 1,024 996 26 30Trading revenues including realized gains/(losses)
from investment securities, net 181 250 127 (28) 43Other revenues 56 140 19 (60) 195
Total noninterest revenues 1,529 1,414 1,142 8 34
Net revenues 1,940 1,818 1,487 7 30
Provision for credit losses 6 (7) 11 – (45)
Compensation and benefits 582 530 495 10 18Other expenses 493 541 459 (9) 7Restructuring charges (2) 11 0 – –
Total operating expenses 1,073 1,082 954 (1) 12
Income from continuing operations before taxes, minority interests, extraordinary items and cumulative effect of accounting changes 861 743 522 16 65
Income tax expense 175 113 126 55 39Minority interests, net of tax 5 4 3 25 67
Income from continuing operations before extraordinary items and cumulative effect of accounting changes 681 626 393 9 73
Income/(loss) from discontinued operations, net of tax 0 2 (1) – –Extraordinary items, net of tax 0 2 4 – –Cumulative effect of accounting changes, net of tax 0 (1) 0 – –
Net income 681 629 396 8 72
Private Banking income statement
Total operating expenses amounted to CHF 1.1 billion inthe first quarter of 2004, up 12% compared to the firstquarter of 2003, driven by higher incentive-relatedcompensation accruals, reflecting the better result, aswell as by higher commission expenses in line withincreased brokerage activity, partially offset by furtherefficiency improvements. Compared to the fourth quarterof 2003, operating expenses decreased 1%.
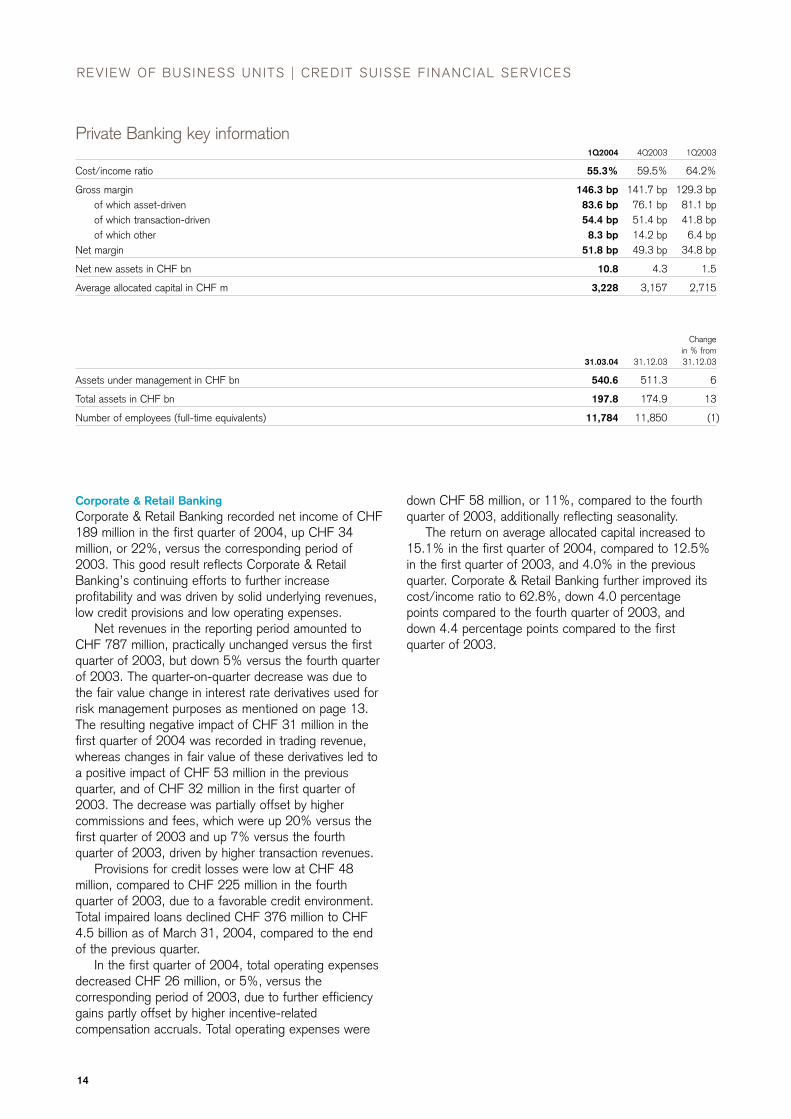
The cost/income ratio improved to 55.3% for the firstquarter of 2004, compared with 64.2% in the firstquarter of 2003.
Private Banking’s gross margin stood at a high 146.3basis points in the first quarter of 2004, up 4.6 basispoints compared to the previous quarter and up 17.0basis points compared to the first quarter of 2003.
Private Banking succeeded in achieving its goal ofgenerating a very good net new asset inflow. Net newassets in the first quarter of 2004 amounted to CHF10.8 billion, representing a very high annualized growthrate of 8.4%. This reflects broad asset inflows from allmarkets. Assets under management were CHF 540.6billion at the end of the first quarter of 2004, up CHF29.3 billion, or 5.7%, compared to year-end 2003.
14
REVIEW OF BUSINESS UNITS | CREDIT SUISSE F INANCIAL SERVICES
1Q2004 4Q2003 1Q2003
Cost/income ratio 55.3% 59.5% 64.2%
Gross margin 146.3 bp 141.7 bp 129.3 bpof which asset-driven 83.6 bp 76.1 bp 81.1 bpof which transaction-driven 54.4 bp 51.4 bp 41.8 bpof which other 8.3 bp 14.2 bp 6.4 bp
Net margin 51.8 bp 49.3 bp 34.8 bp
Net new assets in CHF bn 10.8 4.3 1.5
Average allocated capital in CHF m 3,228 3,157 2,715
Private Banking key information
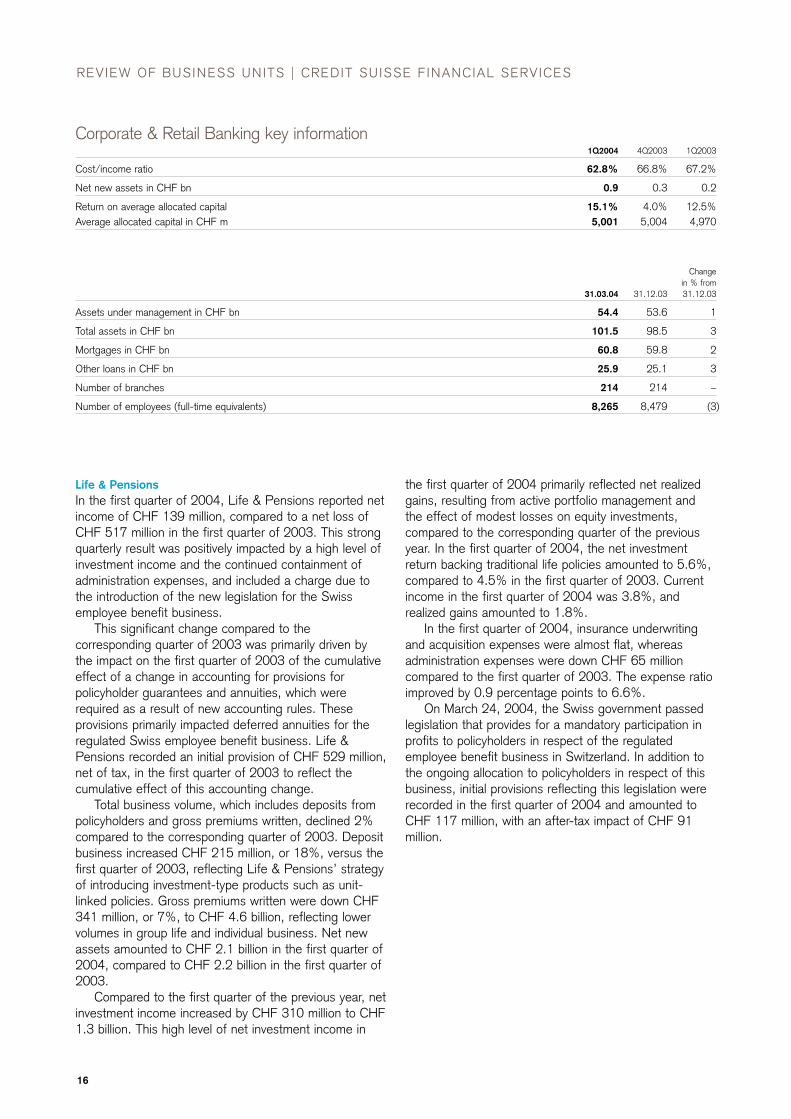
Corporate & Retail BankingCorporate & Retail Banking recorded net income of CHF189 million in the first quarter of 2004, up CHF 34million, or 22%, versus the corresponding period of2003. This good result reflects Corporate & RetailBanking’s continuing efforts to further increaseprofitability and was driven by solid underlying revenues,low credit provisions and low operating expenses.
Net revenues in the reporting period amounted toCHF 787 million, practically unchanged versus the firstquarter of 2003, but down 5% versus the fourth quarterof 2003. The quarter-on-quarter decrease was due tothe fair value change in interest rate derivatives used forrisk management purposes as mentioned on page 13.The resulting negative impact of CHF 31 million in thefirst quarter of 2004 was recorded in trading revenue,whereas changes in fair value of these derivatives led toa positive impact of CHF 53 million in the previousquarter, and of CHF 32 million in the first quarter of2003. The decrease was partially offset by highercommissions and fees, which were up 20% versus thefirst quarter of 2003 and up 7% versus the fourthquarter of 2003, driven by higher transaction revenues.
Provisions for credit losses were low at CHF 48million, compared to CHF 225 million in the fourthquarter of 2003, due to a favorable credit environment.Total impaired loans declined CHF 376 million to CHF4.5 billion as of March 31, 2004, compared to the endof the previous quarter.
In the first quarter of 2004, total operating expensesdecreased CHF 26 million, or 5%, versus thecorresponding period of 2003, due to further efficiencygains partly offset by higher incentive-relatedcompensation accruals. Total operating expenses were
down CHF 58 million, or 11%, compared to the fourthquarter of 2003, additionally reflecting seasonality.
The return on average allocated capital increased to15.1% in the first quarter of 2004, compared to 12.5%in the first quarter of 2003, and 4.0% in the previousquarter. Corporate & Retail Banking further improved itscost/income ratio to 62.8%, down 4.0 percentagepoints compared to the fourth quarter of 2003, anddown 4.4 percentage points compared to the firstquarter of 2003.
Changein % from
31.03.04 31.12.03 31.12.03
Assets under management in CHF bn 540.6 511.3 6
Total assets in CHF bn 197.8 174.9 13
Number of employees (full-time equivalents) 11,784 11,850 (1)
www.credit-suisse.com 15
Change Changein % from in % from
in CHF m 1Q2004 4Q2003 1Q2003 4Q2003 1Q2003
Net interest income 536 579 550 (7) (3)
Commissions and fees 208 194 173 7 20Trading revenues including realized gains/(losses)
from investment securities, net 23 41 27 (44) (15)Other revenues 20 12 24 67 (17)
Total noninterest revenues 251 247 224 2 12
Net revenues 787 826 774 (5) 2
Provision for credit losses 48 225 50 (79) (4)
Compensation and benefits 275 259 281 6 (2)Other expenses 219 293 239 (25) (8)
Total operating expenses 494 552 520 (11) (5)
Income from continuing operations before taxes and cumulative effect of accounting changes 245 49 204 400 20
Income tax expense 56 0 49 – 14
Income from continuing operations before cumulative effect of accounting changes 189 49 155 286 22
Cumulative effect of accounting changes, net of tax 0 1 0 – –
Net income 189 50 155 278 22
Corporate & Retail Banking income statement
16
REVIEW OF BUSINESS UNITS | CREDIT SUISSE F INANCIAL SERVICES
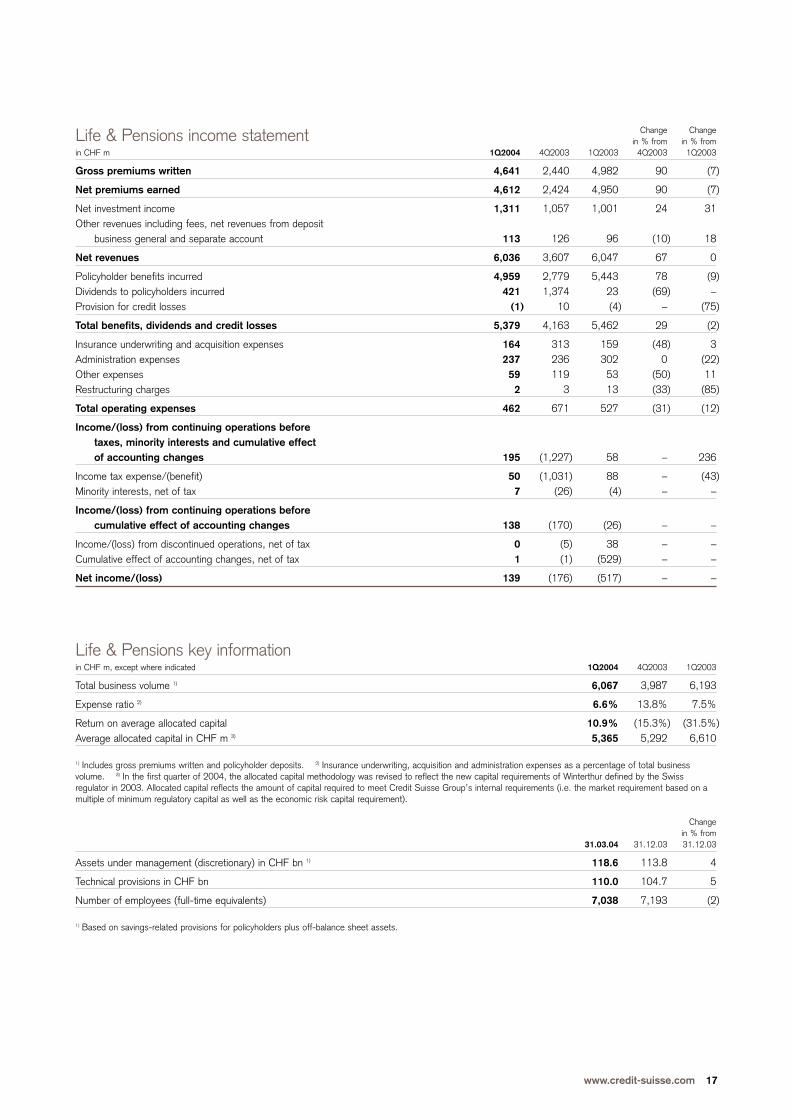
Life & Pensions In the first quarter of 2004, Life & Pensions reported netincome of CHF 139 million, compared to a net loss ofCHF 517 million in the first quarter of 2003. This strongquarterly result was positively impacted by a high level ofinvestment income and the continued containment ofadministration expenses, and included a charge due tothe introduction of the new legislation for the Swissemployee benefit business.
This significant change compared to thecorresponding quarter of 2003 was primarily driven bythe impact on the first quarter of 2003 of the cumulativeeffect of a change in accounting for provisions forpolicyholder guarantees and annuities, which wererequired as a result of new accounting rules. Theseprovisions primarily impacted deferred annuities for theregulated Swiss employee benefit business. Life &Pensions recorded an initial provision of CHF 529 million,net of tax, in the first quarter of 2003 to reflect thecumulative effect of this accounting change.
Total business volume, which includes deposits frompolicyholders and gross premiums written, declined 2%compared to the corresponding quarter of 2003. Depositbusiness increased CHF 215 million, or 18%, versus thefirst quarter of 2003, reflecting Life & Pensions’ strategyof introducing investment-type products such as unit-linked policies. Gross premiums written were down CHF341 million, or 7%, to CHF 4.6 billion, reflecting lowervolumes in group life and individual business. Net newassets amounted to CHF 2.1 billion in the first quarter of2004, compared to CHF 2.2 billion in the first quarter of2003.
Compared to the first quarter of the previous year, netinvestment income increased by CHF 310 million to CHF1.3 billion. This high level of net investment income in
the first quarter of 2004 primarily reflected net realizedgains, resulting from active portfolio management andthe effect of modest losses on equity investments,compared to the corresponding quarter of the previousyear. In the first quarter of 2004, the net investmentreturn backing traditional life policies amounted to 5.6%,compared to 4.5% in the first quarter of 2003. Currentincome in the first quarter of 2004 was 3.8%, andrealized gains amounted to 1.8%.
In the first quarter of 2004, insurance underwritingand acquisition expenses were almost flat, whereasadministration expenses were down CHF 65 millioncompared to the first quarter of 2003. The expense ratioimproved by 0.9 percentage points to 6.6%.
On March 24, 2004, the Swiss government passedlegislation that provides for a mandatory participation inprofits to policyholders in respect of the regulatedemployee benefit business in Switzerland. In addition tothe ongoing allocation to policyholders in respect of thisbusiness, initial provisions reflecting this legislation wererecorded in the first quarter of 2004 and amounted toCHF 117 million, with an after-tax impact of CHF 91million.
1Q2004 4Q2003 1Q2003
Cost/income ratio 62.8% 66.8% 67.2%
Net new assets in CHF bn 0.9 0.3 0.2
Return on average allocated capital 15.1% 4.0% 12.5%Average allocated capital in CHF m 5,001 5,004 4,970
Corporate & Retail Banking key information
Changein % from
31.03.04 31.12.03 31.12.03
Assets under management in CHF bn 54.4 53.6 1
Total assets in CHF bn 101.5 98.5 3
Mortgages in CHF bn 60.8 59.8 2
Other loans in CHF bn 25.9 25.1 3
Number of branches 214 214 –
Number of employees (full-time equivalents) 8,265 8,479 (3)
www.credit-suisse.com 17
Change Changein % from in % from
in CHF m 1Q2004 4Q2003 1Q2003 4Q2003 1Q2003
Gross premiums written 4,641 2,440 4,982 90 (7)
Net premiums earned 4,612 2,424 4,950 90 (7)
Net investment income 1,311 1,057 1,001 24 31Other revenues including fees, net revenues from deposit
business general and separate account 113 126 96 (10) 18
Net revenues 6,036 3,607 6,047 67 0
Policyholder benefits incurred 4,959 2,779 5,443 78 (9)Dividends to policyholders incurred 421 1,374 23 (69) –Provision for credit losses (1) 10 (4) – (75)
Total benefits, dividends and credit losses 5,379 4,163 5,462 29 (2)
Insurance underwriting and acquisition expenses 164 313 159 (48) 3Administration expenses 237 236 302 0 (22)Other expenses 59 119 53 (50) 11Restructuring charges 2 3 13 (33) (85)
Total operating expenses 462 671 527 (31) (12)
Income/(loss) from continuing operations before taxes, minority interests and cumulative effect of accounting changes 195 (1,227) 58 – 236
Income tax expense/(benefit) 50 (1,031) 88 – (43)Minority interests, net of tax 7 (26) (4) – –
Income/(loss) from continuing operations before cumulative effect of accounting changes 138 (170) (26) – –
Income/(loss) from discontinued operations, net of tax 0 (5) 38 – –Cumulative effect of accounting changes, net of tax 1 (1) (529) – –
Net income/(loss) 139 (176) (517) – –
Life & Pensions income statement
in CHF m, except where indicated 1Q2004 4Q2003 1Q2003
Total business volume 1) 6,067 3,987 6,193
Expense ratio 2) 6.6% 13.8% 7.5%
Return on average allocated capital 10.9% (15.3%) (31.5%)Average allocated capital in CHF m 3) 5,365 5,292 6,610
1) Includes gross premiums written and policyholder deposits. 2) Insurance underwriting, acquisition and administration expenses as a percentage of total businessvolume. 3) In the first quarter of 2004, the allocated capital methodology was revised to reflect the new capital requirements of Winterthur defined by the Swissregulator in 2003. Allocated capital reflects the amount of capital required to meet Credit Suisse Group’s internal requirements (i.e. the market requirement based on amultiple of minimum regulatory capital as well as the economic risk capital requirement).
Life & Pensions key information
Changein % from
31.03.04 31.12.03 31.12.03
Assets under management (discretionary) in CHF bn 1) 118.6 113.8 4
Technical provisions in CHF bn 110.0 104.7 5
Number of employees (full-time equivalents) 7,038 7,193 (2)
1) Based on savings-related provisions for policyholders plus off-balance sheet assets.
18
REVIEW OF BUSINESS UNITS | CREDIT SUISSE F INANCIAL SERVICES
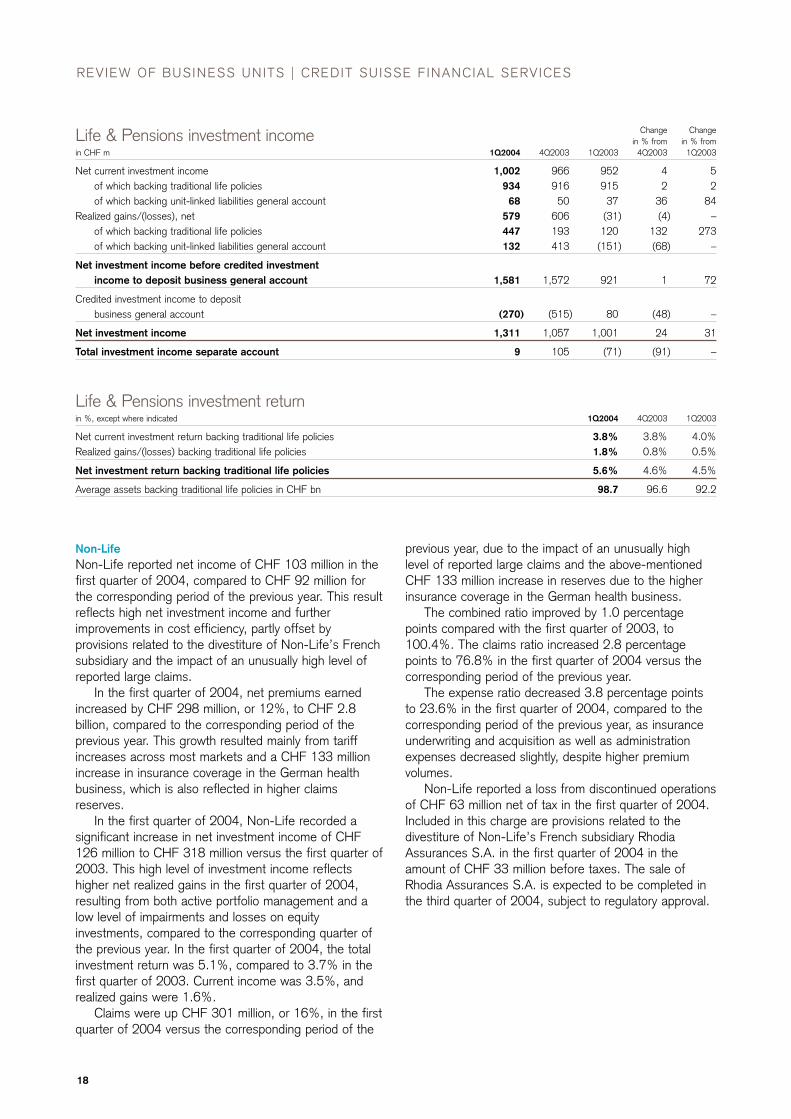
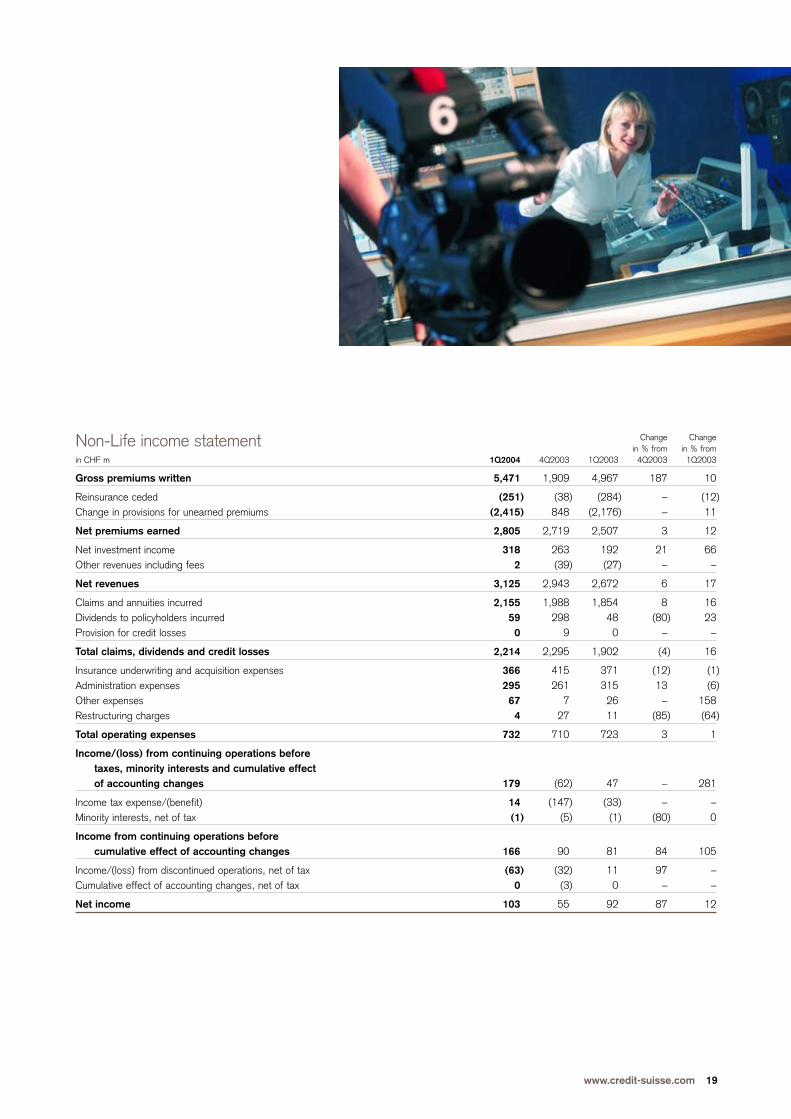
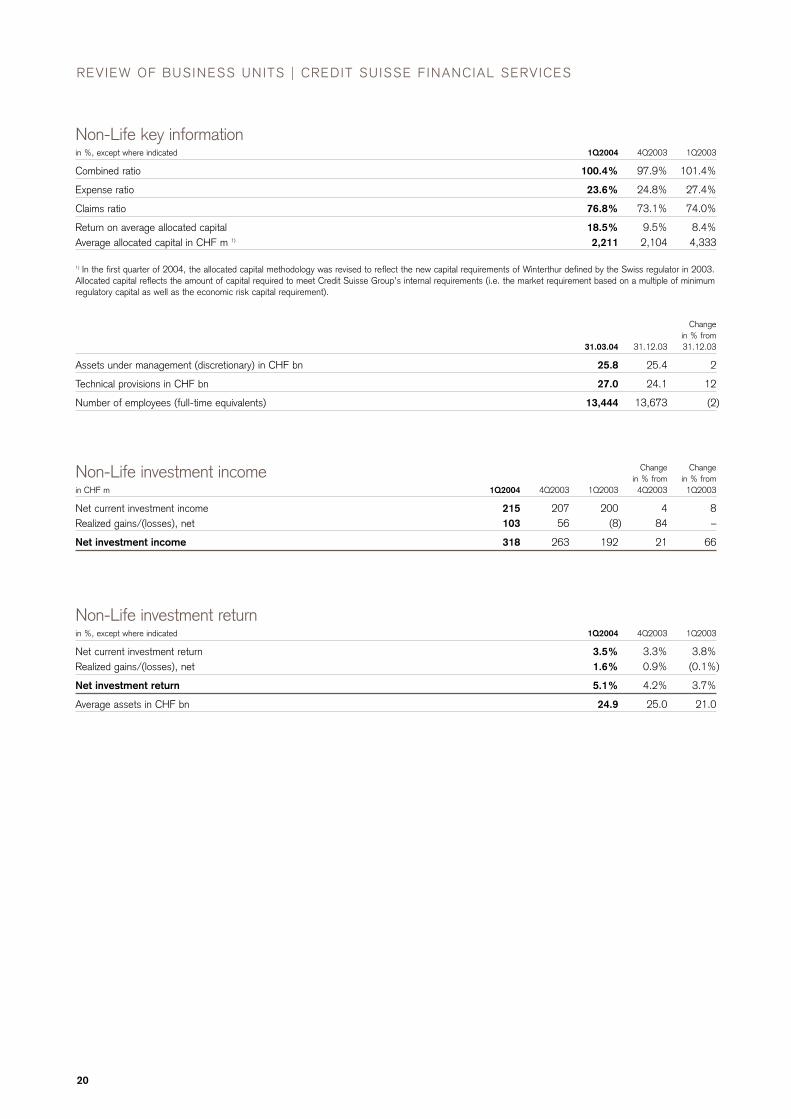
Non-LifeNon-Life reported net income of CHF 103 million in thefirst quarter of 2004, compared to CHF 92 million forthe corresponding period of the previous year. This resultreflects high net investment income and furtherimprovements in cost efficiency, partly offset byprovisions related to the divestiture of Non-Life’s Frenchsubsidiary and the impact of an unusually high level ofreported large claims.
In the first quarter of 2004, net premiums earnedincreased by CHF 298 million, or 12%, to CHF 2.8billion, compared to the corresponding period of theprevious year. This growth resulted mainly from tariffincreases across most markets and a CHF 133 millionincrease in insurance coverage in the German healthbusiness, which is also reflected in higher claimsreserves.
In the first quarter of 2004, Non-Life recorded asignificant increase in net investment income of CHF126 million to CHF 318 million versus the first quarter of2003. This high level of investment income reflectshigher net realized gains in the first quarter of 2004,resulting from both active portfolio management and alow level of impairments and losses on equityinvestments, compared to the corresponding quarter ofthe previous year. In the first quarter of 2004, the totalinvestment return was 5.1%, compared to 3.7% in thefirst quarter of 2003. Current income was 3.5%, andrealized gains were 1.6%.
Claims were up CHF 301 million, or 16%, in the firstquarter of 2004 versus the corresponding period of the
previous year, due to the impact of an unusually highlevel of reported large claims and the above-mentionedCHF 133 million increase in reserves due to the higherinsurance coverage in the German health business.
The combined ratio improved by 1.0 percentagepoints compared with the first quarter of 2003, to100.4%. The claims ratio increased 2.8 percentagepoints to 76.8% in the first quarter of 2004 versus thecorresponding period of the previous year.
The expense ratio decreased 3.8 percentage pointsto 23.6% in the first quarter of 2004, compared to thecorresponding period of the previous year, as insuranceunderwriting and acquisition as well as administrationexpenses decreased slightly, despite higher premiumvolumes.
Non-Life reported a loss from discontinued operationsof CHF 63 million net of tax in the first quarter of 2004.Included in this charge are provisions related to thedivestiture of Non-Life’s French subsidiary RhodiaAssurances S.A. in the first quarter of 2004 in theamount of CHF 33 million before taxes. The sale ofRhodia Assurances S.A. is expected to be completed inthe third quarter of 2004, subject to regulatory approval.
Change Changein % from in % from
in CHF m 1Q2004 4Q2003 1Q2003 4Q2003 1Q2003
Net current investment income 1,002 966 952 4 5of which backing traditional life policies 934 916 915 2 2of which backing unit-linked liabilities general account 68 50 37 36 84
Realized gains/(losses), net 579 606 (31) (4) –of which backing traditional life policies 447 193 120 132 273of which backing unit-linked liabilities general account 132 413 (151) (68) –
Net investment income before credited investment income to deposit business general account 1,581 1,572 921 1 72
Credited investment income to deposit business general account (270) (515) 80 (48) –
Net investment income 1,311 1,057 1,001 24 31
Total investment income separate account 9 105 (71) (91) –
Life & Pensions investment income
in %, except where indicated 1Q2004 4Q2003 1Q2003
Net current investment return backing traditional life policies 3.8% 3.8% 4.0%Realized gains/(losses) backing traditional life policies 1.8% 0.8% 0.5%
Net investment return backing traditional life policies 5.6% 4.6% 4.5%
Average assets backing traditional life policies in CHF bn 98.7 96.6 92.2
Life & Pensions investment return
www.credit-suisse.com 19
Change Changein % from in % from
in CHF m 1Q2004 4Q2003 1Q2003 4Q2003 1Q2003
Gross premiums written 5,471 1,909 4,967 187 10
Reinsurance ceded (251) (38) (284) – (12)Change in provisions for unearned premiums (2,415) 848 (2,176) – 11
Net premiums earned 2,805 2,719 2,507 3 12
Net investment income 318 263 192 21 66Other revenues including fees 2 (39) (27) – –
Net revenues 3,125 2,943 2,672 6 17
Claims and annuities incurred 2,155 1,988 1,854 8 16Dividends to policyholders incurred 59 298 48 (80) 23Provision for credit losses 0 9 0 – –
Total claims, dividends and credit losses 2,214 2,295 1,902 (4) 16
Insurance underwriting and acquisition expenses 366 415 371 (12) (1)Administration expenses 295 261 315 13 (6)Other expenses 67 7 26 – 158Restructuring charges 4 27 11 (85) (64)
Total operating expenses 732 710 723 3 1
Income/(loss) from continuing operations before taxes, minority interests and cumulative effect of accounting changes 179 (62) 47 – 281
Income tax expense/(benefit) 14 (147) (33) – –Minority interests, net of tax (1) (5) (1) (80) 0
Income from continuing operations before cumulative effect of accounting changes 166 90 81 84 105
Income/(loss) from discontinued operations, net of tax (63) (32) 11 97 –Cumulative effect of accounting changes, net of tax 0 (3) 0 – –
Net income 103 55 92 87 12
Non-Life income statement
20
REVIEW OF BUSINESS UNITS | CREDIT SUISSE F INANCIAL SERVICES
in %, except where indicated 1Q2004 4Q2003 1Q2003
Combined ratio 100.4% 97.9% 101.4%
Expense ratio 23.6% 24.8% 27.4%
Claims ratio 76.8% 73.1% 74.0%
Return on average allocated capital 18.5% 9.5% 8.4%Average allocated capital in CHF m 1) 2,211 2,104 4,333
1) In the first quarter of 2004, the allocated capital methodology was revised to reflect the new capital requirements of Winterthur defined by the Swiss regulator in 2003.Allocated capital reflects the amount of capital required to meet Credit Suisse Group’s internal requirements (i.e. the market requirement based on a multiple of minimumregulatory capital as well as the economic risk capital requirement).
Non-Life key information
Changein % from
31.03.04 31.12.03 31.12.03
Assets under management (discretionary) in CHF bn 25.8 25.4 2
Technical provisions in CHF bn 27.0 24.1 12
Number of employees (full-time equivalents) 13,444 13,673 (2)
Change Changein % from in % from
in CHF m 1Q2004 4Q2003 1Q2003 4Q2003 1Q2003
Net current investment income 215 207 200 4 8Realized gains/(losses), net 103 56 (8) 84 –
Net investment income 318 263 192 21 66
Non-Life investment income
in %, except where indicated 1Q2004 4Q2003 1Q2003
Net current investment return 3.5% 3.3% 3.8%Realized gains/(losses), net 1.6% 0.9% (0.1%)
Net investment return 5.1% 4.2% 3.7%
Average assets in CHF bn 24.9 25.0 21.0
Non-Life investment return
www.credit-suisse.com 21
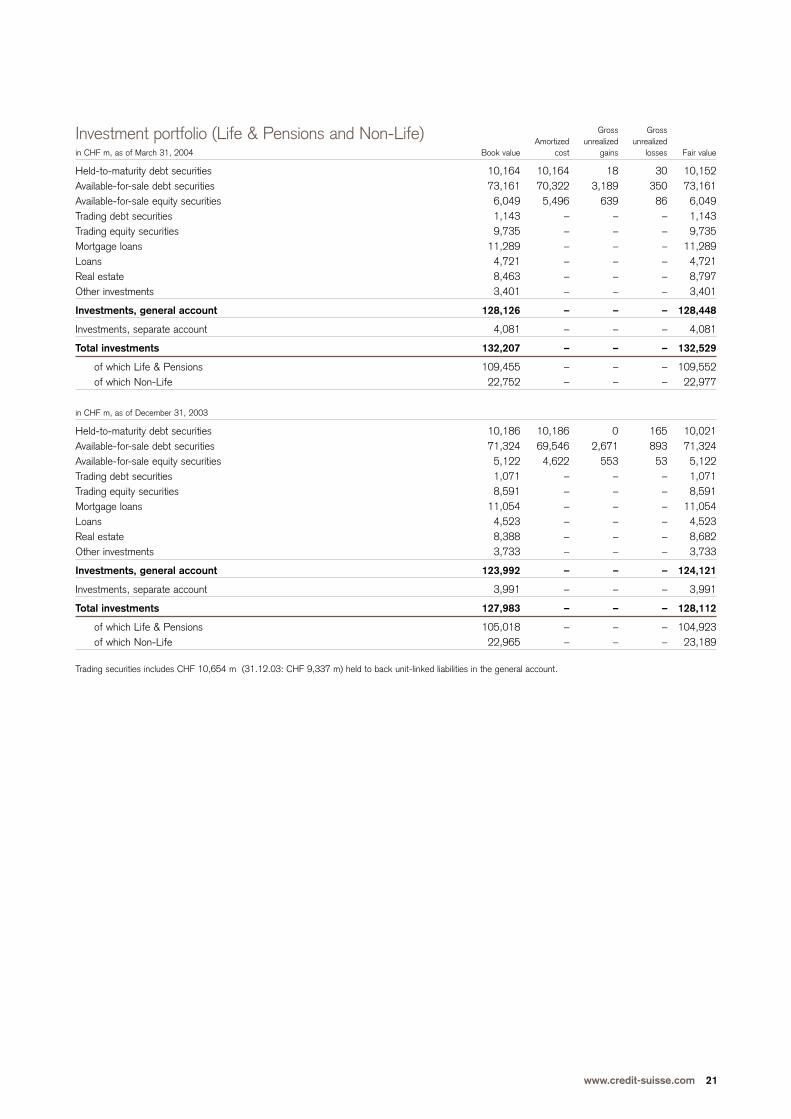
Gross GrossAmortized unrealized unrealized
in CHF m, as of March 31, 2004 Book value cost gains losses Fair value
Held-to-maturity debt securities 10,164 10,164 18 30 10,152Available-for-sale debt securities 73,161 70,322 3,189 350 73,161Available-for-sale equity securities 6,049 5,496 639 86 6,049Trading debt securities 1,143 – – – 1,143Trading equity securities 9,735 – – – 9,735Mortgage loans 11,289 – – – 11,289Loans 4,721 – – – 4,721Real estate 8,463 – – – 8,797Other investments 3,401 – – – 3,401
Investments, general account 128,126 – – – 128,448
Investments, separate account 4,081 – – – 4,081
Total investments 132,207 – – – 132,529
of which Life & Pensions 109,455 – – – 109,552of which Non-Life 22,752 – – – 22,977
in CHF m, as of December 31, 2003
Held-to-maturity debt securities 10,186 10,186 0 165 10,021Available-for-sale debt securities 71,324 69,546 2,671 893 71,324Available-for-sale equity securities 5,122 4,622 553 53 5,122Trading debt securities 1,071 – – – 1,071Trading equity securities 8,591 – – – 8,591Mortgage loans 11,054 – – – 11,054Loans 4,523 – – – 4,523Real estate 8,388 – – – 8,682Other investments 3,733 – – – 3,733
Investments, general account 123,992 – – – 124,121
Investments, separate account 3,991 – – – 3,991
Total investments 127,983 – – – 128,112
of which Life & Pensions 105,018 – – – 104,923of which Non-Life 22,965 – – – 23,189
Trading securities includes CHF 10,654 m (31.12.03: CHF 9,337 m) held to back unit-linked liabilities in the general account.
Investment portfolio (Life & Pensions and Non-Life)
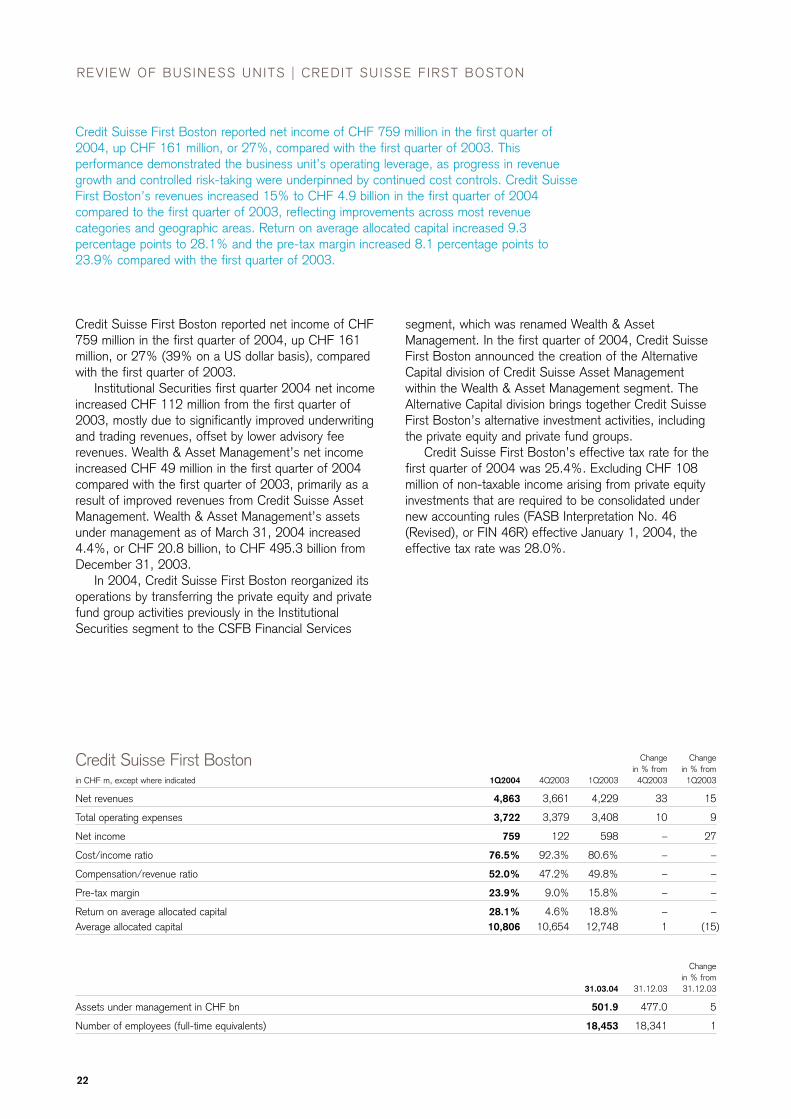
Credit Suisse First Boston reported net income of CHF 759 million in the first quarter of2004, up CHF 161 million, or 27%, compared with the first quarter of 2003. Thisperformance demonstrated the business unit’s operating leverage, as progress in revenuegrowth and controlled risk-taking were underpinned by continued cost controls. Credit SuisseFirst Boston’s revenues increased 15% to CHF 4.9 billion in the first quarter of 2004compared to the first quarter of 2003, reflecting improvements across most revenuecategories and geographic areas. Return on average allocated capital increased 9.3percentage points to 28.1% and the pre-tax margin increased 8.1 percentage points to23.9% compared with the first quarter of 2003.
Change Changein % from in % from
in CHF m, except where indicated 1Q2004 4Q2003 1Q2003 4Q2003 1Q2003
Net revenues 4,863 3,661 4,229 33 15
Total operating expenses 3,722 3,379 3,408 10 9
Net income 759 122 598 – 27
Cost/income ratio 76.5% 92.3% 80.6% – –
Compensation/revenue ratio 52.0% 47.2% 49.8% – –
Pre-tax margin 23.9% 9.0% 15.8% – –
Return on average allocated capital 28.1% 4.6% 18.8% – –Average allocated capital 10,806 10,654 12,748 1 (15)
Credit Suisse First Boston
22
REVIEW OF BUSINESS UNITS | CREDIT SUISSE F IRST BOSTON
Credit Suisse First Boston reported net income of CHF759 million in the first quarter of 2004, up CHF 161million, or 27% (39% on a US dollar basis), comparedwith the first quarter of 2003.
Institutional Securities first quarter 2004 net incomeincreased CHF 112 million from the first quarter of2003, mostly due to significantly improved underwritingand trading revenues, offset by lower advisory feerevenues. Wealth & Asset Management’s net incomeincreased CHF 49 million in the first quarter of 2004compared with the first quarter of 2003, primarily as aresult of improved revenues from Credit Suisse AssetManagement. Wealth & Asset Management’s assetsunder management as of March 31, 2004 increased4.4%, or CHF 20.8 billion, to CHF 495.3 billion fromDecember 31, 2003.
In 2004, Credit Suisse First Boston reorganized itsoperations by transferring the private equity and privatefund group activities previously in the InstitutionalSecurities segment to the CSFB Financial Services
segment, which was renamed Wealth & AssetManagement. In the first quarter of 2004, Credit SuisseFirst Boston announced the creation of the AlternativeCapital division of Credit Suisse Asset Managementwithin the Wealth & Asset Management segment. TheAlternative Capital division brings together Credit SuisseFirst Boston’s alternative investment activities, includingthe private equity and private fund groups.
Credit Suisse First Boston’s effective tax rate for thefirst quarter of 2004 was 25.4%. Excluding CHF 108million of non-taxable income arising from private equityinvestments that are required to be consolidated undernew accounting rules (FASB Interpretation No. 46(Revised), or FIN 46R) effective January 1, 2004, theeffective tax rate was 28.0%.
Changein % from
31.03.04 31.12.03 31.12.03
Assets under management in CHF bn 501.9 477.0 5
Number of employees (full-time equivalents) 18,453 18,341 1
www.credit-suisse.com 23
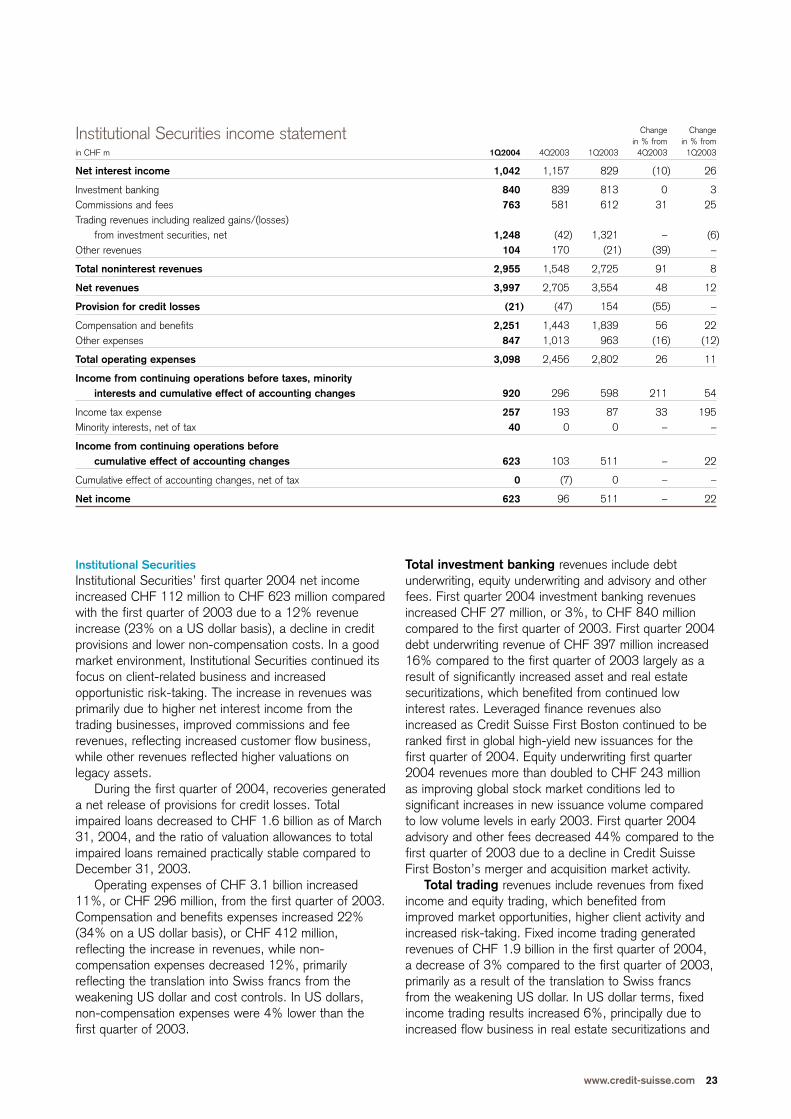
Institutional SecuritiesInstitutional Securities’ first quarter 2004 net incomeincreased CHF 112 million to CHF 623 million comparedwith the first quarter of 2003 due to a 12% revenueincrease (23% on a US dollar basis), a decline in creditprovisions and lower non-compensation costs. In a goodmarket environment, Institutional Securities continued itsfocus on client-related business and increasedopportunistic risk-taking. The increase in revenues wasprimarily due to higher net interest income from thetrading businesses, improved commissions and feerevenues, reflecting increased customer flow business,while other revenues reflected higher valuations onlegacy assets.
During the first quarter of 2004, recoveries generateda net release of provisions for credit losses. Totalimpaired loans decreased to CHF 1.6 billion as of March31, 2004, and the ratio of valuation allowances to totalimpaired loans remained practically stable compared toDecember 31, 2003.
Operating expenses of CHF 3.1 billion increased11%, or CHF 296 million, from the first quarter of 2003.Compensation and benefits expenses increased 22%(34% on a US dollar basis), or CHF 412 million,reflecting the increase in revenues, while non-compensation expenses decreased 12%, primarilyreflecting the translation into Swiss francs from theweakening US dollar and cost controls. In US dollars,non-compensation expenses were 4% lower than thefirst quarter of 2003.
Change Changein % from in % from
in CHF m 1Q2004 4Q2003 1Q2003 4Q2003 1Q2003
Net interest income 1,042 1,157 829 (10) 26
Investment banking 840 839 813 0 3Commissions and fees 763 581 612 31 25Trading revenues including realized gains/(losses)
from investment securities, net 1,248 (42) 1,321 – (6)Other revenues 104 170 (21) (39) –
Total noninterest revenues 2,955 1,548 2,725 91 8
Net revenues 3,997 2,705 3,554 48 12
Provision for credit losses (21) (47) 154 (55) –
Compensation and benefits 2,251 1,443 1,839 56 22Other expenses 847 1,013 963 (16) (12)
Total operating expenses 3,098 2,456 2,802 26 11
Income from continuing operations before taxes, minority interests and cumulative effect of accounting changes 920 296 598 211 54
Income tax expense 257 193 87 33 195Minority interests, net of tax 40 0 0 – –
Income from continuing operations before cumulative effect of accounting changes 623 103 511 – 22
Cumulative effect of accounting changes, net of tax 0 (7) 0 – –
Net income 623 96 511 – 22
Institutional Securities income statement
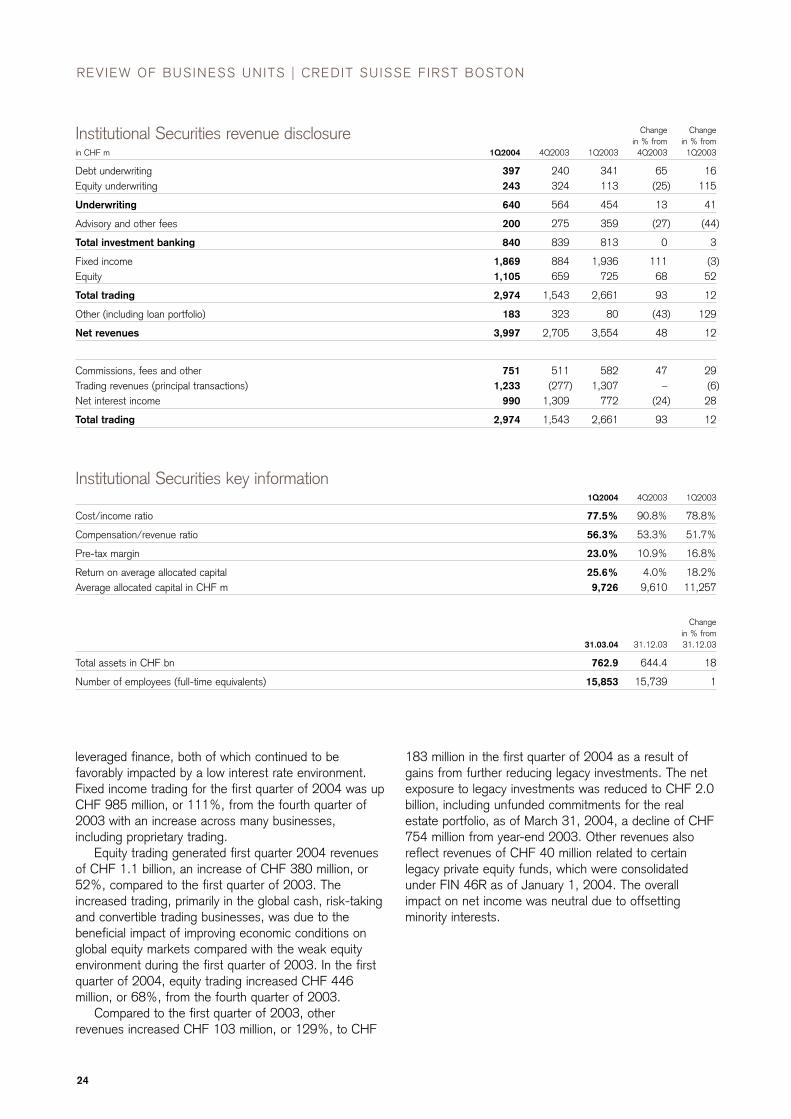
Total investment banking revenues include debtunderwriting, equity underwriting and advisory and otherfees. First quarter 2004 investment banking revenuesincreased CHF 27 million, or 3%, to CHF 840 millioncompared to the first quarter of 2003. First quarter 2004debt underwriting revenue of CHF 397 million increased16% compared to the first quarter of 2003 largely as aresult of significantly increased asset and real estatesecuritizations, which benefited from continued lowinterest rates. Leveraged finance revenues alsoincreased as Credit Suisse First Boston continued to beranked first in global high-yield new issuances for thefirst quarter of 2004. Equity underwriting first quarter2004 revenues more than doubled to CHF 243 millionas improving global stock market conditions led tosignificant increases in new issuance volume comparedto low volume levels in early 2003. First quarter 2004advisory and other fees decreased 44% compared to thefirst quarter of 2003 due to a decline in Credit SuisseFirst Boston’s merger and acquisition market activity.
Total trading revenues include revenues from fixedincome and equity trading, which benefited fromimproved market opportunities, higher client activity andincreased risk-taking. Fixed income trading generatedrevenues of CHF 1.9 billion in the first quarter of 2004,a decrease of 3% compared to the first quarter of 2003,primarily as a result of the translation to Swiss francsfrom the weakening US dollar. In US dollar terms, fixedincome trading results increased 6%, principally due toincreased flow business in real estate securitizations and
24
REVIEW OF BUSINESS UNITS | CREDIT SUISSE F IRST BOSTON
leveraged finance, both of which continued to befavorably impacted by a low interest rate environment.Fixed income trading for the first quarter of 2004 was upCHF 985 million, or 111%, from the fourth quarter of2003 with an increase across many businesses,including proprietary trading.
Equity trading generated first quarter 2004 revenuesof CHF 1.1 billion, an increase of CHF 380 million, or52%, compared to the first quarter of 2003. Theincreased trading, primarily in the global cash, risk-takingand convertible trading businesses, was due to thebeneficial impact of improving economic conditions onglobal equity markets compared with the weak equityenvironment during the first quarter of 2003. In the firstquarter of 2004, equity trading increased CHF 446million, or 68%, from the fourth quarter of 2003.
Compared to the first quarter of 2003, otherrevenues increased CHF 103 million, or 129%, to CHF
183 million in the first quarter of 2004 as a result ofgains from further reducing legacy investments. The netexposure to legacy investments was reduced to CHF 2.0billion, including unfunded commitments for the realestate portfolio, as of March 31, 2004, a decline of CHF754 million from year-end 2003. Other revenues alsoreflect revenues of CHF 40 million related to certainlegacy private equity funds, which were consolidatedunder FIN 46R as of January 1, 2004. The overallimpact on net income was neutral due to offsettingminority interests.
Change Changein % from in % from
in CHF m 1Q2004 4Q2003 1Q2003 4Q2003 1Q2003
Debt underwriting 397 240 341 65 16Equity underwriting 243 324 113 (25) 115
Underwriting 640 564 454 13 41
Advisory and other fees 200 275 359 (27) (44)
Total investment banking 840 839 813 0 3
Fixed income 1,869 884 1,936 111 (3)Equity 1,105 659 725 68 52
Total trading 2,974 1,543 2,661 93 12
Other (including loan portfolio) 183 323 80 (43) 129
Net revenues 3,997 2,705 3,554 48 12
Commissions, fees and other 751 511 582 47 29Trading revenues (principal transactions) 1,233 (277) 1,307 – (6)Net interest income 990 1,309 772 (24) 28
Total trading 2,974 1,543 2,661 93 12
Institutional Securities revenue disclosure
1Q2004 4Q2003 1Q2003
Cost/income ratio 77.5% 90.8% 78.8%
Compensation/revenue ratio 56.3% 53.3% 51.7%
Pre-tax margin 23.0% 10.9% 16.8%
Return on average allocated capital 25.6% 4.0% 18.2%Average allocated capital in CHF m 9,726 9,610 11,257
Institutional Securities key information
Changein % from
31.03.04 31.12.03 31.12.03
Total assets in CHF bn 762.9 644.4 18
Number of employees (full-time equivalents) 15,853 15,739 1
www.credit-suisse.com 25
Change Changein % from in % from
in CHF m 1Q2004 4Q2003 1Q2003 4Q2003 1Q2003
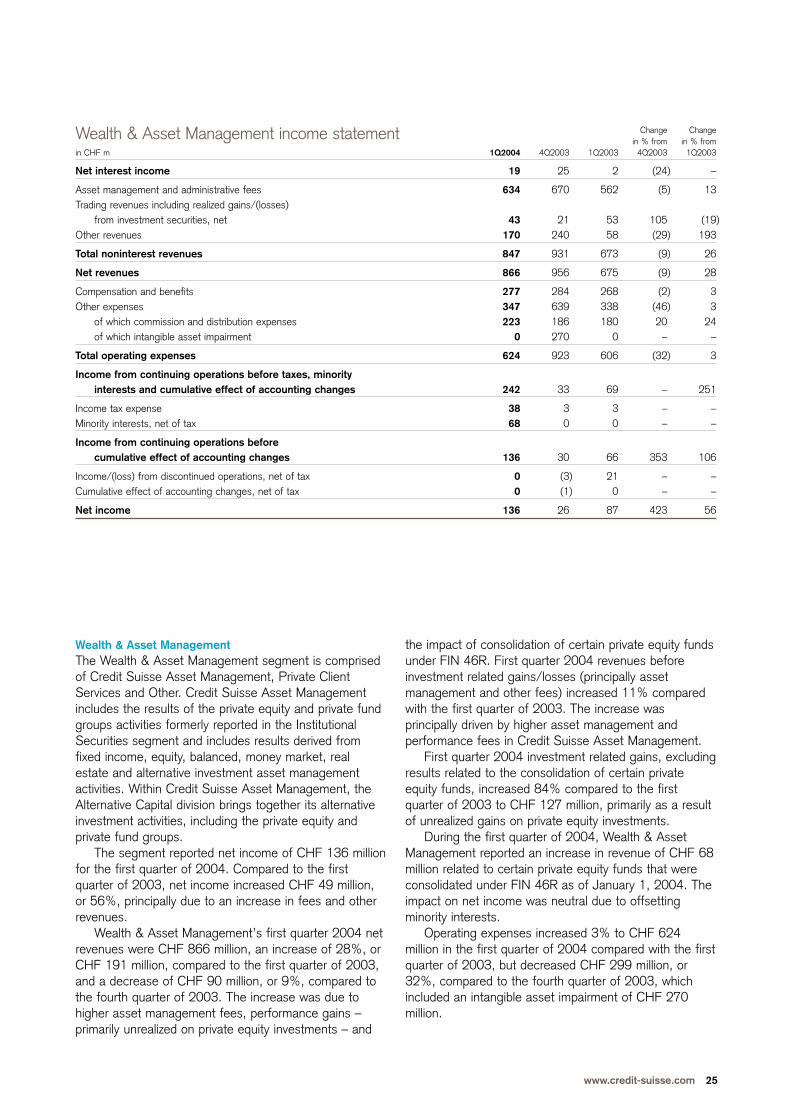
Net interest income 19 25 2 (24) –
Asset management and administrative fees 634 670 562 (5) 13Trading revenues including realized gains/(losses)
from investment securities, net 43 21 53 105 (19)Other revenues 170 240 58 (29) 193
Total noninterest revenues 847 931 673 (9) 26
Net revenues 866 956 675 (9) 28
Compensation and benefits 277 284 268 (2) 3Other expenses 347 639 338 (46) 3
of which commission and distribution expenses 223 186 180 20 24of which intangible asset impairment 0 270 0 – –
Total operating expenses 624 923 606 (32) 3
Income from continuing operations before taxes, minority interests and cumulative effect of accounting changes 242 33 69 – 251
Income tax expense 38 3 3 – –Minority interests, net of tax 68 0 0 – –
Income from continuing operations before cumulative effect of accounting changes 136 30 66 353 106
Income/(loss) from discontinued operations, net of tax 0 (3) 21 – –Cumulative effect of accounting changes, net of tax 0 (1) 0 – –
Net income 136 26 87 423 56
Wealth & Asset Management income statement
Wealth & Asset ManagementThe Wealth & Asset Management segment is comprisedof Credit Suisse Asset Management, Private ClientServices and Other. Credit Suisse Asset Managementincludes the results of the private equity and private fundgroups activities formerly reported in the InstitutionalSecurities segment and includes results derived fromfixed income, equity, balanced, money market, realestate and alternative investment asset managementactivities. Within Credit Suisse Asset Management, theAlternative Capital division brings together its alternativeinvestment activities, including the private equity andprivate fund groups.
The segment reported net income of CHF 136 millionfor the first quarter of 2004. Compared to the firstquarter of 2003, net income increased CHF 49 million,or 56%, principally due to an increase in fees and otherrevenues.
Wealth & Asset Management’s first quarter 2004 netrevenues were CHF 866 million, an increase of 28%, orCHF 191 million, compared to the first quarter of 2003,and a decrease of CHF 90 million, or 9%, compared tothe fourth quarter of 2003. The increase was due tohigher asset management fees, performance gains –primarily unrealized on private equity investments – and
the impact of consolidation of certain private equity fundsunder FIN 46R. First quarter 2004 revenues beforeinvestment related gains/losses (principally assetmanagement and other fees) increased 11% comparedwith the first quarter of 2003. The increase wasprincipally driven by higher asset management andperformance fees in Credit Suisse Asset Management.
First quarter 2004 investment related gains, excludingresults related to the consolidation of certain privateequity funds, increased 84% compared to the firstquarter of 2003 to CHF 127 million, primarily as a resultof unrealized gains on private equity investments.
During the first quarter of 2004, Wealth & AssetManagement reported an increase in revenue of CHF 68million related to certain private equity funds that wereconsolidated under FIN 46R as of January 1, 2004. Theimpact on net income was neutral due to offsettingminority interests.
Operating expenses increased 3% to CHF 624million in the first quarter of 2004 compared with the firstquarter of 2003, but decreased CHF 299 million, or32%, compared to the fourth quarter of 2003, whichincluded an intangible asset impairment of CHF 270million.
26
REVIEW OF BUSINESS UNITS | CREDIT SUISSE F IRST BOSTON
Change Changein % from in % from
in CHF m 1Q2004 4Q2003 1Q2003 4Q2003 1Q2003
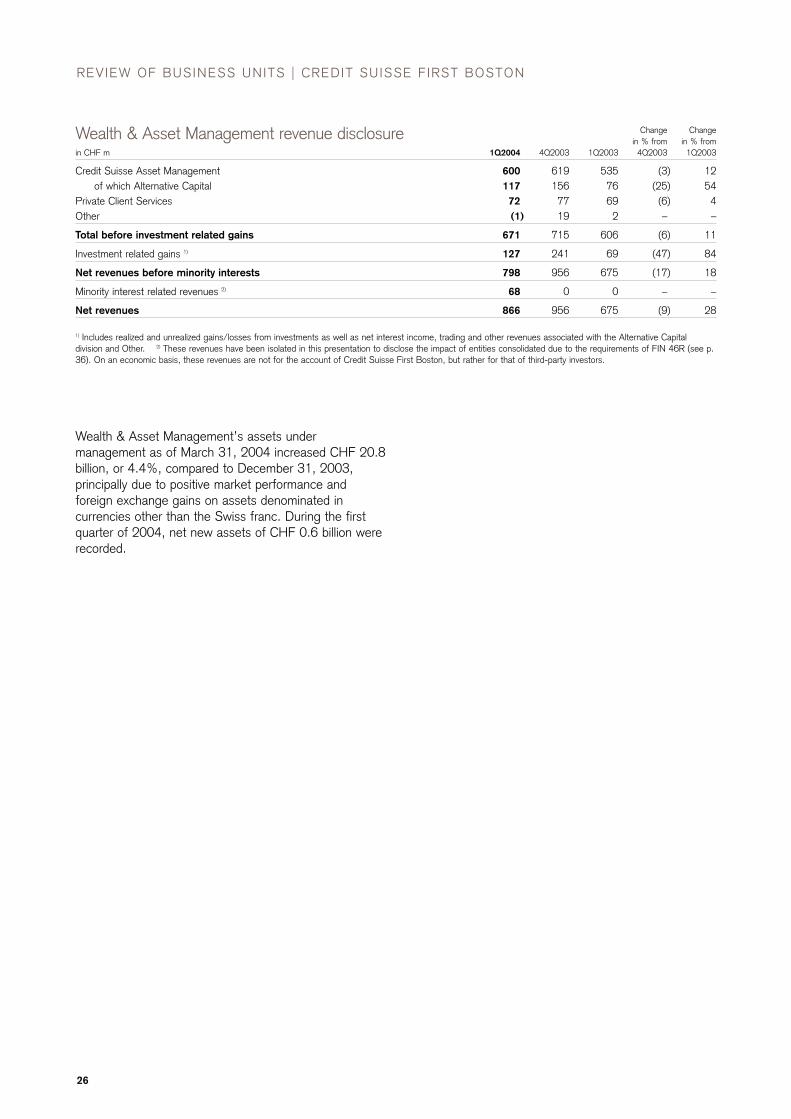
Credit Suisse Asset Management 600 619 535 (3) 12of which Alternative Capital 117 156 76 (25) 54
Private Client Services 72 77 69 (6) 4Other (1) 19 2 – –
Total before investment related gains 671 715 606 (6) 11
Investment related gains 1) 127 241 69 (47) 84
Net revenues before minority interests 798 956 675 (17) 18
Minority interest related revenues 2) 68 0 0 – –
Net revenues 866 956 675 (9) 28
1) Includes realized and unrealized gains/losses from investments as well as net interest income, trading and other revenues associated with the Alternative Capitaldivision and Other. 2) These revenues have been isolated in this presentation to disclose the impact of entities consolidated due to the requirements of FIN 46R (see p.36). On an economic basis, these revenues are not for the account of Credit Suisse First Boston, but rather for that of third-party investors.
Wealth & Asset Management revenue disclosure
Wealth & Asset Management’s assets undermanagement as of March 31, 2004 increased CHF 20.8billion, or 4.4%, compared to December 31, 2003,principally due to positive market performance andforeign exchange gains on assets denominated incurrencies other than the Swiss franc. During the firstquarter of 2004, net new assets of CHF 0.6 billion wererecorded.
www.credit-suisse.com 27
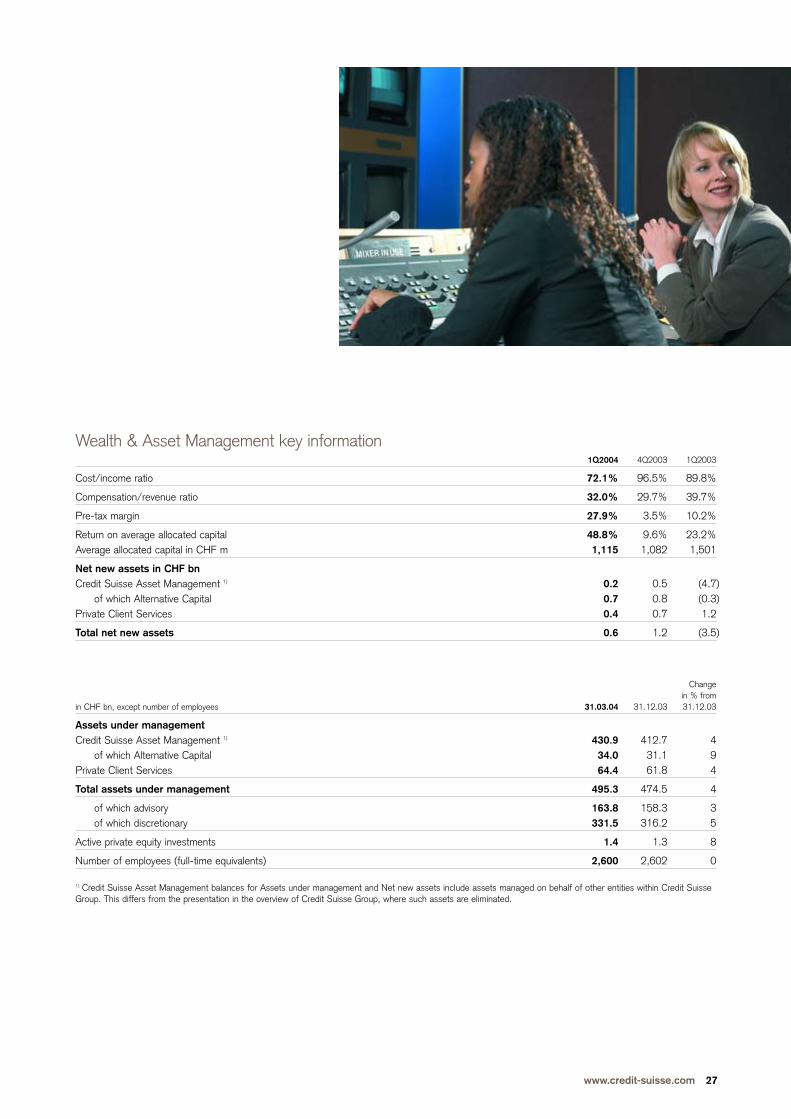
1Q2004 4Q2003 1Q2003
Cost/income ratio 72.1% 96.5% 89.8%
Compensation/revenue ratio 32.0% 29.7% 39.7%
Pre-tax margin 27.9% 3.5% 10.2%
Return on average allocated capital 48.8% 9.6% 23.2%Average allocated capital in CHF m 1,115 1,082 1,501
Net new assets in CHF bn Credit Suisse Asset Management 1) 0.2 0.5 (4.7)
of which Alternative Capital 0.7 0.8 (0.3)Private Client Services 0.4 0.7 1.2
Total net new assets 0.6 1.2 (3.5)
Wealth & Asset Management key information
Changein % from
in CHF bn, except number of employees 31.03.04 31.12.03 31.12.03
Assets under managementCredit Suisse Asset Management 1) 430.9 412.7 4
of which Alternative Capital 34.0 31.1 9Private Client Services 64.4 61.8 4
Total assets under management 495.3 474.5 4
of which advisory 163.8 158.3 3of which discretionary 331.5 316.2 5
Active private equity investments 1.4 1.3 8
Number of employees (full-time equivalents) 2,600 2,602 0
1) Credit Suisse Asset Management balances for Assets under management and Net new assets include assets managed on behalf of other entities within Credit SuisseGroup. This differs from the presentation in the overview of Credit Suisse Group, where such assets are eliminated.
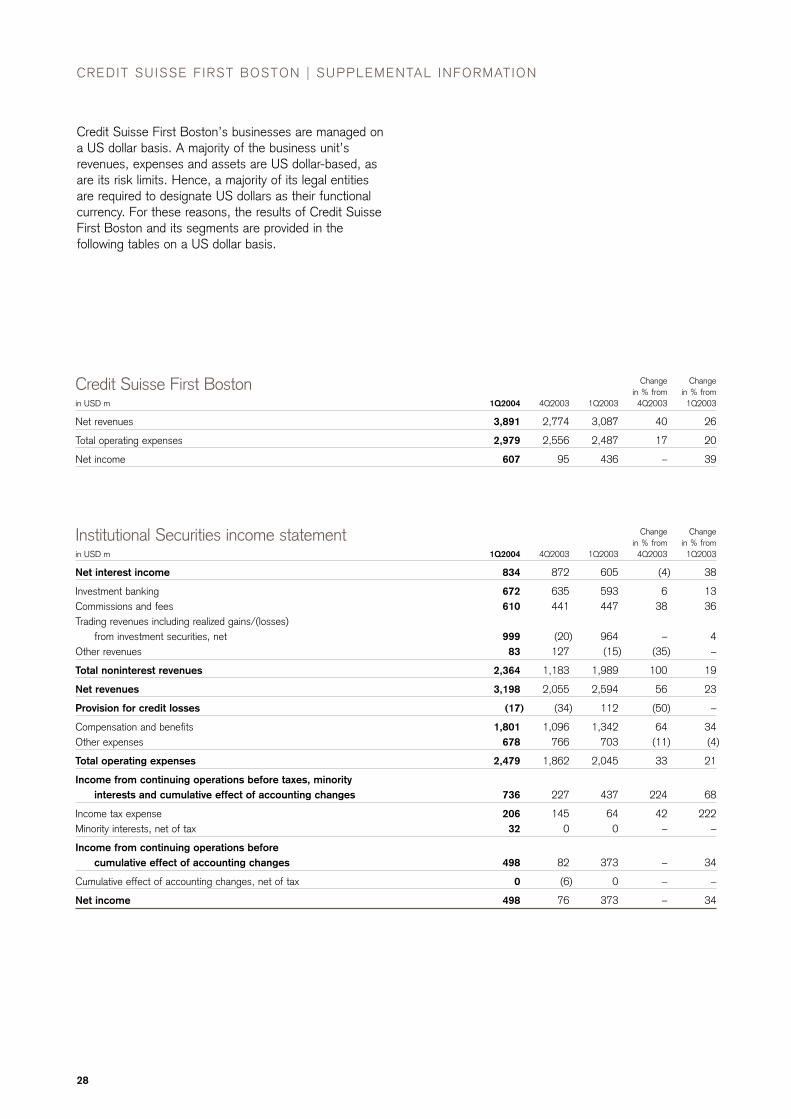
28
CREDIT SUISSE F IRST BOSTON | SUPPLEMENTAL INFORMATION
Change Changein % from in % from
in USD m 1Q2004 4Q2003 1Q2003 4Q2003 1Q2003
Net revenues 3,891 2,774 3,087 40 26
Total operating expenses 2,979 2,556 2,487 17 20
Net income 607 95 436 – 39
Credit Suisse First Boston
Change Changein % from in % from
in USD m 1Q2004 4Q2003 1Q2003 4Q2003 1Q2003
Net interest income 834 872 605 (4) 38
Investment banking 672 635 593 6 13Commissions and fees 610 441 447 38 36Trading revenues including realized gains/(losses)
from investment securities, net 999 (20) 964 – 4Other revenues 83 127 (15) (35) –
Total noninterest revenues 2,364 1,183 1,989 100 19
Net revenues 3,198 2,055 2,594 56 23
Provision for credit losses (17) (34) 112 (50) –
Compensation and benefits 1,801 1,096 1,342 64 34Other expenses 678 766 703 (11) (4)
Total operating expenses 2,479 1,862 2,045 33 21
Income from continuing operations before taxes, minority interests and cumulative effect of accounting changes 736 227 437 224 68
Income tax expense 206 145 64 42 222Minority interests, net of tax 32 0 0 – –
Income from continuing operations before cumulative effect of accounting changes 498 82 373 – 34
Cumulative effect of accounting changes, net of tax 0 (6) 0 – –
Net income 498 76 373 – 34
Institutional Securities income statement
Credit Suisse First Boston’s businesses are managed ona US dollar basis. A majority of the business unit’srevenues, expenses and assets are US dollar-based, asare its risk limits. Hence, a majority of its legal entitiesare required to designate US dollars as their functionalcurrency. For these reasons, the results of Credit SuisseFirst Boston and its segments are provided in thefollowing tables on a US dollar basis.
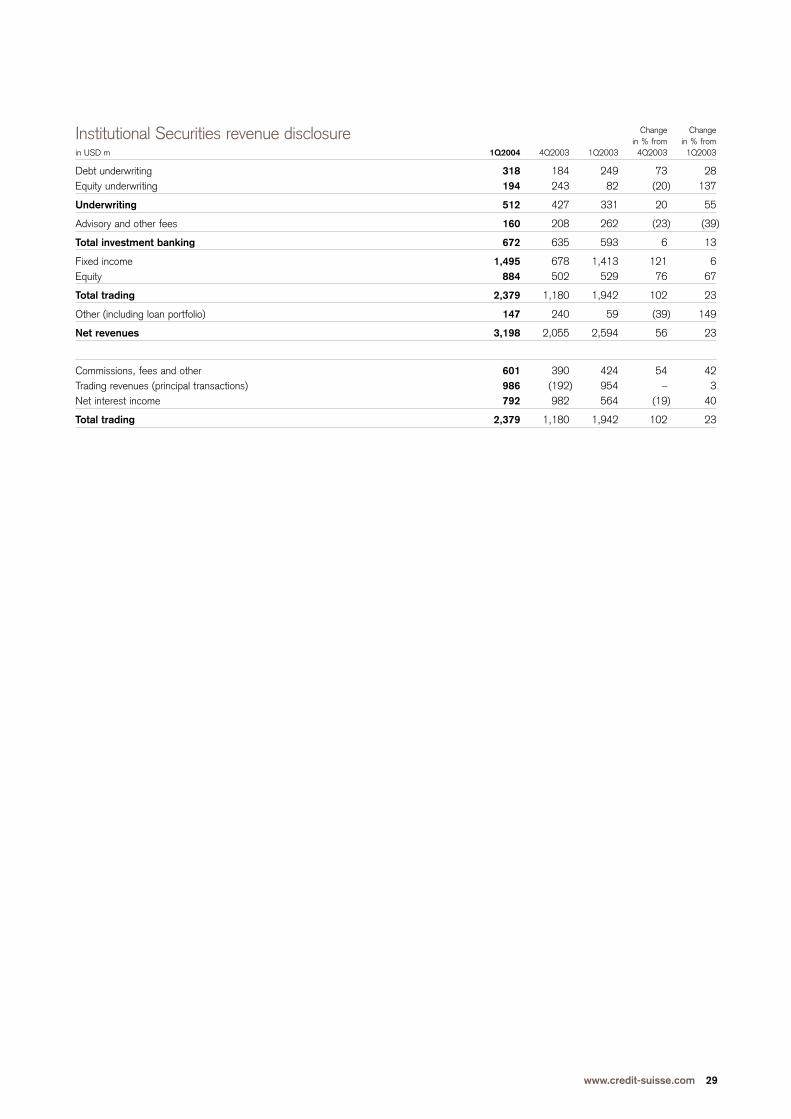
www.credit-suisse.com 29
Change Changein % from in % from
in USD m 1Q2004 4Q2003 1Q2003 4Q2003 1Q2003
Debt underwriting 318 184 249 73 28Equity underwriting 194 243 82 (20) 137
Underwriting 512 427 331 20 55
Advisory and other fees 160 208 262 (23) (39)
Total investment banking 672 635 593 6 13
Fixed income 1,495 678 1,413 121 6Equity 884 502 529 76 67
Total trading 2,379 1,180 1,942 102 23
Other (including loan portfolio) 147 240 59 (39) 149
Net revenues 3,198 2,055 2,594 56 23
Commissions, fees and other 601 390 424 54 42Trading revenues (principal transactions) 986 (192) 954 – 3Net interest income 792 982 564 (19) 40
Total trading 2,379 1,180 1,942 102 23
Institutional Securities revenue disclosure
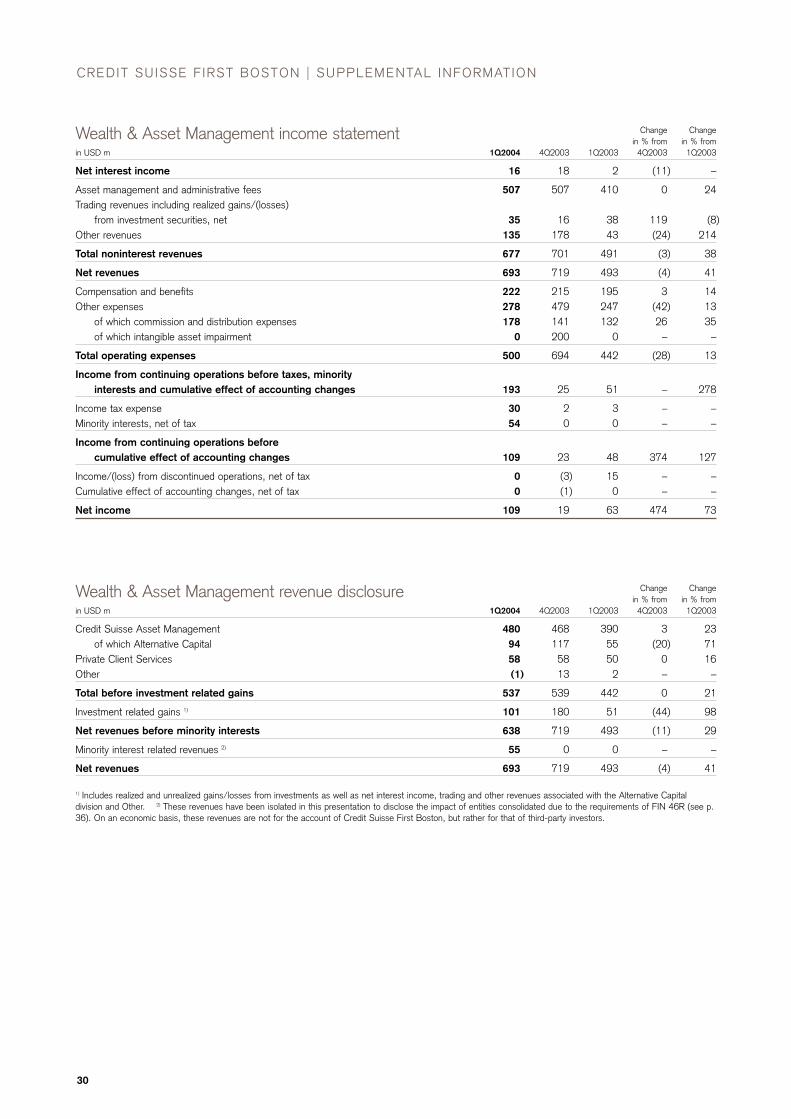
30
Change Changein % from in % from
in USD m 1Q2004 4Q2003 1Q2003 4Q2003 1Q2003
Credit Suisse Asset Management 480 468 390 3 23of which Alternative Capital 94 117 55 (20) 71
Private Client Services 58 58 50 0 16Other (1) 13 2 – –
Total before investment related gains 537 539 442 0 21
Investment related gains 1) 101 180 51 (44) 98
Net revenues before minority interests 638 719 493 (11) 29
Minority interest related revenues 2) 55 0 0 – –
Net revenues 693 719 493 (4) 41
1) Includes realized and unrealized gains/losses from investments as well as net interest income, trading and other revenues associated with the Alternative Capitaldivision and Other. 2) These revenues have been isolated in this presentation to disclose the impact of entities consolidated due to the requirements of FIN 46R (see p.36). On an economic basis, these revenues are not for the account of Credit Suisse First Boston, but rather for that of third-party investors.
Wealth & Asset Management revenue disclosure
CREDIT SUISSE F IRST BOSTON | SUPPLEMENTAL INFORMATION
Change Changein % from in % from
in USD m 1Q2004 4Q2003 1Q2003 4Q2003 1Q2003
Net interest income 16 18 2 (11) –
Asset management and administrative fees 507 507 410 0 24Trading revenues including realized gains/(losses)
from investment securities, net 35 16 38 119 (8)Other revenues 135 178 43 (24) 214
Total noninterest revenues 677 701 491 (3) 38
Net revenues 693 719 493 (4) 41
Compensation and benefits 222 215 195 3 14Other expenses 278 479 247 (42) 13
of which commission and distribution expenses 178 141 132 26 35of which intangible asset impairment 0 200 0 – –
Total operating expenses 500 694 442 (28) 13
Income from continuing operations before taxes, minority interests and cumulative effect of accounting changes 193 25 51 – 278
Income tax expense 30 2 3 – –Minority interests, net of tax 54 0 0 – –
Income from continuing operations before cumulative effect of accounting changes 109 23 48 374 127
Income/(loss) from discontinued operations, net of tax 0 (3) 15 – –Cumulative effect of accounting changes, net of tax 0 (1) 0 – –
Net income 109 19 63 474 73
Wealth & Asset Management income statement
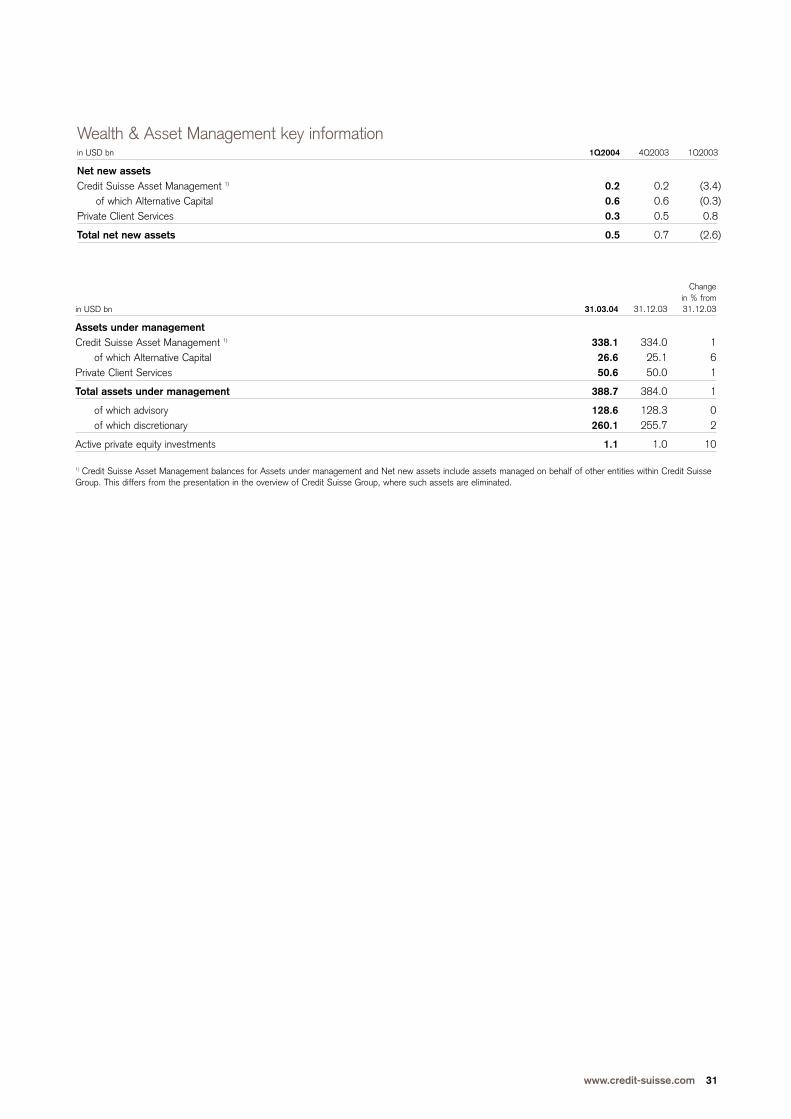
www.credit-suisse.com 31
in USD bn 1Q2004 4Q2003 1Q2003
Net new assetsCredit Suisse Asset Management 1) 0.2 0.2 (3.4)
of which Alternative Capital 0.6 0.6 (0.3)Private Client Services 0.3 0.5 0.8
Total net new assets 0.5 0.7 (2.6)
Wealth & Asset Management key information
Changein % from
in USD bn 31.03.04 31.12.03 31.12.03
Assets under managementCredit Suisse Asset Management 1) 338.1 334.0 1
of which Alternative Capital 26.6 25.1 6Private Client Services 50.6 50.0 1
Total assets under management 388.7 384.0 1
of which advisory 128.6 128.3 0of which discretionary 260.1 255.7 2
Active private equity investments 1.1 1.0 10
1) Credit Suisse Asset Management balances for Assets under management and Net new assets include assets managed on behalf of other entities within Credit SuisseGroup. This differs from the presentation in the overview of Credit Suisse Group, where such assets are eliminated.
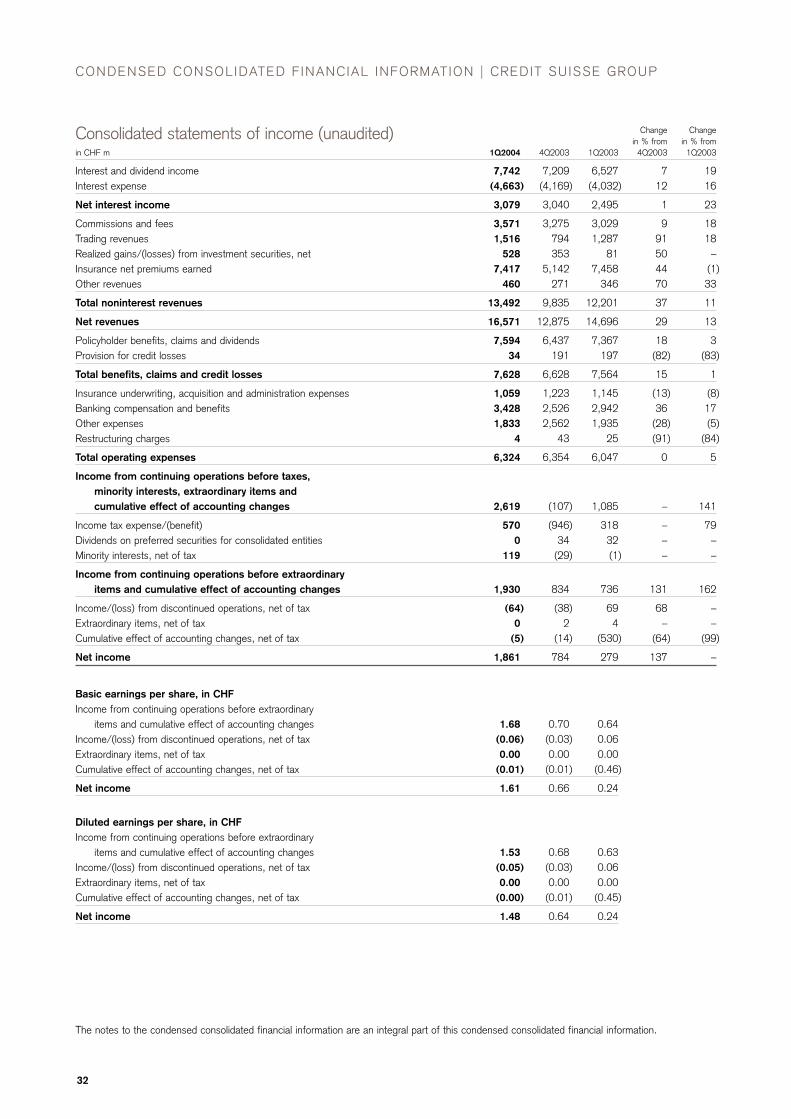
32
CONDENSED CONSOLIDATED F INANCIAL INFORMATION | CREDIT SUISSE GROUP
The notes to the condensed consolidated financial information are an integral part of this condensed consolidated financial information.
Change Changein % from in % from
in CHF m 1Q2004 4Q2003 1Q2003 4Q2003 1Q2003
Interest and dividend income 7,742 7,209 6,527 7 19Interest expense (4,663) (4,169) (4,032) 12 16
Net interest income 3,079 3,040 2,495 1 23
Commissions and fees 3,571 3,275 3,029 9 18Trading revenues 1,516 794 1,287 91 18Realized gains/(losses) from investment securities, net 528 353 81 50 –Insurance net premiums earned 7,417 5,142 7,458 44 (1)Other revenues 460 271 346 70 33
Total noninterest revenues 13,492 9,835 12,201 37 11
Net revenues 16,571 12,875 14,696 29 13
Policyholder benefits, claims and dividends 7,594 6,437 7,367 18 3Provision for credit losses 34 191 197 (82) (83)
Total benefits, claims and credit losses 7,628 6,628 7,564 15 1
Insurance underwriting, acquisition and administration expenses 1,059 1,223 1,145 (13) (8)Banking compensation and benefits 3,428 2,526 2,942 36 17Other expenses 1,833 2,562 1,935 (28) (5)Restructuring charges 4 43 25 (91) (84)
Total operating expenses 6,324 6,354 6,047 0 5
Income from continuing operations before taxes, minority interests, extraordinary items and cumulative effect of accounting changes 2,619 (107) 1,085 – 141
Income tax expense/(benefit) 570 (946) 318 – 79Dividends on preferred securities for consolidated entities 0 34 32 – –Minority interests, net of tax 119 (29) (1) – –
Income from continuing operations before extraordinary items and cumulative effect of accounting changes 1,930 834 736 131 162
Income/(loss) from discontinued operations, net of tax (64) (38) 69 68 –Extraordinary items, net of tax 0 2 4 – –Cumulative effect of accounting changes, net of tax (5) (14) (530) (64) (99)
Net income 1,861 784 279 137 –
Consolidated statements of income (unaudited)
Basic earnings per share, in CHFIncome from continuing operations before extraordinary
items and cumulative effect of accounting changes 1.68 0.70 0.64Income/(loss) from discontinued operations, net of tax (0.06) (0.03) 0.06Extraordinary items, net of tax 0.00 0.00 0.00Cumulative effect of accounting changes, net of tax (0.01) (0.01) (0.46)
Net income 1.61 0.66 0.24
Diluted earnings per share, in CHFIncome from continuing operations before extraordinary
items and cumulative effect of accounting changes 1.53 0.68 0.63Income/(loss) from discontinued operations, net of tax (0.05) (0.03) 0.06Extraordinary items, net of tax 0.00 0.00 0.00Cumulative effect of accounting changes, net of tax (0.00) (0.01) (0.45)
Net income 1.48 0.64 0.24
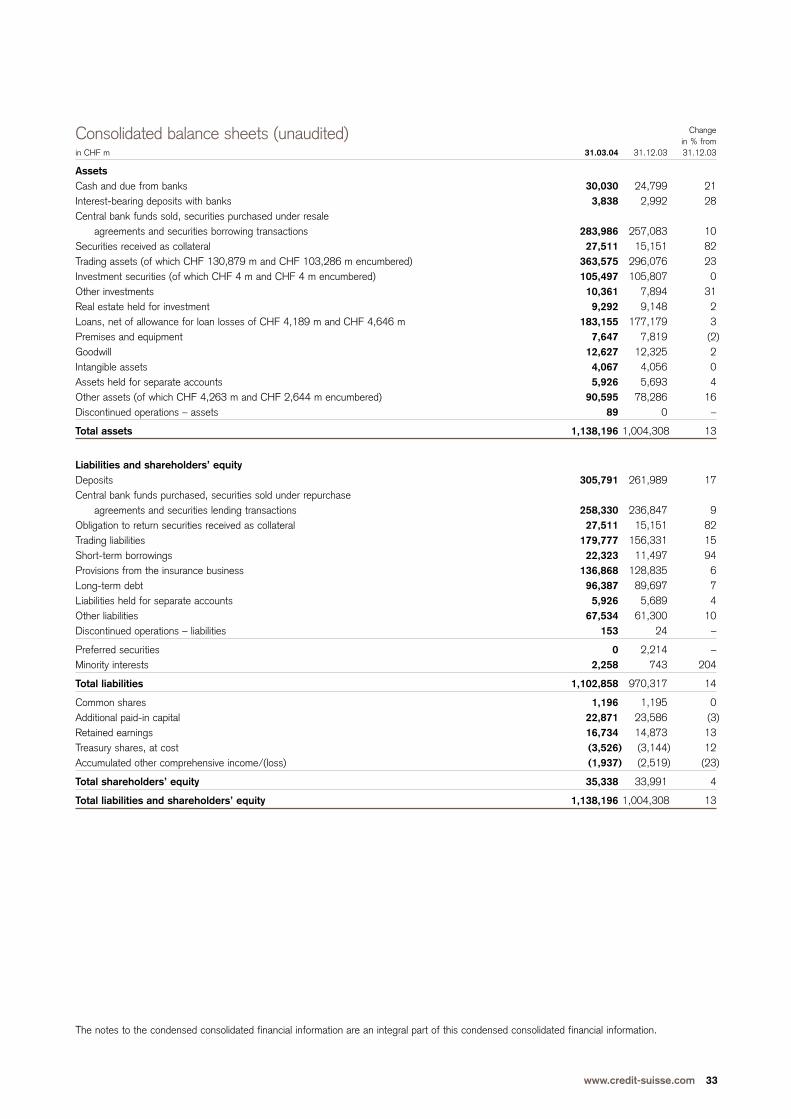
www.credit-suisse.com 33
The notes to the condensed consolidated financial information are an integral part of this condensed consolidated financial information.
Changein % from
in CHF m 31.03.04 31.12.03 31.12.03
AssetsCash and due from banks 30,030 24,799 21Interest-bearing deposits with banks 3,838 2,992 28Central bank funds sold, securities purchased under resale
agreements and securities borrowing transactions 283,986 257,083 10Securities received as collateral 27,511 15,151 82Trading assets (of which CHF 130,879 m and CHF 103,286 m encumbered) 363,575 296,076 23Investment securities (of which CHF 4 m and CHF 4 m encumbered) 105,497 105,807 0Other investments 10,361 7,894 31Real estate held for investment 9,292 9,148 2Loans, net of allowance for loan losses of CHF 4,189 m and CHF 4,646 m 183,155 177,179 3Premises and equipment 7,647 7,819 (2)Goodwill 12,627 12,325 2Intangible assets 4,067 4,056 0Assets held for separate accounts 5,926 5,693 4Other assets (of which CHF 4,263 m and CHF 2,644 m encumbered) 90,595 78,286 16Discontinued operations – assets 89 0 –
Total assets 1,138,196 1,004,308 13
Liabilities and shareholders’ equityDeposits 305,791 261,989 17Central bank funds purchased, securities sold under repurchase
agreements and securities lending transactions 258,330 236,847 9Obligation to return securities received as collateral 27,511 15,151 82Trading liabilities 179,777 156,331 15Short-term borrowings 22,323 11,497 94Provisions from the insurance business 136,868 128,835 6Long-term debt 96,387 89,697 7Liabilities held for separate accounts 5,926 5,689 4Other liabilities 67,534 61,300 10Discontinued operations – liabilities 153 24 –
Preferred securities 0 2,214 –Minority interests 2,258 743 204
Total liabilities 1,102,858 970,317 14
Common shares 1,196 1,195 0Additional paid-in capital 22,871 23,586 (3)Retained earnings 16,734 14,873 13Treasury shares, at cost (3,526) (3,144) 12Accumulated other comprehensive income/(loss) (1,937) (2,519) (23)
Total shareholders’ equity 35,338 33,991 4
Total liabilities and shareholders’ equity 1,138,196 1,004,308 13
Consolidated balance sheets (unaudited)
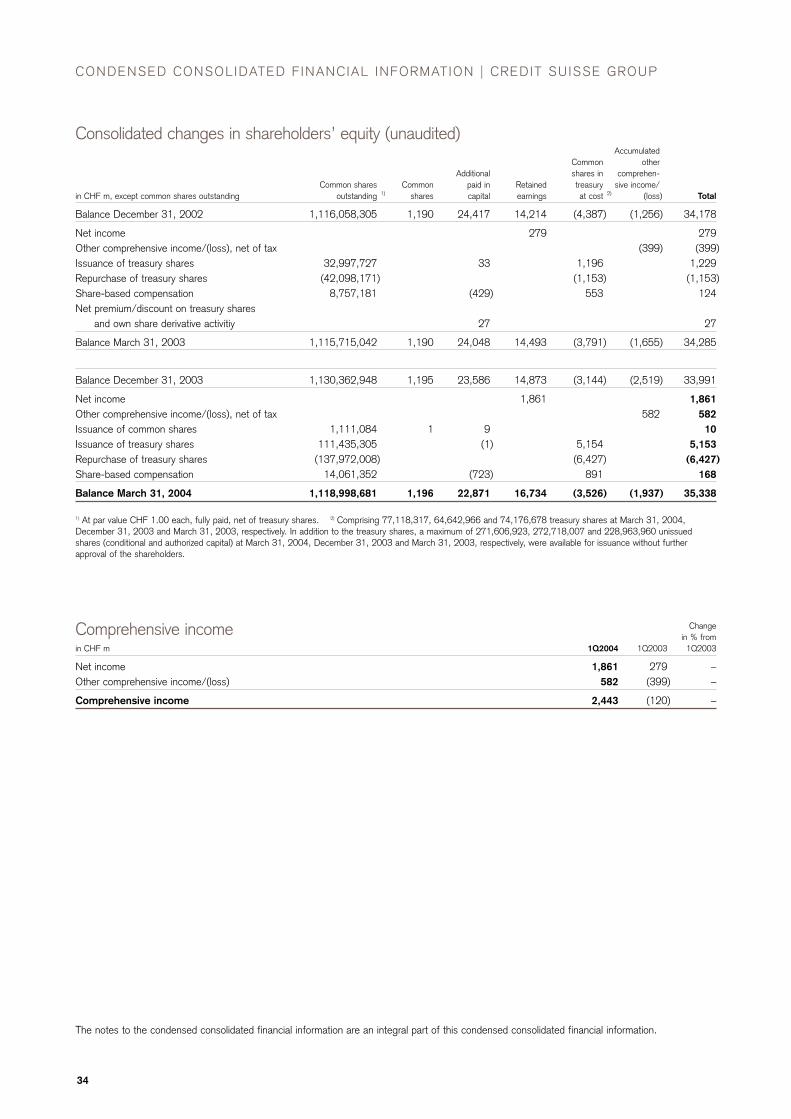
34
CONDENSED CONSOLIDATED F INANCIAL INFORMATION | CREDIT SUISSE GROUP
The notes to the condensed consolidated financial information are an integral part of this condensed consolidated financial information.
AccumulatedCommon other
Additional shares in comprehen-Common shares Common paid in Retained treasury sive income/
in CHF m, except common shares outstanding outstanding 1) shares capital earnings at cost 2) (loss) Total
Balance December 31, 2002 1,116,058,305 1,190 24,417 14,214 (4,387) (1,256) 34,178
Net income 279 279Other comprehensive income/(loss), net of tax (399) (399)Issuance of treasury shares 32,997,727 33 1,196 1,229Repurchase of treasury shares (42,098,171) (1,153) (1,153)Share-based compensation 8,757,181 (429) 553 124Net premium/discount on treasury shares
and own share derivative activitiy 27 27
Balance March 31, 2003 1,115,715,042 1,190 24,048 14,493 (3,791) (1,655) 34,285
Balance December 31, 2003 1,130,362,948 1,195 23,586 14,873 (3,144) (2,519) 33,991
Net income 1,861 1,861Other comprehensive income/(loss), net of tax 582 582Issuance of common shares 1,111,084 1 9 10Issuance of treasury shares 111,435,305 (1) 5,154 5,153Repurchase of treasury shares (137,972,008) (6,427) (6,427)Share-based compensation 14,061,352 (723) 891 168
Balance March 31, 2004 1,118,998,681 1,196 22,871 16,734 (3,526) (1,937) 35,338
1) At par value CHF 1.00 each, fully paid, net of treasury shares. 2) Comprising 77,118,317, 64,642,966 and 74,176,678 treasury shares at March 31, 2004,December 31, 2003 and March 31, 2003, respectively. In addition to the treasury shares, a maximum of 271,606,923, 272,718,007 and 228,963,960 unissuedshares (conditional and authorized capital) at March 31, 2004, December 31, 2003 and March 31, 2003, respectively, were available for issuance without furtherapproval of the shareholders.
Consolidated changes in shareholders’ equity (unaudited)
Changein % from
in CHF m 1Q2004 1Q2003 1Q2003
Net income 1,861 279 –Other comprehensive income/(loss) 582 (399) –
Comprehensive income 2,443 (120) –
Comprehensive income
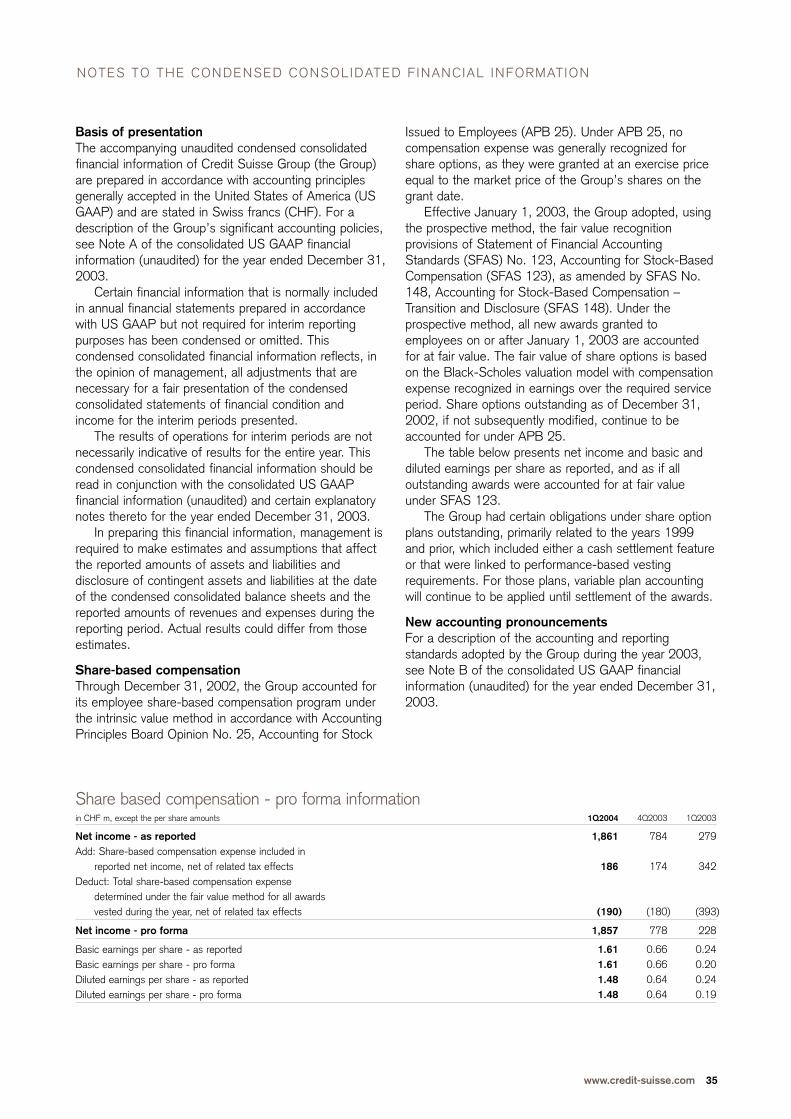
www.credit-suisse.com 35
Basis of presentationThe accompanying unaudited condensed consolidatedfinancial information of Credit Suisse Group (the Group)are prepared in accordance with accounting principlesgenerally accepted in the United States of America (USGAAP) and are stated in Swiss francs (CHF). For adescription of the Group’s significant accounting policies,see Note A of the consolidated US GAAP financialinformation (unaudited) for the year ended December 31,2003.
Certain financial information that is normally includedin annual financial statements prepared in accordancewith US GAAP but not required for interim reportingpurposes has been condensed or omitted. Thiscondensed consolidated financial information reflects, inthe opinion of management, all adjustments that arenecessary for a fair presentation of the condensedconsolidated statements of financial condition andincome for the interim periods presented.
The results of operations for interim periods are notnecessarily indicative of results for the entire year. Thiscondensed consolidated financial information should beread in conjunction with the consolidated US GAAPfinancial information (unaudited) and certain explanatorynotes thereto for the year ended December 31, 2003.
In preparing this financial information, management isrequired to make estimates and assumptions that affectthe reported amounts of assets and liabilities anddisclosure of contingent assets and liabilities at the dateof the condensed consolidated balance sheets and thereported amounts of revenues and expenses during thereporting period. Actual results could differ from thoseestimates.
Share-based compensation Through December 31, 2002, the Group accounted forits employee share-based compensation program underthe intrinsic value method in accordance with AccountingPrinciples Board Opinion No. 25, Accounting for Stock
NOTES TO THE CONDENSED CONSOLIDATED F INANCIAL INFORMATION
Issued to Employees (APB 25). Under APB 25, nocompensation expense was generally recognized forshare options, as they were granted at an exercise priceequal to the market price of the Group’s shares on thegrant date.
Effective January 1, 2003, the Group adopted, usingthe prospective method, the fair value recognitionprovisions of Statement of Financial AccountingStandards (SFAS) No. 123, Accounting for Stock-BasedCompensation (SFAS 123), as amended by SFAS No.148, Accounting for Stock-Based Compensation –Transition and Disclosure (SFAS 148). Under theprospective method, all new awards granted toemployees on or after January 1, 2003 are accountedfor at fair value. The fair value of share options is basedon the Black-Scholes valuation model with compensationexpense recognized in earnings over the required serviceperiod. Share options outstanding as of December 31,2002, if not subsequently modified, continue to beaccounted for under APB 25.
The table below presents net income and basic anddiluted earnings per share as reported, and as if alloutstanding awards were accounted for at fair valueunder SFAS 123.
The Group had certain obligations under share optionplans outstanding, primarily related to the years 1999and prior, which included either a cash settlement featureor that were linked to performance-based vestingrequirements. For those plans, variable plan accountingwill continue to be applied until settlement of the awards.
New accounting pronouncementsFor a description of the accounting and reportingstandards adopted by the Group during the year 2003,see Note B of the consolidated US GAAP financialinformation (unaudited) for the year ended December 31,2003.
in CHF m, except the per share amounts 1Q2004 4Q2003 1Q2003
Net income - as reported 1,861 784 279Add: Share-based compensation expense included in
reported net income, net of related tax effects 186 174 342Deduct: Total share-based compensation expense
determined under the fair value method for all awards vested during the year, net of related tax effects (190) (180) (393)
Net income - pro forma 1,857 778 228
Basic earnings per share - as reported 1.61 0.66 0.24Basic earnings per share - pro forma 1.61 0.66 0.20Diluted earnings per share - as reported 1.48 0.64 0.24Diluted earnings per share - pro forma 1.48 0.64 0.19
Share based compensation - pro forma information
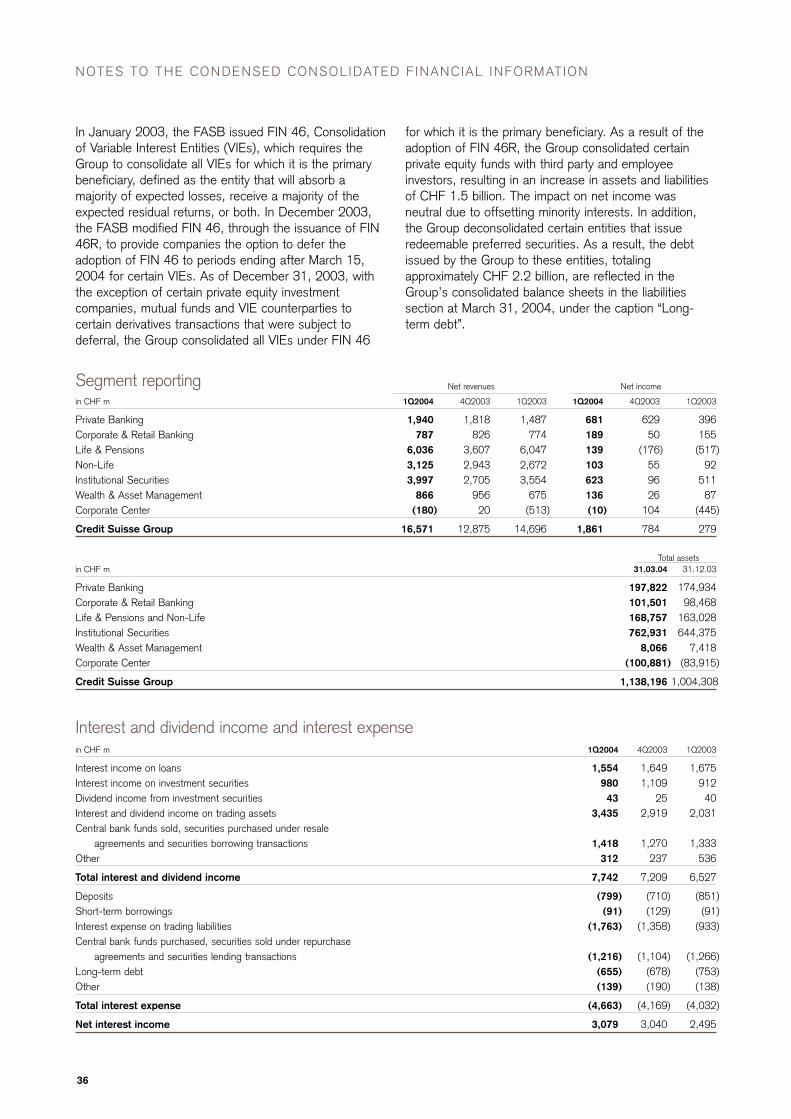
36
NOTES TO THE CONDENSED CONSOLIDATED F INANCIAL INFORMATION
In January 2003, the FASB issued FIN 46, Consolidationof Variable Interest Entities (VIEs), which requires theGroup to consolidate all VIEs for which it is the primarybeneficiary, defined as the entity that will absorb amajority of expected losses, receive a majority of theexpected residual returns, or both. In December 2003,the FASB modified FIN 46, through the issuance of FIN46R, to provide companies the option to defer theadoption of FIN 46 to periods ending after March 15,2004 for certain VIEs. As of December 31, 2003, withthe exception of certain private equity investmentcompanies, mutual funds and VIE counterparties tocertain derivatives transactions that were subject todeferral, the Group consolidated all VIEs under FIN 46
Net revenues Net income
in CHF m 1Q2004 4Q2003 1Q2003 1Q2004 4Q2003 1Q2003
Private Banking 1,940 1,818 1,487 681 629 396Corporate & Retail Banking 787 826 774 189 50 155Life & Pensions 6,036 3,607 6,047 139 (176) (517)Non-Life 3,125 2,943 2,672 103 55 92Institutional Securities 3,997 2,705 3,554 623 96 511Wealth & Asset Management 866 956 675 136 26 87Corporate Center (180) 20 (513) (10) 104 (445)
Credit Suisse Group 16,571 12,875 14,696 1,861 784 279
Segment reporting
in CHF m 1Q2004 4Q2003 1Q2003
Interest income on loans 1,554 1,649 1,675Interest income on investment securities 980 1,109 912Dividend income from investment securities 43 25 40Interest and dividend income on trading assets 3,435 2,919 2,031Central bank funds sold, securities purchased under resale
agreements and securities borrowing transactions 1,418 1,270 1,333Other 312 237 536
Total interest and dividend income 7,742 7,209 6,527
Deposits (799) (710) (851)Short-term borrowings (91) (129) (91)Interest expense on trading liabilities (1,763) (1,358) (933)Central bank funds purchased, securities sold under repurchase
agreements and securities lending transactions (1,216) (1,104) (1,266)Long-term debt (655) (678) (753)Other (139) (190) (138)
Total interest expense (4,663) (4,169) (4,032)
Net interest income 3,079 3,040 2,495
Interest and dividend income and interest expense
for which it is the primary beneficiary. As a result of theadoption of FIN 46R, the Group consolidated certainprivate equity funds with third party and employeeinvestors, resulting in an increase in assets and liabilitiesof CHF 1.5 billion. The impact on net income wasneutral due to offsetting minority interests. In addition,the Group deconsolidated certain entities that issueredeemable preferred securities. As a result, the debtissued by the Group to these entities, totalingapproximately CHF 2.2 billion, are reflected in theGroup’s consolidated balance sheets in the liabilitiessection at March 31, 2004, under the caption “Long-term debt”.
Total assetsin CHF m 31.03.04 31.12.03
Private Banking 197,822 174,934Corporate & Retail Banking 101,501 98,468Life & Pensions and Non-Life 168,757 163,028Institutional Securities 762,931 644,375Wealth & Asset Management 8,066 7,418Corporate Center (100,881) (83,915)
Credit Suisse Group 1,138,196 1,004,308
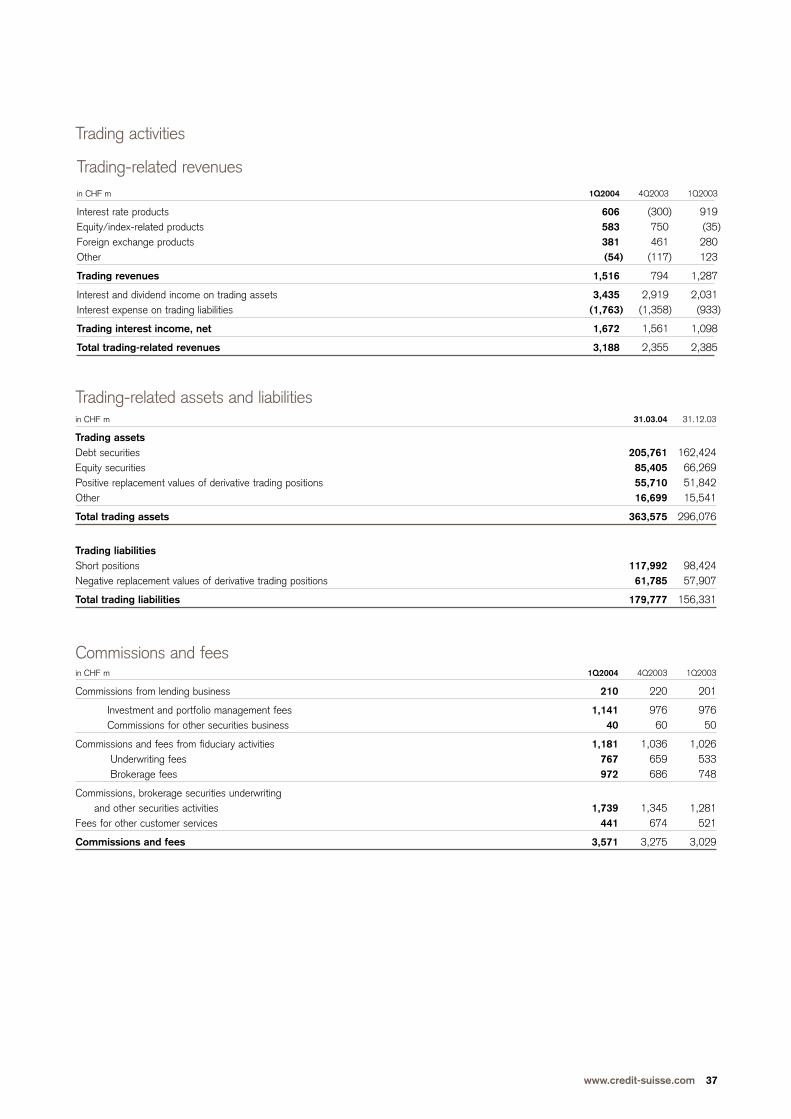
www.credit-suisse.com 37
in CHF m 1Q2004 4Q2003 1Q2003
Commissions from lending business 210 220 201
Investment and portfolio management fees 1,141 976 976Commissions for other securities business 40 60 50
Commissions and fees from fiduciary activities 1,181 1,036 1,026Underwriting fees 767 659 533Brokerage fees 972 686 748
Commissions, brokerage securities underwriting and other securities activities 1,739 1,345 1,281
Fees for other customer services 441 674 521
Commissions and fees 3,571 3,275 3,029
Commissions and fees
in CHF m 31.03.04 31.12.03
Trading assetsDebt securities 205,761 162,424Equity securities 85,405 66,269Positive replacement values of derivative trading positions 55,710 51,842Other 16,699 15,541
Total trading assets 363,575 296,076
Trading liabilitiesShort positions 117,992 98,424Negative replacement values of derivative trading positions 61,785 57,907
Total trading liabilities 179,777 156,331
Trading-related assets and liabilities
Trading activities
Trading-related revenuesin CHF m 1Q2004 4Q2003 1Q2003
Interest rate products 606 (300) 919Equity/index-related products 583 750 (35)Foreign exchange products 381 461 280Other (54) (117) 123
Trading revenues 1,516 794 1,287
Interest and dividend income on trading assets 3,435 2,919 2,031Interest expense on trading liabilities (1,763) (1,358) (933)
Trading interest income, net 1,672 1,561 1,098
Total trading-related revenues 3,188 2,355 2,385
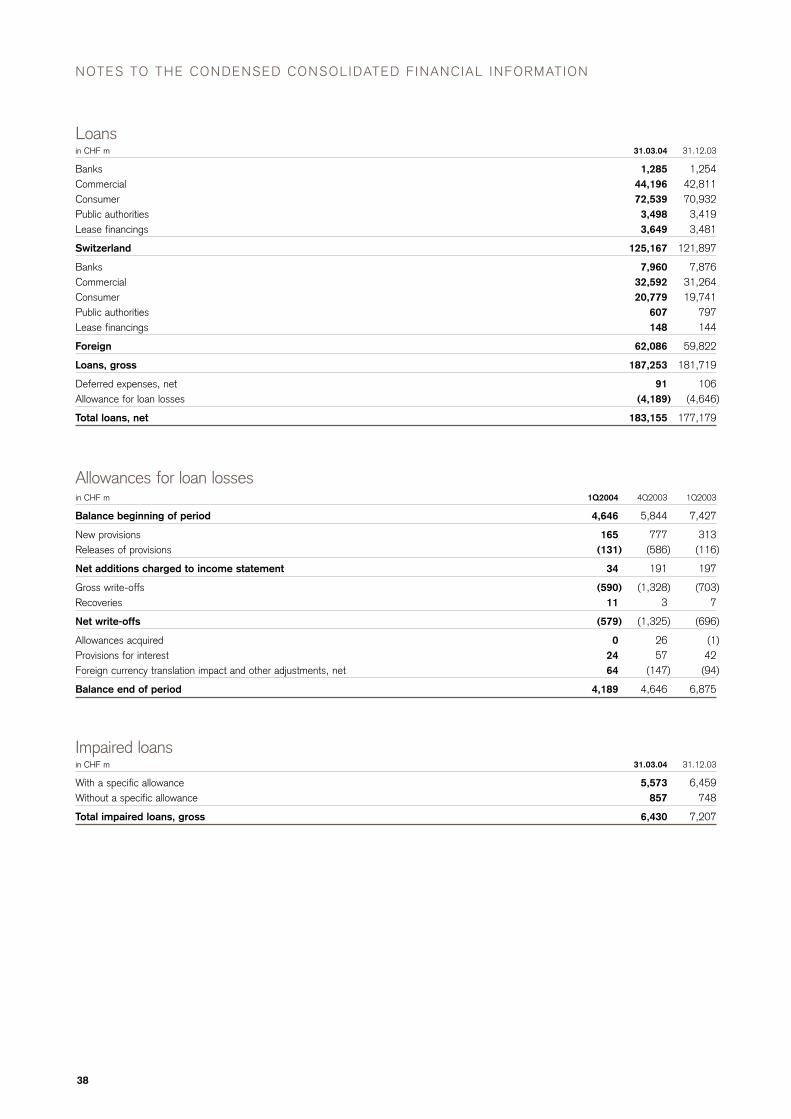
38
NOTES TO THE CONDENSED CONSOLIDATED F INANCIAL INFORMATION
in CHF m 31.03.04 31.12.03
Banks 1,285 1,254Commercial 44,196 42,811Consumer 72,539 70,932Public authorities 3,498 3,419Lease financings 3,649 3,481
Switzerland 125,167 121,897
Banks 7,960 7,876Commercial 32,592 31,264Consumer 20,779 19,741Public authorities 607 797Lease financings 148 144
Foreign 62,086 59,822
Loans, gross 187,253 181,719
Deferred expenses, net 91 106Allowance for loan losses (4,189) (4,646)
Total loans, net 183,155 177,179
Loans
in CHF m 1Q2004 4Q2003 1Q2003
Balance beginning of period 4,646 5,844 7,427
New provisions 165 777 313Releases of provisions (131) (586) (116)
Net additions charged to income statement 34 191 197
Gross write-offs (590) (1,328) (703)Recoveries 11 3 7
Net write-offs (579) (1,325) (696)
Allowances acquired 0 26 (1)Provisions for interest 24 57 42Foreign currency translation impact and other adjustments, net 64 (147) (94)
Balance end of period 4,189 4,646 6,875
Allowances for loan losses
in CHF m 31.03.04 31.12.03
With a specific allowance 5,573 6,459Without a specific allowance 857 748
Total impaired loans, gross 6,430 7,207
Impaired loans
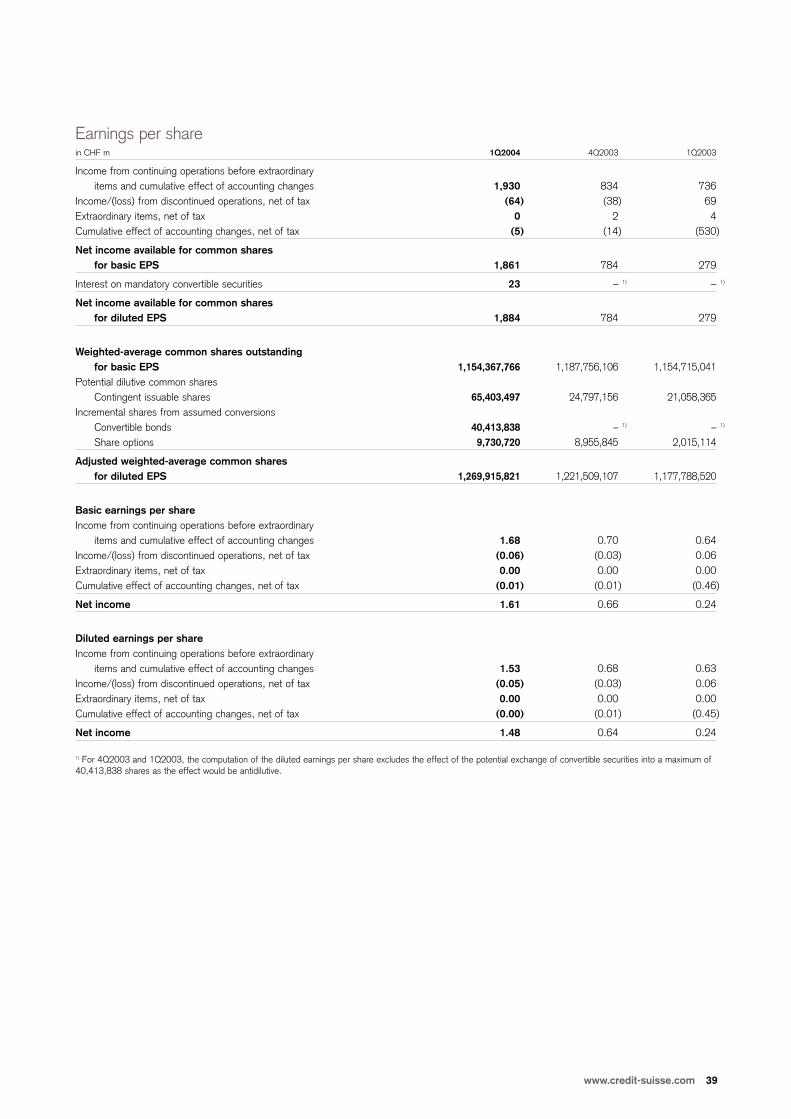
www.credit-suisse.com 39
in CHF m 1Q2004 4Q2003 1Q2003
Income from continuing operations before extraordinary items and cumulative effect of accounting changes 1,930 834 736
Income/(loss) from discontinued operations, net of tax (64) (38) 69Extraordinary items, net of tax 0 2 4Cumulative effect of accounting changes, net of tax (5) (14) (530)
Net income available for common shares for basic EPS 1,861 784 279
Interest on mandatory convertible securities 23 – 1) – 1)
Net income available for common shares for diluted EPS 1,884 784 279
Weighted-average common shares outstanding for basic EPS 1,154,367,766 1,187,756,106 1,154,715,041
Potential dilutive common sharesContingent issuable shares 65,403,497 24,797,156 21,058,365
Incremental shares from assumed conversionsConvertible bonds 40,413,838 – 1) – 1)
Share options 9,730,720 8,955,845 2,015,114
Adjusted weighted-average common shares for diluted EPS 1,269,915,821 1,221,509,107 1,177,788,520
Basic earnings per shareIncome from continuing operations before extraordinary
items and cumulative effect of accounting changes 1.68 0.70 0.64Income/(loss) from discontinued operations, net of tax (0.06) (0.03) 0.06Extraordinary items, net of tax 0.00 0.00 0.00Cumulative effect of accounting changes, net of tax (0.01) (0.01) (0.46)
Net income 1.61 0.66 0.24
Diluted earnings per shareIncome from continuing operations before extraordinary
items and cumulative effect of accounting changes 1.53 0.68 0.63Income/(loss) from discontinued operations, net of tax (0.05) (0.03) 0.06Extraordinary items, net of tax 0.00 0.00 0.00Cumulative effect of accounting changes, net of tax (0.00) (0.01) (0.45)
Net income 1.48 0.64 0.24
1) For 4Q2003 and 1Q2003, the computation of the diluted earnings per share excludes the effect of the potential exchange of convertible securities into a maximum of40,413,838 shares as the effect would be antidilutive.
Earnings per share
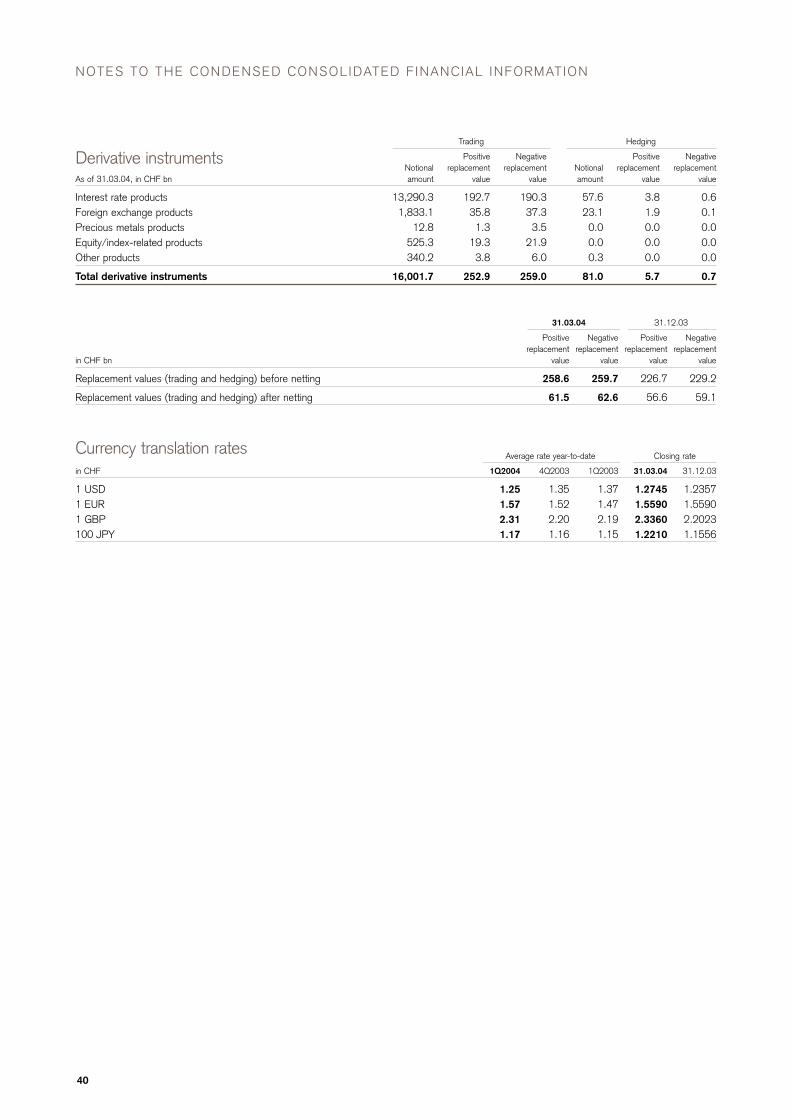
40
NOTES TO THE CONDENSED CONSOLIDATED F INANCIAL INFORMATION
Trading Hedging
Positive Negative Positive NegativeNotional replacement replacement Notional replacement replacement
As of 31.03.04, in CHF bn amount value value amount value value
Interest rate products 13,290.3 192.7 190.3 57.6 3.8 0.6Foreign exchange products 1,833.1 35.8 37.3 23.1 1.9 0.1Precious metals products 12.8 1.3 3.5 0.0 0.0 0.0Equity/index-related products 525.3 19.3 21.9 0.0 0.0 0.0Other products 340.2 3.8 6.0 0.3 0.0 0.0
Total derivative instruments 16,001.7 252.9 259.0 81.0 5.7 0.7
Derivative instruments
31.03.04 31.12.03
Positive Negative Positive Negativereplacement replacement replacement replacement
in CHF bn value value value value
Replacement values (trading and hedging) before netting 258.6 259.7 226.7 229.2
Replacement values (trading and hedging) after netting 61.5 62.6 56.6 59.1
Average rate year-to-date Closing rate
in CHF 1Q2004 4Q2003 1Q2003 31.03.04 31.12.03
1 USD 1.25 1.35 1.37 1.2745 1.23571 EUR 1.57 1.52 1.47 1.5590 1.55901 GBP 2.31 2.20 2.19 2.3360 2.2023100 JPY 1.17 1.16 1.15 1.2210 1.1556
Currency translation rates
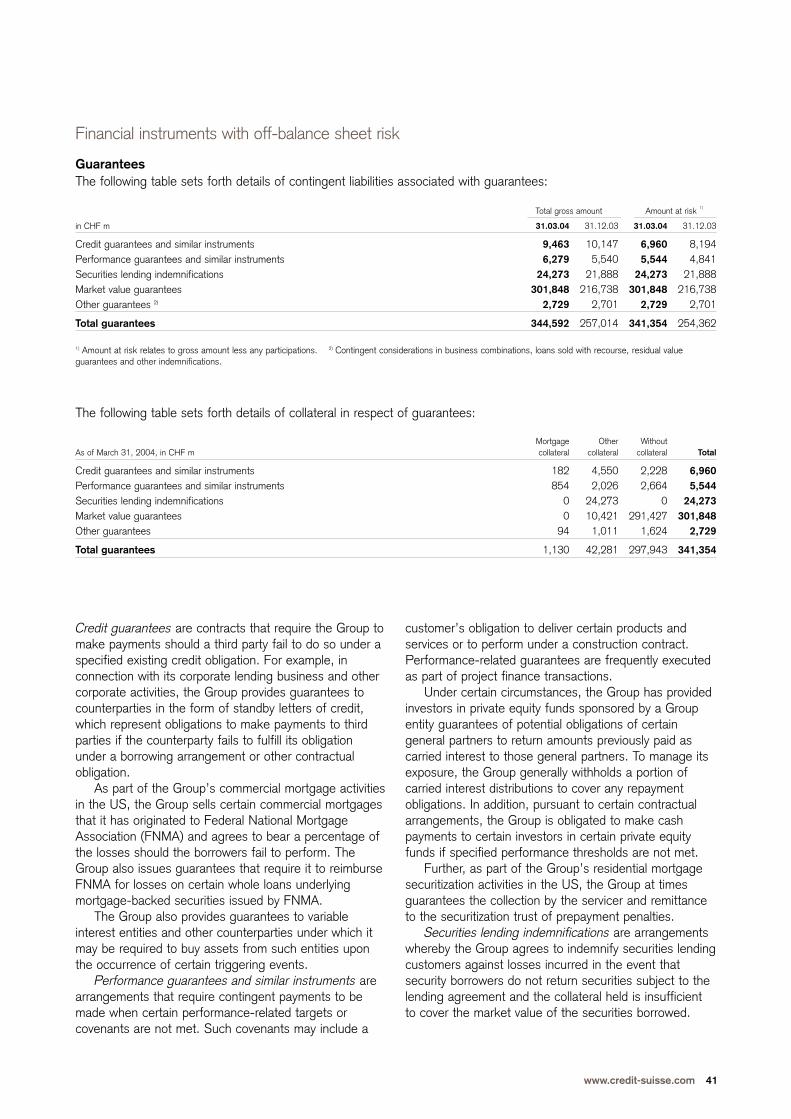
www.credit-suisse.com 41
Total gross amount Amount at risk 1)
in CHF m 31.03.04 31.12.03 31.03.04 31.12.03
Credit guarantees and similar instruments 9,463 10,147 6,960 8,194Performance guarantees and similar instruments 6,279 5,540 5,544 4,841Securities lending indemnifications 24,273 21,888 24,273 21,888Market value guarantees 301,848 216,738 301,848 216,738Other guarantees 2) 2,729 2,701 2,729 2,701
Total guarantees 344,592 257,014 341,354 254,362
1) Amount at risk relates to gross amount less any participations. 2) Contingent considerations in business combinations, loans sold with recourse, residual valueguarantees and other indemnifications.
Financial instruments with off-balance sheet risk
Guarantees
Credit guarantees are contracts that require the Group tomake payments should a third party fail to do so under aspecified existing credit obligation. For example, inconnection with its corporate lending business and othercorporate activities, the Group provides guarantees tocounterparties in the form of standby letters of credit,which represent obligations to make payments to thirdparties if the counterparty fails to fulfill its obligationunder a borrowing arrangement or other contractualobligation.
As part of the Group’s commercial mortgage activitiesin the US, the Group sells certain commercial mortgagesthat it has originated to Federal National MortgageAssociation (FNMA) and agrees to bear a percentage ofthe losses should the borrowers fail to perform. TheGroup also issues guarantees that require it to reimburseFNMA for losses on certain whole loans underlyingmortgage-backed securities issued by FNMA.
The Group also provides guarantees to variableinterest entities and other counterparties under which itmay be required to buy assets from such entities uponthe occurrence of certain triggering events.
Performance guarantees and similar instruments arearrangements that require contingent payments to bemade when certain performance-related targets orcovenants are not met. Such covenants may include a
customer’s obligation to deliver certain products andservices or to perform under a construction contract.Performance-related guarantees are frequently executedas part of project finance transactions.
Under certain circumstances, the Group has providedinvestors in private equity funds sponsored by a Groupentity guarantees of potential obligations of certaingeneral partners to return amounts previously paid ascarried interest to those general partners. To manage itsexposure, the Group generally withholds a portion ofcarried interest distributions to cover any repaymentobligations. In addition, pursuant to certain contractualarrangements, the Group is obligated to make cashpayments to certain investors in certain private equityfunds if specified performance thresholds are not met.
Further, as part of the Group’s residential mortgagesecuritization activities in the US, the Group at timesguarantees the collection by the servicer and remittanceto the securitization trust of prepayment penalties.
Securities lending indemnifications are arrangementswhereby the Group agrees to indemnify securities lendingcustomers against losses incurred in the event thatsecurity borrowers do not return securities subject to thelending agreement and the collateral held is insufficientto cover the market value of the securities borrowed.
Mortgage Other WithoutAs of March 31, 2004, in CHF m collateral collateral collateral Total
Credit guarantees and similar instruments 182 4,550 2,228 6,960Performance guarantees and similar instruments 854 2,026 2,664 5,544Securities lending indemnifications 0 24,273 0 24,273Market value guarantees 0 10,421 291,427 301,848Other guarantees 94 1,011 1,624 2,729
Total guarantees 1,130 42,281 297,943 341,354
The following table sets forth details of collateral in respect of guarantees:
1)
The following table sets forth details of contingent liabilities associated with guarantees:
42
NOTES TO THE CONDENSED CONSOLIDATED F INANCIAL INFORMATION
Market value guarantees are issued in the ordinarycourse of business in the form of derivative contractssuch as written put options and credit default swaps.Included in this category are certain written over-the-counter (OTC) put option contracts, pursuant to whichthe counterparty can potentially force the Group toacquire the underlying financial instrument or require theGroup to make a cash payment in an amount equal tothe decline in value of the financial instrument underlyingthe OTC put option. Also included in this category arecredit derivatives that may subject the Group to creditspread or issuer default risk because the change in creditspreads or the credit quality of the underlying financialinstrument may obligate the Group to make a payment.The Group seeks to manage these OTC derivativesexposures by engaging in various hedging strategies toreduce its exposure. For some contracts, such as writteninterest rate caps or foreign exchange options themaximum payout is not determinable, as interest rates orexchange rates could theoretically rise without limit. TheGroup discloses the notional amounts in order to providean indication of the underlying exposure. In addition, theGroup carries all derivatives at fair value in the balancesheet.
Other guarantees include acceptances andtransactions with recourse and all other guarantees thatare not allocated to one of the captions above.
The Group has certain guarantees for which itsmaximum contingent liability cannot be quantified. Theseguarantees are not reflected in the table on page 43 andare discussed below.
In connection with the sale of assets or businesses,the Group sometimes provides the acquiror with certainindemnification provisions. These indemnificationprovisions vary by counterparty in scope and duration anddepend upon the type of assets or businesses sold.These indemnification provisions generally shift thepotential risk of certain unquantifiable and unknowableloss contingencies (e.g., relating to litigation, tax andintellectual property matters) from the acquirer to theseller. The Group closely monitors all such contractualagreements to ensure that indemnification provisions areadequately provided for in the Group’s financialstatements.
The Group provides indemnifications to certaincounterparties in connection with its normal operatingactivities. The Group has determined that it is notpossible to estimate the maximum amount it could beobligated to pay. As a normal part of issuing its ownsecurities, the Group typically agrees to reimburseholders for additional tax withholding charges orassessments resulting from changes in applicable taxlaws or the interpretation of those laws. Securities thatinclude these agreements to pay additional amountsgenerally also include a related redemption or callprovision if the obligation to pay the additional amountsresults from a change in law or its interpretation and theobligation cannot be avoided by the issuer takingreasonable steps to avoid the payment of additionalamounts. Since such potential obligations are dependenton future changes in tax laws, the related liabilities theGroup may incur as a result of such changes cannot bereasonably estimated. In light of the related callprovisions typically included, the Group does not expectany potential liabilities in respect of tax gross-ups to bematerial.
The Group is a member of numerous securitiesexchanges and clearing houses, and may, as a result ofits membership arrangements, be required to perform ifanother member defaults. The Group has determinedthat it is not possible to estimate the maximum amountof these obligations and believes that any potentialrequirement to make payments under thesearrangements is remote.
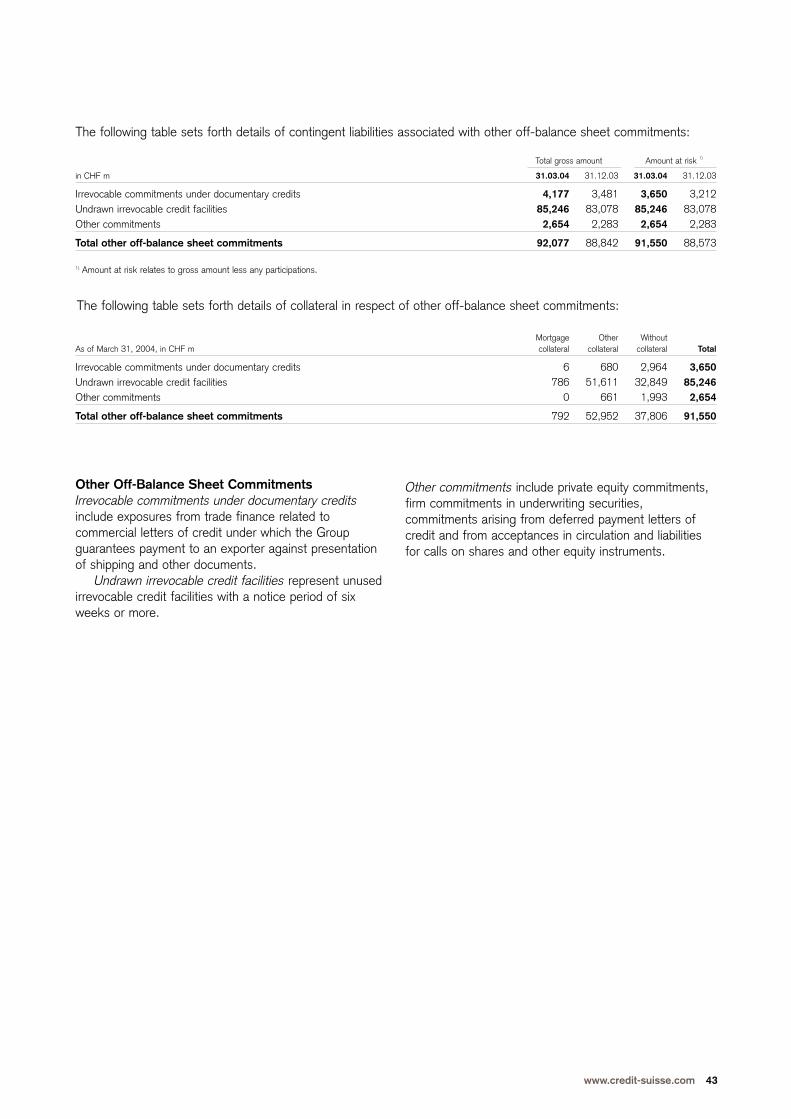
www.credit-suisse.com 43
Other Off-Balance Sheet CommitmentsIrrevocable commitments under documentary creditsinclude exposures from trade finance related tocommercial letters of credit under which the Groupguarantees payment to an exporter against presentationof shipping and other documents.
Undrawn irrevocable credit facilities represent unusedirrevocable credit facilities with a notice period of sixweeks or more.
Total gross amount Amount at risk 1)
in CHF m 31.03.04 31.12.03 31.03.04 31.12.03
Irrevocable commitments under documentary credits 4,177 3,481 3,650 3,212Undrawn irrevocable credit facilities 85,246 83,078 85,246 83,078Other commitments 2,654 2,283 2,654 2,283
Total other off-balance sheet commitments 92,077 88,842 91,550 88,573
1) Amount at risk relates to gross amount less any participations.
Mortgage Other WithoutAs of March 31, 2004, in CHF m collateral collateral collateral Total
Irrevocable commitments under documentary credits 6 680 2,964 3,650Undrawn irrevocable credit facilities 786 51,611 32,849 85,246Other commitments 0 661 1,993 2,654
Total other off-balance sheet commitments 792 52,952 37,806 91,550
1)
Other commitments include private equity commitments,firm commitments in underwriting securities,commitments arising from deferred payment letters ofcredit and from acceptances in circulation and liabilitiesfor calls on shares and other equity instruments.
The following table sets forth details of collateral in respect of other off-balance sheet commitments:
The following table sets forth details of contingent liabilities associated with other off-balance sheet commitments:
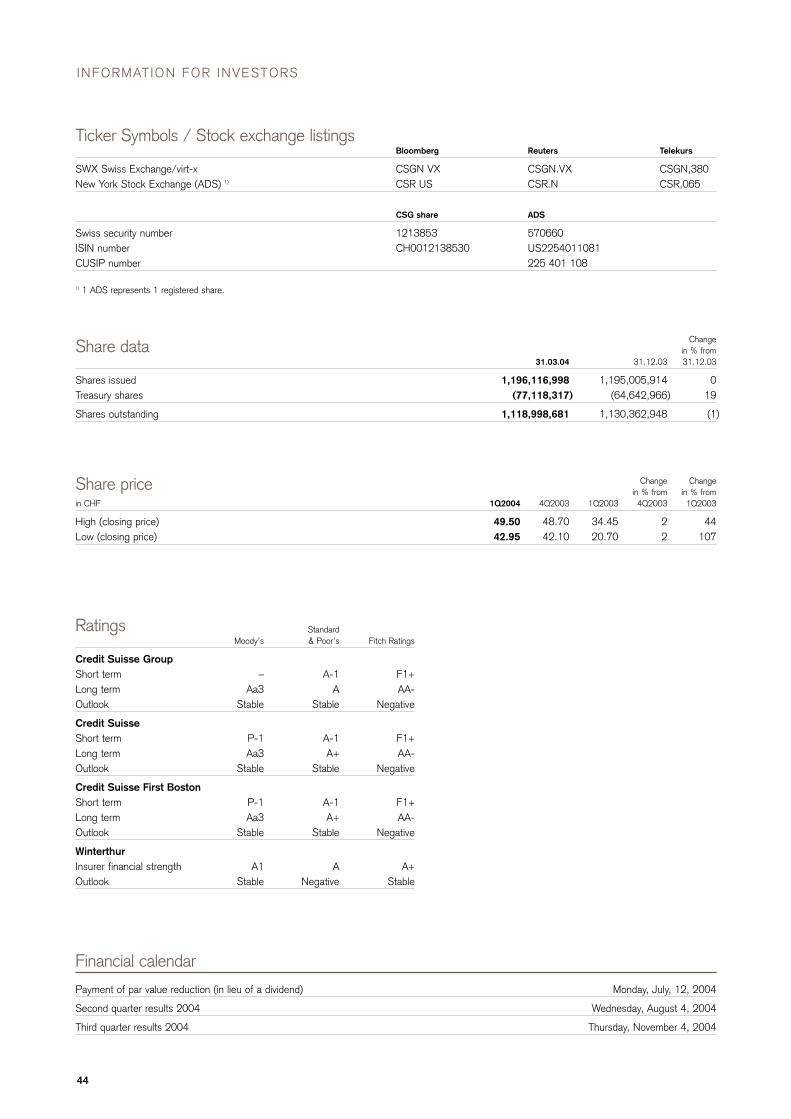
44
INFORMATION FOR INVESTORS
Bloomberg Reuters Telekurs
SWX Swiss Exchange/virt-x CSGN VX CSGN.VX CSGN,380New York Stock Exchange (ADS) 1) CSR US CSR.N CSR,065
CSG share ADS
Swiss security number 1213853 570660ISIN number CH0012138530 US2254011081CUSIP number 225 401 108
1) 1 ADS represents 1 registered share.
Ticker Symbols / Stock exchange listings
Changein % from
31.03.04 31.12.03 31.12.03
Shares issued 1,196,116,998 1,195,005,914 0Treasury shares (77,118,317) (64,642,966) 19
Shares outstanding 1,118,998,681 1,130,362,948 (1)
Share data
Change Changein % from in % from
in CHF 1Q2004 4Q2003 1Q2003 4Q2003 1Q2003
High (closing price) 49.50 48.70 34.45 2 44Low (closing price) 42.95 42.10 20.70 2 107
Share price
Financial calendar
Payment of par value reduction (in lieu of a dividend) Monday, July, 12, 2004
Second quarter results 2004 Wednesday, August 4, 2004
Third quarter results 2004 Thursday, November 4, 2004
StandardMoody’s & Poor’s Fitch Ratings
Credit Suisse GroupShort term – A-1 F1+Long term Aa3 A AA-Outlook Stable Stable Negative
Credit SuisseShort term P-1 A-1 F1+Long term Aa3 A+ AA-Outlook Stable Stable Negative
Credit Suisse First BostonShort term P-1 A-1 F1+Long term Aa3 A+ AA-Outlook Stable Stable Negative
WinterthurInsurer financial strength A1 A A+Outlook Stable Negative Stable
Ratings
EnquiriesCredit Suisse GroupInvestor RelationsGerhard Beindorff, Marc BuchheisterTel. +41 1 333 4570/+41 1 333 3169Fax +41 1 333 2587
Credit Suisse GroupMedia RelationsKarin Rhomberg Hug, Claudia KraazTel. +41 1 333 8844 Fax +41 1 333 8877
In this year’s corporate reports we have chosen to present anumber of personalities whose achievements reflect particularvalues of Credit Suisse Group. This report features Sarah Holt –founder of a private television production company – renowned for innovative and progressive productions.

Credit Suisse GroupParadeplatz 8P.O. Box 18070 ZurichSwitzerlandTel. +41 1 212 1616Fax +41 1 333 2587www.credit-suisse.com
5520124English