Embed Size (px)
Citation preview
CMP 683.00
Target Price 765.00
ISIN: INE201K01015
JULY 28th
,2015
SQS INDIA BFSI LTD
Result Update (Consolidated): Q1 FY16
BUYBUYBUYBUY
Index Details
Stock Data
Sector IT Consulting & Software
BSE Code 533121
Face Value 10.00
52wk. High / Low (Rs.) 790.00/385.00
Volume (2wk. Avg. Q.) 7066
Market Cap (Rs. in mn.) 7239.80
Annual Estimated Results (A*: Actual / E*: Estimated)
YEARS FY15A FY16E FY17E
Net Sales 2141.50 2398.48 2662.31
EBITDA 388.50 446.80 506.40
Net Profit 216.40 257.31 296.17
EPS 20.51 24.27 27.94
P/E 33.30 28.14 24.45
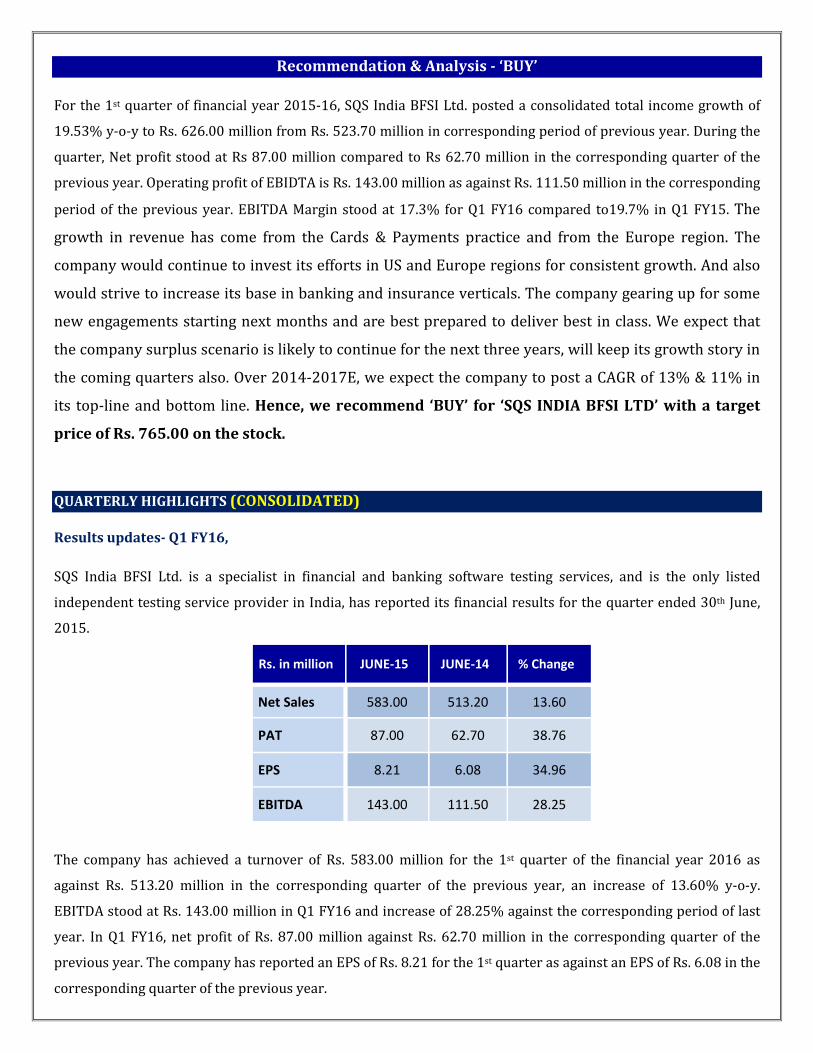
Shareholding Pattern (%)
1 Year Comparative Graph
SQS INDIA BFSI LTD BSE SENSEX
SYNOPSIS
SQS India BFSI Ltd. (formerly known as “Thinksoft
Global Services Ltd”) is an independent Business
Assurance and Testing Specialist working entirely
with financial sector clients in APAC, the USA,
Europe, Middle East and India.
In Q1 FY16, Net profit at Rs 87.00 million compared
to Rs 62.70 million in Q1 FY15. An increase of
38.76% y-o-y.
The company’s net sales registered 13.60% increase
in Q1 FY16 and stood at Rs. 583.00 million from Rs.
513.20 million in Q1 FY15.
Other income Jumps to 309.52% in the June quarter
of current year and stood at Rs. 43.00 mn compared
to Rs. 10.50 mn in the same quarter previous year.
For Q1 FY16, operating profit is Rs. 143.00 million
as against Rs. 111.50 million in the corresponding
period of the previous year.
EBITDA Margin stood at 17.3% for Q1 FY16
compared to19.7% in Q1 FY15.
The company has reported an EPS of Rs. 8.21 for the
1st quarter as against an EPS of Rs. 6.08 in the
corresponding quarter of the previous year.
Profit before tax (PBT) at Rs. 131.00 million in Q1
FY16 compared to Rs. 93.70 million in Q1 FY15.
Net Sales and PAT of the company are expected to
grow at a CAGR of 13% & 11% over 2014 to 2017E
respectively.
PEER GROUPS CMP MARKET CAP EPS P/E (X) P/BV(X) DIVIDEND
Company Name (Rs.) Rs. in mn. (Rs.) Ratio Ratio (%)
SQS India BFSI Ltd 683.00 7239.80 20.51 33.30 7.09 240.00
Tata Elxsi Ltd 1619.35 50423.70 37.83 42.81 17.80 110.00
Zensar Technologies Ltd 878.25 38950.10 45.59 19.26 5.06 110.00
Mastek Ltd 186.20 4247.70 29.56 6.30 1.02 50.00
Recommendation & Analysis - ‘BUY’
For the 1st quarter of financial year 2015-16, SQS India BFSI Ltd. posted a consolidated total income growth of
19.53% y-o-y to Rs. 626.00 million from Rs. 523.70 million in corresponding period of previous year. During the
quarter, Net profit stood at Rs 87.00 million compared to Rs 62.70 million in the corresponding quarter of the
previous year. Operating profit of EBIDTA is Rs. 143.00 million as against Rs. 111.50 million in the corresponding
period of the previous year. EBITDA Margin stood at 17.3% for Q1 FY16 compared to19.7% in Q1 FY15. The
growth in revenue has come from the Cards & Payments practice and from the Europe region. The
company would continue to invest its efforts in US and Europe regions for consistent growth. And also
would strive to increase its base in banking and insurance verticals. The company gearing up for some
new engagements starting next months and are best prepared to deliver best in class. We expect that
the company surplus scenario is likely to continue for the next three years, will keep its growth story in
the coming quarters also. Over 2014-2017E, we expect the company to post a CAGR of 13% & 11% in
its top-line and bottom line. Hence, we recommend ‘BUY’ for ‘SQS INDIA BFSI LTD’ with a target
price of Rs. 765.00 on the stock.
QUARTERLY HIGHLIGHTS (CONSOLIDATED)
Results updates- Q1 FY16,
SQS India BFSI Ltd. is a specialist in financial and banking software testing services, and is the only listed
independent testing service provider in India, has reported its financial results for the quarter ended 30th June,
2015.
The company has achieved a turnover of Rs. 583.00 million for the 1st quarter of the financial year 2016 as
against Rs. 513.20 million in the corresponding quarter of the previous year, an increase of 13.60% y-o-y.
EBITDA stood at Rs. 143.00 million in Q1 FY16 and increase of 28.25% against the corresponding period of last
year. In Q1 FY16, net profit of Rs. 87.00 million against Rs. 62.70 million in the corresponding quarter of the
previous year. The company has reported an EPS of Rs. 8.21 for the 1st quarter as against an EPS of Rs. 6.08 in the
corresponding quarter of the previous year.
Rs. in million JUNE-15 JUNE-14 % Change
Net Sales 583.00 513.20 13.60
PAT 87.00 62.70 38.76
EPS 8.21 6.08 34.96
EBITDA 143.00 111.50 28.25
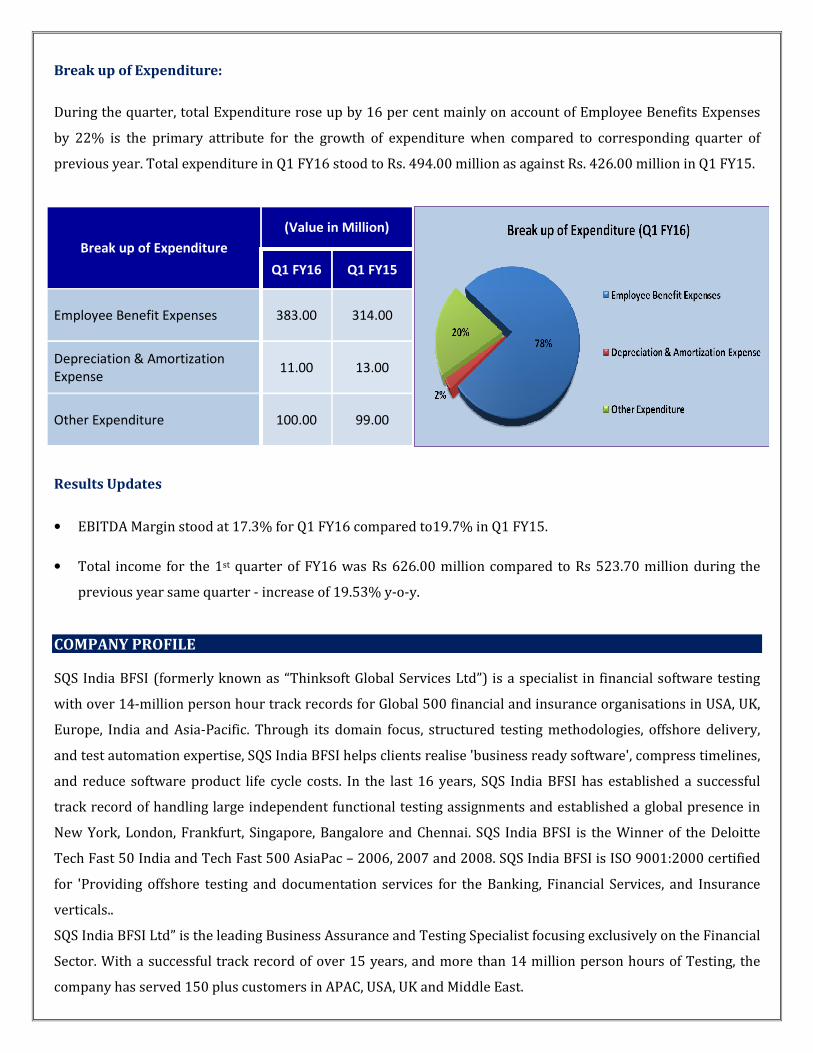
Break up of Expenditure:
During the quarter, total Expenditure rose up by 16 per cent mainly on account of Employee Benefits Expenses
by 22% is the primary attribute for the growth of expenditure when compared to corresponding quarter of
previous year. Total expenditure in Q1 FY16 stood to Rs. 494.00 million as against Rs. 426.00 million in Q1 FY15.
Break up of Expenditure
(Value in Million)
Q1 FY16 Q1 FY15
Employee Benefit Expenses 383.00 314.00
Depreciation & Amortization
Expense 11.00 13.00
Other Expenditure 100.00 99.00
Results Updates
• EBITDA Margin stood at 17.3% for Q1 FY16 compared to19.7% in Q1 FY15.
• Total income for the 1st quarter of FY16 was Rs 626.00 million compared to Rs 523.70 million during the
previous year same quarter - increase of 19.53% y-o-y.
COMPANY PROFILE
SQS India BFSI (formerly known as “Thinksoft Global Services Ltd”) is a specialist in financial software testing
with over 14-million person hour track records for Global 500 financial and insurance organisations in USA, UK,
Europe, India and Asia-Pacific. Through its domain focus, structured testing methodologies, offshore delivery,
and test automation expertise, SQS India BFSI helps clients realise 'business ready software', compress timelines,
and reduce software product life cycle costs. In the last 16 years, SQS India BFSI has established a successful
track record of handling large independent functional testing assignments and established a global presence in
New York, London, Frankfurt, Singapore, Bangalore and Chennai. SQS India BFSI is the Winner of the Deloitte
Tech Fast 50 India and Tech Fast 500 AsiaPac – 2006, 2007 and 2008. SQS India BFSI is ISO 9001:2000 certified
for 'Providing offshore testing and documentation services for the Banking, Financial Services, and Insurance
verticals..
SQS India BFSI Ltd” is the leading Business Assurance and Testing Specialist focusing exclusively on the Financial
Sector. With a successful track record of over 15 years, and more than 14 million person hours of Testing, the
company has served 150 plus customers in APAC, USA, UK and Middle East.
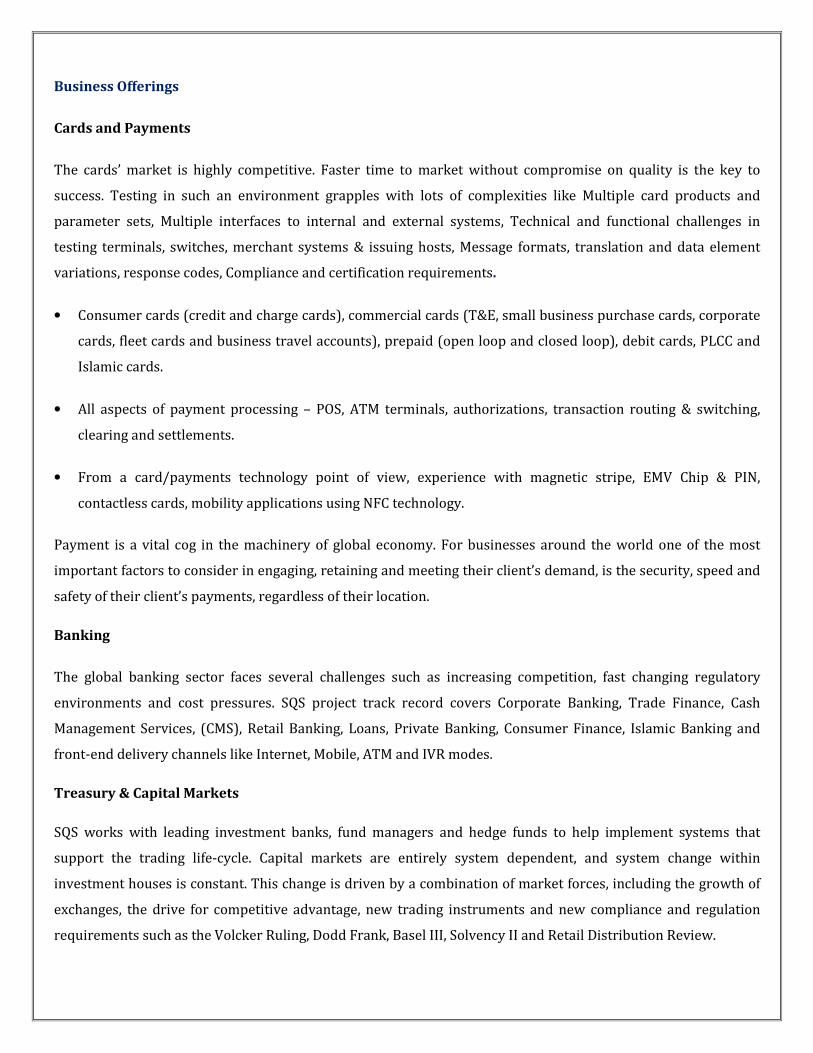
Business Offerings
Cards and Payments
The cards’ market is highly competitive. Faster time to market without compromise on quality is the key to
success. Testing in such an environment grapples with lots of complexities like Multiple card products and
parameter sets, Multiple interfaces to internal and external systems, Technical and functional challenges in
testing terminals, switches, merchant systems & issuing hosts, Message formats, translation and data element
variations, response codes, Compliance and certification requirements.
• Consumer cards (credit and charge cards), commercial cards (T&E, small business purchase cards, corporate
cards, fleet cards and business travel accounts), prepaid (open loop and closed loop), debit cards, PLCC and
Islamic cards.
• All aspects of payment processing – POS, ATM terminals, authorizations, transaction routing & switching,
clearing and settlements.
• From a card/payments technology point of view, experience with magnetic stripe, EMV Chip & PIN,
contactless cards, mobility applications using NFC technology.
Payment is a vital cog in the machinery of global economy. For businesses around the world one of the most
important factors to consider in engaging, retaining and meeting their client’s demand, is the security, speed and
safety of their client’s payments, regardless of their location.
Banking
The global banking sector faces several challenges such as increasing competition, fast changing regulatory
environments and cost pressures. SQS project track record covers Corporate Banking, Trade Finance, Cash
Management Services, (CMS), Retail Banking, Loans, Private Banking, Consumer Finance, Islamic Banking and
front-end delivery channels like Internet, Mobile, ATM and IVR modes.
Treasury & Capital Markets
SQS works with leading investment banks, fund managers and hedge funds to help implement systems that
support the trading life-cycle. Capital markets are entirely system dependent, and system change within
investment houses is constant. This change is driven by a combination of market forces, including the growth of
exchanges, the drive for competitive advantage, new trading instruments and new compliance and regulation
requirements such as the Volcker Ruling, Dodd Frank, Basel III, Solvency II and Retail Distribution Review.
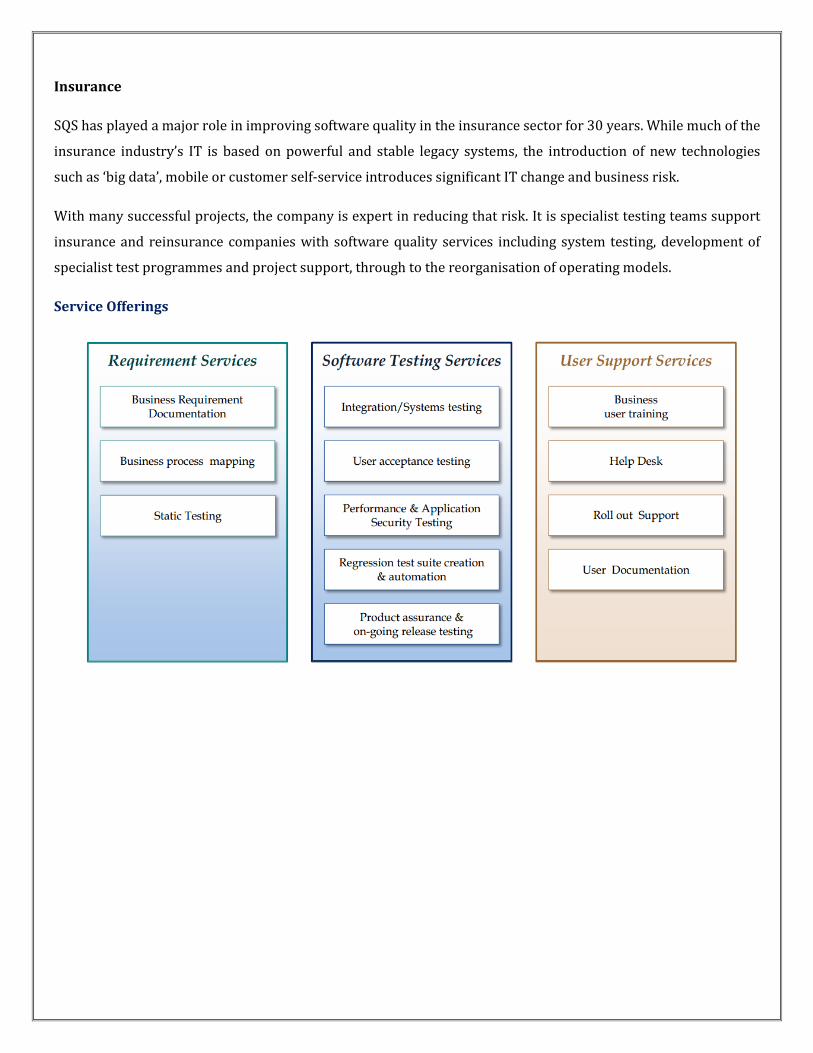
Insurance
SQS has played a major role in improving software quality in the insurance sector for 30 years. While much of the
insurance industry’s IT is based on powerful and stable legacy systems, the introduction of new technologies
such as ‘big data’, mobile or customer self-service introduces significant IT change and business risk.
With many successful projects, the company is expert in reducing that risk. It is specialist testing teams support
insurance and reinsurance companies with software quality services including system testing, development of
specialist test programmes and project support, through to the reorganisation of operating models.
Service Offerings
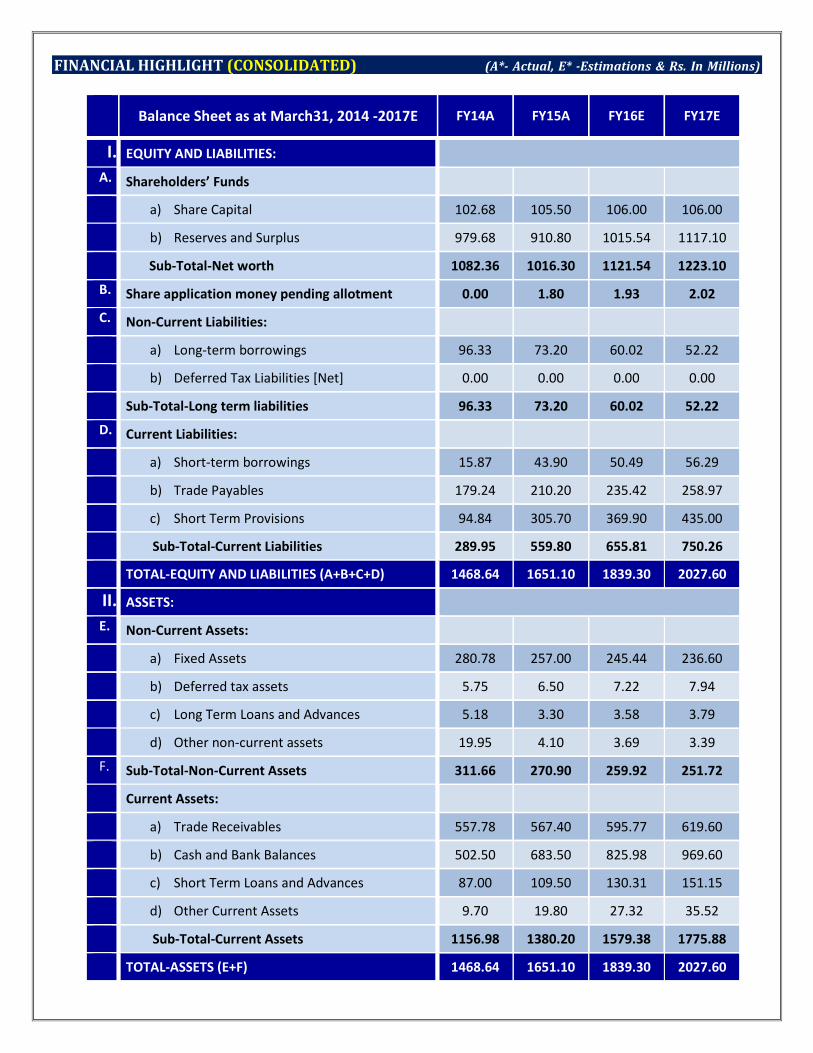
FINANCIAL HIGHLIGHT (CONSOLIDATED) (A*- Actual, E* -Estimations & Rs. In Millions)
Balance Sheet as at March31, 2014 -2017E FY14A FY15A FY16E FY17E
I. EQUITY AND LIABILITIES:
A. Shareholders’ Funds
a) Share Capital 102.68 105.50 106.00 106.00
b) Reserves and Surplus 979.68 910.80 1015.54 1117.10
Sub-Total-Net worth 1082.36 1016.30 1121.54 1223.10
B. Share application money pending allotment 0.00 1.80 1.93 2.02
C. Non-Current Liabilities:
a) Long-term borrowings 96.33 73.20 60.02 52.22
b) Deferred Tax Liabilities [Net] 0.00 0.00 0.00 0.00
Sub-Total-Long term liabilities 96.33 73.20 60.02 52.22
D. Current Liabilities:
a) Short-term borrowings 15.87 43.90 50.49 56.29
b) Trade Payables 179.24 210.20 235.42 258.97
c) Short Term Provisions 94.84 305.70 369.90 435.00
Sub-Total-Current Liabilities 289.95 559.80 655.81 750.26
TOTAL-EQUITY AND LIABILITIES (A+B+C+D) 1468.64 1651.10 1839.30 2027.60
II. ASSETS:
E. Non-Current Assets:
a) Fixed Assets 280.78 257.00 245.44 236.60
b) Deferred tax assets 5.75 6.50 7.22 7.94
c) Long Term Loans and Advances 5.18 3.30 3.58 3.79
d) Other non-current assets 19.95 4.10 3.69 3.39
F. Sub-Total-Non-Current Assets 311.66 270.90 259.92 251.72
Current Assets:
a) Trade Receivables 557.78 567.40 595.77 619.60
b) Cash and Bank Balances 502.50 683.50 825.98 969.60
c) Short Term Loans and Advances 87.00 109.50 130.31 151.15
d) Other Current Assets 9.70 19.80 27.32 35.52
Sub-Total-Current Assets 1156.98 1380.20 1579.38 1775.88
TOTAL-ASSETS (E+F) 1468.64 1651.10 1839.30 2027.60
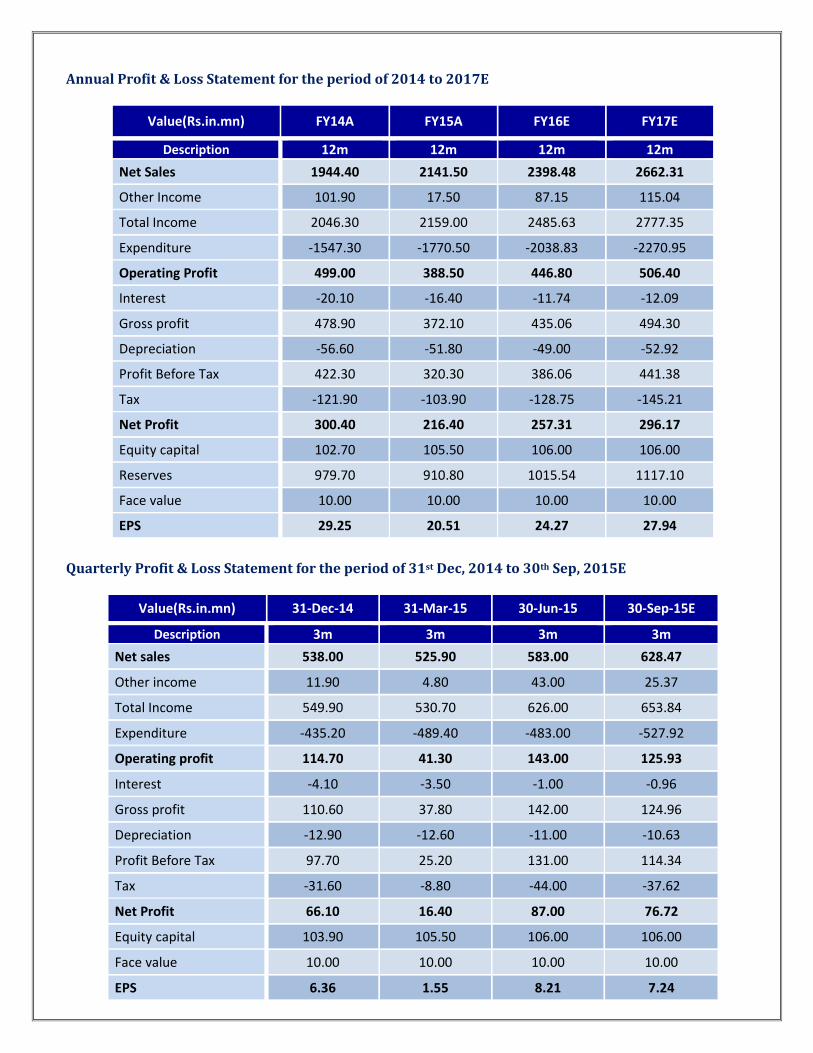
Annual Profit & Loss Statement for the period of 2014 to 2017E
Value(Rs.in.mn) FY14A FY15A FY16E FY17E
Description 12m 12m 12m 12m
Net Sales 1944.40 2141.50 2398.48 2662.31
Other Income 101.90 17.50 87.15 115.04
Total Income 2046.30 2159.00 2485.63 2777.35
Expenditure -1547.30 -1770.50 -2038.83 -2270.95
Operating Profit 499.00 388.50 446.80 506.40
Interest -20.10 -16.40 -11.74 -12.09
Gross profit 478.90 372.10 435.06 494.30
Depreciation -56.60 -51.80 -49.00 -52.92
Profit Before Tax 422.30 320.30 386.06 441.38
Tax -121.90 -103.90 -128.75 -145.21
Net Profit 300.40 216.40 257.31 296.17
Equity capital 102.70 105.50 106.00 106.00
Reserves 979.70 910.80 1015.54 1117.10
Face value 10.00 10.00 10.00 10.00
EPS 29.25 20.51 24.27 27.94
Quarterly Profit & Loss Statement for the period of 31st Dec, 2014 to 30th Sep, 2015E
Value(Rs.in.mn) 31-Dec-14 31-Mar-15 30-Jun-15 30-Sep-15E
Description 3m 3m 3m 3m
Net sales 538.00 525.90 583.00 628.47
Other income 11.90 4.80 43.00 25.37
Total Income 549.90 530.70 626.00 653.84
Expenditure -435.20 -489.40 -483.00 -527.92
Operating profit 114.70 41.30 143.00 125.93
Interest -4.10 -3.50 -1.00 -0.96
Gross profit 110.60 37.80 142.00 124.96
Depreciation -12.90 -12.60 -11.00 -10.63
Profit Before Tax 97.70 25.20 131.00 114.34
Tax -31.60 -8.80 -44.00 -37.62
Net Profit 66.10 16.40 87.00 76.72
Equity capital 103.90 105.50 106.00 106.00
Face value 10.00 10.00 10.00 10.00
EPS 6.36 1.55 8.21 7.24
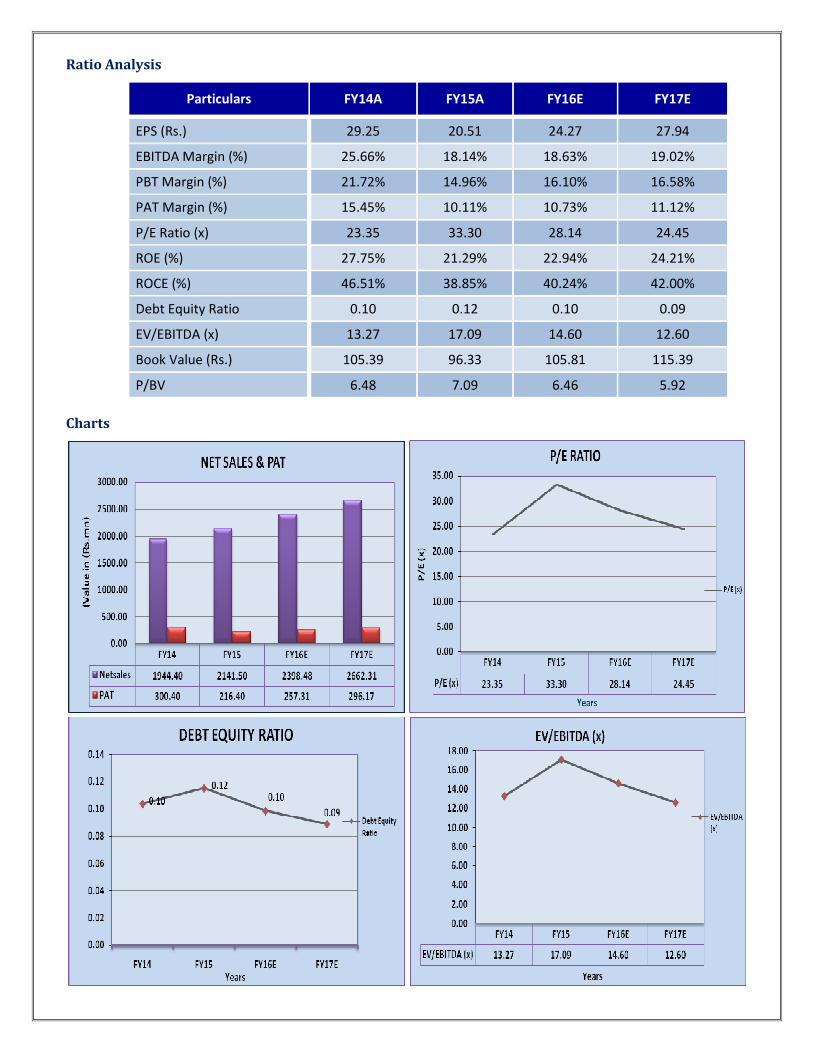
Ratio Analysis
Particulars FY14A FY15A FY16E FY17E
EPS (Rs.) 29.25 20.51 24.27 27.94
EBITDA Margin (%) 25.66% 18.14% 18.63% 19.02%
PBT Margin (%) 21.72% 14.96% 16.10% 16.58%
PAT Margin (%) 15.45% 10.11% 10.73% 11.12%
P/E Ratio (x) 23.35 33.30 28.14 24.45
ROE (%) 27.75% 21.29% 22.94% 24.21%
ROCE (%) 46.51% 38.85% 40.24% 42.00%
Debt Equity Ratio 0.10 0.12 0.10 0.09
EV/EBITDA (x) 13.27 17.09 14.60 12.60
Book Value (Rs.) 105.39 96.33 105.81 115.39
P/BV 6.48 7.09 6.46 5.92
Charts
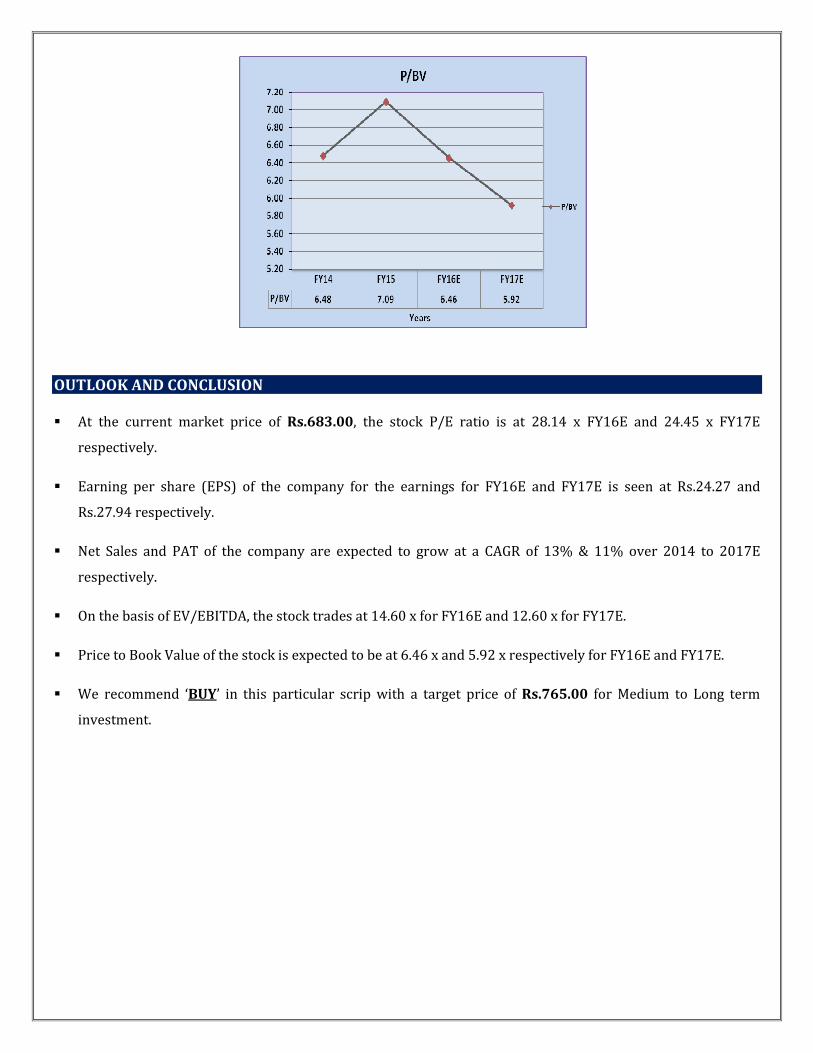
OUTLOOK AND CONCLUSION
� At the current market price of Rs.683.00, the stock P/E ratio is at 28.14 x FY16E and 24.45 x FY17E
respectively.
� Earning per share (EPS) of the company for the earnings for FY16E and FY17E is seen at Rs.24.27 and
Rs.27.94 respectively.
� Net Sales and PAT of the company are expected to grow at a CAGR of 13% & 11% over 2014 to 2017E
respectively.
� On the basis of EV/EBITDA, the stock trades at 14.60 x for FY16E and 12.60 x for FY17E.
� Price to Book Value of the stock is expected to be at 6.46 x and 5.92 x respectively for FY16E and FY17E.
� We recommend ‘BUY’ in this particular scrip with a target price of Rs.765.00 for Medium to Long term
investment.
INDUSTRY OVERVIEW
India is the world's largest sourcing destination for the information technology (IT) industry, accounting for
approximately 52 per cent of the US$ 124-130 billion market. The industry employs about 10 million Indians and
continues to contribute significantly to the social and economic transformation in the country.
The Indian IT and ITeS industry is divided into four major segments – IT services, business process management
(BPM), software products and engineering services, and hardware.
The IT-BPM sector in India grew at a compound annual growth rate (CAGR) of 25 per cent over 2000-2013,
which is 3-4 times higher than the global IT-BPM spend, and is estimated to expand at a CAGR of 9.5 per cent to
US$ 300 billion by 2020. India has emerged as the fastest growing market for Dell globally and the third largest
market in terms of revenue after the US and China, as per Managing Director, Dell India.
Market Size
India, the fourth largest base for young businesses in the world and home to 3,000 tech start-ups, is set to
increase its base to 11,500 tech start-ups by 2020.
India’s internet economy is expected to touch Rs 10 trillion (US$ 161.26 billion) by 2018, accounting for 5 per
cent of the country’s gross domestic product (GDP), according to a report by the Boston Consulting Group (BCG)
and Internet and Mobile Association of India (IAMAI). In December 2014, India’s internet user base reached 300
million, the third largest in the world, while the number of social media users and smart phones grew to 100
million.
Public cloud services revenue in India is expected to reach US$ 838 million in 2015, growing by 33 per cent year-
on-year (y-o-y), as per a report by Gartner Inc. In yet another Gartner report, the public cloud market alone in the
country was estimated to treble to US$ 1.9 billion by 2018 from US$ 638 million in 2014. The increased internet
penetration and rise of e-commerce are the main reasons for continued growth of the data centre co-location and
hosting market in India.
Investments
Indian IT's core competencies and strengths have placed it on the international canvas, attracting investments
from major countries. The computer software and hardware sector in India attracted cumulative foreign direct
investment (FDI) inflows worth US$ 13,788.56 million between April 2000 and December 2014, according to
data released by the Department of Industrial Policy and Promotion (DIPP).
The private equity (PE) deals increased the number of mergers and acquisitions (M&A) especially in the e-
commerce space in 2014. The IT space, including e-commerce, witnessed 240 deals worth US$ 3.8 billion in
2014, as per data from Dealogic.
India also saw a ten-fold increase in the venture funding that went into internet companies in 2014 as compared
to 2013. More than 800 internet start-ups got funding in 2014 as compared to 200 in 2012, said Rajan Anandan,
Managing Director, Google India Pvt Ltd and Chairman, IAMA.
Most large technology companies may have so far focused primarily on bigger enterprises, but a report from
market research firm Zinnov highlighted that the small and medium businesses will present a lucrative
opportunity worth US$ 11.6 billion in 2015 and US$ 25.8 billion in 2020. Moreover, India has nearly 51 million
such businesses of which 12 million have a high degree of technology influence and are looking to adopt newer
IT products, as per the report.
Some of the major investments in the Indian IT and ITeS sector are as follows:
• Wipro has won a US$ 400 million, multi-year IT infrastructure management contract from Swiss engineering
giant ABB, making it the largest deal for the technology company.
• Tech Mahindra has signed a definitive agreement to acquire Geneva-based SOFGEN Holdings. The acquisition
is expected to strengthen Tech Mahindra’s presence in the banking segment.
• Tata Consultancy Services (TCS) plans to set up offshore development centres in India for Japanese clients in
a bid to boost the company's margin in the market.
• Reliance is building a 650,000 square feet (sq ft) data centre in India—its 10th data centre in the country—
with a combined capacity of about 1 million sq ft and an overall investment of US$ 200 million.
• Intel Corp plans to invest about US$ 62 million in 16 technology companies, working on wearable, data
analytics and the Internet of Things (IoT), in 2015 through its investment arm Intel Capital. The Indian IoT
industry is expected be worth US$ 15 billion and to connect 28 billion devices to the internet by 2020.
• Keiretsu Forum, a global angel investor network, has forayed into India by opening a chapter in Chennai.
With this, the Silicon Valley-based network will have 34 chapters across three continents.
Government Initiatives
The adoption of key technologies across sectors spurred by the 'Digital India Initiative' could help boost India's
gross domestic product (GDP) by US$ 550 billion to US$ 1 trillion by 2025, as per research firm McKinsey.
Some of the major initiatives taken by the government to promote IT and ITeS sector in India are as follows:
� India and the United States (US) have agreed to jointly explore opportunities for collaboration on
implementing India's ambitious Rs 1.13 trillion (US$ 18.22 billion) ‘Digital India Initiative’. The two sides also
agreed to hold the US-India Information and Communication Technology (ICT) Working Group in India later
this year.
� India and Japan held a Joint Working Group conference for Comprehensive Cooperation Framework for ICT.
India also offered Japan to manufacture ICT equipment in India.
� The Government of Telangana began construction of a technology incubator in Hyderabad—dubbed T-Hub—
to reposition the city as a technology destination. The state government is initially investing Rs 35 crore (US$
5.64 million) to set up a 60,000 sq ft space, labelled the largest start-up incubator in the county, at the
campus of International Institute of Information Technology-Hyderabad (IIIT-H). Once completed, the
project is proposed to be the world’s biggest start-up incubator housing 1,000 start-ups.
� Bengaluru has received US$ 2.6 billion in venture capital (VC) investments in 2014, making it the fifth largest
recipient globally during the year, an indication of the growing vibrancy of its startup ecosystem. Among
countries, India received the third highest VC funding worth US$ 4.6 billion.
Industry Outlook
The global economic outlook in the year under review was divergent, with growth in the United States, weaker
recoveries in Europe and Japan, while emerging economies including China slowed down in growth rates. IT
Exports were impacted by significant exchange rate volatility especially with the Euro and Pound Sterling
weakening in the second half of FY15.
As per NASSCOM, Indian IT export revenues is expected to grow by 12-14% in FY16, while domestic IT revenues
excluding e-commerce is expected to grow at a similar rate.
Disclaimer:
This document is prepared by our research analysts and it does not constitute an offer or solicitation for the
purchase or sale of any financial instrument or as an official confirmation of any transaction. The information
contained herein is from publicly available data or other sources believed to be reliable but we do not represent that
it is accurate or complete and it should not be relied on as such. Firstcall Research or any of its affiliates shall not be
in any way responsible for any loss or damage that may arise to any person from any inadvertent error in the
information contained in this report. Firstcall Research and/ or its affiliates and/or employees will not be liable for
the recipients’ investment decision based on this document.
Firstcall India Equity Research: Email – [email protected]
C.V.S.L.Kameswari Pharma & Diversified
U. Janaki Rao Capital Goods
B. Anil Kumar Auto, IT & FMCG
M. Vinayak Rao Diversified
G. Amarender Diversified
Firstcall Research Provides
Industry Research on all the Sectors and Equity Research on Major Companies
forming part of Listed and Unlisted Segments
For Further Details Contact:
Tel.: 022-2527 2510/2527 6077 / 25276089 Telefax: 022-25276089
040-20000235 /20000233
E-mail: [email protected]
www.firstcallresearch.com