Embed Size (px)
Citation preview

This dIn the
HA
document e event of
ALF-
J
has been discrepanc
-YEAREPUNE
translatedcy, the Ital
AR FPORTE 30
d into Engllian langua
FINAT AT, 201
ish for theage versio
ANCT 17
convenienn prevails.
IAL
nce of the .
readers.

CONTENTS INTERIM MANAGEMENT REPORT AT JUNE 30, 2017
The TIM Group _______________________________________________________________________ 3 Highlights – Half-Year 2017 ____________________________________________________________ 5 Consolidated Operating Performance ____________________________________________________ 8 Financial and Operating Highlights of the Business Units of the TIM Group ___________________ 14 Consolidated Financial Position and Cash Flows Performance ______________________________ 23 Consolidated Financial Statements – TIM Group _________________________________________ 31 Events Subsequent to June 30, 2017 __________________________________________________ 39 Business Outlook for the Year 2017 ___________________________________________________ 39 Main risks and uncertainties _________________________________________________________ 40 Main changes in the regulatory framework ______________________________________________ 44 Corporate Boards at June 30, 2017 ___________________________________________________ 47 Macro-Organization Chart at June 30, 2017 _____________________________________________ 49 Information for Investors _____________________________________________________________ 50 Related Party Transactions ___________________________________________________________ 52 Alternative Performance Measures ____________________________________________________ 53 Sustainability ______________________________________________________________________ 55 Research & development and innovative services ________________________________________ 56 Environmental protection ____________________________________________________________ 60 TIM People ________________________________________________________________________ 62
TIM GROUP HALF-YEAR CONDENSED CONSOLIDATED FINANCIAL STATEMENTS AT JUNE 30, 2017 __________________________________ 67
Contents __________________________________________________________________________ 68
Consolidated Statements of Financial Position __________________________________________ 69
Separate Consolidated Income Statements _____________________________________________ 71
Consolidated Statements of Comprehensive Income _____________________________________ 72
Consolidated Statements of Changes in Equity __________________________________________ 73
Consolidated Statements of Cash Flows ________________________________________________ 74
Notes to the Consolidated Financial Statements _________________________________________ 76
Certification of the Half-Year Condensed Consolidated Financial Statements
pursuant to Article 81-ter of the Consob Regulation 11971 dated May 14, 1999, with
amendments and additions _________________________________________________________ 150
Auditors’ Report on the Limited Review of the Half-Year Condensed Consolidated
Financial Statements ______________________________________________________________ 151
USEFUL INFORMATION _________________________________________ 152

Interim Management Report at June 30, 2017
The TIM Group 3
THE TIM GROUP
THE BUSINESS UNITS
DOMESTIC
The Domestic Business Unit operates as the consolidated market leader in the sphere of voice and data services on fixed and mobile networks for final retail customers and other wholesale operators. In the international field, the Business Unit develops fiber optic networks for wholesale customers (in Europe, in the Mediterranean and in South America). Olivetti, which is now part of the Business segment of Core Domestic, operates in the area of office products and services for Information Technology. INWIT S.p.A. operates in the electronic communications infrastructure sector, specifically relating to infrastructure for housing radio transmission equipment for mobile telephone networks, both for TIM and other operators.
CORE DOMESTIC
• Consumer
• Business
• Wholesale
• Other (INWIT S.p.A. and support structures)
INTERNATIONAL WHOLESALE Telecom Italia Sparkle Group
• Telecom Italia Sparkle S.p.A.
• TI Sparkle Ireland Telecommunications Group
BRAZIL
The Brazil Business Unit (Tim Brasil group) provides mobile telephone services using UMTS, GSM and LTE technologies. Moreover, with the acquisitions and subsequent integrations into the group of Intelig Telecomunicações, Tim Fiber RJ and Tim Fiber SP, the services portfolio has been extended by offering fiber optic data transmission using full IP technology such as DWDM and MPLS and by offering residential broadband services.
Tim Brasil Serviços e Participações S.A.
• Tim Participações S.A. – Intelig Telecomunicações Ltda – Tim Celular S.A.

Interim Management Report at June 30, 2017
Board of Directors and Board of Statutory Auditors of TIM S.p.A.
4
BOARD OF DIRECTORS Chairman Arnaud Roy de Puyfontaine
Deputy Chairman Giuseppe Recchi
Chief Executive Officer Flavio Cattaneo (*)
Directors Camilla Antonini (independent) Franco Bernabè (independent) Ferruccio Borsani (independent) Lucia Calvosa (independent) Francesca Cornelli (independent) Frédéric Crépin Dario Frigerio (independent) Félicité Herzog (independent) Anna Jones (independent) Marella Moretti (independent) Hervé Philippe Danilo Vivarelli (independent)
Secretary to the Board Agostino Nuzzolo
(*) Flavio Cattaneo departed the office of Chief Executive Officer on July 28, 2017
BOARD OF STATUTORY AUDITORS Chairman Roberto Capone
Acting Auditors Vincenzo Cariello
Paola Maiorana
Gianluca Ponzellini
Ugo Rock
Alternate Auditors Francesco Di Carlo Gabriella Chersicla Piera Vitali Riccardo Schioppo
On July 27, 2017, the Board of Directors of TIM S.p.A. acknowledged the start of the direction and coordination by Vivendi S.A..

Interim Management Report at June 30, 2017
Highlights – Half-Year 2017 5
HIGHLIGHTS – HALF-YEAR 2017 In terms of equity and income, for the first half of 2017:
• Consolidated revenues amounted to 9.8 billion euros, up by 7.4% on the first half of 2016 (+3.2% in organic terms). The figure for the second quarter of 2017 was up 6.4% (+3.7% in organic terms).
• EBITDA amounted to 4.1 billion euros, up by 10.4% on the first half of 2016 (+7.2% in organic terms). The Organic EBITDA margin stood at 42.1%, 1.6 percentage points higher than in the first half of 2016. EBITDA in the first half of 2017 was pulled lower by a total of 95 million euros in non-recurring expenses (93 million euros in the first half of 2016, at constant exchange rates), without which the organic change in EBITDA would have been +7.0%, with an EBITDA margin of 43.1%, up 1.6 percentage points compared to the first half of 2016. EBITDA for the second quarter of 2017 amounted to 2.1 billion euros, up 5.5% on second quarter of 2016. In organic terms, and without the impact of the above-mentioned non-recurring expenses, the increase would have been 6.1%.
• Operating profit (EBIT) was 1.9 billion euros, up 10.9% compared to the first half of 2016 (+9.3% in organic terms), as a result of the negative impact of non-recurring net expenses of 96 million euros (82 million euros in the first half of 2016), without which the organic change in EBIT would have been +9.6%. EBIT for the second quarter of 2017 amounted to 1 billion euros, up 2.3% on second quarter of 2016.
• Profit for the period attributable to owners of the Parent amounted to 0.6 billion euros (1 billion euros in the first half of 2016). On a like-for-like basis – i.e. without including the impact of non-recurring net expenses and, in the first half of 2016, the positive impact of the fair value measurement of the embedded option in the mandatory convertible bond converted into TIM shares at the end of 2016 – the profit for the first half of 2017 would have been over 100 million euros higher than the figure for the same period of 2016.
• Capital expenditures for the first half of 2017 totaled 2,056 million euros (1,983 million euros in the first half of 2016), and reflected the continued approach of selectively implementing capital expenditure by identifying projects with higher returns, targeted at innovation and transformation, while also boosting levels of UBB coverage and service quality.
• Adjusted net financial debt amounted to 25,104 million euros at June 30, 2017, down 15 million euros compared to December 31, 2016 (25,119 million euros). The positive performance of business operations ensured coverage of the requirements resulting from the payment of borrowing costs, and dividends totaling 218 million euros, in addition to the payment of 257 million euros made by the Brazil Business Unit to the consortium that is carrying out the clean-up of the 700 MHz spectrum, which the Business Unit purchased the user rights to in 2014.
Interim Management Report at June 30, 2017
Highlights – Half-Year 2017 6
Financial highlights
(millions of euros) 2nd Quarter 2nd Quarter 1st Half 1st Half % Change
2017 2016 2017 2016 Reported Organic
(a) (b) (a/b)
Revenues 4,953 4,656 9,772 9,096 7.4 3.2
EBITDA (1) 2,124 2,014 4,114 3,726 10.4 7.2
EBITDA Margin (1) 42.9% 43.3% 42.1% 41.0% 1.1 pp
Organic EBITDA Margin 42.9% 43.0% 42.1% 40.5% 1.6 pp
EBIT (1) 1,006 983 1,871 1,687 10.9 9.3
EBIT Margin (1) 20.3% 21.1% 19.1% 18.5% 0.6 pp
Organic EBIT Margin 20.3% 20.8% 19.1% 18.1% 1.0 pp
Profit (loss) from Discontinued operations/Non-current assets held for sale − − − 47
Profit (loss) for the period attributable to owners of the Parent 396 585 596 1,018 (41.5)
Capital expenditures (CAPEX) 1,225 1,039 2,056 1,983 3.7
6/30/2017 12/31/2016 Change Amount
Adjusted net financial debt (1) 25,104 25,119 (15)
(1) Details are provided under “Alternative Performance Measures”.

Intat
No
Thfinyetracocainipe
terim ManagemeJune 30, 2017
on-financial
he TIM Group hnancial informaar 2017, with
ansposes Direcompulsory by laarried out by titiatives carriedersonnel to ma
nt Report
highlights
has always caation concernin the entry intoctive 2014/95aw for some lathe TIM Groupd out in the fike the best po
red about socing sustainabilio force of Itali/EU, the disclorge companies
p in relation toirst half of 20ssible contribu
ial responsibilty issues. Starian Legislativeosure of non-fis and groups. Io sustainability
017. These areution to creatin
ity and for yearting from the Ae Decree 254
nancial and dinformation is py, and in part
e aimed at creng value.
Highlights –
ars has provideAnnual Financof December versity informaprovided belowticular on someating the cond
– Half-Year 2017
ed voluntary ncial Report for 30, 2016, whation will becow on the activit
me of the welfditions to ena
7
on-the
hich me ties are
able

Interim Management Report at June 30, 2017
Consolidated Operating Performance 8
CONSOLIDATED OPERATING PERFORMANCE
REVENUES
Revenues amounted to 9,772 million euros in the first half of 2017, up 7.4% from 9,096 million euros in the first half of 2016. The increase of 676 million euros was attributable, gross of intercompany eliminations, to the Domestic Business Unit (247 million euros) and the Brazil Business Unit (435 million euros). In terms of organic change, consolidated revenues rose by 3.2% (+299 million euros), and were calculated as follows:
(millions of euros) 1st Half 1st Half Change
2017 2016 amount %
REPORTED REVENUES 9,772 9,096 676 7.4
Foreign currency financial statements translation effect 377 (377)
Changes in the scope of consolidation − −
ORGANIC REVENUES 9,772 9,473 299 3.2
Exchange rate fluctuations(11) were essentially attributable to the Brazil Business Unit. There were no material changes in the scope of consolidation (2).
The breakdown of revenues by operating segment is the following:
(millions of euros) 1st Half 2017 1st Half 2016 Change
% of total % of total amount % % organic
Domestic 7,494 76.7 7,247 79.7 247 3.4 3.3
Core Domestic 6,965 71.3 6,736 74.1 229 3.4 3.4
International Wholesale 646 6.6 649 7.1 (3) (0.5) (1.2)
Brazil 2,293 23.5 1,858 20.4 435 23.4 2.9
Other Operations − − 9 0.1 (9)
Adjustments and eliminations (15) (0.2) (18) (0.2) 3
Consolidated Total 9,772 100.0 9,096 100.0 676 7.4 3.2
EBITDA
EBITDA totaled 4,114 million euros (3,726 million euros in the first half of 2016), increasing by 388 million euros (+10.4%) compared to the first half of 2016; the EBITDA margin was 42.1% (41.0% in the first half of 2016; +1.1 percentage points).
Organic EBITDA was up 275 million euros (+7.2%) compared to the first half of 2016; the organic EBITDA margin was up 1.6 percentage points, from 40.5% in the first half of 2016 to 42.1% in the first half of 2017.
(1) The average exchange rates used for the translation into euro (expressed in terms of units of local currency per 1 euro) were 1.08279 for the US dollar in the first half of
2017 and 1.11572 in the first half of 2016. For the Brazilian real, the average exchange rates used were 3.44195 in the first half of 2017 and 4.13001 in the first half of 2016. The effect of the change in exchange rates is calculated by applying the foreign currency translation rates used for the current period to the period under comparison.
(2) The change in the scope of consolidation has been calculated by excluding the contribution of the companies that have exited from the comparison figure and adding in the estimated contribution of any companies entering the scope of consolidation.

Interim Management Report at June 30, 2017
Consolidated Operating Performance 9
The TIM Group recorded non-recurring operating expenses totaling 95 million euros for the first half of 2017 (93 million euros in the first half of 2016, at constant exchange rates). These expenses are connected to events and transactions that by their nature do not occur continuously in the normal course of operations, and have been shown because their amount is significant. They essentially consist of expenses from corporate restructuring and reorganization processes, disputes and business transactions. Without these expenses the organic change in EBITDA would have been +7.0%, with an EBITDA margin of 43.1%, up 1.6 percentage points on the first half of 2016. For further details, see the Note "Significant non-recurring events and transactions" in the Half-year Condensed Consolidated Financial Statements at June 30, 2017 of the TIM Group. The positive performance of EBITDA shows that the benefits resulting from the cost recovery plan measures, started in the second quarter of 2016 by the Domestic Business Unit and in the third quarter of 2016 in Brazil, are generating structural improvements. Organic EBITDA is calculated as follows: (millions of euros) 1st Half 1st Half Change
2017 2016 amount %
REPORTED EBITDA 4,114 3,726 388 10.4
Foreign currency financial statements translation effect 113 (113)
Changes in the scope of consolidation − −
ORGANIC EBITDA 4,114 3,839 275 7.2
of which non-recurring income/(expenses) (95) (91) (4)
foreign currency non-recurring income/(expenses) translation effect (2) 2
ORGANIC EBITDA excluding non-recurring component 4,209 3,932 277 7.0
Exchange rate fluctuations substantially related to the Brazil Business Unit.
Details of EBITDA and EBITDA Margins by operating segment are as follows:
(millions of euros) 1st Half 2017 1st Half 2016 Change
% of total % of total amount % % organic
Domestic 3,361 81.7 3,184 85.5 177 5.6 5.5
EBITDA Margin 44.8 43.9 0.9 pp 0.9 pp
Brazil 762 18.5 556 14.9 206 37.1 14.3
EBITDA Margin 33.2 29.9 3.3 pp 3.3 pp
Other Operations (9) (0.2) (11) (0.3) 2
Adjustments and eliminations − − (3) (0.1) 3
Consolidated Total 4,114 100.0 3,726 100.0 388 10.4 7.2
EBITDA Margin 42.1 41.0 1.1 pp 1.6 pp
EBITDA was particularly impacted by the change in the line items analyzed below:
• Acquisition of goods and services (4,136 million euros; 3,783 million euros in the first half of 2016):
(millions of euros) 1st Half 1st Half Change
2017 2016
Acquisition of goods 910 752 158
Revenues due to other TLC operators and interconnection costs 991 978 13
Commercial and advertising costs 700 586 114
Power, maintenance and outsourced services 617 591 26
Rent and leases 380 339 41
Other service expenses 538 537 1
Total acquisition of goods and services 4,136 3,783 353
EBITDA Margin 42.3 41.6 0.7 pp

Interim Management Report at June 30, 2017
Consolidated Operating Performance 10
The overall increase in Acquisition of goods and services included an exchange rate effect of 196 million euros relating to the Brazil Business Unit, without which this item would have shown an increase of 157 million euros.
• Employee benefits expenses (1,530 million euros; 1,551 million euros in the first half of 2016):
(millions of euros) 1st Half 1st Half Change
2017 2016 Employee benefits expenses - Italy 1,339 1,377 (38)
Ordinary employee expenses and costs 1,329 1,310 19
Restructuring and other expenses 10 67 (57)
Employee benefits expenses – Outside Italy 191 174 17
Ordinary employee expenses and costs 191 166 25
Restructuring and other expenses - 8 (8)
Total employee benefits expenses 1,530 1,551 (21)
% of Revenues 15.7 17.1 (1.4)pp
The main factors that drove this change were: – an increase of 19 million euros in the Italian component of ordinary employee expenses; you are
reminded that in the first half of 2016, following the failure to achieve the conditions for the payment of the Results Bonus to employees, a reversal of 66 million euros was made on the accrual in the 2015 financial statements. Excluding that effect, there would have been a reduction in the cost, mainly resulting from the decrease in the average salaried workforce (-1,541 employees);
– the recognition of non-recurring expenses (provisions to Employee benefits and sundry expenses) totaling 10 million euros. 7 million euros mainly related to the aggregation of INPS positions, following the requests made by employees of the Parent and Telecom Italia Sparkle for the application of Article 4 of the “Fornero Law”; 3 million euros related to provisions of the companies Telecontact and INWIT, following the signing in May and June 2017 of agreements for the early departure of employees, again in application of Article 4 of the “Fornero Law”.
In the first half of 2016 provisions were made for non-recurring expenses for the application of Article 4 of the "Fornero Law" to executive and non-executive personnel, for a total of 67 million euros, (of which 40 million euros for the Parent and 27 million euros for TI Information Technology − later merged into TIM S.p.A. − and Olivetti);
– the increase in the component outside Italy of employee benefits expenses. This performance was particularly influenced by the exchange rate effect attributable to the Brazil Business Unit, which resulted in higher costs of around 32 million euros; net of this effect, the reduction in costs was essentially related to the decrease in the average workforce by 2,296 average employees.
• Other operating income (217 million euros; 107 million euros in the first half of 2016): (millions of euros) 1st Half 1st Half Change
2017 2016
Late payment fees charged for telephone services 31 27 4
Recovery of employee benefit expenses, purchases and services rendered 50 18 32
Capital and operating grants 23 8 15
Damage compensation, penalties and sundry recoveries 22 10 12
Partnership agreements 59 − 59
Other income 32 44 (12)
Total 217 107 110
Other income consisted of the impacts of contribution fees resulting from partnership agreements signed with leading technology suppliers. These agreements are aimed at developing the collaboration between the parties, in order to strengthen and stabilize the business and industrial relationship over time, to actively contribute to TIM's marketing plan for the development and use of several strategic services in Italy and in Brazil.

Interim Management Report at June 30, 2017
Consolidated Operating Performance 11
• Other operating expenses (576 million euros; 501 million euros in the first half of 2016):
(millions of euros) 1st Half 1st Half Change
2017 2016
Write-downs and expenses in connection with credit management 177 161 16
Provision charges 109 70 39
TLC operating fees and charges 182 168 14
Indirect duties and taxes 58 50 8
Penalties, settlement compensation and administrative fines 15 22 (7)
Association dues and fees, donations, scholarships and traineeships 8 8 −
Sundry expenses 27 22 5
Total 576 501 75
The overall increase in Other operating expenses included an exchange rate effect of 45 million euros relating to the Brazil Business Unit, without which this item would have shown an increase of 30 million euros.
Depreciation and amortization
Details are as follows: (millions of euros) 1st Half 1st Half Change
2017 2016
Amortization of intangible assets with a finite useful life 907 843 64
Depreciation of property, plant and equipment – owned and leased 1,342 1,204 138
Total 2,249 2,047 202
Impairment reversals (losses) on non-current assets
In the first half of 2017, this item amounted to nil (5 million euros in the first half of 2016). In accordance with IAS 36, goodwill is not subject to amortization, but is tested for impairment annually or more frequently, whenever specific events or circumstances occur that may indicate an impairment. At June 30, 2017, TIM’s market capitalization was less than the value of its equity; however, in view of the positive performance of the first six months of the year, in line with the plan forecasts, the absence of new and additional external indicators and the results in terms of recoverable amount of the impairment testing conducted for the 2016 Financial Statements, it was not considered necessary to redetermine the recoverable amount and consequently the goodwill allocated to the individual cash generating units in the Consolidated Financial Statements 2016 was confirmed.

Interim Management Report at June 30, 2017
Consolidated Operating Performance 12
EBIT
EBIT totaled 1,871 million euros (1,687 million euros in the first half of 2016), increasing by 184 million euros (+10.9%) compared to the first half of 2016; the EBIT margin was 19.1% (18.5% in the first half of 2016, +0.6 percentage points).
Organic EBIT was up 159 million euros (+9.3%), with an organic EBIT margin of 19.1% (18.1% in the first half of 2016).
EBIT in the first half of 2017 reflected the negative impact of non-recurring net expenses totaling 96 million euros (82 million euros in the first half of 2016). Without these expenses, the organic change in EBIT would have been a positive 173 million euros (+9.6%), with an EBIT margin of 20.1% (up 1.2 percentage points compared to the first half of 2016.
Organic EBIT is calculated as follows: (millions of euros) 1st Half 1st Half Change
2017 2016 amount %
REPORTED EBIT 1,871 1,687 184 10.9
Foreign currency financial statements translation effect 25 (25)
Changes in the scope of consolidation − −
ORGANIC EBIT 1,871 1,712 159 9.3
of which non-recurring income/(expenses) (96) (82) (14)
foreign currency non-recurring income/(expenses) translation effect − −
ORGANIC EBIT excluding non-recurring component 1,967 1,794 173 9.6
Exchange rate fluctuations were essentially attributable to the Brazil Business Unit.
Income/(expenses) from investments
In the first half of 2017, this item amounted to an expense of 19 million euros and essentially included the allocation to the income statement of the Reserve for exchange differences on translating foreign operations for the investee company Tierra Argentea S.A., whose liquidation has now been completed. In the first half of 2016, this item amounted to an income of 7 million euros and related to dividends.
Finance income (expenses), net
Finance income (expenses) showed an increase in net expenses of 595 million euros, moving from 145 million euros for the first half of 2016 to 740 million euros for the first half of 2017. The figure for the first half of 2017 reflected:
• the absence of the positive impact, for 620 million euros, relating to the fair value measurement through profit and loss – performed separately to its liability component – of the embedded option included in the mandatory convertible bond issued by Telecom Italia Finance S.A. at the end of 2013, for 1.3 billion euros (“Guaranteed Subordinated Mandatory Convertible Bonds due 2016 convertible into ordinary shares of TIM S.p.A.”);
• lower finance expenses due to the reduction in the Group's debt exposure and in interest rates.
Income tax expense
This item amounted to 457 million euros, up 32 million euros on the first half of 2016 (489 million euros). The tax expense for the first half of 2017 mainly included a provision of 93 million euros for the Telecom Italia Sparkle dispute; this additional expense was offset by the reduction primarily linked to the lower tax base of the Parent TIM S.p.A..

Interim Management Report at June 30, 2017
Consolidated Operating Performance 13
PROFIT (LOSS) FOR THE PERIOD
This item was broken down as follows: (millions of euros) 1st Half 1st Half
2017 2016
Profit (loss) for the period 654 1,105
Attributable to:
Owners of the Parent:
Profit (loss) from continuing operations 596 1,021
Profit (loss) from Discontinued operations/Non-current assets held for sale − (3)
Profit (loss) for the period attributable to owners of the Parent 596 1,018
Non-controlling interests:
Profit (loss) from continuing operations 58 37
Profit (loss) from Discontinued operations/Non-current assets held for sale − 50
Profit (loss) for the period attributable to non-controlling interests 58 87
Profit for the first half of 2017 attributable to the Owners of the Parent amounted to 596 million euros (1,018 million euros in the first half of 2016) and was impacted by non-recurring net expenses of 173 million euros. On a like-for-like basis – i.e. without including the non-recurring items and, in the first half of 2016, the positive impact of the fair value measurement of the embedded option in the mandatory convertible bond – the Profit attributable to the Owners of the Parent for the first half of 2017 would have been over 100 million euros higher than the figure for the same period of the previous year.

Interim Management Report at June 30, 2017
Financial and Operating Highlights of the Business Units of the TIM Group Domestic Business Unit
14
FINANCIAL AND OPERATING HIGHLIGHTS OF THE BUSINESS UNITS OF THE TIM GROUP
DOMESTIC
(millions of euros) 1st Half 2017
1st Half 2016
Change
amount % % organic
Revenues 7,494 7,247 247 3.4 3.3
EBITDA 3,361 3,184 177 5.6 5.5
EBITDA Margin 44.8 43.9 0.9 pp 0.9 pp
EBIT 1,685 1,581 104 6.6 6.5
EBIT Margin 22.5 21.8 0.7 pp 0.7 pp
Headcount at period end (number) 51,095 (1) 51,280 (185) (0.4)
(1) Headcount at December 31, 2016
Fixed
6/30/2017 12/31/2016 6/30/2016
Physical accesses at period end (thousands) (1) 19,066 18,963 19,074
of which Retail physical accesses at period end (thousands) 11,185 11,285 11,468
Broadband accesses at period end (thousands) (2) 9,687 9,206 8,992
of which Retail broadband accesses at period end (thousands) 7,419 7,191 7,088
Network infrastructure in Italy:
copper access network (millions of km – pair, distribution and connection) 114.4 114.4 115.6
access and carrier network in optical fiber (millions of km - fiber)
13.4 12.6 11.7
Total traffic:
Minutes of traffic on fixed-line network (billions): 32.6 69.1 35.9
Domestic traffic 26.3 55.6 29.0
International traffic 6.3 13.5 6.9
Broadband volumes (PBytes) (3) 3,642 5,774 2,690
(1) Does not include full-infrastructured OLOs and Fixed Wireless Access (FWA). (2) Does not include LLU and NAKED, satellite and full-infrastructured OLOs and FWA. (3) DownStream and UpStream traffic volumes.

Interim Management Report at June 30, 2017
Financial and Operating Highlights of the Business Units of the TIM Group Domestic Business Unit
15
Mobile
6/30/2017 12/31/2016 6/30/2016
Lines at period end (thousands) (1) 29,952 29,617 29,742
Change in lines (%) 1.1 (1.3) (0.9)
Churn rate (%) (2) 12.8 22.8 10.9
Total traffic:
Outgoing retail traffic (billions of minutes) 24.4 44.9 22.2
Incoming and outgoing retail traffic (billions of minutes) 37.5 69.6 34.3
Browsing Traffic (PBytes) (3) 175.3 258.5 119.2
Average monthly revenues per line (in euros) (4) 12.2 12.4 11.8
(1) the figure includes the SIM cards used on platforms for delivering Machine-to-Machine services. (2) The data refer to total lines. The churn rate represents the number of mobile customers who discontinued service during the period expressed as a percentage of the
average number of customers. (3) National traffic excluding roaming. (4) The values are calculated on the basis of revenues from services (including revenues from prepaid cards) as a percentage of the average number of lines.
Revenues
Revenues for the first half of 2017 came to 7,494 million euros and were up by 247 million euros (+3.4%) compared to the first half of 2016, continuing the improvement seen in the previous year. Indeed, the second quarter saw growth of +4.0% on the same period of 2016, representing a rise on the previous quarters (first quarter 2017 +2.8%, fourth quarter 2016 +2.5%, third quarter +1.0%, second quarter -1.2%, and first quarter -2.3%). Revenues from services also showed a similar trend, at 6,842 million euros (+21 million euros on the first half of 2016), with a turnaround into positive territory, at +0.3% in the half year (+0.9% in the second quarter 2017, -0.3% in the first quarter 2017 and -1.3% in the fourth quarter 2016). This improvement was driven by the growth in both the Mobile and Fixed Broadband customer base, the increase in ARPU levels (thanks to the higher adoption of Fiber and LTE ultrabroadband connectivity services, and digital and ICT services), also accompanied by higher sales volumes for connected devices (Smartphones, SmartTVs, SmartHomes, Modems, etc.). In detail:
• Fixed market service revenues totaled 4,932 million euros, down slightly on the first half of 2016 (-39 million euros, -0.8%), but continuing the steady recovery already seen in the three previous quarters (second quarter 2017, +0.8%, compared to -2.4% in the first quarter 2017, -3.0% in the fourth quarter 2016, -3.6% in the third quarter and -4.8% in the second quarter 2016). The decline was entirely related to the reduction in revenues from traditional voice services (-162 million euros due to the fall in traditional accesses), as well as the reduction in the regulated prices for some wholesale services (-44 million euros). These impacts were offset, in particular, by continued growth in revenues from innovative services for data connectivity (+128 million euros, +14.2%), driven primarily by the growth in ultrabroadband customers, which increased by 723 thousand in the period, bringing the number of retail accesses to over 1.5 million and the total number of accesses to over 2 million. Revenues from ICT services also increased (+28 million euros, +9.8%).
• Mobile market service revenues totaled 2,228 million euros, up 51 million euros on the same period of the previous year (+2.3%). This result was driven by the strong competitive performance, which generated growth in the customer base, in addition to the increase in LTE customers (72% of the total number of Mobile Internet customers versus 62% at the end of 2016) and ARPU levels. It also continues the historical series of stable positive performance (+2.5% in the second quarter 2017, +2.2% in the first quarter 2017, +3.0% in the fourth quarter 2016, +1.1% in the third quarter, and +0.7% in the second quarter).
Revenues from product sales, including the change in work in progress, amounted to 652 million euros in the first half of 2017 (+226 million euros compared to the first half of 2016) and reflected the steady increase in sales of smartphones and connected devices (smart TVs, Smart Home products, modems, set-top boxes, etc.).

Interim Management Report at June 30, 2017
Financial and Operating Highlights of the Business Units of the TIM Group Domestic Business Unit
16
EBITDA
EBITDA for the Domestic Business Unit totaled 3,361 million euros for the first half of 2017, up by 177 million euros compared to the first half of 2016 (+5.6%), with an EBITDA margin of 44.8% (+0.9 percentage points compared to the same period of the previous year). In organic terms, the increase was +5.5%. The first half of 2017 reflected the negative impact of non-recurring expenses totaling 95 million euros (83 million euros for the same period of the previous year) for settlements, disputes and redundancy costs. Without these expenses the organic change in EBITDA would have been +5.7%, with an EBITDA margin of 46.1%, up 1 percentage point on the first half of 2016. The EBITDA performance, in addition to the improvement in sales earnings and the revenue performance, also reflected the positive impacts achieved by the program of cost transformation and simplification of business processes, which started to have an effect from the second quarter of 2016. As already reported in the first quarter of 2017, resources continued to be focused on marketing, to support sales initiatives and customer management, while reducing industrial and general operating costs.
Organic EBITDA is calculated as follows: (millions of euros) 1st Half
20171st Half
2016Change
amount %
REPORTED EBITDA 3,361 3,184 177 5.6
Foreign currency financial statements translation effect 2 (2)
Changes in the scope of consolidation − −
ORGANIC EBITDA 3,361 3,186 175 5.5
of which non-recurring income/(expenses) (95) (83) (12)
ORGANIC EBITDA excluding non-recurring component 3,456 3,269 187 5.7
Other income amounted to 199 million euros, up 101 million euros on the first half of 2016. This item includes contribution fees resulting from partnership agreements already discussed in relation to the consolidated operating performance.
The changes in the main cost items are shown below: (millions of euros) 1st Half
20171st Half
2016 Change
Acquisition of goods and services 2,976 2,812 164
Employee benefits expenses 1,348 1,384 (36)
Other operating expenses 311 276 35
• Acquisition of goods and services rose by 164 million euros compared to the first half of 2016 and was broken down as follows:
(millions of euros) 1st Half 1st Half Change
2017 2016
Acquisition of goods 775 615 160
Revenues due to other TLC operators and interconnection costs 743 742 1
Commercial and advertising costs 360 315 45
Power, maintenance and outsourced services 472 485 (13)
Rent and leases 211 224 (13)
Other service expenses 415 431 (16)
Total acquisition of goods and services 2,976 2,812 164
% of Revenues 39.7 38.8 0.9 pp

Interim Management Report at June 30, 2017
Financial and Operating Highlights of the Business Units of the TIM Group Domestic Business Unit
17
• Employee benefits expenses amounted to 1,348 million euros, down 36 million euros, substantially due to the same factors that affected the Employee benefits expenses at Group level, details of which can be found in the relevant section;
• Other operating expenses, amounting to 311 million euros, were up 35 million euros. The breakdown of the item is reported in the table below:
(millions of euros) 1st Half 2017
1st Half 2016
Change
Write-downs and expenses in connection with credit management 134 127 7
Provision charges 66 35 31
TLC operating fees and charges 26 24 2
Indirect duties and taxes 47 48 (1)
Penalties, settlement compensation and administrative fines 15 22 (7)
Association dues and fees, donations, scholarships and traineeships 7 7 −
Sundry expenses 16 13 3
Total 311 276 35
EBIT
EBIT of the Domestic Business Unit for the first half of 2017 came to 1,685 million euros (1,581 million euros in the same period of 2016), up 104 million euros (+6.6%), with an EBIT margin of 22.5% (21.8% in the first half of 2016). The EBIT performance mainly reflected the improvement in EBITDA reported above, partially offset by the increase in depreciation and amortization, of +78 million euros. In organic terms the increase was 6.5%. EBIT for the first half of 2017 was pulled down by a total of 95 million euros in non-recurring expenses (83 million euros for the same period of the previous year), without which the organic change in EBIT would have been 6.9%, with an EBIT margin of 23.8%. Organic EBIT is calculated as follows: (millions of euros) 1st Half
20171st Half
2016Change
amount %
REPORTED EBIT 1,685 1,581 104 6.6
Foreign currency financial statements translation effect 1 (1)
Changes in the scope of consolidation − −
ORGANIC EBIT 1,685 1,582 103 6.5
of which non-recurring income/(expenses) (95) (83) (12)
ORGANIC EBIT excluding non-recurring component 1,780 1,665 115 6.9
Interim Management Report at June 30, 2017
Financial and Operating Highlights of the Business Units of the TIM Group Domestic Business Unit
18
Financial highlights of the Domestic Cash Generating Units
The main financial and operating highlights of the Domestic Business Unit are reported according to two Cash Generating units (CGU):
• Core Domestic: includes all telecommunications activities pertaining to the Italian market. Revenues are broken down in the following tables according to the net contribution of each market segment to the CGU’s results, excluding intrasegment transactions. The sales market segments established on the basis of the “customer centric” organizational model are as follows: – Consumer: the segment consists of all Fixed and Mobile voice and Internet services and
products managed and developed for individuals and families and of public telephony; customer care, operating credit support, loyalty and retention activities, sales within its remit, and administrative management of customers; the segment includes the companies 4G, Persidera and Noverca.
– Business: the segment consists of voice, data, and Internet services and products, and ICT solutions managed and developed for small and medium-size enterprises (SMEs), Small Offices/Home Offices (SOHOs), Top customers, the Public Sector, Large Accounts, and Enterprises in the Fixed and Mobile telecommunications markets; it also includes the company Olivetti.
– Wholesale: the segment consists of the management and development of the portfolio of regulated and unregulated wholesale services for Fixed and Mobile telecommunications operators in the domestic market and Open Access operations connected with delivery and assurance processes for customer services.
– Other (INWIT S.p.A. and support structures): includes: – INWIT S.p.A.: from April 2015, the company has been operating within the Operations area
in the electronic communications infrastructure sector, specifically relating to infrastructure for housing radio transmission equipment for mobile telephone networks, both for TIM and other operators;
– Other Operations units: covering technological innovation and the processes of development, engineering, building and operating network infrastructures, IT, real estate properties and plant engineering;
– Staff & Other: services carried out by Staff functions and other support activities performed by minor companies of the Group, also offered to the market and other Business Units.
• International Wholesale – Telecom Italia Sparkle group: includes the activities of the Telecom Italia Sparkle group, which operates in the market for international voice, data and Internet services for fixed and mobile telecommunications operators, ISPs/ASPs (Wholesale market) and multinational companies through its own networks in the European, Mediterranean and South American markets.

Interim Management Report at June 30, 2017
Financial and Operating Highlights of the Business Units of the TIM Group Domestic Business Unit
19
Key results for the first half of 2017 for the Domestic Business Unit are presented in the following tables, broken down by market/business segment and compared to the first half of 2016.
Core Domestic
(millions of euros) 1st Half 2017
1st Half 2016
Change
amount %
Revenues 6,965 6,736 229 3.4
Consumer 3,767 3,572 195 5.5
Business 2,280 2,200 80 3.6
Wholesale 834 863 (29) (3.4)
Other 84 101 (17) (16.8)
EBITDA 3,278 3,093 185 6.0
EBITDA Margin 47.1 45.9 1.2 pp
EBIT 1,657 1,540 117 7.6
EBIT Margin 23.8 22.9 0.9 pp
Headcount at period end (number)(*) 50,307 (1) 50,527 (220) (0.4)
(1) Headcount at December 31, 2016 (*) Includes employees with temp work contracts: 0 employees at 6/30/2017 (1 employee at 12/31/2016).
In detail:
• Consumer: revenues for the Consumer segment for the first half of 2017 amounted to a total of 3,767 million euros, an increase of 195 million euros compared to the same period of 2016 (+5.5%). This performance continued the trend of recovery already underway in the previous year. In particular: – revenues from the Mobile business amounted to 1,847 million euros and showed growth
compared to the first half of 2016 (+70 million euros, +4,0%), with revenues from services in particular up 51 million euros (+3.3% on the first half of 2016). This continued the trend of improvement already seen in the previous quarters (+4.1% in the second quarter 2017; +3.9% in the first quarter 2017; +4.8% in the fourth quarter 2016) due to the progressive stabilization and improvement of market share and the steady growth in Internet mobile and digital services, which sustained the ARPU levels;
– revenues for the Fixed-line segment amounted to 1,903 million euros, up 130 million euros compared to the first half of 2016 (+7.3%), representing a continued improvement on the previous quarters (+11.2% in the second quarter 2017; +3.5% in the first quarter 2017; +2.0% in the fourth quarter 2016), thanks to the reduction in line losses, the growth in the Broadband and Ultra broadband customer base (which offset the loss of voice only accesses), the increase in ARPU levels and the strong performance of sales of connected devices.
• Business: revenues for the Business segment amounted to 2,280 million euros, up 80 million euros on the first half of 2016 (+3.6%). In detail: – revenues from the Mobile business posted performance in line with the first half of 2016
(+0.1%); specifically, the continuing decline in traditional mobile services (-9.0% in the voice and messaging component compared to the first half of 2016), driven by the shift of customers (both private individuals and government agencies) towards formulas with lower ARPU, was fully offset by the positive performance of new digital services (+9.6% on the first half of 2016);
– revenues for the Fixed-line segment increased by 77 million euros (+4.6% on the first half of 2016) thanks to the steady increase in revenues from ICT services (+9.8%), which more than offset the reduction in prices and revenues from traditional services and the effects of the technological shift towards VoIP systems.
• Wholesale: revenues for the Wholesale segment in the first half of 2017 came to 834 million euros, down on the same period of 2016 (-29 million euros, -3.4%). The impact on revenues was entirely

Interim Management Report at June 30, 2017
Financial and Operating Highlights of the Business Units of the TIM Group Domestic Business Unit
20
due to the reduction in regulated prices, which produced a shortfall of -44 million euros, partially offset by the growth in numbers in the NGN, SULL and Co-location segments.
International Wholesale – Telecom Italia Sparkle group
(millions of euros) 1st Half 1st Half Change 2017 2016 amount % % organic
Revenues 646 649 (3) (0.5) (1.2)
of which third party 549 539 10 1.9 0.9
EBITDA 89 97 (8) (8.2) (10.1)
EBITDA Margin 13.8 14.9 (1.1)pp (1.3)pp
EBIT 29 41 (12) (29.3) (31.0)
EBIT Margin 4.5 6.3 (1.8)pp (1.9)pp
Headcount at period end (number)(*) 788 (1) 753 35 4.6
(1) Headcount at December 31, 2016 (*) Includes employees with temp work contracts: 1 employee at 6/30/2017 (3 employees at 12/31/2016).
Revenues for the Telecom Italia Sparkle group – International Wholesale in the first half of 2017 totaled 646 million euros, substantially in line with the figure for the first half of 2016 (-3 million euros, -0.5%). This result was due to the decline in revenues from IP/Data services (-11 million euros, -7.5%), mainly attributable to the fall in revenues from the Mediterranean area as a result of the expiry of old long-term contracts, partially offset by the growth in revenues from Voice services (+8 million euros, +1.8%).

Interim Management Report at June 30, 2017
Financial and Operating Highlights of the Business Units of the TIM Group Brazil Business Unit
21
BRAZIL
(millions of euros) (millions of reais)
1st Half2017
1st Half2016
1st Half2017
1st Half 2016
Change
amount %
(a) (b) (c) (d) (c-d) (c-d)/d
Revenues 2,293 1,858 7,894 7,674 220 2.9
EBITDA 762 556 2,624 2,296 328 14.3
EBITDA Margin 33.2 29.9 33.2 29.9 3.3 pp
EBIT 194 121 669 498 171 34.3
EBIT Margin 8.5 6.5 8.5 6.5 2.0 pp
Headcount at period end (number) 9,471 (1) 9,849 (378) (3.8)
(1) Headcount at December 31, 2016
1st Half2017
1st Half2016
Lines at period end (thousands) 60,831 (1) 63,418
MOU (minutes/month) (*) 106.7 118.4
ARPU (reais) 19.2 17.2
(1) Number at December 31, 2016, including corporate lines (*) Net of visitors
Revenues
Revenues for the first half of 2017 amounted to 7,894 million reais and were up 220 million reais (+2.9%) year-on-year. Service revenues totaled 7,494 million reais, an increase of 305 million reais compared to 7,189 million reais for the first half of 2016 (+4.2%). These results confirm the continued improvement in the trend, with positive growth in the second quarter of 2017 both in total revenues (+3.2% compared to +2.5% for the first quarter of 2017 and -1.7% for the fourth quarter of 2016) and in revenues from services (+5.0% compared to +3.5% for the first quarter 2017 and -0.7% for the fourth quarter of 2016). Mobile Average Revenue Per User (ARPU) for the first half of 2017 was 19.2 reais, up on the figure of 17.2 reais for the first half of 2016 (+11.6%), due to the general repositioning towards the postpaid segment and new commercial initiatives aimed at increasing data usage and the average spend per customer. The total number of lines at June 30, 2017 was 60,831 thousand, representing a decrease of 2,587 thousand on December 31, 2016 (63,418 thousand), with a market share of 25.1% in June 2017 (26.0% at December 31, 2016). This reduction was entirely attributable to the prepaid segment (-3,540 thousand) and was only partially offset by the growth in the postpaid segment (+953 thousand), also as a result of the consolidation underway in the market for second SIM cards. Postpaid customers represented 26.0% of the customer base at June 30, 2017, up 2.5 percentage points on December 2016 (23.5%).

Interim Management Report at June 30, 2017
Financial and Operating Highlights of the Business Units of the TIM Group Brazil Business Unit
22
Revenues from product sales came to 400 million reais (485 million reais in the first half of 2016 (-17.5%). The reduction reflects the change in the commercial policy, which is now more focused on value rather than sales volume growth. The main goals of this strategy are to increase the purchasing of new handsets giving TIM customers access to broadband services on 3G/4G networks and to support the new loyalty offerings for higher-value postpaid customers. This new strategy is reflected in an increase in the average handset price of +7.7% compared with the first half of 2016 and an increase in smartphone penetration within the Company's total customer base, which reached 77% in May 2017 (70% in June 2016).
EBITDA
EBITDA amounted to 2,624 million reais, up 328 million reais on the first half of 2016 (+14.3%). The growth in EBITDA was attributable to both the positive performance of revenues and the benefits from the projects to enhance the efficiency of the operating expenses structure, launched in the second half of 2016, with an improvement in the second quarter (+15.8% compared to +12.6% in the first quarter of 2017 and +5.8% in the fourth quarter of 2016). The EBITDA margin stood at 33.2%, 3.3 percentage points higher than in the first half of 2016. You are also reminded that the employee benefits expenses for the first half of 2016 included non-recurring expenses for termination benefits of 34 million reais. Even without the impact of these non-recurring expenses, EBITDA for the first half of 2017 showed an increase (+12.6%) compared to the first half of 2016, continuing the trend of steady improvement in the second quarter (+15.7% compared to +9.4% for the first quarter of 2017 and +2.1% for the fourth quarter of 2016).
The changes in the main cost items are shown below:
(millions of euros) (millions of reais)
1st Half
20171st Half
20161st Half
20171st Half
2016 Change
(a) (b) (c) (d) (c-d) Acquisition of goods and services 1,169 978 4,025 4,041 (16)
Employee benefits expenses 178 161 613 663 (50)
Other operating expenses 262 224 901 925 (24)
Change in inventories (5) (8) (18) (31) 13
EBIT
EBIT amounted to 669 million reais, up 171 million reais (+34.3%) on the first half of 2016 (498 million reais). This result benefited from the greater contribution from the EBITDA (+328 million reais), which was offset by higher depreciation (+119 million reais) related to the development of industrial infrastructure, and a lower impact of net gains on disposals of assets (-38 million reais), mainly attributable to the telecommunication towers. In this regard, we note that the last partial sale of telecommunication towers to American Tower do Brasil took place in the second quarter of 2017. This transaction resulted in proceeds and an income effect of an immaterial amount.

Interim Management Report at June 30, 2017
Consolidated Financial Position and Cash Flows Performance 23
CONSOLIDATED FINANCIAL POSITION AND CASH FLOWS PERFORMANCE
NON-CURRENT ASSETS
• Goodwill: this decreased by 101 million euros, from 29,612 million euros at the end of 2016 to 29,511 million euros at June 30, 2017 due to the negative variation in exchange rates for the Brazilian companies (1). Further details are provided in the Note "Goodwill" in the Half-year Condensed Consolidated Financial Statements at June 30, 2017 of the TIM Group.
• Other intangible assets: were down 357 million euros, from 6,951 million euros at the end of 2016 to 6,594 million euros at June 30, 2017, representing the balance of the following items: – capex (+673 million euros); – amortization charge for the period (-907 million euros); – disposals, exchange differences, reclassifications and other changes (for a net negative balance
of 123 million euros).
• Tangible assets: were down 318 million euros, from 16,360 million euros at the end of 2016 to 16,042 million euros at June 30, 2017, representing the balance of the following items: – capex (+1,383 million euros); – changes in financial leasing contracts (+30 million euros); – depreciation charge for the period (-1,342 million euros); – disposals, exchange differences, reclassifications and other changes (for a net negative balance
of 389 million euros).
CONSOLIDATED EQUITY
Consolidated equity amounted to 23,619 million euros (23,553 million euros at December 31, 2016), of which 21,404 million euros attributable to Owners of the Parent (21,207 million euros at December 31, 2016) and 2,215 million euros attributable to non-controlling interests (2,346 million euros at December 31, 2016). In greater detail, the changes in equity were the following: (millions of euros) 6/30/2017 12/31/2016
At the beginning of the period 23,553 21,333
Correction due to errors − (84)
At the beginning of the period revised 23,553 21,249
Total comprehensive income (loss) for the period 269 2,801
Dividends approved by: (205) (204)
TIM S.p.A. (166) (166)
Other Group companies (39) (38)
Issue of equity instruments 4 1
Conversion of the Guaranteed Subordinated Mandatory Convertible Bonds due 2016 − 1,300
Disposal of the Sofora – Telecom Argentina group − (1,582)
Other changes (2) (12)
At the end of the period 23,619 23,553
(1) The spot exchange rate used for the translation into euro of the Brazilian real (expressed in terms of units of local currency per 1 euro) was 3.77532 at June 30, 2017 and
3.43542 at December 31, 2016.

Interim Management Report at June 30, 2017
Consolidated Financial Position and Cash Flows Performance 24
CASH FLOWS
Adjusted net financial debt stood at 25,104 million euros, down 15 million euros compared to December 31, 2016 (25,119 million euros). The table below summarizes the main transactions that had an impact on the change in adjusted net financial debt during the first half of 2017:
Change in adjusted net financial debt
(millions of euros) 1st Half 1st Half Change
2017 2016
EBITDA 4,114 3,726 388
Capital expenditures on an accrual basis (2,056) (1,983) (73)
Change in net operating working capital: (1,130) (1,078) (52)
Change in inventories (44) (40) (4)
Change in trade receivables and net amounts due from customers on construction contracts (52) (130) 78
Change in trade payables (*) (692) (635) (57)
Other changes in operating receivables/payables (342) (273) (69)
Change in employee benefits (7) 40 (47)
Change in operating provisions and Other changes 37 (34) 71
Net operating free cash flow 958 671 287
% of Revenues 9.8 7.4 2.4 pp
Sale of investments and other disposals flow 9 732 (723)
Share capital increases/reimbursements, including incidental costs 6 − 6
Financial investments flow (1) (9) 8
Dividends payment (218) (227) 9
Change in financial leasing contracts (30) (123) 93
Finance expenses, income taxes and other net non-operating requirements flow (709) (1,242) 533
Reduction/(Increase) in adjusted net financial debt from continuing operations 15 (198) 213
Reduction/(Increase) in net financial debt from Discontinued operations/Non-current assets held for sale − (38) 38
Reduction/(Increase) in adjusted net financial debt 15 (236) 251
(*) Includes the change in trade payables for amounts due to fixed asset suppliers.
In addition to what has already been described with reference to EBITDA, net financial debt during the first half of 2017 has been particularly impacted by the following items:
Interim Management Report at June 30, 2017
Consolidated Financial Position and Cash Flows Performance 25
Capital expenditures on an accrual basis
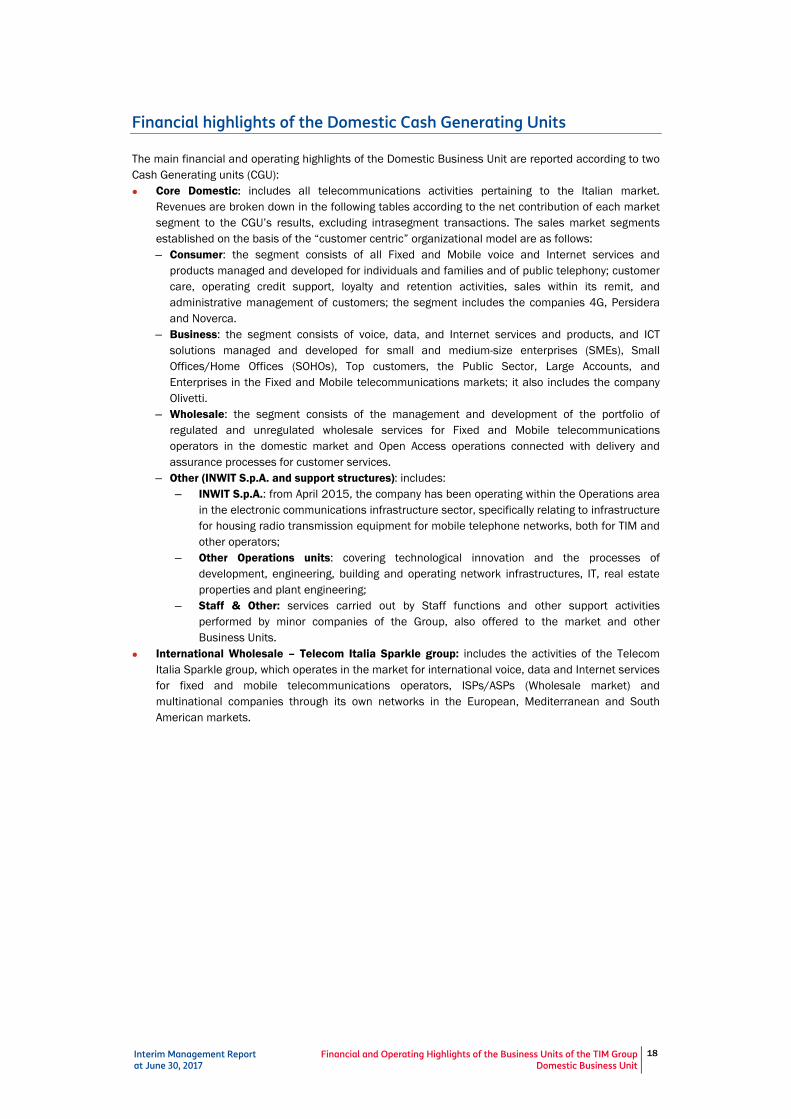
The breakdown of capital expenditures by operating segment is as follows:
(millions of euros) 1st Half 2017 1st Half 2016 Change % of total % of total
Domestic 1,626 79.1 1,575 79.4 51
Brazil 430 20.9 408 20.6 22
Other Operations − − − − −
Adjustments and eliminations − − − − −
Consolidated Total 2,056 100.0 1,983 100.0 73
% of Revenues 21.0 21.8 (0.8)pp
Capital expenditures in the first half of 2017 totaled 2,056 million euros, up 73 million euros on the first half of 2016. In particular:
• the Domestic Business Unit posted capital expenditures of 1,626 million euros, an increase of 51 million euros compared to the first half of 2016. This increase was mainly attributable to the innovative component (+266 million euros on the first half of 2016) and, in particular, it reflected the increase in capital expenditure for the development of next-generation networks and services and the reduction in other types of expenditure. It also confirms the selectivity and attention given to the capital allocation choices based on strategic priorities and profit optimization.
• The Brazil Business Unit recorded an increase in capital expenditure of 22 million euros for the first half of 2017 (including a positive currency effect of 82 million euros) compared to the first half of 2016; capital expenditures for the half-year were mainly aimed at the development of industrial infrastructure.
Change in net operating working capital
The change in net operating working capital for the first half of 2017 was a decrease of 1,130 million euros (decrease of 1,078 million euros in the first half of 2016). In particular:
• the change in inventories and the management of trade receivables generated negative impacts of 44 million euros and 52 million euros, respectively;
• the change in trade payables (-692 million euros) included the payment of around 257 million euros made by the Brazil Business Unit to the consortium that is carrying out the clean-up of the 700 MHz spectrum, which the Business Unit purchased the user rights to in 2014. The level of trade payables was also influenced by the seasonal peak in payments for bills payable;
• the other changes in operating receivables/payables (-342 million euros) include a negative amount of 134 million euros, for levies on telecommunications operations paid by the Brazil Business Unit – the taxes are normally paid every year by the end of March. There was also an increase in the VAT payable, which was settled in July.
Sale of investments and other disposals flow
This item showed a positive figure of 9 million euros for the first half of 2017 and related to disposals of assets within the normal operating cycle. In the first half of 2016 it was a positive figure of 732 million euros and essentially related to the sale of the Sofora – Telecom Argentina group that took place on March 8, 2016.

Interim Management Report at June 30, 2017
Consolidated Financial Position and Cash Flows Performance 26
Financial investments flow
In the first half of 2017 this item amounted to 1 million euros. In the first half of 2016 this item amounted to 9 million euros and included around 6 million euros for the payment made by INWIT S.p.A., net of the cash acquired, for the acquisition of the investments in Revi Immobili S.r.l., Gestione Immobili S.r.l. and Gestione Due S.r.l., and around 3 million euros for the subscription of the capital increase in the company Northgate held as a non-controlling interest.
Change in leasing contracts
In the first half of 2017, this item amounted to 30 million euros. In the first half of 2016 the change was 123 million and related to TIM S.p.A.. Further details are provided in the Note “Tangible assets (owned and under finance leases)” of the Half-year Condensed Consolidated Financial Statements at June 30, 2017 of the TIM Group.
Finance expenses, income taxes and other net non-operating requirements flow
The item amounted to 709 million euros and mainly included the payment, during the first half of 2017, of net finance expenses and income taxes, as well as the change in non-operating receivables and payables.

Interim Management Report at June 30, 2017
Consolidated Financial Position and Cash Flows Performance 27
Net financial debt
Net financial debt is composed as follows:
(millions of euros) 6/30/2017 12/31/2016 Change
(a) (b) (a-b)
Non-current financial liabilities
Bonds 19,587 20,369 (782)
Amounts due to banks, other financial payables and liabilities 6,944 7,656 (712)
Finance lease liabilities 2,356 2,444 (88)
28,887 30,469 (1,582)
Current financial liabilities (*)
Bonds 3,022 2,595 427
Amounts due to banks, other financial payables and liabilities 1,625 1,269 356
Finance lease liabilities 197 192 5
4,844 4,056 788
Financial liabilities directly associated with Discontinued operations/Non-current assets held for sale − − −
Total Gross financial debt 33,731 34,525 (794)
Non-current financial assets
Securities other than investments − (1) 1
Financial receivables and other non-current financial assets (2,185) (2,697) 512
(2,185) (2,698) 513
Current financial assets
Securities other than investments (1,102) (1,519) 417
Financial receivables and other current financial assets (630) (389) (241)
Cash and cash equivalents (4,086) (3,964) (122)
(5,818) (5,872) 54
Financial assets relating to Discontinued operations/Non-current assets held for sale − − −
Total financial assets (8,003) (8,570) 567
Net financial debt carrying amount 25,728 25,955 (227)
Reversal of fair value measurement of derivatives and related financial assets/liabilities (624) (836) 212
Adjusted net financial debt 25,104 25,119 (15)
Breakdown as follows:
Total adjusted gross financial debt 32,002 32,574 (572)
Total adjusted financial assets (6,898) (7,455) 557 (*) of which current portion of medium/long-term debt:
Bonds 3,022 2,595 427
Amounts due to banks, other financial payables and liabilities 853 670 183
Finance lease liabilities 197 192 5
The financial risk management policies of the TIM Group are aimed at minimizing market risks, fully hedging exchange rate risk, and optimizing interest rate exposure through appropriate diversification of the portfolio, which is also achieved by using carefully selected derivative financial instruments. Such instruments, it should be stressed, are not used for speculative purposes and all have an underlying, which is hedged. In addition, to determine its exposure to interest rates, the Group sets an optimum composition for the fixed-rate and variable-rate debt structure and uses derivative financial instruments to achieve that composition. Taking into account the Group's operating activities, the optimum mix of medium/long-term non-current financial liabilities has been established, on the basis of the nominal amount, at a range of 65% - 75% for the fixed-rate component and 25% - 35% for the variable-rate component. In managing market risks, the Group has adopted Guidelines for the "Management and control of financial risk" and mainly uses IRS and CCIRS derivative financial instruments. To provide a better representation of the true performance of Net Financial Debt, from 2009, in addition to the usual indicator (renamed "Net financial debt carrying amount"), a measure called "Adjusted net

Interim Management Report at June 30, 2017
Consolidated Financial Position and Cash Flows Performance 28
financial debt" has also been shown, which neutralizes the effects caused by the volatility of financial markets. Given that some components of the fair value measurement of derivatives (contracts for setting the exchange and interest rate for contractual flows) and derivatives embedded in other financial instruments do not result in actual monetary settlement, the "Adjusted net financial debt" excludes these purely accounting and non-monetary effects (including the effects resulting from the introduction of IFRS 13 – Fair Value Measurement from January 1, 2013) from the measurement of derivatives and related financial assets/liabilities. Sales of receivables to factoring companies Sales of trade receivables to factoring companies completed during the first half of 2017 resulted in a positive effect on net financial debt at June 30, 2017 of 969 million euros (1,091 million euros at December 31, 2016). Gross financial debt Bonds Bonds at June 30, 2017 were recorded for a total of 22,609 million euros (22,964 million euros at December 31, 2016). Their nominal repayment amount was 22,310 million euros, down 107 million euros compared to December 31, 2016 (22,417 million euros). Changes in bonds over the first half of 2017 are shown below:
(millions of original currency) Currency Amount Issue date
New issues
Telecom Italia S.p.A. 1,000 million euros 2.500% maturing 7/19/2023 Euro 1,000 1/19/2017
(millions of original currency) Currency Amount Repayment date
Repayments
Telecom Italia S.p.A. 545 million euros 7.000% (1) Euro 545 1/20/2017 (1) Net of buybacks by the Company of 455 million euros during 2015.
With reference to the Telecom Italia S.p.A. 2002–2022 bonds, reserved for subscription by employees of the Group, the nominal amount at June 30, 2017 was 200 million euros, down 1 million euros compared to December 31, 2016 (201 million euros). Revolving Credit Facility and Term Loan The following table shows the composition and the drawdown of the committed credit lines available at June 30, 2017:
(billions of euros) 6/30/2017 12/31/2016
Agreed Drawn down Agreed Drawn down
Revolving Credit Facility – expiring May 2019 4.0 - 4.0 -
Revolving Credit Facility – expiring March 2020 3.0 - 3.0 -
Total 7.0 - 7.0 -
TIM has two syndicated Revolving Credit Facilities for amounts of 4 billion euros and 3 billion euros expiring May 24, 2019 and March 25, 2020 respectively, both not yet drawn down. TIM also has:
• a bilateral Term Loan from Banca Regionale Europea expiring July 2019 for 200 million euros, drawn down for the full amount;
• two bilateral Term Loans from Mediobanca respectively for 200 million euros expiring in November 2019 and 150 million euros expiring in July 2020, drawn down for the full amount;
• a bilateral Term Loan from ICBC expiring July 2020 for 120 million euros, drawn down for the full amount;

Interim Management Report at June 30, 2017
Consolidated Financial Position and Cash Flows Performance 29
• a bilateral Term Loan from Intesa Sanpaolo expiring August 2021 for 200 million euros, drawn down for the full amount;
• an Hot Money loan with Banca Popolare dell’Emilia Romagna expiring July 2017 for 200 million euros, drawn down for the full amount.
On March 6, 2017, TIM S.p.A. signed a supplementary agreement with Mediobanca under which an early repayment was made on July 3, 2017 for 75 million euros for the bilateral term loan of an original amount of 150 million euros maturing in July 2020, which has been fully drawn down.
Maturities of financial liabilities and average cost of debt The average maturity of non-current financial liabilities (including the current portion of medium/long-term financial liabilities due within 12 months) is 7.71 years. The average cost of the Group's debt, considered as the cost for the year calculated on an annual basis and resulting from the ratio of debt-related expenses to average exposure, is about 5.0%. For details on the maturities of financial liabilities in terms of expected nominal repayment amounts, as contractually agreed, see the Notes "Financial liabilities (non-current and current)" in the Half-year Condensed Consolidated Financial Statements at June 30, 2017 of the TIM Group.
Current financial assets and liquidity margin The TIM Group's available liquidity margin amounted to 12,188 million euros at June 30, 2017, corresponding to the sum of "Cash and cash equivalents" and "Current securities other than investments", totaling 5,188 million euros (5,483 million euros at December 31, 2016), and the committed credit lines, mentioned above, of which a total of 7,000 million euros has not been drawn down. This margin is sufficient to cover Group financial liabilities due at least for the next 24 months. In particular:
Cash and cash equivalents amounted to 4,086 million euros (3,964 million euros at December 31, 2016). The different technical forms used for the investment of liquidity as of June 30, 2017 can be analyzed as follows: – Maturities: investments have a maximum maturity of three months; – Counterparty risk: investments by the European companies are made with leading banking, financial
and industrial institutions with high credit quality. Investments by the companies in South America are made with leading local counterparties;
– Country risk: deposits have been made mainly in major European financial markets.
Current securities other than investments amounted to 1,102 million euros (1,519 million euros at December 31, 2016): these forms of investment represent alternatives to the investment of liquidity with the aim of improving returns. They include 613 million euros of Italian treasury bonds purchased respectively by TIM S.p.A. (256 million euros) and Telecom Italia Finance S.A. (357 million euros) and 488 million euros of bonds purchased by Telecom Italia Finance S.A. with different maturities, all with an active market and consequently readily convertible into cash. The purchases of the above government bonds, which, pursuant to Consob Communication no. DEM/11070007 of August 5, 2011, represent investments in “Sovereign debt securities”, have been made in accordance with the Guidelines for the "Management and control of financial risk" adopted by the TIM Group since August 2012. In the second quarter of 2017, the adjusted net financial debt fell by 131 million euros compared to March 31, 2017 (25,235 million euros) due to the positive business and operational performance which, in particular, provided coverage for the requirements resulting in particular from the already mentioned payment of dividends of 218 million euros.

Interim Management Report at June 30, 2017
Consolidated Financial Position and Cash Flows Performance 30
(millions of euros) 6/30/2017 3/31/2017 Change
(a) (b) (a-b)
Net financial debt carrying amount 25,728 25,923 (195)
Reversal of fair value measurement of derivatives and related financial assets/liabilities (624) (688) 64
Adjusted net financial debt 25,104 25,235 (131)
Breakdown as follows:
Total adjusted gross financial debt 32,002 32,796 (794)
Total adjusted financial assets (6,898) (7,561) 663
Interim Management Report at June 30, 2017
Consolidated Financial Statements – TIM Group 31
CONSOLIDATED FINANCIAL STATEMENTS – TIM GROUP The Half-Year Financial Report at June 30, 2017 of the TIM Group has been prepared in compliance with Article 154-ter (Financial Reports) of Italian Legislative Decree no. 58/1998 (Consolidated Law on Finance - TUF) and subsequent amendments and supplements and presented in accordance with the international accounting standards issued by the International Accounting Standards Board and endorsed by the European Union (designated as "IFRS") as well as with the regulations issued to implement Article 9 of Italian Legislative Decree no. 38/2005. The Half-year Financial Report includes:
• the Interim Management Report;
• the Half-Year Condensed Consolidated Financial Statements;
• the certification of the Half-Year Condensed Consolidated Financial Statements pursuant to Article 81-ter of the Consob Regulation 11971 dated May 14, 1999, with Amendments and Additions.
The accounting policies and consolidation principles adopted in the preparation of the half-year condensed consolidated financial statements at June 30, 2017 are the same as those adopted in the annual consolidated financial statements at December 31, 2016, to which reference can be made. No new standards and interpretations were endorsed by the EU and in force from January 1, 2017. The TIM Group, in addition to the conventional financial performance measures established by IFRS, uses certain alternative performance measures in order to present a better understanding of the trend of operations and financial condition. Specifically, these alternative performance measures refer to: EBITDA; EBIT; the organic change in revenues, EBITDA and EBIT; EBITDA margin and EBIT margin; and net financial debt carrying amount and adjusted net financial debt. Moreover, the part entitled "Business Outlook for 2017" contains forward-looking statements in relation to the Group's intentions, beliefs or current expectations regarding financial performance and other aspects of the Group's operations and strategies. Readers of the Half-year financial Report are reminded not to place undue reliance on forward-looking statements; actual results may differ significantly from forecasts owing to numerous factors, the majority of which are beyond the scope of the Group’s control.
MAIN CHANGES IN THE SCOPE OF CONSOLIDATION There were no significant changes in the scope of consolidation during the first half of 2017. The following changes in the scope of consolidation occurred during 2016:
• TIMVISION S.r.l. (Domestic Business Unit): established on December 28, 2016;
• Noverca S.r.l. (Domestic Business Unit): on October 28, 2016 TIM S.p.A. acquired 100% of the company;
• Flash Fiber S.r.l. (Domestic Business Unit): established on July 28, 2016;
• Sofora - Telecom Argentina group: classified as Discontinued Operations (Discontinued operations/Non-current assets held for sale) was sold on March 8, 2016;
• Revi Immobili S.r.l., Gestione Due S.r.l. and Gestione Immobili S.r.l. (Domestic Business Unit): on January 11, 2016, INWIT S.p.A. purchased 100% of these companies, which were subsequently merged by absorption.

Interim Management Report at June 30, 2017
Consolidated Financial Statements – TIM Group 32
Separate Consolidated Income Statements
(millions of euros) 1st Half 1st Half Change
2017 2016 (a-b)
(a) (b) amount %
Revenues 9,772 9,096 676 7.4
Other income 217 107 110 −
Total operating revenues and other income 9,989 9,203 786 8.5
Acquisition of goods and services (4,136) (3,783) (353) (9.3)
Employee benefits expenses (1,530) (1,551) 21 1.4
Other operating expenses (576) (501) (75) (15.0)
Change in inventories 50 33 17 51.5
Internally generated assets 317 325 (8) (2.5)
Operating profit before depreciation and amortization, capital gains (losses) and impairment reversals (losses) on non-current assets (EBITDA) 4,114 3,726 388 10.4
Depreciation and amortization (2,249) (2,047) (202) (9.9)
Gains/(losses) on disposals of non-current assets 6 13 (7) (53.8)
Impairment reversals (losses) on non-current assets − (5) 5 −
Operating profit (loss) (EBIT) 1,871 1,687 184 10.9
Share of profits (losses) of associates and joint ventures accounted for using the equity method (1) (2) 1 50.0
Other income (expenses) from investments (19) 7 (26) −
Finance income 1,110 2,012 (902) (44.8)
Finance expenses (1,850) (2,157) 307 14.2
Profit (loss) before tax from continuing operations 1,111 1,547 (436) (28.2)
Income tax expense (457) (489) 32 6.5
Profit (loss) from continuing operations 654 1,058 (404) (38.2)
Profit (loss) from Discontinued operations/Non-current assets held for sale − 47 (47) −
Profit (loss) for the period 654 1,105 (451) (40.8)
Attributable to:
Owners of the Parent 596 1,018 (422) (41.5)
Non-controlling interests 58 87 (29) (33.3)

Interim Management Report at June 30, 2017
Consolidated Financial Statements – TIM Group 33
Consolidated Statements of Comprehensive Income
In accordance with IAS 1 (Presentation of Financial Statements), the following consolidated statements of comprehensive income include the Profit (loss) for the period as shown in the Separate Consolidated Income Statements and all non-owner changes in equity. (millions of euros) 1st Half 1st Half
2017 2016
Profit (loss) for the period (a) 654 1,105
Other components of the Consolidated Statements of Comprehensive Income
Other components that subsequently will not be reclassified in the Separate Consolidated Income Statements
Remeasurements of employee defined benefit plans (IAS 19):
Actuarial gains (losses) 33 (118)
Income tax effect (8) 32
(b) 25 (86)
Share of other profits (losses) of associates and joint ventures accounted for using the equity method:
Profit (loss) − −
Income tax effect − −
(c) − −
Total other components that subsequently will not be reclassified in the Separate Consolidated Income Statements (d=b+c) 25 (86)
Other components that subsequently will be reclassified in the Separate Consolidated Income Statements
Available-for-sale financial assets:
Profit (loss) from fair value adjustments 34 76
Loss (profit) transferred to the Separate Consolidated Income Statements (37) (69)
Income tax effect 2 (4)
(e) (1) 3
Hedging instruments:
Profit (loss) from fair value adjustments (331) (327)
Loss (profit) transferred to the Separate Consolidated Income Statements 497 245
Income tax effect (43) (2)
(f) 123 (84)
Exchange differences on translating foreign operations:
Profit (loss) on translating foreign operations (551) 618
Loss (profit) on translating foreign operations transferred to the Separate Consolidated Income Statements 19 304
Income tax effect − −
(g) (532) 922
Share of other profits (losses) of associates and joint ventures accounted for using the equity method:
Profit (loss) − −
Loss (profit) transferred to the Separate Consolidated Income Statements − −
Income tax effect − −
(h) − −
Total other components that subsequently will be reclassified to the Separate Consolidated Income Statements (i=e+f+g+h) (410) 841
Total other components of the Consolidated Statements of Comprehensive Income (k=d+i) (385) 755
Total comprehensive income (loss) for the period (a+k) 269 1,860
Attributable to:
Owners of the Parent 367 1,726
Non-controlling interests (98) 134

Interim Management Report at June 30, 2017
Consolidated Financial Statements – TIM Group 34
Consolidated Statements of Financial Position
(millions of euros) 6/30/2017 12/31/2016 Change
(a) (b) (a-b)
Assets
Non-current assets
Intangible assets
Goodwill 29,511 29,612 (101)
Intangible assets with a finite useful life 6,594 6,951 (357)
36,105 36,563 (458)
Tangible assets
Property, plant and equipment owned 13,671 13,947 (276)
Assets held under finance leases 2,371 2,413 (42)
16,042 16,360 (318)
Other non-current assets
Investments in associates and joint ventures accounted for using the equity method 17 18 (1)
Other investments 48 46 2
Non-current financial assets 2,185 2,698 (513)
Miscellaneous receivables and other non-current assets 2,324 2,222 102
Deferred tax assets 525 877 (352)
5,099 5,861 (762)
Total Non-current assets (a) 57,246 58,784 (1,538)
Current assets
Inventories 314 270 44
Trade and miscellaneous receivables and other current assets 5,617 5,426 191
Current income tax receivables 45 94 (49)
Current financial assets
Securities other than investments, financial receivables and other current financial assets 1,732 1,908 (176)
Cash and cash equivalents 4,086 3,964 122
5,818 5,872 (54)
Current assets sub-total 11,794 11,662 132
Discontinued operations/Non-current assets held for sale − − −
Total Current assets (b) 11,794 11,662 132
Total Assets (a+b) 69,040 70,446 (1,406)

Interim Management Report at June 30, 2017
Consolidated Financial Statements – TIM Group 35
(millions of euros) 6/30/2017 12/31/2016 Change
(a) (b) (a-b)
Equity and Liabilities
Equity
Equity attributable to Owners of the Parent 21,404 21,207 197
Non-controlling interests 2,215 2,346 (131)
Total Equity (c) 23,619 23,553 66
Non-current liabilities
Non-current financial liabilities 28,887 30,469 (1,582)
Employee benefits 1,336 1,355 (19)
Deferred tax liabilities 323 293 30
Provisions 813 830 (17)
Miscellaneous payables and other non-current liabilities 1,594 1,607 (13)
Total Non-current liabilities (d) 32,953 34,554 (1,601)
Current liabilities
Current financial liabilities 4,844 4,056 788
Trade and miscellaneous payables and other current liabilities 7,056 7,646 (590)
Current income tax payables 568 637 (69)
Current liabilities sub-total 12,468 12,339 129
Liabilities directly associated with Discontinued operations/Non-current assets held for sale − − −
Total Current Liabilities (e) 12,468 12,339 129
Total Liabilities (f=d+e) 45,421 46,893 (1,472)
Total Equity and Liabilities (c+f) 69,040 70,446 (1,406)

Interim Management Report at June 30, 2017
Consolidated Financial Statements – TIM Group 36
Consolidated Statements of Cash Flows
(millions of euros) 1st Half 1st Half
2017 2016
Cash flows from operating activities:
Profit (loss) from continuing operations 654 1,058
Adjustments for:
Depreciation and amortization 2,249 2,047
Impairment losses (reversals) on non-current assets (including investments) 10 5
Net change in deferred tax assets and liabilities 336 257
Losses (gains) realized on disposals of non-current assets (including investments) (6) (13)
Share of profits (losses) of associates and joint ventures accounted for using the equity method 1 2
Change in employee benefits (7) 40
Change in inventories (44) (40)
Change in trade receivables and net amounts due from customers on construction contracts (52) (130)
Change in trade payables 44 (141)
Net change in current income tax receivables/payables 72 95
Net change in miscellaneous receivables/payables and other assets/liabilities (119) (687)
Cash flows from (used in) operating activities (a) 3,138 2,493
Cash flows from investing activities:
Purchase of intangible assets (673) (709)
Purchase of tangible assets (1,413) (1,397)
Total purchase of intangible and tangible assets on an accrual basis (2,086) (2,106)
Change in amounts due for purchases of intangible and tangible assets (707) (371)
Total purchase of intangible and tangible assets on a cash basis (2,793) (2,477)
Acquisition of control in subsidiaries or other businesses, net of cash acquired − (6)
Acquisitions/disposals of other investments (1) (3)
Change in financial receivables and other financial assets 695 364
Proceeds from sale that result in a loss of control of subsidiaries or other businesses, net of cash disposed of − 492
Proceeds from sale/repayment of intangible, tangible and other non-current assets 9 29
Cash flows from (used in) investing activities (b) (2,090) (1,601)
Cash flows from financing activities:
Change in current financial liabilities and other (663) (262)
Proceeds from non-current financial liabilities (including current portion) 1,256 2,061
Repayments of non-current financial liabilities (including current portion) (1,200) (3,094)
Share capital proceeds/reimbursements (including subsidiaries) 6 −
Dividends paid (218) (227)
Cash flows from (used in) financing activities (c) (819) (1,522)
Cash flows from (used in) Discontinued operations/Non-current assets held for sale (d) − (45)
Aggregate cash flows (e=a+b+c+d) 229 (675)
Net cash and cash equivalents at beginning of the period (f) 3,952 3,216
Net foreign exchange differences on net cash and cash equivalents (g) (95) 159
Net cash and cash equivalents at end of the period (h=e+f+g) 4,086 2,700

Interim Management Report at June 30, 2017
Consolidated Financial Statements – TIM Group 37
Additional Cash Flow Information
(millions of euros) 1st Half 1st Half
2017 2016
Income taxes (paid) received (27) (104)
Interest expense paid (1,198) (1,327)
Interest income received 432 516
Dividends received − 7
Analysis of Net Cash and Cash Equivalents
(millions of euros) 1st Half 1st Half
2017 2016
Net cash and cash equivalents at beginning of the period
Cash and cash equivalents - from continuing operations 3,964 3,559
Bank overdrafts repayable on demand – from continuing operations (12) (441)
Cash and cash equivalents - from Discontinued operations/Non-current assets held for sale − 98
Bank overdrafts repayable on demand – from Discontinued operations/Non-current assets held for sale − −
3,952 3,216
Net cash and cash equivalents at end of the period
Cash and cash equivalents - from continuing operations 4,086 2,707
Bank overdrafts repayable on demand – from continuing operations − (7)
Cash and cash equivalents - from Discontinued operations/Non-current assets held for sale − −
Bank overdrafts repayable on demand – from Discontinued operations/Non-current assets held for sale − −
4,086 2,700

Interim Management Report at June 30, 2017
Consolidated Financial Statements – TIM Group 38
OTHER INFORMATION Average salaried workforce
(equivalent number) 1st Half 1st Half Change
2017 2016
Average salaried workforce – Italy 45,907 47,448 (1,541)
Average salaried workforce – Outside Italy 9,392 11,688 (2,296)
Total average salaried workforce (1) 55,299 59,136 (3,837)
Discontinued operations/Non-current assets held for sale -Sofora - Telecom Argentina group - 5,161 (5,161)
Total average salaried workforce - including Discontinued operations/Non-current assets held for sale 55,299 64,297 (8,998)
1) Includes employees with temp work contracts: the average headcount was 3 in the first half of 2017 (2 in Italy and 1 outside Italy). In the first half of 2016, the average headcount was 4 (2 in Italy and 2 outside Italy).
Headcount at period end
(number) 6/30/2017 12/31/2016 Change
Headcount – Italy 50,926 51,125 (199)
Headcount – Outside Italy 9,726 10,104 (378)
Total headcount at period end (1) 60,652 61,229 (577)
1) Includes employees with temp work contracts: 1 at 6/30/2017 and 4 at 12/31/2016.
Headcount at period end – Breakdown by Business Unit
(number) 6/30/2017 12/31/2016 Change
Domestic 51,095 51,280 (185)
Brazil 9,471 9,849 (378)
Other Operations 86 100 (14)
Total 60,652 61,229 (577)

Interim Management Report at June 30, 2017
Business outlook for 2017
39
EVENTS SUBSEQUENT TO JUNE 30, 2017 For details of subsequent events see the Note “Events Subsequent to June 30, 2017” in the TIM Group half-year condensed consolidated financial statements.
BUSINESS OUTLOOK FOR THE YEAR 2017 As envisaged in the 2017–2019 Plan, TIM will continue the process of profound transformation of the Company. This process consists of firm financial discipline in support of development, aimed at creating more room for investments for new networks and platforms (Fiber and mobile UltraBroadband and Cloud-based services) and eliminating less strategic cash costs, in addition to maximizing return on investment. The objective is to ensure structural growth in revenue and EBITDA and consolidate TIM's position as the market leader in terms of technology, network quality and service excellence in the Fixed-line and Mobile segments. The key elements of this approach are innovation, convergence, exclusive content and closeness to the Customer.
In the Domestic Fixed segment, TIM expects to reduce the decrease in the number of clients – and that all loss lines will be brought to zero by 2018 – through the faster spread and subsequent adoption of fiber optic networks. A crucial role will also be played by our commercial strategy that aims to retain and increase the number of customers by offering, inter alia, devices and appliances for the Smart Home connected to the home network and directly charged in the phone bill.
Within the Domestic Mobile segment, in an increasingly polarized and segmented competitive scenario, TIM – particularly in the high-end market with ever-increasing data usage – will leverage the reach of its 4G network (expected population coverage of over 99% in 2019) and the diffusion of convergent services and quality content. Kena, the second no-frills brand (launched in April), will allow the company to compete in the more price-sensitive segments.
Operations will be characterized by greater selectivity and priority in investment choices and efficiency recovery actions through structural cost optimization programs. At the same time, the transformation and simplification of organization and processes – combined with the commercial development and the expected growth in revenue – will provide the Group with EBITDA growth (low single digit) and the cash generation needed to reduce the Adjusted net financial debt to reported EBITDA ratio, which is expected to be below 2.7x in 2018.
In Brazil, the Plan provides for the continued turnaround of Tim Brasil through its re-positioning based on network and product quality, thereby enabling the company to maintain its leadership in the prepaid segment and successfully compete in the postpaid segment. The Cost Containment Plan launched in 2016 has also been continued and strengthened and will enable the achievement of solid profit and cash flow generation. More specifically, further impetus will be given to the construction of the UBB Mobile infrastructure – at completion of the Plan, the 4G network will reach 95% of the population with coverage of about 3,600 cities – and the development of convergent offers, also thanks to agreements with major premium content providers.

Interim Management Report at June 30, 2017
Main risks and uncertainties 40
MAIN RISKS AND UNCERTAINTIES Risk governance is a strategic tool for value creation. The TIM Group has adopted an Enterprise Risk Management Model based on the methodology of the Committee of Sponsoring Organizations of the Treadway Commission (ERM CoSO Report), which enables the identification and management of risk in a uniform manner across the Group companies, highlighting potential synergies among the actors involved in the assessment of the Internal Control and Risk Management System. The ERM process is designed to identify potential events that may affect the business, to manage risk within acceptable limits and to provide reasonable assurance regarding the achievement of corporate objectives. The business outlook for 2017 could be affected in the second half of the year by risks and uncertainties caused by a multitude of factors, the majority of which are beyond the Group's control. In particular, several major alterations need to be noted, such as the changes in several senior executive positions and the modification of the market environment, with the initiation of proceedings by the Anti-Trust Authority on the projects for development of the ultrabroadband and fiber optic networks, in addition to a possible revision of the business strategies for the content component. These risk factors may have repercussions – which are currently unforeseeable – in terms of the strategic choices adopted by the company and could have an impact, for example, on the ultrabroadband development plans and on the evolution model adopted in the multimedia market. In view of the above risks, in addition to the expected performance of the domestic market and the impacts from the new tariff model for roaming services, as well as several non-recurring business trends in the third quarter of 2016 (resulting in a not fully like-for-like comparison in the second half of the year), management has confirmed the guidance announced for the full year 2017 and for the period of the Plan (e.g. low-single digit growth in Domestic EBITDA), despite the strong performance in the second quarter of 2017. The main risks affecting the business activities of the TIM Group, which may impact, even significantly, the ability to achieve the objectives of the Group are detailed below.
STRATEGIC RISKS
Risks related to macro economic factors
The TIM Group's economic and financial situation is subject to the influence of numerous macroeconomic factors such as economic growth, political stability, consumer confidence, and changes in interest rates and exchange rates in the markets in which it operates. The expected results may be affected, in the domestic market, by the strengthening of the economic recovery: the year 2016 ended with growth of around 1% (a low figure when compared to the average of the EMU countries) and the forecast for 2017 is for higher growth, albeit only slightly. Consumption is starting to pick up again, after a slowdown in the second half of 2016, despite the erosion of purchasing power due to rising inflation. Confidence has also improved among consumers and businesses. Unemployment is still high, despite the significant fall from the second quarter of 2016, with consequent possible effects on income available for consumption. On the Brazilian market, the expected results may be significantly affected by the macroeconomic and political situation. After 8 quarters of GDP decline, marking the deepest and most profound crisis in its history, Brazil returned to growth in the first quarter of 2017 (+1%). 2017 should close with a growth rate just above zero. Apart from this positive result, there is an ongoing situation of high political instability, as well as a very problematic employment situation (with a total of more than 14 million unemployed and an unemployment rate of 14% in the first quarter of 2017) which are significantly slowing down the recovery in domestic demand.

Interim Management Report at June 30, 2017
Main risks and uncertainties 41
Risks related to competition
The telecommunications market is characterized by strong competition that may reduce market share in the geographical areas where the TIM Group is engaged as well as erode prices and margins. Competition is focused, on one hand, on innovative products and services and, on the other hand, on the price of traditional services. In addition, in the area of infrastructure competition, the growth of alternative operators could represent a threat for TIM, particularly in the years of the Plan after 2017 and also beyond the Plan period. In the mobile market, Iliad S.A. is about to launch a new mobile operator in Italy with the aim of acquiring 10-15% of the market, as per its own announcements, by adopting the strategies it has already used for the French market. For its part, TIM has launched a new operator with its own independent systems and features. In addition, Open Fiber and Infratel have announced their plans for the development of an ultrabroadband telecommunications network as an alternative to the TIM network, respectively in the major Italian cities and the "market failure" areas. In Brazil, the deterioration of the macroeconomic environment continues to negatively impact on the telecommunications market. Competitive risk is given both by a deterioration of the business model tied to traditional services, which have not been replaced by innovative services, and by the rationalization of consumption by customers as a result of a contraction of their purchasing power. In this scenario, the Tim Brasil group may be further impacted in the short term to a greater extent than its main competitors, due to the higher proportion of customers with prepaid services, which are more affected by the current macroeconomic situation, and by a slowdown in their replacement with postpaid customers.
OPERATIONAL RISKS
Operational risks inherent in our business relate to possible inadequacies in internal processes, external factors, frauds, employee errors, errors in properly documenting transactions, loss of critical or commercially sensitive data and failures in systems and/or network platforms.
Risks related to business continuity
The TIM Group's success depends heavily on the ability to ensure continuous and uninterrupted delivery of the products and services we provide through the availability of processes and the relating supporting assets. In particular, the Network Infrastructure and the Information Systems are sensitive to various internal and external threats: power outage, floods, storms, human errors, system failures, hardware and software failures, software bugs, cyber attacks, earthquakes, facility failures, strikes, fraud, vandalism, terrorism, etc.. Each of these events could lead to an interruption in the supply of services/products and potentially affect our business both directly and indirectly: reduction in revenues and/or increased costs for recovery and for penalties and fines, decrease in customer satisfaction, and negative impact on reputation.
Risks related to the development of fixed and mobile networks
To maintain and expand our customer portfolio in each of the markets in which we operate, it is necessary to maintain, update and improve existing networks in a timely manner. A reliable and high quality network is necessary to maintain the customer base and minimize the terminations to protect the Company's revenues from erosion. The maintenance and improvement of existing installations depend on our ability to:
• upgrade the capabilities of the networks to provide customers with services that are closer to their needs; in this regard, the TIM Group may participate in tenders for broadcasting frequencies;
• increase the geographical coverage of innovative services;
• upgrade the structure of the systems and the networks to adapt it to new technologies;

Interim Management Report at June 30, 2017
Main risks and uncertainties 42
• sustaining the necessary level of capital expenditure in the long term.
Risks of internal/external fraud
The TIM Group has adopted an organizational model to prevent fraud. However, the implementation of this model cannot ensure the total mitigation of the risk. Dishonest activities and illegal acts committed by people inside and outside the organization could adversely affect the Company's operating results, financial position and image.
Risks related to disputes and litigation
The TIM Group has to deal with disputes and litigation with tax authorities, regulators, competition authorities, other telecommunications operators and other entities. The possible impacts of such proceedings are generally uncertain. In the event of settlement unfavorable to the Group, these issues may, individually or as whole, have an adverse effect, which may even be significant, on its operating results, financial position and cash flows.
FINANCIAL RISKS
The TIM Group may be exposed to financial risks, such as risks arising from fluctuations in interest rates and exchange rates, credit risk, liquidity risk and risks related to the performance of the equity markets in general, and – more specifically – risks related to the performance of the share price of the TIM Group companies. These risks may adversely impact the earnings and the financial structure of the Group. Accordingly, to manage those risks, the TIM Group has established guidelines, at central level, which must be followed for operational management, identification of the most suitable financial instruments to meet set goals, and monitoring the results achieved. In particular, in order to mitigate the liquidity risk, the TIM Group aims to maintain an "adequate level of financial flexibility", in terms of cash and syndicated committed credit lines, enabling it to cover refinancing requirements at least for the next 12 -18 months. On June 23, 2016, a referendum was held in the United Kingdom, commonly referred to as “Brexit”, in which voters approved the UK’s exit from the European Union. The potential impact of Brexit will depend, in part, on the outcome of the negotiations on tariffs, trade, regulations and other matters, which started in the second half of June 2017. The result of the referendum had an adverse effect on the global markets and also produced a sharp decline in the pound against the dollar and the euro. Brexit and the possible changes during the exit negotiations could create further instability in the global financial markets and uncertainty about the laws and regulations of the European Union that the United Kingdom may decide to replace with national laws and regulations. The potential effects of Brexit could adversely affect our financial conditions, our business and the related earnings and cash flows.
REGULATORY AND COMPLIANCE RISKS
Regulatory risks
The telecommunications industry is highly regulated. In this context, new decisions by the Communications Authority (AGCom) may lead to changes in the regulatory framework that may affect the expected results of the Group. More specifically, the main elements that introduce uncertainty are:
• lack of predictability in start-up timing and consequent new process decisions;
• decisions with retroactive effect (for example, price revisions for previous years as a result of judgments issued by the Administrative Courts);

Interim Management Report at June 30, 2017
Main risks and uncertainties 43
• decisions that can influence the technological choices made and to be made, with potential impact on the timing of return on infrastructure investment.
Implementation has been completed of the New Equivalence Model (NEM), launched by TIM in 2015, aimed at further improving the effectiveness of guarantees for equal treatment between own business divisions and competitors that buy wholesale services. The NEM and the related implementation roadmap were approved by the Board of Directors of TIM on November 5, 2015. The Italian Antitrust Authority (AGCM) and the AGCom positively evaluated the effectiveness of the NEM and decided, respectively, to close the non-compliance proceedings A428C, acknowledging that TIM has complied with the earlier A428 decision, and to discontinue the ongoing penalty proceedings.
Compliance risks
The TIM Group may be exposed to risks of non-compliance due to non-observance/breach of internal (self-regulation, such as, for example, bylaws, code of ethics) and external rules (laws and regulations), with consequent judicial or administrative penalties, financial losses or reputational damage. The TIM Group aims to ensure that processes, and, therefore, the procedures and systems governing them, and corporate conduct comply with legal requirements. The risk is associated with potential time lags in making the processes compliant with regulatory changes or whenever non-conformities are identified.
Interim Management Report at June 30, 2017
Main changes in the regulatory framework 44
MAIN CHANGES IN THE REGULATORY FRAMEWORK
DOMESTIC
Wholesale fixed-line markets
Wholesale access services
Following the Resolution 623/15/CONS, in which AGCom requested TIM to submit a proposal for improving the effectiveness of its equivalence model in the processes for the supply of wholesale services to competitors and to its own commercial divisions, TIM completed the implementation of the New Equivalents Model (NEM) on April 30, 2017. Within the above-mentioned Resolution, AGCom also requested TIM to submit a proposal containing the operating procedures for the introduction of a model for the unbundling of incidental services associated to the delivery and assurance of wholesale access lines for local loop unbundling and sub-loop unbundling services. The proposal submitted by TIM is based on the extension of the Unique System (i.e., use of outside companies at the request of the competitors) to the above-mentioned delivery and assurance activities. The procedure is still ongoing and AGCom final decision, after notification of the draft measure to the European Commission, is expected by the third quarter of 2017.
Infratel Tenders for the subsidizing of the Ultra Broadband networks
On March 7, 2017, Infratel Italia awarded the company Open Fiber (OF) all five lots of the tender for the construction and operation of networks enabling the offering of Ultra Broadband services (from 30 to 100 Mbit/s) in the so-called "White Areas” (in which the private operators had not envisaged the independent construction of Ultra Broadband infrastructure in the next three years) of the municipalities of six Italian regions (Abruzzo, Molise, Emilia Romagna, Lombardy, Tuscany and Veneto). On March 20, 2017, a ruling with an unfavorable outcome for TIM was issued in the main proceedings for the appeal filed by TIM concerning the tender and on June 20, 2017 TIM lodged an appeal with the Consiglio di Stato.
Retail fixed-line markets
Universal Service
Through Resolution 46/17/CONS of January 26, 2017, AGCom introduced new measures regarding the subsidized financial conditions for access to fixed and mobile services for particular categories of disabled customers. The provisions of the measure, which apply to the deaf and the totally and partially blind, broaden the current subsidies, both in terms of discounted services (e.g. flat voice and data offers) and categories of disabled people covered (e.g. the partially blind). In February 2017, TIM submitted an appeal to the Lazio Regional Administrative Court against Resolution 456/16/CONS of October 2016, through which AGCom rejected TIM's proposal for a price adjustment on the "Voice” offering (the basic voice telephony offering), and introduced a strict procedure for future changes of Universal Service prices, by providing, for example, a minimum time interval of a year between two successive tariff changes and the possibility to only change prices with reference to: (i) increase in wholesale costs; (ii) offsetting inflation; (iii) socio-economic conditions. The first hearing has been set for November 22, 2017. Through resolution 163/17/CONS of April 18, 2017, AGCom imposed a fine of 232,000 euros on TIM for the failure to achieve 4 quality objectives of 2015. For information on the pending disputes relating to the remuneration of the net costs of the Universal Service incurred by TIM in the years 1999-2003, excluding 2002, see the Note “Contingent liabilities, other information, commitments and guarantees” of the Consolidated financial statements of the TIM Group at December 31, 2016.

Interim Management Report at June 30, 2017
Main changes in the regulatory framework 45
Wholesale mobile network markets
International roaming
On June 15, 2017, the provision of European Regulation 2015/2120 of November 25, 2015 ("Telecom Single Market - TSM Regulation") entered into force, which requires for the application of the national tariff for intra-EU voice, SMS and roaming data traffic. On April 25, 2017, the European Parliament and the Council adopted a regulation establishing new wholesale caps for roaming traffic valid from June 15, 2017 to June 30, 2022 (Voice: 3.2 euro cents per minute; SMS 1 euro cents per SMS, data: 7.7 euro/GByte in 2017; 6 euro/GByte in 2018; 4.5 euro/GByte in 2019; 3.5 euro/GByte in 2020; 3 euro/GByte in 2021; and 2.5 euro/GByte in 2022).
AGCom contribution fee
On March 31, 2017, TIM paid an amount of 19.3 million euros, with reservation, for the 2017 AGCom contribution fee. The value was calculated by applying the rate of 0.0014 to the revenues recorded in the Company's 2015 Financial Statements. The guidelines for the calculation of the contribution fee, set out in the AGCom Resolutions 463/16/CONS and 62/17/CONS, have not changed with respect to those established for the calculation of the 2016 contribution fee.
Antitrust
For information on the pending legal disputes, relating to proceedings already completed by the AGCM – A428 and I761 – see the Note “Contingent liabilities, other information, commitments and guarantees” of the Half-year condensed consolidated financial statements of the TIM Group at June 30, 2017. Case A500B In April 2017, the AGCM extended to Telecom Italia Sparkle the case A500B, opened against TIM and regarding the possible improper conduct in the market consisting in bulk SMS messaging services. Case “I799” In February 2017, AGCM initiated investigation proceedings for possible violation of Article 101 TFEU (ban on competition-restricting agreements) against TIM S.p.A. and Fastweb S.p.A., following the signing of an agreement aimed at establishing a joint cooperative enterprise Flash Fiber S.r.l.. The end of the proceedings has been set at December 31, 2017. Case “A514” On June 28, 2017, AGCM initiated proceedings against TIM for possible breaches of Article 102 TFEU following complaints made by Infratel, Enel, Open Fiber, Vodafone and Wind-Tre. For more details see the description provided in the Note “Contingent liabilities, other information, commitments and guarantees” of the Half-year condensed consolidated financial statements of the TIM Group at June 30, 2017.

Interim Management Report at June 30, 2017
Main changes in the regulatory framework 46
BRAZIL
700 MHz and Analog TV switch off
In September 2014, TIM won the tender for the award of the 700MHz (4G/LTE) band frequencies, for a price of 1.7 billion reais, and with additional commitments of 1.2 billion reais (in four annual installments, adjusted for inflation) as a contribution to the consortium established by the tender (“EAD”) for all the operators (TIM, Algar, Claro and Vivo) awarded the contract for managing the freeing up of the 700MHz band through the switch off of analog TV, the redistribution of channels and the reduction of interference. To that end, the first payment (370 million reais) was made in April 2015 and the subsequent two payments (for a total of 860 million reais) were both made in January 2017. In April 2017, the first towns to complete the implementation of the 4G/LTE network were Brasilia, Campo Grande and Teresina. Subsequently, seven other towns have installed the new network and start-up is scheduled in another nine towns within the year in the country.

Interim Management Report at June 30, 2017
Corporate Boards at June 30, 2017 47
CORPORATE BOARDS AT JUNE 30, 2017
BOARD OF DIRECTORS
The ordinary shareholders' meeting of the Company, held on May 4, 2017, appointed the new Board of Directors, setting its number of members at 15 and its term of office at three years (up to the approval of the financial statements at December 31, 2019). The Board of Directors' meeting, held on May 5, 2017, appointed Giuseppe Recchi as Chairman of the Board, Arnaud Roy de Puyfontaine as Deputy Chairman and Flavio Cattaneo as Chief Executive Officer of the Company. On June 1, 2017 the Board of Directors approved a change in the company officers, with the appointment of Arnaud Roy de Puyfontaine as Chairman of the Board of Directors and Giuseppe Recchi as Deputy Chairman. The Board of Directors of the Company at June 30, 2017 was composed as follows:
Chairman Arnaud Roy de Puyfontaine
Deputy Chairman Giuseppe Recchi
Chief Executive Officer Flavio Cattaneo
Directors Camilla Antonini (independent) Franco Bernabè (independent) Ferruccio Borsani (independent) Lucia Calvosa (independent) Francesca Cornelli (independent) Frédéric Crépin Dario Frigerio (independent) Félicité Herzog (independent) Anna Jones (independent) Marella Moretti (independent) Hervé Philippe Danilo Vivarelli (independent)
Secretary to the Board Agostino Nuzzolo
All the board members are domiciled for the positions they hold in TIM at the registered offices of the Company in Milan, Via G. Negri 1. The following board committees were in place at June 30, 2017:
• Control and Risk Committee: composed of the Directors: Lucia Calvosa (Chair appointed in the meeting of June 22, 2017), Francesca Cornelli, Frederic Crépin, Félicité Herzog and Marella Moretti;
• Nomination and Remuneration Committee: composed of the Directors: Anna Jones (Chair appointed in the meeting of June 15, 2017), Ferruccio Borsani, Frederic Crépin, Hervé Philippe and Danilo Vivarelli;
• Strategy Committee: made up of the Chairman of the Board of Directors, Arnaud Roy de Puyfontaine, the Chief Executive Officer, Flavio Cattaneo, the Deputy Chairman, Giuseppe Recchi, and the Directors Franco Bernabé and Dario Frigerio.
BOARD OF STATUTORY AUDITORS
The ordinary shareholders' meeting of May 20, 2015 appointed the Company's Board of Statutory Auditors with a term up to the approval of the 2017 financial statements.

Interim Management Report at June 30, 2017
Corporate Boards at June 30, 2017 48
The Board of Statutory Auditors of the Company is now composed as follows:
Chairman Roberto Capone
Acting Auditors Vincenzo Cariello
Paola Maiorana
Gianluca Ponzellini
Ugo Rock
Alternate Auditors Francesco Di Carlo
Gabriella Chersicla
Piera Vitali
Riccardo Schioppo
INDEPENDENT AUDITORS
The shareholders' meeting held on April 29, 2010 appointed the audit firm PricewaterhouseCoopers S.p.A. to audit TIM financial statements for the nine-year period 2010-2018.
MANAGER RESPONSIBLE FOR PREPARING THE CORPORATE FINANCIAL REPORTS
At the meeting of May 5, 2017, the Board of Directors confirmed Piergiorgio Peluso (Head of the Group Administration, Finance and Control Function) as the manager responsible for preparing TIM's financial reports.

Inteat J
MA
Onteran Onasreson
erim ManagemenJune 30, 2017
MACROAT JUNE
n July 24, 20rmination, with
nd as the Gene
n July 27, 201ssigned the Chisponsibilities r
n an interim ba
nt Report
-ORGAE 30, 20
17, the Boardh effect from Jeral Manager (w
17, the Boardief Executive Orelated to the Ssis to the Depu
ANIZATI017
d of Directors July 28, of Mr.with effect from
d of Directors, Officer's responSecurity Functuty Chairman,
ION CH
of TIM S.p.A. Flavio Cattan
m July 31).
in line with tnsibilities to thetion and the coGiuseppe Recc
Macro-Orga
HART
. approved a eo's term of o
the Company'se Executive Chompany Telecochi.
anization Chart a
settlement agoffice as Chief
s succession airman Mr. de
om Italia Spark
at June 30, 2017
greement for Executive Offi
plan, temporae Puyfontaine. Tkle were assign
49
the cer
arily The ned

Interim Management Report at June 30, 2017
Information for Investors
50
INFORMATION FOR INVESTORS
TIM S.P.A. SHARE CAPITAL AT JUNE 30, 2017
Share capital 11,677,002,855.10 euros
Number of ordinary shares (without nominal value) 15,203,122,583
Number of savings shares (without nominal value) 6,027,791,699
Number of TIM S.p.A. ordinary treasury shares 37,672,014
Number of TIM S.p.A. ordinary shares held by Telecom Italia Finance S.A. 126,082,374
Percentage of ordinary treasury shares held by the Group to total share capital 0.77%
Market capitalization (based on June 2017 average prices) 16,577 million euros
Regarding the trading of shares issued by Group companies on regulated markets, the ordinary and savings shares of TIM S.p.A. are listed in Italy (FTSE index), as well as the ordinary shares of INWIT S.p.A., whereas the ordinary shares of Tim Participações S.A. are listed in Brazil (BOVESPA index). The ordinary and savings shares of TIM S.p.A., and the ordinary shares of Tim Participações S.A. are also listed on the NYSE (New York Stock Exchange); trading occurs through ADS (American Depositary Shares) that respectively represent 10 ordinary shares and 10 savings shares of TIM S.p.A. and 5 ordinary shares of Tim Participações S.A..
SHAREHOLDERS
Composition of Telecom Italia S.p.A. shareholders at June 30, 2017 according to the Shareholders Book, supplemented by communications received and other available sources of information (ordinary shares):
There are no significant shareholders’ agreements for TIM pursuant to Article 122 of Italian Legislative Decree 58/1998.
MAJOR HOLDINGS IN SHARE CAPITAL
At June 30, 2017, taking into account the entries in the Shareholders Book, communications sent to Consob and to the Company pursuant to Italian Legislative Decree 58 of February 24, 1998, Article 120, and other available sources of information, the relevant holdings of TIM S.p.A.'s ordinary share capital are as follows: Holder Type of ownership Percentage of ownership Vivendi S.A. Direct 23.94% (*)
(*) Equity interest obtained following receipt of a notification by Vivendi S.A. pursuant to Article 152 octies, paragraph 7, of the Consob Issuer Regulations.
FOREIGN INSTITUTIONAL
INVESTORS58.13%OTHER
SHAREHOLDERS 13.09%
VIVENDI 23.94%
TIMGROUP1.08%
ITALIAN INSTITUTIONAL
INVESTORS3.76%

Interim Management Report at June 30, 2017
Information for Investors
51
Blackrock Inc. also notified Consob that, on November 15, 2016, as an asset management company, it indirectly held a quantity of ordinary shares equal to 3.10% of the total ordinary shares of TIM S.p.A. at June 30, 2017.
COMMON REPRESENTATIVES
• The special meeting of the savings shareholders held on June 16, 2016 renewed the appointment of Dario Trevisan as the common representative for three financial years, up to the approval of the financial statements for the year ended December 31, 2018.
• By decree of June 9, 2017, the Milan Court confirmed the appointment of Enrico Cotta Ramusino (already appointed by the decrees of April 11, 2014 and March 7, 2011) as the common representative of the bondholders for the “Telecom Italia S.p.A. 2002-2022 bonds at variable rates, open special series, reserved for subscription by employees of the TIM Group, in service or retired”, with a mandate for the three-year period 2017-2019.
• By decree of June 12, 2015, the Milan Court appointed Monica Iacoviello as the common representative of the bondholders for the "Telecom Italia S.p.A. 1,250,000,000 euros 5.375 percent. Notes due 2019" up to the approval of the 2017 Annual Report.
RATING AT JUNE 30, 2017
At June 30, 2017, the three rating agencies – Standard & Poor's, Moody's and Fitch Ratings – rated TIM as follows:
Rating Outlook STANDARD & POOR'S BB+ Stable
MOODY'S Ba1 Stable
FITCH RATINGS BBB- Stable
On July 12, 2017, the rating agency Standard & Poor's upgraded TIM S.p.A.'s outlook from "Stable" to "Positive".
WAIVER OF THE OBLIGATION TO PUBLISH DISCLOSURE DOCUMENTS FOR EXTRAORDINARY OPERATIONS
On January 17, 2013, the board of directors of TIM S.p.A. resolved to exercise the option, as per article 70 paragraph 8 and article 71 paragraph 1-bis of the Consob Regulation 11971/99, to waive the obligations to publish disclosure documents in the event of significant operations such as mergers, demergers, capital increases by means of the transfer of assets in kind, acquisitions and disposals.

Interim Management Report at June 30, 2017
Related Party Transactions 52
RELATED PARTY TRANSACTIONS In accordance with Article 5, paragraph 8 of Consob Regulation 17221 of March 12, 2010 concerning "related party transactions" and the subsequent Consob Resolution 17389 of June 23, 2010, no significant transactions were entered into in the first half of 2017 as defined by Article 4, paragraph 1, letter a) of the aforementioned regulation which had a major impact on the financial position or on the results of the TIM Group for the first half of 2017. Furthermore, there were no changes or developments regarding the related party transactions described in the 2016 Report on operations which had a significant effect on the financial position or on the results of the TIM Group in the first half of 2017. Related party transactions, when not dictated by specific laws, were conducted at arm's length. In addition, the transactions were carried out in accordance with an internal procedure that establishes the terms and timing for verification and monitoring. Up to May 4, 2017, the companies of the Generali group, Intesa Sanpaolo group, Mediobanca group and Telefonica group (shareholders of the company Telco) were also considered related parties, based on the provision of TIM's procedure for the management of related party transactions according to which it applies "also to the participants in significant shareholder agreements according to Article 122 of the Consolidated Law on Finance that govern the candidacy to the position of Director of the Company, where the majority of the Directors nominated have been drawn from the list submitted". The members of the Board of Directors of TIM in office up to May 4, 2017 had in fact been drawn from the list originally submitted by the shareholder Telco. With the reappointment of the Board of Directors this circumstance no longer applied and the scope of related parties through Directors was therefore amended. On May 3 and June 1, 2017, the Board of Directors of TIM approved several changes to the Procedure for the management of related party transactions, deciding, on a voluntary basis and therefore without any obligation, to treat Vivendi as if it was the parent, in accordance with the Consob Regulation. The process of identifying new entities that entered the scope of related parties essentially led to the identification of all the entities with which the Group has significant relationships. The full list is currently being completed. The new Procedure for the management of related party transactions is available for consultation at the website www.telecomitalia.com, “About Us” section – “Governance System” channel. The information on related parties required by Consob Communication DEM/6064293 of July 28, 2006 is presented in the financial statements and in the Note "Related party transactions" in the Half-year condensed consolidated financial statements at June 30, 2017 of the TIM Group.

Interim Management Report at June 30, 2017
Alternative Performance Measures 53
ALTERNATIVE PERFORMANCE MEASURES In this Half-year Financial Report at June 30, 2017 of the TIM Group, in addition to the conventional financial performance measures established by IFRS, certain alternative performance measures are presented for purposes of a better understanding of the trend of operations and financial condition. Such measures, which are also presented in other periodical financial reports (annual and interim) should, however, not be construed as a substitute for those required by IFRS. The alternative performance measures used are described below:
• EBITDA: this financial measure is used by TIM as the financial target in internal presentations (business plans) and in external presentations (to analysts and investors). It represents a useful unit of measurement for the evaluation of the operating performance of the Group (as a whole and at the Business Unit level), in addition to EBIT. These measures are calculated as follows:
Profit (loss) before tax from continuing operations
+ Finance expenses
- Finance income
+/- Other expenses (income) from investments
+/- Share of profits (losses) of associates and joint ventures accounted for using the equity method
EBIT - Operating profit (loss)
+/- Impairment losses (reversals) on non-current assets
+/- Losses (gains) on disposals of non-current assets
+ Depreciation and amortization
EBITDA - Operating profit (loss) before depreciation and amortization, Capital gains (losses) and Impairment reversals (losses) on non-current assets
• Organic change in Revenues, EBITDA and EBIT: these measures express changes (amount and/or percentage) in revenues, EBITDA and EBIT, excluding, where applicable, the effects of the change in the scope of consolidation and exchange differences. TIM believes that the presentation of the organic change in revenues, EBITDA and EBIT allows for a more complete and effective understanding of the operating performance of the Group (as a whole and at the Business Unit level). This method of presenting information is also used in presentations to analysts and investors. This Half-Year Financial Report provides a reconciliation between the "reported figure" and the "organic figure".
• EBITDA margin and EBIT margin: TIM believes that these margins represent useful indicators of the Group’s ability, as a whole and at Business Unit level, to generate profits from its revenues. In fact, EBITDA margin and EBIT margin measure the operating performance of an entity by analyzing the percentage of revenues that are converted, respectively, into EBITDA and EBIT. Such indicators are used by TIM in internal presentations (business plans) and in external presentations (to analysts and investors) in order to illustrate the results from operations also through the comparison of the operating results of the reporting period with those of the previous periods.
• Net Financial Debt: TIM believes that Net Financial Debt represents an accurate indicator of the Group's ability to meet its financial obligations. It is represented by Gross Financial Debt less Cash and Cash Equivalents and other Financial Assets. This Half-Year Financial Report includes tables showing the amounts taken from the statement of financial position and used to calculate the Net Financial Debt of the Group. To better represent the real performance of Net Financial Debt, in addition to the usual indicator (called "Net financial debt carrying amount"), "Adjusted net financial debt" is also shown, which excludes effects that are purely accounting and non-monetary in nature deriving from the fair value measurement of derivatives and related financial assets and liabilities.

Interim Management Report at June 30, 2017
Alternative Performance Measures 54
Net financial debt is calculated as follows:
+ Non-current financial liabilities
+ Current financial liabilities
+ Financial liabilities directly associated with Discontinued operations/Non-current assets held for sale
A) Gross financial debt
+ Non-current financial assets
+ Current financial assets
+ Financial assets relating to Discontinued operations/Non-current assets held for sale
B) Financial assets
C=(A - B) Net financial debt carrying amount
D) Reversal of fair value measurement of derivatives and related financial assets/liabilities
E=(C + D) Adjusted net financial debt

Interim Management Report at June 30, 2017
Sustainability 55
SUSTAINABILITY
In the past, environmental, social and governance issues were of interest to a limited community of stakeholders; now, increasingly, they are an essential condition for the prosperity of companies in the long term. Introducing and integrating social responsibility in business activities, in order to promote it as an opportunity to create value, is a strategic lever to strengthen the competitiveness of the company. To demonstrate the growing importance of sustainability issues, in January 2017 Legislative Decree n° 254 of December 30, 2016 came into force, which transposed Directive 2014/95/EU of the European Parliament1. The Decree takes the disclosure of diversity and non-financial information by businesses and large groups from being voluntary to mandatory as of the 2017 financial year. The Decree lists the topics companies are required to provide information about, in particular:
• environmental aspects, including the use of energy resources, water usage, CO2 emissions;
• social aspects;
• issues related to personnel management, including the actions taken to ensure gender equality and dialogue with social partners;
• respect for Human Rights and the actions taken to prevent violations and discriminatory conduct;
• the fight against active and passive corruption. The content of the Decree recognizes what is increasingly felt by the financial and non-financial community, the need for the thorough representation of company activities; in fact it provides further tools that allow stakeholders, including shareholders, to perceive the contribution that sustainability can make to both the financial results of the company and to the community in terms of social value. The TIM Group operates with the conviction that business activities must be conducted in a way that considers the expectations of stakeholders, in keeping with the principles established by internationally recognized standards. In defining and implementing its sustainability strategy and program, TIM is inspired by the guidelines issued by the main global guidance and standardization organizations in the field of Corporate Responsibility. TIM’s sustainability report, prepared using the triple bottom line approach2, has been prepared for almost 20 years and integrated into the consolidated financial statements from 2003 onwards. The adherence of the sustainability report to the GRI G43 standard, comprehensive version, enables TIM to be already compliant with Legislative Decree 254.
1 Directive 2014/95/EU of the European Parliament and of the Council of October 22, 2014, containing an amendment to Directive 2013/34/EU. The Directive concerns the disclosure of non-financial information and information on diversity by certain enterprises and certain large groups. 2 This approach, defined for the first time by John Elkington in 1994, provides for the economic-financial data to be represented together with the environmental and social results. 3 GRI: Global Reporting Initiative, the standard setter for sustainability issues. The comprehensive version is the most complete reporting option in terms of the indicators used.

Interim Management Report at June 30, 2017
Research & development and innovative services 56
RESEARCH & DEVELOPMENT AND INNOVATIVE SERVICES
As a result of the growing presence and importance of digitization in the lives of citizens, consumers and companies, technological and business innovation have become strategic for the market positioning and competitiveness of companies, particularly in the telecommunications sector. The Group, in consideration of this, has adopted a strategy that aims to:
• promote the internal innovation lines, focusing research on key aspects of the development of the fixed and mobile network moving towards the future 5G standards and ultrabroadband, and issues concerning service platforms and the new operations systems1.
• create initiatives such as Idea Sharing2, to promote innovation and creativity among employees;
• continue with “Open Innovation” projects and activities which permit osmosis between innovation within the Company and external sources of innovative ideas.
This context also encompasses the development of laboratories specifically open to industrial collaboration, in particular in the context of the Internet of Things (IoT), and the Joint Open Labs (JOL), set up through collaborations with Universities of excellence, and TIM #WCAP, TIM's Corporate Accelerator covering around 5 thousand square meters in Rome, Milan, Bologna and Catania, entirely dedicated to entrepreneurial open innovation. In terms of patents, 9 new ones were filed in the first half of 2017. In particular, 2 of these were created in close collaboration with the University of Pisa and the University of Genoa on specific Digital Home topics. Another initiative aimed at enhancing the world of inventions was held in Turin in March 2017: “Techshare Day 2017,” a day entirely dedicated to sharing technological knowledge with companies that want to introduce patent-protected forms of innovation resulting from research in their specific activities. For the JOL 2017 activities, focused on infrastructural issues and application solutions, specific research contracts are being finalized (16 with the Polytechnic University of Turin and 6 with the Polytechnic University of Milan) which commit around 660,000 euros, in addition to 30 of TIM's technical experts and 50 researchers from the Universities. With respect to the joint participation in projects funded as part of the European Programme Horizon 20203 a benefit of around one million euros is estimated in 2017 in the form of proceeds deriving from the activities of the JOL. Moreover, thanks to collaboration and exchange between TIM and the Polytechnic University of Turin, the latter has become one of the first “5G campuses” in Europe, a technology campus but also a Living Lab open to students, researchers and possible partners and vendors, thereby involving energies from all over Italy. Finally, in 2017 TIM #WCap strengthened its role as an innovation “tool”, in line with TIM's business strategy, completing the evolution route which led to the launch of the “Call for Partners” in May 2017 for the selection of ready-to-market start-ups focused on specific areas of particular interest to the Company: IOT Consumer; Payment & Digital Identity, Industry 4.0, Cyber Security for Business customers. The start-ups selected will gain access to the Co-Creation Programme aimed at the design and implementation of Proof of Concept (POC) of the digital solutions proposed, with the involvement of the Business Units. The aim, therefore, is primarily to speed up the integration of innovative digital solutions in TIM’s offer or technology. With reference to technological innovation, the following are the projects most worthy of note:
• support for the launch of numerous LTE Advanced services at 225 Mbps and 300 Mbps and the first “in-the-field” testing of LTE Advanced services with speeds of up to 700 Mbps in download and up to 75 Mbps in upload, a new milestone following on from the European record achieved for the commercial launch of 4.5G technology of up to 500 Mbps. The service with speeds of up to 700 Mbps will be made available to TIM customers in the coming months, with the arrival of enabled smartphones and the upgrading of the 4.5G network currently underway in the principal cities;
1 “Operations” are defined as the set of processes that help to create and deliver value to customers, in general through a mixture of products and services. 2 Idea Sharing is an internal crowdsourcing project aimed at discovering the talent and creativity of TIM's employees to stimulate and promote innovation. 3 Horizon 2020 (H2020) is the Framework Programme of the European Union (EU) for research and innovation relating to the period 2014-2020.

Interim Management Report at June 30, 2017
Research & development and innovative services 57
• support for the launch of 200M/20M offers on enhanced VDSL and the 1G/100M offer on FTTH;
• Smart Farm: this is Olivetti’s solution which enables agricultural enterprises to improve the quality of their harvest and encourage increased profits by exploiting the most innovative IoT technologies. Smart Farm is based on an in-cloud platform that offers companies a complete system of tools and information to accurately monitor the factors that help to determine the health of plants, irrigation requirements and climatic conditions. Through a network of in-the-field sensors, data is collected and transmitted to an application, which is easy to use and accessible through a web interface which enables all the parameters of interest to be kept under control. This makes it possible to manage the activities as effectively as possible and to intervene in a prompt and targeted way where necessary;
• Smart Energy: is an added value service for customers who consume high amounts of electricity and are connected to low voltage which allows them to know their electricity consumption in real time, receive suggestions to optimize their consumption, reduce their electricity bill and choose the best offer available. Moreover, if there is a photovoltaic plant, the service helps the customer to optimize the use and return, and to control its effectiveness over time. The main characteristics of the service are simple DIY (do it yourself) installation and the ability to carry out an automatic energy audit through consumption behavior indicators and social comparisons with similar users.
• Energy Aggregation: enables management of an aggregate of the energy resources of industrial customers and their monetization by providing electricity services remunerated on the Dispatching Services Market1. It is based on an ICT platform equipped with the appropriate interfaces to receive dispatching orders from Terna and to execute them on an aggregate of energy resources, as well as to monitor the progress of the orders and measure the electrical flexibility capacity at any given time;
• Smart Retail: in early 2017 TIM set up the first 50 Smart Retail solutions distributed throughout Italy, equipping retail outlets with BLE (Bluetooth Low Energy) beacon technology, small devices installed in theme-based corners (e.g. TIM Vision area, Apple corner, etc.) which are detected by today’s smartphones. Customers who have the MyTIM Mobile App are then guided during their visit to the shop, receiving welcome/goodbye messages (push notifications) and information on their position within the retail outlet. The solution goes beyond the physical confines of the shop, extending the customer's engagement to the geographic area in the immediate vicinity of the shop (geofence area) achieved by using proximity marketing cases: customers with the MyTIM Mobile App, when they are in the vicinity of Smart Retail or a shop that has activated a geofencing campaign, receive a message on their smartphone inviting them to visit the nearest TIM center to activate a promotional offer with particularly advantageous conditions. This idea is part of the company’s New Concept Store project to renew retail outlets in terms of both their physical layout and technological equipment.
INDUSTRY 4.0
The innovations brought by Industry 4.0 are often represented as the fourth industrial revolution. The four key technological principles of Industry 4.0 for the Smart Factory, as defined by the promoters of this initiative (a working group of the German government set up during the Hannover Fair), are:
• Interoperability, seen as the capacity to communicate between smart devices, sensors and people in a transparent and standard way through the Internet of Things and of People (also known as the Internet of Everything);
• Information transparency, seen as the capacity to create a cybernetic image of the Factory, virtual and updated in real time, also enriched with information obtained from smart devices, sensors, legacy databases and the people who work in the factory;
• Technical Assistance, seen as the aggregation of information even using augmented reality techniques to support technicians who must resolve problems and make urgent interventions inside the Factory;
1 The quantity of energy required by the set of consumers (families and companies) must be produced in real time, and must be transmitted so that supply and demand are always balanced, thereby ensuring the continuity and reliability of the supply of service. Management of these energy flows on the network is called dispatching.

Interim Management Report at June 30, 2017
Research & development and innovative services 58
• Remote control and the decentralization of decisions which can also be taken automatically by the CPS at the premises, but with supervision from a control room not necessarily located in the same building or in the same geographic area.
Case studies linked to Industry 4.0 under development are represented by the introduction of Internet technologies and IoT within the production processes of the manufacturing industry. They are essentially based on CPS (Cyber-Physical Systems), that is smart devices used in production processes seen as the evolution of present-day and widely used PLC (Programmable Logic Controllers)1 . The aim is to create a smart factory, modular and with islands, which can be remotely controlled and represented through a virtual image. Through the IoT the CPS (evolution of the PLC) communicate and cooperate with each other and with human beings in real time and, again through the Internet (the Future Internet as defined for example in the FI-PPP Program2 of the European Commission), they present services both to departments within the manufacturing industry and to external organizations.
Immersive Technologies
Immersive technologies, based on environments created around the user in which the latter is literally “immersed,” linked to virtual, augmented and mixed reality, are becoming increasingly pervasive and in the near future may represent a new revolutionary computing platform, just as PCs and smartphones were in the past. The panorama of immersive technologies is broken down into different areas. Virtual Reality (VR), the aim of which is to substitute some sense perceptions (first and foremost sight and hearing) with digital content and simulations that are so realistic they convince the user at a subconscious level of the credibility of the virtual world in which they are immersed. Using appropriate VR headsets (HMD – Head Mounted Display) the user's visual field is entirely replaced with digitally processed images which accurately follow the movements of the user’s head. The user has the sensation of truly finding themselves in a different place, from a simulation of a space station cabin to a fantastic cartoon or a documentary on far-flung locations. Instead, we are talking about Augmented and Mixed Reality (AR and MR) when the reality perceived by the user, instead of being completely replaced by a virtual world, is integrated with information and digital content. Already available for some time through applications for smartphones and tablets, these technologies now allow the direct overlapping of content in the user's visual field through the use of particular eyeglasses. Thanks to the widespread availability of processing power offered by present-day devices and the lower costs of some components, such as LCD displays, for example, these technologies, until now reserved for niche markets and industrial scopes, are now accessible to the consumer market and will soon be part of our daily lives. TIM is active in the research and development of solutions that use Virtual and Augmented Reality in many areas:
• Social VR, Interpersonal Communication, Collaboration: from an initial analysis VR might seem to be a technology that isolates people, but in fact it has the potential to be the most social platform ever tested. Thanks to integration with the network, the virtual worlds are not solitary experiences but places in which to meet real people with whom to interact and chat in the same natural way (or almost) one would in real life. Any application, game or content, can become an experience to share with friends. Applications relating to social networking, interpersonal communication, and company collaboration abound and they are all there to be explored.
• Digital entertainment: many of the main VR and AR applications will be linked, above all in the initial phase, to the entertainment area. Immersive technologies completely revolutionize present-day
1 The Programmable Logic Controller (PLC) is a controller for industry originally specialized in managing or controlling industrial processes. 2 Future Internet Public-Private Partnership Programme.

Interim Management Report at June 30, 2017
Research & development and innovative services 59
storytelling tools and will give rise to new and unexpected forms of artistic expression. The streaming of 360° immersive videos in 3D and high quality is a challenging matter from a technological viewpoint, and the potential offered by TIM’s 4G LTE networks and the future innovations of the mobile wireless network will play a key role in making this content available everywhere.
• Culture and eTourism: the potential of these technologies linked to the world of education, culture and tourism is vast. Think for example of the possibility of bringing and entire class of students to see the pyramids in Egypt, the surface of Mars and the barrier reef, in just one day. The bHERE framework, which arose from the development of this application, will allow the creation of virtual museum experiences and narration of this type which, in the future, will also be available in VR.
• VR eCommerce: immersive technologies will make it possible to offer the entire commodity of present-day electronic commerce solutions combined with the advantages of visiting a real shop: the possibility of being able to view and touch the products (1:1 scale replicas) and interact with a real shop assistant in a virtual environment, even eliminating annoying queues.

Interim Management Report at June 30, 2017
Environmental protection 60
ENVIRONMENTAL PROTECTION
Energy efficiency
Actions aimed at improving the efficiency of technological systems and reducing electricity consumption, consequently reducing greenhouse gas emissions, are always an integral part of TIM’s environmental strategy. 2017 is marked by significant growth in technological developments in the Network context, leading to a substantial increase in energy consumption in both fixed and mobile, estimated for this year at around 200 GWh. Therefore, over the course of the first half year, further new adaptation and efficiency-improvement measures for the structures of fixed network exchanges were assessed and prepared, to be carried out in the second half of the year with the aim of offsetting the aforementioned demand and at the same time reducing the increase in consumption. All the sites not affected by the efficiency-improvement plans already launched (disposal and decommissioning of industrial buildings) were taken into consideration. Actions to reduce consumption in other areas (data centre rooms and offices) were also analysed. The main projects already underway or planned for the months ahead are described below.
• Fixed network – Reengineering of Exchanges: planned adaptation work on both the power supply and air
conditioning of the infrastructure of the exchanges is in the deployment phase, aimed at increasing energy efficiency, reducing the active electrical power and minimizing the reactive electrical power1. Plans have been conceived to carry out work, in the second half of 2017, on the 100 exchanges (SGUs2 and POPs3) which consume the most energy (out of a total of 10,500 exchanges) which indicatively represent 11% of the total consumption of the exchanges, amounting to around 159 GWh per year (105 GWh telecommunications equipment and 54 GWh infrastructure) with a savings target, when fully operational, of around 21 GWh.
– Revamping Equipment: a set of streamlining, compactness and optimization measures are in the deployment phase, aimed at reducing energy consumption in the SGU exchanges in Metropolitan areas with initial estimated savings, when fully operational, of around 4 GWh.
– Summer Efficiency Trial: in order to handle situations of abnormal consumption, the launch of summer monitoring has been planned for 80 fixed network exchanges.
• Data Centre – Room cooling optimization: reducing consumption linked to the cooling of rooms is planned
through the selective switching off of machines by installing a particular solution for the dynamic optimization of cooling mechanisms already tested in previous years. In the initial phase work will be carried out at a data center with significant consumption in the Rome area, obtaining an estimated annual saving of over 1 GWh.
– Eco4Cloud solution: the plan is to expand the number of machines set up with real-time controlled and dynamic switching off of servers in 'farms in the cloud4' based on VMware virtualization5, with optimization of the use of physical resources (CPU and RAM) and the
1 The 'active' or real power is that actually consumed by a load, while the 'reactive' power provides no consumption values as it is an exchange energy between the power line and the inductive load (motor, fluorescent lamps, etc.). Reducing the reactive power signifies, in practical terms, increasing the system’s capacity to use energy to perform useful work by reducing the heating of the load and the cables, which cause energy losses due to the Joule effect. 2 SGUs, or Urban Group Stages, are Area Exchanges that represent level 2 of TIM's switching hierarchy and are positioned between the Group Transit Stage (SGT, intercity network) and the Main Exchanges (MEs, which include the users through the distribution network). 3 In telecommunications the POP, or Point of Presence, is a network access point (router) along the access network, provided by an Internet Service Provider (ISP), capable of routing traffic to the end-users connected to it. 4 A 'farm in the cloud' is a 'farm' or a series of servers positioned in a single area in order to centralize the management, maintenance and security thereof. The various farms are distributed in the cloud. 5 This involves a series of software packages developed by VMware Inc. which allow several operating systems to run in a virtual environment. This makes it possible to implement, on a platform with a Windows or Linux operating system and the relevant hardware, a number “n” of other virtual machines with different operating systems.

Interim Management Report at June 30, 2017
Environmental protection 61
consequent energy savings. The solution, the efficiency of which has already been tested, leads to the better operation of IT farms in terms of performance and 'capacity planning', enabling optimization of the physical development of IT platforms following increases to the processing load required.
• Offices – Energy efficiency at sites used as offices through the Building Energy Management System
(BEMS), namely a building management system, with a dynamic approach, which aims to achieve lower energy consumption during operation and for the entire life cycle of the building-plant system1; implementation is planned for 20 more energy-intensive offices which are not subject to divestment in the next 3 years.
As anticipated, decommissioning initiatives for 'obsolete' technological platforms already launched in previous years also continued in the first half of 2017, mainly with regard to the following projects:
– PSTN2: the project involves the migration of traditional accesses (except for ISDN accesses) to VoIP platforms. This results in reduced energy consumption, occupation of space and maintenance, and in general in the overcoming of the obsolescence of the traditional plants. The 2017 plan includes switching off 3.6 million ports with anticipated progress of over 50% by June with respect to the plan.
– SuperSGU: the initiative plans to make the fixed network equipment more compact, concentrating the functions of some SGUs on a reduced number of 'SuperSGUs' with direct benefits in terms of reducing energy consumption. The 2017 plan includes work on 25 SGUs with anticipated progress of over 50% by June with respect to the plan.
– ATM3: the project involves optimizing data accesses with the gradual disposal of ATM devices and a shift to IP technology devices. This results in reduced energy consumption and in general the overcoming of the obsolescence of the traditional plants. The 2017 plan includes switching off 1.3 million ports with anticipated progress of over 30% by June with respect to the plan.
1 See also standard UNI EN 15232 - 'Energy Performance of Buildings - Impact of building automation, control and technical building management' which defines the methods for assessing the energy savings that can be achieved in buildings that use technologies for the management and automatic control of the technological systems and the electricity system. 2 PSTN is the acronym for Public Switched Telephone Network; it is also known as RTG (General Telephone Network) or switched public telephone network. 3 ATM, or Asynchronous Transfer Mode, identifies a series of network protocols developed from the '90s onwards capable of offering an integrated single telecommunications service which is able to combine voice services with various types of data services.

Interim Management Report at June 30, 2017
TIM People 62
TIM PEOPLE
The evolution of the TLC industry towards Digital Telco models, the technological evolution of infrastructure and market challenges linked to the development of new digital and innovative services are all parts of the framework of an employment market undergoing profound transformation. The Digital Transformation, which TIM is working on, is pervasive and forces us to rethink processes and services and to develop new skills and professionals who are able to make the best use of the new opportunities. At TIM in particular, the move towards a business model centered around Digital Innovation, the consequent need for a reshuffling of skills in line with the expanding range of offers and market positioning, and the extension of working life are the challenges that have the most impact on the definition of the new HR strategy, launched last year and currently on course for full application with particular emphasis on the following priority intervention areas: Efficiency: in the first half of 2017 there was a continuation of actions aimed at rationalizing costs, simplifying the organizational structure and processes and improving productivity indexes. Welfare: the reference model has been redesigned with a renewed proposal of services with particular attention to the 'work longevity' phenomenon. The various actions planned include those to support the enhancement of professional characteristics functional for the increase of Company's value irrespective of age and following a logic of equality, inclusion and sustainability. Skills: a significant number of professional re-training programs are in progress (job center), with particular attention to the digitization of professions; individual professional and managerial development plans to ensure the alignment of skills profiles with the new strategic direction.
Development Model
Compared to last year's, TIM's development model has been further refined in terms of individual components in order to support people in the various phases of their professional path within the company. In particular, the first half saw the continuation of activities related to onboarding programs which involved new graduates and junior professionals already working at the Company, in order, amongst other things, to further support them in their professional career in keeping with the evolution of the business. With respect to the other evaluation processes - Performance, Motivation and Knowledge Review - which constitute the primary source for the construction of development plans 'open to all' directed at the entire Company population, the following activities were carried out:
• Performance: in February the 'choice of evaluators' phase was carried out by the persons responsible for the evaluation according to multirater logic; in March there was an evaluation phase involving everyone in the Group; the feedback phase was then initiated in April (starting with the MBO1 beneficiaries) which concluded for the entire Company population in the month of June.
• Motivation Review: a new evaluation process aimed at detecting the energy people express in their work activities. In February the testing phase was initiated for the scientific validation of the tool; four companies in the Group are involved (TCC, Sparkle, HRS, INWIT).
• Knowledge Review: in May the planning of the critical knowledge assessment process was completed, the results of which will constitute the basis for defining development plans for Professional Leadership aimed at recognizing Knowledge Holders as possessors of strategic know-how for the current and future business of the Company.
1 Management by Objectives
Interim Management Report at June 30, 2017
TIM People 63
Finally, in the first half of the year, an overall review of the instrumentation for the Assessment of potential processes was carried out and the relative evaluation activities were started, aiming to define the development plans for Managerial Leadership.
Training
Continuing on the path of the enhancement and development of in-house expertise, which started in July 2016, the skills development strategy is outlined through the following main pillars:
• Professional re-training and enhancement
• Development of the managerial profile
• Evolution and digitization of skills
• Individual development plans
In keeping with these drivers, the consolidation of the TIM Academy and Development Model continues, in order to ensure tools and methodologies that can support employees at this delicate time of transformation. The training activities are divided into four macro-categories, each of which entails several main activities carried out in the first half. Management Education: training aimed at managers is essential to accelerate company turnaround and ensure the implementation of the 2017-2019 strategic plan. A Management Education course for 2017/2018 has been established, which will involve a total of 700 managers, offering targeted programs differentiated on the basis of the complexity of the roles managed by the participants. In June the planning was completed and the first programs are in the launch phase. The plan, developed in blended mode, includes: webinar sessions, online coaching sessions, bite-size training and video-talks, experimental laboratories, workshops and seminars on strategic topics with key speakers. Development of role-based and specialized skills and new capabilities: training to develop role-based and specialized skills, as well as new capabilities, occupies a central role in TIM’s training investments plan. The main projects launched in the first half are:
• “Open Access on-the-field technicians skills improvement”: blended training for around 9,000 in-the-field technicians aimed at bridging the gaps in the technical skills that emerged from the skill assessment.
• 'Maintenance and Development of Corporate Certifications': measures to enable participation in tenders and contracts in the private sector and in Central and Local Public Administration.
• 'Big Data Transformation': development path for 'Big Data' skills to support the transformation underway at TIM.
• 'Field Management Training': management training for 52 Coordinator Managers for Integrated Access Network Assurance & Delivery (Field Force) in the Open Access area.
Development and empowerment The organizational changes and the evolution of business-linked skills require new tools to support the change and the awareness of TIM’s people. 'The Skills Model' e-learning course has been created, which aims to increase awareness and promote the culture needed to guide the behavior of the Group's personnel. Institutional and corporate culture Institutional and mandatory training, involving the entire population of the Company, aims to raise awareness and disseminate knowledge of the content required by the legal formalities and support the transformation of the organizational culture. The main projects of the first half year are:
• New Equivalence Model (NEM): dedicated to staff in the commercial departments to facilitate the transition towards the New Model.
• Safety: in relation to the obligations deriving from current regulations, around 100 senior managers are involved in the 'Sicuri Adesso' (Safe Now) training project.
Interim Management Report at June 30, 2017
TIM People 64
• Anti-corruption and whistleblowing: a digital learning module has been created, which involves the entire population of the company and the Group in order to encourage the adoption of transparency, correctness and behaviors in good faith by the whole Company.
Job Centre and the development of in-house expertise
In relation to the re-training paths in progress, professional re-skilling activities continued as part of the Job Centre Project, which pursues the following main objectives:
• re-allocating the people currently assigned to support activities with a direct impact on the business and on customers;
• provide a professional qualification for people to be re-employed in activities previously outsourced and now brought back in-house;
• represent a professional opportunity which allows the company to open up to the market more effectively and efficiently, with energy, skills and professionalism, while also allowing people to maintain an updated professional profile.
At the end of June more than 2,700 people have been envolved in the Job Center.
HR Partnerships
In 2017 we implemented the new model of relations with the educational ecosystem (academic world, schools, business schools, institutional and social entities) pro-actively collaborating on the definition of training projects, the teaching of the topics specific to our business and the implementation of specific School-Work Alternation courses with technical institutions and schools from across the country.
The aim of the new partnership model is to generate value in the short-medium term for the organization, on the one hand, through the blending of different knowledge; and for young people, on the other, making our know-how available to them.
People Caring
TIM believes that being an inclusive company, one that is able to take care of its people and to create solutions that put everyone in a position to give the best of themselves, is the basis for economic and social sustainability. In this context, 2017 also saw numerous initiatives launched in various and diverse areas, all connected by the common thread of placing people at the center, which are encompassed in the following four macro areas:
• Work-life balance and Family Care (including daycare centers, summer camps for employees’ children, commute management, free tickets and the testing of agile working);
• Volunteering initiatives by employees (including blood donation days organized at Company offices, stands hosted at Company offices to sell charity products and participate in charitable activities);
• Equity & Inclusion Management (which include disability management and longevity management initiatives);
• Promotion and support for people and their well-being (for example the provision of financial assistance to support employees in particular financial difficulties; the provision of scholarships, for visits abroad and the reimbursement of university taxes; and for enrolment in the first year of single-cycle university programs and selected master's degrees for worthy children of employees).
Health and Safety
During the first half, the main areas of action in the field of health and safety at work, related to the re-modelling of the process of identifying and assessing risks in keeping with TIM's shift to a 'multi-employer' model, which resulted in the reviewing of the organizational and procedural framework linked to the management of prevention aspects.

Interim Management Report at June 30, 2017
TIM People 65
Campaigns to monitor physical agents continued by means of tools specific to the measurement of vibrations, noise and electromagnetic fields. Training activities for all company employees were planned and launched, in particular for operational technical staff increasingly affected by the application of new technologies and involved in new operating scenarios. As part of the information and awareness-raising initiatives to strengthen the safety culture, planning started for a video on how to handle emergencies in the event of earthquakes. With reference to the monitoring of accidents, in the first half the careful analysis of events and the potential identification of corrective actions continued; for greater synergy, there was stronger direct involvement of the staff affected. A number of digital projects are also being developed in collaboration with technical personnel; these are also aimed at the application of new technologies in the Safety area.
Industrial relations
In the first half, in keeping with the Industrial Relations model shaped by seeking dialogue and a constructive comparison of ideas, and in compliance with contractual structures, information and discussion sessions with trade unions continued at both national and regional level. At national level, on several occasions TIM outlined the strategic positioning of the Company in relation to the main economic and production indicators and the consequent need to identify measures aimed at supporting the recovery of competitiveness and profitability as well as improving the quality of services, in order to safeguard employment levels and the company scope. In this context, in February the Company issued a Company Regulation which innovates and modernizes some fundamental aspects of the employment relationship, including, inter alia, with respect to remuneration, specific individual incentive measures for technical staff. This Regulation was then subsequently refined and improved, accepting the proposals and suggestions of the trade union organizations. In June, the Company and the Trade Union reached an understanding that defines the structure of the 2017/2019 Performance Bonus for companies of the TIM Group. The Bonus takes a new approach: it provides for equal incentive systems for all, from managers to technical personnel, and they are based on the results achieved with respect to the goals set. The agreement, which positively concludes the negotiations started last month with the trade union, provides for the performance bonus to be comprised of:
• a “basic” bonus, which uses the Group EBITDA as an indicator;
• a “production” bonus, which uses the revenues from group services net of product revenues as an indicator;
• an “improvement” bonus which uses the Customer Satisfaction Index as an indicator;
• a “department” bonus linked to the departmental targets. The objectives, changed by managerial incentive systems, recognize the contribution of all workers to the achievement of the forecast economic and production results. The average value of the Bonus for TIM was also defined (1,300 euros per year), correlated and commensurate to the achievement of the goals set. The payout will concern all employees, including those with apprenticeship and fixed-term contracts, but the bonus will be awarded upon achievement, first of all, of the measure set for the Group EBITDA indicator. The parties have also provided for the Welfare option, according to which people may choose whether to receive all or a part of the bonus in welfare services, benefiting from full tax relief. The list of services

Interim Management Report at June 30, 2017
TIM People 66
includes, inter alia, daycare centers, taxes and schools books, elderly care, healthcare costs, pension funds, loans, shopping vouchers, sports and free time which are only a part of the welfare capital, in which TIM invests a total of over 100 million euros each year. A consultancy body has been set up to manage the agreement, which will be notified of the goals each year, derived from the budget process, in keeping with the Business Plan. With respect to the trend reversal of the Company's main economic and profit indicators, recorded in the second half of 2016, TIM paid its employees a contribution made on the basis of overall efficiency recovery and improvement of the Company’s economic performance. In this sense TIM’s people were paid a One-off Bonus, diversified according to their grade. Appreciation was also shown to personnel of the Group's other companies - to whom the Telecommunications Collective Employment Agreement applies - with the agreement on the Performance Bonus which expired in 2016.

TIM GROUP HALF-YEAR CONDENSED FINANCIAL STATEMENTS AT JUNE 30, 2017

CONTENTS
TIM GROUP HALF-YEAR CONDENSED CONSOLIDATED FINANCIAL STATEMENTS AT JUNE 30, 2017 Consolidated Statements of Financial Position ____________________ 69 Separate Consolidated Income Statements _______________________ 71 Consolidated Statements of Comprehensive Income _______________ 72 Consolidated Statements of Changes in Equity ____________________ 73 Consolidated Statements of Cash Flows __________________________ 74
Note 1 Form, content and other general information ______________________________________ 76 Note 2 Accounting policies __________________________________________________________ 79 Note 3 Scope of consolidation ________________________________________________________ 81 Note 4 Goodwill ___________________________________________________________________ 83 Note 5 Intangible assets with a finite useful life __________________________________________ 84 Note 6 Tangible assets (owned and under finance leases) _________________________________ 85 Note 7 Investments ________________________________________________________________ 87 Note 8 Financial assets (non-current and current) ________________________________________ 88 Note 9 Trade and miscellaneous receivables and other current assets _______________________ 90 Note 10 Equity ____________________________________________________________________ 92 Note 11 Financial liabilities (non-current and current) ____________________________________ 94 Note 12 Net financial debt __________________________________________________________ 101 Note 13 Derivatives _______________________________________________________________ 102 Note 14 Supplementary disclosures on financial instruments _____________________________ 103 Note 15 Employee benefits _________________________________________________________ 105 Note 16 Provisions ________________________________________________________________ 106 Note 17 Trade and miscellaneous payables and other current liabilities _____________________ 107 Note 18 Contingent liabilities, other information, commitments and guarantees ______________ 108 Note 19 Finance income and finance expenses_________________________________________ 115 Note 20 Profit (loss) for the period ___________________________________________________ 118 Note 21 Earnings per share _________________________________________________________ 119 Note 22 Segment reporting _________________________________________________________ 122 Note 23 Related party transactions __________________________________________________ 125 Note 24 Equity compensation plans __________________________________________________ 139 Note 25 Significant non-recurring events and transactions________________________________ 141 Note 26 Positions or transactions resulting from atypical and/or unusual operations __________ 143 Note 27 Other information __________________________________________________________ 143 Note 28 Events subsequent to June 30, 2017 __________________________________________ 145 Note 29 List of companies of the TIM Group ___________________________________________ 146

TIM Group Half-year Condensed Consolidated Financial Statements at June 30, 2017 Consolidated Statements of Financial Position 69
CONSOLIDATED STATEMENTS OF FINANCIAL POSITION
Assets
(millions of euros) note 6/30/2017 of which
related
parties
12/31/2016 of which
related
parties
Non-current assets
Intangible assets
Goodwill 4) 29,511 29,612
Intangible assets with a finite useful life 5) 6,594 6,951
36,105 36,563
Tangible assets 6)
Property, plant and equipment owned 13,671 13,947
Assets held under finance leases 2,371 2,413
16,042 16,360
Other non-current assets
Investments in associates and joint ventures
accounted for using the equity method 7) 17 18
Other investments 7) 48 46
Non-current financial assets 8) 2,185 2,698 532
Miscellaneous receivables and other non-current
assets 2,324 2,222
Deferred tax assets 525 877
5,099 5,861
Total Non-current assets (a) 57,246 58,784
Current assets
Inventories 314 270
Trade and miscellaneous receivables and other current assets 9) 5,617 15 5,426 136
Current income tax receivables 45 94
Current financial assets 8)
Securities other than investments, financial
receivables and other current financial assets 1,732 5 1,908 132
Cash and cash equivalents 4,086 3,964 621
5,818 5 5,872 753
Current assets sub-total 11,794 11,662
Discontinued operations/Non-current assets held for sale − −
Total Current assets (b) 11,794 11,662
Total Assets (a+b) 69,040 70,446

TIM Group Half-year Condensed Consolidated Financial Statements at June 30, 2017 Consolidated Statements of Financial Position 70
Equity and Liabilities
(millions of euros) note 6/30/2017 of which
related
parties
12/31/2016 of which
related
parties
Equity 10)
Share capital issued 11,677 11,677
less: Treasury shares (90) (90)
Share capital 11,587 11,587
Additional paid-in capital 2,094 2,094
Other reserves and retained earnings (accumulated
losses), including profit (loss) for the period 7,723 7,526
Equity attributable to Owners of the Parent 21,404 21,207
Non-controlling interests 2,215 2,346
Total Equity (c) 23,619 23,553
Non-current liabilities
Non-current financial liabilities 11) 28,887 − 30,469 912
Employee benefits 15) 1,336 1,355
Deferred tax liabilities 323 293
Provisions 16) 813 830
Miscellaneous payables and other non-current
liabilities 1,594 − 1,607 2
Total Non-current liabilities (d) 32,953 34,554
Current liabilities
Current financial liabilities 11) 4,844 − 4,056 133
Trade and miscellaneous payables and other current
liabilities 17) 7,056 76 7,646 263
Current income tax payables 568 637
Current liabilities sub-total 12,468 12,339
Liabilities directly associated with Discontinued
operations/Non-current assets held for sale − −
Total Current Liabilities (e) 12,468 12,339
Total Liabilities (f=d+e) 45,421 46,893
Total Equity and Liabilities (c+f) 69,040 70,446

TIM Group Half-year Condensed Consolidated Financial Statements at June 30, 2017 Separate Consolidated Income Statements 71
SEPARATE CONSOLIDATED INCOME STATEMENTS note 1st Half of which 1st Half of which
(millions of euros) 2017 related
parties 2016 related
parties
Revenues 9,772 118 9,096 164
Other income 217 7 107 2
Total operating revenues and other income 9,989 9,203
Acquisition of goods and services (4,136) (99) (3,783) (110)
Employee benefits expenses (1,530) (54) (1,551) (66)
Other operating expenses (576) (501)
Change in inventories 50 33
Internally generated assets 317 325
Operating profit before depreciation and
amortization, capital gains (losses) and impairment
reversals (losses) on non-current assets (EBITDA) 4,114 3,726
of which: impact of non-recurring items 25) (95) (91)
Depreciation and amortization (2,249) (2,047)
Gains/(losses) on disposals of non-current assets 6 13
Impairment reversals (losses) on non-current assets − (5)
Operating profit (loss) (EBIT) 1,871 1,687
of which: impact of non-recurring items 25) (96) (82)
Share of profits (losses) of associates and joint
ventures accounted for using the equity method (1) (2)
Other income (expenses) from investments (19) 7
Finance income 19) 1,110 37 2,012 60
Finance expenses 19) (1,850) (40) (2,157) (67)
Profit (loss) before tax from continuing operations 1,111 1,547
of which: impact of non-recurring items 25) (110) (93)
Income tax expense (457) (489)
Profit (loss) from continuing operations 654 1,058
Profit (loss) from Discontinued operations/Non-current
assets held for sale − 47 9
Profit (loss) for the period 20) 654 1,105
of which: impact of non-recurring items 25) (173) (78)
Attributable to:
Owners of the Parent 596 1,018
Non-controlling interests 58 87 (euros) 1st Half 1st Half
2017 2016
Earnings per share: 21)
Earnings per share (Basic)
Ordinary Share 0.03 0.05
Savings Share 0.04 0.06
of which:
from Continuing operations attributable to Owners of the Parent
Ordinary Share 0.03 0.05
Savings Share 0.04 0.06
Earnings per share (Diluted)
Ordinary Share 0.03 0.03
Savings Share 0.04 0.04
of which:
from Continuing operations attributable to Owners of the Parent
Ordinary Share 0.03 0.03
Savings Share 0.04 0.04

TIM Group Half-year Condensed Consolidated Financial Statements at June 30, 2017 Consolidated Statements of Comprehensive Income 72
CONSOLIDATED STATEMENTS OF COMPREHENSIVE INCOME
Note 10
(millions of euros) 1st Half 1st Half
2017 2016
Profit (loss) for the period (a) 654 1,105
Other components of the Consolidated Statements of Comprehensive
Income
Other components that subsequently will not be reclassified in the
Separate Consolidated Income Statements
Remeasurements of employee defined benefit plans (IAS 19):
Actuarial gains (losses) 33 (118)
Income tax effect (8) 32
(b) 25 (86)
Share of other profits (losses) of associates and joint ventures accounted
for using the equity method:
Profit (loss) − −
Income tax effect − −
(c) − −
Total other components that subsequently will not be reclassified in the
Separate Consolidated Income Statements (d=b+c) 25 (86)
Other components that subsequently will be reclassified in the Separate
Consolidated Income Statements
Available-for-sale financial assets:
Profit (loss) from fair value adjustments 34 76
Loss (profit) transferred to the Separate Consolidated Income Statements (37) (69)
Income tax effect 2 (4)
(e) (1) 3
Hedging instruments:
Profit (loss) from fair value adjustments (331) (327)
Loss (profit) transferred to the Separate Consolidated Income Statements 497 245
Income tax effect (43) (2)
(f) 123 (84)
Exchange differences on translating foreign operations:
Profit (loss) on translating foreign operations (551) 618
Loss (profit) on translating foreign operations transferred to the Separate
Consolidated Income Statements 19 304
Income tax effect − −
(g) (532) 922
Share of other profits (losses) of associates and joint ventures accounted
for using the equity method:
Profit (loss) − −
Loss (profit) transferred to the Separate Consolidated Income Statements − −
Income tax effect − −
(h) − −
Total other components that subsequently will be reclassified to the
Separate Consolidated Income Statements (i=e+f+g+h) (410) 841
Total other components of the Consolidated Statements of
Comprehensive Income (k=d+i) (385) 755
Total comprehensive income (loss) for the period (a+k) 269 1,860
Attributable to:
Owners of the Parent 367 1,726
Non-controlling interests (98) 134

TIM Group Half-year Condensed Consolidated Financial Statements at June 30, 2017 Consolidated Statements of Changes in Equity 73
CONSOLIDATED STATEMENTS OF CHANGES IN EQUITY
Changes from January 1, 2016 to June 30, 2016
Equity attributable to Owners of the Parent
(millions of euros) Share
capital
Additional
paid-in
capital
Reserve for
available-for-
sale financial
assets
Reserve for
cash flow
hedges
Reserve for
exchange
differences
on
translating
foreign
operations
Reserve for
remeasurem
ents of
employee
defined
benefit plans
(IAS 19)
Share of
other
profits
(losses) of
associates
and joint
ventures
accounted
for using
the equity
method
Other
reserves and
retained
earnings
(accumulated
losses),
including
profit (loss)
for the period
Total Non-controlling
interests
Total
equity
Balance at December 31,
2015 10,650 1,731 32 (249) (1,459) (87) − 6,992 17,610 3,723 21,333
Correction due to errors 46 (102) (56) (28) (84)
Adjusted Balance at December 31, 2015 10,650 1,731 32 (249) (1,413) (87) − 6,890 17,554 3,695 21,249
Changes in equity during the
period:
Dividends approved (166) (166) (26) (192)
Total comprehensive income
(loss) for the period 3 (84) 875 (86) 1,018 1,726 134 1,860
Disposal of the Sofora –
Telecom Argentina group − (1,582) (1,582)
Issue of equity instruments 3 3 3
Other changes (11) (11) (11)
Balance at June 30, 2016 10,650 1,731 35 (333) (538) (173) − 7,734 19,106 2,221 21,327
Changes from January 1, 2017 to June 30, 2017 Note 10
Equity attributable to Owners of the Parent
(millions of euros) Share
capital
Additional
paid-in
capital
Reserve for
available-for-
sale financial
assets
Reserve for
cash flow
hedges
Reserve for
exchange
differences
on
translating
foreign
operations
Reserve for
remeasurem
ents of
employee
defined
benefit plans
(IAS 19)
Share of
other
profits
(losses) of
associates
and joint
ventures
accounted
for using
the equity
method
Other
reserves and
retained
earnings
(accumulated
losses),
including
profit (loss)
for the period
Total Non-
controlling
interests
Total
equity
Balance at December 31,
2016 11,587 2,094 39 (551) (366) (113) − 8,517 21,207 2,346 23,553
Changes in equity during the
period:
Dividends approved (166) (166) (39) (205)
Total comprehensive income
(loss) for the period (1) 123 (376) 25 596 367 (98) 269
Issue of equity instruments 4 4 4
Other changes (8) (8) 6 (2)
Balance at June 30, 2017 11,587 2,094 38 (428) (742) (88) − 8,943 21,404 2,215 23,619

TIM Group Half-year Condensed Consolidated Financial Statements at June 30, 2017
Consolidated Statements of Cash Flows 74
CONSOLIDATED STATEMENTS OF CASH FLOWS
(millions of euros) note 1st Half 1st Half
2017 2016
Cash flows from operating activities:
Profit (loss) from continuing operations 654 1,058
Adjustments for:
Depreciation and amortization 2,249 2,047
Impairment losses (reversals) on non-current assets (including investments) 10 5
Net change in deferred tax assets and liabilities 336 257
Losses (gains) realized on disposals of non-current assets (including investments) (6) (13)
Share of profits (losses) of associates and joint ventures accounted for using the
equity method
1 2
Change in employee benefits (7) 40
Change in inventories (44) (40)
Change in trade receivables and net amounts due from customers on construction
contracts
(52) (130)
Change in trade payables 44 (141)
Net change in current income tax receivables/payables 72 95
Net change in miscellaneous receivables/payables and other assets/liabilities (119) (687)
Cash flows from (used in) operating activities (a) 3,138 2,493
Cash flows from investing activities:
Purchase of intangible assets 5) (673) (709)
Purchase of tangible assets 6) (1,413) (1,397)
Total purchase of intangible and tangible assets on an accrual basis (*) (2,086) (2,106)
Change in amounts due for purchases of intangible and tangible assets (707) (371)
Total purchase of intangible and tangible assets on a cash basis (2,793) (2,477)
Acquisition of control in subsidiaries or other businesses, net of cash acquired − (6)
Acquisitions/disposals of other investments (1) (3)
Change in financial receivables and other financial assets 695 364
Proceeds from sale that result in a loss of control of subsidiaries or other businesses,
net of cash disposed of
− 492
Proceeds from sale/repayment of intangible, tangible and other non-current assets 9 29
Cash flows from (used in) investing activities (b) (2,090) (1,601)
Cash flows from financing activities:
Change in current financial liabilities and other (663) (262)
Proceeds from non-current financial liabilities (including current portion) 1,256 2,061
Repayments of non-current financial liabilities (including current portion) (1,200) (3,094)
Share capital proceeds/reimbursements (including subsidiaries) 6 −
Dividends paid (*) (218) (227)
Cash flows from (used in) financing activities (c) (819) (1,522)
Cash flows from (used in) Discontinued operations/Non-current assets held for sale (d) − (45)
Aggregate cash flows (e=a+b+c+d) 229 (675)
Net cash and cash equivalents at beginning of the period (f) 3,952 3,216
Net foreign exchange differences on net cash and cash equivalents (g) (95) 159
Net cash and cash equivalents at end of the period (h=e+f+g) 4,086 2,700 (*) of which related parties:
Total purchase of intangible and tangible assets on an accrual basis 75 63
Dividends paid − −

TIM Group Half-year Condensed Consolidated Financial Statements at June 30, 2017
Consolidated Statements of Cash Flows 75
Additional Cash Flow Information
(millions of euros) 1st Half 1st Half
2017 2016
Income taxes (paid) received (27) (104)
Interest expense paid (1,198) (1,327)
Interest income received 432 516
Dividends received − 7
Analysis of Net Cash and Cash Equivalents
(millions of euros) 1st Half 1st Half
2017 2016
Net cash and cash equivalents at beginning of the period
Cash and cash equivalents - from continuing operations 3,964 3,559
Bank overdrafts repayable on demand – from continuing operations (12) (441)
Cash and cash equivalents - from Discontinued operations/Non-current assets held for
sale
− 98
Bank overdrafts repayable on demand – from Discontinued operations/Non-current
assets held for sale
− −
3,952 3,216
Net cash and cash equivalents at end of the period
Cash and cash equivalents - from continuing operations 4,086 2,707
Bank overdrafts repayable on demand – from continuing operations − (7)
Cash and cash equivalents - from Discontinued operations/Non-current assets held for
sale
− −
Bank overdrafts repayable on demand – from Discontinued operations/Non-current
assets held for sale
− −
4,086 2,700

TIM Group Half-year Condensed Consolidated Financial Statements at June 30, 2017
Note 1 Form, content and other general information 76
NOTE 1
FORM, CONTENT AND OTHER GENERAL
INFORMATION
FORM AND CONTENT
Telecom Italia S.p.A. (the “Parent”), also known in short as “TIM S.p.A.”, and its subsidiaries form the
“TIM Group” or the “Group”.
TIM is a joint-stock company (S.p.A.) organized under the laws of the Republic of Italy.
The registered offices of the Parent, TIM, are located in Milan, Italy at Via Gaetano Negri 1.
The duration of TIM S.p.A., as stated in the company's bylaws, extends until December 31, 2100.
The TIM Group operates mainly in Europe, the Mediterranean Basin and South America.
The Group is engaged principally in the communications sector and, particularly, the fixed and mobile
national and international telecommunications sector.
The TIM Group half-year condensed consolidated financial statements at June 30, 2017 have been
prepared on a going concern basis (further details are provided in the Note "Accounting policies") and in
accordance with the International Financial Reporting Standards issued by the
International Accounting Standards Board and endorsed by the European Union (designated as "IFRS"),
as well as the laws and regulations in force in Italy.
The TIM Group half-year condensed consolidated financial statements at June 30, 2017 have been
prepared in compliance with IAS 34 (Interim Reports) and, as permitted by this standard, do not include
all the information required in the annual consolidated financial statements; accordingly, these financial
statements should be read together with the 2016 TIM Group consolidated financial statements.
For purposes of comparison, the consolidated statements of financial position at December 31, 2016
and the separate consolidated income statements, the consolidated statements of comprehensive
income, the consolidated statements of cash flows, as well as the consolidated statements of changes
in equity for the first half of 2016 are presented.
The TIM Group half-year condensed consolidated financial statements at June 30, 2017 are expressed
in euro (rounded to the nearest million unless otherwise indicated).
Publication of the TIM Group half-year condensed consolidated financial statements at June 30, 2017
was approved by resolution of the Board of Directors’ meeting held on July 27, 2017.
FINANCIAL STATEMENT FORMATS
The financial statement formats adopted are consistent with those indicated in IAS 1. In particular:
• the consolidated statements of financial position have been prepared by classifying assets and
liabilities according to the "current and non-current" criterion;
• the separate consolidated income statements have been prepared by classifying operating
expenses by nature of expense as this form of presentation is considered more appropriate and
representative of the specific business of the Group, conforms to internal reporting and is in line with
the TIM Group's industrial sector.
In addition to EBIT or Operating profit (loss), the separate consolidated income statements include
the alternative performance measure of EBITDA or Operating profit (loss) before depreciation and
amortization, Capital gains (losses) and Impairment reversals (losses) on non-current assets.
In particular, besides EBIT, EBITDA is used by TIM as the financial target in internal presentations
(business plans) and in external presentations (to analysts and investors). It represents a useful unit
of measurement for the evaluation of the operating performance of the Group (as a whole and at the
Business Unit level). EBIT and EBITDA are calculated as follows:
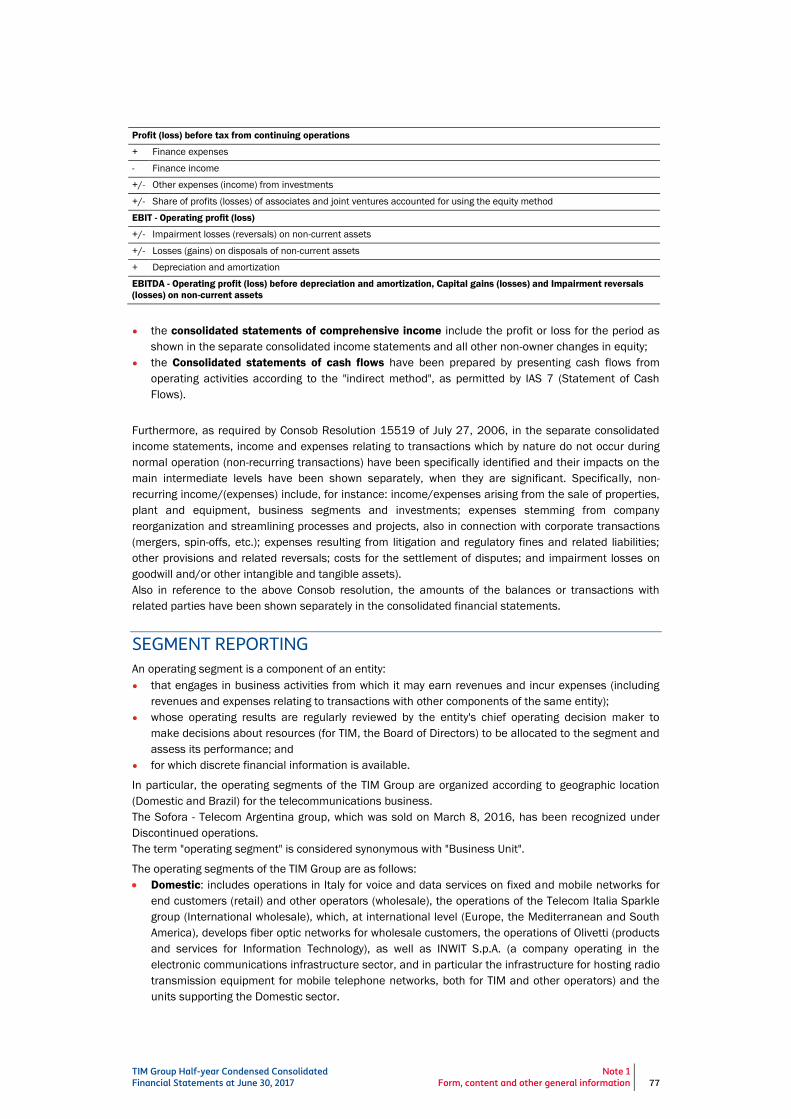
TIM Group Half-year Condensed Consolidated Financial Statements at June 30, 2017
Note 1 Form, content and other general information 77
Profit (loss) before tax from continuing operations
+ Finance expenses
- Finance income
+/- Other expenses (income) from investments
+/- Share of profits (losses) of associates and joint ventures accounted for using the equity method
EBIT - Operating profit (loss)
+/- Impairment losses (reversals) on non-current assets
+/- Losses (gains) on disposals of non-current assets
+ Depreciation and amortization
EBITDA - Operating profit (loss) before depreciation and amortization, Capital gains (losses) and Impairment reversals
(losses) on non-current assets
• the consolidated statements of comprehensive income include the profit or loss for the period as
shown in the separate consolidated income statements and all other non-owner changes in equity;
• the Consolidated statements of cash flows have been prepared by presenting cash flows from
operating activities according to the "indirect method", as permitted by IAS 7 (Statement of Cash
Flows).
Furthermore, as required by Consob Resolution 15519 of July 27, 2006, in the separate consolidated
income statements, income and expenses relating to transactions which by nature do not occur during
normal operation (non-recurring transactions) have been specifically identified and their impacts on the
main intermediate levels have been shown separately, when they are significant. Specifically, non-
recurring income/(expenses) include, for instance: income/expenses arising from the sale of properties,
plant and equipment, business segments and investments; expenses stemming from company
reorganization and streamlining processes and projects, also in connection with corporate transactions
(mergers, spin-offs, etc.); expenses resulting from litigation and regulatory fines and related liabilities;
other provisions and related reversals; costs for the settlement of disputes; and impairment losses on
goodwill and/or other intangible and tangible assets).
Also in reference to the above Consob resolution, the amounts of the balances or transactions with
related parties have been shown separately in the consolidated financial statements.
SEGMENT REPORTING
An operating segment is a component of an entity:
• that engages in business activities from which it may earn revenues and incur expenses (including
revenues and expenses relating to transactions with other components of the same entity);
• whose operating results are regularly reviewed by the entity's chief operating decision maker to
make decisions about resources (for TIM, the Board of Directors) to be allocated to the segment and
assess its performance; and
• for which discrete financial information is available.
In particular, the operating segments of the TIM Group are organized according to geographic location
(Domestic and Brazil) for the telecommunications business.
The Sofora - Telecom Argentina group, which was sold on March 8, 2016, has been recognized under
Discontinued operations.
The term "operating segment" is considered synonymous with "Business Unit".
The operating segments of the TIM Group are as follows:
Domestic: includes operations in Italy for voice and data services on fixed and mobile networks for
end customers (retail) and other operators (wholesale), the operations of the Telecom Italia Sparkle
group (International wholesale), which, at international level (Europe, the Mediterranean and South
America), develops fiber optic networks for wholesale customers, the operations of Olivetti (products
and services for Information Technology), as well as INWIT S.p.A. (a company operating in the
electronic communications infrastructure sector, and in particular the infrastructure for hosting radio
transmission equipment for mobile telephone networks, both for TIM and other operators) and the
units supporting the Domestic sector.

TIM Group Half-year Condensed Consolidated Financial Statements at June 30, 2017
Note 1 Form, content and other general information 78
See the section “Financial and Operating Highlights of the Business Units of the TIM Group –
Domestic Business Unit” of the Interim Management Report for more details;
Brazil: includes mobile (TIM Celular) and fixed (TIM Celular and Intelig) telecommunications
operations in Brazil;
Other Operations: include finance companies and other minor companies not strictly related to the
core business of the TIM Group.

TIM Group Half-year Condensed Consolidated Financial Statements at June 30, 2017
Note 2 Accounting policies 79
NOTE 2
ACCOUNTING POLICIES
GOING CONCERN
The half-year condensed consolidated financial statements at June 30, 2017 have been prepared on a
going concern basis as there is the reasonable expectation that TIM will continue its operational
activities in the foreseeable future (and in any event with a time horizon of at least twelve months).
In particular, the following factors have been taken into consideration:
• the main risks and uncertainties (that are for the most part of an external nature) to which the Group
and the various activities of the TIM Group are exposed:
– changes in the general macroeconomic situation in the Italian, European and Brazilian markets,
as well as the volatility of financial markets in the Eurozone also as a result of the “Brexit”
referendum in the United Kingdom;
– variations in business conditions, also related to competition;
– changes to laws and regulations (price and rate variations or decisions that may affect
technological choices);
– outcomes of legal disputes and proceedings with regulatory authorities, competitors and other
parties;
– financial risks (interest rate and/or exchange rate trends, changes in the Group's credit rating by
rating agencies);
• the mix between equity and debt capital considered optimal as well as the policy for the
remuneration of equity, described in the 2016 consolidated financial statements in the paragraph
devoted to the "Share capital information" under the Note "Equity";
• the policy for financial risk management (market risk, credit risk and liquidity risk) as described in
the Note "Financial risk management" in the annual consolidated financial statements at December
31, 2016.
Based on these factors, the Management believes that, at the present time, there are no elements of
uncertainty regarding the Group’s ability to continue as a going concern.
ACCOUNTING POLICIES AND PRINCIPLES OF CONSOLIDATION
The accounting policies and consolidation principles adopted in the preparation of the half-year
condensed consolidated financial statements at June 30, 2017 are the same as those adopted in the
annual consolidated financial statements at December 31, 2016, to which reference can be made,
except for the changes required because of the nature of interim financial reporting.
Furthermore, in the half-year condensed consolidated financial statements at June 30, 2017, income
taxes for the period of the individual consolidated companies are calculated according to the best
possible estimate based on available information and on a reasonable forecast of performance up to the
end of the tax period. Conventionally, the income tax liabilities (current and deferred) on the profit for the
interim period of the individual consolidated companies are recorded net of advances and tax
receivables (excluding receivables for which refunds have been requested) as well as deferred tax
assets, under "Deferred tax liabilities"; if the balance between deferred tax assets and deferred tax
liabilities is an asset it is conventionally recognized in "Deferred tax assets".
USE OF ESTIMATES
The preparation of the half-year condensed consolidated financial statements at June 30, 2017 and
related disclosure requires management to make estimates and assumptions based also on subjective
judgments, past experience and hypotheses considered reasonable and realistic in relation to the
information known at the time of the estimate. Such estimates have an effect on the reported amount of
assets and liabilities and disclosure of contingent assets and liabilities at the date of the financial

TIM Group Half-year Condensed Consolidated Financial Statements at June 30, 2017
Note 2 Accounting policies 80
statements, as well as the amount of revenues and costs during the period. Actual results could differ,
even significantly, from those estimates owing to possible changes in the factors considered in the
determination of such estimates. Estimates are reviewed periodically.
With regard to the most important accounting estimates, please refer to those illustrated in the annual
consolidated financial statements at December 31, 2016.
NEW STANDARDS AND INTERPRETATIONS ENDORSED BY THE EU AND IN FORCE FROM JANUARY 1, 2017
There were no new Standards and Interpretations that had been endorsed by the EU and were in force
from January 1, 2017.
NEW STANDARDS AND INTERPRETATIONS ISSUED BY IASB BUT NOT YET APPLICABLE
At the date of preparation of these half-year condensed consolidated financial statements, the following
new standards and interpretations, which have not yet entered into force, had been issued by the IASB:
Mandatory
application
starting from
New Standards and Interpretations endorsed by the EU
IFRS 15 (Revenues from contracts with customers) 1/1/2018
IFRS 9 (Financial Instruments) 1/1/2018
New Standards and Interpretations not yet endorsed by the EU
IFRS 16 (Leases) 1/1/2019
Amendments to IFRS 10 (Consolidated Financial Statements) and to IAS 28 (Investments in
Associates and Joint Ventures): Sale or contribution of assets between an investor and its
associate/joint venture
Application
deferred
indefinitely
Amendments to IAS 12 (Income taxes) – Recognition of Deferred Tax Assets for Unrealized Losses 1/1/2017
Amendments to IAS 7 (Cash flow statement - Disclosure initiative) 1/1/2017
Clarifications to IFRS 15 (Revenue from contracts with customers) 1/1/2018
Amendments to IFRS 2 (Classification and measurement of share-based payments) 1/1/2018
Improvements to the IFRS (2014-2016 cycle) – Amendments to IFRS 12 and IAS 28 1/1/2017
for IFRS 12
1/1/2018
for IAS 28
IFRIC 22 (Foreign currency transactions and advance consideration) 1/1/2018
Amendments to IAS 40 (Investment property) 1/1/2018
IFRIC 23 – Uncertainty over income tax treatments 1/1/2019
The potential impacts on the consolidated financial statements from application of these standards and
interpretations are currently being assessed. With regard to the adoption of IFRS 15, IFRS 16 and IFRS
9, specific projects have been initiated at Group level and therefore a reliable estimate of their
quantitative effects will only be possible when each project has been completed.
For more details of the specific projects see the information provided in the Note “Accounting policies”
of the annual consolidated financial statements at December 31, 2016.

TIM Group Half-year Condensed Consolidated Financial Statements at June 30, 2017
Note 3 Scope of consolidation 81
NOTE 3
SCOPE OF CONSOLIDATION
The changes in the scope of consolidation at June 30, 2017 compared to December 31, 2016 are listed
below.
Subsidiaries exiting the scope of consolidation:
Company Business Unit Month
Exit:
TIERRA ARGENTEA S.A. Liquidated Other Operations May 2017
In addition to that noted above, the changes in the scope of consolidation at June 30, 2017 compared
to June 30, 2016 are listed below:
Subsidiaries entering/exiting/merged into the scope of consolidation
Company Business Unit Month
Entry:
FLASH FIBER S.r.l. New company Domestic July 2016
TI SPARKLE RUSSIA LLC New acquisition Domestic July 2016
NOVERCA S.r.l. New acquisition Domestic October 2016
TIMVISION S.r.l. New company Domestic December 2016
Exit:
PURPLE TULIP B.V. Liquidated Other Operations July 2016
Merger:
TELECOM ITALIA INTERNATIONAL N.V. Merged into Telecom Italia
Finance S.A.
Other Operations August 2016
TELECOM ITALIA DEUTSCHLAND HOLDING
Gmbh
Merged into TIM S.p.A. Other Operations August 2016
GESTIONE DUE S.r.l. Merged into INWIT S.p.A. Domestic September 2016
GESTIONE IMMOBILI S.r.l. Merged into INWIT S.p.A. Domestic September 2016
REVI IMMOBILI S.r.l. Merged into INWIT S.p.A. Domestic September 2016
TELECOM ITALIA INFORMATION TECHNOLOGY
S.p.A.
Merged into TIM S.p.A. Domestic December 2016
The breakdown by number of subsidiaries and associates of the TIM Group is as follows:
6/30/2017
Companies: Italy Outside Italy Total
subsidiaries consolidated line-by-line 25 47 72
joint ventures accounted for using the equity method 1 - 1
associates accounted for using the equity method 20 - 20
Total companies 46 47 93

TIM Group Half-year Condensed Consolidated Financial Statements at June 30, 2017
Note 3 Scope of consolidation 82
12/31/2016
Companies: Italy Outside Italy Total
subsidiaries consolidated line-by-line 25 48 73
joint ventures accounted for using the equity method 1 - 1
associates accounted for using the equity method 19 - 19
Total companies 45 48 93
6/30/2016
Companies: Italy Outside Italy Total
subsidiaries consolidated line-by-line 26 50 76
joint ventures accounted for using the equity method 1 - 1
associates accounted for using the equity method 18 - 18
Total companies 45 50 95
Further details are provided in the Note "List of companies of the TIM Group".

TIM Group Half-year Condensed Consolidated Financial Statements at June 30, 2017
Note 4 Goodwill 83
NOTE 4
GOODWILL
The breakdown and the changes in Goodwill during the first six months of 2017 were as follows:
(millions of euros) 12/31/2016 Reclassifications Increase Decrease Impairments Exchange
differences 6/30/2017
Domestic 28,489 28,489
Core Domestic 28,077 28,077
International Wholesale 412 412
Brazil 1,123 (101) 1,022
Other Operations − −
Total 29,612 − − − − (101) 29,511
In accordance with IAS 36, goodwill is not subject to amortization, but is tested for impairment annually
or more frequently, whenever specific events or circumstances occur that may indicate an impairment.
At June 30, 2017, TIM’s market capitalization was less than the value of its equity; however, in view of
the positive performance of the first six months of the year, in line with the plan forecasts, the absence
of new and additional external indicators and the results in terms of recoverable amount of the
impairment testing conducted for the 2016 Financial Statements, it was not considered necessary to
redetermine the recoverable amount and consequently the goodwill allocated to the individual cash
generating units in the 2016 Consolidated Financial Statements was confirmed.

TIM Group Half-year Condensed Consolidated Financial Statements at June 30, 2017
Note 5 Intangible assets with a finite useful life 84
NOTE 5
INTANGIBLE ASSETS WITH A FINITE USEFUL LIFE
Intangible assets with a finite useful life decreased by 357 million euros compared to December 31,
2016. The breakdown and movements are as follows:
(millions of euros) 12/31/2016 Additions Amortization Impairment
(losses) /
reversals
Disposals Exchange
differences
Capitalized
borrowing
costs
Other
changes 6/30/2017
Industrial patents and
intellectual property rights 2,458 255 (645) (101) 318 2,285
Concessions, licenses,
trademarks and similar
rights 2,854 7 (198) (53) 30 2,640
Other intangible assets 109 76 (64) (3) 1 119
Work in progress and
advance payments 1,530 335 (106) 45 (254) 1,550
Total 6,951 673 (907) − − (263) 45 95 6,594
Additions in the first six months of 2017 included 133 million euros of internally generated assets (147
million euros in the first six months of 2016).
Industrial patents and intellectual property rights at June 30, 2017 essentially consisted of software
applications purchased outright and user license rights of unlimited duration, relating to TIM S.p.A.
(1,240 million euros) and the Brazil Business Unit (1,021 million euros).
Concessions, licenses, trademarks and similar rights at June 30, 2017 mainly refer to:
• the remaining cost of telephone licenses and similar rights (1,823 million euros for TIM S.p.A., 383
million euros for the Brazil Business Unit);
• Indefeasible Rights of Use - IRU (319 million euros) mainly relating to companies of the Telecom
Italia Sparkle group - International Wholesale (215 million euros) and the Parent (104 million euros);
• TV frequencies of the company Persidera in the Core Domestic segment (115 million euros).
Other intangible assets at June 30, 2017 essentially consist of capitalized subscriber acquisition costs
(SAC) of 103 million euros (70 million euros for the Parent and 33 million euros for the Brazil Business
Unit), mainly related to commissions for the sales network, for a number of commercial deals that lock in
customers for a set period.
Work in progress and advance payments increased by 20 million euros. You are reminded that this
item includes the user rights for the 700 MHz frequencies, acquired in 2014 by the Tim Brasil group for
a total of 2.9 billion reais (equal to around 1 billion euros). Since the assets require a period of more
than 12 months to be ready for use, again in the first half of 2017, borrowing costs of 45 million euros
were capitalized, as they were directly attributable to the acquisition. The yearly rate used for the
capitalization of borrowing costs in reais is 10.28%. Capitalized borrowing costs have been recorded as
a direct reduction of the income statement item "Finance expenses - Interest expenses to banks". In the
second quarter of 2017, the implementation was completed of the 4G/LTE network in the city of Brasilia
and nine other cities; accordingly, the first part of the amount was reclassified to the item Concessions,
licenses, trademarks and similar rights.

TIM Group Condensed Consolidated Financial Statements at June 30, 2017
Note 6 Tangible assets (owned and under finance leases) 85
NOTE 6
TANGIBLE ASSETS (OWNED AND UNDER
FINANCE LEASES)
PROPERTY, PLANT AND EQUIPMENT OWNED
Property, plant and equipment owned decreased by 276 million euros compared to December 31,
2016. The breakdown and movements are as follows:
(millions of euros) 12/31/2016 Additions Depreciation Impairment
(losses) /
reversals
Disposals Exchange
differences
Other
changes 6/30/2017
Land 203 1 (1) 3 206
Buildings (civil and industrial) 509 1 (23) (2) 3 488
Plant and equipment 11,709 824 (1,140) (3) (217) 249 11,422
Manufacturing and distribution
equipment 38 4 (8) 1 35
Other 391 21 (82) (3) (12) 64 379
Construction in progress and
advance payments 1,097 479 (19) (416) 1,141
Total 13,947 1,330 (1,253) − (6) (251) (96) 13,671
Additions in the first six months of 2017 included 184 million euros of internally generated assets (178
million euros in the first six months of 2016).
Land comprises both built-up land and available land and is not subject to depreciation. The figure at
June 30, 2017 mainly related to TIM S.p.A. (119 million euros) and TIM Real Estate S.r.l. (55 million
euros).
Buildings (civil and industrial) almost exclusively includes buildings for industrial use hosting telephone
exchanges or for office use, and light constructions. The figure at June 30, 2017 mainly related to TIM
S.p.A. (228 million euros) and TIM Real Estate S.r.l. (212 million euros).
Plant and equipment includes the aggregate of all the structures used for the functioning of voice and
data telephone services. The figure at June 30, 2017 was mainly attributable to TIM S.p.A. (8,671
million euros) and to companies of the Brazil Business Unit (2,101 million euros).
Manufacturing and distribution equipment consists of instruments and equipment used for the
operations and maintenance of plants and equipment; the amount was essentially in line with the end of
the prior year and primarily related to TIM S.p.A..
The item Other mainly consists of hardware for the functioning of the Data Center and for work stations,
furniture and fixtures and, to a minimal extent, transport vehicles and office machines.
Construction in progress and advance payments refer to the internal and external costs incurred for
the acquisition or internal production of tangible assets, which are not yet in use.

TIM Group Condensed Consolidated Financial Statements at June 30, 2017
Note 6 Tangible assets (owned and under finance leases) 86
ASSETS HELD UNDER FINANCE LEASES
Assets held under finance leases decreased by 42 million euros compared to December 31, 2016. The
breakdown and movements are as follows:
(millions of euros) 12/31/2016 Additions Change in
financial
leasing
contracts
Depreciation Exchange
differences
Other
changes 6/30/2017
Land under lease 16 16
Buildings (civil and industrial) 1,835 6 2 (64) 10 1,789
Plant and equipment 365 40 8 (10) (32) 14 385
Other 125 20 (15) (1) (1) 128
Construction in progress and
advance payments 72 7 (26) 53
Total 2,413 53 30 (89) (33) (3) 2,371
The additions consisted of the acquisition of IRU transmission capacity, due to the full financial
settlement at the beginning of the contract, and improvements and incremental expenses incurred for
movable and immovable third-party assets used on the basis of finance lease agreements.
The item Buildings (civil and industrial) includes buildings under long rent contracts and related
building adaptations, almost exclusively attributable to TIM S.p.A..
The item Plant and equipment mainly includes the recognition of the value of the telecommunications
towers sold by the Tim Brasil group to American Tower do Brasil and subsequently repurchased in the
form of finance lease. The additions consisted of the acquisition of IRU transmission capacity by the
Parent.
The item Other mainly comprises the finance leases on autovehicles.
Other changes included disposals for a total of 3 million euros, in addition to reclassifications between
the items.

TIM Group Condensed Consolidated Financial Statements at June 30, 2017
Note 7 Investments 87
NOTE 7
INVESTMENTS
Investments in associates and joint ventures accounted for using the equity method include:
(millions of euros) 6/30/2017 12/31/2016
Tiglio I 7 8
NordCom 5 5
W.A.Y. 3 3
Other 2 2
Total Associates 17 18
Alfiere - -
Total Joint Ventures - -
Total investments accounted for using the equity method 17 18
The list of investments accounted for using the equity method is presented in the Note "List of
companies of the TIM Group".
Other investments refer to the following:
(millions of euros) 6/30/2017 12/31/2016
Assicurazioni Generali 3 2
Fin.Priv. 18 17
Northgate Telecom Innovations Partners L.P. 14 14
Other 13 13
Total 48 46
The TIM Group does not hold investments in structured entities.

TIM Group Half-year Condensed Consolidated Financial Statements at June 30, 2017
Note 8 Financial assets (non-current and current) 88
NOTE 8
FINANCIAL ASSETS (NON-CURRENT AND
CURRENT)
Financial assets (non-current and current) were broken down as follows:
(millions of euros) 6/30/2017 12/31/2016
Non-current financial assets
Securities, financial receivables and other non-current financial assets
Securities other than investments − 1
Financial receivables for lease contracts 90 101
Hedging derivatives relating to hedged items classified as non-current
assets/liabilities of a financial nature 1,886 2,497
Receivables from employees 46 48
Non-hedging derivatives 13 39
Other financial receivables 150 12
Total non-current financial assets (a) 2,185 2,698
Current financial assets
Securities other than investments
Held for trading 1 140
Held-to-maturity − −
Available-for-sale 1,101 1,379
1,102 1,519
Financial receivables and other current financial assets
Liquid assets with banks, financial institutions and post offices (with
maturity over 3 months) 250 100
Receivables from employees 15 15
Financial receivables for lease contracts 57 59
Hedging derivatives relating to hedged items classified as current
assets/liabilities of a financial nature 287 185
Non-hedging derivatives 18 28
Other short-term financial receivables 3 2
630 389
Cash and cash equivalents 4,086 3,964
Total current financial assets (b) 5,818 5,872
Financial assets relating to Discontinued operations/Non-current
assets held for sale (c) − −
Total non-current and current financial assets (a+b+c) 8,003 8,570
Financial receivables for lease contracts refer to:
• Teleleasing lease contracts entered into directly with customers in previous years and for which TIM
is the guarantor;
• the portion of rental contracts, with the rendering of accessory services;
• finance leases on user rights and equipment.
Hedging derivatives relating to hedged items classified as non-current assets/liabilities of a
financial nature mainly refer to the mark-to-market spot valuation component of the hedging
derivatives, whereas Hedging derivatives relating to hedged items classified as current
assets/liabilities of a financial nature mainly consist of accrued income on derivative contracts.
The Non-hedging derivatives consist of the spot mark-to-market component of the non-hedging
derivatives of the Brazil Business Unit.

TIM Group Half-year Condensed Consolidated Financial Statements at June 30, 2017
Note 8 Financial assets (non-current and current) 89
Further details are provided in the Note "Derivatives".
Securities other than investments included in current assets relate to:
• listed securities (1,101 million euros), classified as available-for-sale due beyond three months. They
consist of 613 million euros of treasury bonds purchased respectively by TIM S.p.A. (256 million
euros) and Telecom Italia Finance S.A. (357 million euros) and 488 million euros of bonds
purchased by Telecom Italia Finance S.A. with different maturities, all with an active market and
consequently readily convertible into cash. The purchases of the above government bonds, which,
pursuant to Consob Communication no. DEM/11070007 of August 5, 2011, represent investments
in “Sovereign debt securities”, have been made in accordance with the Guidelines for the
"Management and control of financial risk" adopted by the TIM Group since August 2012, in
replacement of the previous policies in force;
• securities (1 million euros), classified as held-for-trading, relating to the investment made by the
Brazil Business Unit in a monetary fund that invests almost entirely in instruments in US dollars.
Cash and cash equivalents increased by 122 million euros compared to December 31, 2016 and were
broken down as follows:
(millions of euros) 6/30/2017 12/31/2016
Liquid assets with banks, financial institutions and post offices 3,123 2,491
Checks, cash and other receivables and deposits for cash flexibility 1 1
Securities other than investments (due within 3 months) 962 1,472
Total 4,086 3,964
The different technical forms of investing available cash at June 30, 2017 had the following
characteristics:
• maturities: all deposits have a maximum maturity date of three months;
• counterparty risk: deposits have been made with leading high-credit-quality banks and financial
institutions with a rating of at least BBB- according to Standard & Poor's with regard to Europe, and
with leading local counterparts with regard to investments in South America;
• Country risk: deposits have been made mainly in major European financial markets.
Securities other than investments (due within 3 months) consisted of 893 million euros (1,471 million
euros at December 31, 2016) of Brazilian bank certificates of deposit (Certificado de Depósito Bancário)
held by companies of the Brazil Business Unit with premier local banking and financial institutions, and
68 million euros of Euro Commercial Papers held by Telecom Italia Finance S.A. (with an issuer rating of
BBB- from S&P’s).

TIM Group Half-year Condensed Consolidated Financial Statements at June 30, 2017
Note 9 Trade and miscellaneous receivables and other current assets 90
NOTE 9
TRADE AND MISCELLANEOUS RECEIVABLES
AND OTHER CURRENT ASSETS
Trade and miscellaneous receivables and other current assets increased by 191 million euros compared
to December 31, 2016 and were broken down as follows:
(millions of euros) 6/30/2017 12/31/2016
Amounts due on construction contracts 29 33
Trade receivables:
Receivables from customers 3,083 3,110
Receivables from other telecommunications operators 888 815
3,971 3,925
Miscellaneous receivables and other current assets:
Other receivables 703 784
Trade and miscellaneous prepaid expenses 914 684
1,617 1,468
Total 5,617 5,426
Trade receivables amounted to 3,971 million euros (3,925 million euros at December 31, 2016) and
were net of the provision for bad debts of 592 million euros (648 million euros at December 31, 2016).
Trade receivables mainly related to TIM S.p.A. (2,817 million euros) and the Brazil Business Unit (712
million euros). They also included 64 million euros (82 million euros at December 31, 2016) of
medium/long-term receivables, principally in respect of agreements for the sale of Indefeasible Rights of
Use (IRU).
Other receivables amounted to 703 million euros (784 million euros at December 31, 2016) and were
net of a provision for bad debts of 73 million euros (72 million euros at December 31, 2016). Details are
as follows:
(millions of euros) 6/30/2017 12/31/2016
Advances to suppliers 64 41
Receivables from employees 32 26
Tax receivables 189 228
Receivables for grants from the government and public entities 202 242
Sundry receivables 216 247
Total 703 784
Tax receivables included, among others, 156 million euros relating to the Brazil Business Unit, largely
with reference to local indirect taxes, and 34 million euros relating to the Domestic Business Unit, partly
represented by credits resulting from tax returns, other taxes and also the VAT receivable on the
purchase of cars and related accessories for which refunds were requested under Italian Decree Law
258/2006, converted with amendments by Italian Law 278/2006.

TIM Group Half-year Condensed Consolidated Financial Statements at June 30, 2017
Note 9 Trade and miscellaneous receivables and other current assets 91
Receivables for grants from the government and public entities (202 million euros) mainly relate to Ultra-
Broadband-UBB and Broadband-BB projects. The grants are recognized to the income statement when
the related plants become ready for use upon satisfaction of specific requirements for each tender
notice.
Sundry receivables mainly included:
• receivables from factoring companies, totaling 50 million euros;
• receivables from social security and assistance agencies due to TIM S.p.A. of 27 million euros;
• miscellaneous receivables due to TIM S.p.A. from other licensed TLC operators of 43 million euros.
Trade and miscellaneous prepaid expenses mainly relate to the deferrals of costs referring to the
activation of new contracts with customers (467 million euros), building leases (34 million euros), rent
and maintenance (78 million euros) and insurance premiums (16 million euros).

TIM Group Half-year Condensed Consolidated Financial Statements at June 30, 2017
Note 10 Equity 92
NOTE 10
EQUITY
Equity consisted of:
(millions of euros) 6/30/2017 12/31/2016
Equity attributable to owners of the Parent 21,404 21,207
Non-controlling interests 2,215 2,346
Total 23,619 23,553
The breakdown of Equity attributable to Owners of the Parent is provided below:
(millions of euros) 6/30/2017 12/31/2016
Share capital 11,587 11,587
Additional paid-in capital 2,094 2,094
Other reserves and retained earnings (accumulated losses), including profit (loss) for the period 7,723 7,526
Reserve for available-for-sale financial assets 38 39
Reserve for cash flow hedges (428) (551)
Reserve for exchange differences on translating foreign operations (742) (366)
Reserve for remeasurements of employee defined benefit plans (IAS
19) (88) (113)
Share of other profits (losses) of associates and joint ventures
accounted for using the equity method − −
Sundry reserves and retained earnings (accumulated losses),
including profit (loss) for the period 8,943 8,517
Total 21,404 21,207
On the basis of the resolution passed by the Shareholders' Meeting held on May 4, 2017, the profit for
the year 2016 reported in the financial statements of the Parent TIM S.p.A. has been allocated as
follows:
166 million euros, for the distribution of a preferred dividend to Savings Shareholders of 0.0275
euros for each savings share, gross of withholdings required by law;
95 million euros to the legal reserve;
1,636 million euros to retained earnings.
Movements in Share Capital during the first half of 2017, amounting to 11,587 million euros, and
already net of treasury shares of 90 million euros, are shown in the tables below:
Reconciliation between the number of shares outstanding at December 31, 2016 and June 30, 2017
(number of shares) at 12/31/2016 Share issues at 6/30/2017 % of share
capital
Ordinary shares issued (a) 15,203,122,583 − 15,203,122,583 71.61%
less: treasury shares (b) (163,754,388) − (163,754,388)
Ordinary shares outstanding (c) 15,039,368,195 − 15,039,368,195
Savings shares issued and outstanding (d) 6,027,791,699 − 6,027,791,699 28.39%
Total TIM S.p.A. shares issued (a+d) 21,230,914,282 − 21,230,914,282 100.00%
Total TIM S.p.A. shares outstanding (c+d) 21,067,159,894 − 21,067,159,894

TIM Group Half-year Condensed Consolidated Financial Statements at June 30, 2017
Note 10 Equity 93
Reconciliation between the value of shares outstanding at December 31, 2016 and June 30, 2017
(millions of euros) Share capital at
12/31/2016
Change in
share capital
Share capital at
6/30/2017
Ordinary shares issued (a) 8,362 − 8,362
less: treasury shares (b) (90) − (90)
Ordinary shares outstanding (c) 8,272 − 8,272
Savings shares issued and outstanding (d) 3,315 − 3,315
Total TIM S.p.A. share capital issued (a+d) 11,677 − 11,677
Total TIM S.p.A. share capital outstanding (c+d) 11,587 − 11,587
POTENTIAL FUTURE CHANGES IN SHARE CAPITAL
Details of "Future potential changes in share capital" are presented in the Note "Earnings per share".

TIM Group Condensed Consolidated Financial Statements at June 30, 2017
Note 11 Financial liabilities (non-current and current) 94
NOTE 11
FINANCIAL LIABILITIES (NON-CURRENT AND
CURRENT)
Non-current and current financial liabilities (gross financial debt) were broken down as follows: (millions of euros) 6/30/2017 12/31/2016
Financial payables (medium/long-term):
Bonds 17,740 18,537
Convertible bonds 1,847 1,832
Amounts due to banks 4,916 5,461
Other financial payables 173 306
24,676 26,136
Finance lease liabilities (medium/long-term) 2,356 2,444
Other financial liabilities (medium/long-term):
Hedging derivatives relating to hedged items classified as non-current
assets/liabilities of a financial nature 1,849 1,876
Non-hedging derivatives 6 13
Other liabilities − −
1,855 1,889
Total non-current financial liabilities (a) 28,887 30,469
Financial payables (short-term):
Bonds 3,016 2,589
Convertible bonds 6 6
Amounts due to banks 1,438 1,072
Other financial payables 107 117
4,567 3,784
Finance lease liabilities (short-term) 197 192
Other financial liabilities (short-term):
Hedging derivatives relating to hedged items classified as current
assets/liabilities of a financial nature 77 69
Non-hedging derivatives 3 11
Other liabilities − −
80 80
Total current financial liabilities (b) 4,844 4,056
Financial liabilities directly associated with Discontinued
operations/Non-current assets held for sale (c) − −
Total Financial liabilities (Gross financial debt) (a+b+c) 33,731 34,525

TIM Group Condensed Consolidated Financial Statements at June 30, 2017
Note 11 Financial liabilities (non-current and current) 95
Gross financial debt according to the original currency of the transaction is as follows:
6/30/2017 12/31/2016
(millions
of foreign currency) (millions of euros)
(millions
of foreign currency) (millions of euros)
USD 7,209 6,317 7,504 7,119
GBP 2,007 2,282 2,017 2,356
BRL 7,449 1,973 7,128 2,075
JPY 20,031 157 20,032 162
EURO 23,002 22,813
Total 33,731 34,525
The breakdown of gross financial debt by effective interest rate bracket, excluding the effect of any
hedging instruments, is provided below:
(millions of euros) 6/30/2017 12/31/2016
Up to 2.5% 4,846 5,041
From 2.5% to 5% 10,313 9,368
From 5% to 7.5% 11,555 12,629
From 7.5% to 10% 3,772 3,918
Over 10% 641 673
Accruals/deferrals, MTM and derivatives 2,604 2,896
Total 33,731 34,525
Following the use of derivative hedging instruments, on the other hand, the gross financial debt by
nominal interest rate bracket is:
(millions of euros) 6/30/2017 12/31/2016
Up to 2.5% 11,767 9,410
From 2.5% to 5% 6,181 7,775
From 5% to 7.5% 9,652 10,586
From 7.5% to 10% 2,018 1,430
Over 10% 1,509 2,428
Accruals/deferrals, MTM and derivatives 2,604 2,896
Total 33,731 34,525
The maturities of financial liabilities according to the expected nominal repayment amount, as defined
by contract, are the following:
Details of the maturities of financial liabilities – at nominal repayment amount:
maturing by 6/30 of the year:
(millions of euros) 2018 2019 2020 2021 2022 After
2022
Total
Convertible bonds 2,667 3,047 720 1,111 3,084 11,681 22,310
Loans and other financial liabilities 721 1,837 1,267 622 590 474 5,511
Finance lease liabilities 144 115 110 110 93 1,919 2,491
Total 3,532 4,999 2,097 1,843 3,767 14,074 30,312
Current financial liabilities 769 − − − − − 769
Total 4,301 4,999 2,097 1,843 3,767 14,074 31,081
The main components of financial liabilities are commented below.

TIM Group Condensed Consolidated Financial Statements at June 30, 2017
Note 11 Financial liabilities (non-current and current) 96
Bonds are broken down as follows:
(millions of euros) 6/30/2017 12/31/2016
Non-current portion 17,740 18,537
Current portion 3,016 2,589
Total carrying amount 20,756 21,126
Fair value adjustment and measurements at amortized cost (446) (709)
Total nominal repayment amount 20,310 20,417
The convertible bonds consist of the unsecured equity-linked bond for 2,000 million euros, with a
coupon of 1.125%, issued by TIM S.p.A., convertible into newly-issued ordinary shares, maturing in
2022.
This item was broken down as follows:
(millions of euros) 6/30/2017 12/31/2016
Non-current portion 1,847 1,832
Current portion 6 6
Total carrying amount 1,853 1,838
Fair value adjustment and measurements at amortized cost 147 162
Total nominal repayment amount 2,000 2,000
The nominal repayment amount of the bonds and convertible bonds totaled 22,310 million euros and
was down 107 million euros compared to December 31, 2016 (22,417 million euros), as a result of the
new issues and repayments in the first half of 2017.

TIM Group Condensed Consolidated Financial Statements at June 30, 2017
Note 11 Financial liabilities (non-current and current) 97
The following table lists the bonds issued by companies of the TIM Group, by issuing company,
expressed at the nominal repayment amount, net of bond repurchases, and also at market value: Currency Amount
(millions)
Nominal
repayment
amount
(millions of
euros)
Coupon Issue date Maturity date Issue price
(%)
Market price
at 6/30/17
(%)
Market value
at
6/30/17
(millions of
euros) Bonds issued by TIM S.p.A.
Euro 628.2 628.2 4.500% 9/20/12 9/20/17 99.693 100.969 634
GBP 750 852.9 7.375% 5/26/09 12/15/17 99.608 102.862 877
Euro 592.9 592.9 4.750% 5/25/11 5/25/18 99.889 104.243 618
Euro 581.9 581.9 6.125% 6/15/12 12/14/18 99.737 108.894 634
Euro 832.4 832.4 5.375% 1/29/04 1/29/19 99.070 108.361 902
GBP 850 966.6 6.375% 6/24/04 6/24/19 98.850 109.320 1,057
Euro 719.5 719.5 4.000% 12/21/12 1/21/20 99.184 109.243 786
Euro 547.5 547.5 4.875% 9/25/13 9/25/20 98.966 114.211 625
Euro 563.6 563.6 4.500% 1/23/14 1/25/21 99.447 114.230 644
Euro (b) 200.5 200.5 6 month Euribor (base 365) 1/1/02 1/1/22 100 100 200
Euro 883.9 883.9 5.250% 2/10/10 2/10/22 99.295 119.865 1,059
Euro (c)2,000 2,000 1.125% 3/26/15 3/26/22 100 99.237 1,985
Euro 1,000 1,000 3.250% 1/16/15 1/16/23 99.446 110.480 1,105
GBP 375 426.5 5.875% 5/19/06 5/19/23 99.622 115.482 492
Euro 1,000 1,000 2.500% 1/19/17 7/19/23 99.288 105.373 1,054
Euro 750 750 3.625% 1/20/16 1/19/24 99.632 111.427 836
USD 1,500 1,314.4 5.303% 5/30/14 5/30/24 100 107.716 1,416
Euro 1,000 1,000 3.000% 9/30/16 9/30/25 99.806 106.289 1,063
Euro 1,000 1,000 3.625% 5/25/16 5/25/26 100 111.489 1,115
Euro 670 670 5.250% 3/17/05 3/17/55 99.667 108.387 726
Subtotal 16,530.8 17,828
Bonds issued by Telecom Italia Finance S.A. and guaranteed by TIM S.p.A.
Euro 1,015 1,015 7.750% 1/24/03 1/24/33 (a) 109.646 138.906 1,410
Subtotal 1,015 1,410
Bonds issued by Telecom Italia Capital S.A. and guaranteed by TIM S.p.A.
USD (d) 676.6 592.9 6.999% 6/4/08 6/4/18 100 104.560 620
USD (d) 759.7 665.6 7.175% 6/18/09 6/18/19 100 109.292 728
USD 1,000 876.3 6.375% 10/29/03 11/15/33 99.558 107.946 946
USD 1,000 876.3 6.000% 10/6/04 9/30/34 99.081 105.714 926
USD 1,000 876.3 7.200% 7/18/06 7/18/36 99.440 116.327 1,019
USD 1,000 876.3 7.721% 6/4/08 6/4/38 100 121.229 1,062
Subtotal 4,763.7 5,301
Total 22,309.5 24,539
(a) Weighted average issue price for bonds issued with more than one tranche.
(b) Reserved for employees.
(c) Bond convertible into newly-issued TIM S.p.A. ordinary treasury shares.
(d) Net of the securities bought back by TIM S.p.A. on July 20, 2015.
The regulations and the Offering Circulars relating to the bonds of the TIM Group are available on the
corporate website www.telecomitalia.com.
The following table lists the changes in bonds during the first half of 2017:
New issues
(millions of original currency) Currency Amount Issue date
Telecom Italia S.p.A. 1,000 million euros 2.500% maturing 7/19/2023 Euro 1,000 1/19/2017
Repayments
(millions of original currency) Currency Amount Repayment date
Telecom Italia S.p.A. 545 million euros 7.000% (1) Euro 545 1/20/2017
(1) Net of buybacks by the Company of 455 million euros during 2015.
TIM Group Condensed Consolidated Financial Statements at June 30, 2017
Note 11 Financial liabilities (non-current and current) 98
Medium/long-term amounts due to banks of 4,916 million euros (5,461 million euros at December 31,
2016) decreased by 545 million euros. Short-term amounts due to banks totaled 1,438 million euros
(1,072 million euros at December 31, 2016) and included 758 million euros of the current portion of
medium/long-term amounts due to banks. In addition, Telecom Italia Finance S.A. had investments in
repurchase agreements ("Repos") on government bonds for a total value of 250 million euros maturing
in July 2017.
Medium/long-term other financial payables, amounting to 173 million euros (306 million euros at
December 31, 2016), decreased by 133 million euros (following the early repayment on April 10, 2017
of the bilateral term loan with Cassa Depositi e Prestiti of the amount of 100 million euros maturing April
2019) and included 152 million euros of the Telecom Italia Finance S.A. loan for 20,000 million
Japanese yen maturing in 2029. Short-term other financial payables amounting 107 million euros (117
million euros at December 31, 2016) decreased by 10 million euros and included 15 million euros of
the current portion of the medium/long-term other financial payables.
Medium/long-term finance lease liabilities totaled 2,356 million euros (2,444 million euros at
December 31, 2016) and mainly related to property leases accounted for using the financial method
established by IAS 17. Short-term finance lease liabilities amounted to 197 million euros (192 million
euros at December 31, 2016).
Hedging derivatives relating to items classified as non-current liabilities of a financial nature amounted
to 1,849 million euros (1,876 million euros at December 31, 2016). Hedging derivatives relating to
items classified as current liabilities of a financial nature totaled 77 million euros (69 million euros at
December 31, 2016).
Non-hedging derivatives classified as non-current financial liabilities totaled 6 million euros (13 million
euros at December 31, 2016). Non-hedging derivatives classified as non-current financial liabilities
totaled 3 million euros (11 million euros at December 31, 2016). These also include the measurement
of derivatives which, although put into place for hedging purposes, do not possess the formal requisites
to be considered as such under IFRS.
“COVENANTS” AND “NEGATIVE PLEDGES” EXISTING AT JUNE 30, 2017
The bonds issued by the TIM Group do not contain financial covenants (e.g. ratios such as Debt/EBITDA,
EBITDA/Interest, etc.) or clauses that would force the early redemption of the bonds in relation to events
other than the insolvency of the TIM Group. Furthermore, the repayment of the bonds and the payment
of interest are not covered by specific guarantees nor are there commitments provided relative to the
assumption of future guarantees, except for the full and unconditional guarantees provided by TIM S.p.A.
for the bonds issued by Telecom Italia Finance S.A. and Telecom Italia Capital S.A..
Since these bonds have been placed principally with institutional investors in major world capital
markets (Euromarket and the U.S.A.), the terms which regulate the bonds are in line with market
practice for similar transactions effected on these same markets. Consequently, for example, there are
commitments not to use the company's assets as collateral for loans ("negative pledges").
With regard to the loans taken out by TIM S.p.A. with the European Investment Bank ("EIB"), at June 30,
2017, the nominal amount of outstanding loans amounted to 1,950 million euros, of which 800 million
euros at direct risk and 1,150 million euros secured.
EIB loans not secured by bank guarantees for a nominal amount equal to 800 million euros need to
apply the following covenants:
• in the event the company becomes the target of a merger, demerger or contribution of a business
segment outside the Group, or sells, disposes or transfers assets or business segments (except in
certain cases, expressly provided for), it shall immediately inform the EIB which shall have the right
to ask for guarantees to be provided or changes to be made to the loan contract, or, only for certain
loan contracts, the EIB shall have the option to demand the immediate repayment of the loan
(should the merger, demerger or contribution of a business segment outside the Group compromise
the Project execution or cause a prejudice to EIB in its capacity as creditor);
• with the 500 million euros loan, signed on December 14, 2015, TIM undertook to ensure that, for
the entire duration of the loan, the total financial debt of the Group companies other than TIM S.p.A.

TIM Group Condensed Consolidated Financial Statements at June 30, 2017
Note 11 Financial liabilities (non-current and current) 99
– except for the cases when that debt is fully and irrevocably secured by TIM S.p.A. – is lower than
35% (thirty-five percent) of the Group's total financial debt.
EIB loans secured by banks or entities approved by the EIB for a total nominal amount of 1,150 million
euros, and direct risk loans, respectively for 300 million euros, signed on July 30, 2014 and 500 million
euros, signed on December 14, 2015, must apply the following covenants:
• "Inclusion clause", covering a total of 1,650 million euros of loans, under which, in the event TIM
commits to uphold financial covenants in other loan contracts (and even more restrictive clauses for
2014 and 2015 direct risk loans, including, for instance, cross default clauses and commitments
restricting the sale of goods) that are not present in or are stricter than those granted to the EIB, the
EIB will have the right – if, in its reasonable opinion, it considers that such changes may have a
negative impact on TIM's financial capacity – to request the provision of guarantees or the
modification of the loan contract in order to establish an equivalent provision in favor of the EIB;
• "Network Event", covering a total of 1,350 million euros of loans, under which, in the event of the
disposal of the entire fixed network or of a substantial part of it (in any case more than half in
quantitative terms) to third parties or in the event of disposal of the controlling interest in the
company in which the network or a substantial part of it has previously been transferred, TIM must
immediately inform the EIB, which shall have the option of requiring the establishment of guarantees
or amendment of the loan contract or an alternative solution.
The loan agreements of TIM S.p.A. do not contain financial covenants (e.g. ratios such as Debt/EBITDA,
EBITDA/Interests, etc.) which would oblige the Company to repay the outstanding loan if the covenants
are not observed.
The loan agreements contain the usual other types of covenants, including the commitment not to use
the Company’s assets as collateral for loans (negative pledges), the commitment not to change the
business purpose or sell the assets of the Company unless specific conditions exist (e.g. the sale takes
place at fair market value). Covenants with basically the same content are also found in the export credit
loan agreement.
In the Loan Agreements and the Bonds, TIM is required to provide notification of change of control.
Identification of the occurrence of a change of control and the applicable consequences – including the
establishment of guarantees or the early repayment of the amount paid and the cancellation of the
commitment in the absence of agreements to the contrary – are specifically covered in the individual
agreements.
In addition, the outstanding loans generally contain a commitment by TIM, whose breach is an Event of
Default, not to implement mergers, demergers or transfer of business, involving entities outside the
Group. Such Event of Default may entail, upon request of the Lender, the early redemption of the drawn
amounts and/or the annulment of the undrawn commitment amounts.
In the documentation of the loans granted to certain companies of the Tim Brasil group, the companies
must generally respect certain financial ratios (e.g. capitalization ratios, ratios for servicing debt and
debt ratios) as well as the usual other covenants, under pain of a request for the early repayment of the
loan.
Finally, as of June 30, 2017, no covenant, negative pledge clause or other clause relating to the above-
described debt position, has in any way been breached or violated.

TIM Group Condensed Consolidated Financial Statements at June 30, 2017
Note 11 Financial liabilities (non-current and current) 100
REVOLVING CREDIT FACILITY
The following table shows the composition and the drawdown of the committed credit lines available at
June 30, 2017:
(billions of euros) 6/30/2017 12/31/2016
Agreed Agreed Agreed Drawn down
Revolving Credit Facility – expiring May 2019 4.0 - 4.0 -
Revolving Credit Facility – expiring March 2020 3.0 - 3.0 -
Total 7.0 - 7.0 -
TIM has two syndicated Revolving Credit Facilities for amounts of 4 billion euros and 3 billion euros
expiring May 24, 2019 and March 25, 2020 respectively, both not yet drawn down.
TIM also has:
• a bilateral Term Loan from Banca Regionale Europea expiring July 2019 for 200 million euros, drawn
down for the full amount;
• two bilateral Term Loans from Mediobanca respectively for 200 million euros expiring in November
2019 and 150 million euros expiring in July 2020, drawn down for the full amount;
• a bilateral Term Loan from ICBC expiring July 2020 for 120 million euros, drawn down for the full
amount;
• a bilateral Term Loan from Intesa Sanpaolo expiring August 2021 for 200 million euros, drawn down
for the full amount;
• an Hot Money loan with Banca Popolare dell’Emilia Romagna expiring July 2017 for 200 million
euros, drawn down for the full amount.
On March 6, 2017, TIM S.p.A. signed a supplementary agreement with Mediobanca under which an
early repayment was made on July 3, 2017 for 75 million euros for the bilateral term loan of an original
amount of 150 million euros expiring in July 2020, which had been fully drawn down.
TIM'S RATING AT JUNE 30, 2017
At June 30, 2017, the three rating agencies – Standard & Poor's, Moody's and Fitch Ratings – rated TIM
as follows:
Rating Outlook
STANDARD & POOR'S BB+ Stable
MOODY'S Ba1 Stable
FITCH RATINGS BBB- Stable
On July 12, 2017, the rating agency Standard & Poor's upgraded TIM S.p.A.'s outlook from "Stable" to
"Positive".

TIM Group Half-year Condensed Consolidated Financial Statements at June 30, 2017
Note 12 Net financial debt 101
NOTE 12
NET FINANCIAL DEBT
The following table shows the net financial debt at June 30, 2017 and December 31, 2016, calculated
in accordance with the criteria indicated in the "Recommendations for the Consistent Implementation of
the European Commission Regulation on Prospectuses", issued on February 10, 2005 by the European
Securities & Markets Authority (ESMA), and adopted by Consob.
For the purpose of determining such figure, the amount of financial liabilities has been adjusted by the
effect of the relative hedging derivatives recorded in assets and the receivables arising from financial
subleasing.
This table also shows the reconciliation of the net financial debt determined according to the criteria
indicated by the ESMA and net financial debt calculated according to the criteria of the TIM Group.
(millions of euros) 6/30/2017 12/31/2016
Non-current financial liabilities 28,887 30,469
Current financial liabilities 4,844 4,056
Financial liabilities directly associated with Discontinued
operations/Non-current assets held for sale − −
Total Gross financial debt (a) 33,731 34,525
Non-current financial assets (°)
Non-current financial receivables for lease contract (90) (101)
Non-current hedging derivatives (1,886) (2,497)
(b) (1,976) (2,598)
Current financial assets
Securities other than investments (1,102) (1,519)
Financial receivables and other current financial assets (630) (389)
Cash and cash equivalents (4,086) (3,964)
Financial assets relating to Discontinued operations/Non-current
assets held for sale − −
(c) (5,818) (5,872)
Net financial debt as per Consob communication
DEM/6064293/2006 (ESMA) (d=a+b+c) 25,937 26,055
Non-current financial assets (°)
Securities other than investments − (1)
Other financial receivables and other non-current financial assets (209) (99)
(e) (209) (100)
Net financial debt(*) (f=d+e) 25,728 25,955
Reversal of fair value measurement of derivatives and related
financial assets/liabilities (g) (624) (836)
Adjusted net financial debt (f+g) 25,104 25,119
(°) At June 30, 2017 and at December 31, 2016, "Non-current financial assets" (b+e) amounted to 2,185 million euros and 2,698
million euros, respectively. (*) For details of the effects of related party transactions on net financial debt, see the specific table in the Note "Related party
transactions".

TIM Group Half-year Condensed Consolidated Financial Statements at June 30, 2017
Note 13 Derivatives 102
NOTE 13
DERIVATIVES
Derivative financial instruments are used by the TIM Group to hedge its exposure to foreign exchange
rate risk, to manage interest rate risk and to diversify the parameters of debt so that costs and volatility
can be reduced to within predetermined operational limits.
Derivative financial instruments in place at June 30, 2017 are principally used to manage debt
positions. They include interest rate swaps (IRSs) to reduce interest rate exposure on fixed-rate and
variable-rate bank loans and bonds, as well as cross currency and interest rate swaps (CCIRSs), currency
forwards and foreign exchange options to convert the loans/receivables secured in currencies different
from the functional currencies of the various Group companies.
IRS transactions, provide for or may entail, at specified maturity dates, the exchange of flows of interest,
calculated on the notional amount, at the agreed fixed or variable rates.
The same also applies to CCIRS transactions which, in addition to the settlement of periodic interest
flows, may provide for the exchange of principal, in the respective currencies of denomination, at
maturity and possibly spot.
The following table shows the derivative financial instruments of the TIM Group at June 30, 2017 and at
December 31, 2016, by type (for cross currency and interest rate swaps the notional amount refers to
the synthetic coverage):
Type
(millions of euros)
Hedged risk Notional
amount at
6/30/2017
Notional amount
at 12/31/2016
Spot (*) Mark-to-
Market (Clean
Price) at
6/30/2017
Spot* Mark-to-
Market (Clean
Price) at
12/31/2016
Interest rate swaps Interest rate risk 3,734 3,334 (7) 42
Cross Currency and
Interest Rate Swaps
Interest rate risk and
currency exchange rate
risk 851 851 12 46
Total Fair Value Hedge Derivatives ** 4,585 4,185 5 88
Interest rate swaps Interest rate risk - - - -
Cross Currency and Interest Rate Swaps
Interest rate risk and
currency exchange rate risk 7,952 7,952 170 551
Total Cash Flow Hedge Derivatives ** 7,952 7,952 170 551
Total Non-Hedge Accounting Derivatives 184 484 23 51
Total TIM Group derivatives 12,721 12,621 198 690
* Spot Mark-to-market above represents the market measurement of the derivative net of the accrued portion of the flow in
progress.
** On the 2009 issue in GBP there are two hedges, in FVH and CFH; accordingly, although it is a single issue, the notional amount
of the hedge is included in both the FVH and CFH groupings.

TIM Group Half-year Condensed Consolidated Financial Statements at June 30, 2017
Note 14 Supplementary disclosures on financial instruments 103
NOTE 14
SUPPLEMENTARY DISCLOSURES ON FINANCIAL
INSTRUMENTS
MEASUREMENT AT FAIR VALUE
The fair value measurement of the financial instruments of the Group is classified according to the three
levels set out in IFRS 7. In particular, the fair value hierarchy introduces three levels of input:
• Level 1: quoted prices in active market;
• Level 2: prices calculated using observable market inputs;
• Level 3: prices calculated using inputs that are not based on observable market data.
The tables below provide additional information on the financial instruments, including the table relating
to the hierarchy level for each class of financial asset/liability measured at fair value at June 30, 2017.
Key for IAS 39 categories
Acronym
Loans and Receivables Loans and Receivables LaR
Financial assets Held-to-Maturity Financial assets Held-to-Maturity HtM
Available-for-Sale financial assets Financial assets Available-for-Sale AfS
Financial Assets/Liabilities Held for Trading Financial Assets/Liabilities Held for Trading FAHfT/FLHfT
Financial Liabilities at Amortized Cost Financial Liabilities at Amortized Cost FLAC
Hedging Derivatives Hedge Derivatives HD
Not applicable Not applicable n.a.

TIM Group Half-year Condensed Consolidated Financial Statements at June 30, 2017
Note 14 Supplementary disclosures on financial instruments 104
Fair value hierarchy level for each class of financial asset/liability at 6/30/2017
Hierarchy Levels
(millions of euros) IAS 39
Categories
Note Carrying
amount in
financial
statements
at 6/30/2017
Level 1 (*) Level 2 (*) Level 3 (*)
ASSETS
Non-current assets
Other investments AfS 7) 48 3 18
Securities, financial receivables and other non-current
financial assets
of which securities AfS 8) - -
of which hedging derivatives HD 8) 1,886 1,886
of which non-hedging derivatives FAHfT 8) 13 13
(a) 1,947 3 1,917 -
Current assets
Securities
of which available-for-sale financial assets AfS 8) 1,101 1,101
of which held-for-trading financial assets FAHfT 8) 1 1
Financial receivables and other current financial assets
of which hedging derivatives HD 8) 287 287
of which non-hedging derivatives FAHfT 8) 18 18
(b) 1,407 1,102 305 -
Total (a+b) 3,354 1,105 2,222 -
LIABILITIES
Non-current liabilities
of which hedging derivatives HD 11) 1,849 1,849
of which non-hedging derivatives FLHfT 11) 6 6
(c) 1,855 - 1,855 -
Current liabilities
of which hedging derivatives HD 11) 77 77
of which non-hedging derivatives FLHfT 11) 3 3
(d) 80 - 80 -
Total (c+d) 1,935 - 1,935 -
(*) Level 1: quoted prices in active markets.
Level 2: prices calculated using observable market inputs.
Level 3: prices calculated using inputs that are not based on observable market data.

TIM Group Half-year Condensed Consolidated Financial Statements at June 30, 2017
Note 15 Employee benefits 105
NOTE 15
EMPLOYEE BENEFITS
Employee benefits decreased by 26 million euros compared to December 31, 2016 and were broken
down as follows:
(millions of euros)
12/31/2016 Increases/
Present value
Decrease Exchange
differences
and other
changes
6/30/2017
Provision for employee severance indemnities (a) 1,009 (26) (8) - 975
Provision for pension and other plans 28 7 (1) - 34
Provision for termination benefit incentives 348 10 (8) - 350
Total other provisions for employee benefits (b) 376 17 (9) - 384
Total (a+b) 1,385 1,359
of which:
non-current portion 1,355 1,336
current portion (*) 30 23
(*) The current portion refers only to Other provisions for employee benefits.
The Provision for employee severance indemnities only refers to Italian companies and decreased
overall by 34 million euros. The "Decreases" of 8 million euros refer to indemnities paid during the
period to employees who terminated employment or for advances. The decrease of 26 million euros in
the column "Increases/Present value" consists of the following:
(millions of euros) 1st half
2017
1st half
2016
Current service cost (*) - -
Finance expenses 7 10
Net actuarial (gains) losses for the period (33) 118
Total (26) 128
Effective return on plan assets there are no assets servicing the
plan
(*) Following the social security reform in 2007, the portions intended for the INPS Treasury Fund or for the supplementary pension
funds have been recorded under "Employee benefits expenses", in "Social security expenses", and not as "Employee severance
indemnities expenses". The latter account will continue to be used only for the severance indemnity expenses of companies with less
than 50 employees.
The net actuarial gains recognized at June 30, 2017, totaling 33 million euros (net actuarial losses of
118 million euros for the first half of 2016), essentially related to the change in the discount rate to
1.67% from the 1.31% used at December 31, 2016, while the inflation rate was considered to be 1.5%
for the entire time (curve at December 2016: 1.1% for 2017; 1.3% for 2018; and 1.5% from 2019
onwards).
The Provision for pension and other plans amounted to 34 million euros at June 30, 2017 (28 million
euros at December 31, 2016) and mainly represented pension plans in place at foreign companies of
the Group.
The Provision for termination benefit incentives increased by a total of 2 million euros and included
the recognition of the net impacts resulting from the various agreements with the trade unions signed
during 2015 and 2016 by TIM S.p.A. and TI Information Technology (later merged into TIM S.p.A.) and by
other companies of the Domestic Business Unit. These agreements are part of the process of dialog
between the parties, aimed at managing redundancies resulting from the streamlining processes
affecting all the companies operating in the TLC sector.
The figure consists of 326 million euros for the Parent, 10 million euros for Telecom Italia Sparkle S.p.A.,
9 million euros for Olivetti S.p.A and a total of 5 million euros for the other companies of the Domestic
Business Unit.

TIM Group Half-year Condensed Consolidated Financial Statements at June 30, 2017
Note 16 Provisions 106
NOTE 16
PROVISIONS
Provisions increased by 160 million euros compared to December 31, 2016 and were broken down as
follows:
(millions of euros) 12/31/2016 Increase Taken to
income
Used directly Exchange
differences
and other
changes
6/30/2017
Provision for taxation and tax
risks 119 104 − (11) (4) 208
Provision for restoration costs 326 4 − (2) (2) 326
Provision for legal disputes 457 127 (1) (62) 4 525
Provision for commercial risks 46 1 − (1) (6) 40
Provision for risks and
charges on investments and
corporate-related transactions 28 − − − 6 34
Other provisions 8 4 (1) 11
Total 984 240 (1) (77) (2) 1,144
of which:
non-current portion 830 813
current portion 154 331
The provision for taxation and tax risks increased by 89 million euros compared to December 31,
2016. The increase was mainly due to the provision of 93 million euros by Telecom Italia Sparkle S.p.A.
as described in the Note Contingent Liabilities. The figure at June 30, 2017 was mainly attributable to
the Domestic Business Unit (144 million euros) and the Brazil Business Unit (61 million euros).
The provision for restoration costs related to the provision for the estimated cost of dismantling
tangible assets (in particular: batteries, wooden poles and equipment) and for the restoration of the
sites used for mobile telephony by the companies, with 322 million euros attributable to the Domestic
Business Unit.
The provision for legal disputes included the provision for litigation with employees, social security
entities, customers, regulatory authorities and other counterparties.
The figure at June 30, 2017 includes 443 million euros for the Domestic Business Unit and 82 million
euros for the Brazil Business Unit.
The provision for commercial risks is attributable to the Domestic Business Unit.

TIM Group Half-year Condensed Consolidated Financial Statements at June 30, 2017
Note 17 Trade and miscellaneous payables and other current liabilities 107
NOTE 17
TRADE AND MISCELLANEOUS PAYABLES AND
OTHER CURRENT LIABILITIES
Trade and miscellaneous payables and other current liabilities decreased by 590 million euros
compared to December 31, 2016 and were broken down as follows:
(millions of euros) 6/30/2017 12/31/2016
Payables on construction work (a) 26 25
Trade payables
Payables to suppliers 3,820 4,532
Payables to other telecommunication operators 349 323
(b) 4,169 4,855
Tax payables (c) 503 292
Miscellaneous payables and other current liabilities
Payables for employee compensation 377 319
Payables to social security agencies 146 215
Trade and miscellaneous deferred income 537 488
Advances received 25 53
Customer-related items 713 847
Payables for TLC operating fee 16 15
Dividends approved, but not yet paid to shareholders 17 33
Other current liabilities 173 320
Employee benefits (except for employee severance indemnities) for the
current portion expected to be settled within 1 year 23 30
Provisions for risks and charges for the current portion expected to be
settled within 1 year 331 154
(d) 2,358 2,474
Total (a+b+c+d) 7,056 7,646
Trade payables amounting to 4,169 million euros (4,855 million euros at December 31, 2016), mainly
refer to TIM S.p.A. (3,007 million euros) and to the companies of the Brazil Business Unit (797 million
euros).
Tax payables refer in particular to TIM S.p.A. and relate to the VAT payable (311 million euros), the
payable for the government concession tax (25 million euros) and the withholding tax payables to the tax
authorities as withholding agent (39 million euros). They also included other tax payables of the Brazil
Business Unit of 113 million euros.
Within miscellaneous payables and other current liabilities it is noted in particular that:
• trade and miscellaneous deferred income mainly consists of 268 million euros for interconnection
charges, 175 million euros for the deferral of revenues from the activation of telephone service, 17
million euros for traffic and charges, and 78 million euros for rent and maintenance payments;
• customer-related items largely consisted of the advance payments received by the Parent TIM S.p.A.
from its fixed-line telephony customers for deposits made for telephone calls and subscription
charges debited in advance;
• other current liabilities mainly relate to debt positions of the Parent TIM S.p.A..

TIM Group Half-year Condensed Consolidated Financial Statements at June 30, 2017
Note 18 Contingent liabilities, other information, commitments and
guarantees 108
NOTE 18
CONTINGENT LIABILITIES, OTHER
INFORMATION, COMMITMENTS AND
GUARANTEES
A description is provided below of the most significant judicial, arbitration and tax disputes in which TIM
Group companies are involved as of June 30, 2017, as well as those that came to an end during the
period.
The TIM Group has posted liabilities totalling 520 million euros for those disputes described below
where the risk of losing the case has been considered probable.
A) SIGNIFICANT DISPUTES AND PENDING LEGAL ACTIONS
For the following disputes and pending legal actions no significant facts have emerged with respect to
what was published in the 2016 Annual Report:
• international tax and regulatory disputes;
• administrative offence charge pursuant to Legislative Decree 231/2011 for the so-called TIM
Security Affair;
• irregularities concerning transactions for the leasing/rental of assets.
Telecom Italia Sparkle – Relations with I-Globe, Planetarium, Acumen, Accrue Telemedia and Diadem: investigation by the Public Prosecutor’s Office of Rome
The Rome Public Prosecutor's Office has challenged the judgement of the Court of Rome of October
2013 with which the three former managers of Telecom Italia Sparkle were fully acquitted of the charges
of transnational conspiracy for the purpose of tax evasion and false declarations through the use of
invoices or other documents for non-existent transactions ("carousel fraud"), also in relation to the
position of the Telecom Italia Sparkle employees; currently, judgement is pending in the Court of Appeal
in Rome. Telecom Italia Sparkle is still being investigated for the administrative offence pursuant to
Legislative Decree 231/2001, with the predicate offence of conspiracy and translational money
laundering.
Following the outcome of the immediate trial, the Company fully released the provisions for risk in the
profit and loss account during 2014 and obtained from the Judicial Authority the release and return of
all the sums issued to guarantee any obligations deriving from the application of Legislative Decree
231/2001; the sum of 1,549,000 euros, which corresponds to the maximum fine applicable for the
administrative offence, still remains under seizure.
As for risks of a fiscal nature, it should be noted that in February 2014 the Revenues Agency (Lazio
Regional Office) served three formal notifications of fines for the years 2005, 2006 and 2007, based on
the assumption that the telephone traffic in the “carousel fraud” did not exist. The amount of the fines –
25% of the “crime related costs” unduly deducted – total 280 million euros. In this respect the Company
has filed an appeal to the Provincial Tax Commission in April 2014. The Commission rejected the appeal
with a decision filed in May 2016.
The Company lodged an appeal with the Regional Tax Commission in October 2016, opposing the
judgement in the first instance, requesting a suspension of the enforcement of this first instance
judgement subject to presentation of an appropriate guarantee. In December 2016, the Regional Tax
Commission granted this suspension, fixing the date for a hearing on the merits in April 2017.

TIM Group Half-year Condensed Consolidated Financial Statements at June 30, 2017
Note 18 Contingent liabilities, other information, commitments and
guarantees 109
On 5 April 2017 the appeal was discussed before the Regional Tax Commission of Lazio. On 26 April
2017 the second tier ruling was filed (2310/2017 - sec. 11) which rejected the Company’s appeal.
During the same month of April an application was filed for the scrapping of the case - opened by
Equitalia following the unfavourable judgement of the Rome Provincial Tax Commission - concerning the
application for payment of 2/3rds of the sanction imposed earlier by the Revenues Agency; the probable
risk is therefore confirmed as totalling 93 million euros, provision for which was made in the first quarter
of 2017.
─ ● ─
It should be noted that for some of the disputes described below, it was not possible to make a
reliable estimate of the size and/or times of possible payments, if any, on the basis of the
information available at the closing date of the present document, particularly in light of the
complexity of the proceedings, the progress made, and the elements of uncertainty of a technical-
trial nature. Moreover, in those cases in which disclosure of information on a dispute could seriously
jeopardise the position of TIM or its subsidiaries, only the general nature of the dispute is described.
Of the disputes with the aforementioned characteristics, no significant facts have emerged for those
listed below with respect to the information published in the 2016 Annual Report:
• Italian Competition Authority Case I-761;
• WIND (I-761);
• VODAFONE (A428);
• VODAFONE;
• COLT TECHNOLOGY SERVICES;
• KPNQ West Italia S.p.A.;
• EUTELIA and VOICEPLUS;
• Vodafone Dispute - Universal Service;
• Olivetti – Asbestos exposure;
• POSTE;
• Elinet S.p.A. Bankruptcy;
• Dispute relative to "Adjustments on license fees" for the years 1994-1998;
• Brazil - Docas/JVCO Arbitration;
• Brazil – CAM JVCO Arbitration.
Antitrust Case A428
At the conclusion of case A428, in May 2013, Italian Competition Authority AGCM imposed two
administrative sanctions of 88,182,000 euros and 15,612,000 euros on TIM for abuse of its dominant
position. The Company allegedly (i) hindered or delayed activation of access services requested by OLOs
through unjustified and spurious refusals; (ii) offered its access services to final customers at economic
and technical conditions that allegedly could not be matched by competitors purchasing wholesale
access services from TIM itself, only in those geographic areas of the Country where disaggregated
access services to the local network are available, and hence where other operators can compete more
effectively with the Company.
TIM appealed against the decision before the Regional Administrative Court (TAR) for Lazio, applying for
payment of the fine to be suspended. In particular, it alleged: infringement of its rights to defend itself in
the proceedings, the circumstance that the organisational choices challenged by AGCM and allegedly at
the base of the abuse of the OLO provisioning processes had been the subject of specific rulings made
by the industry regulator (AGCom), the circumstance that the comparative examination of the
internal/external provisioning processes had in fact shown better results for the OLOs than for the TIM
retail department (hence the lack of any form of inequality of treatment and/or opportunistic behaviour
by TIM), and (regarding the second abuse) the fact that the conduct was structurally unsuitable to
reduce the margins of the OLOs.

TIM Group Half-year Condensed Consolidated Financial Statements at June 30, 2017
Note 18 Contingent liabilities, other information, commitments and
guarantees 110
In May 2014, the judgement of the Lazio TAR was published, rejecting TIM's appeal and confirming the
fines imposed in the original order challenged. In September 2014 the Company appealed against this
decision.
In May 2015, with the judgement no. 2497/15, the Council of State found the decision of the court of
first instance did not present the deficiencies alleged by TIM and confirmed the AGCM ruling. The
company had already proceeded to pay the fines and the accrued interest.
In a decision notified in July 2015, AGCM started proceedings for non-compliance against TIM, to
ascertain if the Company had respected the notice to comply requiring it to refrain from undertaking
behaviours analogous to those that were the object of the breach ascertained with the concluding
decision in case A428 dated May 2013.
On 13 January 2017 TIM was notified of the conclusive assessment of the Italian Competition Authority
(AGCM), acknowledging that TIM has fully complied with the judgement in proceedings A428 and that
therefore the conditions do not exist for the imposition of any sanctions for non-compliance.
AGCM recognises, furthermore, that TIM's behaviour subsequently to the 2013 proceedings has been
directed towards continuous improvement of its performance in the supply of wholesale access services
concerning not only the services which were the subject of the investigation, but also the new super-fast
broadband access services. In assessing compliance, AGCM recognised the positive impact of the
implementation, albeit not yet completed, of TIM's New Equivalence Model (NME). AGCM's decision
forces TIM to: (i) proceed with the implementation of the NME until its completion which is expected to
be by 30 April 2017; (ii) to inform the Authority about the performance levels of the systems for
providing wholesale access services and about the completion of the corresponding internal
reorganisation plan by the end of May 2017. Both impositions were promptly fulfilled.
Vodafone lodged an appeal with the Lazio Regional Administrative Court against the final decision in the
proceedings for non-compliance taken by AGCM. TIM filed an appearance, as it did in the further
proceedings brought in the month of March 2017 by the operators CloudItalia, Kpnqwest and Digitel.
VODAFONE (I-761)
With a writ of summons before the Milan Court, Vodafone has sued TIM and some network companies,
bringing claims for compensation from the Company for around 193 million euros for damages arising
from alleged anti-competitive conduct censured in the known ICA case I-761 (on corrective
maintenance) referring to the period from 2011 to 2017.
Like Wind before it, with which a similar judgement is pending, Vodafone contests the abuse of a
dominant market position allegedly carried out by TIM in the wholesale markets giving access to its fixed
network (LLU lines; Bitstream; WLR), through an unlawful agreement with the maintenance companies
to maintain the monopoly on the offer of corrective maintenance services on its network. In particular
this restrictive agreement would have concerned the coordination, by the Company, of the financial
conditions contained in the offers formulated by the aforementioned companies with respect to the
OLOs, for the maintenance service, at artificially high prices with respect to the cost of the maintenance
included in the regulated access subscription charge, in order to make it seem as if the unbundling of
the service itself were not convenient. The Company will file an appearance, contesting all of the other
party’s requests.
TELEUNIT
With a writ of summons before the Rome Court, Teleunit has claimed 35.4 million euros in
compensation from TIM, based on the known decision of the Italian Competition Authority that settled
the A428 case. Specifically, the other party complained that in the period 2009/2010 it had suffered
abusive conduct on TIM's part in the form of technical boycotting (refusals to activate network access
services - KOs), and anticompetitive practices in the form of margin squeezing (excessive squeezing of
discount margins, considered abusive inasmuch as it cannot be replicated by competitors). Telecom
Italia filed an appearance, contesting all of the plaintiff’s allegations.

TIM Group Half-year Condensed Consolidated Financial Statements at June 30, 2017
Note 18 Contingent liabilities, other information, commitments and
guarantees 111
With a writ of summons issued in October 2009 before the Milan Appeal Court, Teleunit asked that TIM
alleged acts of abuse of its dominant position in the premium services market be ascertained. The
plaintiff quantified its damages at a total of approximately 362 million euros. TIM filed an appearance,
contesting the claims of the other party.
After the ruling of January 2014 with which the Court of Appeal declared that it was not competent in
this matter and referred the case to the Court, Teleunit reinstated the case before the Milan Court the
following April. TIM filed an appearance in the reinstated proceedings challenging the plaintiff’s claims.
In its judgement of May 2017, the Milan Court rejected Teleunit's claim in its entirety, and ordered the
company to pay the legal costs of the case. This judgement was appealed by Teleunit, in June 2017,
before the Milan Court of Appeal. The Company will file an appeal challenging the arguments presented
by the other party and asking that the judgement in the first instance be fully confirmed.
Competition Authority case A514
In June 2017 the Italian Competition Authority (AGCM) started proceedings A514 against TIM, to
ascertain a possible abuse of its dominant market position in breach of article 102 of the Treaty on the
Functioning of the European Union. The proceedings were started based on some complaints filed in
May and June 2017, by Infratel, Enel, Open Fiber, Vodafone and Wind Tre, and concerns a presumed
abuse of TIM's dominant position in the market for wholesale access services and for retail services
using the broadband and ultrabroadband fixed network. In particular, the ICA hypothesised that TIM had
adopted conduct aimed at: i) slowing and hindering the course of the Infratel tender processes so as to
delay, or render less remunerative the entry of another operator in the wholesale market; ii) pre-
emptively securing customers on the retail market for ultrabroadband services by means of commercial
policies designed to restrict the space of customer contendibility remaining for the competitor operators.
After the start of the proceedings, the Authority's officials carried out an inspection at some of TIM’s
offices in the month of July 2017. The proceedings, within which the company will be upholding all its
arguments to support the correctness of its work, must be concluded by 31 October 2018.
SKY
TIM has started civil proceedings against SKY Italia in the Milan Court, asking the court to void the
partnership contract signed by the two companies in April 2014 for the delivery and marketing, between
2015 and 2019, of the SKY IPTV (Internet Protocol Television) offer on the TIM IPTV platform, due to
abuse of dominant position by the other party.
As an alternative, the Company also asked the court to reduce to a fair level the amounts demanded by
SKY by way of the so-called Guaranteed Minimums (“penalties”) established to SKY’s advantage and
related to predetermined customer sign-up and churn-rate thresholds in the five years of the
partnership.
Sky filed an appearance in February 2017, challenging TIM’s claim and demanding payment of the
Guaranteed Minimums it claimed to have accrued, a request which was opposed by the Company. The
proceedings are ongoing: the next hearing is scheduled for the month of May 2018.
Investigation by the Monza Public Prosecutor’s Office Criminal charges have recently been brought before the Monza Court regarding a number of
transactions for the leasing and/or sale of assets. At the end of the preliminary hearing, the judge
ordered a former employee of the Company to be committed for trial on charges of aggravated fraud and
tax crimes, and, at the same time, declared that the statute of limitations applied to other charges; at
the start of the trial, the Court declared that all the remaining offences were statute-barred. As part of
these proceedings TIM, which had filed a formal complaint against persons unknown in 2011, joined the
proceedings as a civil party as the person injured and damaged by the offence.

TIM Group Half-year Condensed Consolidated Financial Statements at June 30, 2017
Note 18 Contingent liabilities, other information, commitments and
guarantees 112
Brazil - Opportunity Arbitration
In May 2012, TIM and Telecom Italia International N.V (now merged in Telecom Italia Finance) were
served with a notice of arbitration proceedings brought by the Opportunity group, claiming compensation
for damages allegedly suffered for presumed breach of a settlement agreement signed in 2005. Based
on the claimant’s allegations, the damages relate to circumstances that emerged in the criminal
proceedings pending before the Milan Court regarding, inter alia, unlawful activities engaged in by
former employees of TIM.
The investigatory phase having been completed, the hearing for oral discussion took place in November
2014, after which the parties filed their concluding arguments in preparation for the decision on the
case.
In September 2015, the Board of Arbitration declared the proceedings closed, as the award was going to
be filed.
Subsequently, the Board of Arbitration allowed the parties to exchange short arguments and the ICC
Court extended the term for the filing of the award.
In September 2016 the ICC Court notified the parties of its judgement, based on which the Board of
Arbitration rejected all the claims made by the Opportunity group and decided that the legal costs,
administrative costs and costs for expert witnesses should be split between the parties.
In April 2017 the Opportunity group filed an appeal against the arbitration award before the Court of
Appeal of Paris.
Formal Notice of Assessments against TIM S.p.A.
On 29 October 2015 the Guardia di Finanza concluded a tax investigation into TIM S.p.A., started in
2013, regarding the years 2007 to 2014. The formal notice of assessment (Processo Verbale di
Costatazione, or PVC) contained two substantial findings. The first relates to the presumed non-debiting
of royalties to the company's indirect subsidiary Tim Brasil, for the use of the "TIM" brand. The second
regards the alleged non-application of withholding tax on interest paid to subsidiary Telecom Italia
Capital S.A.
In this regard, on the basis of the aforementioned formal notice of assessment, the Milan Revenues
Agency in December 2015 served assessment notices on the company for the 2010 tax year, and in
December 2016 it served assessment notices for the tax years 2007 and 2011.
While believing, on the basis of opinions issued by established professionals, that it has acted correctly
in fulfilling all its tax obligations, the Company has attempted to come to an agreement with the
Revenues Agency. Having failed to reach an agreement, as already occurred for the 2010 tax year, the
Company has lodged an appeal with the Provincial Tax Commission against the verification notices
relating to the 2007 and 2011 tax years too, in any event without excluding the possibility of coming to a
judicial settlement with the Revenues Agency, with the object of closing the disputes in pre-litigation
proceedings, for these and the other tax years.

TIM Group Half-year Condensed Consolidated Financial Statements at June 30, 2017
Note 18 Contingent liabilities, other information, commitments and
guarantees 113
B) OTHER INFORMATION
With reference to the cases listed below no significant facts have emerged with respect to that
published in the 2016 Annual Report:
Dispute concerning the license fees for 1998,
Vodafone (previously TELETU),
Mobile telephony - criminal proceedings
In March 2012 TIM was served notice of the conclusion of the preliminary enquiries, which showed that
the Company was being investigated by the Public Prosecutor of Milan pursuant to the Legislative
Decree n. 231/2001, for the offences of handling stolen goods and counterfeiting committed, according
to the alleged allegations, by fourteen employees of the so-called “ethnic channel”, with the participation
of a number of dealers, for the purpose of obtaining undeserved commissions from TIM.
The Company, as the injured party damaged by such conduct, had brought two legal actions in 2008
and 2009 and had proceeded to suspend the employees involved in the criminal proceedings
(suspension later followed by dismissal). It has also filed an initial statement of defence, together with a
technical report by its own expert, requesting that the proceedings against it be suspended, and that
charges of aggravated fraud against the Company be brought against the other defendants. In
December 2012, the Public Prosecutor's Office filed a request for 89 defendants and the Company itself
to be committed for trial.
During the preliminary hearing, the Company was admitted as civil party to the trial and, in November
2013, the conclusions in the interest of the civil party were filed, reaffirming TIM's total lack of
involvement in the offences claimed.
At the end of the preliminary hearing, which took place in March 2014, the Judge for the Preliminary
Hearing committed for trial all the defendants (including TIM) who had not asked for their situation to be
settled with alternative procedures, on the grounds that “examination in a trial” was needed. In April
2016, at the end of the first part of the trial, the Public Prosecutor asked for TIM to be sentenced to pay
an administrative fine of 900 thousand euros, but decided not to ask for confiscation of any of the
presumed profits of the offences (quantified in the committal proceedings as totalling several million
euros), based on the assumption that TIM had in any event remedied the presumed organisational
inadequacies. While acknowledging the considerable redimensioning of the accusations, the Company
has reiterated its total non-involvement in the facts at issue. In November 2016 the Court gave a verdict
acquitting the Company on the grounds that there was no case to answer. All the individuals charged
were also acquitted on various grounds. The acquittal judgement is not final, as it was challenged in
April 2017 by the Public Prosecutor who sought appeal before the Court of Cassation.
C) COMMITMENTS AND GUARANTEES
Guarantees, net of back-to-back guarantees received, amounted to 21 million euros.
The guarantees provided by third parties to Group companies, amounting to 5,356 million euros,
consisted of guarantees for loans received (1,688 million euros) and of performance under outstanding
contracts (3,668 million euros).
The guarantees provided by third parties for TIM S.p.A. obligations include the surety issued in favor of
the Ministry of Economic Development for 38 million euros, for the commitment made by the Company
to build equipment networks with eco-sustainable characteristics. In particular, the Company has made
a commitment to achieve energy savings in the new LTE technologies of approximately 10% on
infrastructure and 20% on transmission devices over a period of 5 years (compared to energy consumed
by current technology).
A surety was also issued in October 2016 on behalf of Telecom Italia Sparkle, in favor of the Italian
Revenue Agency - Lazio Regional Department, for 198 million euros, upon the outcome of the summary

TIM Group Half-year Condensed Consolidated Financial Statements at June 30, 2017
Note 18 Contingent liabilities, other information, commitments and
guarantees 114
suspension order for the provisional execution of the ruling issued by the Provincial Tax Commission of
Rome, which had rejected the Company’s appeal against the fines issued by the Italian Revenue Agency
- Lazio Regional Department for a total amount of 280 million euros (see paragraph a) - Significant
disputes and pending legal actions). The guarantee has been issued in accordance with Article 68 of
Italian Legislative Decree 546/1992 and gives the Italian Revenue Agency - Lazio Regional Department
the right, with respect to the appeal lodged by the Company, to collect an amount equal to 2/3 of the
original claim.
Main guarantees for loans at June 30, 2017
Issuer
Amount (millions of euros)
BBVA - Banco Bilbao Vizcaya Argentaria 368
SACE 368
Intesa Sanpaolo 220
Cassa Depositi e Prestiti 158
Barclays Bank 105
Ing 105
Unicredit 105
Commerzbank 57
Banco Santander 52
Sumitomo Mitsui Banking 52
Bank of Tokyo - Mitsubishi UFJ 52
The amounts shown in the table relate to loans issued by the EIB for the TIM Broadband Digital Divide,
TIM Ricerca & Sviluppo Banda Larga, TIM Rete Mobile a Banda Larga, and TIM RDI for Broadband
Services projects.
It is noted that the following guarantees from:
• Bank of Tokyo - Mitsubishi UFJ of 52 million euros,
• BBVA - Banco Bilbao Vizcaya Argentaria of 157 million euros, and
• Intesa Sanpaolo of 105 million euros,
relating to the loan granted by the EIB for the TIM Broadband Digital Divide/B project, and repaid in
advance in the amount of 300 million euros on December 27, 2016, will remain valid for 13 months
after the repayment as provided in the agreement to protect against clawback risk.
It is also noted that the Barclays Bank guarantee of 105 million euros, for the loan granted by the EIB for
the Digital Divide/C project, expired on April 17, 2017 and was replaced, as per the option granted to
TIM, with another guarantor bank. The guarantee will remain valid for 3 months after its expiry as
provided in the agreement to protect against clawback risk.
There are also surety bonds on the telecommunication services in Brazil for 571 million euros.
D) ASSETS PLEDGED TO GUARANTEE FINANCIAL LIABILITIES
The contracts for low-rate loans granted by the Brazilian development bank BNDES (Banco Nacional de
Desenvolvimento Econômico e Social) to Tim Celular for a total equivalent amount of 1,487 million
euros are covered by specific covenants. In the event of non-compliance with the covenant obligations,
BNDES will have a right to the receipts which transit on the bank accounts of the company.

TIM Group Half-year Condensed Consolidated Financial Statements at June 30, 2017
Note 19 Finance income and expenses 115
NOTE 19
FINANCE INCOME AND FINANCE EXPENSES
FINANCE INCOME
This item decreased by 902 million euros compared to first half of 2016, and was broken down as
follows:
(millions of euros) 1st Half 1st Half
2017 2016
Interest income and other finance income:
Income from financial receivables, recorded in Non-current assets − −
Income from securities other than investments, recorded in Non-current assets − −
Income from securities other than investments, recorded in Current
assets 6 8
Income other than the above:
Interest income 75 62
Exchange gains 518 613
Income from fair value hedge derivatives 32 31
Reversal of the Reserve for cash flow hedge derivatives to the income
statement (interest rate component) 290 344
Income from non-hedging derivatives 8 6
Miscellaneous finance income 12 25
(a) 941 1,089
Positive fair value adjustments to:
Fair value hedge derivatives − 77
Underlying financial assets and liabilities of fair value hedge derivatives 88 124
Non-hedging derivatives 81 722
(b) 169 923
Reversal of impairment loss on financial assets other than
investments (c) − −
Total (a+b+c) 1,110 2,012

TIM Group Half-year Condensed Consolidated Financial Statements at June 30, 2017
Note 19 Finance income and expenses 116
FINANCE EXPENSES
This item decreased by 307 million euros compared to first half of 2016, and was broken down as
follows:
1st Half 1st Half
(millions of euros) 2017 2016
Interest expenses and other finance expenses:
Interest expenses and other costs relating to bonds 552 566
Interest expenses to banks 57 57
Interest expenses to others 133 122
742 745
Commissions 44 49
Exchange losses 498 382
Charges from fair value hedge derivatives − −
Reversal of the Reserve for cash flow hedge derivatives to the income
statement (interest rate component) 244 304
Charges from non-hedging derivatives 17 34
Miscellaneous finance expenses 118 113
(a) 1,663 1,627
Negative fair value adjustments to:
Fair value hedge derivatives 82 124
Underlying financial assets and liabilities of fair value hedge derivatives - 75
Non-hedging derivatives 105 331
(b) 187 530
Impairment losses on financial assets other than investments (c) − −
Total (a+b+c) 1,850 2,157

TIM Group Half-year Condensed Consolidated Financial Statements at June 30, 2017
Note 19 Finance income and expenses 117
For greater clarity of presentation, the net effects relating to derivative financial instruments are
summarized in the following table:
1st Half 1st Half
(millions of euros) 2017 2016
Exchange gains 518 613
Exchange losses (498) (382)
Net exchange gains and losses 20 231
Income from fair value hedge derivatives 32 31
Charges from fair value hedge derivatives − −
Net result from fair value hedge derivatives (a) 32 31
Positive effect of the reversal of the Reserve of cash flow hedge
derivatives to the income statement (interest rate component) 290 344
Negative effect of the reversal of the Reserve of cash flow hedge
derivatives to the income statement (interest rate component) (244) (304)
Net effect of the Reversal of the Reserve of cash flow hedge derivatives to
the income statement (interest rate component) (b) 46 40
Income from non-hedging derivatives 8 6
Charges from non-hedging derivatives (17) (34)
Net result from non-hedging derivatives (c) (9) (28)
Net result from derivatives (a+b+c) 69 43
Positive fair value adjustments to fair value hedge derivatives − 77
Negative fair value adjustments to Underlying financial assets and
liabilities of fair value hedge derivatives − (75)
Net fair value adjustments (d) − 2
Positive fair value adjustments to Underlying financial assets and
liabilities of fair value hedge derivatives 88 124
Negative fair value adjustments to fair value hedge derivatives (82) (124)
Net fair value adjustments (e) 6 −
Net fair value adjustments to fair value hedge derivatives and
underlyings (d+e) 6 2
Positive fair value to non-hedging derivatives (f) 81 722
Negative fair value adjustments to non-hedging derivatives (g) (105) (331)
Net fair value adjustments to non-hedging derivatives (f+g) (24) 391

TIM Group Half-year Condensed Consolidated Financial Statements at June 30, 2017
Note 20 Profit (loss) for the period 118
NOTE 20
PROFIT (LOSS) FOR THE PERIOD
Profit for the period decreased by 451 million euros compared to first half of 2016 and may be broken
down as follows:
1st Half 1st Half
(millions of euros) 2017 2016
Profit (loss) for the period 654 1,105
Attributable to:
Owners of the Parent:
Profit (loss) from continuing operations 596 1,021
Profit (loss) from Discontinued operations/Non-current assets held for sale − (3)
Profit (loss) for the period attributable to owners of the Parent 596 1,018
Non-controlling interests:
Profit (loss) from continuing operations 58 37
Profit (loss) from Discontinued operations/Non-current assets held for sale − 50
Profit (loss) for the period attributable to non-controlling interests 58 87

TIM Group Half-year Condensed Consolidated Financial Statements at June 30, 2017
Note 21 Earnings per share 119
NOTE 21
EARNINGS PER SHARE
1st Half
2017
1st Half
2016
Basic earnings per share
Profit (loss) for the period attributable to owners of the Parent 596 1,018
Less: additional dividends for the savings shares (0.011 euros per share and up to capacity) (66) (66)
(millions of euros) 530 952
Average number of ordinary and savings shares (millions) 21,067 21,126
Basic earnings per share – Ordinary shares (euros) 0.03 0.05
Plus: additional dividends per savings share 0.01 0.01
Basic earnings per share – Savings shares (euros) 0.04 0.06
Basic earnings per share from continuing operations
Profit (loss) from continuing operations attributable to Owners
of the Parent 596 1,021
Less: additional dividends for the savings shares (66) (66)
(millions of euros) 530 955
Average number of ordinary and savings shares (millions) 21,067 21,126
Basic earnings per share from continuing operations – Ordinary
shares (euros) 0.03 0.05
Plus: additional dividends per savings share 0.01 0.01
Basic earnings per share from continuing operations – Savings
shares (euros) 0.04 0.06
Basic earnings per share from Discontinued operations/Non-
current assets held for sale
Profit (loss) from Discontinued operations/Non-current assets
held for sale (millions of euros) − 47
Average number of ordinary and savings shares (millions) 21,067 21,126
Basic earnings per share from Discontinued operations/Non-
current assets held for sale – Ordinary shares (euros) − −
Basic earnings per share from Discontinued operations/Non-current assets held for sale – Savings shares (euros) − −
1st Half
2017
1st Half
2016
Average number of ordinary shares 15,039,368,195 15,098,152,504
Average number of savings shares 6,027,791,699 6,027,791,699
Total 21,067,159,894 21,125,944,203

TIM Group Half-year Condensed Consolidated Financial Statements at June 30, 2017
Note 21 Earnings per share 120
1st Half
2017
1st Half
2016
Diluted earnings per share
Profit (loss) for the period attributable to owners of the Parent 596 1,018
Dilution effect of stock option plans and convertible bonds (*) 29 (437)
Less: additional dividends for the savings shares (0.011 euros per
share and up to capacity) (66) (66)
(millions of euros) 559 515
Average number of ordinary and savings shares (millions) 22,219 19,364
Diluted earnings per share – Ordinary shares (euros) 0.03 0.03
Plus: additional dividends per savings share 0.01 0.01
Diluted earnings per share – Savings shares (euros) 0.04 0.04
Diluted earnings per share from continuing operations
Profit (loss) from continuing operations attributable to Owners of
the Parent 596 1,021
Dilution effect of stock option plans and convertible bonds (*) 29 (437)
Less: additional dividends for the savings shares (66) (66)
(millions of euros) 559 518
Average number of ordinary and savings shares (millions) 22,219 19,364
Diluted earnings per share from continuing operations – Ordinary
shares (euros) 0.03 0.03
Plus: additional dividends per savings share 0.01 0.01
Diluted earnings per share from continuing operations – Savings
shares (euros) 0.04 0.04
Diluted earnings per share from Discontinued operations/Non-
current assets held for sale
Profit (loss) from Discontinued operations/Non-current assets held for sale (millions of euros) − 47
Dilution effect of stock option plans and convertible bonds − −
Average number of ordinary and savings shares (millions) 22,219 19,364
Diluted earnings per share from Discontinued operations/Non-
current assets held for sale – Ordinary shares (euros) − −
Diluted earnings per share from Discontinued operations/Non-
current assets held for sale – Savings shares (euros) − −
1st Half
2017
1st Half
2016
Average number of ordinary shares (*) 16,191,454,392 13,336,157,383
Average number of savings shares 6,027,791,699 6,027,791,699
Total 22,219,246,091 19,363,949,082
(*) The average number of ordinary shares also includes the potential ordinary shares relating to the equity compensation plans of
employees for which the (market and non-market) performance conditions have been met, in addition to the theoretical number
of shares that are issuable as a result of the conversion of the unsecured equity-linked convertible bond. Consequently, the “Net
profit (loss) for the period attributable to Owners of the Parent” and the “Profit (loss) from continuing operations attributable to
Owners of the Parent” have also been adjusted to exclude the effects, net of tax, related to the above-mentioned plans and to the
convertible bond (+29 million euros in the 1st Half 2017).

TIM Group Half-year Condensed Consolidated Financial Statements at June 30, 2017
Note 21 Earnings per share 121
POTENTIAL FUTURE CHANGES IN SHARE CAPITAL
The table below shows future potential changes in share capital, based on: the issuance of the
convertible bond by TIM S.p.A. in March 2015; the authorizations to increase the share capital in place
at June 30, 2017; and the options and rights granted under equity compensation plans, still outstanding
at June 30, 2017:
Number of maximum shares
issuable
Share capital (thousands of
euros)
Additional Paid-in
capital (thousands
of euros)
Subscription price per
share (euros)
Additional capital increases not yet approved (ordinary shares)
2014-2016 Stock Option Plan
133,042
343,069
893,617
13,555,651
73
189
492
7,455
80
158
393
5,287
1.15
1.01
0.99
0.94
Total additional capital increases not yet approved (ordinary shares)
14,925,379 8,209 5,918
Capital increases already approved (ordinary shares)
2015 Convertible Bond (ordinary shares) (*) 1,082,485,386 2,000,000 n.a. n.a.
Convertible bonds 2,000,000
Total 2,008,209
(*) The number of shares potentially issuable shown may be subject to adjustments.
Further information is provided in the Notes "Financial liabilities (non-current and current)" and "Equity
compensation plans".

TIM Group Half-year Condensed Consolidated Financial Statements at June 30, 2017
Note 22 Segment reporting
122
NOTE 22
SEGMENT REPORTING
A) SEGMENT REPORTING
Segment reporting is based on the following operating segments:
• Domestic
• Brazil
• Other Operations

TIM Group Half-year Condensed Consolidated Financial Statements at June 30, 2017
Note 22 Segment reporting 123
Separate Consolidated Income Statements by Operating Segment
(millions of euros) Domestic Brazil Other Operations Adjustments and
eliminations
Consolidated Total
1st Half
2017
1st Half
2016
1st Half
2017
1st Half
2016
1st Half
2017
1st Half
2016
1st Half
2017
1st Half
2016
1st Half
2017
1st Half
2016
Third-party revenues 7,480 7,231 2,292 1,857 − 8 − − 9,772 9,096
Intragroup revenues 14 16 1 1 − 1 (15) (18) − −
Revenues by operating segment 7,494 7,247 2,293 1,858 − 9 (15) (18) 9,772 9,096
Other income 199 98 18 10 − 1 − (2) 217 107
Total operating revenues and other income 7,693 7,345 2,311 1,868 − 10 (15) (20) 9,989 9,203
Acquisition of goods and services (2,976) (2,812) (1,169) (978) (2) (5) 11 12 (4,136) (3,783)
Employee benefits expenses (1,348) (1,384) (178) (161) (4) (7) − 1 (1,530) (1,551)
of which: accruals to employee severance
indemnities (1) (1) − − − − − − (1) (1)
Other operating expenses (311) (276) (262) (224) (3) (2) − 1 (576) (501)
of which: write-downs and expenses in connection
with credit management and provision charges (200) (162) (86) (69) − − − − (286) (231)
Change in inventories 45 32 5 8 − (7) − − 50 33
Internally generated assets 258 279 55 43 − − 4 3 317 325
EBITDA 3,361 3,184 762 556 (9) (11) − (3) 4,114 3,726
Depreciation and amortization (1,675) (1,596) (575) (450) − − 1 (1) (2,249) (2,047)
Gains/(losses) on disposals of non-current assets (1) (2) 7 15 − − − − 6 13
Impairment reversals (losses) on non-current assets − (5) − − − − − − − (5)
EBIT 1,685 1,581 194 121 (9) (11) 1 (4) 1,871 1,687
Share of profits (losses) of associates and joint
ventures accounted for using the equity method (1) (2) − − − − − − (1) (2)
Other income (expenses) from investments (19) 7
Finance income 1,110 2,012
Finance expenses (1,850) (2,157)
Profit (loss) before tax from continuing operations 1,111 1,547
Income tax expense (457) (489)
Profit (loss) from continuing operations 654 1,058
Profit (loss) from Discontinued operations/Non-current assets held for sale − 47
Profit (loss) for the period 654 1,105
Attributable to:
Owners of the Parent 596 1,018
Non-controlling interests 58 87
Revenues by operating segment
(millions of euros) Domestic Brazil Other Operations Adjustments and
eliminations
Consolidated Total
1st Half
2017
1st Half
2016
1st Half
2017
1st Half
2016
1st Half
2017
1st Half
2016
1st Half
2017
1st Half
2016
1st Half
2017
1st Half
2016
Revenues from equipment sales - third party 655 430 116 118 − 8 − − 771 556
Revenues from equipment sales - intragroup − − − − − 1 − (1) − −
Total revenues from equipment sales 655 430 116 118 − 9 − (1) 771 556
Revenues from services - third party 6,827 6,804 2,176 1,739 − − − − 9,003 8,543
Revenues from services - intragroup 14 16 1 1 − − (15) (17) − −
Total revenues from services 6,841 6,820 2,177 1,740 − − (15) (17) 9,003 8,543
Revenues on construction contracts - third party (2) (3) − − − − − − (2) (3)
Revenues on construction contracts-intragroup − − − − − − − − − −
Total revenues on construction contracts (2) (3) − − − − − − (2) (3)
Total third-party revenues 7,480 7,231 2,292 1,857 − 8 − − 9,772 9,096
Total intragroup revenues 14 16 1 1 − 1 (15) (18) − −
Total revenues by operating segment 7,494 7,247 2,293 1,858 − 9 (15) (18) 9,772 9,096

TIM Group Half-year Condensed Consolidated Financial Statements at June 30, 2017
Note 22 Segment reporting 124
Purchase of intangible and tangible assets by operating segment
(millions of euros) Domestic Brazil Other Operations Adjustments and
eliminations
Consolidated Total
1st Half
2017
1st Half
2016
1st Half
2017
1st Half
2016
1st Half
2017
1st Half
2016
1st Half
2017
1st Half
2016
1st Half
2017
1st Half
2016
Purchase of intangible assets 436 465 237 244 − − − − 673 709
Purchase of tangible assets 1,212 1,208 201 189 − − − − 1,413 1,397
Total purchase of intangible and tangible
assets 1,648 1,673 438 433 − − − − 2,086 2,106
of which: capital expenditures 1,626 1,575 430 408 − − − − 2,056 1,983
of which: change in financial leasing
contracts 22 98 8 25 − − − − 30 123
Headcount by Operating Segment
(number) Domestic Brazil Other Operations Consolidated Total
6/30/2017 12/31/2016 6/30/2017 12/31/2016 6/30/2017 12/31/2016 6/30/2017 12/31/2016
Headcount 51,095 51,280 9,471 9,849 86 100 60,652 61,229
Assets and liabilities by Operating Segment
(millions of euros) Domestic Brazil Other Operations Adjustments and
eliminations
Consolidated Total
6/30/2017 12/31/2016 6/30/2017 12/31/2016 6/30/2017 12/31/2016 6/30/2017 12/31/2016 6/30/2017 12/31/2016
Non-current operating assets 47,508 47,428 6,958 7,711 4 5 1 1 54,471 55,145
Current operating assets 4,780 4,472 1,129 1,209 14 16 8 (1) 5,931 5,696
Total operating assets 52,288 51,900 8,087 8,920 18 21 9 − 60,402 60,841
Investments accounted for using the equity method 17 18 − − − − − − 17 18
Discontinued operations/Non-current assets held for sale − −
Unallocated assets 8,621 9,587
Total Assets 69,040 70,446
Total operating liabilities 8,970 8,968 1,646 2,397 51 57 (5) (16) 10,662 11,406
Liabilities directly associated with Discontinued operations/Non-current assets held for sale − −
Unallocated liabilities 34,759 35,487
Equity 23,619 23,553
Total Equity and Liabilities 69,040 70,446
B) REPORTING BY GEOGRAPHICAL AREA
Revenues Non-current operating assets
(millions of euros) Breakdown by location of operations Breakdown by location of customers Breakdown by location of operations
1st Half 2017 1st Half 2016 1st Half 2017 1st Half 2016 06/30/ 2017 12/31/ 2016
Italy (a) 7,312 7,079 6,878 6,620 47,080 46,948
Outside Italy (b) 2,460 2,017 2,894 2,476 7,391 8,197
Total (a+b) 9,772 9,096 9,772 9,096 54,471 55,145
C) INFORMATION ABOUT MAJOR CUSTOMERS
None of the TIM Group's customers exceeds 10% of consolidated revenues.

TIM Group Half-year Condensed Consolidated Financial Statements at June 30, 2017
Note 23 Related Party Transactions
125
NOTE 23
RELATED PARTY TRANSACTIONS
The following tables show the figures relating to related party transactions and the impact of those
amounts on the separate consolidated income statements, consolidated statements of financial
position and consolidated statements of cash flows.
Related party transactions, when not dictated by specific laws, were conducted at arm's length. The
transactions were carried out in accordance with the internal procedure that contains the rules aimed at
ensuring the transparency and fairness of related party transactions, in accordance with Consob
Regulation 17221/2010.
Up to May 4, 2017, the companies of the Generali group, Intesa Sanpaolo group, Mediobanca group and
Telefonica group (shareholders of the company Telco) were also considered related parties, based on
the provision of TIM's procedure for the management of transactions with related parties according to
which it applies "also to the participants in significant shareholder agreements according to Article 122
of the Consolidated Law on Finance, which govern the candidacy to the position of Director of the
Company, where the slate presented is the slate where the majority of the Directors nominated have
been drawn from". The members of the Board of Directors of TIM in office up to May 4, 2017 had in fact
been drawn from the list originally submitted by the shareholder Telco. With the reappointment of the
Board of Directors this circumstance no longer applied and the scope of related parties through
Directors was therefore amended.
On May 3 and June 1, 2017, the Board of Directors of TIM approved several changes to the Procedure
for the management of related party transactions, deciding, on a voluntary basis and therefore without
any obligations, to treat Vivendi as if it was the parent, in accordance with the Consob Regulation. The
process of identifying new entities that entered the scope of related parties essentially led to the
identification of all the entities with which the Group has significant relationships. The full list is currently
being completed.
The new Procedure for the management of related party transactions is available for consultation at the
website www.telecomitalia.com, “About Us” section – “Governance System” channel.
Lastly, you are reminded that the investment held in the Sofora – Telecom Argentina group, classified
under Discontinued operations/Non-current assets held for sale starting from the consolidated financial
statements at December 31, 2013, was sold on March 8, 2016.

TIM Group Half-year Condensed Consolidated Financial Statements at June 30, 2017
Note 23 Related Party Transactions
126
The effects on the individual line items of the separate consolidated income statements for the first half
of 2017 and 2016 are as follows:
SEPARATE CONSOLIDATED INCOME STATEMENT LINE ITEMS — FIRST HALF 2017
(millions of euros) Total
Associates,
subsidiaries of
associates and
joint ventures
Other related
parties (*)
Pension funds Key managers Total
related
parties
% of financial
statement item
(a) (b) (b/a)
Revenues 9,772 2 116 118 1.2
Other income 217 3 4 7 3.2
Acquisition of goods and services 4,136 11 88 99 2.4
Employee benefits expenses 1,530 1 40 13 54 3.5
Finance income 1,110 37 37 3.3
Finance expenses 1,850 9 31 40 2.2
(*) Vivendi Group and Companies belonging to the group that it belongs to; other related parties through directors, statutory auditors and key managers and
as participants in shareholder agreements pursuant to Article 122 of the Consolidated Law on Finance.
SEPARATE CONSOLIDATED INCOME STATEMENT LINE ITEMS — FIRST HALF 2016
(millions of euros) Total
Associates,
subsidiaries
of
associates
and joint
ventures
Other
related
parties (*)
Pension
funds
Key managers Total related
parties
Transactions
of
Discontinued
Operations
Total related parties net of
Discontinued
Operations
% of
financial
statement
item
(a) (b) (b/a)
Revenues 9,096 2 185 187 (23) 164 1.8
Other income 107 2 2 2 1.9
Acquisition of goods and
services 3,783 11 113 124 (14) 110 2.9
Employee benefits expenses 1,551 1 41 24 66 66 4.3
Finance income 2,012 60 60 60 3.0
Finance expenses 2,157 67 67 67 3.1
Profit (loss) from
Discontinued
operations/Non-current
assets held for sale 47 (1) 10 9
(*) Other related parties both through directors, statutory auditors and key managers and as participants in shareholder agreements pursuant to Article 122 of the
Consolidated Law on Finance.

TIM Group Half-year Condensed Consolidated Financial Statements at June 30, 2017
Note 23 Related Party Transactions
127
The effects on the individual line items of the consolidated statements of financial position of the Group
at June 30, 2017 and at December 31, 2016 are as follows:
CONSOLIDATED STATEMENT OF FINANCIAL POSITION LINE ITEMS AT 6/30/2017
(millions of euros) Total
Associates,
subsidiaries of
associates and
joint ventures
Other related
parties (*)
Pension funds Total related
parties
% of financial
statement item
(a) (b) (b/a)
Net financial debt
Non-current financial assets (2,185)
Securities other than investments
(current assets) (1,102) (5) (5) 0.5
Financial receivables and other
current financial assets (630)
Cash and cash equivalents (4,086)
Current financial assets (5,818) (5) (5) 0.1
Non-current financial
liabilities 28,887
Current financial liabilities 4,844
Total net financial debt 25,728 (5) (5)
Other statement of financial position line items
Trade and miscellaneous
receivables and other current assets 5,617 15 15 0.3
Trade and miscellaneous payables
and other current liabilities 7,056 24 25 27 76 1.1
(*) Vivendi Group and Companies belonging to the group that it belongs to; other related parties through directors, statutory auditors and key managers.

TIM Group Half-year Condensed Consolidated Financial Statements at June 30, 2017
Note 23 Related Party Transactions
128
CONSOLIDATED STATEMENT OF FINANCIAL POSITION LINE ITEMS AT 12/31/2016
(millions of euros) Total Related Parties
Associates,
subsidiaries
of
associates
and joint
ventures
Other
related
parties (*)
Pension
funds Total
related
parties
Transactions of
Discontinued
Operations
Total related
parties net of
Discontinued
Operations
% of financial
statement
item
(a) (b) (b/a)
Net financial debt
Non-current financial
assets (2,698) (12) (520) (532) (532) 19.7
Securities other than
investments (current assets) (1,519) (110) (110) (110) 7.2
Financial receivables and other
current financial assets (389) (22) (22) (22) 5.7
Cash and cash equivalents (3,964) (621) (621) (621) 15.7
Current financial assets (5,872) (753) (753) (753) 12.8
Non-current financial
liabilities 30,469 912 912 912 3.0
Current financial
liabilities 4,056 133 133 133 3.3
Total net financial debt 25,955 (12) (228) (240) (240) (0.9)
Other statement of
financial position line
items
Trade and miscellaneous
receivables and other current
assets 5,426 9 127 136 136 2.5
Miscellaneous payables and
other non-current liabilities 1,607 2 2 2 0.1
Trade and miscellaneous
payables and other current
liabilities 7,646 37 200 26 263 263 3.4
(*) Other related parties both through directors, statutory auditors and key managers and as participants in shareholder agreements pursuant to Article 122 of the
Consolidated Law on Finance.

TIM Group Half-year Condensed Consolidated Financial Statements at June 30, 2017
Note 23 Related Party Transactions
129
The effects on the significant line items of the consolidated statements of cash flows for the first half of
2017 and 2016 are as follows:
CONSOLIDATED STATEMENT OF CASH FLOWS LINE ITEMS — FIRST HALF 2017
(millions of euros) Total
Associates,
subsidiaries of
associates and
joint ventures
Other related
parties (*)
Pension funds Total related
parties
% of financial
statement item
(a) (b) (b/a)
Purchase of intangible and tangible
assets on an accrual basis 2,086 75 75 3.6
(*) Vivendi Group and Companies belonging to the group that it belongs to; other related parties through directors, statutory auditors and key managers and
as participants in shareholder agreements pursuant to Article 122 of the Consolidated Law on Finance.
CONSOLIDATED STATEMENT OF CASH FLOWS LINE ITEMS — FIRST HALF 2016
(millions of euros) Total Related Parties
Associates,
subsidiaries
of
associates
and joint
ventures
Other
related
parties (*)
Pension
funds Total
related
parties
Transactions of
Discontinued
Operations
Total related
parties net of
Discontinued
Operations
% of financial
statement
item
(a) (b) (b/a)
Purchase of intangible and
tangible assets on an accrual
basis 2,106 63 63 63 3.0
(*) Other related parties both through directors, statutory auditors and key managers and as participants in shareholder agreements pursuant to Article 122 of
the Consolidated Law on Finance.

TIM Group Half-year Condensed Consolidated Financial Statements at June 30, 2017
Note 23 Related Party Transactions
130
TRANSACTIONS WITH ASSOCIATES, SUBSIDIARIES OF ASSOCIATES AND JOINT VENTURES
The most significant amounts are summarized as follows:
SEPARATE CONSOLIDATED INCOME STATEMENT LINE ITEMS
(millions of euros) 1st Half 1st Half
2017 2016 TYPE OF CONTRACT
Revenues
Italtel group 1 1
Provision of equipment rental, fixed and mobile
telephone and outsourced communication services.
NordCom S.p.A. 1
Fixed and mobile voice services, data network
connections and outsourced ICT products and
services.
Other minor companies 1
Total revenues 2 2
Other income 3
Contributions governed by partnership agreements
and penalties with respect to the Italtel group.
Acquisition of goods and services
Italtel group 9 9
Supply and maintenance of switching equipment,
software development and platforms upgrading, and
customized products and services, as part of TIM
offerings to the Italtel group customers, and
extension of professional services for the new
Multimedia Video Data Center for the provision of the TIM Vision service.
W.A.Y. S.r.l. 2 1
Supply and installation of geolocation equipment
and provision of related technical support services within the TIM customer offering.
Other minor companies 1
Total acquisition of goods and
services 11 11
Finance expenses 9
Write-down of the financial receivable due from
Alfiere.

TIM Group Half-year Condensed Consolidated Financial Statements at June 30, 2017
Note 23 Related Party Transactions
131
CONSOLIDATED STATEMENT OF FINANCIAL POSITION LINE ITEMS
(millions of euros) 6/30/2017 12/31/2016 TYPE OF CONTRACT
Net financial debt
Non-current financial assets 12 Shareholder loans to Alfiere S.p.A.
Other statement of financial
position line items
Trade and miscellaneous
receivables and other current
assets
Alfiere S.p.A. 1
Contracts for project management, administration,
corporate and compliance services, and sundry
chargebacks.
Italtel group 12 6
Provision of equipment rental, fixed and mobile
telephone and outsourced communication services.
W.A.Y. S.r.l. 1 1
Supply of fixed-line telephony, ICT and mobile
services.
Other minor companies 1 2
Total trade and miscellaneous
receivables and other current
assets 15 9
Trade and miscellaneous
payables and other current
liabilities
Italtel group 21 33
Supply transactions connected with investment and
operations activities.
Dono per… S.c.a.r.l. 1
Payable for fixed and mobile calls made by TIM customers for charity initiatives.
Movenda S.p.A. 1
SIM-card supply and certification and functional
development of IT platforms.
NordCom S.p.A. 1
Supply and development of IT solutions, provision of
customized services as part of TIM offerings to end
customers, and rental expense for base transceiver station housing.
W.A.Y. S.r.l. 1 2
Supply and installation of geolocation equipment
and provision of related technical support services
within the TIM customer offering.
Other minor companies 1
Total trade and miscellaneous
payables and other current
liabilities 24 37
CONSOLIDATED STATEMENT OF CASH FLOWS LINE ITEMS
1st Half 1st Half
(millions of euros) 2017 2016 TYPE OF CONTRACT
Purchase of intangible and
tangible assets on an accrual
basis
Italtel group 74 63 Purchases of telecommunications equipment.
Other minor companies 1
Total purchase of intangible and
tangible assets on an accrual
basis 75 63
The shareholder loan with Alfiere S.p.A. in place at December 31, 2016 was increased by 3 million
euros in the first half of 2017 and subsequently converted into an equity interest amounting to 6
million euros. The remaining amount, of 9 million euros, was fully written down.
At June 30, 2017, TIM S.p.A. had issued guarantees in favor of the joint venture Alfiere S.p.A. for 1
million euros.

TIM Group Half-year Condensed Consolidated Financial Statements at June 30, 2017
Note 23 Related Party Transactions
132
TRANSACTIONS WITH OTHER RELATED PARTIES (BOTH THROUGH DIRECTORS, STATUTORY AUDITORS AND KEY MANAGERS AND AS PARTICIPANTS IN SHAREHOLDER AGREEMENTS PURSUANT TO ARTICLE 122 OF THE CONSOLIDATED LAW ON FINANCE)
Details are provided below of the transactions with:
• Companies (and related groups) formerly shareholders of Telco S.p.A. (in short “Former Telco
Companies”) namely: the Mediobanca group, the Generali group, the Intesa Sanpaolo group and the
Telefonica group. – Up to May 4, 2017;
• Related companies through Directors whose term of office ended on May 4, 2017;
• Vivendi Group and the companies of the group it belongs to (as a result of the resolutions of the
Board of Directors of TIM S.p.A. of May 3 and June 1, 2017);
• Related companies through Directors appointed on May 4, 2017.
The most significant amounts are summarized as follows:

TIM Group Half-year Condensed Consolidated Financial Statements at June 30, 2017
Note 23 Related Party Transactions
133
SEPARATE CONSOLIDATED INCOME STATEMENT LINE ITEMS
(millions of euros) 1st Half 1st Half
2017 2016 TYPE OF CONTRACT
Revenues
Generali group 12 25
Supply of telephone and data transmission services,
peripheral data networks, connections, storage, and
telecommunications products and services.
Intesa Sanpaolo group 31 34
Telephone services, MPLS data and international
network, ICT services and Microsoft licenses,
Internet connectivity and high-speed connections.
Mediobanca group 3 3
Telephone and MPLS data network services and
marketing of data devices and sale of equipment for
fixed and mobile networks.
RCS Media Group 2 Fixed-line telephony service.
Telefónica group 70 121
Interconnection services, roaming, broadband
access fees, supply of "IRU" transmission capacity
and software.
Total revenues 116 185
Other income 4 2 Generali group damage compensation.
Acquisition of goods and services
Bollorè-Havas group 12
Conception, planning and implementation of
advertising campaigns for products and services for
the TIM Group.
Generali group 7 11 Insurance premiums and property leases.
Intesa Sanpaolo group 5 6
Factoring fees, fees for smart card top-ups/activation and commissions for payment of
telephone bills by direct debit and collections via
credit cards.
Mediobanca group 1 1 Credit recovery activities.
RCS Media Group 1
Provision of content and digital publishing services
and fees for telephone top-up services.
Telefónica group 59 91
Interconnection and roaming services, site sharing,
co-billing agreements, broadband linesharing and
unbundling.
Vivendi group 4 3
Purchase of musical and television digital content
(TIMmusic and TIMvision) and supply of D&P cloud-
based games (TIMgames).
Total acquisition of goods and
services 88 113
Employee benefits expenses 1 1
Generali group insurance related to the work of
personnel.
Finance income
Intesa Sanpaolo group 27 47 Bank accounts, deposits and hedging derivatives.
Mediobanca group 8 10 Bank accounts, deposits and hedging derivatives.
Telefónica group 2 3 Finance lease.
Total finance income 37 60
Finance expenses
Intesa Sanpaolo group 23 54
Term Loan Facility, Revolving Credit Facility, hedging
derivatives, loans and bank accounts.
Mediobanca group 8 13
Term Loan Facility and Revolving Credit Facility and
hedging derivatives.
Total finance expenses 31 67
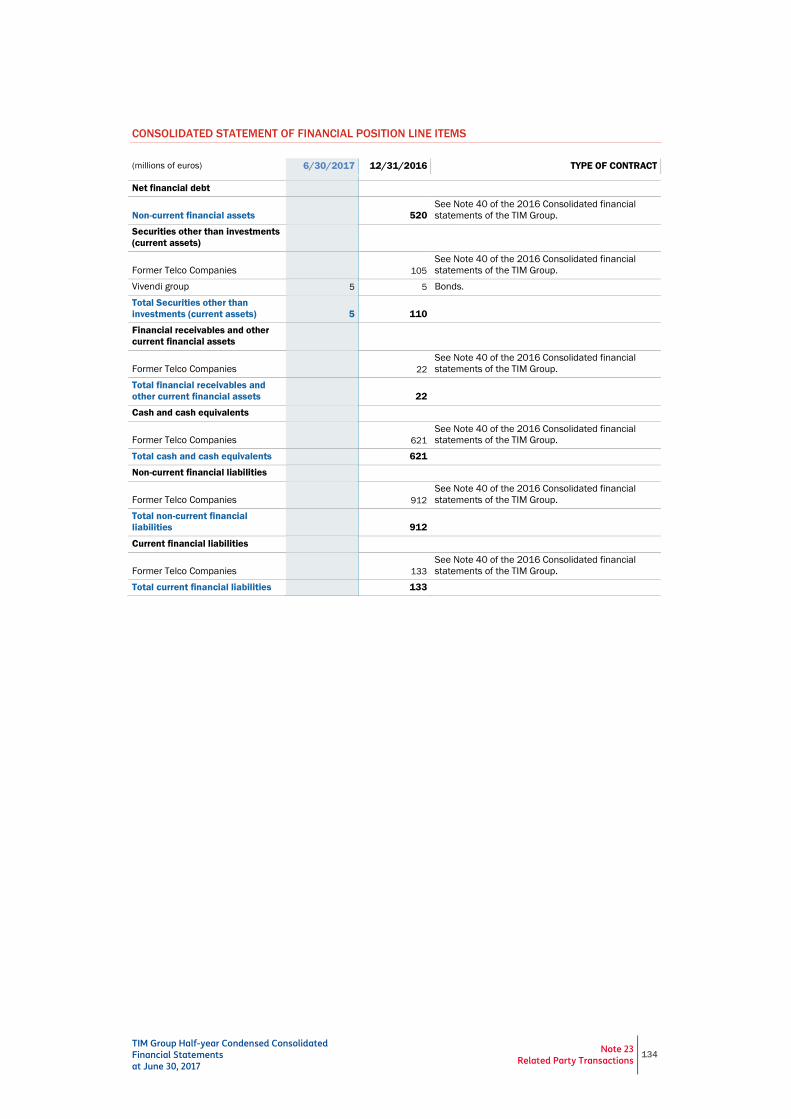
TIM Group Half-year Condensed Consolidated Financial Statements at June 30, 2017
Note 23 Related Party Transactions
134
CONSOLIDATED STATEMENT OF FINANCIAL POSITION LINE ITEMS
(millions of euros) 6/30/2017 12/31/2016 TYPE OF CONTRACT
Net financial debt
Non-current financial assets 520
See Note 40 of the 2016 Consolidated financial
statements of the TIM Group.
Securities other than investments
(current assets)
Former Telco Companies 105
See Note 40 of the 2016 Consolidated financial
statements of the TIM Group.
Vivendi group 5 5 Bonds.
Total Securities other than
investments (current assets) 5 110
Financial receivables and other
current financial assets
Former Telco Companies 22
See Note 40 of the 2016 Consolidated financial
statements of the TIM Group.
Total financial receivables and
other current financial assets 22
Cash and cash equivalents
Former Telco Companies 621
See Note 40 of the 2016 Consolidated financial statements of the TIM Group.
Total cash and cash equivalents 621
Non-current financial liabilities
Former Telco Companies 912
See Note 40 of the 2016 Consolidated financial
statements of the TIM Group.
Total non-current financial
liabilities 912
Current financial liabilities
Former Telco Companies 133
See Note 40 of the 2016 Consolidated financial
statements of the TIM Group.
Total current financial liabilities 133

TIM Group Half-year Condensed Consolidated Financial Statements at June 30, 2017
Note 23 Related Party Transactions
135
(millions of euros) 6/30/2017 12/31/2016 TYPE OF CONTRACT
Other statement of financial
position line items
Trade and miscellaneous
receivables and other current
assets
Former Telco Companies 127
See Note 40 of the 2016 Consolidated financial
statements of the TIM Group.
Total trade and miscellaneous
receivables and other current
assets 127
Miscellaneous payables and other
non-current liabilities
Former Telco Companies 2
See Note 40 of the 2016 Consolidated financial statements of the TIM Group.
Total miscellaneous payables and
other non-current liabilities 2
Trade and miscellaneous
payables and other current
liabilities
Bollorè-Havas group 22
Conception, planning and implementation of
advertising campaigns for products and services for
the TIM Group.
Former Telco Companies 196
See Note 40 of the 2016 Consolidated financial
statements of the TIM Group.
Vivendi group 3 4
Purchase of musical and television digital content
(TIMmusic and TIMvision).
Total trade and miscellaneous
payables and other current
liabilities 25 200

TIM Group Half-year Condensed Consolidated Financial Statements at June 30, 2017
Note 23 Related Party Transactions
136
TRANSACTIONS WITH PENSION FUNDS
The most significant amounts are summarized as follows:
SEPARATE CONSOLIDATED INCOME STATEMENT LINE ITEMS
(millions of euros) 1st Half 1st Half
2017 2016 TYPE OF CONTRACT
Employee benefits expenses Contributions to pension funds.
Fontedir 5 6
Telemaco 33 34
Other pension funds 2 1
Total employee benefits expenses 40 41
CONSOLIDATED STATEMENT OF FINANCIAL POSITION LINE ITEMS
(millions of euros) 6/30/2017 12/31/2016 TYPE OF CONTRACT
Trade and miscellaneous payables
and other current liabilities Payables for contributions to pension funds.
Fontedir 3 4
Telemaco 22 21
Other pension funds 2 1
Trade and miscellaneous payables
and other current liabilities 27 26

TIM Group Half-year Condensed Consolidated Financial Statements at June 30, 2017
Note 23 Related Party Transactions
137
REMUNERATION TO KEY MANAGERS
In the first half of 2017, the total remuneration recorded on an accrual basis by TIM or by companies
controlled by the Group in respect of key managers amounted to 12.7 million euros (23.6 million euros
in the first half of 2016), broken down as follows: (millions of euros) 1st Half 1st Half
2017 2016
Short-term remuneration 5.5
7.6
Long-term remuneration 2.7
0.5
Employment termination benefit incentives
12.5
Share-based payments (*) 4.5
3.0
12.7 23.6
(*) These refer to the fair value of the rights, accrued to June 30, under the share-based incentive plans of TIM S.p.A. and its
subsidiaries (2014/2016 Stock Option Plan, Special Awards and Stock Option Plans of the South American subsidiaries).
Short-term remuneration is paid during the period it pertains to, and, at the latest, within the six months
following the end of that period.
The amounts shown in the table do not include:
• in the first half of 2017, the effects of the allocation of a total amount of 4.9 million euros – as the
2016/2019 Special Award for the discretionary amount allocated to the managers and/or directors
of TIM or its subsidiaries and consequently to several Key Managers;
• in the first half of 2016, the effects of the reversal of the accruals related to the costs for the
2014/2016 Stock Option Plan of –1.6 million euros.
In addition, in the first half of 2017, the beneficiaries of the Special Award were identified for the 1.5%
of the 2016 over-performance, already allocated in 2016.
The Key Managers, recipients of that bonus, were assigned a total amount of 1,850,000 euros (of which
1,480,000 euros consisted of 1,897,434 TIM ordinary shares). The payment is scheduled for after the
approval of the Financial Statements for the year 2019.
In the first half of 2017, the contributions paid in to defined contribution plans (Assida and Fontedir) by
TIM S.p.A. or by subsidiaries of the Group on behalf of key managers amounted to 47,000 euros
(46,000 euros in the first half of 2016).

TIM Group Half-year Condensed Consolidated Financial Statements at June 30, 2017
Note 23 Related Party Transactions
138
In the first half of 2017, the "Key Managers", i.e. those who have the power and responsibility, directly or
indirectly, for the planning, management and control of the operations of the TIM Group, including
directors, had been identified as follows:
Directors:
Arnaud Roy de Puyfontaine (1) Executive Chairman of TIM S.p.A.
Giuseppe Recchi (2) Executive Chairman of TIM S.p.A.
Flavio Cattaneo Managing Director and Chief Executive Officer of TIM S.p.A.
General Manager of TIM S.p.A.
Managers:
Stefano De Angelis Diretor Presidente Tim Participações S.A.
Stefano Azzi Head of Consumer & Small Enterprise
Stefano Ciurli Head of Wholesale
Giovanni Ferigo Head of Technology
Lorenzo Forina Head of Business & Top Clients
Francesco Micheli (3) Head of Human Resources & Organizational Development
Cristoforo Morandini Head of Regulatory Affairs and Equivalence
Agostino Nuzzolo (4) Head of Legal
Piergiorgio Peluso (5) Head of Administration, Finance and Control
(1) from June 1, 2017; (2) to May 31, 2017; (3) responsibility for the Human Resources & Organizational Development function has been assigned on an interim basis to
the Head of Group Special Projects, Francesco Micheli; (4) from January 10, 2017; (5) the Chief Financial Officer of the Company Piergiorgio Peluso has been assigned responsibility on an interim basis for the
Business Support Office function.

TIM Group Half-year Condensed Consolidated Financial Statements at June 30, 2017
Note 24 Equity compensation plans 139
NOTE 24
EQUITY COMPENSATION PLANS
Equity compensation plans in effect at June 30, 2017 are used for retention purposes and as a long-
term incentive for the managers and employees of the Group.
However, it should be noted that these plans do not have any significant effect on the economic result or
on the financial position or on cash flows at June 30, 2017.
DESCRIPTION OF STOCK OPTION PLANS
For a description of the:
– TIM S.p.A. 2014-2016 Stock Option Plan, and the
– Tim Participações S.A. 2011-2013 Stock Option Plan,
already in place at December 31, 2016, see the consolidated financial statements of the TIM Group at
that date.
Other Tim Participações S.A. Stock Option Plans.
• 2014-2016 Plan
On April 10, 2014, the General Meeting of Shareholders of Tim Participações S.A. approved the long-
term incentive plan for managers in key positions in the company and its subsidiaries.
Exercise of the options is not subject to the achievement of specific performance targets, but the
exercise price is adjusted upwards or downwards according to the performance of the Tim
Participações S.A. shares in a ranking of Total Shareholder Return, in which companies in the
Telecommunications, Information Technology and Media industry are compared during each year of
validity of the plan. If the performance of the Tim Participações S.A. shares, in the 30 days prior to
September 29 of each year, is in last place in that ranking, the participant loses the right to 25% of
the options vesting at that time.
The vesting period is 3 years (a third per year), the options are valid for 6 years, and the company
does not have the legal obligation to repurchase or liquidate the options in cash, or in any other
form.
Year 2014
On September 29, 2014, the grantees of the options were granted the right to purchase a total of
1,687,686 shares.
At December 31, 2016, a total of 623,027 options were considered lapsed due to failure to achieve
the minimum exercise conditions set in the Plan, whereas 502,097 of the remaining 1,064,659
options were considered vested. No option has been exercised. At June 30, 2017, a further 285,487
options had lapsed.
Year 2015
On October 16, 2015, the grantees of the options were granted the right to purchase a total of
3,355,229 shares.
At December 31, 2016, a total of 780,144 options were considered lapsed and 338,266 options
were considered vested.
At June 30, 2017, a total of 157,663 options had been exercised at a price of 8.7341 reais (initial
price of 8.4526 reais adjusted by 3.33%, in line with the positioning in the benchmarking). A further
387,197 options also lapsed.

TIM Group Half-year Condensed Consolidated Financial Statements at June 30, 2017
Note 24 Equity compensation plans 140
2016
On November 8, 2016, the grantees of the options were granted the right to purchase a total of
3,922,204 shares. At June 30, 2017, there were no options that could be considered as vested and
381,444 options had lapsed.
DESCRIPTION OF OTHER TIM S.p.A. EQUITY COMPENSATION PLANS
For the description of the Special Award 2016-2019, launched in 2016, see the 2016 Consolidated
financial statements of the TIM Group.
In the first half of 2017, the beneficiaries of the Special Award were identified for the 1.5% of the 2016
over-performance.
The Key Managers, recipients of that bonus, were assigned a total amount of 1,850,000 euros (of which
1,480,000 euros consisted of 1,897,434 TIM S.p.A. ordinary shares). The payment is scheduled for
after the approval of the Financial Statements for the year 2019.
On July 24, 2017, following the resignation of Mr. Cattaneo, an agreement was reached between the
parties that provides for the payment of a gross amount of 22.9 million euros as a settlement
arrangement. This amount takes particular, but not exclusive, account of the Special Award.

TIM Group Half-year Condensed Consolidated Financial Statements at June 30, 2017
Note 25 Significant non-recurring events and transactions 141
NOTE 25
SIGNIFICANT NON-RECURRING EVENTS AND
TRANSACTIONS
The effect of non-recurring events and transactions of the first half of 2017 on equity, profit, net
financial debt and cash flows of the TIM Group is set out below in accordance with Consob
Communication DEM/6064293 of July 28, 2006. The non-recurring effects on Equity and Profit (loss) for
the period are shown net of tax effects.
(millions of euros) Equity Profit (loss)
for the period
Net financial
debt
Cash flows
carrying
amount
(*)
Amount – financial statements (a) 23,619 654 25,728 229
Acquisition of goods and services - Expenses related to agreements and the development of non-recurring projects (1) (1) 8 (8)
Employee benefits expenses - Expenses related to
restructuring and rationalization (7) (7) 65 (65)
Other operating expenses - Expenses related to disputes
and regulatory penalties and liabilities related to those
expenses, and expenses related to disputes with former employees and liabilities with customers and/or suppliers (61) (61) 103 (103)
Gains on disposals of non-current assets (1) (1) − −
Finance expenses – Other finance expenses related to
litigations (10) (10) − −
Provision charges for Sparkle tax dispute (93) (93) − −
Total non-recurring effects (b) (173) (173) 176 (176)
Figurative amount – financial statements (a-b) 23,792 827 25,552 405
(*) Cash flows refer to the increase (decrease) in Cash and Cash equivalents during the period.

TIM Group Half-year Condensed Consolidated Financial Statements at June 30, 2017
Note 25 Significant non-recurring events and transactions 142
The impact of non-recurring items on the separate consolidated income statement line items is as
follows:
(millions of euros) 1st Half 1st Half
2017 2016
Acquisition of goods and services:
Sundry expenses (2) −
Employee benefits expenses:
Expenses related to restructuring and rationalization (10) (75)
Other operating expenses:
Sundry expenses and provisions (83) (16)
Impact on Operating profit (loss) before depreciation and amortization, capital gains
(losses) and impairment reversals (losses) on non-current assets (EBITDA) (95) (91)
Gains (losses) on non-current assets:
Gains on disposals of non-current assets − 9
Losses on disposals of non-current assets (1) −
Impact on EBIT – Operating profit (loss) (96) (82)
Finance expenses:
Interest expenses and miscellaneous finance expenses (14) (11)
Impact on profit (loss) before tax from continuing operations (110) (93)
Effect on income taxes on non-recurring items 30 27
Provision charges for Sparkle tax dispute (93) −
Discontinued operations – Effect of the disposal of the Sofora – Telecom Argentina
group − (12)
Impact on profit (loss) for the period (173) (78)

TIM Group Half-year Condensed Consolidated Financial Statements at June 30, 2017
Note 27 Other information 143
NOTE 26
POSITIONS OR TRANSACTIONS RESULTING
FROM ATYPICAL AND/OR UNUSUAL
OPERATIONS
In accordance with Consob Communication DEM/6064293 of July 28, 2006, a statement is made to the
effect that in the first half of 2017 no atypical and/or unusual transactions, as defined by that
Communication, were carried out.
NOTE 27
OTHER INFORMATION
A) EXCHANGE RATES USED TO TRANSLATE THE FINANCIAL STATEMENTS OF FOREIGN OPERATIONS(*)
Period-end exchange rates Average exchange rates for the period
(statements of financial position) (income statements and statements of
cash flows)
(local currency against 1 euro) 6/30/2017 12/31/2016 1st Half 2017 1st Half 2016
Europe
BGN Bulgarian Lev 1.95580 1.95580 1.95580 1.95580
CZK Czech koruna 26.19700 27.02100 26.78393 27.03985
CHF Swiss franc 1.09300 1.07390 1.07656 1.09582
TRY Turkish lira 4.01340 3.70720 3.93800 3.25790
GBP Pound sterling 0.87933 0.85618 0.86027 0.77859
RON Romanian leu 4.55230 4.53900 4.53675 4.49533
RUB Russian Ruble 67.54500 64.30000 62.75611 78.30656
North America
USD U.S. dollar 1.14120 1.05410 1.08279 1.11572
Latin America
VEF Venezuelan bolivar 15.40620 14.23035 14.57744 15.02350
BOB Bolivian Bolíviano 7.88569 7.28383 7.48209 7.70963
PEN Peruvian nuevo sol 3.70976 3.54020 3.54696 3.77419
ARS Argentine peso 18.88510 16.74880 17.00284 15.98614
CLP Chilean peso 758.21400 704.94500 714.60792 769.03591
COP Colombian peso 3,478.65000 3,169.49000 3,164.52430 3,481.92257
BRL Brazilian real 3.77532 3.43542 3.44195 4.13001
Other countries
ILS Israeli shekel 3.98880 4.04770 3.96243 4.30633
(*) Source: data processed by the European Central Bank, Reuters and major Central Banks.

TIM Group Half-year Condensed Consolidated Financial Statements at June 30, 2017
Note 27 Other information 144
B) RESEARCH AND DEVELOPMENT
Expenditures for research and development activities are represented by external costs, labor costs of
dedicated staff and depreciation and amortization. Details are as follows:
(millions of euros) 1st Half 1st Half
2017 2016
Research and development costs expensed during the period 24 25
Capitalized development costs 846 722
Total research and development costs (expensed and capitalized) 870 747
Moreover, in the separate consolidated income statements for the first half of 2017, amortization
charges are recorded for development costs, capitalized during the period and in prior years, for an
amount of 401 million euros.
Research and development activities conducted by the TIM Group are detailed in the Report on
Operations ("Research and Development" Section).

TIM Group Half-year Condensed Consolidated Financial Statements at June 30, 2017
Note 28 Events Subsequent to June 30, 2017 145
NOTE 28
EVENTS SUBSEQUENT TO JUNE 30, 2017
TERMINATION OF THE EMPLOYMENT RELATIONSHIP WITH THE CHIEF EXECUTIVE OFFICER AND CONSEQUENT SETTLEMENT AGREEMENT
On July 24, 2017, the Board of Directors of TIM S.p.A. approved a settlement agreement by majority vote
(upon favorable recommendation by majority of the Appointment and Remuneration Committee, also
pursuant to the procedure for the approval of minor related-party transactions, due to the Chief
Executive Officer's status as a related party) for the termination, with effect from July 28, 2017, of Mr.
Flavio Cattaneo's term of office as Chief Executive Officer (and as such also as a member of the
Strategic Committee) and as the General Manager (with effect from July 31, 2017). The Board of
Statutory Auditors expressed a non-favorable, non-binding opinion in this regard.
The agreement provides for the payment to Mr. Cattaneo, upon termination of the relationship, of the
gross amount of 22.9 million euros as a settlement for the compensation due to Mr. Cattaneo under his
contract with the Company, considering in particular the Special Award and the MBO, in relation to the
work already carried out as Director and the value identified as having been created based on available
data. The agreement also provides for the payment to Mr. Cattaneo of the gross amount of 2.1 million
euros consideration for non-competition, non-solicitation and non-poaching covenants, for one year,
towards the main competitors of TIM in Italy and Brazil, subject to claw-back in case of breach of the
covenants (as well as the transfer of certain company goods).
GOVERNANCE RESOLUTIONS
On July 27, 2017, the Board of Directors of TIM S.p.A. acknowledged the start of the direction and
coordination by Vivendi S.A..
In relation to Mr Cattaneo's termination from the offices of Chief Executive Officer and Director, the
Board, in line with the Company's succession plan, has temporarily assigned his responsibilities to the
Executive Chairman Mr. de Puyfontaine, who will lead the Group, with the aid of the Company's
management, in accordance with the guidelines of the strategic plan. The responsibilities related to the
Security Function and the company Telecom Italia Sparkle have been assigned on an interim basis to
the Deputy Chairman, Giuseppe Recchi.

TIM Group Half-year Condensed Consolidated Financial Statements at June 30, 2017
Note 29 List of companies of the TIM Group
146
NOTE 29
LIST OF COMPANIES OF THE TIM GROUP
In accordance with Consob Communication DEM/6064293 dated July 28, 2006, the list of companies is provided herein.
The list is divided by type of investment, consolidation method and operating segment.
The following is indicated for each company: name, head office, country and share capital in the original currency. In addition to the
percentage ownership of share capital, the percentage of voting rights in the ordinary shareholders' meeting, if different than the
percentage holding of share capital, and which companies hold the investment.
Company name Head office Currency Share capital % Ownership
% of
voting
rights
Held by
PARENT COMPANY
TIM S.p.A. MILAN (ITALY) EUR 11,677,002,85
5
SUBSIDIARIES CONSOLIDATED LINE-BY-LINE
DOMESTIC BU
4G RETAIL S.r.l. MILAN (ITALY) EUR 2,402,241 100.0000 TIM S.p.A
(sale of fixed and mobile telecommunications products and services and
all analog and digital broadcasting equipment)
ADVANCED CARING CENTER S.r.l. ROME (ITALY) EUR 600,000 100.0000 TELECONTACT CENTER S.p.A.
(telemarketing, market research and surveys activities and
development)
ALFABOOK S.r.l. TURIN (ITALY) EUR 100,000 100.0000 OLIVETTI S.p.A.
(on-line sale of digital texts)
BEIGUA S.r.l. ROME (ITALY) EUR 51,480 100.0000 PERSIDERA S.p.A.
(purchase, sale and maintenance of systems for repair work and radio
and television broadcasting)
CD FIBER S.r.l. ROME (ITALY) EUR 50,000 100.0000 TIM S.p.A
(design, construction, maintenance and management of network
infrastructure services and high-speed electronic communication
systems)
FLASH FIBER S.r.l. MILAN (ITALY) EUR 30,000 80.0000 TIM S.p.A
(development, implementation, maintenance and supply of the fiber
network in Italy)
H.R. SERVICES S.r.l. L'AQUILA (ITALY) EUR 500,000 100.0000 TIM S.p.A
(personnel training and services)
INFRASTRUTTURE WIRELESS ITALIANE S.p.A. MILAN (ITALY) EUR 600,000,000 60.0333 TIM S.p.A
(installation and operation of installations and infrastructure for the
management and the sale of telecommunications services)
MED 1 SUBMARINE CABLES Ltd RAMAT GAN ILS 55,886,866 100.0000 TELECOM ITALIA SPARKLE S.p.A.
(construction and management of the submarine cable lev1) (ISRAEL)
NOVERCA S.r.l. ROME (ITALY) EUR 10,000 100.0000 TIM S.p.A
(development and provision of services in the TLC and multimedia sector
in Italy and abroad)
OLIVETTI MULTISERVICES S.p.A. MILAN (ITALY) EUR 20,337,161 100.0000 TIM S.p.A
(real estate management)
OLIVETTI S.p.A. IVREA EUR 10,000,000 100.0000 TIM S.p.A
(production and sale of office equipment and information technology
services)
(TURIN) (ITALY)
PERSIDERA S.p.A. ROME (ITALY) EUR 21,428,572 70.0000 TIM S.p.A
(purchase, sale and maintenance of systems for repair work and radio
and television broadcasting)
TELECOM ITALIA SAN MARINO S.p.A. BORGO MAGGIORE EUR 1,808,000 100.0000 TIM S.p.A
(San Marino telecommunications management) (SAN MARINO)
TELECOM ITALIA SPARKLE S.p.A. ROME (ITALY) EUR 200,000,000 100.0000 TIM S.p.A
(completion and management of telecommunications services for public
and private use)
TELECOM ITALIA TRUST TECHNOLOGIES S.r.l. POMEZIA EUR 7,000,000 100.0000 TIM S.p.A
(other operations related to non-classified IT services) ROME (ITALY)
TELECOM ITALIA VENTURES S.r.l. MILAN (ITALY) EUR 10,000 100.0000 TIM S.p.A
(investment holding company)
TELECONTACT CENTER S.p.A. NAPLES (ITALY) EUR 3,000,000 100.0000 TIM S.p.A
(telemarketing services)
TELEFONIA MOBILE SAMMARINESE S.p.A. BORGO MAGGIORE EUR 78,000 51.0000 TELECOM ITALIA SAN MARINO S.p.A.
(development and management of mobile telecommunications plants
and services)
(SAN MARINO)
TELENERGIA S.r.l. ROME (ITALY) EUR 50,000 100.0000 TIM S.p.A
(import, export, purchase, sale and trade of electricity)

TIM Group Half-year Condensed Consolidated Financial Statements at June 30, 2017
Note 29 List of companies of the TIM Group
147
Company name Head office Currency Share capital % Ownership
% of
voting
rights
Held by
TELSY ELETTRONICA E TELECOMUNICAZIONI S.p.A. TURIN (ITALY) EUR 390,000 100.0000 TIM S.p.A
(production and sale of equipment and systems for crypto
telecommunications)
TI SPARKLE NETHERLANDS B.V. AMSTERDAM EUR 18,200 100.0000 TELECOM ITALIA SPARKLE S.p.A.
(telecommunications services) (NETHERLANDS)
TI SPARKLE AMERICAS Inc. MIAMI USD 10,000 100.0000 TI SPARKLE IRELAND TELECOMMUNICATIONS Ltd
(managed bandwidth services) (UNITED STATES)
TI SPARKLE ARGENTINA S.A. BUENOS AIRES ARS 9,998,000 95.0000 TI SPARKLE IRELAND TELECOMMUNICATIONS Ltd
(managed bandwidth services) (ARGENTINA) 5.0000 TELECOM ITALIA SPARKLE S.p.A.
TI SPARKLE AUSTRIA Gmbh VIENNA EUR 2,735,000 100.0000 TELECOM ITALIA SPARKLE S.p.A.
(telecommunications services) (AUSTRIA)
TI SPARKLE BELGIUM S.P.R.L. - B.V.B.A BRUSSELS EUR 2,200,000 99.9999 TELECOM ITALIA SPARKLE S.p.A.
(telecommunications services) (BELGIUM) 0.0001 TI SPARKLE UK Ltd
TI SPARKLE BOLIVIA S.r.l. LA PAZ BOB 1,747,600 99.9999 TELECOM ITALIA SPARKLE S.p.A.
(managed bandwidth services) (BOLIVIA) 0.0001 TI SPARKLE AMERICAS Inc.
TI SPARKLE BRASIL PARTIÇIPAÇÕES Ltda RIO DE JANEIRO BRL 71,563,866 99.9999 TI SPARKLE IRELAND TELECOMMUNICATIONS Ltd
(investment holding company) (BRAZIL) 0.0001 TI SPARKLE AMERICAS Inc.
TI SPARKLE BRASIL TELECOMUNICAÇÕES Ltda RIO DE JANEIRO BRL 69,337,363 99.9999 TI SPARKLE BRASIL PARTIÇIPAÇÕES Ltda
(managed bandwidth services) (BRAZIL) 0.0001 TI SPARKLE AMERICAS Inc.
TI SPARKLE BULGARIA EOOD SOFIA BGN 100,000 100.0000 TI SPARKLE IRELAND TELECOMMUNICATIONS Ltd
(telecommunications) (BULGARIA)
TI SPARKLE CHILE SPA SANTIAGO CLP 5,852,430,960 100.0000 TI SPARKLE IRELAND TELECOMMUNICATIONS Ltd
(managed bandwidth services) (CHILE)
TI SPARKLE COLOMBIA Ltda BOGOTA' COP 5,246,906,000 99.9999 TI SPARKLE IRELAND TELECOMMUNICATIONS Ltd
(managed bandwidth services) (COLOMBIA) 0.0001 TI SPARKLE AMERICAS Inc.
TI SPARKLE CZECH S.R.O. PRAGUE CZK 6,720,000 100.0000 TELECOM ITALIA SPARKLE S.p.A.
(telecommunications services) (CZECH REPUBLIC)
TI SPARKLE FRANCE S.A.S. PARIS EUR 18,295,000 100.0000 TELECOM ITALIA SPARKLE S.p.A.
(installation and management of telecommunications services for fixed
network and related activities)
(FRANCE)
TI SPARKLE GERMANY Gmbh FRANKFURT EUR 25,000 100.0000 TELECOM ITALIA SPARKLE S.p.A.
(telecommunications services) (GERMANY)
TI SPARKLE GREECE S.A. ATHENS EUR 368,760 100.0000 TI SPARKLE IRELAND TELECOMMUNICATIONS Ltd
(telecommunications) (GREECE)
TI SPARKLE IRELAND TELECOMMUNICATIONS Ltd DUBLIN USD 1,000,000 100.0000 TELECOM ITALIA SPARKLE S.p.A.
(telecommunications services, installation and maintenance of
submarine cable systems for managed bandwidth services)
(IRELAND)
TI SPARKLE ISRAEL Ltd RAMAT GAN ILS 1,000 100.0000 TI SPARKLE IRELAND TELECOMMUNICATIONS Ltd
(international wholesale telecommunication services) (ISRAEL)
TI SPARKLE MED S.p.A. ROME (ITALY) EUR 3,100,000 100.0000 TI SPARKLE IRELAND TELECOMMUNICATIONS Ltd
(installation and management of submarine cable systems)
TI SPARKLE NORTH AMERICA, Inc NEW YORK USD 15,550,000 100.0000 TELECOM ITALIA SPARKLE S.p.A.
(telecommunications and promotional services) (UNITED STATES)
TI SPARKLE PANAMA S.A. PANAMA USD 10,000 100.0000 TI SPARKLE IRELAND TELECOMMUNICATIONS Ltd
(managed bandwidth services)
TI SPARKLE PERU' S.A. LIMA PEN 57,101,788 99.9999 TI SPARKLE IRELAND TELECOMMUNICATIONS Ltd
(managed bandwidth services) (PERU) 0.0001 TI SPARKLE AMERICAS Inc.
TI SPARKLE PUERTO RICO LLC SAN JUAN USD 50,000 100.0000 TI SPARKLE IRELAND TELECOMMUNICATIONS Ltd
(managed bandwidth services) (PUERTO RICO)
TI SPARKLE ROMANIA S.r.l. BUCHAREST RON 3,021,560 100.0000 TELECOM ITALIA SPARKLE S.p.A.
(telecommunications services) (ROMANIA)
TI SPARKLE RUSSIA LLC MOSCOW RUB 8,520,000 99.0000 TELECOM ITALIA SPARKLE S.p.A.
(telecommunications services) (RUSSIA) 1.0000 TI SPARKLE UK Ltd
TI SPARKLE SINGAPORE Pte.Ltd SINGAPORE USD 5,121,120 99.9999 TELECOM ITALIA SPARKLE S.p.A.
(telecommunications services) 0.0001 TI SPARKLE NORTH AMERICA, Inc
TI SPARKLE SLOVAKIA S.R.O. BRATISLAVA EUR 300,000 100.0000 TELECOM ITALIA SPARKLE S.p.A.
(telecommunications services) (SLOVAKIA)
TI SPARKLE SPAIN Telecommunications S.L. MADRID EUR 1,687,124 100.0000 TELECOM ITALIA SPARKLE S.p.A.
(telecommunications services) (SPAIN)
TI SPARKLE St. Croix LLC VIRGIN ISLANDS USD 10,000 100.0000 TI SPARKLE IRELAND TELECOMMUNICATIONS Ltd
(managed bandwidth services) (UNITED STATES)

TIM Group Half-year Condensed Consolidated Financial Statements at June 30, 2017
Note 29 List of companies of the TIM Group
148
Company name Head office Currency Share capital % Ownership
% of
voting
rights
Held by
TI SPARKLE SWITZERLAND Gmbh ZURICH CHF 2,000,000 100.0000 TELECOM ITALIA SPARKLE S.p.A.
(telecommunications services) (SWITZERLAND)
TI SPARKLE TURKEY TELEKOMÜNIKASYON ANONIM SIRKETI YENISBONA TRY 40,600,000 100.0000 TI SPARKLE IRELAND TELECOMMUNICATIONS Ltd
(telecommunications services) ISTANBUL
(TURKEY)
TI SPARKLE UK Ltd LONDON EUR 3,983,254 100.0000 TELECOM ITALIA SPARKLE S.p.A.
(value-added and networking services) (UNITED KINGDOM)
TI SPARKLE VENEZUELA CA. CARACAS VEF 981,457 100.0000 TI SPARKLE IRELAND TELECOMMUNICATIONS Ltd
(managed bandwidth services) (VENEZUELA)
TIM REAL ESTATE S.r.l. MILAN (ITALY) EUR 50,000 100.0000 TIM S.p.A
(real estate)
TIMB2 S.r.l. ROME (ITALY) EUR 10,000 99.0000 PERSIDERA S.p.A.
(management of television frequency user rights) 1.0000 TIM S.p.A
TIMVISION S.r.l. ROME (ITALY) EUR 50,000 100.0000 TIM S.p.A
(production, co-production, conception and creation of programs, films
and audiovisual content, including multimedia and interactive content)
TMI TELEMEDIA INTERNATIONAL DO BRASIL Ltda SÃO PAULO BRL 8,909,639 100.0000 TI SPARKLE BRASIL PARTIÇIPAÇÕES Ltda
(telecommunications services and promotional services) (BRAZIL)
TN FIBER S.r.l. TRENTO (ITALY) EUR 55,918,000 100.0000 TIM S.p.A
(design, construction, maintenance and supply of optical network access
to users in the province of Trento)
BRAZIL BU
INTELIG TELECOMUNICAÇÕES Ltda RIO DE JANEIRO BRL 4,041,956,045 99.9999 TIM PARTICIPAÇÕES S.A.
(telecommunications services) (BRAZIL) 0.0001 TIM CELULAR S.A.
TIM BRASIL SERVIÇOS E PARTICIPAÇÕES S.A. RIO DE JANEIRO BRL 7,169,029,859 99.9999 TELECOM ITALIA FINANCE S.A.
(investment holding company) (BRAZIL) 0.0001 TIM S.p.A
TIM CELULAR S.A. SÃO PAULO BRL 9,434,215,720 100.0000 TIM PARTICIPAÇÕES S.A.
(telecommunications services) (BRAZIL)
TIM PARTICIPAÇÕES S.A. RIO DE JANEIRO BRL 9,913,414,422 66.5819 TIM BRASIL SERVIÇOS E PARTICIPAÇÕES S.A.
(investment holding company) (BRAZIL) 0.0264 TIM PARTICIPAÇÕES S.A.
OTHER OPERATIONS
OLIVETTI DEUTSCHLAND GmbH NURENBERG EUR 25,600,000 100.0000 OLIVETTI S.p.A.
(sale of office equipment and supplies) (GERMANY)
OLIVETTI ESPAÑA S.A. (in Liquidation) BARCELONA EUR 1,229,309 100.0000 OLIVETTI S.p.A.
(sale and maintenance of office supplies, consultancy and network
management)
(SPAIN)
OLIVETTI UK Ltd. NORTHAMPTON GBP 6,295,712 100.0000 OLIVETTI S.p.A.
(sale of office equipment and supplies) (UNITED KINGDOM)
TELECOM ITALIA CAPITAL S.A. LUXEMBOURG EUR 2,336,000 100.0000 TIM S.p.A
(financial company)
TELECOM ITALIA FINANCE IRELAND Ltd (in liquidation) DUBLIN EUR 1,360,000,000 100.0000 TELECOM ITALIA FINANCE S.A.
(financial company) (IRELAND)
TELECOM ITALIA FINANCE S.A. LUXEMBOURG EUR 1,818,691,979 100.0000 TIM S.p.A
(financial company)
TELECOM ITALIA LATAM PARTICIPAÇÕES E GESTÃO ADMINISTRATIVA
Ltda
SÃO PAULO BRL 118,925,803 100.0000 TIM S.p.A
(telecommunications and promotional services) (BRAZIL)
TIAUDIT COMPLIANCE LATAM S.A. (in liquidation) RIO DE JANEIRO BRL 1,500,000 69.9996 TIM S.p.A
(internal audit services) (BRAZIL) 30.0004 TIM BRASIL SERVIÇOS E PARTICIPAÇÕES S.A.
TIESSE S.c.p.A. IVREA EUR 103,292 61.0000 OLIVETTI S.p.A.
(installation and assistance for electronic, IT, telematics and
telecommunications equipment)
(TURIN) (ITALY)
TIM TANK S.r.l. MILAN (ITALY) EUR 16,600,000 100.0000 TIM S.p.A
(fund and securities investments)

TIM Group Half-year Condensed Consolidated Financial Statements at June 30, 2017
Note 29 List of companies of the TIM Group
149
Company name Head office Currency Share capital % Ownership
% of
voting
rights
Held by
ASSOCIATES AND JOINT VENTURES ACCOUNTED FOR USING THE EQUITY METHOD
ALFIERE S.p.A. (*) ROME (ITALY) EUR 9,250,000 50.0000 TIM S.p.A
(real estate)
AREE URBANE S.r.l. (in liquidation) MILAN (ITALY) EUR 100,000 32.6200 TIM S.p.A
(real estate management)
ASSCOM INSURANCE BROKERS S.r.l. MILAN (ITALY) EUR 100,000 20.0000 TIM S.p.A
(insurance brokerage)
BALTEA S.r.l. (in bankruptcy) IVREA EUR 100,000 49.0000 OLIVETTI S.p.A.
(production and sale of office products and telecommunications IT
services)
(TURIN) (ITALY)
CLOUDESIRE.COM S.r.l. PISA (ITALY) EUR 11,671 (**) TELECOM ITALIA VENTURES S.r.l.
(design, implementation and marketing of a marketplace platform for
the sale of software-as-a-service applications)
CONSORZIO ANTENNA COLBUCCARO Società Consortile a RL ASCOLI PICENO
(ITALY)
EUR 121,000 20.0000 PERSIDERA S.p.A.
(installation, management and maintenance of metal pylons complete
with workstations for device recovery)
CONSORZIO ANTENNA MONTECONERO Società Consortile a RL SIROLO EUR 51,100 22.2211 PERSIDERA S.p.A.
(multimedia services) (ANCONA) (ITALY)
CONSORZIO E O (in liquidation) ROME (ITALY) EUR 30,987 50.0000 TIM S.p.A
(training services)
DONO PER...S.C.A.R.L. (in liquidation) ROME (ITALY) EUR 30,000 33.3333 TIM S.p.A
(collection and distribution of funds for charitable purposes or for
financing of political parties or political or social movements)
ECO4CLOUD S.r.l. RENDE EUR 19,532 (**) TELECOM ITALIA VENTURES S.r.l.
(development, production and sale of innovative products or services
with high technological value)
(COSENZA) (ITALY)
ITALTEL GROUP S.p.A. SETTIMO
MILANESE
EUR 825,695 34.6845 19.3733 TELECOM ITALIA FINANCE S.A.
(investment holding company) (MILAN) (ITALY)
ITALTEL S.p.A SETTIMO
MILANESE
EUR 2,000,000 (**) TIM S.p.A
(telecommunications systems) (MILAN) (ITALY)
KOPJRA S.r.l. SCHIO EUR 16,207 22.8491 TELECOM ITALIA VENTURES S.r.l.
(development, production and sale of innovative products or services
with high technological value)
(VICENZA) (ITALY)
MOVENDA S.p.A. ROME (ITALY) EUR 133,333 24.9998 TELECOM ITALIA FINANCE S.A.
(design, construction and diffusion of Internet sites, products and
computer media)
NORDCOM S.p.A. MILAN (ITALY) EUR 5,000,000 42.0000 TIM S.p.A
(application service provider)
OILPROJECT S.r.l. MILAN (ITALY) EUR 13,556 (**) TELECOM ITALIA VENTURES S.r.l.
(research, development, marketing and patenting of all intellectual
property related to technology, information technology and TLC)
PEDIUS S.r.l. ROME (ITALY) EUR 159 (**) TELECOM ITALIA VENTURES S.r.l.
(implementation of specialized telecommunications applications,
telecommunications services over telephone connections, VOIP services)
TIGLIO I S.r.l. MILAN (ITALY) EUR 5,255,704 47.8019 TIM S.p.A
(real estate management)
TIGLIO II S.r.l. (in liquidation) MILAN (ITALY) EUR 10,000 49.4700 TIM S.p.A
(real estate management)
W.A.Y. S.r.l. TURIN (ITALY) EUR 136,383 39.9999 OLIVETTI S.p.A.
(development and sale of geolocation products and systems for security
and logistics)
WIMAN S.r.l. MATTINATA EUR 21,568 (**) TELECOM ITALIA VENTURES S.r.l.
(development, management and implementation of platforms for social-
based Wi-Fi authentication)
(FOGGIA) (ITALY)
(*) Joint Venture.
(**) Associate over which TIM S.p.A., directly or indirectly, exercises significant influence pursuant to IAS 28 (Investments in Associates and Joint Ventures).

TIM Group Half-year Condensed Consolidated Financial Statements at June 30, 2017 Certification of the consolidated financial statements 150
CERTIFICATION OF THE HALF-YEAR CONDENSED
CONSOLIDATED FINANCIAL STATEMENTS
PURSUANT TO ARTICLE 81-TER OF THE CONSOB
REGULATION 11971 DATED MAY 14, 1999, WITH
AMENDMENTS AND ADDITIONS.
1. We, the undersigned, Arnaud Roy de Puyfontaine, as Chairman, Flavio Cattaneo, as Chief
Executive Officer, and Piergiorgio Peluso, as Manager responsible for preparing TIM S.p.A. financial
reports, certify, having also considered the provisions of Article 154-bis, paragraphs 3 and 4, of
Italian Legislative Decree 58 of February 24, 1998:
• the adequacy in relation to the characteristics of the company and
• the effective application
of the administrative and accounting procedures used in the preparation of the half-year condensed
consolidated financial statements for the period January 1 – June 30, 2017.
2. TIM has adopted the Internal Control – Integrated Framework Model (2013), issued by the
Committee of Sponsoring Organizations of the Treadway Commission, as its framework for the
establishment and assessment of its internal control system, with particular reference to the internal
controls for the preparation of the financial statements.
3. The undersigned also certify that:
3.1 the Half-year Condensed Consolidated Financial Statements at June 30, 2017:
a) are prepared in conformity with international accounting standards adopted by the
European Union pursuant to EC regulation 1606/2002 of the European Parliament and
Council of July 19, 2002 (International Financial Reporting Standards – IFRS) as well as
the legislative and prescribed provisions in force in Italy also with reference to the
measures enacted for the implementation of Article 9 of Italian Legislative Decree 38 of
February 28, 2005;
b) agree with the results of the accounting records and entries;
c) provide a true and fair view of the financial condition, the results of operations and the
cash flows of the Company and its consolidated subsidiaries;
3.2 the interim management report contains a reliable analysis of important events which took
place during the first six months of 2017 and their impact on the half-year condensed
consolidated financial statements at June 30, 2017, together with a description of the main
risks and uncertainties for the remaining six months of 2017. The interim management report
also contains a reliable analysis of information concerning significant related party
transactions.
27 July 2017
Chairman Chief Executive Officer Manager responsible for
preparing corporate
financial reports
[signature] [signature] [signature]
Arnaud Roy de Puyfontaine Flavio Cattaneo Piergiorgio Peluso

TIM Group Half-year Condensed Consolidated Financial Statements at June 30, 2017 Independent Auditors’ Letter 151
REVIEW REPORT ON CONSOLIDATED CONDENSED INTERIM FINANCIAL
STATEMENTS
To the shareholders of
TIM SpA
Foreword
We have reviewed the accompanying consolidated condensed interim financial statements of TIM
SpA and its subsidiaries (“TIM Group”) as of and for the six-month period ended 30 June 2017,
comprising the statement of financial position, the separate income statement, the statement of
comprehensive income, the statement of changes in shareholders’ equity, the statement of cash
flows and related explanatory notes. The directors of TIM SpA are responsible for the preparation
of the consolidated condensed interim financial statements in accordance with International
Accounting Standard 34 applicable to interim financial reporting (IAS 34) as adopted by the
European Union. Our responsibility is to express a conclusion on these consolidated condensed
interim financial statements based on our review.
Scope of review
We conducted our work in accordance with the criteria for a review recommended by the National
Commission for Companies and Stock Exchange (CONSOB) in Resolution No. 10867 of 31 July
1997. A review of consolidated condensed interim financial statements consists of making
enquiries, primarily of persons responsible for financial and accounting matters, and applying
analytical and other review procedures. A review is substantially less in scope than a full-scope
audit conducted in accordance with International Standards on Auditing (ISA Italia) and,
consequently, does not enable us to obtain assurance that we would become aware of all
significant matters that might be identified in an audit. Accordingly, we do not express an audit
opinion on the consolidated condensed interim financial statements.
Conclusion
Based on our review, nothing has come to our attention that causes us to believe that the
accompanying consolidated condensed interim financial statements of TIM Group as of and for
the six-month period ended 30 June 2017 are not prepared, in all material respects, in accordance
with International Accounting Standard 34 applicable to interim financial reporting (IAS 34) as
adopted by the European Union.
Milan, 9 August 2017
PricewaterhouseCoopers SpA
Signed by
Francesco Ferrara
(Partner)
This report has been translated into English from the Italian original solely for the convenience of
international readers

TIM Group Half-year Condensed Consolidated Financial Statements at June 30, 2017 Useful information 152
USEFUL INFORMATION
Free copies of this report, can be obtained by:
Calling Free Number 800.020.220 (for calls inside Italy)
or +39 011 2293603 (for calls outside Italy)
providing information and assistance to shareholders
E-mail [email protected]
Internet Users can view the Half-Year financial Report at June 2017, by visiting the
website telecomitalia.com/Bilanci-Relazioni
They can also obtain information about TIM at the following URL:
www.telecomitalia.com and information about its products and services at the
following URL: www.tim.it
Investor Relations +39 02 85954131 (switchboard)
+39 02 85954132 (fax)
TIM S.p.A.
A company directed and coordinated by Vivendi S.A.
Registered Office Via G. Negri n. 1 - Milan
Headquarters and Secondary Office in Corso d’Italia 41 - Rome
PEC (Certified Electronic Mail) box: [email protected]
Share Capital 11,677,002,855.10 euros, fully paid up
Tax Code/VAT no. and Milan Companies Register file no. 00488410010