Embed Size (px)
Citation preview
The World’s Local Bank
Singapore -November 2006
Morgan Stanley Asia Pacific Summit 2006
Forward-looking statements
This presentation and subsequent discussion may contain certain forward-looking statements with respect to the financial condition, results of operations and business of the Group. These forward-looking statements represent the Group’s expectations or beliefs concerning future events and involve known and unknown risks and uncertainty that could cause actual results, performance or events to differ materially from those expressed or implied in such statements. Additional detailed information concerning important factors that could cause actual results to differ materially is available in our Annual Report.
0
20
40
60
80
100
120
140
160
1995 1996 1997 1998 1999 2000 2001 2002 2003 2004 2005
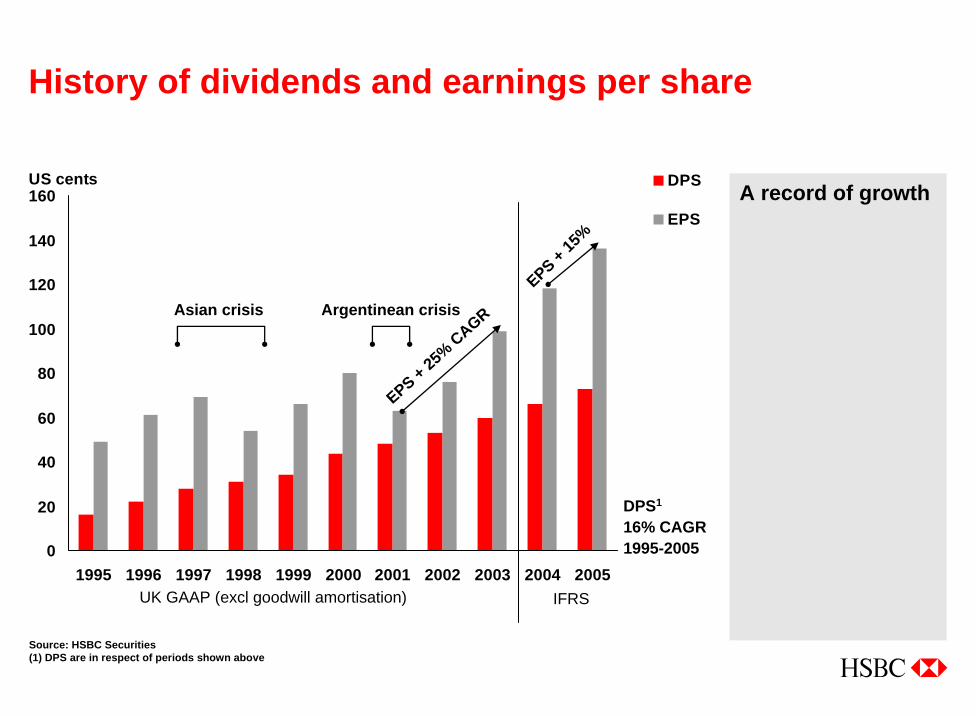
US cents DPS
EPSA record of growth
Source: HSBC Securities(1) DPS are in respect of periods shown above
EPS + 25% CAGR
EPS + 15%
History of dividends and earnings per share
Asian crisis Argentinean crisis
DPS1
16% CAGR 1995-2005
IFRSUK GAAP (excl goodwill amortisation)
95
100
105
110
115
120
125
130
135
Jun
04
Sep
04
Nov
04
Feb
05
Apr
05
Jun
05
Sep
05
Nov
05
Feb
06
Apr
06
Jun
06
HSBC Total Shareholder Return
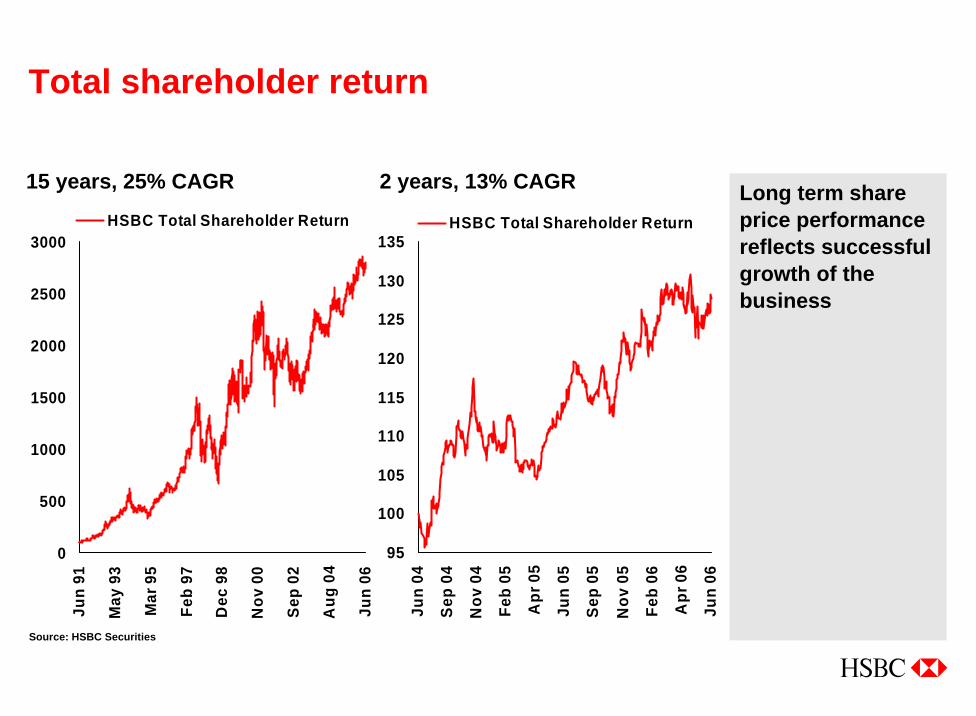
Total shareholder return
0
500
1000
1500
2000
2500
3000
Jun
91
May
93
Mar
95
Feb
97
Dec
98
Nov
00
Sep
02
Aug
04
Jun
06
HSBC Total Shareholder ReturnLong term share price performance reflects successful growth of the business
15 years, 25% CAGR
Source: HSBC Securities
2 years, 13% CAGR
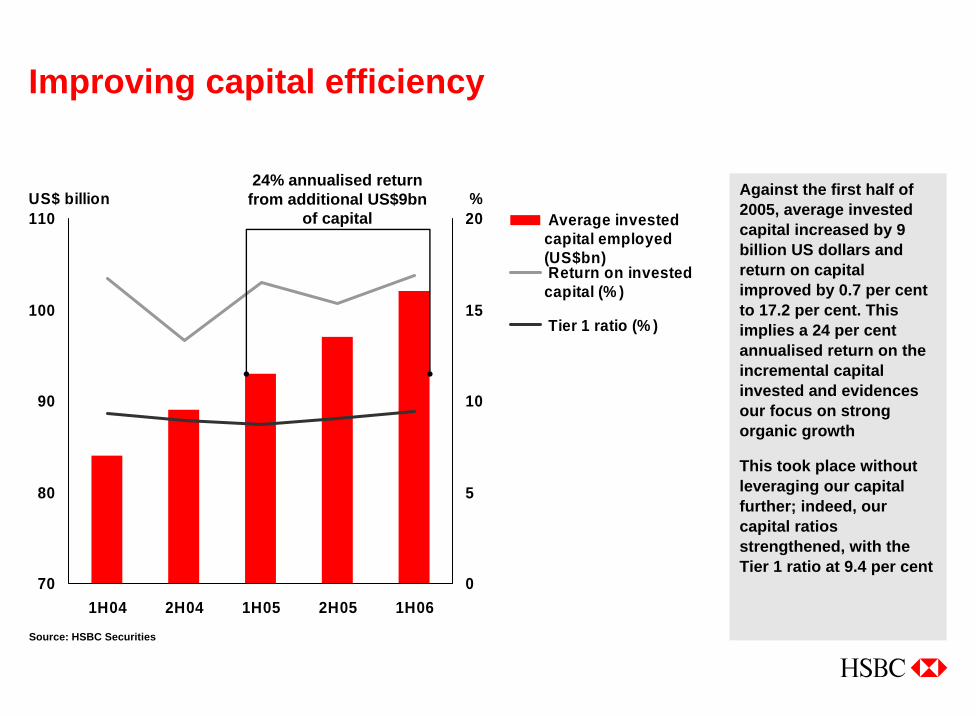
Improving capital efficiency
Against the first half of 2005, average invested capital increased by 9 billion US dollars and return on capital improved by 0.7 per cent to 17.2 per cent. This implies a 24 per cent annualised return on the incremental capital invested and evidences our focus on strong organic growth
This took place without leveraging our capital further; indeed, our capital ratios strengthened, with the Tier 1 ratio at 9.4 per cent
70
80
90
100
110
1H04 2H04 1H05 2H05 1H06
US$ billion
0
5
10
15
20%
Average investedcapital employed(US$bn) Return on investedcapital (% )
Tier 1 ratio (% )
24% annualised return from additional US$9bn
of capital
Source: HSBC Securities
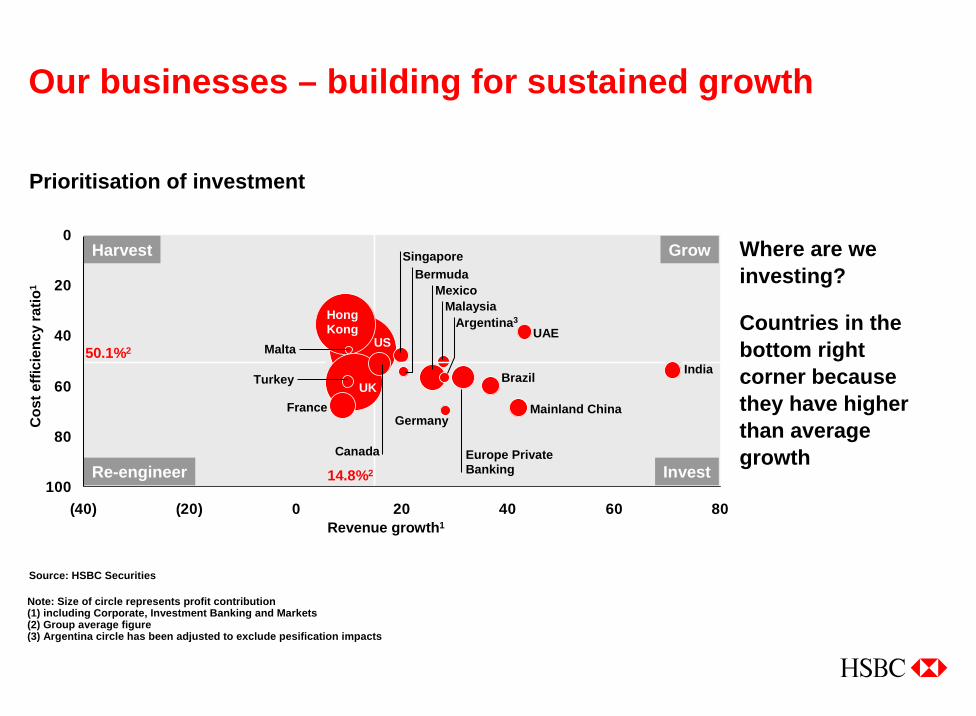
Our businesses – building for sustained growth
Where are we investing?
Countries in the bottom right corner because they have higher than average growth
Source: HSBC Securities
Prioritisation of investment
Note: Size of circle represents profit contribution(1) including Corporate, Investment Banking and Markets(2) Group average figure(3) Argentina circle has been adjusted to exclude pesification impacts
0
20
40
60
80
100(40) (20) 0 20 40 60 80
Cos
t effi
cien
cy ra
tio1
Revenue growth1
50.1%2
14.8%2
US
UK
HongKong
Mainland ChinaFrance
Argentina3
Brazil
UAE
India
MexicoMalaysia
Malta
Germany
SingaporeBermuda
Turkey
Canada
Re-engineer
Harvest
Invest
Grow
Europe Private Banking
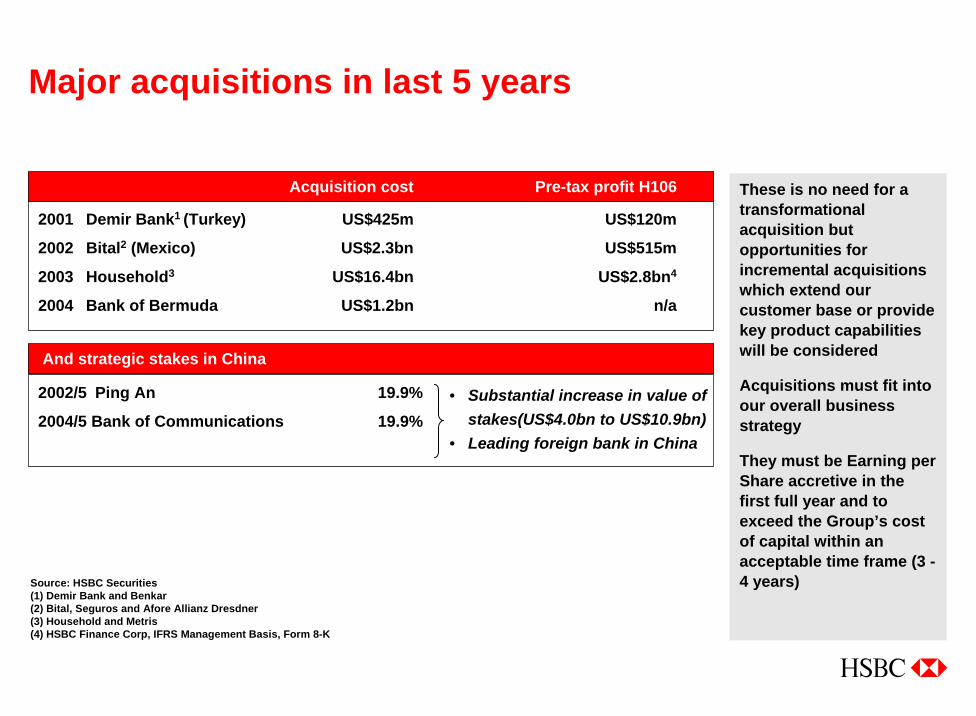
Major acquisitions in last 5 years
These is no need for a transformational acquisition but opportunities for incremental acquisitions which extend our customer base or provide key product capabilities will be considered
Acquisitions must fit into our overall business strategy
They must be Earning per Share accretive in the first full year and to exceed the Group’s cost of capital within an acceptable time frame (3 -4 years)
2001 Demir Bank1 (Turkey) US$425m US$120m
2002 Bital2 (Mexico) US$2.3bn US$515m
2003 Household3 US$16.4bn US$2.8bn4
2004 Bank of Bermuda US$1.2bn n/a
Acquisition cost Pre-tax profit H106
2002/5 Ping An 19.9%
2004/5 Bank of Communications 19.9%
And strategic stakes in China
Source: HSBC Securities(1) Demir Bank and Benkar(2) Bital, Seguros and Afore Allianz Dresdner(3) Household and Metris(4) HSBC Finance Corp, IFRS Management Basis, Form 8-K
• Substantial increase in value of stakes(US$4.0bn to US$10.9bn)
• Leading foreign bank in China
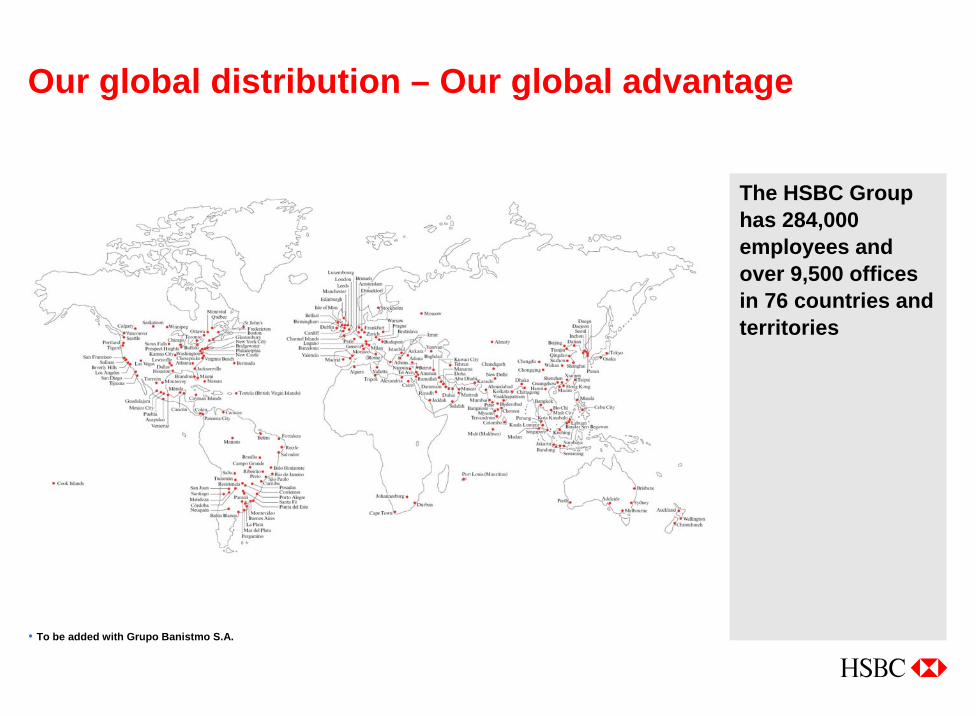
Our global distribution – Our global advantage
The HSBC Group has 284,000 employees and over 9,500 offices in 76 countries and territories
To be added with Grupo Banistmo S.A.
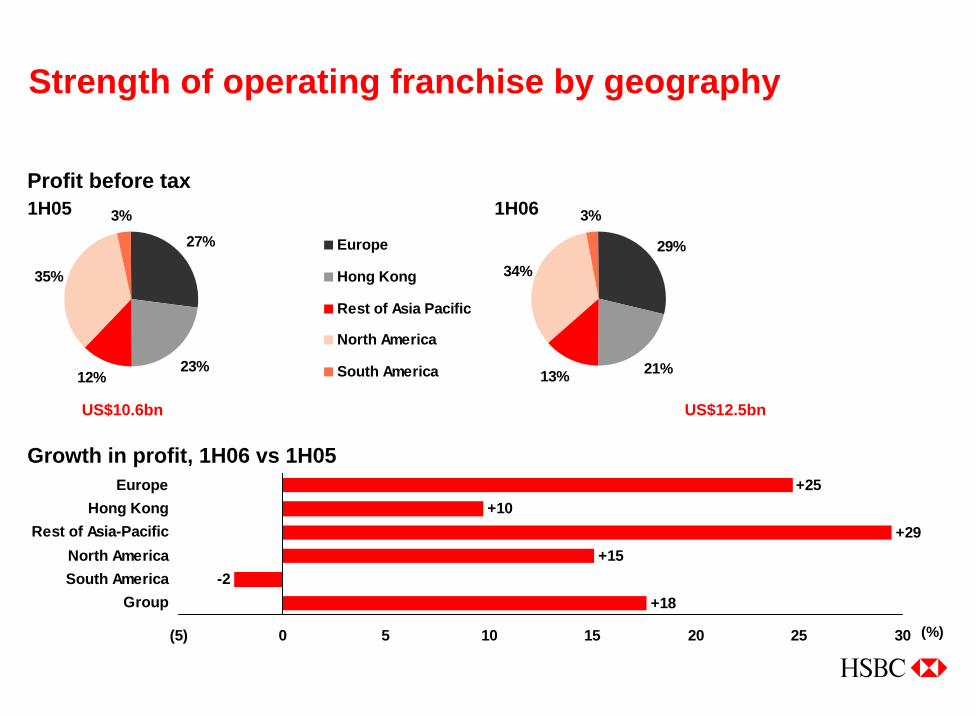
27%
23%12%
35%
3%
Europe
Hong Kong
Rest of Asia Pacific
North America
South America
Strength of operating franchise by geography
29%
21%13%
34%
3%
US$12.5bn
1H06
US$10.6bn
1H05Profit before tax
+18-2
+15+29
+10+25
(5) 0 5 10 15 20 25 30
GroupSouth AmericaNorth America
Rest of Asia-PacificHong Kong
Europe
(%)
Growth in profit, 1H06 vs 1H05
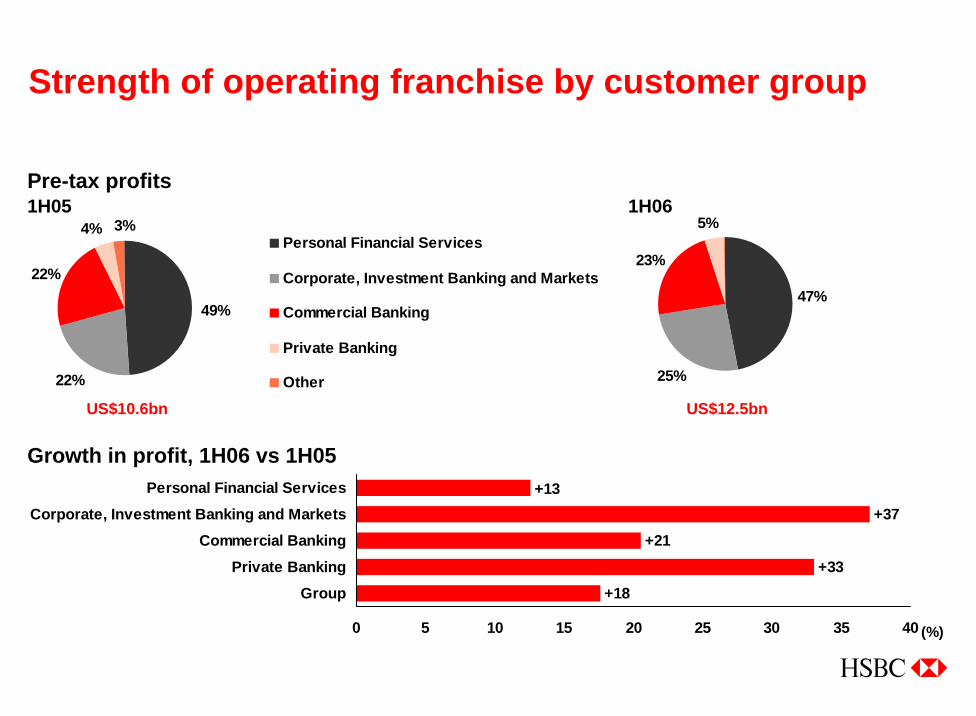
Strength of operating franchise by customer group
22%
22%
4% 3%
49%
Personal Financial Services
Corporate, Investment Banking and Markets
Commercial Banking
Private Banking
Other
US$10.6bn
1H05
47%
25%
23%
5%
US$12.5bn
1H06Pre-tax profits
Growth in profit, 1H06 vs 1H05
+18+33
+21+37
+13
0 5 10 15 20 25 30 35 40
GroupPrivate Banking
Commercial BankingCorporate, Investment Banking and Markets
Personal Financial Services
(%)
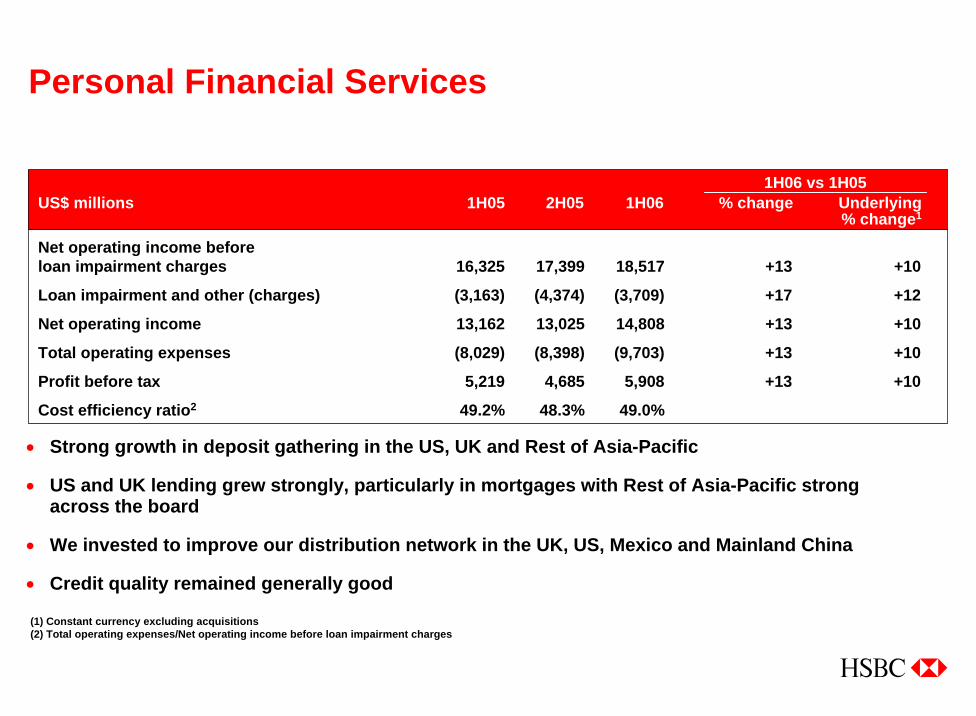
Personal Financial Services
Net operating income beforeloan impairment charges 16,325 17,399 18,517 +13 +10
Loan impairment and other (charges) (3,163) (4,374) (3,709) +17 +12
Net operating income 13,162 13,025 14,808 +13 +10
Total operating expenses (8,029) (8,398) (9,703) +13 +10
Profit before tax 5,219 4,685 5,908 +13 +10
Cost efficiency ratio2 49.2% 48.3% 49.0%
US$ millions 1H05 2H05 1H06 % change Underlying % change1
1H06 vs 1H05
(1) Constant currency excluding acquisitions(2) Total operating expenses/Net operating income before loan impairment charges
• Strong growth in deposit gathering in the US, UK and Rest of Asia-Pacific
• US and UK lending grew strongly, particularly in mortgages with Rest of Asia-Pacific strong across the board
• We invested to improve our distribution network in the UK, US, Mexico and Mainland China
• Credit quality remained generally good
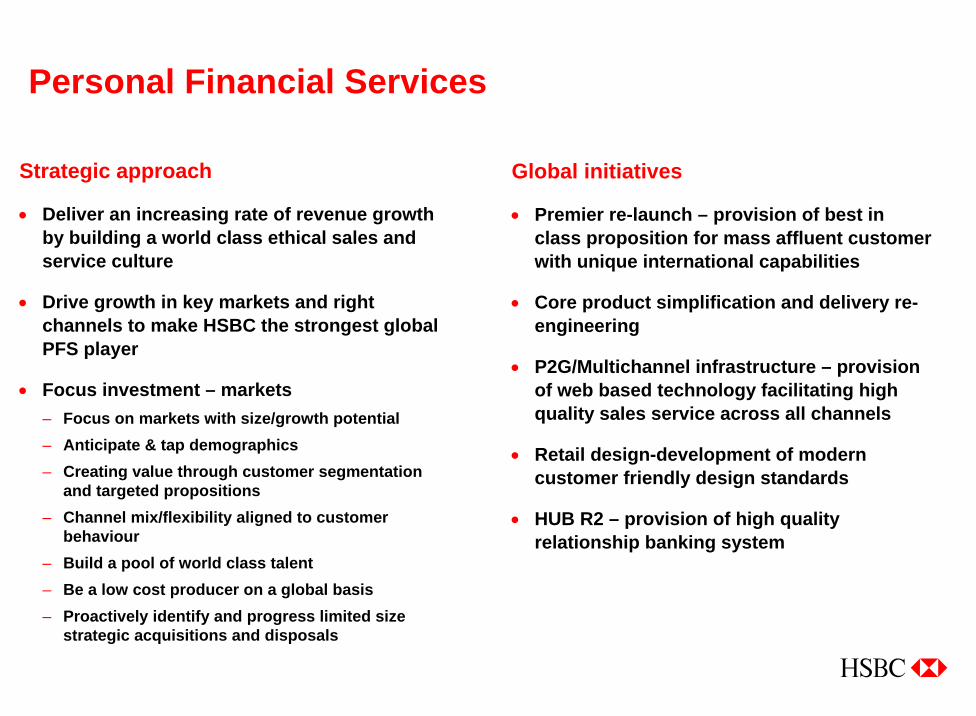
Personal Financial Services
Strategic approach
• Deliver an increasing rate of revenue growth by building a world class ethical sales and service culture
• Drive growth in key markets and right channels to make HSBC the strongest global PFS player
• Focus investment – markets – Focus on markets with size/growth potential– Anticipate & tap demographics– Creating value through customer segmentation
and targeted propositions– Channel mix/flexibility aligned to customer
behaviour– Build a pool of world class talent – Be a low cost producer on a global basis– Proactively identify and progress limited size
strategic acquisitions and disposals
Global initiatives
• Premier re-launch – provision of best in class proposition for mass affluent customer with unique international capabilities
• Core product simplification and delivery re-engineering
• P2G/Multichannel infrastructure – provision of web based technology facilitating high quality sales service across all channels
• Retail design-development of modern customer friendly design standards
• HUB R2 – provision of high quality relationship banking system
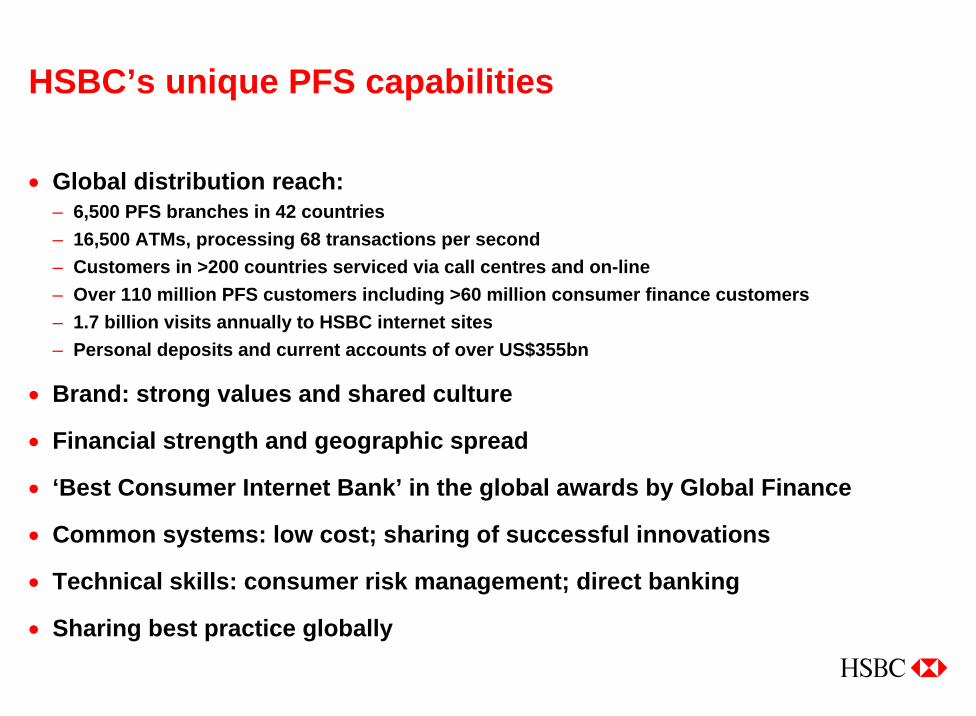
HSBC’s unique PFS capabilities
• Global distribution reach:– 6,500 PFS branches in 42 countries– 16,500 ATMs, processing 68 transactions per second– Customers in >200 countries serviced via call centres and on-line– Over 110 million PFS customers including >60 million consumer finance customers– 1.7 billion visits annually to HSBC internet sites– Personal deposits and current accounts of over US$355bn
• Brand: strong values and shared culture
• Financial strength and geographic spread
• ‘Best Consumer Internet Bank’ in the global awards by Global Finance
• Common systems: low cost; sharing of successful innovations
• Technical skills: consumer risk management; direct banking
• Sharing best practice globally
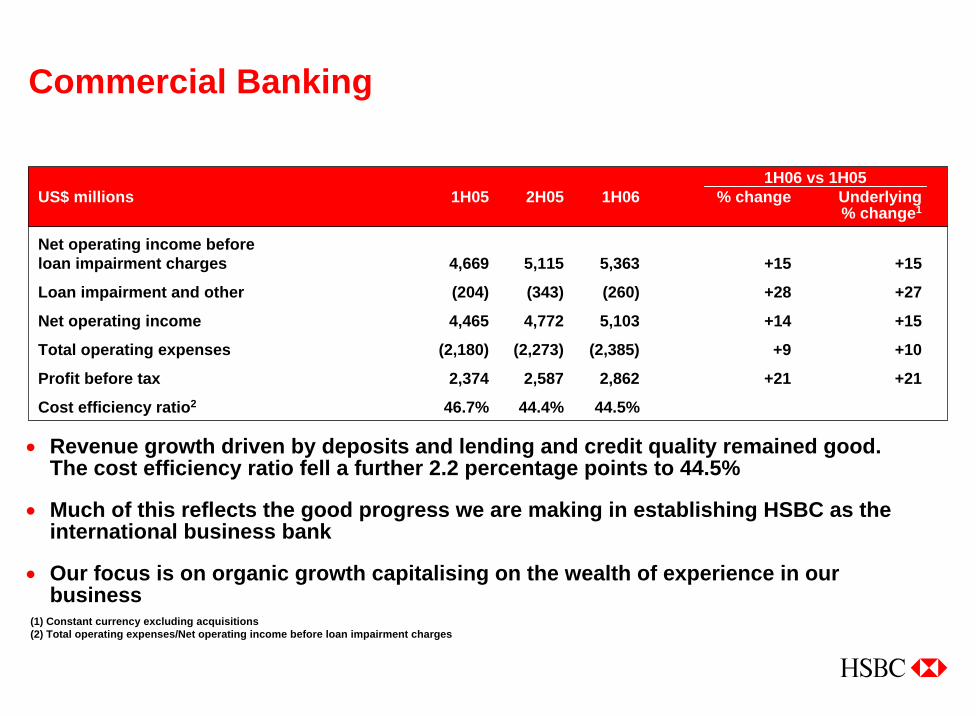
Commercial Banking
Net operating income beforeloan impairment charges 4,669 5,115 5,363 +15 +15
Loan impairment and other (204) (343) (260) +28 +27
Net operating income 4,465 4,772 5,103 +14 +15
Total operating expenses (2,180) (2,273) (2,385) +9 +10
Profit before tax 2,374 2,587 2,862 +21 +21
Cost efficiency ratio2 46.7% 44.4% 44.5%
US$ millions 1H05 2H05 1H06 % change Underlying% change1
1H06 vs 1H05
(1) Constant currency excluding acquisitions(2) Total operating expenses/Net operating income before loan impairment charges
• Revenue growth driven by deposits and lending and credit quality remained good. The cost efficiency ratio fell a further 2.2 percentage points to 44.5%
• Much of this reflects the good progress we are making in establishing HSBC as the international business bank
• Our focus is on organic growth capitalising on the wealth of experience in our business
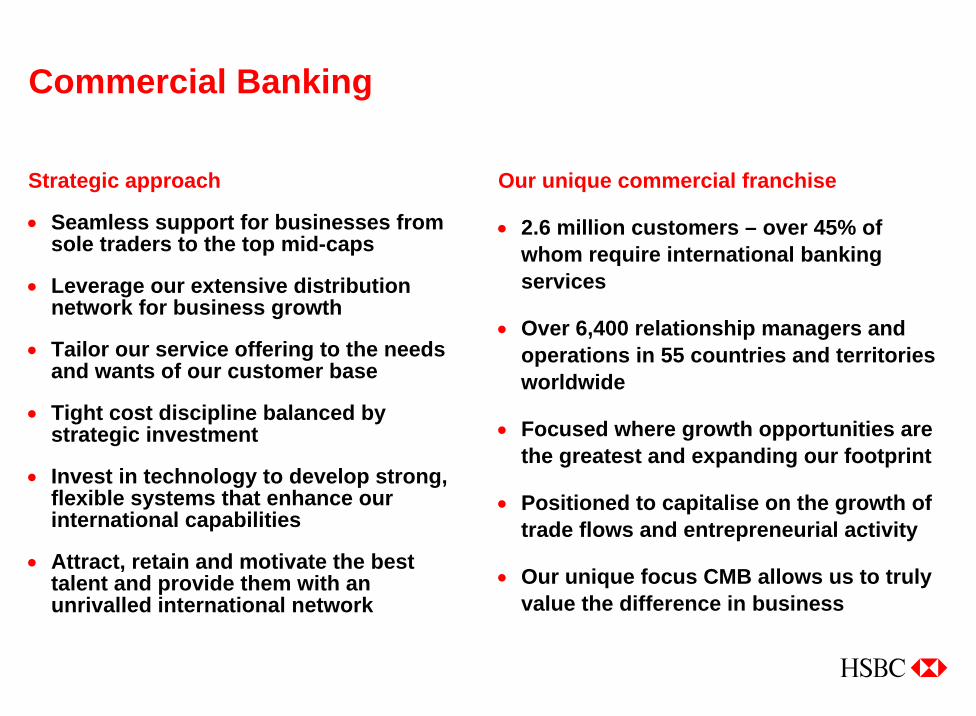
Strategic approach
• Seamless support for businesses from sole traders to the top mid-caps
• Leverage our extensive distribution network for business growth
• Tailor our service offering to the needs and wants of our customer base
• Tight cost discipline balanced by strategic investment
• Invest in technology to develop strong, flexible systems that enhance our international capabilities
• Attract, retain and motivate the best talent and provide them with an unrivalled international network
Our unique commercial franchise
• 2.6 million customers – over 45% of whom require international banking services
• Over 6,400 relationship managers and operations in 55 countries and territories worldwide
• Focused where growth opportunities are the greatest and expanding our footprint
• Positioned to capitalise on the growth of trade flows and entrepreneurial activity
• Our unique focus CMB allows us to truly value the difference in business
Commercial Banking
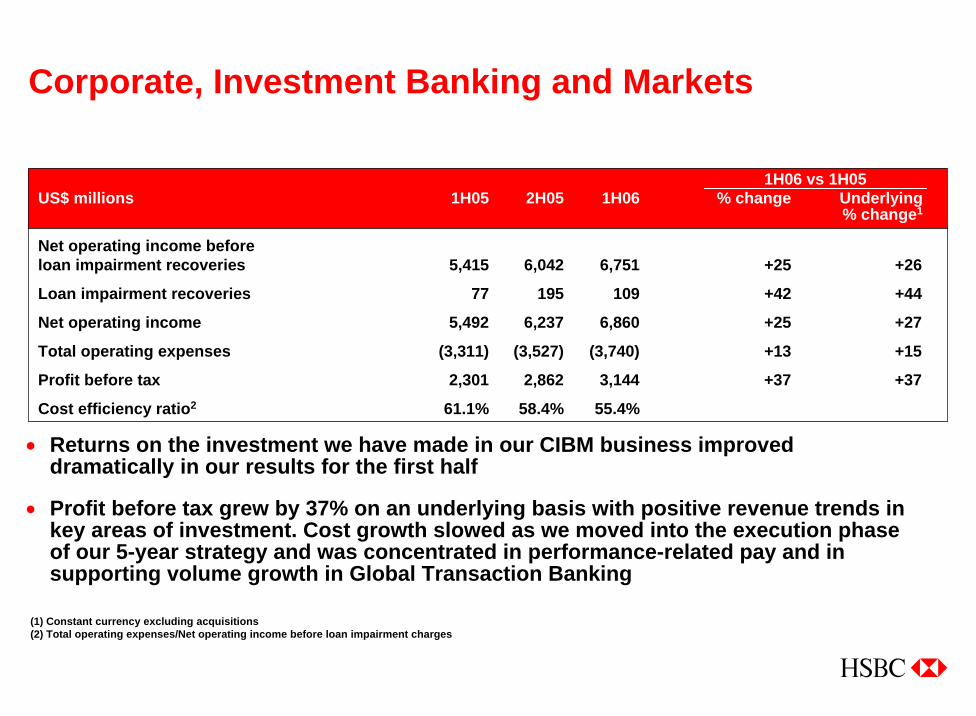
Corporate, Investment Banking and Markets
Net operating income beforeloan impairment recoveries 5,415 6,042 6,751 +25 +26
Loan impairment recoveries 77 195 109 +42 +44
Net operating income 5,492 6,237 6,860 +25 +27
Total operating expenses (3,311) (3,527) (3,740) +13 +15
Profit before tax 2,301 2,862 3,144 +37 +37
Cost efficiency ratio2 61.1% 58.4% 55.4%
US$ millions 1H05 2H05 1H06 % change Underlying % change1
1H06 vs 1H05
(1) Constant currency excluding acquisitions(2) Total operating expenses/Net operating income before loan impairment charges
• Returns on the investment we have made in our CIBM business improved dramatically in our results for the first half
• Profit before tax grew by 37% on an underlying basis with positive revenue trends in key areas of investment. Cost growth slowed as we moved into the execution phase of our 5-year strategy and was concentrated in performance-related pay and in supporting volume growth in Global Transaction Banking
Corporate, Investment Banking and Markets
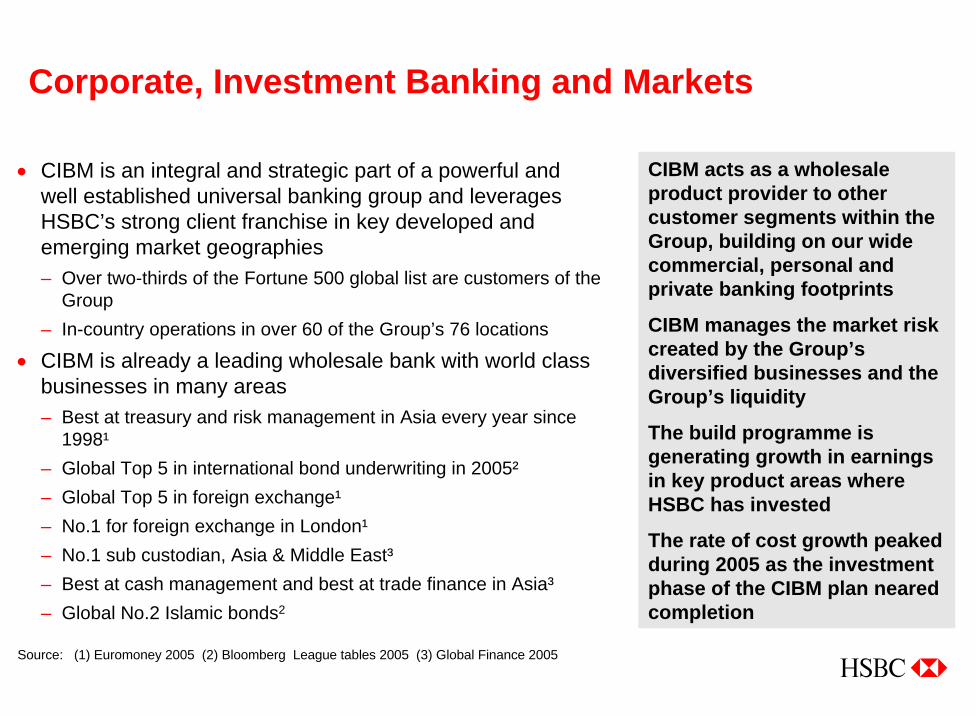
• CIBM is an integral and strategic part of a powerful and well established universal banking group and leverages HSBC’s strong client franchise in key developed and emerging market geographies– Over two-thirds of the Fortune 500 global list are customers of the
Group– In-country operations in over 60 of the Group’s 76 locations
• CIBM is already a leading wholesale bank with world class businesses in many areas– Best at treasury and risk management in Asia every year since
1998¹– Global Top 5 in international bond underwriting in 2005²– Global Top 5 in foreign exchange¹– No.1 for foreign exchange in London¹– No.1 sub custodian, Asia & Middle East³– Best at cash management and best at trade finance in Asia³– Global No.2 Islamic bonds2
Source: (1) Euromoney 2005 (2) Bloomberg League tables 2005 (3) Global Finance 2005
CIBM acts as a wholesale product provider to other customer segments within the Group, building on our wide commercial, personal and private banking footprints
CIBM manages the market risk created by the Group’s diversified businesses and the Group’s liquidity
The build programme is generating growth in earnings in key product areas where HSBC has invested
The rate of cost growth peaked during 2005 as the investment phase of the CIBM plan neared completion
Corporate, Investment Banking and MarketsThe strategic focus
• Build a financing (and emerging markets) led wholesale bank through– Roll out of our successful Asian hub/spoke model to EMEA and the
Americas to provide expansion of distribution in key emerging market geographies enabling us to leverage the investment in product development
– Enhancement of the product suite to grow our capabilities in structured derivatives, fixed income and equities
– Build out of our debt and equity capital markets presences
– Build out of targeted advisory platform
– Creation of market leading e-delivery platforms
– More efficient use of the Group’s balance sheet
– Positioning the Investment Businesses to best leverage Group strengths
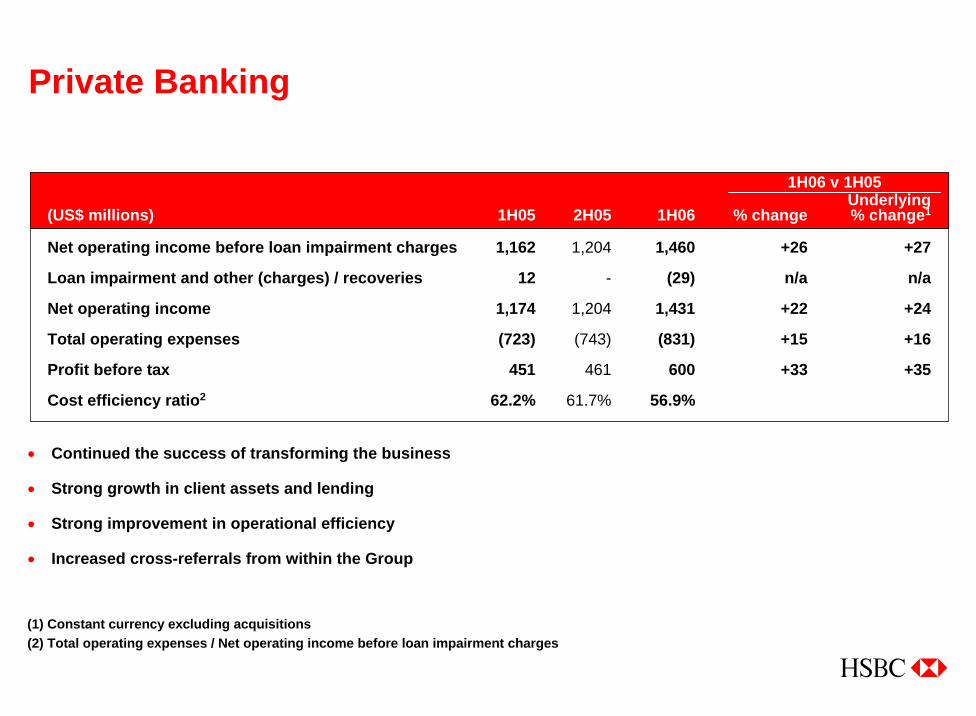
Private Banking
• Continued the success of transforming the business
• Strong growth in client assets and lending
• Strong improvement in operational efficiency
• Increased cross-referrals from within the Group
Net operating income before loan impairment charges 1,162 1,204 1,460 +26 +27
Loan impairment and other (charges) / recoveries 12 - (29) n/a n/a
Net operating income 1,174 1,204 1,431 +22 +24
Total operating expenses (723) (743) (831) +15 +16
Profit before tax 451 461 600 +33 +35
Cost efficiency ratio2 62.2% 61.7% 56.9%
Underlying(US$ millions) 1H05 2H05 1H06 % change % change1
(1) Constant currency excluding acquisitions(2) Total operating expenses / Net operating income before loan impairment charges
1H06 v 1H05
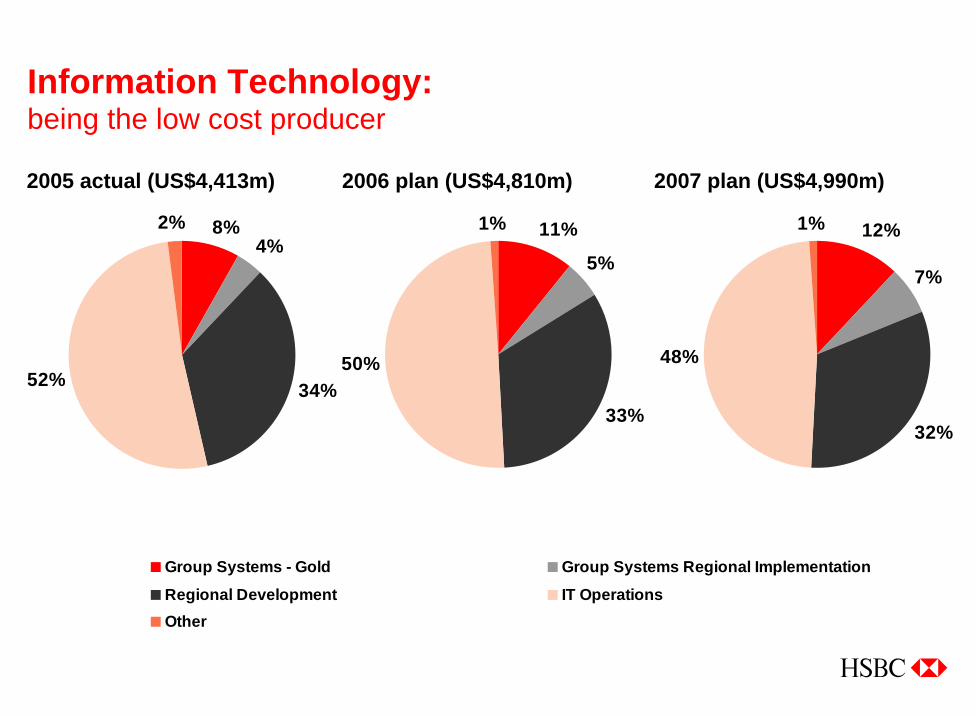
Information Technology: being the low cost producer
2005 actual (US$4,413m) 2006 plan (US$4,810m) 2007 plan (US$4,990m)
8%4%
34%52%
2% 11%
5%
33%
50%
1% 12%
7%
32%
48%
1%
Group Systems - Gold Group Systems Regional Implementation
Regional Development IT OperationsOther
Unexploited efficiency potentialEfficient IT
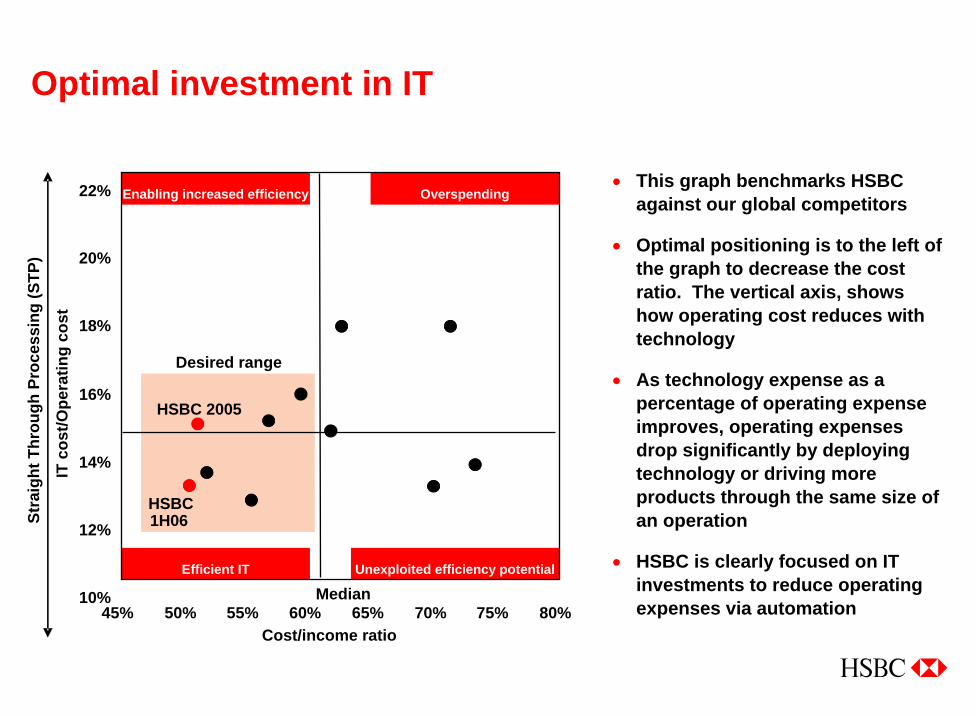
Optimal investment in IT
• This graph benchmarks HSBC against our global competitors
• Optimal positioning is to the left of the graph to decrease the cost ratio. The vertical axis, shows how operating cost reduces with technology
• As technology expense as a percentage of operating expense improves, operating expenses drop significantly by deploying technology or driving more products through the same size of an operation
• HSBC is clearly focused on IT investments to reduce operating expenses via automation10%
12%
14%
16%
18%
20%
22%
45% 50% 55% 60% 65% 70% 75% 80%Cost/income ratio
IT c
ost/O
pera
ting
cost
Median
Desired range
HSBC 2005
HSBC1H06St
raig
ht T
hrou
gh P
roce
ssin
g (S
TP)
Enabling increased efficiency Overspending
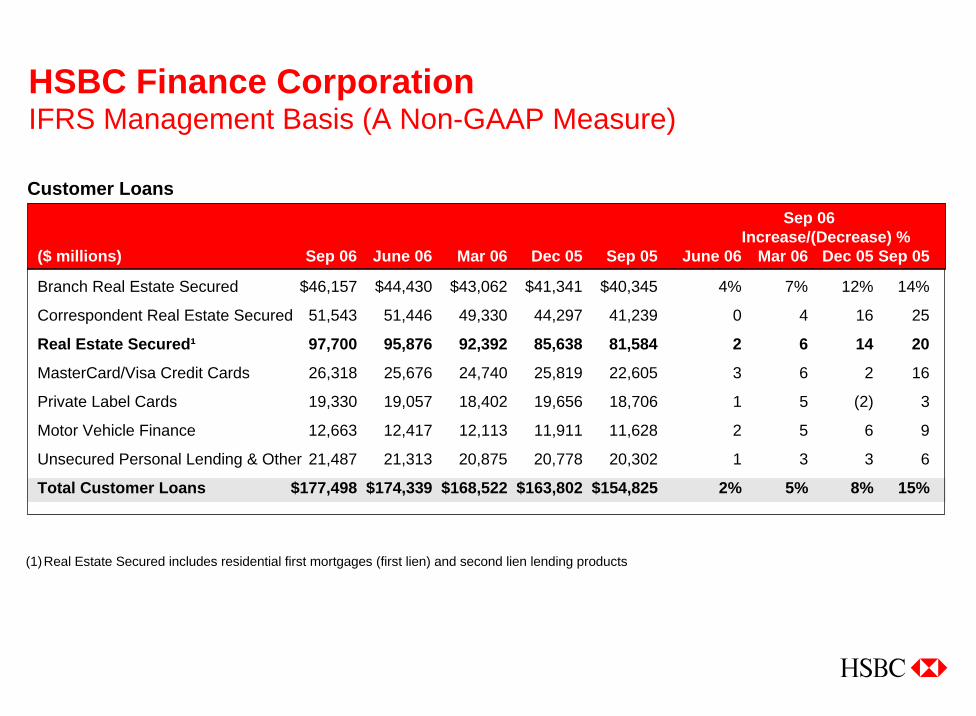
Sep 06 Increase/(Decrease) %
($ millions) Sep 06 June 06 Mar 06 Dec 05 Sep 05 June 06 Mar 06 Dec 05 Sep 05
Customer Loans
HSBC Finance Corporation IFRS Management Basis (A Non-GAAP Measure)
(1)Real Estate Secured includes residential first mortgages (first lien) and second lien lending products
Branch Real Estate Secured $46,157 $44,430 $43,062 $41,341 $40,345 4% 7% 12% 14%
Correspondent Real Estate Secured 51,543 51,446 49,330 44,297 41,239 0 4 16 25
Real Estate Secured¹ 97,700 95,876 92,392 85,638 81,584 2 6 14 20
MasterCard/Visa Credit Cards 26,318 25,676 24,740 25,819 22,605 3 6 2 16
Private Label Cards 19,330 19,057 18,402 19,656 18,706 1 5 (2) 3
Motor Vehicle Finance 12,663 12,417 12,113 11,911 11,628 2 5 6 9
Unsecured Personal Lending & Other 21,487 21,313 20,875 20,778 20,302 1 3 3 6
Total Customer Loans $177,498 $174,339 $168,522 $163,802 $154,825 2% 5% 8% 15%
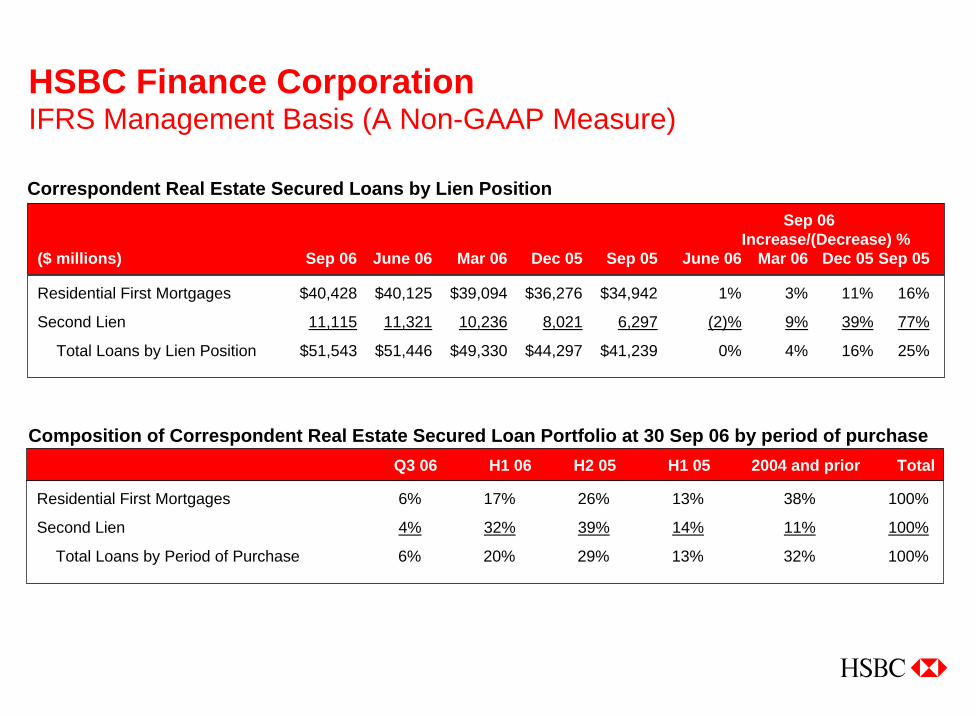
Residential First Mortgages 6% 17% 26% 13% 38% 100%
Second Lien 4% 32% 39% 14% 11% 100%
Total Loans by Period of Purchase 6% 20% 29% 13% 32% 100%
Q3 06 H1 06 H2 05 H1 05 2004 and prior Total
Composition of Correspondent Real Estate Secured Loan Portfolio at 30 Sep 06 by period of purchase
Residential First Mortgages $40,428 $40,125 $39,094 $36,276 $34,942 1% 3% 11% 16%
Second Lien 11,115 11,321 10,236 8,021 6,297 (2)% 9% 39% 77%
Total Loans by Lien Position $51,543 $51,446 $49,330 $44,297 $41,239 0% 4% 16% 25%
HSBC Finance CorporationIFRS Management Basis (A Non-GAAP Measure)
Sep 06 Increase/(Decrease) %
($ millions) Sep 06 June 06 Mar 06 Dec 05 Sep 05 June 06 Mar 06 Dec 05 Sep 05
Correspondent Real Estate Secured Loans by Lien Position
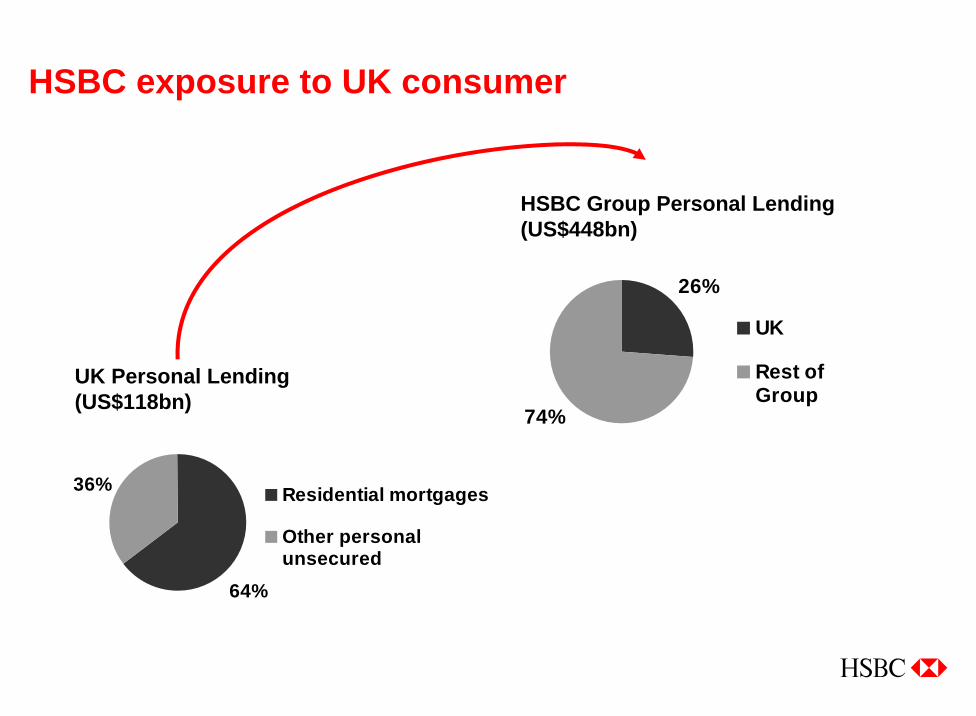
HSBC exposure to UK consumer
36%
64%
Residential mortgages
Other personalunsecured
26%
74%
UK
Rest ofGroup
UK Personal Lending (US$118bn)
HSBC Group Personal Lending (US$448bn)
ProgressivePerceptiveResponsiveRespectfulFair
One of the world’s leading brands for customer experience and corporate responsibility
HSBC now ranked No. 28 by Interbrand
Highest mover in top 40. Absent from top 100 in 2002
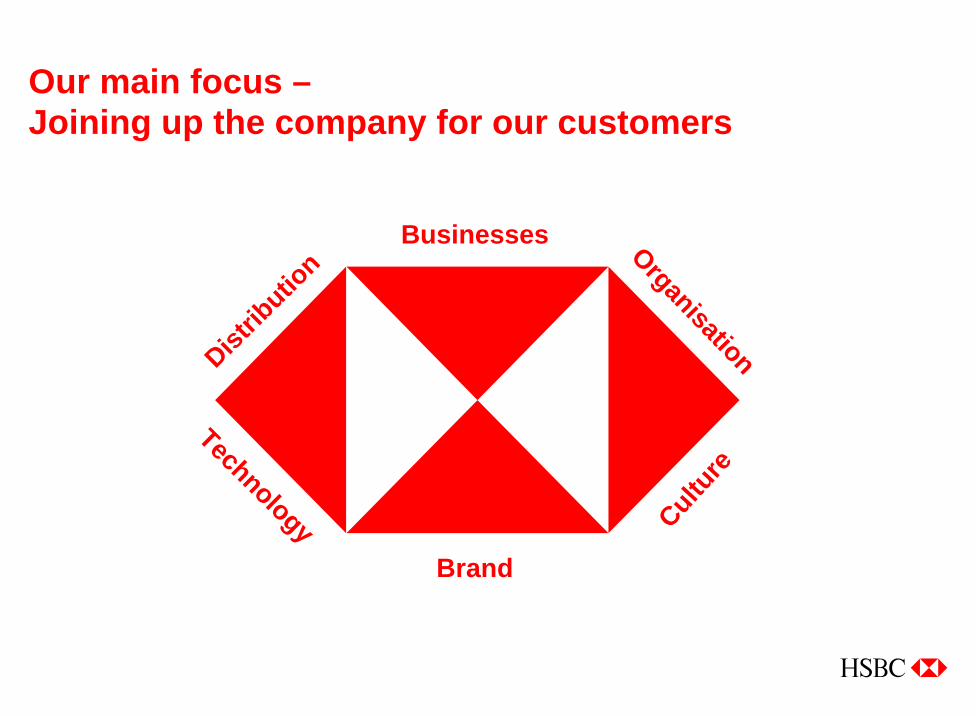
Distrib
ution
TechnologyBrand
Cultur
e
OrganisationBusinesses
Our main focus –Joining up the company for our customers