Embed Size (px)
Citation preview
Technology M&A Report
Q2 2012
HYDE PARK CAPITAL
Member FINRA/SIPC
Investment Banking | Mergers & Acquisitions | Capital Raising
Hyde Park Capital Advisors, LLC 701 N. Franklin Street
Tampa, FL 33602 Tel: 813-383-0202
www.hydeparkcapital.com
John Hill Senior Managing Director [email protected] (813) 383-0205 John McDonald Senior Managing Director [email protected] (813) 383-0206 Keith Hodgdon Senior Vice President [email protected] (813) 383-0208 Jeffrey Bridge Vice President [email protected] (813) 383-0204 Michael Mariani Associate [email protected] (813) 597-2649 Jennifer Paul Associate [email protected] (813) 383-0203
HYDE PARK CAPITAL Investment Banking | Mergers & Acquisitions | Capital Raising
Public Market Performance (LTM)
Select Initial Public Offerings – Technology (Q2 2012)
Market Performance by Sector
Source: S&P Capital IQ
2
Capital Markets Overview
($ in millions)
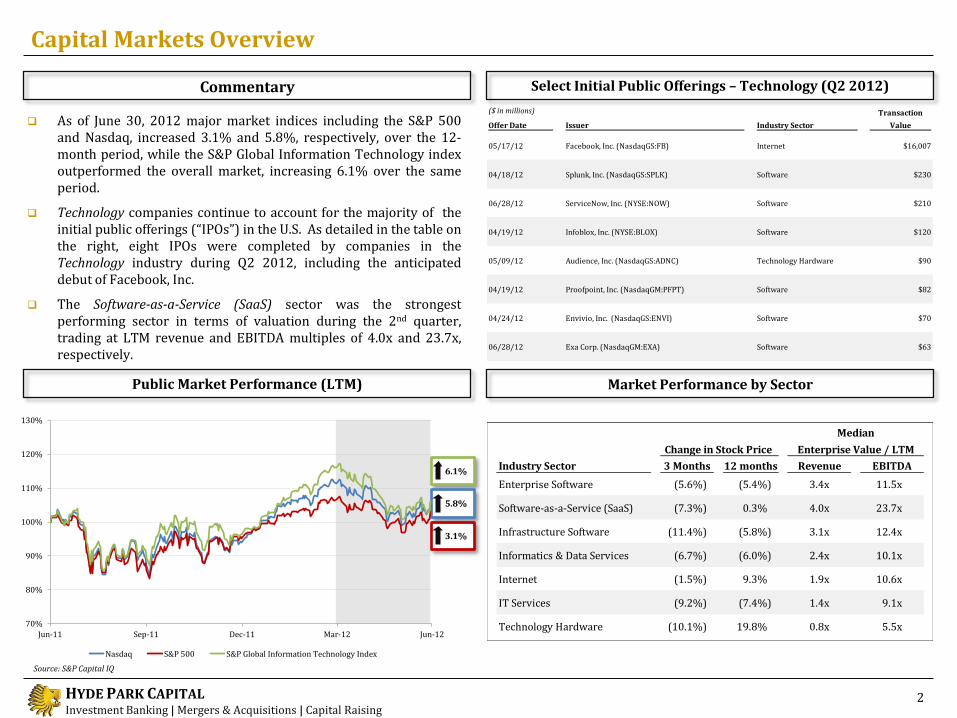
As of June 30, 2012 major market indices including the S&P 500 and Nasdaq, increased 3.1% and 5.8%, respectively, over the 12-month period, while the S&P Global Information Technology index outperformed the overall market, increasing 6.1% over the same period.
Technology companies continue to account for the majority of the initial public offerings (“IPOs”) in the U.S. As detailed in the table on the right, eight IPOs were completed by companies in the Technology industry during Q2 2012, including the anticipated debut of Facebook, Inc.
The Software-as-a-Service (SaaS) sector was the strongest performing sector in terms of valuation during the 2nd quarter, trading at LTM revenue and EBITDA multiples of 4.0x and 23.7x, respectively.
Commentary
6.1%
5.8%
3.1%
70%
80%
90%
100%
110%
120%
130%
Jun-11 Sep-11 Dec-11 Mar-12 Jun-12
Nasdaq S&P 500 S&P Global Information Technology Index
Offer Date Issuer Industry Sector
Transaction
Value
05/17/12 Facebook, Inc. (NasdaqGS:FB) Internet $16,007
04/18/12 Splunk, Inc. (NasdaqGS:SPLK) Software $230
06/28/12 ServiceNow, Inc. (NYSE:NOW) Software $210
04/19/12 Infoblox, Inc. (NYSE:BLOX) Software $120
05/09/12 Audience, Inc. (NasdaqGS:ADNC) Technology Hardware $90
04/19/12 Proofpoint, Inc. (NasdaqGM:PFPT) Software $82
04/24/12 Envivio, Inc. (NasdaqGS:ENVI) Software $70
06/28/12 Exa Corp. (NasdaqGM:EXA) Software $63
Industry Sector 3 Months 12 months Revenue EBITDA
Enterprise Software (5.6%) (5.4%) 3.4x 11.5x
Software-as-a-Service (SaaS) (7.3%) 0.3% 4.0x 23.7x
Infrastructure Software (11.4%) (5.8%) 3.1x 12.4x
Informatics & Data Services (6.7%) (6.0%) 2.4x 10.1x
Internet (1.5%) 9.3% 1.9x 10.6x
IT Services (9.2%) (7.4%) 1.4x 9.1x
Technology Hardware (10.1%) 19.8% 0.8x 5.5x
Median
Change in Stock Price Enterprise Value / LTM
HYDE PARK CAPITAL Investment Banking | Mergers & Acquisitions | Capital Raising
18.2x
13.6x16.5x
25.8x
32.2x
23.0x
26.4x
15.7x
19.9x21.5x
17.5x
2.3x
1.8x
2.6x2.5x
2.4x2.3x 2.3x
1.9x
2.4x
2.6x
2.8x
0.0x
0.5x
1.0x
1.5x
2.0x
2.5x
3.0x
3.5x
0.0x
5.0x
10.0x
15.0x
20.0x
25.0x
30.0x
35.0x
2002 2003 2004 2005 2006 2007 2008 2009 2010 2011 1H 2012
EV / EBITDA EV / Revenue
Middle Market Purchase Multiples
U.S. Middle Market M&A Activity – Annual Trends: VOLUME U.S. Middle Market M&A Activity – Annual Trends: VALUE
Annual Middle Market M&A Activity – Technology
3
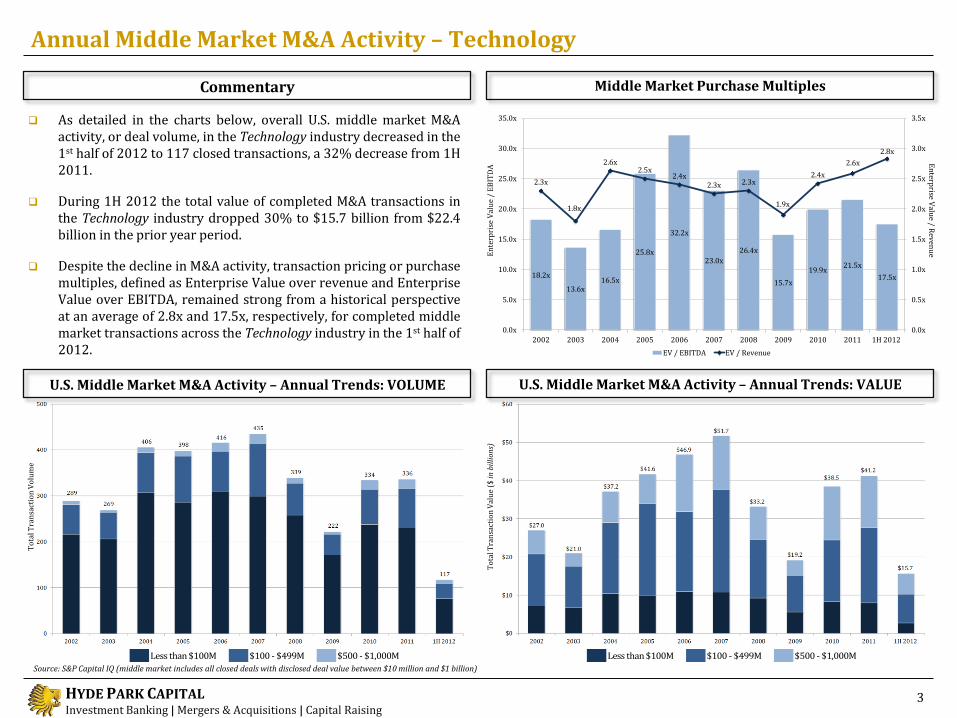
As detailed in the charts below, overall U.S. middle market M&A activity, or deal volume, in the Technology industry decreased in the 1st half of 2012 to 117 closed transactions, a 32% decrease from 1H 2011.
During 1H 2012 the total value of completed M&A transactions in the Technology industry dropped 30% to $15.7 billion from $22.4 billion in the prior year period.
Despite the decline in M&A activity, transaction pricing or purchase multiples, defined as Enterprise Value over revenue and Enterprise Value over EBITDA, remained strong from a historical perspective at an average of 2.8x and 17.5x, respectively, for completed middle market transactions across the Technology industry in the 1st half of 2012.
Commentary
Source: S&P Capital IQ (middle market includes all closed deals with disclosed deal value between $10 million and $1 billion)
Less than $100M $100 - $499M $500 - $1,000MLess than $100M $100 - $499M $500 - $1,000M
To
tal T
ran
sact
ion
Vo
lum
e
To
tal T
ran
sact
ion
Val
ue
($ i
n b
illi
ons)
E
nte
rpri
se V
alu
e /
EB
ITD
A E
nterp
rise Valu
e / Reven
ue
HYDE PARK CAPITAL Investment Banking | Mergers & Acquisitions | Capital Raising
Quarterly Middle Market M&A Activity – Technology
U.S. Middle Market M&A Activity – Quarterly Trends: VALUE U.S. Middle Market M&A Activity – Quarterly Trends: VOLUME
Middle Market M&A Transactions by Deal Size – Technology
($ in billions)
To
tal T
ran
sact
ion
Vo
lum
e
To
tal T
ran
sact
ion
Val
ue
($ i
n b
illi
ons)
4
Commentary
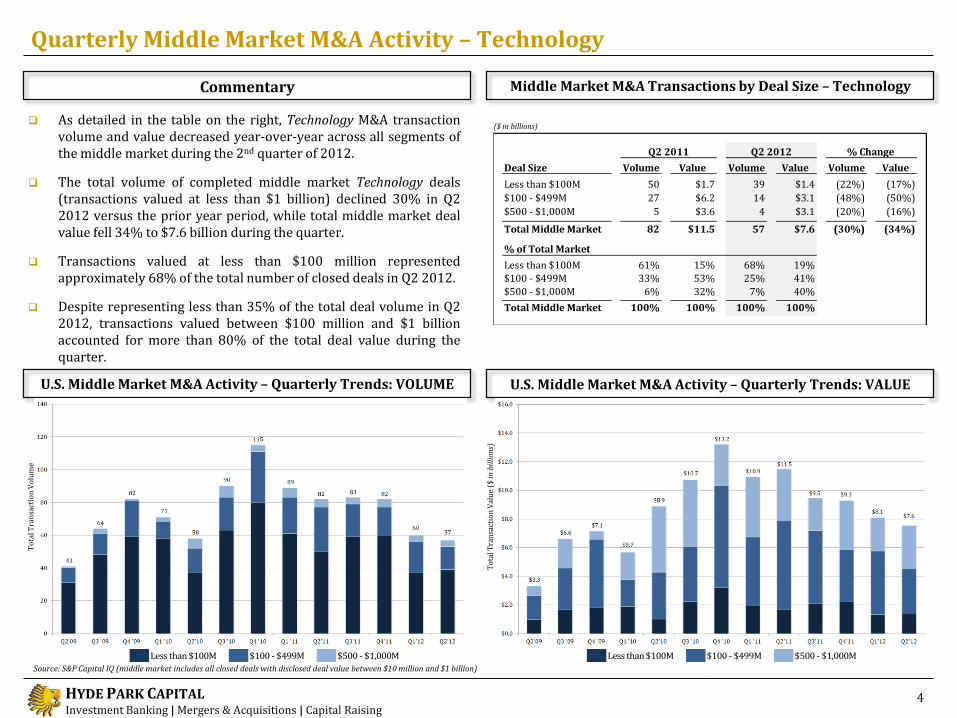
As detailed in the table on the right, Technology M&A transaction volume and value decreased year-over-year across all segments of the middle market during the 2nd quarter of 2012.
The total volume of completed middle market Technology deals (transactions valued at less than $1 billion) declined 30% in Q2 2012 versus the prior year period, while total middle market deal value fell 34% to $7.6 billion during the quarter.
Transactions valued at less than $100 million represented approximately 68% of the total number of closed deals in Q2 2012.
Despite representing less than 35% of the total deal volume in Q2 2012, transactions valued between $100 million and $1 billion accounted for more than 80% of the total deal value during the quarter.
Less than $100M $100 - $499M $500 - $1,000MLess than $100M $100 - $499M $500 - $1,000M
Deal Size Volume Value Volume Value Volume Value
Less than $100M 50 $1.7 39 $1.4 (22%) (17%)
$100 - $499M 27 $6.2 14 $3.1 (48%) (50%)
$500 - $1,000M 5 $3.6 4 $3.1 (20%) (16%)
Total Middle Market 82 $11.5 57 $7.6 (30%) (34%)
% of Total Market
Less than $100M 61% 15% 68% 19%
$100 - $499M 33% 53% 25% 41%
$500 - $1,000M 6% 32% 7% 40%
Total Middle Market 100% 100% 100% 100%
Q2 2011 Q2 2012 % Change
Source: S&P Capital IQ (middle market includes all closed deals with disclosed deal value between $10 million and $1 billion)
HYDE PARK CAPITAL Investment Banking | Mergers & Acquisitions | Capital Raising
Recent M&A Activity – Technology
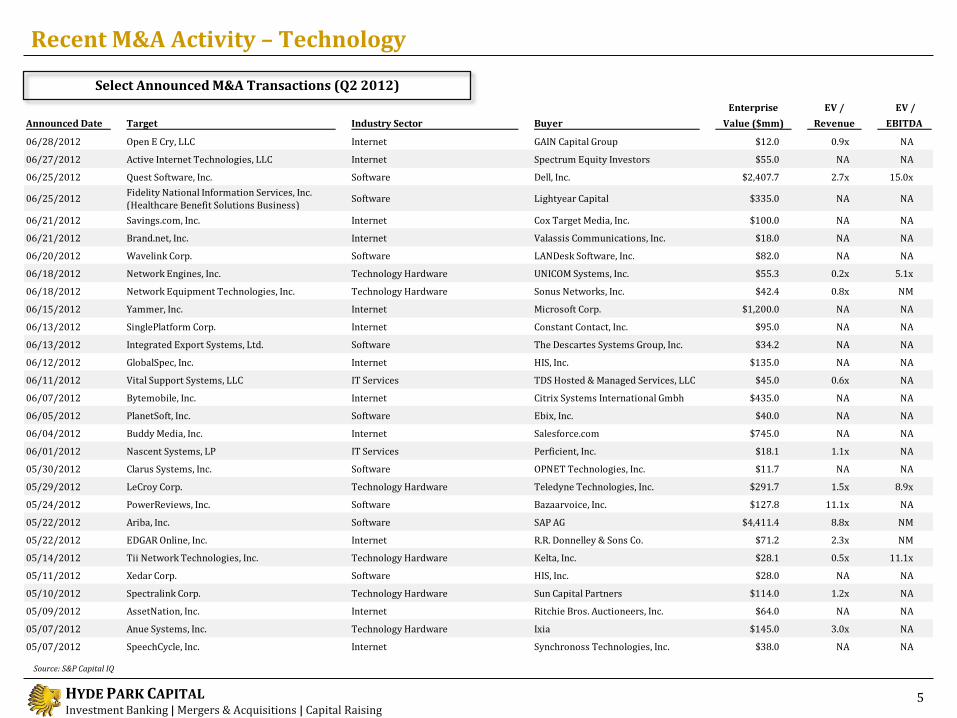
Select Announced M&A Transactions (Q2 2012)
5
Source: S&P Capital IQ
Announced Date Target Industry Sector Buyer
Enterprise
Value ($mm)
EV /
Revenue
EV /
EBITDA
06/28/2012 Open E Cry, LLC Internet GAIN Capital Group $12.0 0.9x NA
06/27/2012 Active Internet Technologies, LLC Internet Spectrum Equity Investors $55.0 NA NA
06/25/2012 Quest Software, Inc. Software Dell, Inc. $2,407.7 2.7x 15.0x
06/25/2012Fidelity National Information Services, Inc.
(Healthcare Benefit Solutions Business)Software Lightyear Capital $335.0 NA NA
06/21/2012 Savings.com, Inc. Internet Cox Target Media, Inc. $100.0 NA NA
06/21/2012 Brand.net, Inc. Internet Valassis Communications, Inc. $18.0 NA NA
06/20/2012 Wavelink Corp. Software LANDesk Software, Inc. $82.0 NA NA
06/18/2012 Network Engines, Inc. Technology Hardware UNICOM Systems, Inc. $55.3 0.2x 5.1x
06/18/2012 Network Equipment Technologies, Inc. Technology Hardware Sonus Networks, Inc. $42.4 0.8x NM
06/15/2012 Yammer, Inc. Internet Microsoft Corp. $1,200.0 NA NA
06/13/2012 SinglePlatform Corp. Internet Constant Contact, Inc. $95.0 NA NA
06/13/2012 Integrated Export Systems, Ltd. Software The Descartes Systems Group, Inc. $34.2 NA NA
06/12/2012 GlobalSpec, Inc. Internet HIS, Inc. $135.0 NA NA
06/11/2012 Vital Support Systems, LLC IT Services TDS Hosted & Managed Services, LLC $45.0 0.6x NA
06/07/2012 Bytemobile, Inc. Internet Citrix Systems International Gmbh $435.0 NA NA
06/05/2012 PlanetSoft, Inc. Software Ebix, Inc. $40.0 NA NA
06/04/2012 Buddy Media, Inc. Internet Salesforce.com $745.0 NA NA
06/01/2012 Nascent Systems, LP IT Services Perficient, Inc. $18.1 1.1x NA
05/30/2012 Clarus Systems, Inc. Software OPNET Technologies, Inc. $11.7 NA NA
05/29/2012 LeCroy Corp. Technology Hardware Teledyne Technologies, Inc. $291.7 1.5x 8.9x
05/24/2012 PowerReviews, Inc. Software Bazaarvoice, Inc. $127.8 11.1x NA
05/22/2012 Ariba, Inc. Software SAP AG $4,411.4 8.8x NM
05/22/2012 EDGAR Online, Inc. Internet R.R. Donnelley & Sons Co. $71.2 2.3x NM
05/14/2012 Tii Network Technologies, Inc. Technology Hardware Kelta, Inc. $28.1 0.5x 11.1x
05/11/2012 Xedar Corp. Software HIS, Inc. $28.0 NA NA
05/10/2012 Spectralink Corp. Technology Hardware Sun Capital Partners $114.0 1.2x NA
05/09/2012 AssetNation, Inc. Internet Ritchie Bros. Auctioneers, Inc. $64.0 NA NA
05/07/2012 Anue Systems, Inc. Technology Hardware Ixia $145.0 3.0x NA
05/07/2012 SpeechCycle, Inc. Internet Synchronoss Technologies, Inc. $38.0 NA NA
HYDE PARK CAPITAL Investment Banking | Mergers & Acquisitions | Capital Raising
Recent M&A Activity – Technology
Select Announced M&A Transactions (Q2 2012)
6
Source: S&P Capital IQ
Announced Date Target Industry Sector Buyer
Enterprise
Value ($mm)
EV /
Revenue
EV /
EBITDA
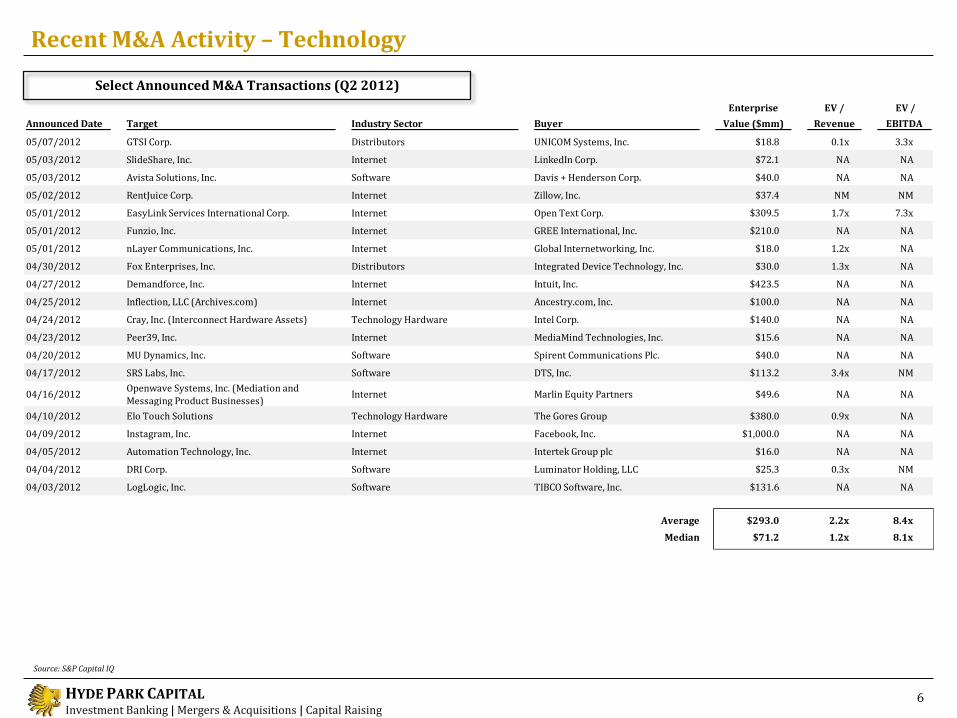
05/07/2012 GTSI Corp. Distributors UNICOM Systems, Inc. $18.8 0.1x 3.3x
05/03/2012 SlideShare, Inc. Internet LinkedIn Corp. $72.1 NA NA
05/03/2012 Avista Solutions, Inc. Software Davis + Henderson Corp. $40.0 NA NA
05/02/2012 RentJuice Corp. Internet Zillow, Inc. $37.4 NM NM
05/01/2012 EasyLink Services International Corp. Internet Open Text Corp. $309.5 1.7x 7.3x
05/01/2012 Funzio, Inc. Internet GREE International, Inc. $210.0 NA NA
05/01/2012 nLayer Communications, Inc. Internet Global Internetworking, Inc. $18.0 1.2x NA
04/30/2012 Fox Enterprises, Inc. Distributors Integrated Device Technology, Inc. $30.0 1.3x NA
04/27/2012 Demandforce, Inc. Internet Intuit, Inc. $423.5 NA NA
04/25/2012 Inflection, LLC (Archives.com) Internet Ancestry.com, Inc. $100.0 NA NA
04/24/2012 Cray, Inc. (Interconnect Hardware Assets) Technology Hardware Intel Corp. $140.0 NA NA
04/23/2012 Peer39, Inc. Internet MediaMind Technologies, Inc. $15.6 NA NA
04/20/2012 MU Dynamics, Inc. Software Spirent Communications Plc. $40.0 NA NA
04/17/2012 SRS Labs, Inc. Software DTS, Inc. $113.2 3.4x NM
04/16/2012Openwave Systems, Inc. (Mediation and Messaging Product Businesses)
Internet Marlin Equity Partners $49.6 NA NA
04/10/2012 Elo Touch Solutions Technology Hardware The Gores Group $380.0 0.9x NA
04/09/2012 Instagram, Inc. Internet Facebook, Inc. $1,000.0 NA NA
04/05/2012 Automation Technology, Inc. Internet Intertek Group plc $16.0 NA NA
04/04/2012 DRI Corp. Software Luminator Holding, LLC $25.3 0.3x NM
04/03/2012 LogLogic, Inc. Software TIBCO Software, Inc. $131.6 NA NA
Average $293.0 2.2x 8.4x
Median $71.2 1.2x 8.1x
HYDE PARK CAPITAL Investment Banking | Mergers & Acquisitions | Capital Raising
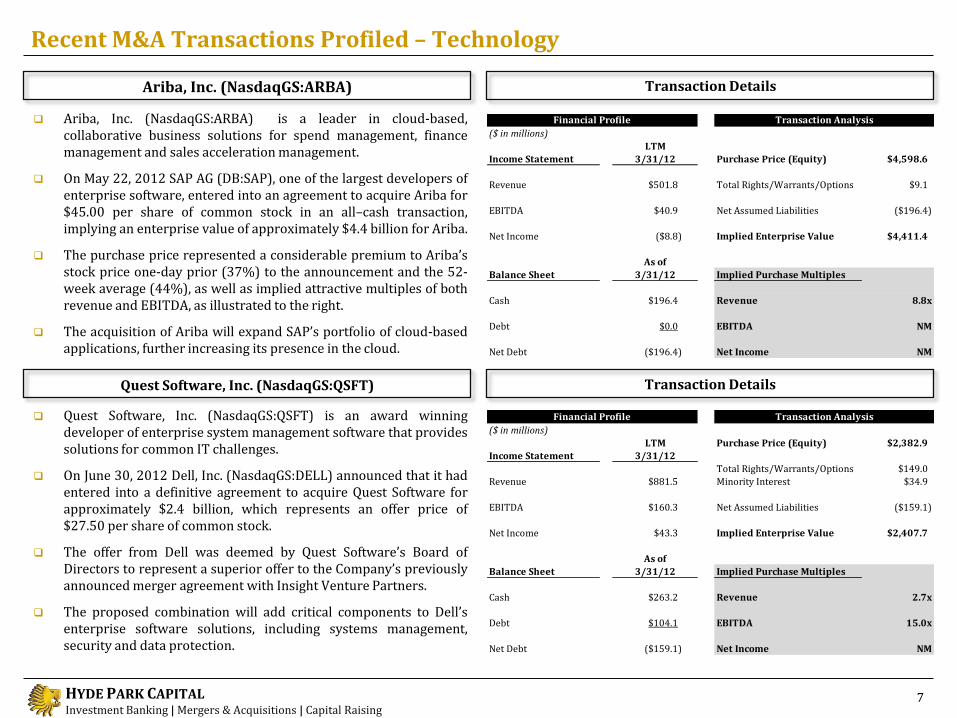
Ariba, Inc. (NasdaqGS:ARBA) is a leader in cloud-based, collaborative business solutions for spend management, finance management and sales acceleration management.
On May 22, 2012 SAP AG (DB:SAP), one of the largest developers of enterprise software, entered into an agreement to acquire Ariba for $45.00 per share of common stock in an all–cash transaction, implying an enterprise value of approximately $4.4 billion for Ariba.
The purchase price represented a considerable premium to Ariba’s stock price one-day prior (37%) to the announcement and the 52-week average (44%), as well as implied attractive multiples of both revenue and EBITDA, as illustrated to the right.
The acquisition of Ariba will expand SAP’s portfolio of cloud-based applications, further increasing its presence in the cloud.
Recent M&A Transactions Profiled – Technology
Transaction Details Quest Software, Inc. (NasdaqGS:QSFT)
Transaction Details
7
Ariba, Inc. (NasdaqGS:ARBA)
Quest Software, Inc. (NasdaqGS:QSFT) is an award winning developer of enterprise system management software that provides solutions for common IT challenges.
On June 30, 2012 Dell, Inc. (NasdaqGS:DELL) announced that it had entered into a definitive agreement to acquire Quest Software for approximately $2.4 billion, which represents an offer price of $27.50 per share of common stock.
The offer from Dell was deemed by Quest Software’s Board of Directors to represent a superior offer to the Company’s previously announced merger agreement with Insight Venture Partners.
The proposed combination will add critical components to Dell’s enterprise software solutions, including systems management, security and data protection.
($ in millions)
LTM
Income Statement 3/31/12 Purchase Price (Equity) $4,598.6
Revenue $501.8 Total Rights/Warrants/Options $9.1
EBITDA $40.9 Net Assumed Liabilities ($196.4)
Net Income ($8.8) Implied Enterprise Value $4,411.4
As of
Balance Sheet 3/31/12 Implied Purchase Multiples
Cash $196.4 Revenue 8.8x
Debt $0.0 EBITDA NM
Net Debt ($196.4) Net Income NM
Financial Profile Transaction Analysis
($ in millions)
LTM Purchase Price (Equity) $2,382.9
Income Statement 3/31/12
Total Rights/Warrants/Options $149.0
Revenue $881.5 Minority Interest $34.9
EBITDA $160.3 Net Assumed Liabilities ($159.1)
Net Income $43.3 Implied Enterprise Value $2,407.7
As of
Balance Sheet 3/31/12 Implied Purchase Multiples
Cash $263.2 Revenue 2.7x
Debt $104.1 EBITDA 15.0x
Net Debt ($159.1) Net Income NM
Financial Profile Transaction Analysis
HYDE PARK CAPITAL Investment Banking | Mergers & Acquisitions | Capital Raising
35
7
41
34
43
26
49
53
0 10 20 30 40 50 60
Technology Hardware
IT Services
Internet
Software
$6.0
$0.6
$4.4
$4.7
$6.1
$2.8
$3.9
$9.6
$0.0 $2.0 $4.0 $6.0 $8.0 $10.0 $12.0
Technology Hardware
IT Services
Internet
Software
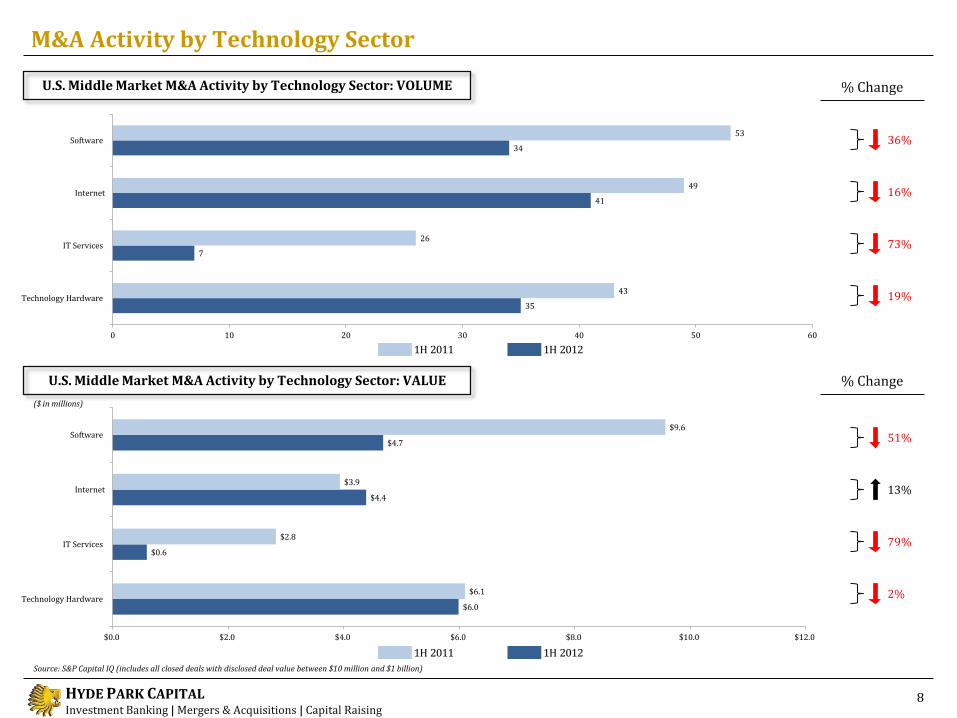
M&A Activity by Technology Sector
% Change
% Change
U.S. Middle Market M&A Activity by Technology Sector: VOLUME
8
Source: S&P Capital IQ (includes all closed deals with disclosed deal value between $10 million and $1 billion)
($ in millions)
U.S. Middle Market M&A Activity by Technology Sector: VALUE
36%
16%
73%
19%
51%
13%
79%
2%
1H 2011 1H 2012
1H 2011 1H 2012
HYDE PARK CAPITAL Investment Banking | Mergers & Acquisitions | Capital Raising
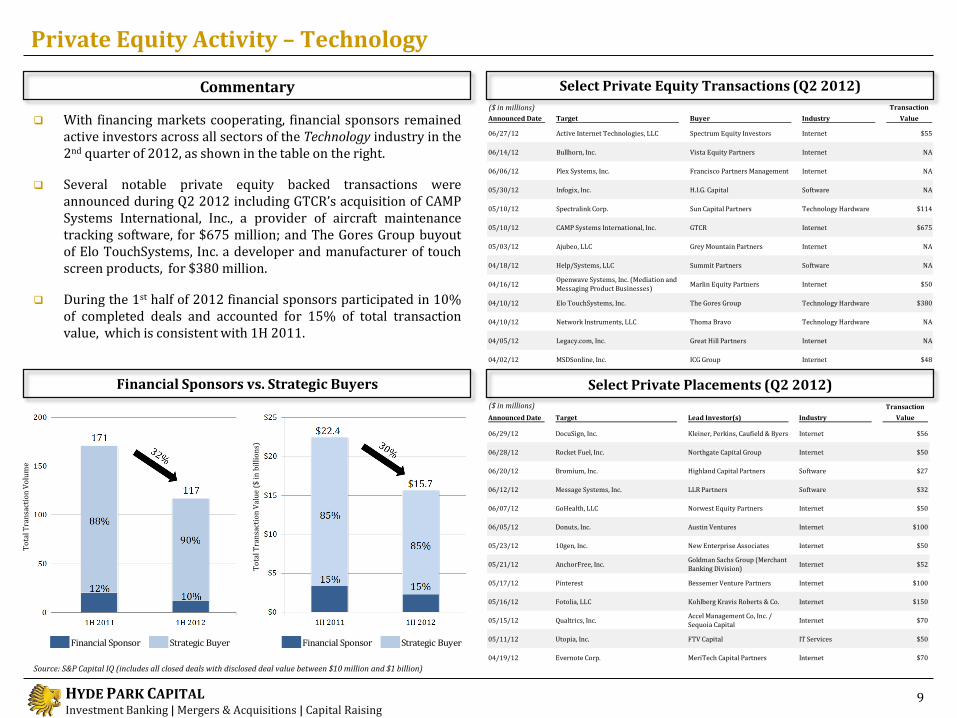
Select Private Equity Transactions (Q2 2012)
Financial Sponsors vs. Strategic Buyers Select Private Placements (Q2 2012)
Private Equity Activity – Technology
Financial Sponsor Strategic Buyer Financial Sponsor Strategic Buyer
To
tal T
ran
sact
ion
Vo
lum
e
To
tal T
ran
sact
ion
Val
ue
($ in
bil
lio
ns)
9
($ in millions)
With financing markets cooperating, financial sponsors remained active investors across all sectors of the Technology industry in the 2nd quarter of 2012, as shown in the table on the right.
Several notable private equity backed transactions were announced during Q2 2012 including GTCR’s acquisition of CAMP Systems International, Inc., a provider of aircraft maintenance tracking software, for $675 million; and The Gores Group buyout of Elo TouchSystems, Inc. a developer and manufacturer of touch screen products, for $380 million.
During the 1st half of 2012 financial sponsors participated in 10% of completed deals and accounted for 15% of total transaction value, which is consistent with 1H 2011.
Commentary
Source: S&P Capital IQ (includes all closed deals with disclosed deal value between $10 million and $1 billion)
($ in millions)
Announced Date Target Lead Investor(s) Industry
Transaction
Value
06/29/12 DocuSign, Inc. Kleiner, Perkins, Caufield & Byers Internet $56
06/28/12 Rocket Fuel, Inc. Northgate Capital Group Internet $50
06/20/12 Bromium, Inc. Highland Capital Partners Software $27
06/12/12 Message Systems, Inc. LLR Partners Software $32
06/07/12 GoHealth, LLC Norwest Equity Partners Internet $50
06/05/12 Donuts, Inc. Austin Ventures Internet $100
05/23/12 10gen, Inc. New Enterprise Associates Internet $50
05/21/12 AnchorFree, Inc.Goldman Sachs Group (Merchant Banking Division)
Internet $52
05/17/12 Pinterest Bessemer Venture Partners Internet $100
05/16/12 Fotolia, LLC Kohlberg Kravis Roberts & Co. Internet $150
05/15/12 Qualtrics, Inc.Accel Management Co, Inc. / Sequoia Capital
Internet $70
05/11/12 Utopia, Inc. FTV Capital IT Services $50
04/19/12 Evernote Corp. MeriTech Capital Partners Internet $70
Announced Date Target Buyer Industry
Transaction
Value
06/27/12 Active Internet Technologies, LLC Spectrum Equity Investors Internet $55
06/14/12 Bullhorn, Inc. Vista Equity Partners Internet NA
06/06/12 Plex Systems, Inc. Francisco Partners Management Internet NA
05/30/12 Infogix, Inc. H.I.G. Capital Software NA
05/10/12 Spectralink Corp. Sun Capital Partners Technology Hardware $114
05/10/12 CAMP Systems International, Inc. GTCR Internet $675
05/03/12 Ajubeo, LLC Grey Mountain Partners Internet NA
04/18/12 Help/Systems, LLC Summit Partners Software NA
04/16/12Openwave Systems, Inc. (Mediation and Messaging Product Businesses)
Marlin Equity Partners Internet $50
04/10/12 Elo TouchSystems, Inc. The Gores Group Technology Hardware $380
04/10/12 Network Instruments, LLC Thoma Bravo Technology Hardware NA
04/05/12 Legacy.com, Inc. Great Hill Partners Internet NA
04/02/12 MSDSonline, Inc. ICG Group Internet $48
HYDE PARK CAPITAL Investment Banking | Mergers & Acquisitions | Capital Raising
Industry Sector Overview – Recent Stock Price Performance
Software-as-a-Service (SaaS)
Commentary
10
Enterprise Software
Infrastructure Software
Source: S&P Capital IQ
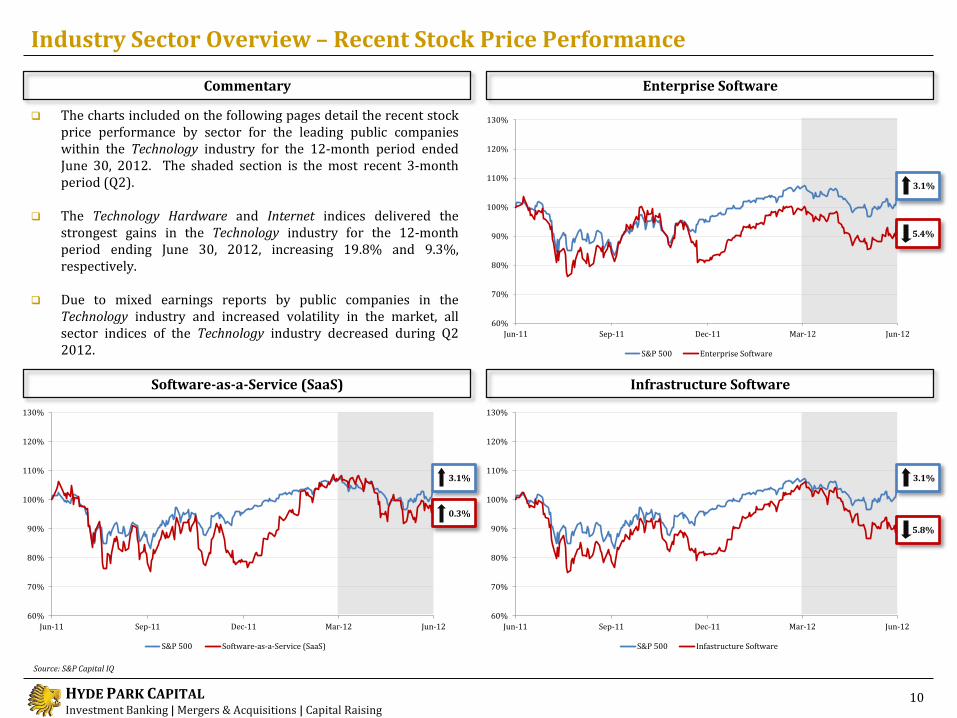
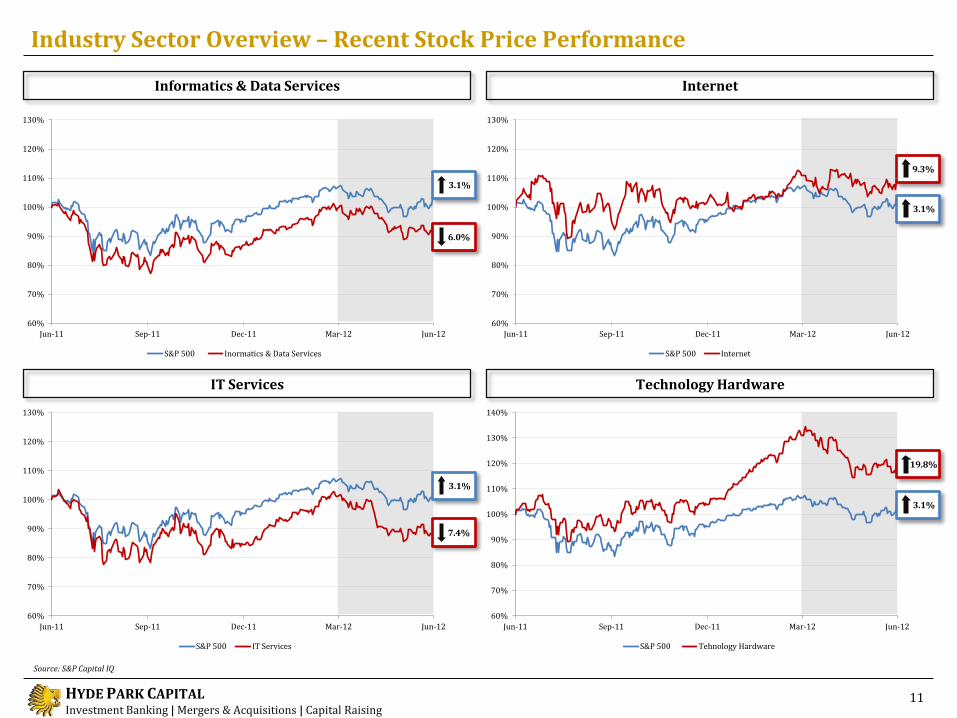
The charts included on the following pages detail the recent stock price performance by sector for the leading public companies within the Technology industry for the 12-month period ended June 30, 2012. The shaded section is the most recent 3-month period (Q2).
The Technology Hardware and Internet indices delivered the strongest gains in the Technology industry for the 12-month period ending June 30, 2012, increasing 19.8% and 9.3%, respectively.
Due to mixed earnings reports by public companies in the Technology industry and increased volatility in the market, all sector indices of the Technology industry decreased during Q2 2012.
60%
70%
80%
90%
100%
110%
120%
130%
Jun-11 Sep-11 Dec-11 Mar-12 Jun-12
S&P 500 Software-as-a-Service (SaaS)
3.1%
5.4%
3.1%
60%
70%
80%
90%
100%
110%
120%
130%
Jun-11 Sep-11 Dec-11 Mar-12 Jun-12
S&P 500 Infastructure Software
3.1%
5.8%
60%
70%
80%
90%
100%
110%
120%
130%
Jun-11 Sep-11 Dec-11 Mar-12 Jun-12
S&P 500 Enterprise Software
0.3%
HYDE PARK CAPITAL Investment Banking | Mergers & Acquisitions | Capital Raising
Industry Sector Overview – Recent Stock Price Performance
IT Services
Informatics & Data Services
11
Internet
Technology Hardware
Source: S&P Capital IQ
60%
70%
80%
90%
100%
110%
120%
130%
Jun-11 Sep-11 Dec-11 Mar-12 Jun-12
S&P 500 Inormatics & Data Services
60%
70%
80%
90%
100%
110%
120%
130%
Jun-11 Sep-11 Dec-11 Mar-12 Jun-12
S&P 500 IT Services
60%
70%
80%
90%
100%
110%
120%
130%
140%
Jun-11 Sep-11 Dec-11 Mar-12 Jun-12
S&P 500 Tehnology Hardware
3.1%
9.3%
7.4%
3.1%
6.0%
3.1%
3.1%
19.8%
60%
70%
80%
90%
100%
110%
120%
130%
Jun-11 Sep-11 Dec-11 Mar-12 Jun-12
S&P 500 Internet
HYDE PARK CAPITAL Investment Banking | Mergers & Acquisitions | Capital Raising
Closing Price % of 52 Equity Enterprise
Company Ticker 6/29/12 Week High Value Value Revenue Gross Profit EBITDA Gross Profit EBITDA Revenue EBITDAOracle Corp. ORCL $29.70 87.0% $151,322 $137,519 $37,121 $29,263 $16,050 78.8% 43.2% 3.7x 8.6xSAP AG DB:SAP $59.36 85.3% $70,465 $71,052 $19,214 $13,758 $6,882 71.6% 35.8% 3.7x 10.3xSage Group plc LSE:SGE $4.35 88.5% $5,747 $5,552 $2,138 $2,004 $620 93.7% 29.0% 2.6x 9.0xNetSuite, Inc. N $54.77 99.9% $3,719 $3,568 $252 $177 ($17) 70.0% (6.8%) 14.1x* NMDeltek, Inc. PROJ $11.59 99.6% $755 $871 $343 $220 $50 64.0% 14.6% 2.5x 17.3xExact Holding NV ENXTAM:EXACT $21.86 81.0% $499 $434 $280 $111 $64 39.6% 22.9% 1.5x 6.8x
Average 90.2% $38,751 $36,499 $9,891 $7,589 $3,942 69.6% 23.1% 2.8x 10.4x
Median 87.8% $4,733 $4,560 $1,240 $1,112 $342 70.8% 26.0% 2.6x 9.0x
Enterprise Value /
LTM LTM Margins LTM
Closing Price % of 52 Equity Enterprise
Company Ticker 6/29/12 Week High Value Value Revenue Gross Profit EBITDA Gross Profit EBITDA Revenue EBITDAAriba, Inc. ARBA $44.76 98.4% $4,191 $3,995 $502 $330 $41 65.8% 8.1% 8.0x NMJDA Software Group, Inc. JDAS $29.69 85.2% $1,270 $1,257 $672 $406 $165 60.4% 24.5% 1.9x 7.6x
Manhattan Associates, Inc. MANH $45.71 89.6% $966 $869 $349 $204 $76 58.6% 21.7% 2.5x 11.5xSciQuest, Inc. SQI $17.96 99.1% $405 $345 $55 $41 $7 73.4% 12.1% 6.2x 51.8x
Average 93.1% $1,708 $1,617 $394 $245 $72 64.6% 16.6% 4.6x 23.6x
Median 94.0% $1,118 $1,063 $425 $267 $58 63.1% 16.9% 4.4x 11.5x
Enterprise Value /
LTM LTM Margins LTM
Closing Price % of 52 Equity Enterprise
Company Ticker 6/29/12 Week High Value Value Revenue Gross Profit EBITDA Gross Profit EBITDA Revenue EBITDA
Oracle Corp. ORCL $29.70 87.0% $151,322 $137,519 $37,121 $29,263 $16,050 78.8% 43.2% 3.7x 8.6xSAP AG DB:SAP $59.36 85.3% $70,465 $71,052 $19,214 $13,758 $6,882 71.6% 35.8% 3.7x 10.3x
Salesforce.com CRM $138.26 83.9% $18,869 $18,709 $2,458 $1,920 $106 78.1% 4.3% 7.6x NMAmdocs, Ltd. DOX $29.72 91.8% $5,266 $4,371 $3,230 $1,147 $596 35.5% 18.5% 1.4x 7.3x
NetSuite, Inc. N $54.77 99.9% $3,719 $3,568 $252 $177 ($17) 70.0% (6.8%) 14.1x* NM
Comverse Technology, Inc. CMVT $5.82 74.6% $1,230 $1,463 $1,589 $844 $145 53.1% 9.2% 0.9x 10.1xPegasystems, Inc. PEGA $32.98 69.4% $1,300 $1,212 $425 $259 $27 60.9% 6.5% 2.8x NM
CSG Systems International, Inc. CSGS $17.28 88.2% $568 $685 $737 $372 $165 50.5% 22.4% 0.9x 4.1x
Average 85.0% $31,593 $29,822 $8,128 $5,967 $2,994 62.3% 16.6% 3.0x 8.1x
Median 86.2% $4,493 $3,969 $2,023 $995 $155 65.5% 13.8% 2.8x 8.6x
Enterprise Value /
LTM LTM Margins LTM
Industry Sector Overview – Public Company Analysis
Enterprise Resource Planning
($ in millions, except per share)
12
Source: S&P Capital IQ *Excluded from average and median calculation.
Supply/Demand Chain Management
Customer Relationship Management
Enterprise Software
HYDE PARK CAPITAL Investment Banking | Mergers & Acquisitions | Capital Raising
Closing Price % of 52 Equity Enterprise
Company Ticker 6/29/12 Week High Value Value Revenue Gross Profit EBITDA Gross Profit EBITDA Revenue EBITDAConcur Technologies, Inc. CNQR $68.10 98.3% $3,687 $3,457 $393 $282 $53 71.6% 13.6% 8.8x 64.8x
The Ultimate Software Group, Inc. ULTI $88.93 97.3% $2,481 $2,420 $283 $160 $28 56.4% 9.9% 8.6x 86.7xCornerstone OnDemand, Inc. CSOD $23.81 100.0% $1,156 $1,074 $81 $58 ($21) 71.0% (25.5%) 13.2x NMKenexa Corp. KNXA $29.03 85.6% $771 $722 $301 $180 $26 59.7% 8.5% 2.4x 28.2xVocus, Inc. VOCS $18.60 55.2% $352 $404 $138 $111 ($4) 80.3% (3.1%) 2.9x NM
Average 87.3% $1,689 $1,615 $239 $158 $16 67.8% 0.7% 7.2x 59.9x
Median 97.3% $1,156 $1,074 $283 $160 $26 71.0% 8.5% 8.6x 64.8x
Enterprise Value /
LTM LTM Margins LTM
Closing Price % of 52 Equity Enterprise
Company Ticker 6/29/12 Week High Value Value Revenue Gross Profit EBITDA Gross Profit EBITDA Revenue EBITDATeradata Corp. TDC $72.01 90.1% $12,375 $11,683 $2,469 $1,359 $566 55.0% 22.9% 4.7x 20.6x
TIBCO Software, Inc. TIBX $29.92 86.3% $5,126 $5,034 $992 $724 $225 73.0% 22.7% 5.1x 22.3xInformatica Corp. INFA $42.36 67.9% $4,772 $4,206 $812 $685 $183 84.4% 22.5% 5.2x 23.0xQlik Technologies, Inc. QLIK $22.12 62.1% $1,923 $1,717 $337 $301 $21 89.5% 6.1% 5.1x NMMicroStrategy, Inc. MSTR $129.86 72.7% $1,439 $1,227 $585 $437 $28 74.7% 4.7% 2.1x NM
Average 75.8% $5,127 $4,773 $1,039 $701 $205 75.3% 15.8% 4.4x 22.0x
Median 72.7% $4,772 $4,206 $812 $685 $183 74.7% 22.5% 5.1x 22.3x
Enterprise Value /
LTM LTM Margins LTM
Closing Price % of 52 Equity Enterprise
Company Ticker 6/29/12 Week High Value Value Revenue Gross Profit EBITDA Gross Profit EBITDA Revenue EBITDAAdobe Systems, Inc. ADBE $32.37 93.1% $16,192 $14,704 $4,335 $3,875 $1,492 89.4% 34.4% 3.4x 9.9xOpen Text Corp. OTEX $49.90 69.0% $2,928 $3,024 $1,187 $861 $325 72.5% 27.4% 2.5x 9.3x
Synchronoss Technologies, Inc. SNCR $18.47 47.5% $717 $596 $241 $130 $40 54.1% 16.7% 2.5x 14.8xLogMeIn, Inc. LOGM $30.52 68.4% $779 $586 $125 $114 $16 90.8% 12.8% 4.7x 36.5x
Average 69.5% $5,154 $4,727 $1,472 $1,245 $468 76.7% 22.8% 3.3x 17.6x
Median 68.7% $1,853 $1,810 $714 $495 $183 80.9% 22.0% 3.0x 12.3x
Enterprise Value /
LTM LTM Margins LTM
Industry Sector Overview – Public Company Analysis
Human Capital Management
($ in millions, except per share)
13
Enterprise Software
Source: S&P Capital IQ
Content Management
Business Intelligence/Analytics
HYDE PARK CAPITAL Investment Banking | Mergers & Acquisitions | Capital Raising
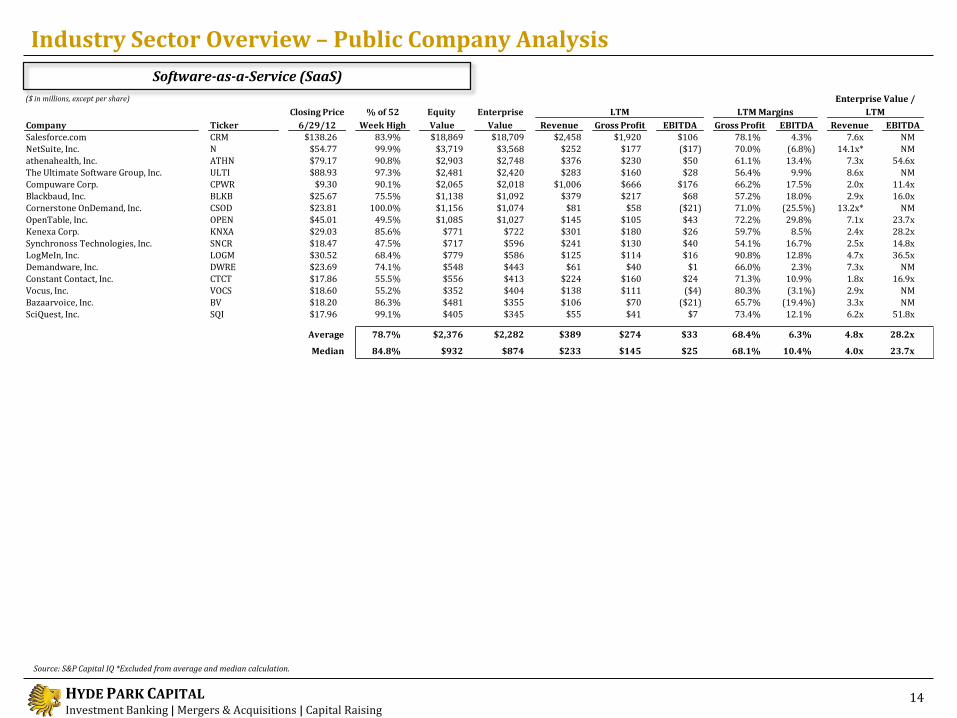
Closing Price % of 52 Equity Enterprise
Company Ticker 6/29/12 Week High Value Value Revenue Gross Profit EBITDA Gross Profit EBITDA Revenue EBITDASalesforce.com CRM $138.26 83.9% $18,869 $18,709 $2,458 $1,920 $106 78.1% 4.3% 7.6x NMNetSuite, Inc. N $54.77 99.9% $3,719 $3,568 $252 $177 ($17) 70.0% (6.8%) 14.1x* NMathenahealth, Inc. ATHN $79.17 90.8% $2,903 $2,748 $376 $230 $50 61.1% 13.4% 7.3x 54.6xThe Ultimate Software Group, Inc. ULTI $88.93 97.3% $2,481 $2,420 $283 $160 $28 56.4% 9.9% 8.6x NM
Compuware Corp. CPWR $9.30 90.1% $2,065 $2,018 $1,006 $666 $176 66.2% 17.5% 2.0x 11.4xBlackbaud, Inc. BLKB $25.67 75.5% $1,138 $1,092 $379 $217 $68 57.2% 18.0% 2.9x 16.0xCornerstone OnDemand, Inc. CSOD $23.81 100.0% $1,156 $1,074 $81 $58 ($21) 71.0% (25.5%) 13.2x* NMOpenTable, Inc. OPEN $45.01 49.5% $1,085 $1,027 $145 $105 $43 72.2% 29.8% 7.1x 23.7xKenexa Corp. KNXA $29.03 85.6% $771 $722 $301 $180 $26 59.7% 8.5% 2.4x 28.2xSynchronoss Technologies, Inc. SNCR $18.47 47.5% $717 $596 $241 $130 $40 54.1% 16.7% 2.5x 14.8xLogMeIn, Inc. LOGM $30.52 68.4% $779 $586 $125 $114 $16 90.8% 12.8% 4.7x 36.5xDemandware, Inc. DWRE $23.69 74.1% $548 $443 $61 $40 $1 66.0% 2.3% 7.3x NMConstant Contact, Inc. CTCT $17.86 55.5% $556 $413 $224 $160 $24 71.3% 10.9% 1.8x 16.9xVocus, Inc. VOCS $18.60 55.2% $352 $404 $138 $111 ($4) 80.3% (3.1%) 2.9x NMBazaarvoice, Inc. BV $18.20 86.3% $481 $355 $106 $70 ($21) 65.7% (19.4%) 3.3x NMSciQuest, Inc. SQI $17.96 99.1% $405 $345 $55 $41 $7 73.4% 12.1% 6.2x 51.8x
Average 78.7% $2,376 $2,282 $389 $274 $33 68.4% 6.3% 4.8x 28.2x
Median 84.8% $932 $874 $233 $145 $25 68.1% 10.4% 4.0x 23.7x
Enterprise Value /
LTM LTM Margins LTM
Industry Sector Overview – Public Company Analysis
14
Software-as-a-Service (SaaS)
($ in millions, except per share)
Source: S&P Capital IQ *Excluded from average and median calculation.
HYDE PARK CAPITAL Investment Banking | Mergers & Acquisitions | Capital Raising
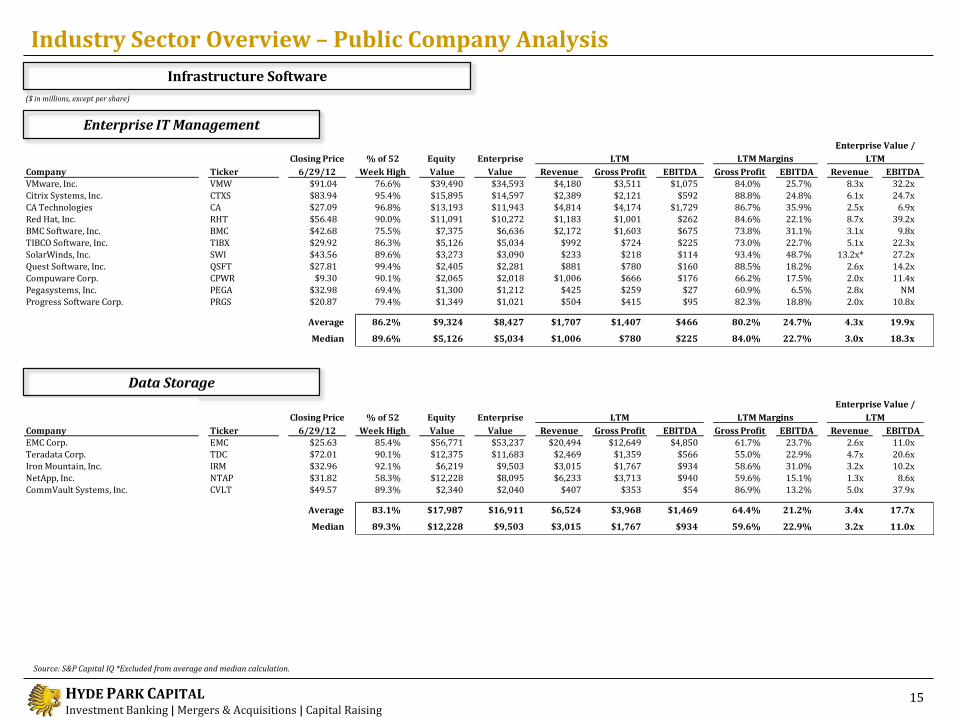
Closing Price % of 52 Equity Enterprise
Company Ticker 6/29/12 Week High Value Value Revenue Gross Profit EBITDA Gross Profit EBITDA Revenue EBITDA
VMware, Inc. VMW $91.04 76.6% $39,490 $34,593 $4,180 $3,511 $1,075 84.0% 25.7% 8.3x 32.2xCitrix Systems, Inc. CTXS $83.94 95.4% $15,895 $14,597 $2,389 $2,121 $592 88.8% 24.8% 6.1x 24.7xCA Technologies CA $27.09 96.8% $13,193 $11,943 $4,814 $4,174 $1,729 86.7% 35.9% 2.5x 6.9x
Red Hat, Inc. RHT $56.48 90.0% $11,091 $10,272 $1,183 $1,001 $262 84.6% 22.1% 8.7x 39.2xBMC Software, Inc. BMC $42.68 75.5% $7,375 $6,636 $2,172 $1,603 $675 73.8% 31.1% 3.1x 9.8xTIBCO Software, Inc. TIBX $29.92 86.3% $5,126 $5,034 $992 $724 $225 73.0% 22.7% 5.1x 22.3x
SolarWinds, Inc. SWI $43.56 89.6% $3,273 $3,090 $233 $218 $114 93.4% 48.7% 13.2x* 27.2xQuest Software, Inc. QSFT $27.81 99.4% $2,405 $2,281 $881 $780 $160 88.5% 18.2% 2.6x 14.2xCompuware Corp. CPWR $9.30 90.1% $2,065 $2,018 $1,006 $666 $176 66.2% 17.5% 2.0x 11.4x
Pegasystems, Inc. PEGA $32.98 69.4% $1,300 $1,212 $425 $259 $27 60.9% 6.5% 2.8x NMProgress Software Corp. PRGS $20.87 79.4% $1,349 $1,021 $504 $415 $95 82.3% 18.8% 2.0x 10.8x
Average 86.2% $9,324 $8,427 $1,707 $1,407 $466 80.2% 24.7% 4.3x 19.9x
Median 89.6% $5,126 $5,034 $1,006 $780 $225 84.0% 22.7% 3.0x 18.3x
Enterprise Value /
LTM LTM Margins LTM
Industry Sector Overview – Public Company Analysis
Enterprise IT Management
($ in millions, except per share)
15
Data Storage
Infrastructure Software
Closing Price % of 52 Equity Enterprise
Company Ticker 6/29/12 Week High Value Value Revenue Gross Profit EBITDA Gross Profit EBITDA Revenue EBITDAEMC Corp. EMC $25.63 85.4% $56,771 $53,237 $20,494 $12,649 $4,850 61.7% 23.7% 2.6x 11.0x
Teradata Corp. TDC $72.01 90.1% $12,375 $11,683 $2,469 $1,359 $566 55.0% 22.9% 4.7x 20.6xIron Mountain, Inc. IRM $32.96 92.1% $6,219 $9,503 $3,015 $1,767 $934 58.6% 31.0% 3.2x 10.2xNetApp, Inc. NTAP $31.82 58.3% $12,228 $8,095 $6,233 $3,713 $940 59.6% 15.1% 1.3x 8.6xCommVault Systems, Inc. CVLT $49.57 89.3% $2,340 $2,040 $407 $353 $54 86.9% 13.2% 5.0x 37.9x
Average 83.1% $17,987 $16,911 $6,524 $3,968 $1,469 64.4% 21.2% 3.4x 17.7x
Median 89.3% $12,228 $9,503 $3,015 $1,767 $934 59.6% 22.9% 3.2x 11.0x
Enterprise Value /
LTM LTM Margins LTM
Source: S&P Capital IQ *Excluded from average and median calculation.
HYDE PARK CAPITAL Investment Banking | Mergers & Acquisitions | Capital Raising
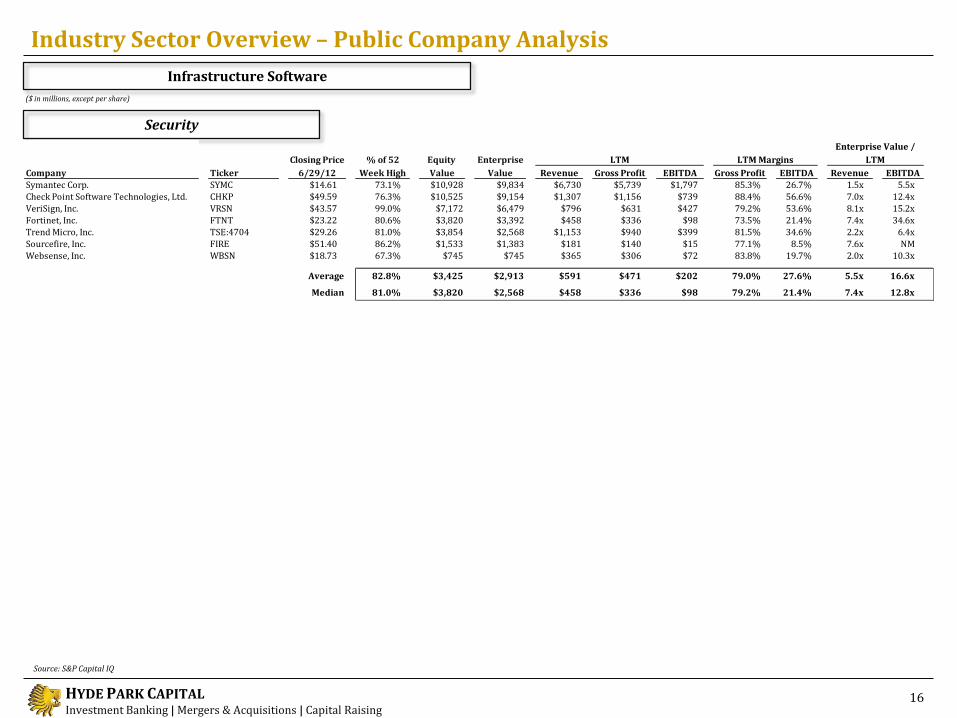
Industry Sector Overview – Public Company Analysis
Security
($ in millions, except per share)
16
Infrastructure Software
Closing Price % of 52 Equity Enterprise
Company Ticker 6/29/12 Week High Value Value Revenue Gross Profit EBITDA Gross Profit EBITDA Revenue EBITDA
Symantec Corp. SYMC $14.61 73.1% $10,928 $9,834 $6,730 $5,739 $1,797 85.3% 26.7% 1.5x 5.5x
Check Point Software Technologies, Ltd. CHKP $49.59 76.3% $10,525 $9,154 $1,307 $1,156 $739 88.4% 56.6% 7.0x 12.4x
VeriSign, Inc. VRSN $43.57 99.0% $7,172 $6,479 $796 $631 $427 79.2% 53.6% 8.1x 15.2x
Fortinet, Inc. FTNT $23.22 80.6% $3,820 $3,392 $458 $336 $98 73.5% 21.4% 7.4x 34.6xTrend Micro, Inc. TSE:4704 $29.26 81.0% $3,854 $2,568 $1,153 $940 $399 81.5% 34.6% 2.2x 6.4x
Sourcefire, Inc. FIRE $51.40 86.2% $1,533 $1,383 $181 $140 $15 77.1% 8.5% 7.6x NM
Websense, Inc. WBSN $18.73 67.3% $745 $745 $365 $306 $72 83.8% 19.7% 2.0x 10.3x
Average 82.8% $3,425 $2,913 $591 $471 $202 79.0% 27.6% 5.5x 16.6x
Median 81.0% $3,820 $2,568 $458 $336 $98 79.2% 21.4% 7.4x 12.8x
Enterprise Value /
LTM LTM Margins LTM
Source: S&P Capital IQ
HYDE PARK CAPITAL Investment Banking | Mergers & Acquisitions | Capital Raising
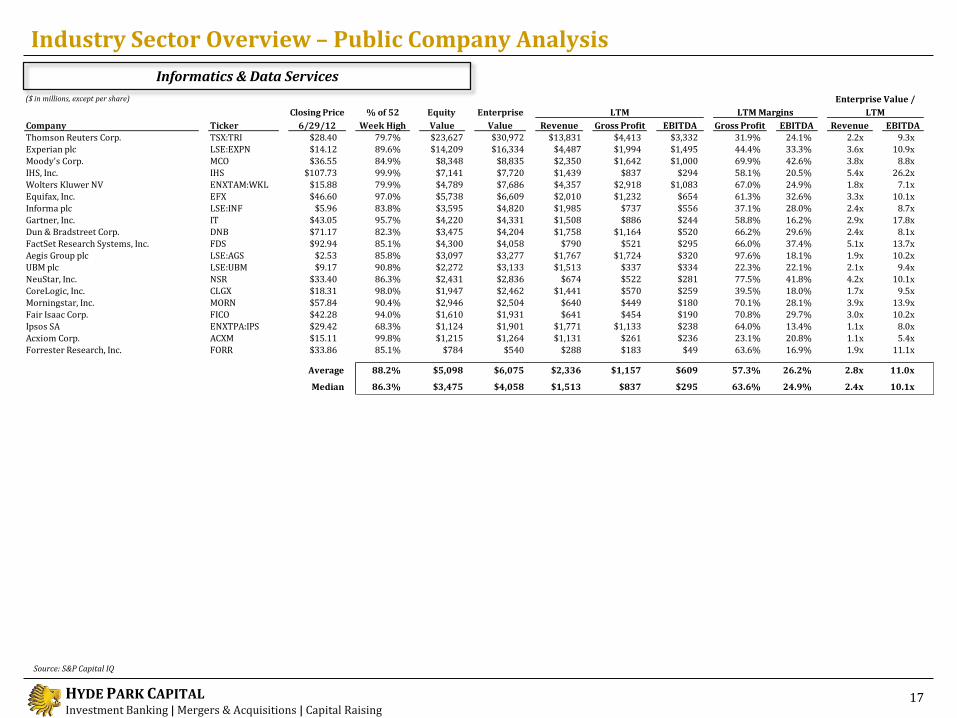
Closing Price % of 52 Equity Enterprise
Company Ticker 6/29/12 Week High Value Value Revenue Gross Profit EBITDA Gross Profit EBITDA Revenue EBITDAThomson Reuters Corp. TSX:TRI $28.40 79.7% $23,627 $30,972 $13,831 $4,413 $3,332 31.9% 24.1% 2.2x 9.3xExperian plc LSE:EXPN $14.12 89.6% $14,209 $16,334 $4,487 $1,994 $1,495 44.4% 33.3% 3.6x 10.9xMoody's Corp. MCO $36.55 84.9% $8,348 $8,835 $2,350 $1,642 $1,000 69.9% 42.6% 3.8x 8.8xIHS, Inc. IHS $107.73 99.9% $7,141 $7,720 $1,439 $837 $294 58.1% 20.5% 5.4x 26.2xWolters Kluwer NV ENXTAM:WKL $15.88 79.9% $4,789 $7,686 $4,357 $2,918 $1,083 67.0% 24.9% 1.8x 7.1xEquifax, Inc. EFX $46.60 97.0% $5,738 $6,609 $2,010 $1,232 $654 61.3% 32.6% 3.3x 10.1xInforma plc LSE:INF $5.96 83.8% $3,595 $4,820 $1,985 $737 $556 37.1% 28.0% 2.4x 8.7xGartner, Inc. IT $43.05 95.7% $4,220 $4,331 $1,508 $886 $244 58.8% 16.2% 2.9x 17.8xDun & Bradstreet Corp. DNB $71.17 82.3% $3,475 $4,204 $1,758 $1,164 $520 66.2% 29.6% 2.4x 8.1xFactSet Research Systems, Inc. FDS $92.94 85.1% $4,300 $4,058 $790 $521 $295 66.0% 37.4% 5.1x 13.7xAegis Group plc LSE:AGS $2.53 85.8% $3,097 $3,277 $1,767 $1,724 $320 97.6% 18.1% 1.9x 10.2xUBM plc LSE:UBM $9.17 90.8% $2,272 $3,133 $1,513 $337 $334 22.3% 22.1% 2.1x 9.4xNeuStar, Inc. NSR $33.40 86.3% $2,431 $2,836 $674 $522 $281 77.5% 41.8% 4.2x 10.1xCoreLogic, Inc. CLGX $18.31 98.0% $1,947 $2,462 $1,441 $570 $259 39.5% 18.0% 1.7x 9.5xMorningstar, Inc. MORN $57.84 90.4% $2,946 $2,504 $640 $449 $180 70.1% 28.1% 3.9x 13.9xFair Isaac Corp. FICO $42.28 94.0% $1,610 $1,931 $641 $454 $190 70.8% 29.7% 3.0x 10.2xIpsos SA ENXTPA:IPS $29.42 68.3% $1,124 $1,901 $1,771 $1,133 $238 64.0% 13.4% 1.1x 8.0xAcxiom Corp. ACXM $15.11 99.8% $1,215 $1,264 $1,131 $261 $236 23.1% 20.8% 1.1x 5.4xForrester Research, Inc. FORR $33.86 85.1% $784 $540 $288 $183 $49 63.6% 16.9% 1.9x 11.1x
Average 88.2% $5,098 $6,075 $2,336 $1,157 $609 57.3% 26.2% 2.8x 11.0x
Median 86.3% $3,475 $4,058 $1,513 $837 $295 63.6% 24.9% 2.4x 10.1x
Enterprise Value /
LTM LTM Margins LTM
Industry Sector Overview – Public Company Analysis
17
Informatics & Data Services
($ in millions, except per share)
Source: S&P Capital IQ
HYDE PARK CAPITAL Investment Banking | Mergers & Acquisitions | Capital Raising
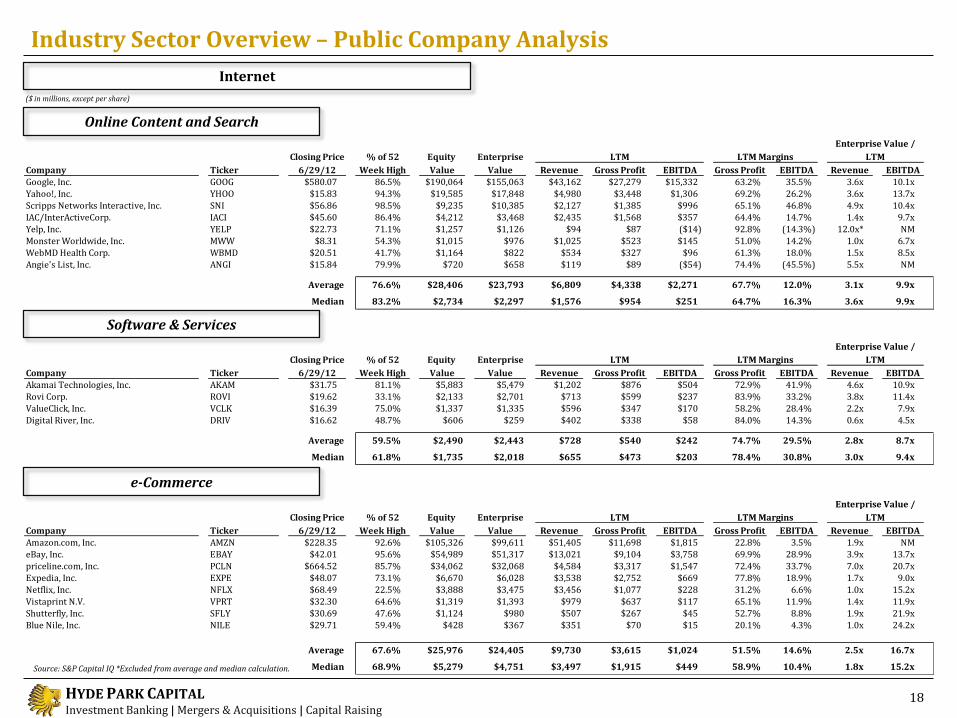
Closing Price % of 52 Equity Enterprise
Company Ticker 6/29/12 Week High Value Value Revenue Gross Profit EBITDA Gross Profit EBITDA Revenue EBITDA
Google, Inc. GOOG $580.07 86.5% $190,064 $155,063 $43,162 $27,279 $15,332 63.2% 35.5% 3.6x 10.1xYahoo!, Inc. YHOO $15.83 94.3% $19,585 $17,848 $4,980 $3,448 $1,306 69.2% 26.2% 3.6x 13.7x
Scripps Networks Interactive, Inc. SNI $56.86 98.5% $9,235 $10,385 $2,127 $1,385 $996 65.1% 46.8% 4.9x 10.4xIAC/InterActiveCorp. IACI $45.60 86.4% $4,212 $3,468 $2,435 $1,568 $357 64.4% 14.7% 1.4x 9.7x
Yelp, Inc. YELP $22.73 71.1% $1,257 $1,126 $94 $87 ($14) 92.8% (14.3%) 12.0x* NM
Monster Worldwide, Inc. MWW $8.31 54.3% $1,015 $976 $1,025 $523 $145 51.0% 14.2% 1.0x 6.7xWebMD Health Corp. WBMD $20.51 41.7% $1,164 $822 $534 $327 $96 61.3% 18.0% 1.5x 8.5x
Angie's List, Inc. ANGI $15.84 79.9% $720 $658 $119 $89 ($54) 74.4% (45.5%) 5.5x NM
Average 76.6% $28,406 $23,793 $6,809 $4,338 $2,271 67.7% 12.0% 3.1x 9.9x
Median 83.2% $2,734 $2,297 $1,576 $954 $251 64.7% 16.3% 3.6x 9.9x
Enterprise Value /
LTM LTM Margins LTM
Closing Price % of 52 Equity Enterprise
Company Ticker 6/29/12 Week High Value Value Revenue Gross Profit EBITDA Gross Profit EBITDA Revenue EBITDA
Amazon.com, Inc. AMZN $228.35 92.6% $105,326 $99,611 $51,405 $11,698 $1,815 22.8% 3.5% 1.9x NMeBay, Inc. EBAY $42.01 95.6% $54,989 $51,317 $13,021 $9,104 $3,758 69.9% 28.9% 3.9x 13.7x
priceline.com, Inc. PCLN $664.52 85.7% $34,062 $32,068 $4,584 $3,317 $1,547 72.4% 33.7% 7.0x 20.7xExpedia, Inc. EXPE $48.07 73.1% $6,670 $6,028 $3,538 $2,752 $669 77.8% 18.9% 1.7x 9.0x
Netflix, Inc. NFLX $68.49 22.5% $3,888 $3,475 $3,456 $1,077 $228 31.2% 6.6% 1.0x 15.2x
Vistaprint N.V. VPRT $32.30 64.6% $1,319 $1,393 $979 $637 $117 65.1% 11.9% 1.4x 11.9xShutterfly, Inc. SFLY $30.69 47.6% $1,124 $980 $507 $267 $45 52.7% 8.8% 1.9x 21.9x
Blue Nile, Inc. NILE $29.71 59.4% $428 $367 $351 $70 $15 20.1% 4.3% 1.0x 24.2x
Average 67.6% $25,976 $24,405 $9,730 $3,615 $1,024 51.5% 14.6% 2.5x 16.7x
Median 68.9% $5,279 $4,751 $3,497 $1,915 $449 58.9% 10.4% 1.8x 15.2x
Enterprise Value /
LTM LTM Margins LTM
Closing Price % of 52 Equity Enterprise
Company Ticker 6/29/12 Week High Value Value Revenue Gross Profit EBITDA Gross Profit EBITDA Revenue EBITDAAkamai Technologies, Inc. AKAM $31.75 81.1% $5,883 $5,479 $1,202 $876 $504 72.9% 41.9% 4.6x 10.9xRovi Corp. ROVI $19.62 33.1% $2,133 $2,701 $713 $599 $237 83.9% 33.2% 3.8x 11.4x
ValueClick, Inc. VCLK $16.39 75.0% $1,337 $1,335 $596 $347 $170 58.2% 28.4% 2.2x 7.9xDigital River, Inc. DRIV $16.62 48.7% $606 $259 $402 $338 $58 84.0% 14.3% 0.6x 4.5x
Average 59.5% $2,490 $2,443 $728 $540 $242 74.7% 29.5% 2.8x 8.7x
Median 61.8% $1,735 $2,018 $655 $473 $203 78.4% 30.8% 3.0x 9.4x
Enterprise Value /
LTM LTM Margins LTM
Industry Sector Overview – Public Company Analysis
Online Content and Search
($ in millions, except per share)
18
Software & Services
e-Commerce
Internet
Source: S&P Capital IQ *Excluded from average and median calculation.
HYDE PARK CAPITAL Investment Banking | Mergers & Acquisitions | Capital Raising
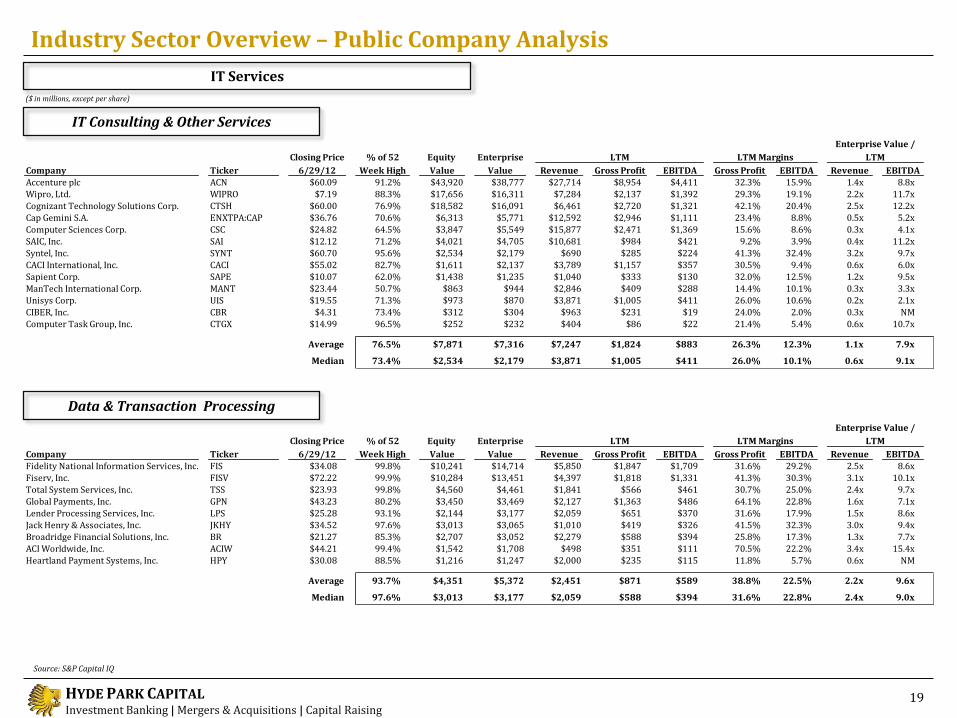
Closing Price % of 52 Equity Enterprise
Company Ticker 6/29/12 Week High Value Value Revenue Gross Profit EBITDA Gross Profit EBITDA Revenue EBITDAFidelity National Information Services, Inc. FIS $34.08 99.8% $10,241 $14,714 $5,850 $1,847 $1,709 31.6% 29.2% 2.5x 8.6x
Fiserv, Inc. FISV $72.22 99.9% $10,284 $13,451 $4,397 $1,818 $1,331 41.3% 30.3% 3.1x 10.1xTotal System Services, Inc. TSS $23.93 99.8% $4,560 $4,461 $1,841 $566 $461 30.7% 25.0% 2.4x 9.7x
Global Payments, Inc. GPN $43.23 80.2% $3,450 $3,469 $2,127 $1,363 $486 64.1% 22.8% 1.6x 7.1xLender Processing Services, Inc. LPS $25.28 93.1% $2,144 $3,177 $2,059 $651 $370 31.6% 17.9% 1.5x 8.6x
Jack Henry & Associates, Inc. JKHY $34.52 97.6% $3,013 $3,065 $1,010 $419 $326 41.5% 32.3% 3.0x 9.4xBroadridge Financial Solutions, Inc. BR $21.27 85.3% $2,707 $3,052 $2,279 $588 $394 25.8% 17.3% 1.3x 7.7x
ACI Worldwide, Inc. ACIW $44.21 99.4% $1,542 $1,708 $498 $351 $111 70.5% 22.2% 3.4x 15.4xHeartland Payment Systems, Inc. HPY $30.08 88.5% $1,216 $1,247 $2,000 $235 $115 11.8% 5.7% 0.6x NM
Average 93.7% $4,351 $5,372 $2,451 $871 $589 38.8% 22.5% 2.2x 9.6x
Median 97.6% $3,013 $3,177 $2,059 $588 $394 31.6% 22.8% 2.4x 9.0x
Enterprise Value /
LTM LTM Margins LTM
Closing Price % of 52 Equity Enterprise
Company Ticker 6/29/12 Week High Value Value Revenue Gross Profit EBITDA Gross Profit EBITDA Revenue EBITDAAccenture plc ACN $60.09 91.2% $43,920 $38,777 $27,714 $8,954 $4,411 32.3% 15.9% 1.4x 8.8xWipro, Ltd. WIPRO $7.19 88.3% $17,656 $16,311 $7,284 $2,137 $1,392 29.3% 19.1% 2.2x 11.7x
Cognizant Technology Solutions Corp. CTSH $60.00 76.9% $18,582 $16,091 $6,461 $2,720 $1,321 42.1% 20.4% 2.5x 12.2xCap Gemini S.A. ENXTPA:CAP $36.76 70.6% $6,313 $5,771 $12,592 $2,946 $1,111 23.4% 8.8% 0.5x 5.2xComputer Sciences Corp. CSC $24.82 64.5% $3,847 $5,549 $15,877 $2,471 $1,369 15.6% 8.6% 0.3x 4.1xSAIC, Inc. SAI $12.12 71.2% $4,021 $4,705 $10,681 $984 $421 9.2% 3.9% 0.4x 11.2xSyntel, Inc. SYNT $60.70 95.6% $2,534 $2,179 $690 $285 $224 41.3% 32.4% 3.2x 9.7x
CACI International, Inc. CACI $55.02 82.7% $1,611 $2,137 $3,789 $1,157 $357 30.5% 9.4% 0.6x 6.0xSapient Corp. SAPE $10.07 62.0% $1,438 $1,235 $1,040 $333 $130 32.0% 12.5% 1.2x 9.5xManTech International Corp. MANT $23.44 50.7% $863 $944 $2,846 $409 $288 14.4% 10.1% 0.3x 3.3xUnisys Corp. UIS $19.55 71.3% $973 $870 $3,871 $1,005 $411 26.0% 10.6% 0.2x 2.1x
CIBER, Inc. CBR $4.31 73.4% $312 $304 $963 $231 $19 24.0% 2.0% 0.3x NMComputer Task Group, Inc. CTGX $14.99 96.5% $252 $232 $404 $86 $22 21.4% 5.4% 0.6x 10.7x
Average 76.5% $7,871 $7,316 $7,247 $1,824 $883 26.3% 12.3% 1.1x 7.9x
Median 73.4% $2,534 $2,179 $3,871 $1,005 $411 26.0% 10.1% 0.6x 9.1x
Enterprise Value /
LTM LTM Margins LTM
Industry Sector Overview – Public Company Analysis
IT Consulting & Other Services
($ in millions, except per share)
19
Data & Transaction Processing
IT Services
Source: S&P Capital IQ
HYDE PARK CAPITAL Investment Banking | Mergers & Acquisitions | Capital Raising
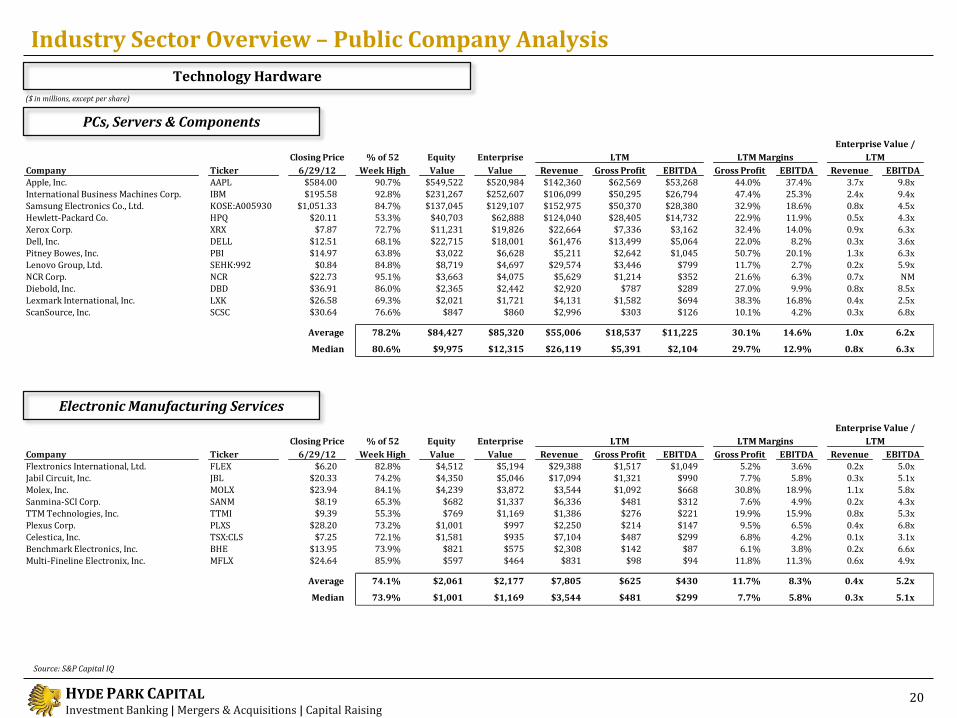
Closing Price % of 52 Equity Enterprise
Company Ticker 6/29/12 Week High Value Value Revenue Gross Profit EBITDA Gross Profit EBITDA Revenue EBITDAApple, Inc. AAPL $584.00 90.7% $549,522 $520,984 $142,360 $62,569 $53,268 44.0% 37.4% 3.7x 9.8x
International Business Machines Corp. IBM $195.58 92.8% $231,267 $252,607 $106,099 $50,295 $26,794 47.4% 25.3% 2.4x 9.4xSamsung Electronics Co., Ltd. KOSE:A005930 $1,051.33 84.7% $137,045 $129,107 $152,975 $50,370 $28,380 32.9% 18.6% 0.8x 4.5xHewlett-Packard Co. HPQ $20.11 53.3% $40,703 $62,888 $124,040 $28,405 $14,732 22.9% 11.9% 0.5x 4.3xXerox Corp. XRX $7.87 72.7% $11,231 $19,826 $22,664 $7,336 $3,162 32.4% 14.0% 0.9x 6.3x
Dell, Inc. DELL $12.51 68.1% $22,715 $18,001 $61,476 $13,499 $5,064 22.0% 8.2% 0.3x 3.6xPitney Bowes, Inc. PBI $14.97 63.8% $3,022 $6,628 $5,211 $2,642 $1,045 50.7% 20.1% 1.3x 6.3xLenovo Group, Ltd. SEHK:992 $0.84 84.8% $8,719 $4,697 $29,574 $3,446 $799 11.7% 2.7% 0.2x 5.9x
NCR Corp. NCR $22.73 95.1% $3,663 $4,075 $5,629 $1,214 $352 21.6% 6.3% 0.7x NMDiebold, Inc. DBD $36.91 86.0% $2,365 $2,442 $2,920 $787 $289 27.0% 9.9% 0.8x 8.5xLexmark International, Inc. LXK $26.58 69.3% $2,021 $1,721 $4,131 $1,582 $694 38.3% 16.8% 0.4x 2.5x
ScanSource, Inc. SCSC $30.64 76.6% $847 $860 $2,996 $303 $126 10.1% 4.2% 0.3x 6.8x
Average 78.2% $84,427 $85,320 $55,006 $18,537 $11,225 30.1% 14.6% 1.0x 6.2x
Median 80.6% $9,975 $12,315 $26,119 $5,391 $2,104 29.7% 12.9% 0.8x 6.3x
Enterprise Value /
LTM LTM Margins LTM
Closing Price % of 52 Equity Enterprise
Company Ticker 6/29/12 Week High Value Value Revenue Gross Profit EBITDA Gross Profit EBITDA Revenue EBITDAFlextronics International, Ltd. FLEX $6.20 82.8% $4,512 $5,194 $29,388 $1,517 $1,049 5.2% 3.6% 0.2x 5.0x
Jabil Circuit, Inc. JBL $20.33 74.2% $4,350 $5,046 $17,094 $1,321 $990 7.7% 5.8% 0.3x 5.1xMolex, Inc. MOLX $23.94 84.1% $4,239 $3,872 $3,544 $1,092 $668 30.8% 18.9% 1.1x 5.8x
Sanmina-SCI Corp. SANM $8.19 65.3% $682 $1,337 $6,336 $481 $312 7.6% 4.9% 0.2x 4.3xTTM Technologies, Inc. TTMI $9.39 55.3% $769 $1,169 $1,386 $276 $221 19.9% 15.9% 0.8x 5.3x
Plexus Corp. PLXS $28.20 73.2% $1,001 $997 $2,250 $214 $147 9.5% 6.5% 0.4x 6.8xCelestica, Inc. TSX:CLS $7.25 72.1% $1,581 $935 $7,104 $487 $299 6.8% 4.2% 0.1x 3.1x
Benchmark Electronics, Inc. BHE $13.95 73.9% $821 $575 $2,308 $142 $87 6.1% 3.8% 0.2x 6.6xMulti-Fineline Electronix, Inc. MFLX $24.64 85.9% $597 $464 $831 $98 $94 11.8% 11.3% 0.6x 4.9x
Average 74.1% $2,061 $2,177 $7,805 $625 $430 11.7% 8.3% 0.4x 5.2x
Median 73.9% $1,001 $1,169 $3,544 $481 $299 7.7% 5.8% 0.3x 5.1x
Enterprise Value /
LTM LTM Margins LTM
Industry Sector Overview – Public Company Analysis
PCs, Servers & Components
($ in millions, except per share)
20
Electronic Manufacturing Services
Technology Hardware
Source: S&P Capital IQ
HYDE PARK CAPITAL Investment Banking | Mergers & Acquisitions | Capital Raising
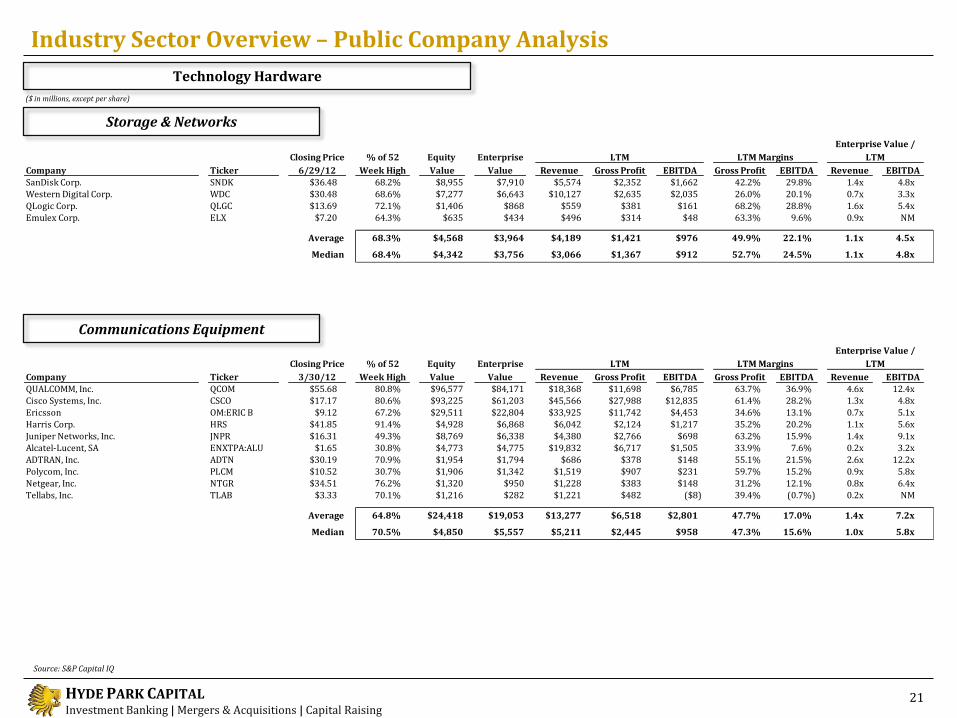
Closing Price % of 52 Equity Enterprise
Company Ticker 3/30/12 Week High Value Value Revenue Gross Profit EBITDA Gross Profit EBITDA Revenue EBITDA
QUALCOMM, Inc. QCOM $55.68 80.8% $96,577 $84,171 $18,368 $11,698 $6,785 63.7% 36.9% 4.6x 12.4xCisco Systems, Inc. CSCO $17.17 80.6% $93,225 $61,203 $45,566 $27,988 $12,835 61.4% 28.2% 1.3x 4.8x
Ericsson OM:ERIC B $9.12 67.2% $29,511 $22,804 $33,925 $11,742 $4,453 34.6% 13.1% 0.7x 5.1xHarris Corp. HRS $41.85 91.4% $4,928 $6,868 $6,042 $2,124 $1,217 35.2% 20.2% 1.1x 5.6x
Juniper Networks, Inc. JNPR $16.31 49.3% $8,769 $6,338 $4,380 $2,766 $698 63.2% 15.9% 1.4x 9.1xAlcatel-Lucent, SA ENXTPA:ALU $1.65 30.8% $4,773 $4,775 $19,832 $6,717 $1,505 33.9% 7.6% 0.2x 3.2x
ADTRAN, Inc. ADTN $30.19 70.9% $1,954 $1,794 $686 $378 $148 55.1% 21.5% 2.6x 12.2xPolycom, Inc. PLCM $10.52 30.7% $1,906 $1,342 $1,519 $907 $231 59.7% 15.2% 0.9x 5.8xNetgear, Inc. NTGR $34.51 76.2% $1,320 $950 $1,228 $383 $148 31.2% 12.1% 0.8x 6.4x
Tellabs, Inc. TLAB $3.33 70.1% $1,216 $282 $1,221 $482 ($8) 39.4% (0.7%) 0.2x NM
Average 64.8% $24,418 $19,053 $13,277 $6,518 $2,801 47.7% 17.0% 1.4x 7.2x
Median 70.5% $4,850 $5,557 $5,211 $2,445 $958 47.3% 15.6% 1.0x 5.8x
Enterprise Value /
LTM LTM Margins LTM
Closing Price % of 52 Equity Enterprise
Company Ticker 6/29/12 Week High Value Value Revenue Gross Profit EBITDA Gross Profit EBITDA Revenue EBITDASanDisk Corp. SNDK $36.48 68.2% $8,955 $7,910 $5,574 $2,352 $1,662 42.2% 29.8% 1.4x 4.8xWestern Digital Corp. WDC $30.48 68.6% $7,277 $6,643 $10,127 $2,635 $2,035 26.0% 20.1% 0.7x 3.3x
QLogic Corp. QLGC $13.69 72.1% $1,406 $868 $559 $381 $161 68.2% 28.8% 1.6x 5.4xEmulex Corp. ELX $7.20 64.3% $635 $434 $496 $314 $48 63.3% 9.6% 0.9x NM
Average 68.3% $4,568 $3,964 $4,189 $1,421 $976 49.9% 22.1% 1.1x 4.5x
Median 68.4% $4,342 $3,756 $3,066 $1,367 $912 52.7% 24.5% 1.1x 4.8x
Enterprise Value /
LTM LTM Margins LTM
Industry Sector Overview – Public Company Analysis
Storage & Networks
($ in millions, except per share)
21
Communications Equipment
Technology Hardware
Source: S&P Capital IQ
HYDE PARK CAPITAL Investment Banking | Mergers & Acquisitions | Capital Raising
Member FINRA/SIPC
Recent Transactions
HYDE PARK CAPITAL Investment Banking | Mergers & Acquisitions | Capital Raising Integrity | Expertise | Results
Hyde Park Capital Advisors, LLC 701 N. Franklin Street
Tampa, FL 33602 Tel: 813-383-0202
www.hydeparkcapital.com
John Hill Senior Managing Director [email protected] (813) 383-0205 John McDonald Senior Managing Director [email protected] (813) 383-0206 Keith Hodgdon Senior Vice President [email protected] (813) 383-0208 Jeffrey Bridge Vice President [email protected] (813) 383-0204 Michael Mariani Associate [email protected] (813) 597-2649 Jennifer Paul Associate [email protected] (813) 383-0203
has been acquired by has acquired has been acquired by has been acquired by has been acquired by
has been recapitalized by has merged with has been recapitalized by
Sage Compliance Services
has acquired has been recapitalized by
has been recapitalized by
Harbert Mezzanine Partners
&
&
ADG Acquisition
Holdings, LLC
has been acquired byhas been acquired byhas been recapitalized by
has been acquired bySouthern Management Corp.
with mezzanine financing from