Embed Size (px)
Citation preview
U.S. employment situation: September 2013Release date: October 22, 2013
May job growth paused: was it temporary or are we at an inflection point?U.S. employment situation: May 2016 June 3, 2016
May 2016 employment summary
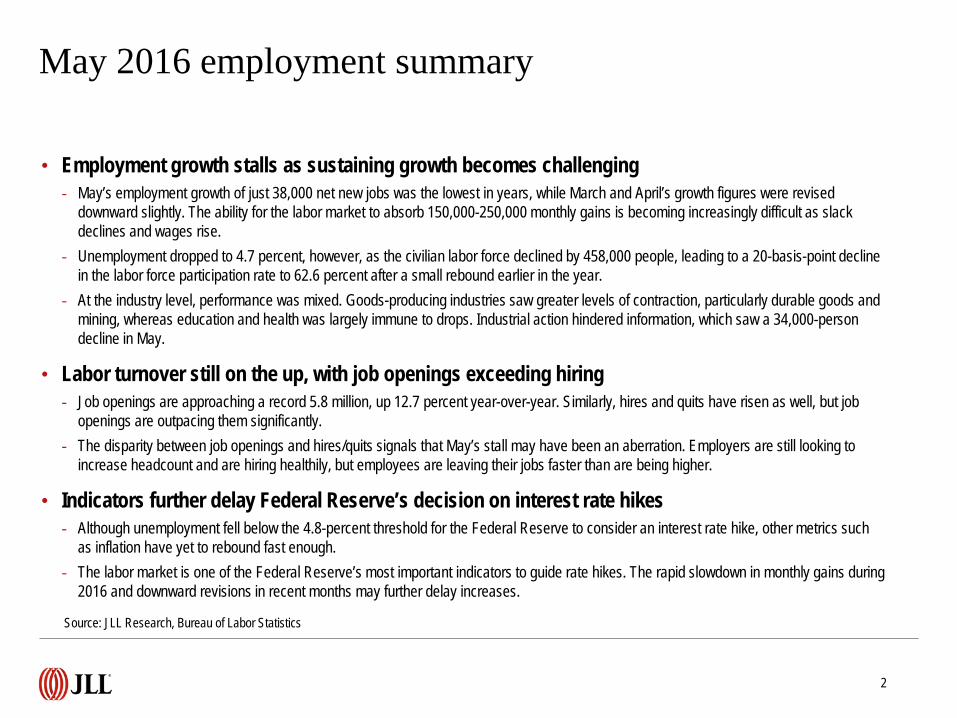
• Employment growth stalls as sustaining growth becomes challenging- May’s employment growth of just 38,000 net new jobs was the lowest in years, while March and April’s growth figures were revised
downward slightly. The ability for the labor market to absorb 150,000-250,000 monthly gains is becoming increasingly difficult as slack declines and wages rise.
- Unemployment dropped to 4.7 percent, however, as the civilian labor force declined by 458,000 people, leading to a 20-basis-point decline in the labor force participation rate to 62.6 percent after a small rebound earlier in the year.
- At the industry level, performance was mixed. Goods-producing industries saw greater levels of contraction, particularly durable goods and mining, whereas education and health was largely immune to drops. Industrial action hindered information, which saw a 34,000-person decline in May.
• Labor turnover still on the up, with job openings exceeding hiring - Job openings are approaching a record 5.8 million, up 12.7 percent year-over-year. Similarly, hires and quits have risen as well, but job
openings are outpacing them significantly. - The disparity between job openings and hires/quits signals that May’s stall may have been an aberration. Employers are still looking to
increase headcount and are hiring healthily, but employees are leaving their jobs faster than are being higher.
• Indicators further delay Federal Reserve’s decision on interest rate hikes- Although unemployment fell below the 4.8-percent threshold for the Federal Reserve to consider an interest rate hike, other metrics such
as inflation have yet to rebound fast enough. - The labor market is one of the Federal Reserve’s most important indicators to guide rate hikes. The rapid slowdown in monthly gains during
2016 and downward revisions in recent months may further delay increases.
Source: JLL Research, Bureau of Labor Statistics
2
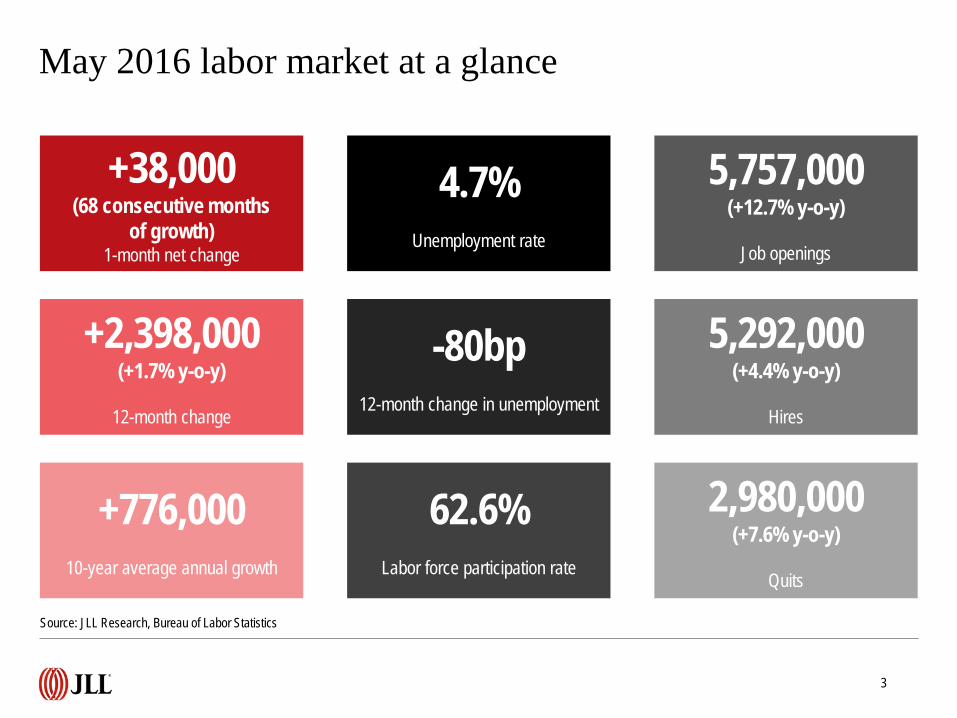
May 2016 labor market at a glance
+38,000(68 consecutive months
of growth)1-month net change
+2,398,000(+1.7% y-o-y)
12-month change
+776,00010-year average annual growth
Source: JLL Research, Bureau of Labor Statistics
4.7%Unemployment rate
-80bp12-month change in unemployment
62.6%Labor force participation rate
5,757,000(+12.7% y-o-y)
Job openings
5,292,000(+4.4% y-o-y)
Hires
2,980,000(+7.6% y-o-y)
Quits
3
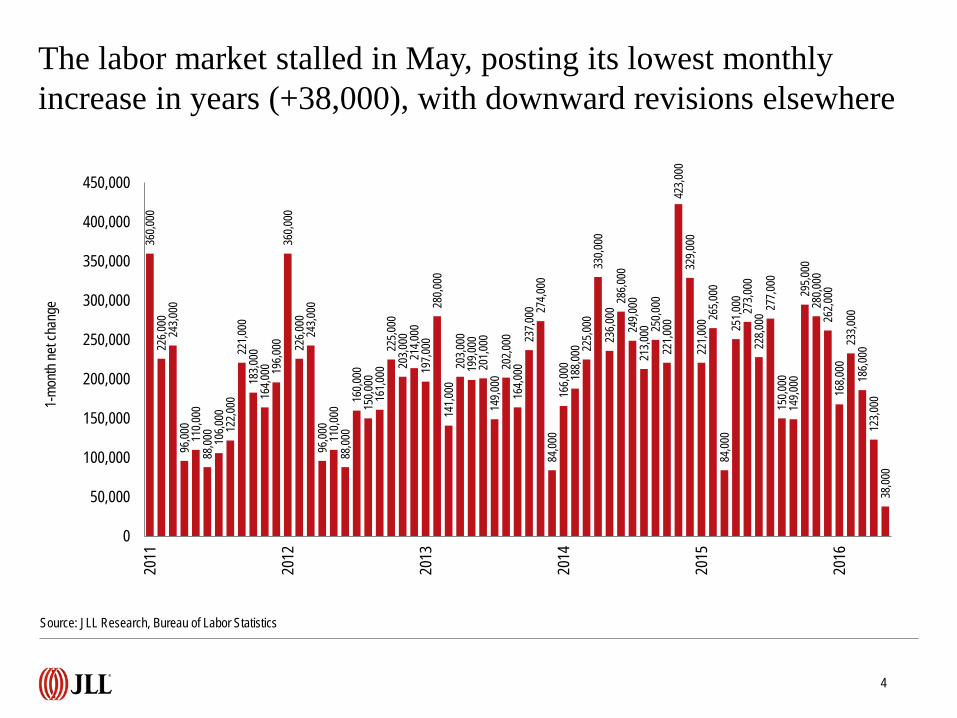
The labor market stalled in May, posting its lowest monthly increase in years (+38,000), with downward revisions elsewhere
360,0
0022
6,000
243,0
0096
,000
110,0
0088
,000
106,0
0012
2,000
221,0
0018
3,000
164,0
00 196,0
0036
0,000
226,0
0024
3,000
96,00
011
0,000
88,00
016
0,000
150,0
0016
1,000
225,0
0020
3,000
214,0
0019
7,000
280,0
0014
1,000
203,0
0019
9,000
201,0
0014
9,000
202,0
0016
4,000
237,0
00 274,0
0084
,000
166,0
00 188,0
00 225,0
0033
0,000
236,0
0028
6,000
249,0
0021
3,000 25
0,000
221,0
0042
3,000
329,0
0022
1,000
265,0
0084
,000
251,0
00 273,0
0022
8,000
277,0
0015
0,000
149,0
0029
5,000
280,0
0026
2,000
168,0
0023
3,000
186,0
0012
3,000
38,00
0
0
50,000
100,000
150,000
200,000
250,000
300,000
350,000
400,000
450,000
2011
2012
2013
2014
2015
2016
1-mo
nth ne
t cha
nge
4
Source: JLL Research, Bureau of Labor Statistics
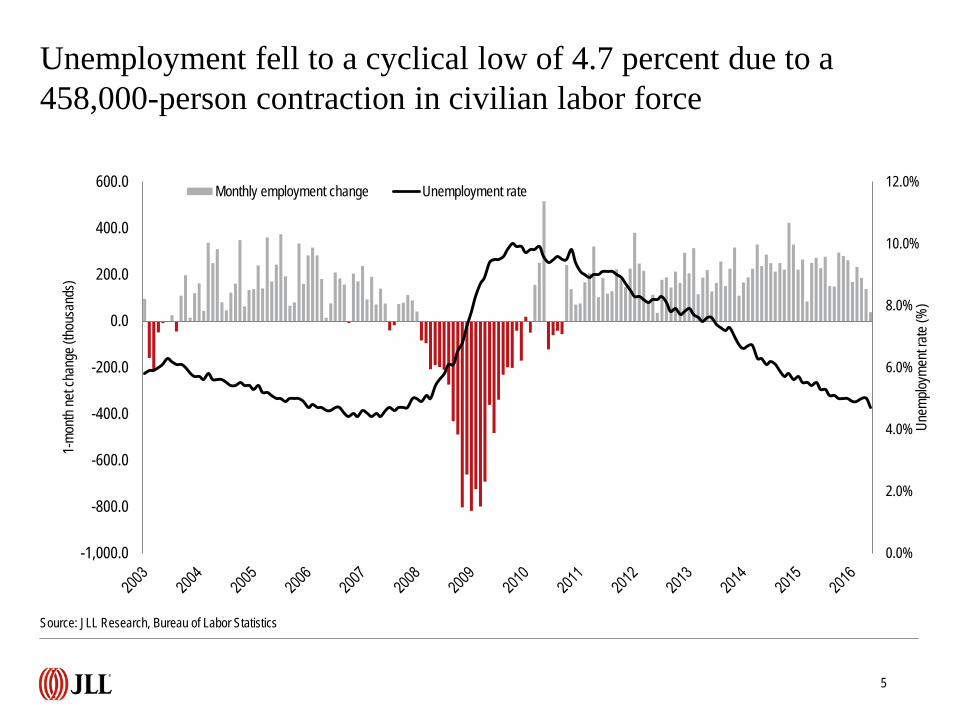
Unemployment fell to a cyclical low of 4.7 percent due to a 458,000-person contraction in civilian labor force
0.0%
2.0%
4.0%
6.0%
8.0%
10.0%
12.0%
-1,000.0
-800.0
-600.0
-400.0
-200.0
0.0
200.0
400.0
600.0
Unem
ploym
ent ra
te (%
)
1-mo
nth ne
t cha
nge (
thous
ands
)
Monthly employment change Unemployment rate
Source: JLL Research, Bureau of Labor Statistics
5
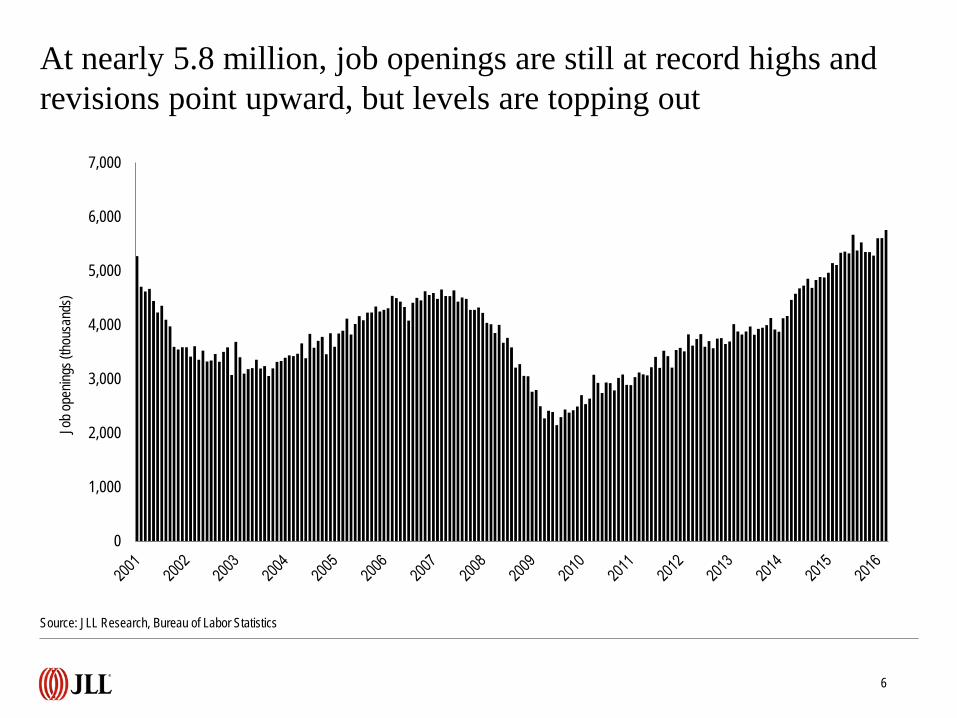
At nearly 5.8 million, job openings are still at record highs and revisions point upward, but levels are topping out
Source: JLL Research, Bureau of Labor Statistics
6
0
1,000
2,000
3,000
4,000
5,000
6,000
7,000
Job o
penin
gs (t
hous
ands
)
0
20
40
60
80
100
120
140
Cons
umer
confi
denc
e Ind
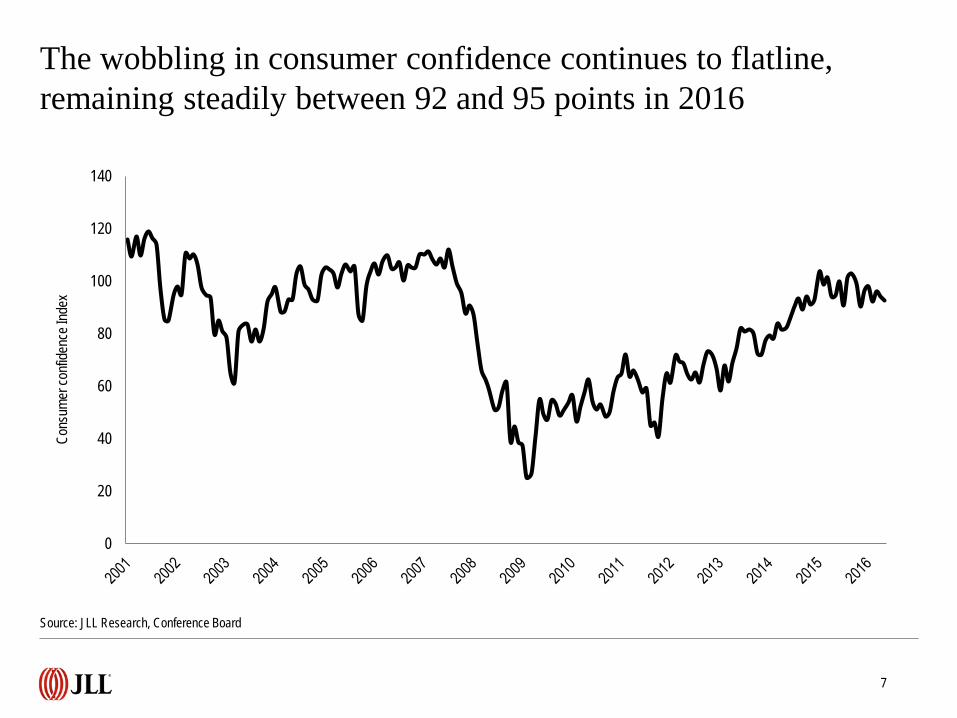
exThe wobbling in consumer confidence continues to flatline, remaining steadily between 92 and 95 points in 2016
Source: JLL Research, Conference Board
7
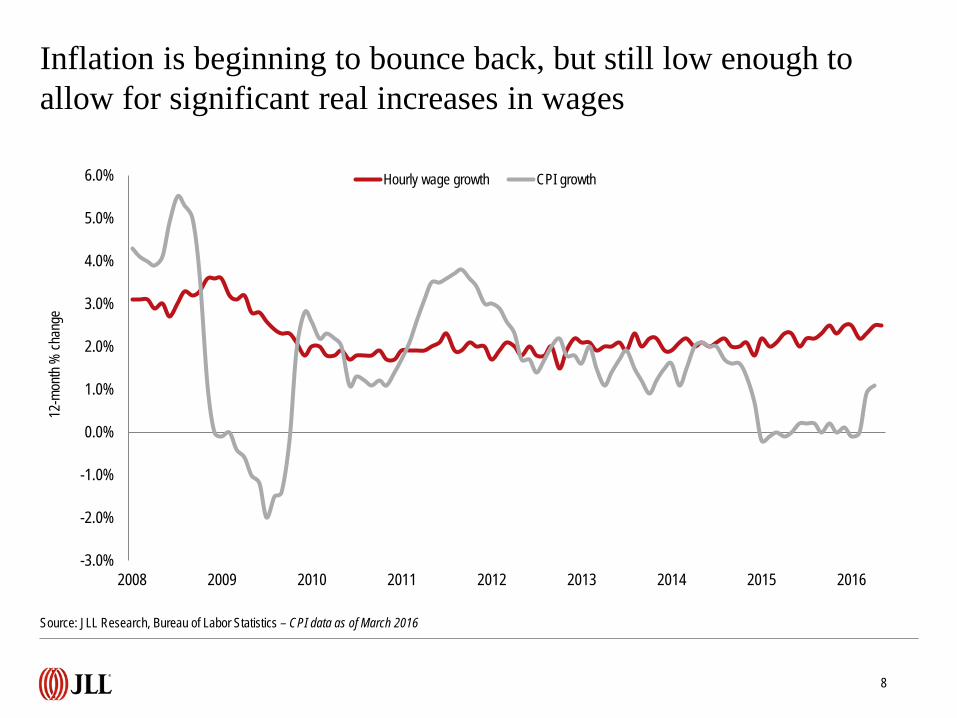
Inflation is beginning to bounce back, but still low enough to allow for significant real increases in wages
Source: JLL Research, Bureau of Labor Statistics – CPI data as of March 2016
8
-3.0%
-2.0%
-1.0%
0.0%
1.0%
2.0%
3.0%
4.0%
5.0%
6.0%
2008 2009 2010 2011 2012 2013 2014 2015 2016
12-m
onth
% ch
ange
Hourly wage growth CPI growth
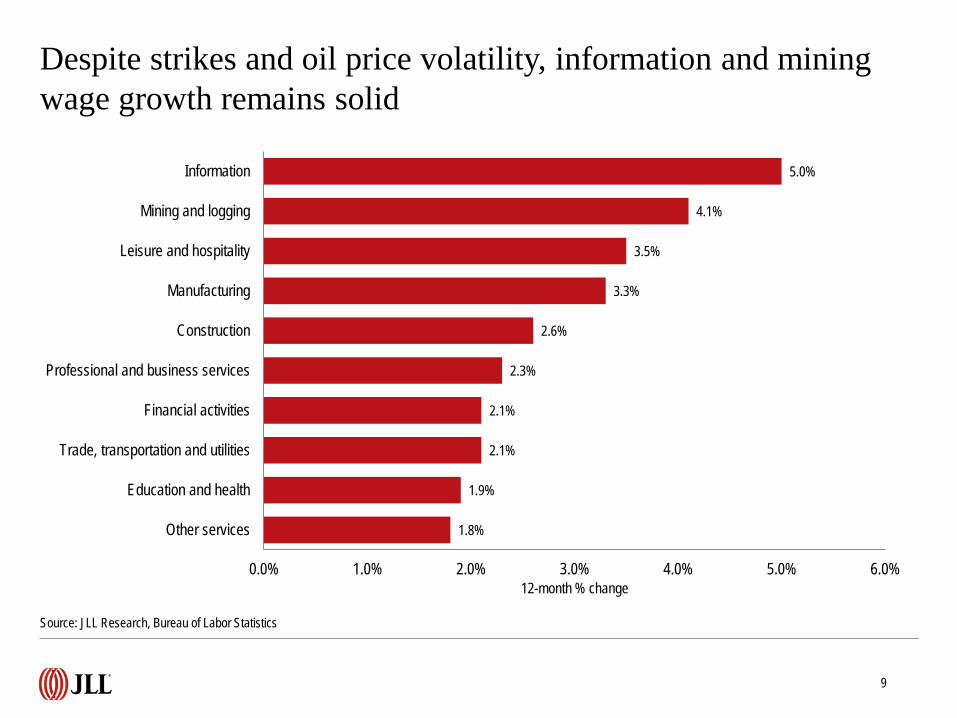
1.8%
1.9%
2.1%
2.1%
2.3%
2.6%
3.3%
3.5%
4.1%
5.0%
0.0% 1.0% 2.0% 3.0% 4.0% 5.0% 6.0%
Other services
Education and health
Trade, transportation and utilities
Financial activities
Professional and business services
Construction
Manufacturing
Leisure and hospitality
Mining and logging
Information
12-month % change
Despite strikes and oil price volatility, information and mining wage growth remains solid
Source: JLL Research, Bureau of Labor Statistics
9
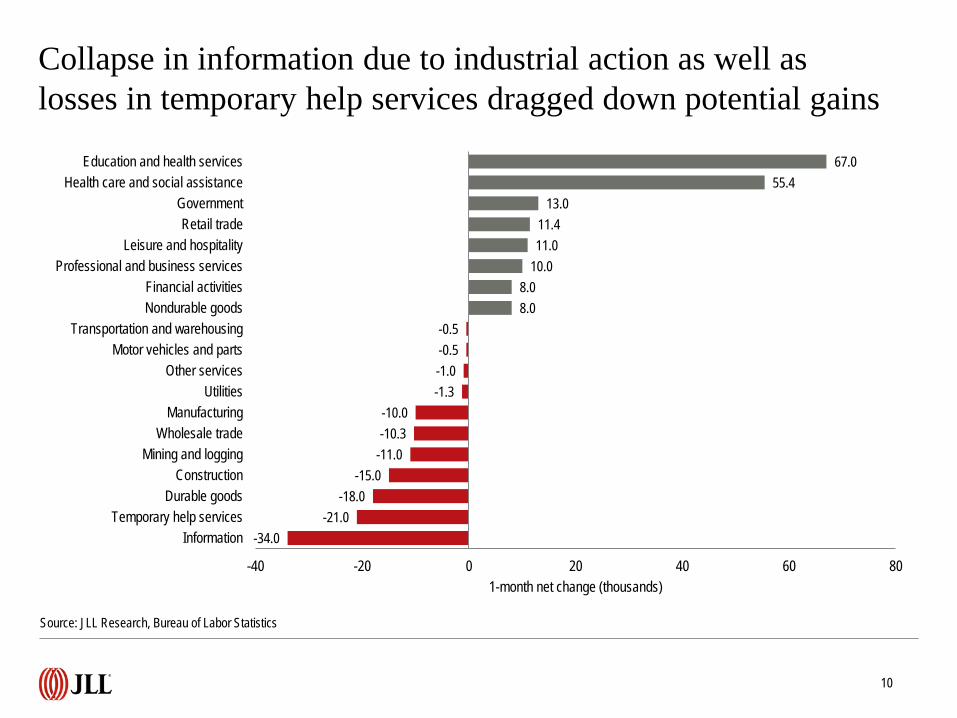
-34.0-21.0
-18.0-15.0
-11.0-10.3-10.0
-1.3-1.0-0.5-0.5
8.08.0
10.011.011.4
13.055.4
67.0
-40 -20 0 20 40 60 80
InformationTemporary help services
Durable goodsConstruction
Mining and loggingWholesale trade
ManufacturingUtilities
Other servicesMotor vehicles and parts
Transportation and warehousingNondurable goodsFinancial activities
Professional and business servicesLeisure and hospitality
Retail tradeGovernment
Health care and social assistanceEducation and health services
1-month net change (thousands)
Collapse in information due to industrial action as well as losses in temporary help services dragged down potential gains
10
Source: JLL Research, Bureau of Labor Statistics

-129.0-80.0
-39.0-16.0
4.05.820.4
41.043.352.563.0
101.0157.0
219.0323.3
394.0525.0
588.0678.0
-200 0 200 400 600 800
Mining and loggingDurable goodsManufacturing
Temporary help servicesInformation
UtilitiesMotor vehicles and parts
Nondurable goodsWholesale trade
Transportation and warehousingOther services
GovernmentFinancial activities
ConstructionRetail trade
Leisure and hospitalityProfessional and business services
Health care and social assistanceEducation and health services
12-month net change (thousands)
Education and health PBS
Leisure and hospitality Retail trade
Financial activities Manufacturing
All other jobs
Annual levels of growth are still healthy even when taking into account May’s pause
Source: JLL Research, Bureau of Labor Statistics
11
Core subsectors added 86.6 percent of all jobs over the past 12 months.
0.0%
1.0%
2.0%
3.0%
4.0%
5.0%
6.0%
Unem
ploym
ent ra
te for
bach
elor’s
degr
ee ho
lders
(%)
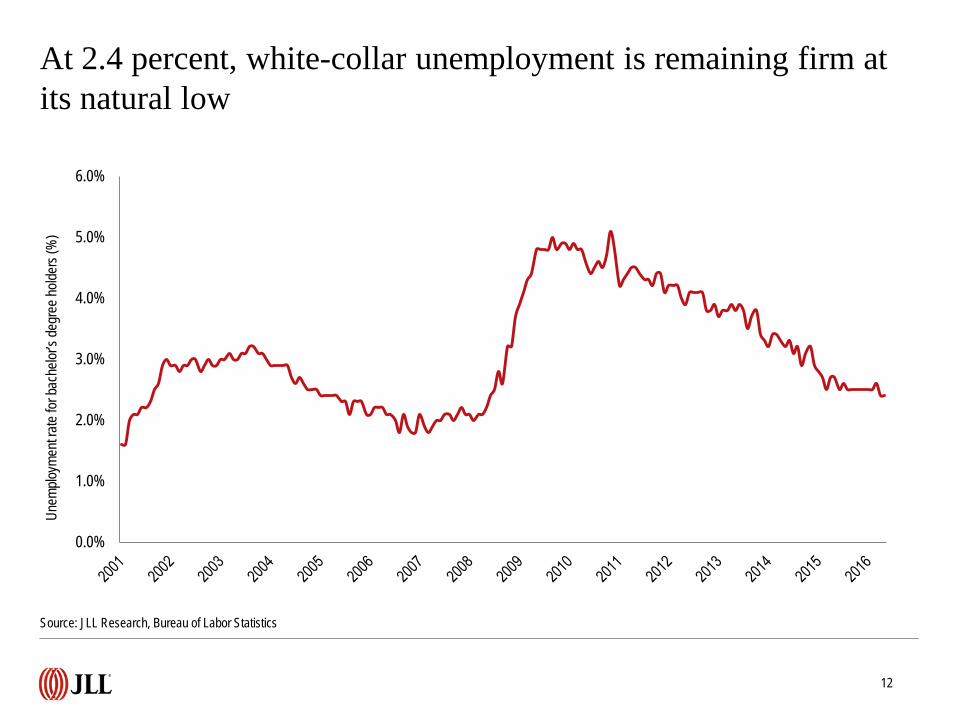
At 2.4 percent, white-collar unemployment is remaining firm at its natural low
Source: JLL Research, Bureau of Labor Statistics
12
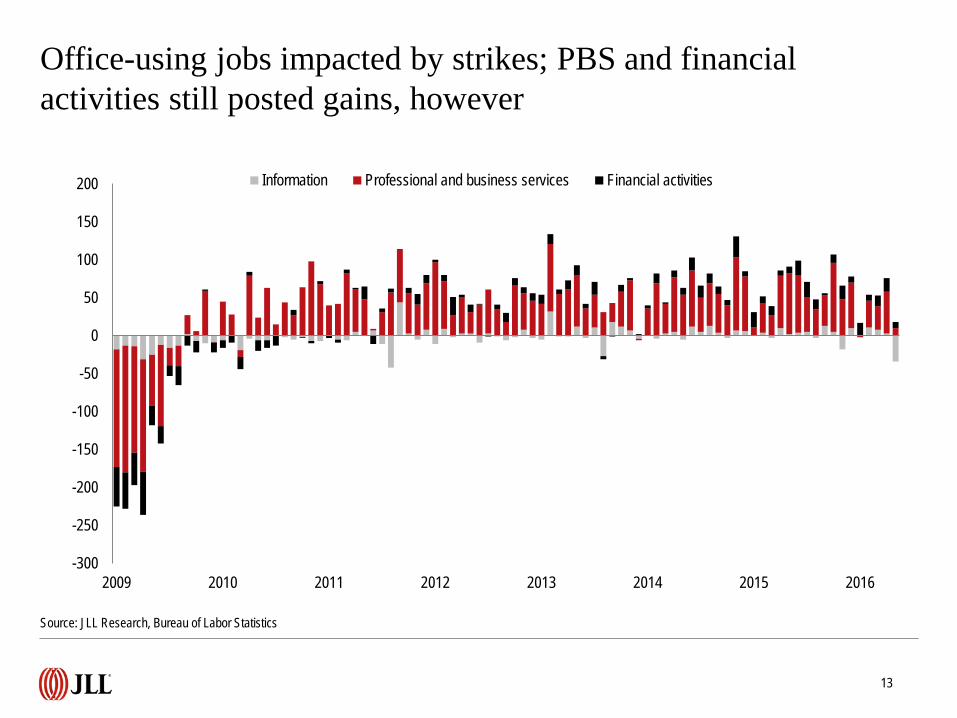
Office-using jobs impacted by strikes; PBS and financial activities still posted gains, however
-300
-250
-200
-150
-100
-50
0
50
100
150
200
2009 2010 2011 2012 2013 2014 2015 2016
Information Professional and business services Financial activities
Source: JLL Research, Bureau of Labor Statistics
13
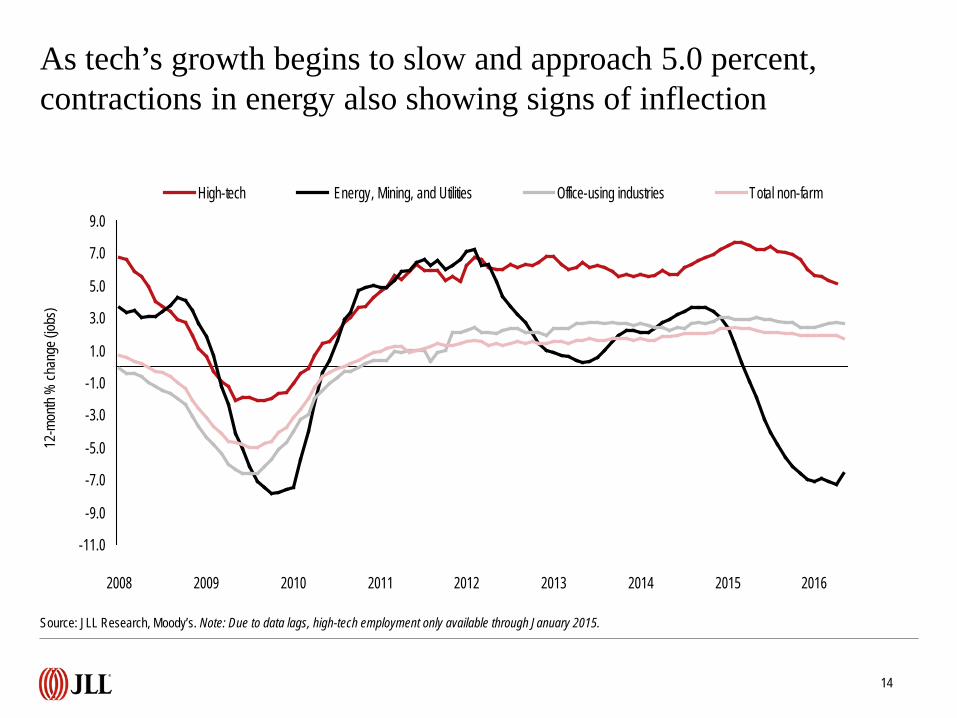
As tech’s growth begins to slow and approach 5.0 percent, contractions in energy also showing signs of inflection
-11.0
-9.0
-7.0
-5.0
-3.0
-1.0
1.0
3.0
5.0
7.0
9.0
2008 2009 2010 2011 2012 2013 2014 2015 2016
High-tech Energy, Mining, and Utilities Office-using industries Total non-farm
Source: JLL Research, Moody’s. Note: Due to data lags, high-tech employment only available through January 2015.
14
12-m
onth
% ch
ange
(jobs
)
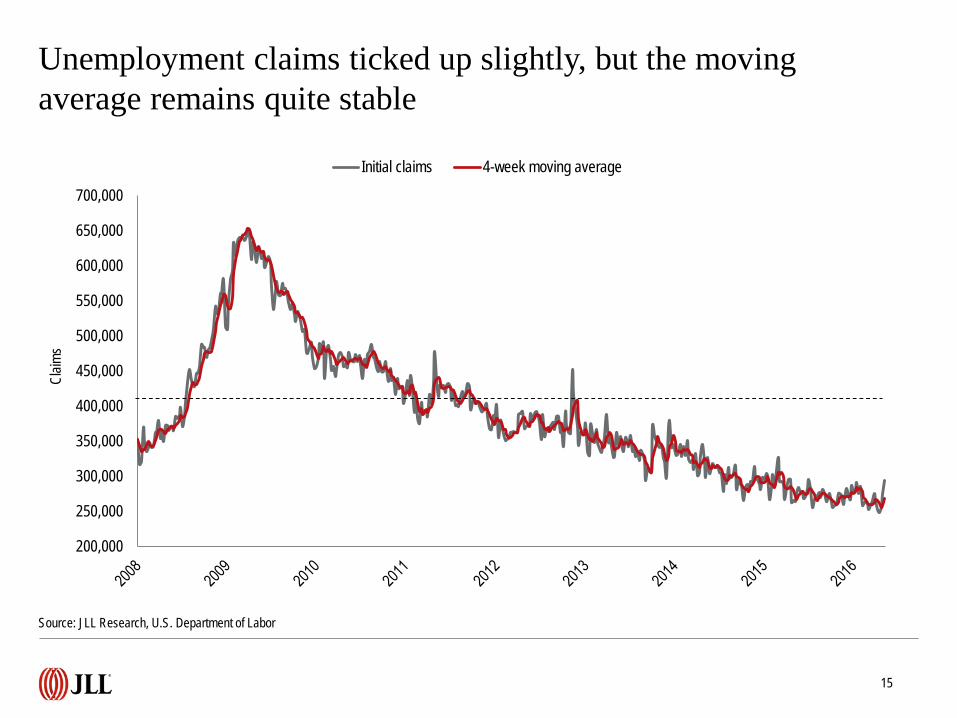
Unemployment claims ticked up slightly, but the moving average remains quite stable
Source: JLL Research, U.S. Department of Labor
15
200,000
250,000
300,000
350,000
400,000
450,000
500,000
550,000
600,000
650,000
700,000
Claim
s
Initial claims 4-week moving average
0
1,000
2,000
3,000
4,000
5,000
6,000
2007 2008 2009 2010 2011 2012 2013 2014 2015 2016
Hire
s and
quits
(tho
usan
ds)
Hires Quits
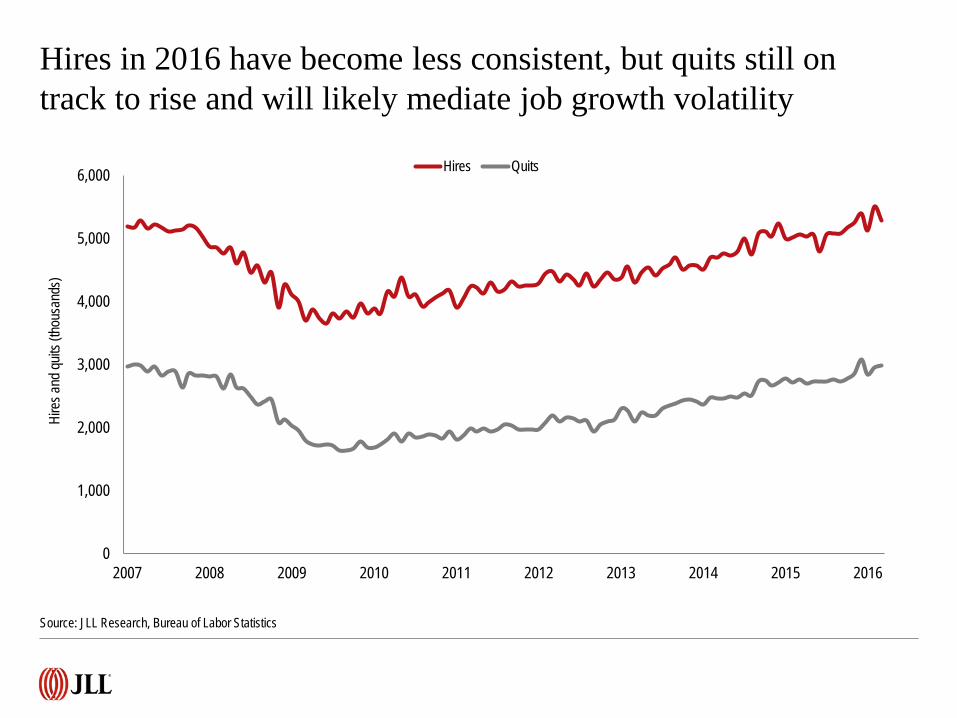
Hires in 2016 have become less consistent, but quits still on track to rise and will likely mediate job growth volatility
Source: JLL Research, Bureau of Labor Statistics

Month after month, tech and Sun Belt markets continue to surpass the national rate of job growth by more than 100bp
Source: JLL Research, Bureau of Labor Statistics
17
San Francisco
4.1%
Fort Lauderdale
4.0%
Dallas3.9%
Raleigh-Durham
3.4%Silicon Valley4.1%
Austin4.0%
0.3%
1.6%
1.7%
1.9%
2.2%
2.3%
2.5%
2.7%
3.2%
3.2%
3.9%
4.0%
0.0% 0.5% 1.0% 1.5% 2.0% 2.5% 3.0% 3.5% 4.0% 4.5%
Houston
Chicago
Boston
New York
Philadelphia
Washington, DC
Los Angeles
South Florida
Atlanta
Seattle
Dallas
San Francisco
12-month % change
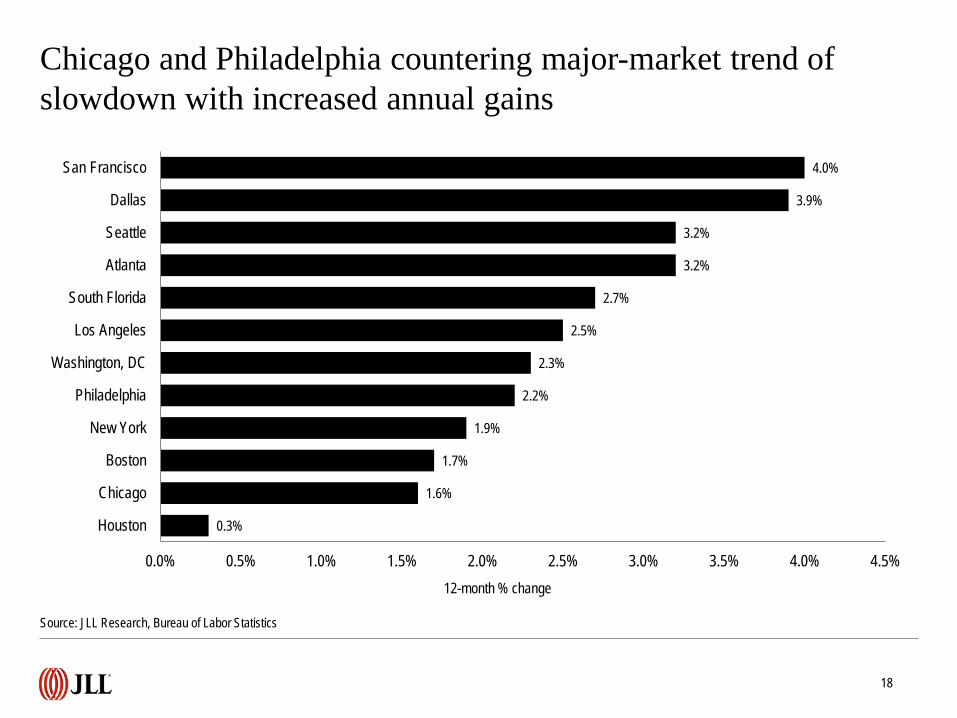
Chicago and Philadelphia countering major-market trend of slowdown with increased annual gains
Source: JLL Research, Bureau of Labor Statistics
18
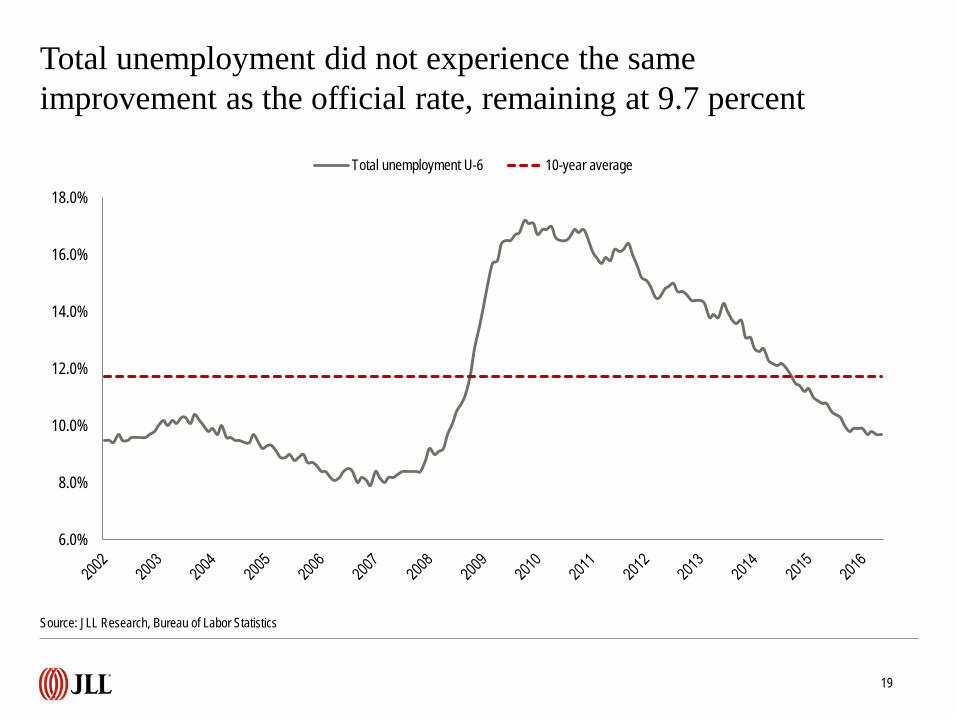
Total unemployment did not experience the same improvement as the official rate, remaining at 9.7 percent
6.0%
8.0%
10.0%
12.0%
14.0%
16.0%
18.0%
Total unemployment U-6 10-year average
Source: JLL Research, Bureau of Labor Statistics
19
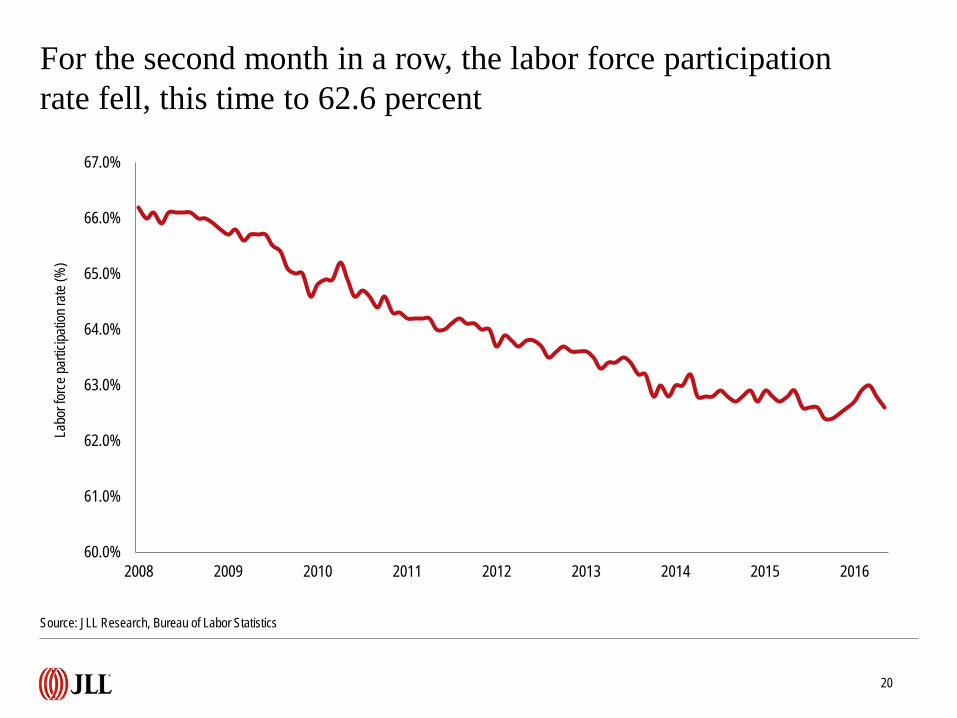
For the second month in a row, the labor force participation rate fell, this time to 62.6 percent
Source: JLL Research, Bureau of Labor Statistics
20
60.0%
61.0%
62.0%
63.0%
64.0%
65.0%
66.0%
67.0%
2008 2009 2010 2011 2012 2013 2014 2015 2016
Labo
r for
ce pa
rticipa
tion r
ate (%
)
©2016 Jones Lang LaSalle Research IP, Inc. All rights reserved. All information contained herein is from sources deemed reliable; however, no representation or warranty is made to the accuracy thereof.
For more information, please contact:
Ben BreslauManaging Director - Americas [email protected]
Phil RyanSenior Research Analyst – Office and Economy [email protected]