Embed Size (px)
Citation preview

http://www.oecd.org/eco/surveys/economic-survey-luxembourg.htm
OECD
OECD Economics
2015 OECD ECONOMIC
SURVEY OF LUXEMBOURG
Diversifying growthLuxembourg, Friday 27th March 2015
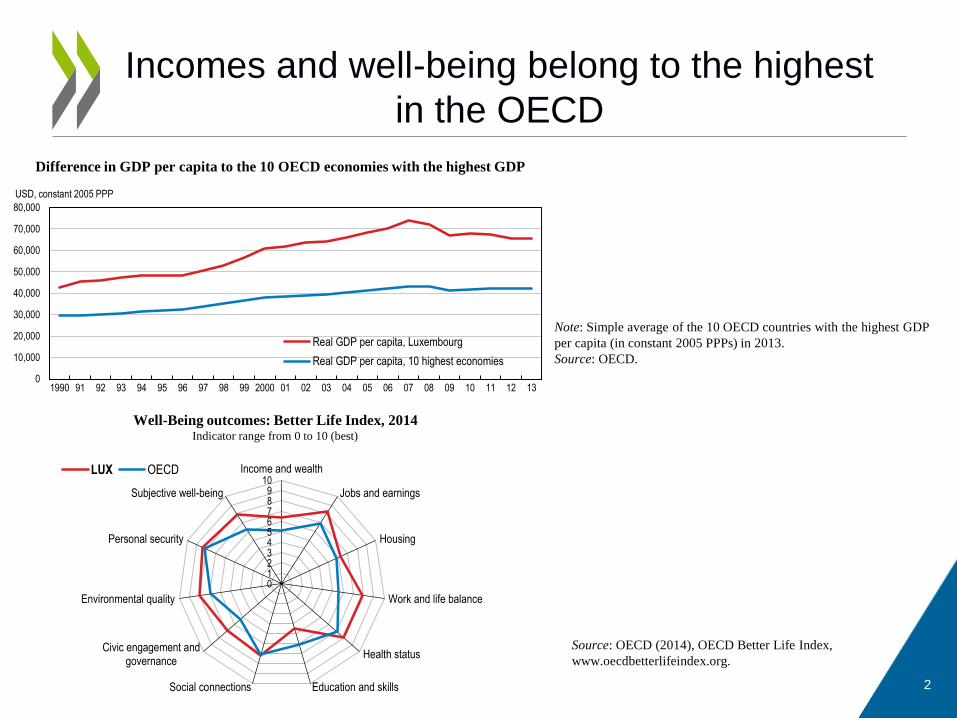
Incomes and well-being belong to the highest
in the OECD
Difference in GDP per capita to the 10 OECD economies with the highest GDP
2
Note: Simple average of the 10 OECD countries with the highest GDP
per capita (in constant 2005 PPPs) in 2013.
Source: OECD.
Well-Being outcomes: Better Life Index, 2014Indicator range from 0 to 10 (best)
Source: OECD (2014), OECD Better Life Index,
www.oecdbetterlifeindex.org.
0
10,000
20,000
30,000
40,000
50,000
60,000
70,000
80,000
1990 91 92 93 94 95 96 97 98 99 2000 01 02 03 04 05 06 07 08 09 10 11 12 13
USD, constant 2005 PPP
Real GDP per capita, Luxembourg
Real GDP per capita, 10 highest economies
0 1 2 3 4 5 6 7 8 9
10Income and wealth
Jobs and earnings
Housing
Work and life balance
Health status
Education and skillsSocial connections
Civic engagement andgovernance
Environmental quality
Personal security
Subjective well-being
LUX OECD
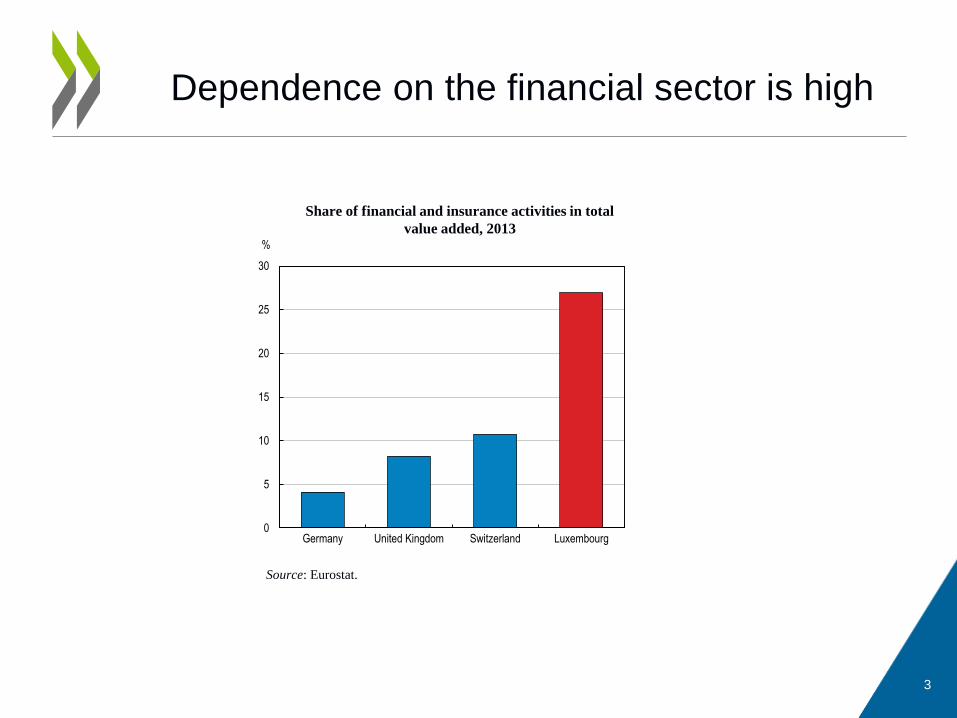
Dependence on the financial sector is high
3
Share of financial and insurance activities in total
value added, 2013
Source: Eurostat.
%
0
5
10
15
20
25
30
Germany United Kingdom Switzerland Luxembourg
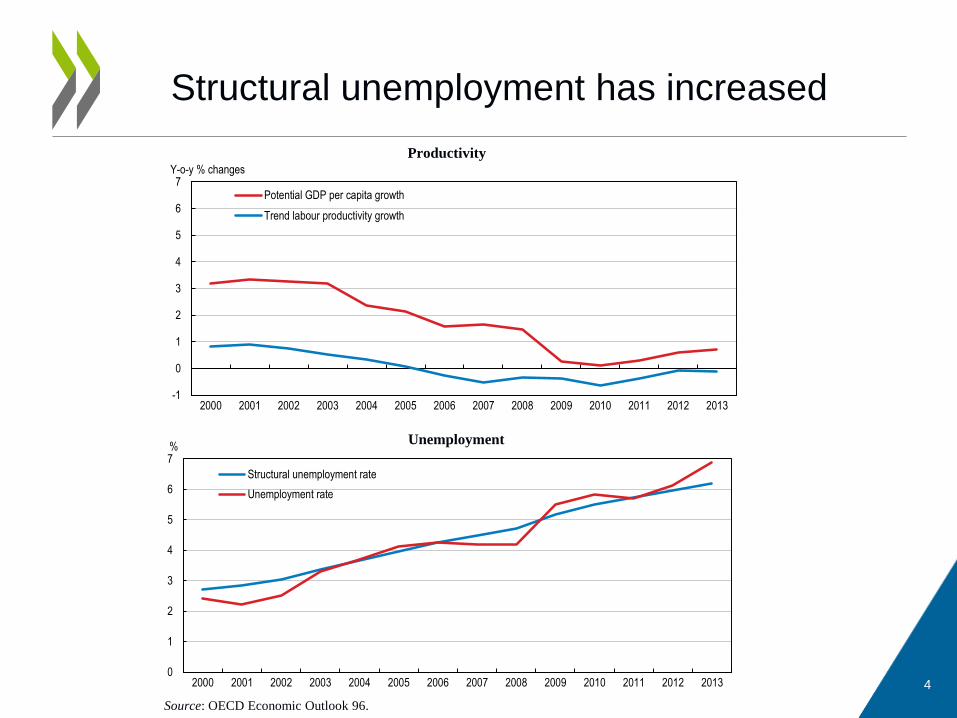
Structural unemployment has increased
4
Productivity
Source: OECD Economic Outlook 96.
Unemployment
-1
0
1
2
3
4
5
6
7
2000 2001 2002 2003 2004 2005 2006 2007 2008 2009 2010 2011 2012 2013
Y-o-y % changes
Potential GDP per capita growth
Trend labour productivity growth
0
1
2
3
4
5
6
7
2000 2001 2002 2003 2004 2005 2006 2007 2008 2009 2010 2011 2012 2013
%
Structural unemployment rate
Unemployment rate
Main Findings
• Luxembourg is one of the most prosperous countries in the OECD and an attractive business location.
• The financial sector is an important source of high incomes.
• The economy depends to a large extent on the financial sector, creating potential vulnerabilities.
• Economic diversification could raise productivity growth and reduce vulnerabilities.
5
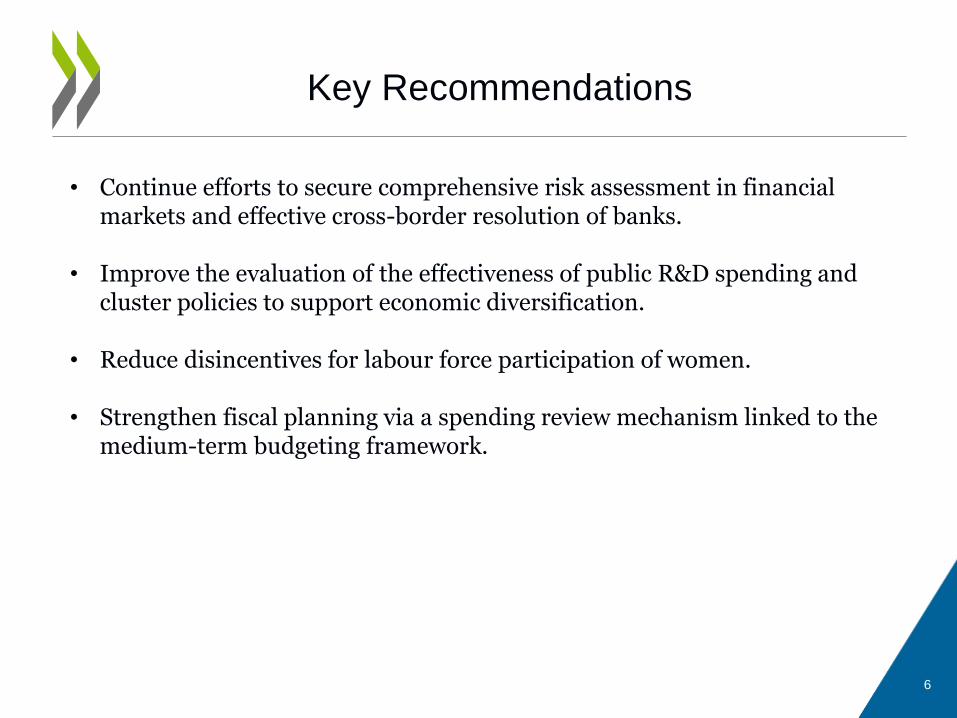
Key Recommendations
• Continue efforts to secure comprehensive risk assessment in financial markets and effective cross-border resolution of banks.
• Improve the evaluation of the effectiveness of public R&D spending and cluster policies to support economic diversification.
• Reduce disincentives for labour force participation of women.
• Strengthen fiscal planning via a spending review mechanism linked to the medium-term budgeting framework.
6
Strengthening the performance and
resilience of the financial sector
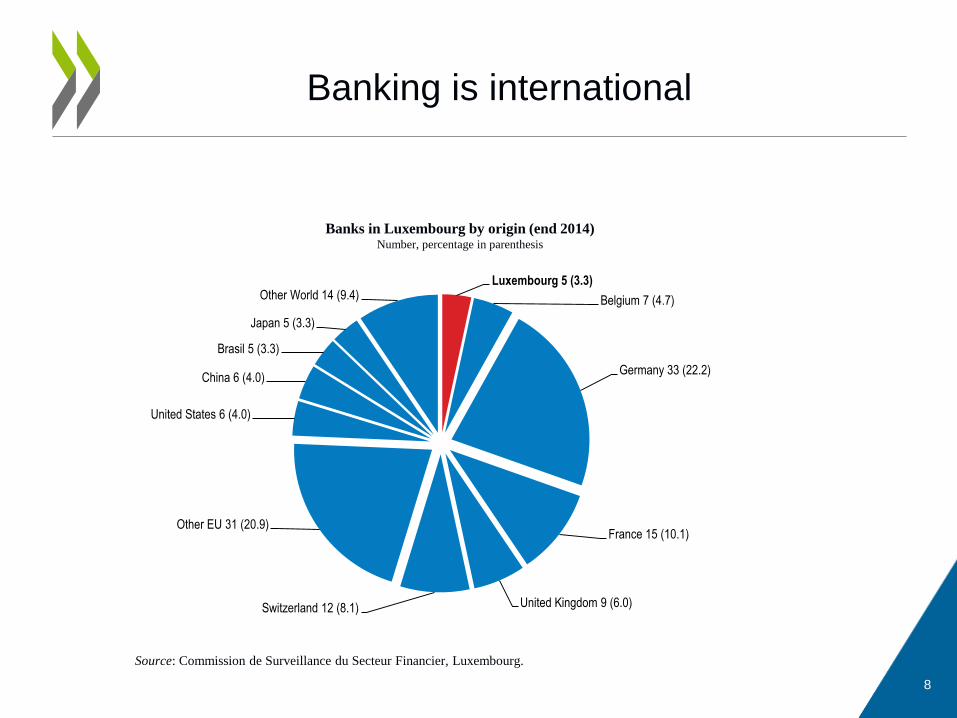
Banking is international
8
Banks in Luxembourg by origin (end 2014)Number, percentage in parenthesis
Source: Commission de Surveillance du Secteur Financier, Luxembourg.
Luxembourg 5 (3.3)
Belgium 7 (4.7)
Germany 33 (22.2)
France 15 (10.1)
United Kingdom 9 (6.0)Switzerland 12 (8.1)
Other EU 31 (20.9)
United States 6 (4.0)
China 6 (4.0)
Brasil 5 (3.3)
Japan 5 (3.3)
Other World 14 (9.4)
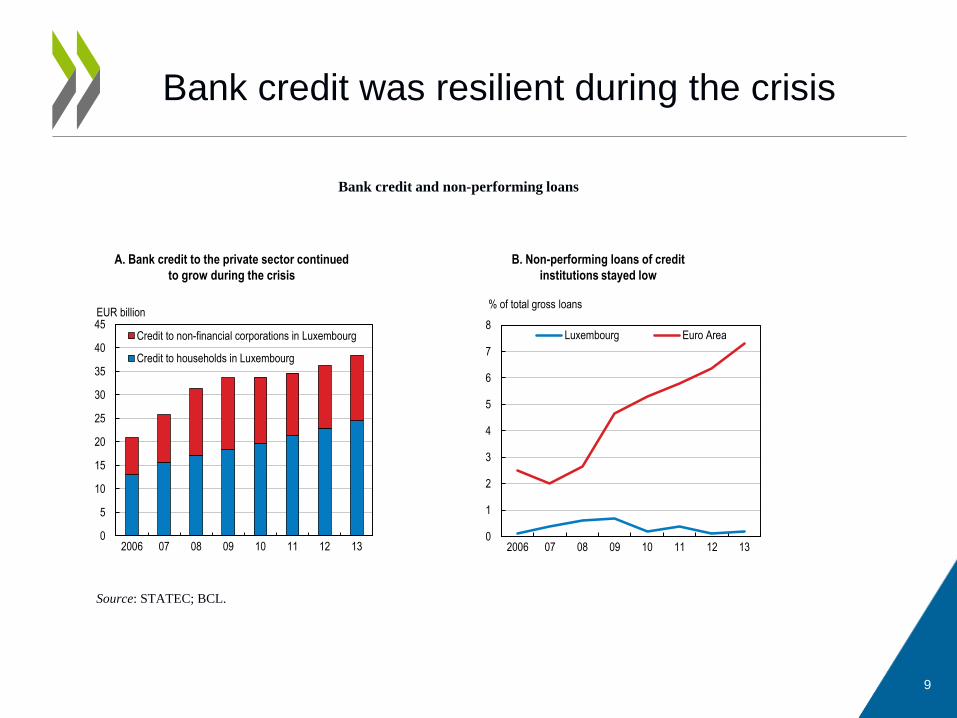
Bank credit was resilient during the crisis
9
Bank credit and non-performing loans
Source: STATEC; BCL.
0
5
10
15
20
25
30
35
40
45
2006 07 08 09 10 11 12 13
EUR billion
Credit to non-financial corporations in Luxembourg
Credit to households in Luxembourg
0
1
2
3
4
5
6
7
8
2006 07 08 09 10 11 12 13
Luxembourg Euro Area
% of total gross loans
A. Bank credit to the private sector continued
to grow during the crisis
B. Non-performing loans of credit
institutions stayed low
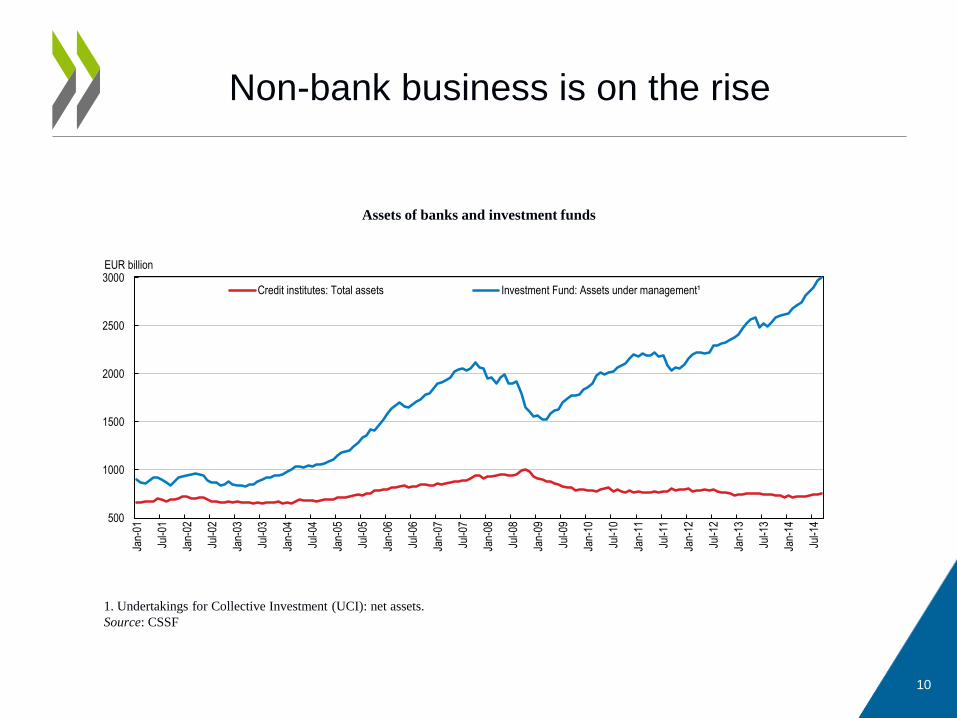
Non-bank business is on the rise
10
Assets of banks and investment funds
1. Undertakings for Collective Investment (UCI): net assets.
Source: CSSF
500
1000
1500
2000
2500
3000
Jan-
01
Jul-0
1
Jan-
02
Jul-0
2
Jan-
03
Jul-0
3
Jan-
04
Jul-0
4
Jan-
05
Jul-0
5
Jan-
06
Jul-0
6
Jan-
07
Jul-0
7
Jan-
08
Jul-0
8
Jan-
09
Jul-0
9
Jan-
10
Jul-1
0
Jan-
11
Jul-1
1
Jan-
12
Jul-1
2
Jan-
13
Jul-1
3
Jan-
14
Jul-1
4
EUR billion
Credit institutes: Total assets Investment Fund: Assets under management¹
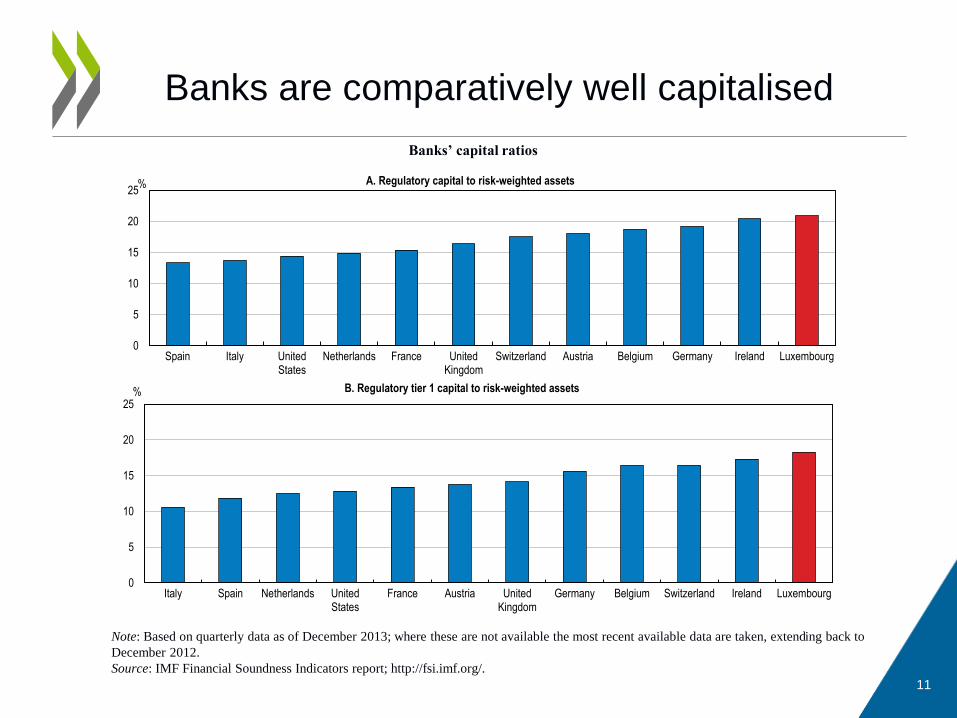
Banks are comparatively well capitalised
11
Banks’ capital ratios
Note: Based on quarterly data as of December 2013; where these are not available the most recent available data are taken, extending back to
December 2012.
Source: IMF Financial Soundness Indicators report; http://fsi.imf.org/.
0
5
10
15
20
25
Spain Italy UnitedStates
Netherlands France UnitedKingdom
Switzerland Austria Belgium Germany Ireland Luxembourg
% A. Regulatory capital to risk-weighted assets
0
5
10
15
20
25
Italy Spain Netherlands UnitedStates
France Austria UnitedKingdom
Germany Belgium Switzerland Ireland Luxembourg
% B. Regulatory tier 1 capital to risk-weighted assets
Ensure a healthy financial sector
• Sound financial market regulation has supported growth of the financial sector.
• Continue to monitor financial market risk while using a comprehensive approach to risk assessment that accounts for financial linkages between banks and other financial intermediaries.
• Continue efforts to develop resolution plans and to undertake resolvability assessments so that important banks could be resolved effectively across borders.
• Continue to actively participate in international negotiations on co-ordinated action to combat tax base erosion and profit shifting of multinational enterprises. Change domestic laws as necessary.
12

Raising productivity and fostering the
diversification of the economy

Entrepreneurship
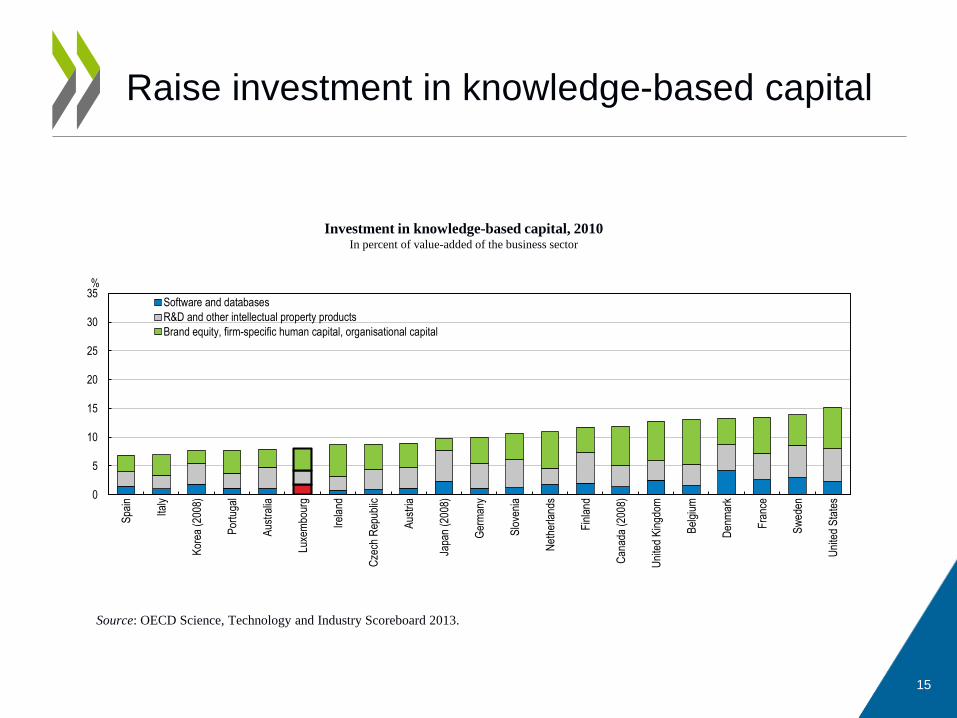
Raise investment in knowledge-based capital
15
Investment in knowledge-based capital, 2010In percent of value-added of the business sector
Source: OECD Science, Technology and Industry Scoreboard 2013.
0
5
10
15
20
25
30
35
Spa
in
Italy
Kor
ea (
2008
)
Por
tuga
l
Aus
tral
ia
Luxe
mbo
urg
Irel
and
Cze
ch R
epub
lic
Aus
tria
Japa
n (2
008)
Ger
man
y
Slo
veni
a
Net
herla
nds
Fin
land
Can
ada
(200
8)
Uni
ted
Kin
gdom
Bel
gium
Den
mar
k
Fra
nce
Sw
eden
Uni
ted
Sta
tes
%
Software and databases
R&D and other intellectual property products
Brand equity, firm-specific human capital, organisational capital
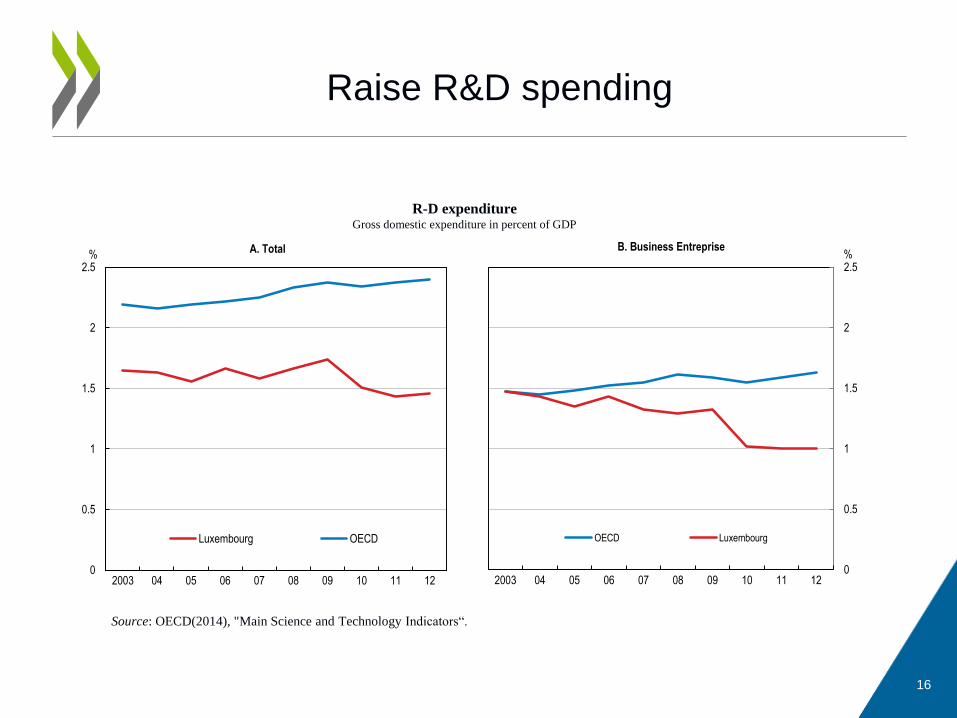
Raise R&D spending
16
R-D expenditureGross domestic expenditure in percent of GDP
Source: OECD(2014), "Main Science and Technology Indicators“.
0
0.5
1
1.5
2
2.5
2003 04 05 06 07 08 09 10 11 12
%
Luxembourg OECD
0
0.5
1
1.5
2
2.5
2003 04 05 06 07 08 09 10 11 12
%
OECD Luxembourg
A. Total B. Business Entreprise
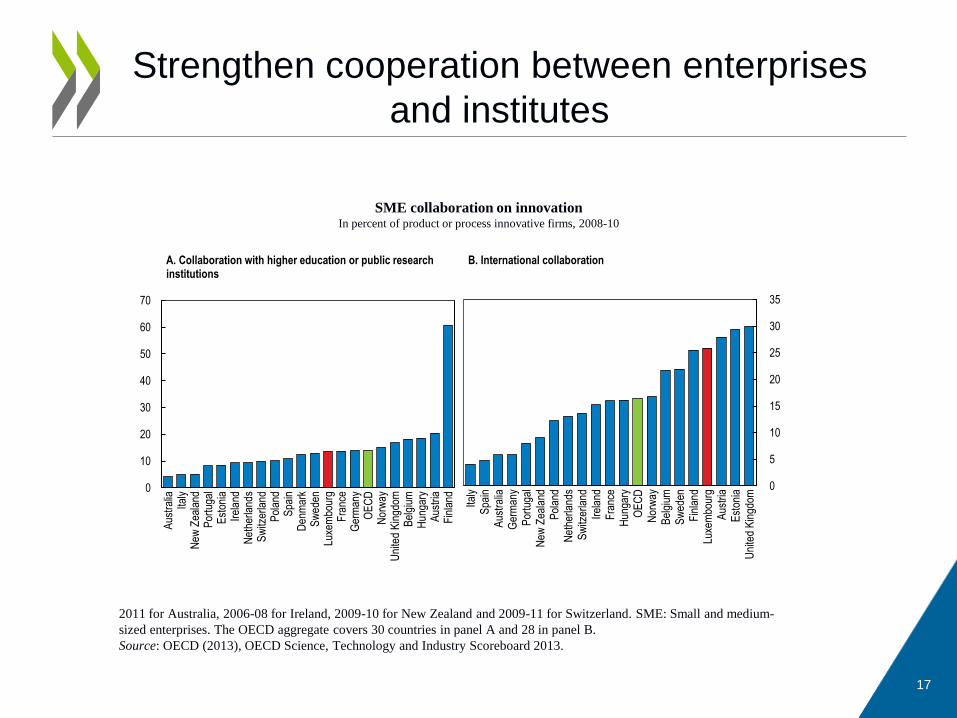
Strengthen cooperation between enterprises
and institutes
17
SME collaboration on innovationIn percent of product or process innovative firms, 2008-10
2011 for Australia, 2006-08 for Ireland, 2009-10 for New Zealand and 2009-11 for Switzerland. SME: Small and medium-
sized enterprises. The OECD aggregate covers 30 countries in panel A and 28 in panel B.
Source: OECD (2013), OECD Science, Technology and Industry Scoreboard 2013.
0
10
20
30
40
50
60
70
Aus
tral
iaIta
lyN
ew Z
eala
ndP
ortu
gal
Est
onia
Irel
and
Net
herla
nds
Sw
itzer
land
Pol
and
Spa
inD
enm
ark
Sw
eden
Luxe
mbo
urg
Fra
nce
Ger
man
yO
EC
DN
orw
ayU
nite
d K
ingd
omB
elgi
umH
unga
ryA
ustr
iaF
inla
nd
A. Collaboration with higher education or public research institutions
0
5
10
15
20
25
30
35
Italy
Spa
inA
ustr
alia
Ger
man
yP
ortu
gal
New
Zea
land
Pol
and
Net
herla
nds
Sw
itzer
land
Irel
and
Fra
nce
Hun
gary
OE
CD
Nor
way
Bel
gium
Sw
eden
Fin
land
Luxe
mbo
urg
Aus
tria
Est
onia
Uni
ted
Kin
gdom
B. International collaboration
Enhance the potential of innovative industries
• Better evaluate the effectiveness of public R&D spending and cluster policies.
• Strengthen the cooperation between enterprises, University of Luxembourg and research institutes in Luxembourg and abroad.
18
Education and labour force
participation
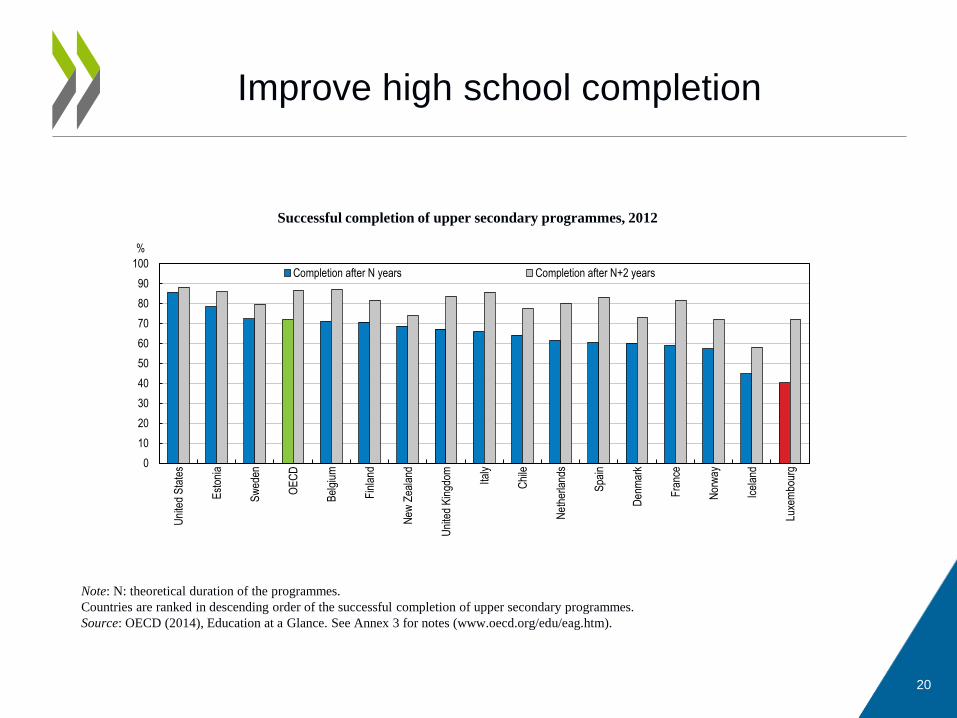
Improve high school completion
20
Successful completion of upper secondary programmes, 2012
Note: N: theoretical duration of the programmes.
Countries are ranked in descending order of the successful completion of upper secondary programmes.
Source: OECD (2014), Education at a Glance. See Annex 3 for notes (www.oecd.org/edu/eag.htm).
0
10
20
30
40
50
60
70
80
90
100
Uni
ted
Sta
tes
Est
onia
Sw
eden
OE
CD
Bel
gium
Fin
land
New
Zea
land
Uni
ted
Kin
gdom Ita
ly
Chi
le
Net
herla
nds
Spa
in
Den
mar
k
Fra
nce
Nor
way
Icel
and
Luxe
mbo
urg
%
Completion after N years Completion after N+2 years
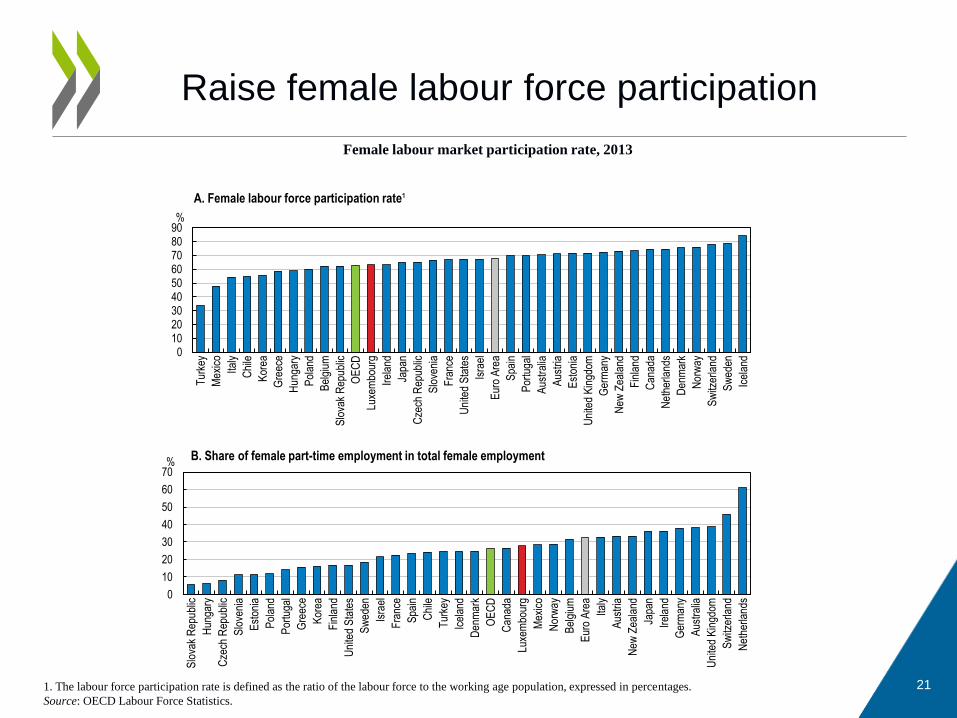
Raise female labour force participation
21
Female labour market participation rate, 2013
1. The labour force participation rate is defined as the ratio of the labour force to the working age population, expressed in percentages.
Source: OECD Labour Force Statistics.
0102030405060708090
Tur
key
Mex
ico
Italy
Chi
le
Kor
ea
Gre
ece
Hun
gary
Pol
and
Bel
gium
Slo
vak
Rep
ublic
OE
CD
Luxe
mbo
urg
Irel
and
Japa
n
Cze
ch R
epub
lic
Slo
veni
a
Fra
nce
Uni
ted
Sta
tes
Isra
el
Eur
o A
rea
Spa
in
Por
tuga
l
Aus
tral
ia
Aus
tria
Est
onia
Uni
ted
Kin
gdom
Ger
man
y
New
Zea
land
Fin
land
Can
ada
Net
herla
nds
Den
mar
k
Nor
way
Sw
itzer
land
Sw
eden
Icel
and
%
0
10
20
30
40
50
60
70
Slo
vak
Rep
ublic
Hun
gary
Cze
ch R
epub
lic
Slo
veni
a
Est
onia
Pol
and
Por
tuga
l
Gre
ece
Kor
ea
Fin
land
Uni
ted
Sta
tes
Sw
eden
Isra
el
Fra
nce
Spa
in
Chi
le
Tur
key
Icel
and
Den
mar
k
OE
CD
Can
ada
Luxe
mbo
urg
Mex
ico
Nor
way
Bel
gium
Eur
o A
rea
Italy
Aus
tria
New
Zea
land
Japa
n
Irel
and
Ger
man
y
Aus
tral
ia
Uni
ted
Kin
gdom
Sw
itzer
land
Net
herla
nds
%
A. Female labour force participation rate¹
B. Share of female part-time employment in total female employment
Nourish a high-quality labour force
• In secondary education, reduce grade repetition, provide more school autonomy and better monitor education quality.
• Increase enrolment in early childhood education with emphasis on low-income and foreign-language families.
• Reduce disincentives for labour force participation of women by charging health care contributions for each spouse individually and introducing separate income tax assessment of spouses.
22
More Information…
http://www.oecd.org/eco/surveys/economic-survey-luxembourg.htm
OECD
OECD Economics
Disclaimers:
The statistical data for Israel are supplied by and under the responsibility of the relevant Israeli authorities. The use of such data by the OECD is without
prejudice to the status of the Golan Heights, East Jerusalem and Israeli settlements in the West Bank under the terms of international law.
This document and any map included herein are without prejudice to the status of or sovereignty over any territory, to the delimitation of international frontiers
and boundaries and to the name of any territory, city or area.
23