Embed Size (px)
Citation preview
Please refer to important disclosures at the end of this report
Event Update | Oil & GasEvent Update | Oil & GasEvent Update | Oil & GasEvent Update | Oil & GasEvent Update | Oil & Gas
June 28, 2010
Oil POil POil POil POil Price Deregulationrice Deregulationrice Deregulationrice Deregulationrice DeregulationOn the path of reforms
In a meeting held on Friday, June 25, 2010, the Empowered Group of Ministers
(EGoM) took a major policy decision on the country's retail fuel pricing. After long
deliberation for more than a year, the EGoM has freed the price of petrol from the
government's control. On an immediate basis, petrol price has increased by
Rs3.7/litre. Diesel prices has been also increased by Rs2/litre and are to be
deregulated in a phased manner. However, no timeline for the decontrol has been
mentioned. In the cooking fuel segment, domestic LPG prices has been increased
by Rs35/cylinder, and kerosene price by Rs3/litre. However, cooking fuels will
continue to be subsidised.
While the announcement of petrol deregulation is in line with our expectation, the
announcement of the deregulation of diesel prices and increase in prices of kerosene
and domestic LPG has surprised us positively. However, absence of (1) the timeline
of the diesel price deregulation, (2) the frequency of change in petrol price and (3)
pricing limit (band) for petrol price takes some sheen off the decision.
We were also pinning hopes on the announcement of the subsidy-sharing formulae;
however, the absence of the same has left us a bit disappointed, as it makes it
difficult to judge the beneficiaries of the move.
All said, we believe the policy change is a significant step in the right direction and
has come as a positive surprise for PSU oil companies, viz. ONGC, OIL India,
GAIL, IOC, HPCL and BPCL. In case of upstream companies, we were already
building in the proposed moves and the same was reflected in higher-than-consensus
EPS estimates for ONGC and GAIL.
We believe downstream oil companies are likely to be key beneficiaries of the
deregulation on the following counts:
• Reduction in overall subsidies to manageable limits
• Subdued outlook on crude oil prices
• Improved profitability situation of upstream companies post the APM gas price
hike, enables them to bear a relatively higher subsidy burden
• Government efforts towards divestment in IOC
Thus, we believe, while the move is likely to benefit downstream oil marketingThus, we believe, while the move is likely to benefit downstream oil marketingThus, we believe, while the move is likely to benefit downstream oil marketingThus, we believe, while the move is likely to benefit downstream oil marketingThus, we believe, while the move is likely to benefit downstream oil marketing
companies, the same is likely to be neutal for upstream oil companies.companies, the same is likely to be neutal for upstream oil companies.companies, the same is likely to be neutal for upstream oil companies.companies, the same is likely to be neutal for upstream oil companies.companies, the same is likely to be neutal for upstream oil companies.
Amit VAmit VAmit VAmit VAmit Voraoraoraoraora+91 22 4040 3800 Ext: 322
Deepak PDeepak PDeepak PDeepak PDeepak Pareekareekareekareekareek+91 22 4040 3800 Ext: 340
CompaniesCompaniesCompaniesCompaniesCompanies CMPCMPCMPCMPCMP TTTTTargetargetargetargetarget RecoRecoRecoRecoReco Mkt CapMkt CapMkt CapMkt CapMkt Cap EPSEPSEPSEPSEPS P/EP/EP/EP/EP/E P/BP/BP/BP/BP/B EV/EBITDEV/EBITDEV/EBITDEV/EBITDEV/EBITDA (%)A (%)A (%)A (%)A (%)
(Rs)(Rs)(Rs)(Rs)(Rs) PPPPPricericericericerice (Rs cr)(Rs cr)(Rs cr)(Rs cr)(Rs cr) FY2011EFY2011EFY2011EFY2011EFY2011E FY2012EFY2012EFY2012EFY2012EFY2012E FY2011EFY2011EFY2011EFY2011EFY2011E FY2012EFY2012EFY2012EFY2012EFY2012E FY2011EFY2011EFY2011EFY2011EFY2011E FY2012EFY2012EFY2012EFY2012EFY2012E FY2011EFY2011EFY2011EFY2011EFY2011E FY2012EFY2012EFY2012EFY2012EFY2012E
ONGC 1,304 1,356 Neutral 278,973 114.6 123.3 11.4 10.6 2.4 2.1 4.7 4.3
GAIL 473 580 Buy 60,031 30.3 35.2 15.6 13.4 3.1 2.6 10.6 8.3
HPCL 433 - Not Rated 14,664 47.3 48.4 9.1 8.9 1.2 1.1 5.4 5.0
BPCL 642 - Not Rated 23,225 48.1 60.4 13.4 10.6 1.4 1.3 10.5 7.1
Valuation Summary
Source: Angel Research
June 28, 2010 2
Oil Price Deregulation | Event Update
Broad counters of the move
PPPPPetrol price deregulated; Diesel (to be deregulated) and cooking fuel prices alsoetrol price deregulated; Diesel (to be deregulated) and cooking fuel prices alsoetrol price deregulated; Diesel (to be deregulated) and cooking fuel prices alsoetrol price deregulated; Diesel (to be deregulated) and cooking fuel prices alsoetrol price deregulated; Diesel (to be deregulated) and cooking fuel prices also
hiked:hiked:hiked:hiked:hiked: In the EGoM meeting held on June 25, 2010, the government has decided to
increase the prices of all subsidised petro products. The government has also
deregulated petrol prices. This will, in turn, permit oil marketing companies (OMCs)
to fix the price of petrol on a market determined basis. On an immediate basis, petrol
price has gone up by Rs3.7/litre (~7%). Similarly, the government has increased diesel
price by Rs2/litre (~5%) and has proposed to deregulate diese pricel in the future.
However, no timeline for the decontrol has been mentioned. In the cooking fuel segment,
domestic LPG price has been increased by Rs35/cylinder (~11%), and kerosene price
has been increased by Rs3/litre (~33%).
Prices of petrol and diesel were last increased in February 2010, while prices of LPG
and kerosene were previously revised in January 2009 and April 2002, respectively.
Post the price hikes, retail selling prices of petrol, diesel, LPG and kerosene in Mumbai
will increase to Rs55.4/litre, Rs41.6/litre, Rs347/cylinder and Rs12/litre, respectively.
While the announcement of petrol deregulation is in line with our expectation, theannouncement of the deregulation of diesel and increased prices of kerosene anddomestic LPG have surprised us positively. However, absence of (1) the timeline of thediesel price deregulation, (2) the frequency of change in petrol price and (3) pricinglimit (band) for petrol price takes some sheen off the decision.
We were also pinning hopes on the announcement of the subsidy-sharing formulae;however, the absence of the same has left us a bit disappointed, as it makes it difficultto judge the beneficiaries of the move. Although the current reforms are positive innature, they in themselves are not adequate and need to be followed by the deregulationof diesel prices coupled with announcement of the subsidy-sharing mechanism.
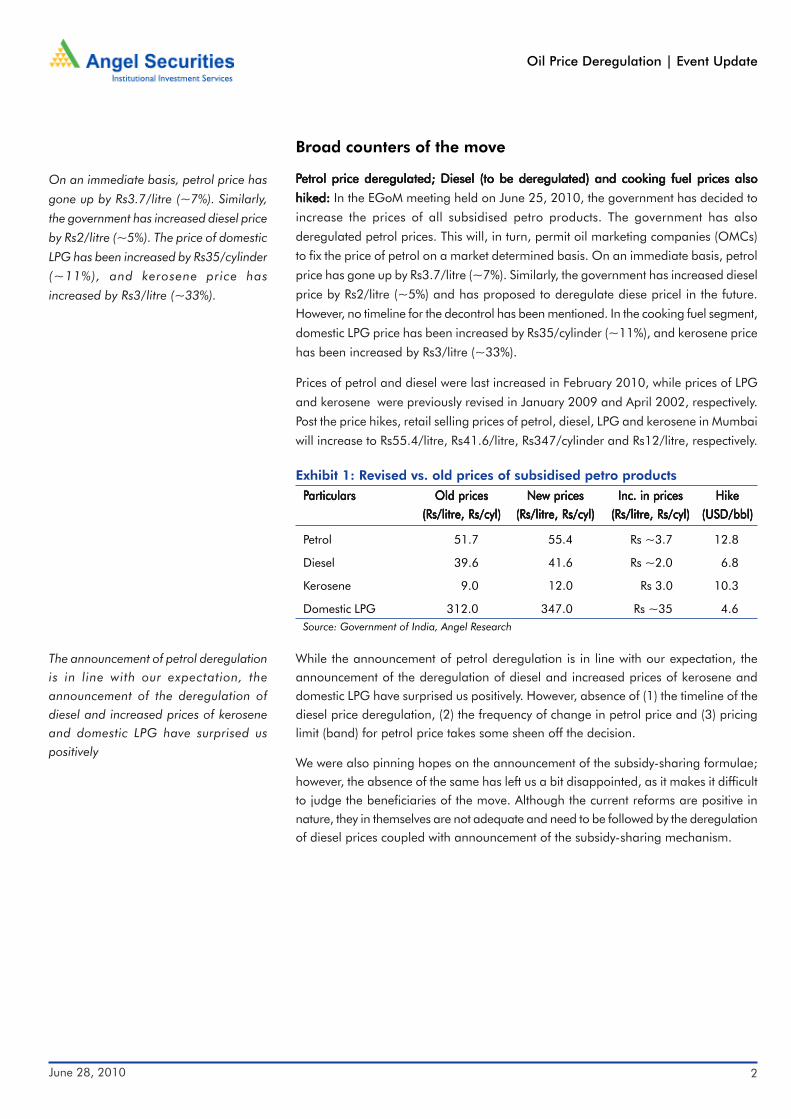
Exhibit 1: Revised vs. old prices of subsidised petro products
Petrol 51.7 55.4 Rs ~3.7 12.8
Diesel 39.6 41.6 Rs ~2.0 6.8
Kerosene 9.0 12.0 Rs 3.0 10.3
Domestic LPG 312.0 347.0 Rs ~35 4.6Source: Government of India, Angel Research
Old pricesOld pricesOld pricesOld pricesOld prices(Rs/litre, Rs/cyl)(Rs/litre, Rs/cyl)(Rs/litre, Rs/cyl)(Rs/litre, Rs/cyl)(Rs/litre, Rs/cyl)
HikeHikeHikeHikeHike(USD/bbl)(USD/bbl)(USD/bbl)(USD/bbl)(USD/bbl)
Inc. in pricesInc. in pricesInc. in pricesInc. in pricesInc. in prices(Rs/litre, Rs/cyl)(Rs/litre, Rs/cyl)(Rs/litre, Rs/cyl)(Rs/litre, Rs/cyl)(Rs/litre, Rs/cyl)
New pricesNew pricesNew pricesNew pricesNew prices(Rs/litre, Rs/cyl)(Rs/litre, Rs/cyl)(Rs/litre, Rs/cyl)(Rs/litre, Rs/cyl)(Rs/litre, Rs/cyl)
PPPPParticularsarticularsarticularsarticularsarticulars
On an immediate basis, petrol price has
gone up by Rs3.7/litre (~7%). Similarly,
the government has increased diesel price
by Rs2/litre (~5%). The price of domestic
LPG has been increased by Rs35/cylinder
(~11%), and kerosene price has
increased by Rs3/litre (~33%).
The announcement of petrol deregulationis in line with our expectation, theannouncement of the deregulation ofdiesel and increased prices of keroseneand domestic LPG have surprised uspositively
June 28, 2010 3
Oil Price Deregulation | Event Update
EGoM decision in sink with Kirit Parekh Committee's recommendation
Relative to the recommendation of the Kirit Parikh committee, decisions taken by theEGoM seem to be inadequate as the increase in kerosene and domestic LPG prices isless than that proposed by the Kirit Parekh Committee. The deregulation of dieselprices in a phased manner is contrary to the complete deregulation recommended bythe committee. We believe the government has marginally increased prices, consideringthe possible political fallout in case the prices were increased significantly.
However, we believe government has done enough on the recommendations of KiritParekh Committee. Moreover, if the recommendation of the Kirit Parikh committeewould have been accepted in totality, under recoveries would have come downdrastically. Significantly lower under recoveries along with cash subsidy of Rs20,000crto be provided by the government would have resulted in a reduction subsidy-sharingburden for ONGC, OIL and GAIL to the levels of around Rs1,600cr-2,000cr. Thus, wewere not anticipating any increase in the retail prices of kerosene and domestic LPG.
Impact of the EGoM decision on under recoveries
After incorporating the EGoM's decision, under recoveries in the sector are expectedto reduce by around 29% to Rs54,516cr for FY2011E from the earlier estimate ofRs77,213cr.
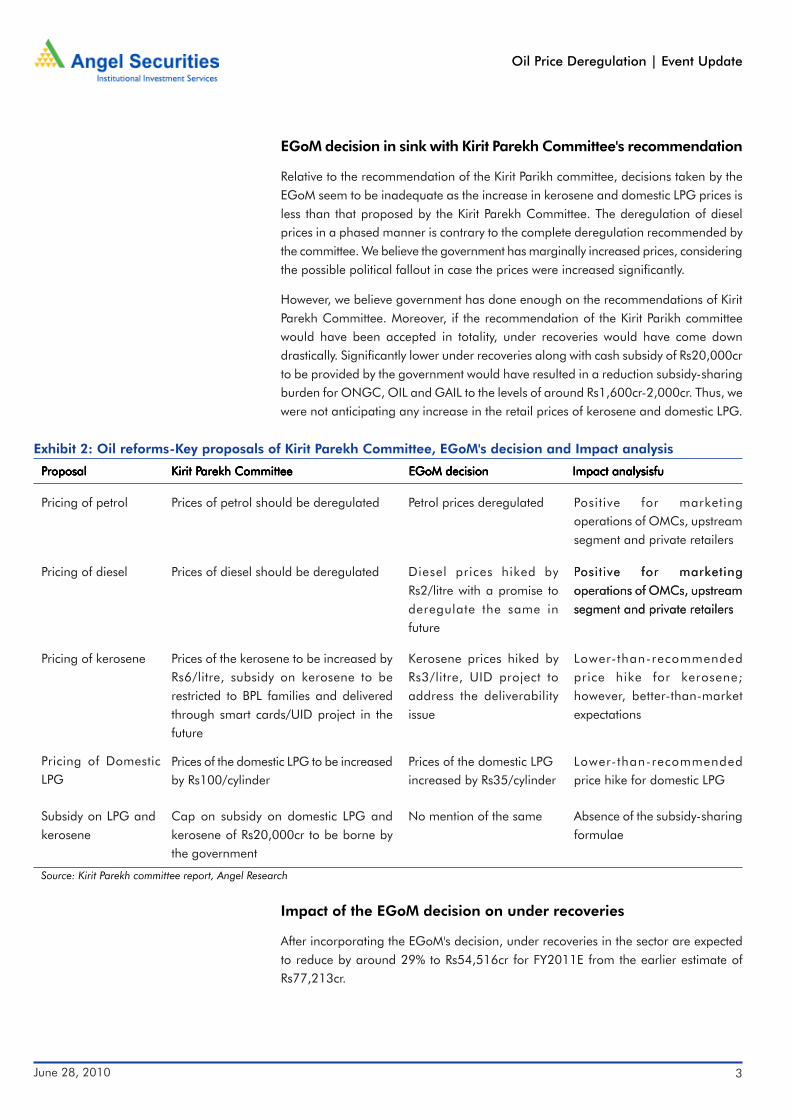
Exhibit 2: Oil reforms-Key proposals of Kirit Parekh Committee, EGoM's decision and Impact analysis
PPPPProposalroposalroposalroposalroposal
Pricing of petrol
Kirit PKirit PKirit PKirit PKirit Parekh Committeearekh Committeearekh Committeearekh Committeearekh Committee EGoM decisionEGoM decisionEGoM decisionEGoM decisionEGoM decision Impact analysisfuImpact analysisfuImpact analysisfuImpact analysisfuImpact analysisfu
Pricing of diesel Positive for marketingoperations of OMCs, upstreamsegment and private retailers
Pricing of kerosene
Subsidy on LPG andkerosene
Source: Kirit Parekh committee report, Angel Research
Prices of petrol should be deregulated Petrol prices deregulated Positive for marketingoperations of OMCs, upstreamsegment and private retailers
Positive for marketingoperations of OMCs, upstreamsegment and private retailers
Diesel prices hiked byRs2/litre with a promise toderegulate the same infuture
Prices of diesel should be deregulated
Prices of the kerosene to be increased byRs6/litre, subsidy on kerosene to berestricted to BPL families and deliveredthrough smart cards/UID project in thefuture
Kerosene prices hiked byRs3/litre, UID project toaddress the deliverabilityissue
Lower-than-recommendedprice hike for kerosene;however, better-than-marketexpectations
Lower-than-recommendedprice hike for domestic LPG
Prices of the domestic LPGincreased by Rs35/cylinder
Prices of the domestic LPG to be increasedby Rs100/cylinder
Cap on subsidy on domestic LPG andkerosene of Rs20,000cr to be borne bythe government
No mention of the same Absence of the subsidy-sharingformulae
Pricing of DomesticLPG

June 28, 2010 4
Oil Price Deregulation | Event Update
Exhibit 3: Change in under recoveries on account of EGoM's decision for FY2011EPPPPParticularsarticularsarticularsarticularsarticulars PPPPPre price revision (Rs cr)re price revision (Rs cr)re price revision (Rs cr)re price revision (Rs cr)re price revision (Rs cr) PPPPPost price revision (Rs cr)ost price revision (Rs cr)ost price revision (Rs cr)ost price revision (Rs cr)ost price revision (Rs cr) % change% change% change% change% change
HSD 27,602 16,465 (40)
MS 6,923 1,731 (75)
TTTTTotal auto fuelsotal auto fuelsotal auto fuelsotal auto fuelsotal auto fuels 34,52534,52534,52534,52534,525 18,19618,19618,19618,19618,196 (47)(47)(47)(47)(47)
LPG 20,772 18,125 (13)
Kerosene 21,917 18,196 (17)
TTTTTotal cooking fuelsotal cooking fuelsotal cooking fuelsotal cooking fuelsotal cooking fuels 42,68842,68842,68842,68842,688 36,32036,32036,32036,32036,320 (15)(15)(15)(15)(15)
TTTTTotal under recoveriesotal under recoveriesotal under recoveriesotal under recoveriesotal under recoveries 77,21377,21377,21377,21377,213 54,51654,51654,51654,51654,516 (29)(29)(29)(29)(29)Source: Angel Research
The government's move to increase petro products' prices will also affect underrecoveries in FY2012E. However, the amount of under recoveries in FY2012E is likelyto be contingent on the deregulation of diesel prices or otherwise; this would lead totwo scenarios:
If diesel prices are deregulated by FY2012EIf diesel prices are deregulated by FY2012EIf diesel prices are deregulated by FY2012EIf diesel prices are deregulated by FY2012EIf diesel prices are deregulated by FY2012E::::: The government has not provided theroadmap of the deregulation of diesel prices. However, we believe the same is contingenton headline inflation numbers going ahead. Given the expectation of moderation ininflation numbers, we foresee decontrol of diesel prices by the end of FY2011E.
Exhibit 4: Under recoveries for FY2012E (in case of diesel prices are deregulated)PPPPParticulars (Rs cr)articulars (Rs cr)articulars (Rs cr)articulars (Rs cr)articulars (Rs cr) FY2012E FY2012E FY2012E FY2012E FY2012E
HSD -
MS -
TTTTTotal auto fuelsotal auto fuelsotal auto fuelsotal auto fuelsotal auto fuels - - - - -
LPG 20,738
Kerosene 22,151
TTTTTotal cooking fuelsotal cooking fuelsotal cooking fuelsotal cooking fuelsotal cooking fuels 42,890 42,890 42,890 42,890 42,890
TTTTTotal under recoveriesotal under recoveriesotal under recoveriesotal under recoveriesotal under recoveries 42,890 42,890 42,890 42,890 42,890Source: Angel Research
Government continues to control diesel prices:Government continues to control diesel prices:Government continues to control diesel prices:Government continues to control diesel prices:Government continues to control diesel prices: If the government is unable to increasediesel prices going ahead, under recovery in diesel will continue to exist. Thus, inaddition to a subsidy on cooking fuels, there will be a subsidy on diesel as well. Thiswill result in overall under recoveries of Rs55,118cr (in line with the subsidies expectedin FY2011E).
Exhibit 5: Under recoveries for FY2012E (in case of diesel prices are not deregulated)PPPPParticulars (Rs cr)articulars (Rs cr)articulars (Rs cr)articulars (Rs cr)articulars (Rs cr) FY2012E FY2012E FY2012E FY2012E FY2012E
HSD 12,228
MS -
TTTTTotal auto fuelsotal auto fuelsotal auto fuelsotal auto fuelsotal auto fuels 12,228 12,228 12,228 12,228 12,228
LPG 20,738
Kerosene 22,151
TTTTTotal cooking fuelsotal cooking fuelsotal cooking fuelsotal cooking fuelsotal cooking fuels 42,890 42,890 42,890 42,890 42,890
TTTTTotal under recoveriesotal under recoveriesotal under recoveriesotal under recoveriesotal under recoveries 55,118 55,118 55,118 55,118 55,118Source: Angel Research
June 28, 2010 5
Oil Price Deregulation | Event Update
However, given the likely softening of inflation going ahead, we believe the government
will deregulate diesel prices. This will reduce under recoveries to manageable levels.
In our view, the government will share 50% of the total under recoveries under the
scenario, while upstream companies will be asked to share the remaining (50%).
Thus, downstream companies will not be required to share the subsidy burden going
ahead. Our estimates are factoring similar subsidy-sharing mechanism in the picture,
which in turn results in ONGC reporting net realisations of around US$58-60/bbls
and EPS of around Rs120-125/share.
Key issues to watch out in the near future
Time for deregulation of diesel:Time for deregulation of diesel:Time for deregulation of diesel:Time for deregulation of diesel:Time for deregulation of diesel: While the EGoM has deregulated petrol prices, we
believe the key event to watch out for going ahead will be the timeframe to deregulate
diesel prices. Under recoveries on petrol are less than 10% of the overall under
recoveries, the same on diesel are higher at 20% (on account of higher sales volume).
Thus, the timeframe regarding the deregulation of diesel must be known for better
clarity.
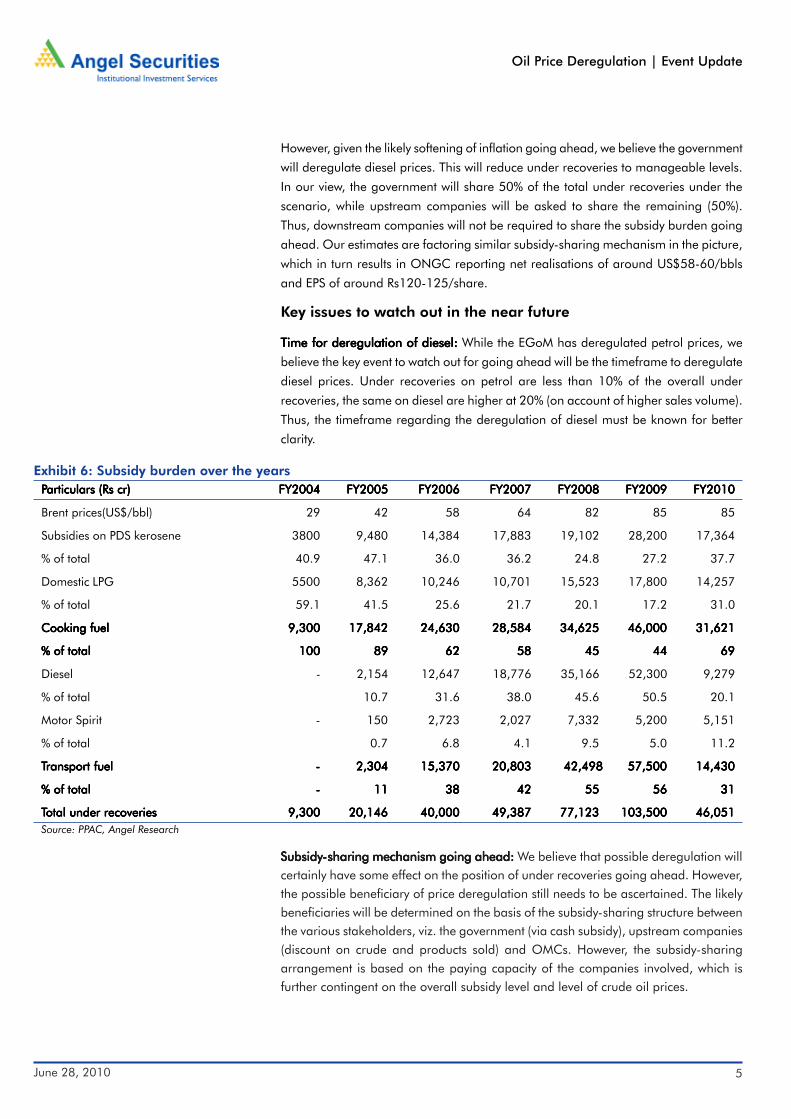
Exhibit 6: Subsidy burden over the yearsPPPPParticulars (Rs cr)articulars (Rs cr)articulars (Rs cr)articulars (Rs cr)articulars (Rs cr) FY2004FY2004FY2004FY2004FY2004 FY2005FY2005FY2005FY2005FY2005 FY2006FY2006FY2006FY2006FY2006 FY2007FY2007FY2007FY2007FY2007 FY2008FY2008FY2008FY2008FY2008 FY2009FY2009FY2009FY2009FY2009 FY2010FY2010FY2010FY2010FY2010
Brent prices(US$/bbl) 29 42 58 64 82 85 85
Subsidies on PDS kerosene 3800 9,480 14,384 17,883 19,102 28,200 17,364
% of total 40.9 47.1 36.0 36.2 24.8 27.2 37.7
Domestic LPG 5500 8,362 10,246 10,701 15,523 17,800 14,257
% of total 59.1 41.5 25.6 21.7 20.1 17.2 31.0
Cooking fuelCooking fuelCooking fuelCooking fuelCooking fuel 9,3009,3009,3009,3009,300 17,84217,84217,84217,84217,842 24,63024,63024,63024,63024,630 28,58428,58428,58428,58428,584 34,62534,62534,62534,62534,625 46,00046,00046,00046,00046,000 31,62131,62131,62131,62131,621
% of total% of total% of total% of total% of total 100100100100100 8989898989 6262626262 5858585858 4545454545 4444444444 6969696969
Diesel - 2,154 12,647 18,776 35,166 52,300 9,279
% of total 10.7 31.6 38.0 45.6 50.5 20.1
Motor Spirit - 150 2,723 2,027 7,332 5,200 5,151
% of total 0.7 6.8 4.1 9.5 5.0 11.2
TTTTTransport fuelransport fuelransport fuelransport fuelransport fuel - - - - - 2,304 2,304 2,304 2,304 2,304 15,370 15,370 15,370 15,370 15,370 20,803 20,803 20,803 20,803 20,803 42,498 42,498 42,498 42,498 42,498 57,500 57,500 57,500 57,500 57,500 14,430 14,430 14,430 14,430 14,430
% of total% of total% of total% of total% of total ----- 1111111111 3838383838 4242424242 5555555555 5656565656 3131313131
TTTTTotal under recoveriesotal under recoveriesotal under recoveriesotal under recoveriesotal under recoveries 9,3009,3009,3009,3009,300 20,14620,14620,14620,14620,146 40,00040,00040,00040,00040,000 49,38749,38749,38749,38749,387 77,12377,12377,12377,12377,123 103,500103,500103,500103,500103,500 46,05146,05146,05146,05146,051Source: PPAC, Angel Research
SubsidySubsidySubsidySubsidySubsidy-----sharing mechanism going ahead:sharing mechanism going ahead:sharing mechanism going ahead:sharing mechanism going ahead:sharing mechanism going ahead: We believe that possible deregulation willcertainly have some effect on the position of under recoveries going ahead. However,the possible beneficiary of price deregulation still needs to be ascertained. The likelybeneficiaries will be determined on the basis of the subsidy-sharing structure betweenthe various stakeholders, viz. the government (via cash subsidy), upstream companies(discount on crude and products sold) and OMCs. However, the subsidy-sharingarrangement is based on the paying capacity of the companies involved, which isfurther contingent on the overall subsidy level and level of crude oil prices.
June 28, 2010 6
Oil Price Deregulation | Event Update
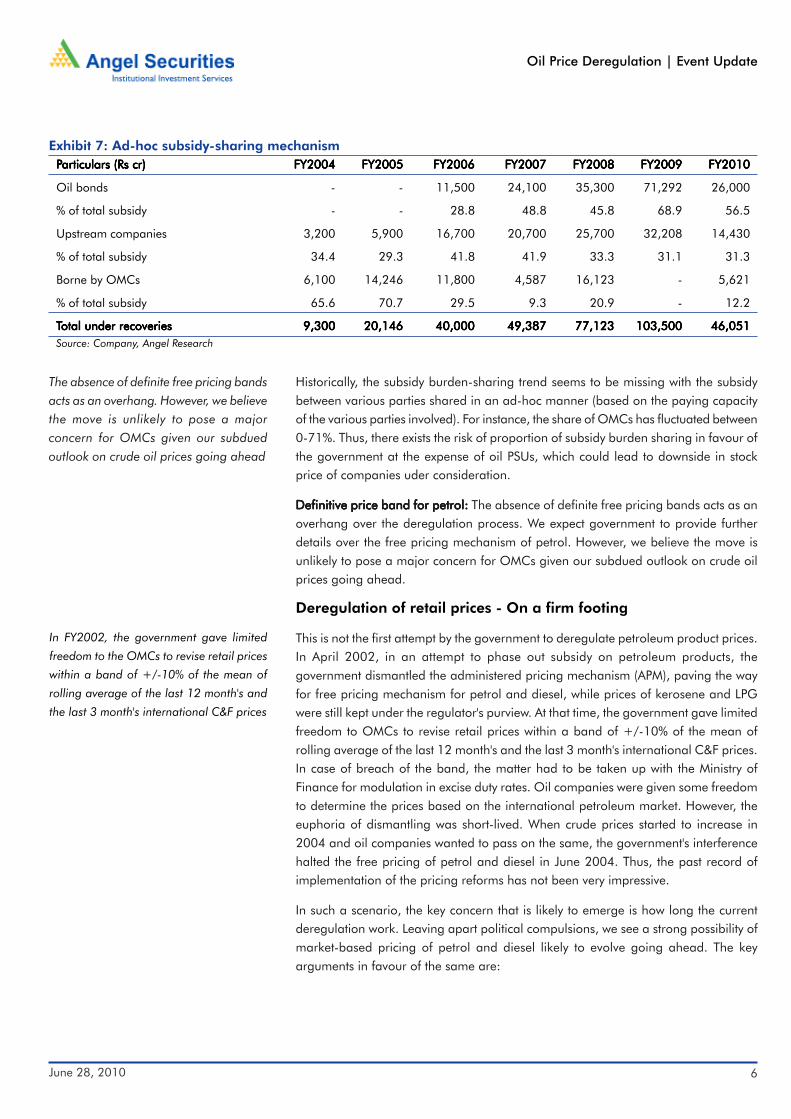
Historically, the subsidy burden-sharing trend seems to be missing with the subsidybetween various parties shared in an ad-hoc manner (based on the paying capacityof the various parties involved). For instance, the share of OMCs has fluctuated between0-71%. Thus, there exists the risk of proportion of subsidy burden sharing in favour ofthe government at the expense of oil PSUs, which could lead to downside in stockprice of companies uder consideration.
Definitive price band for petrol:Definitive price band for petrol:Definitive price band for petrol:Definitive price band for petrol:Definitive price band for petrol: The absence of definite free pricing bands acts as anoverhang over the deregulation process. We expect government to provide furtherdetails over the free pricing mechanism of petrol. However, we believe the move isunlikely to pose a major concern for OMCs given our subdued outlook on crude oilprices going ahead.
Deregulation of retail prices - On a firm footing
This is not the first attempt by the government to deregulate petroleum product prices.In April 2002, in an attempt to phase out subsidy on petroleum products, thegovernment dismantled the administered pricing mechanism (APM), paving the wayfor free pricing mechanism for petrol and diesel, while prices of kerosene and LPGwere still kept under the regulator's purview. At that time, the government gave limitedfreedom to OMCs to revise retail prices within a band of +/-10% of the mean ofrolling average of the last 12 month's and the last 3 month's international C&F prices.In case of breach of the band, the matter had to be taken up with the Ministry ofFinance for modulation in excise duty rates. Oil companies were given some freedomto determine the prices based on the international petroleum market. However, theeuphoria of dismantling was short-lived. When crude prices started to increase in2004 and oil companies wanted to pass on the same, the government's interferencehalted the free pricing of petrol and diesel in June 2004. Thus, the past record ofimplementation of the pricing reforms has not been very impressive.
In such a scenario, the key concern that is likely to emerge is how long the currentderegulation work. Leaving apart political compulsions, we see a strong possibility ofmarket-based pricing of petrol and diesel likely to evolve going ahead. The keyarguments in favour of the same are:
Exhibit 7: Ad-hoc subsidy-sharing mechanismPPPPParticulars (Rs cr)articulars (Rs cr)articulars (Rs cr)articulars (Rs cr)articulars (Rs cr) FY2004FY2004FY2004FY2004FY2004 FY2005FY2005FY2005FY2005FY2005 FY2006FY2006FY2006FY2006FY2006 FY2007FY2007FY2007FY2007FY2007 FY2008FY2008FY2008FY2008FY2008 FY2009FY2009FY2009FY2009FY2009 FY2010FY2010FY2010FY2010FY2010
Oil bonds - - 11,500 24,100 35,300 71,292 26,000
% of total subsidy - - 28.8 48.8 45.8 68.9 56.5
Upstream companies 3,200 5,900 16,700 20,700 25,700 32,208 14,430
% of total subsidy 34.4 29.3 41.8 41.9 33.3 31.1 31.3
Borne by OMCs 6,100 14,246 11,800 4,587 16,123 - 5,621
% of total subsidy 65.6 70.7 29.5 9.3 20.9 - 12.2
TTTTTotal under recoveriesotal under recoveriesotal under recoveriesotal under recoveriesotal under recoveries 9,3009,3009,3009,3009,300 20,14620,14620,14620,14620,146 40,00040,00040,00040,00040,000 49,38749,38749,38749,38749,387 77,12377,12377,12377,12377,123 103,500103,500103,500103,500103,500 46,05146,05146,05146,05146,051Source: Company, Angel Research
In FY2002, the government gave limited
freedom to the OMCs to revise retail prices
within a band of +/-10% of the mean of
rolling average of the last 12 month's and
the last 3 month's international C&F prices
The absence of definite free pricing bandsacts as an overhang. However, we believethe move is unlikely to pose a majorconcern for OMCs given our subduedoutlook on crude oil prices going ahead
June 28, 2010 7
Oil Price Deregulation | Event Update
Subdued outlook on crude prices:Subdued outlook on crude prices:Subdued outlook on crude prices:Subdued outlook on crude prices:Subdued outlook on crude prices: We expect crude oil prices to be range-bounded inthe near future, on account of relatively subdued demand outlook in OECD countries,along with growth in production of NGL by OPEC countries. On account of the same,we expect crude oil prices to average US$75/bbls in FY2011E and FY2012E.Considering the same, the required changes in the price of petrol and diesel will notbe significant. Though there is no mention of the pricing band as was the case inerstwhile dismantling of APM, we believe the government is likely to provide pricingfreedom to OMCs until US$90/bbls (thus providing a tentative pricing freedom of15% from the current crude levels).
Headroom for further reforms:Headroom for further reforms:Headroom for further reforms:Headroom for further reforms:Headroom for further reforms: Even if crude oil prices were to register a significantincrease, we believe the government has certain levers in the form of reduction inexcise and custom duty to address the situation of under recoveries. Moreover, therecent statement by the petroleum minister also seems to suggest that the governmentwill also discuss the issue of the high state tax on petroleum products. Any favourabledevelopment on the issue could widen the headroom available for further correctivemeasures in the event of spiraling increases in crude oil prices. Also a clear policy ofsubsidy in high oil price environment would be positive.
Impact of deregulation on OMCs
We believe downstream oil companies (HPCL, BPCL and IOC) are likely to be keybeneficiaries of the deregulation on the following counts:
Reduction in overall subsidies to manageable limits:Reduction in overall subsidies to manageable limits:Reduction in overall subsidies to manageable limits:Reduction in overall subsidies to manageable limits:Reduction in overall subsidies to manageable limits: On account of the EGoM'srecommendation regarding the deregulation of petrol price coupled with theproposed deregulation of diesel price and increase in kerosene and domestic LPGprices, the overall subsidies are likely to subside to manageable limits.
Subdued outlook on crude oil prices
Improved profitability situation of upstream companies post the APM gas pricehike, enables them to bear a relatively higher subsidy burden
Government efforts towards divestment in IOC
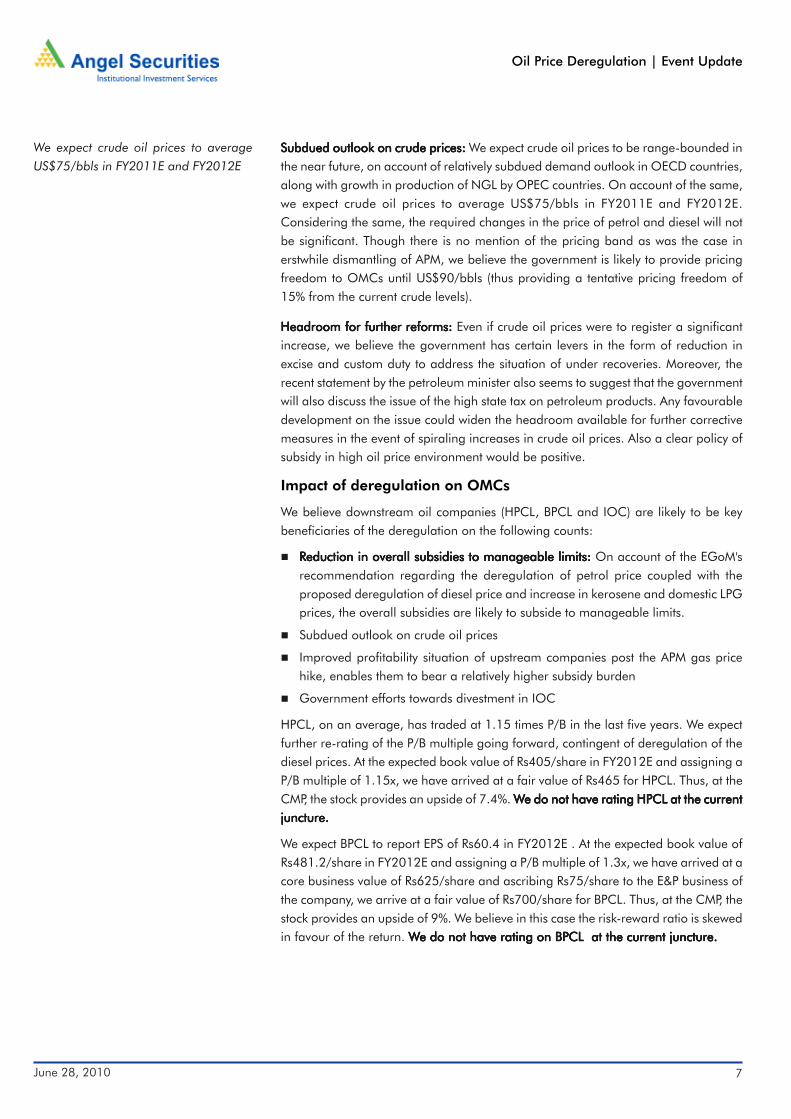
HPCL, on an average, has traded at 1.15 times P/B in the last five years. We expectfurther re-rating of the P/B multiple going forward, contingent of deregulation of thediesel prices. At the expected book value of Rs405/share in FY2012E and assigning aP/B multiple of 1.15x, we have arrived at a fair value of Rs465 for HPCL. Thus, at theCMP, the stock provides an upside of 7.4%. WWWWWe do not have rating HPCL at the currente do not have rating HPCL at the currente do not have rating HPCL at the currente do not have rating HPCL at the currente do not have rating HPCL at the currentjuncture.juncture.juncture.juncture.juncture.
We expect BPCL to report EPS of Rs60.4 in FY2012E . At the expected book value ofRs481.2/share in FY2012E and assigning a P/B multiple of 1.3x, we have arrived at acore business value of Rs625/share and ascribing Rs75/share to the E&P business ofthe company, we arrive at a fair value of Rs700/share for BPCL. Thus, at the CMP, thestock provides an upside of 9%. We believe in this case the risk-reward ratio is skewedin favour of the return. WWWWWe do not have rating on BPCL at the current juncture.e do not have rating on BPCL at the current juncture.e do not have rating on BPCL at the current juncture.e do not have rating on BPCL at the current juncture.e do not have rating on BPCL at the current juncture.
We expect crude oil prices to averageUS$75/bbls in FY2011E and FY2012E
June 28, 2010 8
Oil Price Deregulation | Event Update
Source: Company, Angel Research
Exhibit 8: Key Financials - BPCL
Y/E March (Rs cr) FY2009 FY2010E FY2011E FY2012E
Net SalesNet SalesNet SalesNet SalesNet Sales 135,252 135,252 135,252 135,252 135,252 123,817 123,817 123,817 123,817 123,817 131,001 131,001 131,001 131,001 131,001 152,760 152,760 152,760 152,760 152,760
% chg 22.1 (8.5) 5.8 16.6
Net PNet PNet PNet PNet Profitsrofitsrofitsrofitsrofits 634 634 634 634 634 1,632 1,632 1,632 1,632 1,632 1,740 1,740 1,740 1,740 1,740 2,184 2,184 2,184 2,184 2,184
% chg (66.8) 157.4 6.6 25.5
OPM (%) 2.9 2.4 2.9 3.1
EPS (Rs)EPS (Rs)EPS (Rs)EPS (Rs)EPS (Rs) 17.517.517.517.517.5 45.145.145.145.145.1 48.148.148.148.148.1 60.460.460.460.460.4
P/E (x) 36.6 14.2 13.4 10.6
P/BV (x) 1.0 1.6 1.4 1.3
RoE (%) 4.6 11.4 11.2 13.1
RoCE (%) 6.7 6.7 7.6 10.3
EV/Sales (x) 0.3 0.3 0.3 0.2
EV/EBITDA (x) 9.4 13.8 10.5 7.1
Source: Company, Angel Research
Exhibit 9: Key Financials - HPCL
Y/E March (Rs cr) FY2009 FY2010E FY2011E FY2012E
Net SalesNet SalesNet SalesNet SalesNet Sales 124,752 124,752 124,752 124,752 124,752 107,637 107,637 107,637 107,637 107,637 111,134 111,134 111,134 111,134 111,134 109,186 109,186 109,186 109,186 109,186
% chg 19.1 (13.7) 3.2 (1.8)
Net PNet PNet PNet PNet Profitsrofitsrofitsrofitsrofits 575 575 575 575 575 1,301 1,301 1,301 1,301 1,301 1,605 1,605 1,605 1,605 1,605 1,641 1,641 1,641 1,641 1,641
% chg (49.3) 126.3 23.3 2.3
OPM (%) 2.3 2.4 3.5 3.8
EPS (Rs)EPS (Rs)EPS (Rs)EPS (Rs)EPS (Rs) 17.017.017.017.017.0 38.438.438.438.438.4 47.347.347.347.347.3 48.448.448.448.448.4
P/E (x) 25.5 11.3 9.1 8.9
P/BV (x) 1.4 1.3 1.2 1.1
RoE (%) 5.4 11.7 13.3 12.5
RoCE (%) 5.9 3.8 6.6 6.6
EV/Sales (x) 0.2 0.2 0.2 0.2
EV/EBITDA (x) 8.2 8.2 5.4 5.0
June 28, 2010 9
Oil Price Deregulation | Event Update
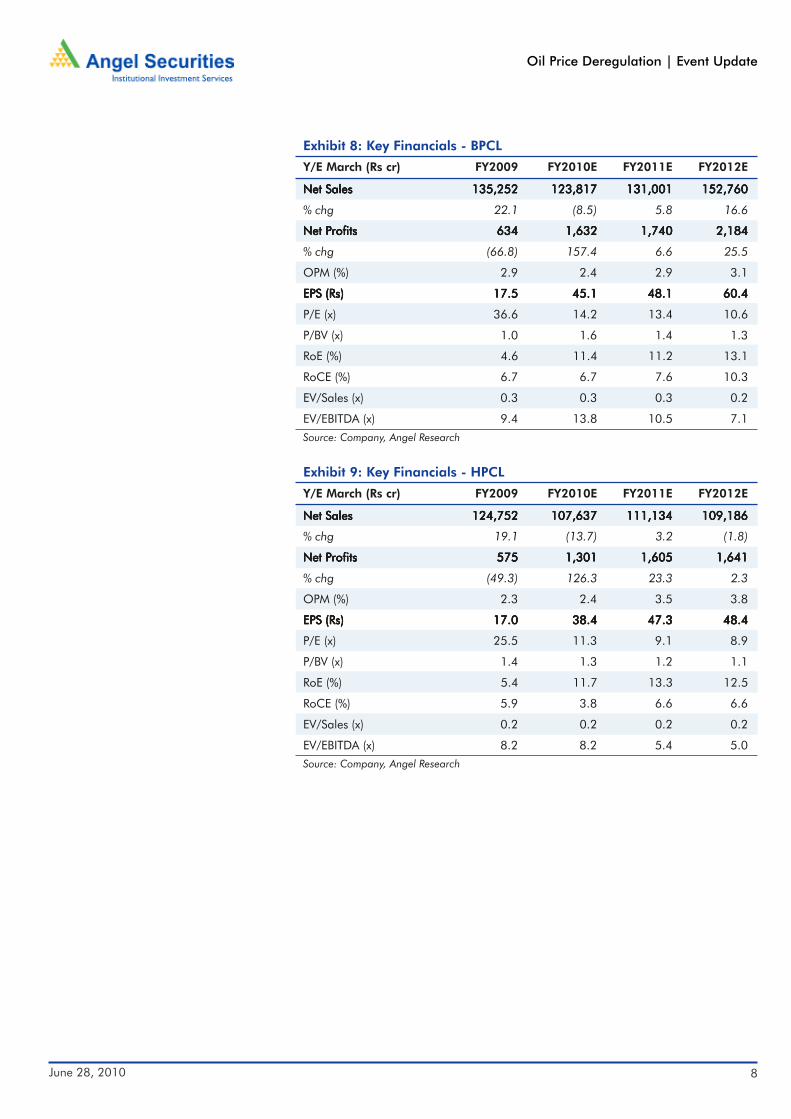
Impact of Auto fuel deregulation on ONGC
In case of upstream companies, we were already building in proposed moves, thesame was reflected in higher-than-consensus EPS estimates for ONGC. We expectONGC to report net realisation of around US$60/bbls (in FY2011E and FY2012E) asthe large part of the benefit on account of reduction in under recoveries is retained bythe government and OMCs. However, in case of ONGC, on the back of reduction inoverall under recoveries, the risk associated with variability in earnings estimates ofONGC has reduced to an extent. Therefore, we increase our target multiple for thecompany from 10x to 11x. At FY2012E EPS of Rs123.3/share, we arrive at a targetprice of 1356/share for ONGC, resulting in an upside of 3.9% from current levels.WWWWWe recommend Neutral rating on ONGC.e recommend Neutral rating on ONGC.e recommend Neutral rating on ONGC.e recommend Neutral rating on ONGC.e recommend Neutral rating on ONGC.
Source: Company, Angel Research
Exhibit 10: Key Financials - ONGC
Y/E March (Rs cr) FY2009 FY2010E FY2011E FY2012E
Net SalesNet SalesNet SalesNet SalesNet Sales 104,588 104,588 104,588 104,588 104,588 101,760 101,760 101,760 101,760 101,760 117,551 117,551 117,551 117,551 117,551 124,021 124,021 124,021 124,021 124,021
% chg 8.1 (2.7) 15.5 5.5
Net PNet PNet PNet PNet Profitsrofitsrofitsrofitsrofits 19,795 19,795 19,795 19,795 19,795 19,404 19,404 19,404 19,404 19,404 24,505 24,505 24,505 24,505 24,505 26,372 26,372 26,372 26,372 26,372
% chg (0.4) (2.0) 26.3 7.6
OPM (%) 41.3 43.7 44.9 46.1
EPS (Rs)EPS (Rs)EPS (Rs)EPS (Rs)EPS (Rs) 92.592.592.592.592.5 90.790.790.790.790.7 114.6114.6114.6114.6114.6 123.3123.3123.3123.3123.3
P/E (x) 14.1 14.4 11.4 10.6
P/BV (x) 3.0 2.7 2.4 2.1
RoE (%) 23.4 20.0 22.2 20.8
RoCE (%) 24.5 19.4 23.3 23.3
EV/Sales (x) 2.5 2.5 2.1 2.0
EV/EBITDA (x) 6.1 5.8 4.7 4.3
Impact of auto fuel deregulation on GAIL
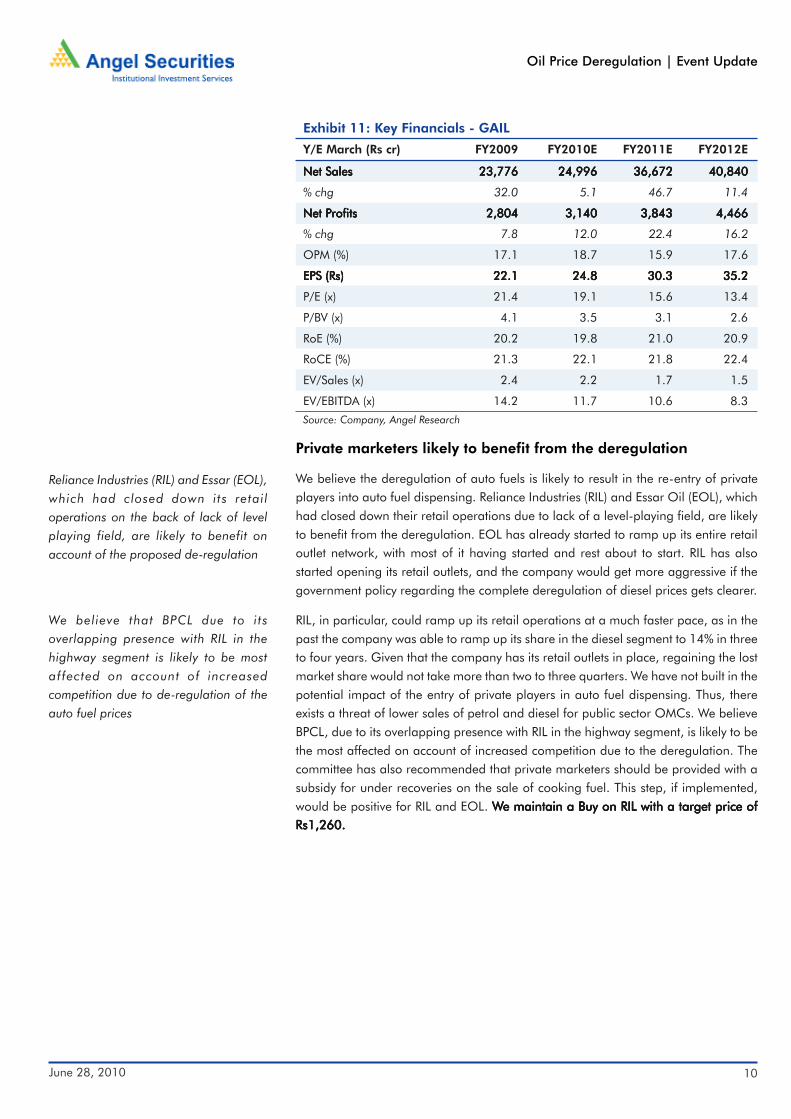
We were also pinning hopes on the announcement of the subsidy-sharing formulae;however, the absence of the same has left us a bit disappointed, as it makes it difficultto judge the beneficiaries of the move. The key decision regarding whether GAILshould be asked to share the subsidy burden or not is also not taken. The Kirit Parikhcommittee has recommended that there should not be any subsidy burden on GAIL.The committee perceived GAIL to be a distribution company rather than an upstreamcompany. Currently, we continue to build subsidy sharing by GAIL in our estimates.However, the Kirit Parikh committee recommendation if accepted would be significantlypositive for GAIL. WWWWWe maintain our estimates and recommend a Buy on GAIL with ae maintain our estimates and recommend a Buy on GAIL with ae maintain our estimates and recommend a Buy on GAIL with ae maintain our estimates and recommend a Buy on GAIL with ae maintain our estimates and recommend a Buy on GAIL with atarget price of Rs580.target price of Rs580.target price of Rs580.target price of Rs580.target price of Rs580.
We expect ONGC to report net realisationof around US$60/bbls (in FY2011E andFY2012E) as the large part of the benefiton account of reduction in underrecoveries is retained by the governmentand OMCs
The Kirit Parikh committee hasrecommended that there should not beany subsidy burden on GAIL. The move ifaccepted would be significantly positivefor GAIL
June 28, 2010 10
Oil Price Deregulation | Event Update
Private marketers likely to benefit from the deregulation
We believe the deregulation of auto fuels is likely to result in the re-entry of privateplayers into auto fuel dispensing. Reliance Industries (RIL) and Essar Oil (EOL), whichhad closed down their retail operations due to lack of a level-playing field, are likelyto benefit from the deregulation. EOL has already started to ramp up its entire retailoutlet network, with most of it having started and rest about to start. RIL has alsostarted opening its retail outlets, and the company would get more aggressive if thegovernment policy regarding the complete deregulation of diesel prices gets clearer.
RIL, in particular, could ramp up its retail operations at a much faster pace, as in thepast the company was able to ramp up its share in the diesel segment to 14% in threeto four years. Given that the company has its retail outlets in place, regaining the lostmarket share would not take more than two to three quarters. We have not built in thepotential impact of the entry of private players in auto fuel dispensing. Thus, thereexists a threat of lower sales of petrol and diesel for public sector OMCs. We believeBPCL, due to its overlapping presence with RIL in the highway segment, is likely to bethe most affected on account of increased competition due to the deregulation. Thecommittee has also recommended that private marketers should be provided with asubsidy for under recoveries on the sale of cooking fuel. This step, if implemented,would be positive for RIL and EOL. WWWWWe maintain a Buy on RIL with a target price ofe maintain a Buy on RIL with a target price ofe maintain a Buy on RIL with a target price ofe maintain a Buy on RIL with a target price ofe maintain a Buy on RIL with a target price ofRs1,260.Rs1,260.Rs1,260.Rs1,260.Rs1,260.
Source: Company, Angel Research
Exhibit 11: Key Financials - GAIL
Y/E March (Rs cr) FY2009 FY2010E FY2011E FY2012E
Net SalesNet SalesNet SalesNet SalesNet Sales 23,776 23,776 23,776 23,776 23,776 24,996 24,996 24,996 24,996 24,996 36,672 36,672 36,672 36,672 36,672 40,840 40,840 40,840 40,840 40,840
% chg 32.0 5.1 46.7 11.4
Net PNet PNet PNet PNet Profitsrofitsrofitsrofitsrofits 2,804 2,804 2,804 2,804 2,804 3,140 3,140 3,140 3,140 3,140 3,843 3,843 3,843 3,843 3,843 4,466 4,466 4,466 4,466 4,466
% chg 7.8 12.0 22.4 16.2
OPM (%) 17.1 18.7 15.9 17.6
EPS (Rs)EPS (Rs)EPS (Rs)EPS (Rs)EPS (Rs) 22.122.122.122.122.1 24.824.824.824.824.8 30.330.330.330.330.3 35.235.235.235.235.2
P/E (x) 21.4 19.1 15.6 13.4
P/BV (x) 4.1 3.5 3.1 2.6
RoE (%) 20.2 19.8 21.0 20.9
RoCE (%) 21.3 22.1 21.8 22.4
EV/Sales (x) 2.4 2.2 1.7 1.5
EV/EBITDA (x) 14.2 11.7 10.6 8.3
Reliance Industries (RIL) and Essar (EOL),which had closed down its retailoperations on the back of lack of levelplaying field, are likely to benefit onaccount of the proposed de-regulation
We believe that BPCL due to itsoverlapping presence with RIL in thehighway segment is likely to be mostaffected on account of increasedcompetition due to de-regulation of theauto fuel prices

June 28, 2010 11
Oil Price Deregulation | Event Update
Source: Company, Angel Research
Exhibit 12: One-Year Forward P/BV of GAIL
0.6x 1.2x 1.8x 2.4x 3.0x
0
100
200
300
400
500
600
Apr-04 Dec-04 Aug-05 Apr-06 Dec-06 Aug-07 Apr-08 Dec-08 Aug-09 Apr-10
Share
Pric
e(R
s)
Source: Company, Angel Research
Exhibit 13: One-Year Forward P/BV of ONGC
0.6x 1.2x 1.8x 2.4x 3.0x
0
200
400
600
800
1,000
1,200
1,400
1,600
1,800
2,000
Apr-04 Dec-04 Aug-05 Apr-06 Dec-06 Aug-07 Apr-08 Dec-08 Aug-09 Apr-10
Share
Pric
e(R
s)

June 28, 2010 12
Oil Price Deregulation | Event Update
Source: Company, Angel Research
Exhibit 14: One-Year Forward P/BV of BPCL
0
100
200
300
400
500
600
700
800
900
1,000
Apr-04 Dec-04 Aug-05 Apr-06 Dec-06 Aug-07 Apr-08 Dec-08 Aug-09 Apr-10
0.4x 0.8x 1.2x 1.6x 2.0x
Share
Pric
e(R
s)
Source: Company, Angel Research
Exhibit 15: One-Year Forward P/BV of HPCL
Share
Pric
e(R
s)
0
100
200
300
400
500
600
700
800
Apr-04 Dec-04 Aug-05 Apr-06 Dec-06 Aug-07 Apr-08 Dec-08 Aug-09 Apr-10
0.4x 0.8x 1.2x 1.6x 2.0x
June 28, 2010 13
Oil Price Deregulation | Event Update
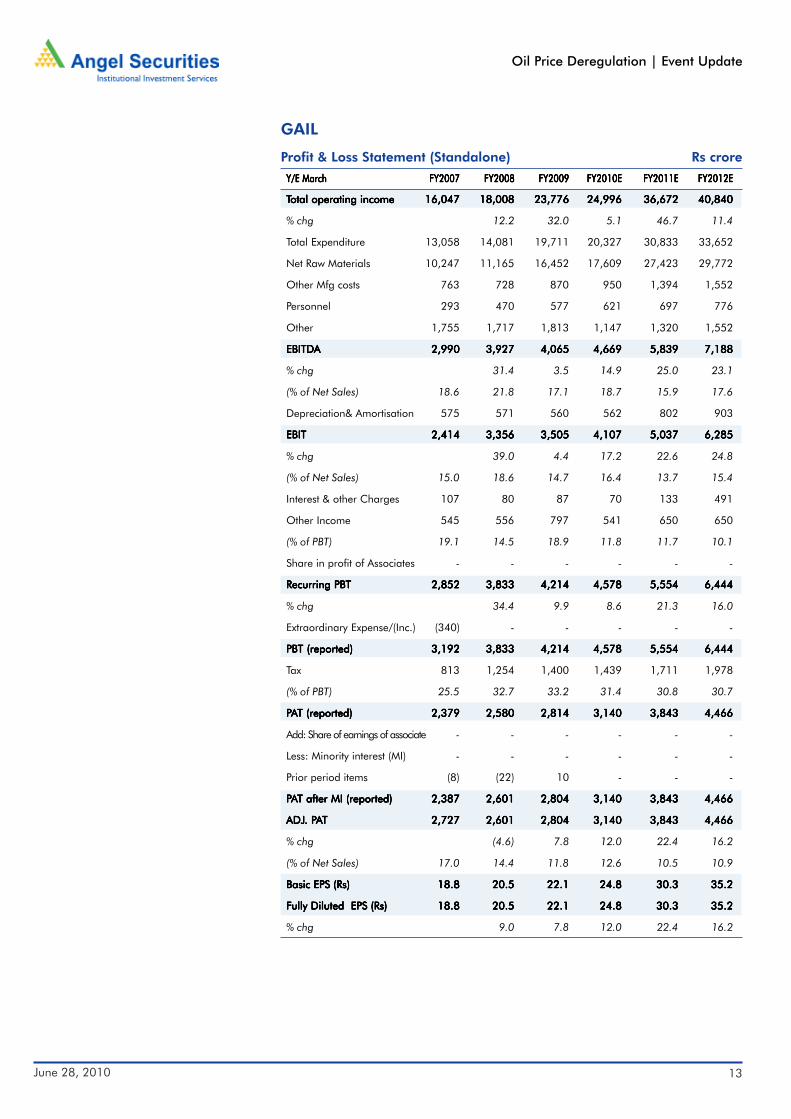
GAIL
Profit & Loss Statement (Standalone) Rs crore
Y/E MarchY/E MarchY/E MarchY/E MarchY/E March FY2007FY2007FY2007FY2007FY2007 FY2008FY2008FY2008FY2008FY2008 FY2009FY2009FY2009FY2009FY2009 FY2010EFY2010EFY2010EFY2010EFY2010E FY2011EFY2011EFY2011EFY2011EFY2011E FY2012EFY2012EFY2012EFY2012EFY2012E
TTTTTotal operating incomeotal operating incomeotal operating incomeotal operating incomeotal operating income 16,047 16,047 16,047 16,047 16,047 18,008 18,008 18,008 18,008 18,008 23,776 23,776 23,776 23,776 23,776 24,996 24,996 24,996 24,996 24,996 36,672 36,672 36,672 36,672 36,672 40,840 40,840 40,840 40,840 40,840
% chg 12.2 32.0 5.1 46.7 11.4
Total Expenditure 13,058 14,081 19,711 20,327 30,833 33,652
Net Raw Materials 10,247 11,165 16,452 17,609 27,423 29,772
Other Mfg costs 763 728 870 950 1,394 1,552
Personnel 293 470 577 621 697 776
Other 1,755 1,717 1,813 1,147 1,320 1,552
EBITDEBITDEBITDEBITDEBITDAAAAA 2,990 2,990 2,990 2,990 2,990 3,927 3,927 3,927 3,927 3,927 4,065 4,065 4,065 4,065 4,065 4,669 4,669 4,669 4,669 4,669 5,839 5,839 5,839 5,839 5,839 7,188 7,188 7,188 7,188 7,188
% chg 31.4 3.5 14.9 25.0 23.1
(% of Net Sales) 18.6 21.8 17.1 18.7 15.9 17.6
Depreciation& Amortisation 575 571 560 562 802 903
EBITEBITEBITEBITEBIT 2,414 2,414 2,414 2,414 2,414 3,356 3,356 3,356 3,356 3,356 3,505 3,505 3,505 3,505 3,505 4,107 4,107 4,107 4,107 4,107 5,037 5,037 5,037 5,037 5,037 6,285 6,285 6,285 6,285 6,285
% chg 39.0 4.4 17.2 22.6 24.8
(% of Net Sales) 15.0 18.6 14.7 16.4 13.7 15.4
Interest & other Charges 107 80 87 70 133 491
Other Income 545 556 797 541 650 650
(% of PBT) 19.1 14.5 18.9 11.8 11.7 10.1
Share in profit of Associates - - - - - -
Recurring PBTRecurring PBTRecurring PBTRecurring PBTRecurring PBT 2,852 2,852 2,852 2,852 2,852 3,833 3,833 3,833 3,833 3,833 4,214 4,214 4,214 4,214 4,214 4,578 4,578 4,578 4,578 4,578 5,554 5,554 5,554 5,554 5,554 6,444 6,444 6,444 6,444 6,444
% chg 34.4 9.9 8.6 21.3 16.0
Extraordinary Expense/(Inc.) (340) - - - - -
PBT (reported)PBT (reported)PBT (reported)PBT (reported)PBT (reported) 3,192 3,192 3,192 3,192 3,192 3,833 3,833 3,833 3,833 3,833 4,214 4,214 4,214 4,214 4,214 4,578 4,578 4,578 4,578 4,578 5,554 5,554 5,554 5,554 5,554 6,444 6,444 6,444 6,444 6,444
Tax 813 1,254 1,400 1,439 1,711 1,978
(% of PBT) 25.5 32.7 33.2 31.4 30.8 30.7
PPPPPAAAAAT (reported)T (reported)T (reported)T (reported)T (reported) 2,379 2,379 2,379 2,379 2,379 2,580 2,580 2,580 2,580 2,580 2,814 2,814 2,814 2,814 2,814 3,140 3,140 3,140 3,140 3,140 3,843 3,843 3,843 3,843 3,843 4,466 4,466 4,466 4,466 4,466
Add: Share of earnings of associate - - - - - -
Less: Minority interest (MI) - - - - - -
Prior period items (8) (22) 10 - - -
PPPPPAAAAAT after MI (reported)T after MI (reported)T after MI (reported)T after MI (reported)T after MI (reported) 2,387 2,387 2,387 2,387 2,387 2,601 2,601 2,601 2,601 2,601 2,804 2,804 2,804 2,804 2,804 3,140 3,140 3,140 3,140 3,140 3,843 3,843 3,843 3,843 3,843 4,466 4,466 4,466 4,466 4,466
ADJADJADJADJADJ. P. P. P. P. PAAAAATTTTT 2,727 2,727 2,727 2,727 2,727 2,601 2,601 2,601 2,601 2,601 2,804 2,804 2,804 2,804 2,804 3,140 3,140 3,140 3,140 3,140 3,843 3,843 3,843 3,843 3,843 4,466 4,466 4,466 4,466 4,466
% chg (4.6) 7.8 12.0 22.4 16.2
(% of Net Sales) 17.0 14.4 11.8 12.6 10.5 10.9
Basic EPS (Rs)Basic EPS (Rs)Basic EPS (Rs)Basic EPS (Rs)Basic EPS (Rs) 18.8 18.8 18.8 18.8 18.8 20.5 20.5 20.5 20.5 20.5 22.1 22.1 22.1 22.1 22.1 24.8 24.8 24.8 24.8 24.8 30.3 30.3 30.3 30.3 30.3 35.2 35.2 35.2 35.2 35.2
FFFFFully Diluted EPS (Rs)ully Diluted EPS (Rs)ully Diluted EPS (Rs)ully Diluted EPS (Rs)ully Diluted EPS (Rs) 18.8 18.8 18.8 18.8 18.8 20.5 20.5 20.5 20.5 20.5 22.1 22.1 22.1 22.1 22.1 24.8 24.8 24.8 24.8 24.8 30.3 30.3 30.3 30.3 30.3 35.2 35.2 35.2 35.2 35.2
% chg 9.0 7.8 12.0 22.4 16.2

June 28, 2010 14
Oil Price Deregulation | Event Update
Balance Sheet (Standalone) Rs crore
Y/E MarchY/E MarchY/E MarchY/E MarchY/E March FY2007FY2007FY2007FY2007FY2007 FY2008FY2008FY2008FY2008FY2008 FY2009FY2009FY2009FY2009FY2009 FY2010EFY2010EFY2010EFY2010EFY2010E FY2011EFY2011EFY2011EFY2011EFY2011E FY2012EFY2012EFY2012EFY2012EFY2012E
SOURCES OF FUNDSSOURCES OF FUNDSSOURCES OF FUNDSSOURCES OF FUNDSSOURCES OF FUNDS
Equity Share Capital 846 846 1,268 1,268 1,268 1,268
Reserves& Surplus 10,547 12,159 13,501 15,655 18,385 21,738
Shareholders FShareholders FShareholders FShareholders FShareholders Fundsundsundsundsunds 11,393 11,393 11,393 11,393 11,393 13,005 13,005 13,005 13,005 13,005 14,770 14,770 14,770 14,770 14,770 16,924 16,924 16,924 16,924 16,924 19,653 19,653 19,653 19,653 19,653 23,006 23,006 23,006 23,006 23,006
Minority Interest - - - - - -
Total Loans 1,338 1,266 1,200 1,480 5,300 5,300
Deferred Tax Liability 1,319 1,320 1,326 1,390 1,435 1,480
TTTTTotal Liabilitiesotal Liabilitiesotal Liabilitiesotal Liabilitiesotal Liabilities 14,049 14,049 14,049 14,049 14,049 15,590 15,590 15,590 15,590 15,590 17,296 17,296 17,296 17,296 17,296 19,794 19,794 19,794 19,794 19,794 26,388 26,388 26,388 26,388 26,388 29,786 29,786 29,786 29,786 29,786
APPLICAAPPLICAAPPLICAAPPLICAAPPLICATION OF FUNDSTION OF FUNDSTION OF FUNDSTION OF FUNDSTION OF FUNDS
Gross Block 14,933 16,958 17,604 17,904 22,904 24,404
Less: Acc. Depreciation 7,478 8,025 8,554 9,115 9,917 10,820
Net BlockNet BlockNet BlockNet BlockNet Block 7,454 7,454 7,454 7,454 7,454 8,933 8,933 8,933 8,933 8,933 9,050 9,050 9,050 9,050 9,050 8,789 8,789 8,789 8,789 8,789 12,987 12,987 12,987 12,987 12,987 13,584 13,584 13,584 13,584 13,584
Capital Work-in-Progress 1,937 817 2,426 2,688 6,188 7,688
Goodwill - - - - - -
InvestmentsInvestmentsInvestmentsInvestmentsInvestments 1,464 1,464 1,464 1,464 1,464 1,491 1,491 1,491 1,491 1,491 1,737 1,737 1,737 1,737 1,737 2,073 2,073 2,073 2,073 2,073 2,123 2,123 2,123 2,123 2,123 2,123 2,123 2,123 2,123 2,123
Current Assets 7,746 10,410 12,237 16,623 14,096 16,088
Cash 2,660 4,473 3,456 7,081 3,733 5,439
Loans & Advances 3,710 4,237 6,621 7,606 7,606 7,606
Other 1,375 1,700 2,159 1,935 2,756 3,043
Current liabilities 4,551 6,060 8,155 10,378 9,006 9,697
Net Current AssetsNet Current AssetsNet Current AssetsNet Current AssetsNet Current Assets 3,194 3,194 3,194 3,194 3,194 4,350 4,350 4,350 4,350 4,350 4,082 4,082 4,082 4,082 4,082 6,244 6,244 6,244 6,244 6,244 5,090 5,090 5,090 5,090 5,090 6,391 6,391 6,391 6,391 6,391
Mis. Exp. not written off - - - - - -
TTTTTotal Assetsotal Assetsotal Assetsotal Assetsotal Assets 14,049 14,049 14,049 14,049 14,049 15,590 15,590 15,590 15,590 15,590 17,296 17,296 17,296 17,296 17,296 19,794 19,794 19,794 19,794 19,794 26,388 26,388 26,388 26,388 26,388 29,786 29,786 29,786 29,786 29,786
June 28, 2010 15
Oil Price Deregulation | Event Update
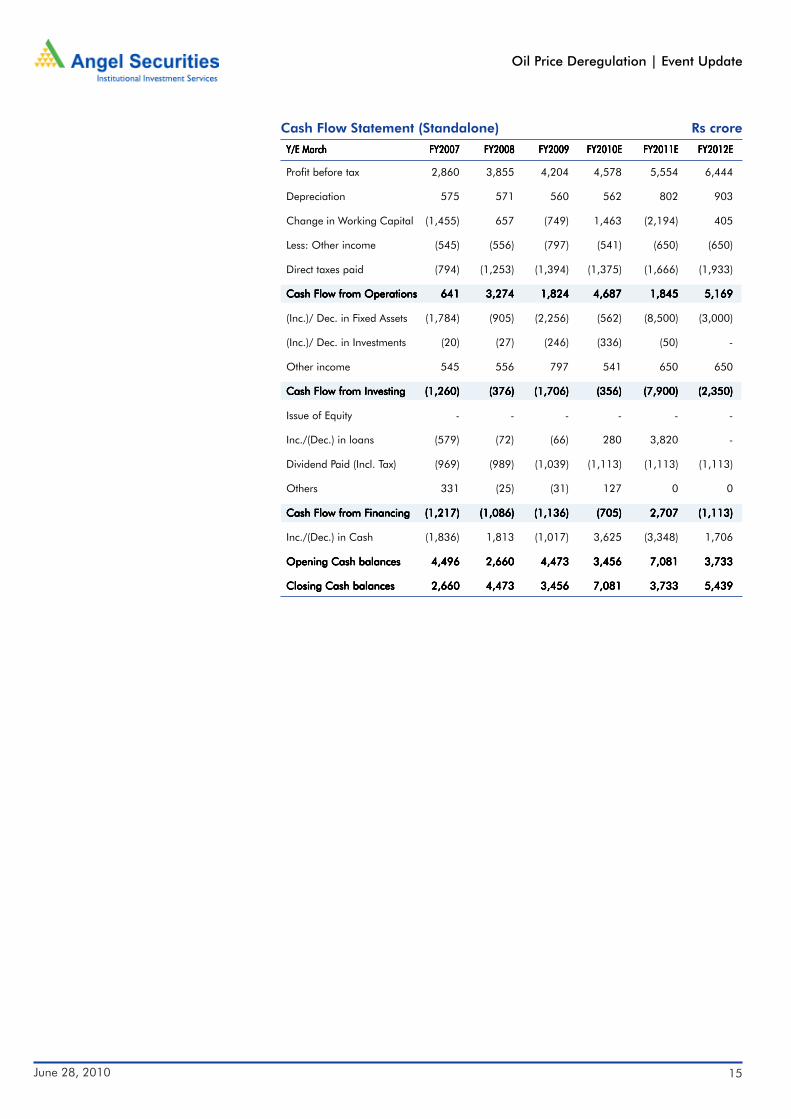
Cash Flow Statement (Standalone) Rs crore
Y/E MarchY/E MarchY/E MarchY/E MarchY/E March FY2007FY2007FY2007FY2007FY2007 FY2008FY2008FY2008FY2008FY2008 FY2009FY2009FY2009FY2009FY2009 FY2010EFY2010EFY2010EFY2010EFY2010E FY2011EFY2011EFY2011EFY2011EFY2011E FY2012EFY2012EFY2012EFY2012EFY2012E
Profit before tax 2,860 3,855 4,204 4,578 5,554 6,444
Depreciation 575 571 560 562 802 903
Change in Working Capital (1,455) 657 (749) 1,463 (2,194) 405
Less: Other income (545) (556) (797) (541) (650) (650)
Direct taxes paid (794) (1,253) (1,394) (1,375) (1,666) (1,933)
Cash Flow from OperationsCash Flow from OperationsCash Flow from OperationsCash Flow from OperationsCash Flow from Operations 641 641 641 641 641 3,274 3,274 3,274 3,274 3,274 1,824 1,824 1,824 1,824 1,824 4,687 4,687 4,687 4,687 4,687 1,845 1,845 1,845 1,845 1,845 5,169 5,169 5,169 5,169 5,169
(Inc.)/ Dec. in Fixed Assets (1,784) (905) (2,256) (562) (8,500) (3,000)
(Inc.)/ Dec. in Investments (20) (27) (246) (336) (50) -
Other income 545 556 797 541 650 650
Cash Flow from InvestingCash Flow from InvestingCash Flow from InvestingCash Flow from InvestingCash Flow from Investing (1,260) (1,260) (1,260) (1,260) (1,260) (376) (376) (376) (376) (376) (1,706) (1,706) (1,706) (1,706) (1,706) (356) (356) (356) (356) (356) (7,900) (7,900) (7,900) (7,900) (7,900) (2,350) (2,350) (2,350) (2,350) (2,350)
Issue of Equity - - - - - -
Inc./(Dec.) in loans (579) (72) (66) 280 3,820 -
Dividend Paid (Incl. Tax) (969) (989) (1,039) (1,113) (1,113) (1,113)
Others 331 (25) (31) 127 0 0
Cash Flow from FCash Flow from FCash Flow from FCash Flow from FCash Flow from Financinginancinginancinginancinginancing (1,217) (1,217) (1,217) (1,217) (1,217) (1,086) (1,086) (1,086) (1,086) (1,086) (1,136) (1,136) (1,136) (1,136) (1,136) (705) (705) (705) (705) (705) 2,707 2,707 2,707 2,707 2,707 (1,113) (1,113) (1,113) (1,113) (1,113)
Inc./(Dec.) in Cash (1,836) 1,813 (1,017) 3,625 (3,348) 1,706
Opening Cash balancesOpening Cash balancesOpening Cash balancesOpening Cash balancesOpening Cash balances 4,496 4,496 4,496 4,496 4,496 2,660 2,660 2,660 2,660 2,660 4,473 4,473 4,473 4,473 4,473 3,456 3,456 3,456 3,456 3,456 7,081 7,081 7,081 7,081 7,081 3,733 3,733 3,733 3,733 3,733
Closing Cash balancesClosing Cash balancesClosing Cash balancesClosing Cash balancesClosing Cash balances 2,660 2,660 2,660 2,660 2,660 4,473 4,473 4,473 4,473 4,473 3,456 3,456 3,456 3,456 3,456 7,081 7,081 7,081 7,081 7,081 3,733 3,733 3,733 3,733 3,733 5,439 5,439 5,439 5,439 5,439

June 28, 2010 16
Oil Price Deregulation | Event Update
Key Ratios
Y/E MarchY/E MarchY/E MarchY/E MarchY/E March FY2007FY2007FY2007FY2007FY2007 FY2008FY2008FY2008FY2008FY2008 FY2009FY2009FY2009FY2009FY2009 FY2010EFY2010EFY2010EFY2010EFY2010E FY2011EFY2011EFY2011EFY2011EFY2011E FY2012EFY2012EFY2012EFY2012EFY2012E
VVVVValuation Ratio (x)aluation Ratio (x)aluation Ratio (x)aluation Ratio (x)aluation Ratio (x)
P/E (on FDEPS) 25.7 23.5 21.8 19.5 15.9 13.7
P/CEPS 20.7 19.3 18.2 16.5 13.2 11.4
P/BV 5.4 4.7 4.1 3.6 3.1 2.7
Dividend yield (%) 1.4 1.4 1.5 1.6 1.6 1.6
EV/Sales 3.7 3.2 2.5 2.2 1.7 1.5
EV/EBITDA 20.0 14.8 14.5 11.9 10.8 8.5
EV/Total Assets 4.3 3.7 3.4 2.8 2.4 2.1
PPPPPer Share Data (Rs)er Share Data (Rs)er Share Data (Rs)er Share Data (Rs)er Share Data (Rs)
EPS (Basic) 18.8 20.5 22.1 24.8 30.3 35.2
EPS (fully diluted) 18.8 20.5 22.1 24.8 30.3 35.2
Cash EPS 23.4 25.0 26.5 29.2 36.6 42.3
DPS 6.7 6.7 7.0 7.5 7.5 7.5
Book Value 89.8 102.5 116.4 133.4 154.9 181.4
Dupont Analysis (%)Dupont Analysis (%)Dupont Analysis (%)Dupont Analysis (%)Dupont Analysis (%)
EBIT margin 15.0 18.6 14.7 16.4 13.7 15.4
Tax retention ratio 71.8 67.7 66.9 68.6 69.2 69.3
Asset turnover (x) 1.6 1.6 1.9 1.9 2.1 1.7
ROIC (Post-tax) 17.3 20.2 18.8 21.2 19.7 18.5
Cost of Debt (Post Tax) - - - - 2.7 6.4
Leverage (x) - - - - (0.1) 0.0
Operating ROE 17.3 20.2 18.8 21.2 18.0 18.9
Returns (%)Returns (%)Returns (%)Returns (%)Returns (%)
ROCE (Pre-tax) 17.7 22.6 21.3 22.1 21.8 22.4
Angel ROIC (Pre-tax) 27.5 34.0 32.3 38.3 38.0 37.9
ROE 22.3 21.3 20.2 19.8 21.0 20.9
TTTTTurnover ratios (x)urnover ratios (x)urnover ratios (x)urnover ratios (x)urnover ratios (x)
Asset Turnover (Gross Block) 13.7 13.4 15.0 17.7 8.1 7.1
Inventory / Sales (days) 11.8 11.4 9.0 9.0 7.7 8.5
Receivables (days) 17.6 18.9 19.8 20.4 15.6 17.3
Payables (days) 80.4 77.1 69.8 86.4 68.7 69.0
WC cycle (ex-cash) (days) (4.4) 4.2 3.9 (1.5) 2.6 10.3
Solvency ratios (x)Solvency ratios (x)Solvency ratios (x)Solvency ratios (x)Solvency ratios (x)
Net debt to equity (0.1) (0.2) (0.2) (0.3) 0.1 (0.0)
Net debt to EBITDA (0.4) (0.8) (0.6) (1.2) 0.3 (0.0)
Interest Coverage (EBIT/Interest) 22.5 42.2 40.3 58.7 37.8 12.8
June 28, 2010 17
Oil Price Deregulation | Event Update
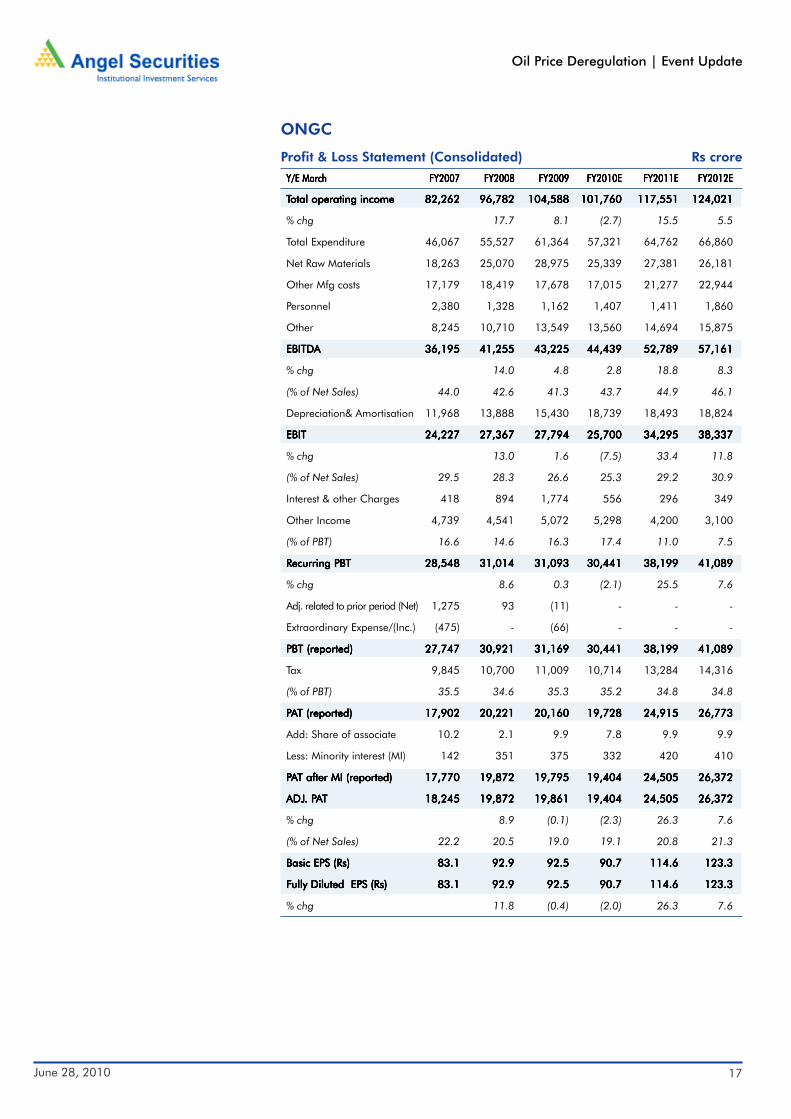
ONGC
Profit & Loss Statement (Consolidated) Rs crore
Y/E MarchY/E MarchY/E MarchY/E MarchY/E March FY2007FY2007FY2007FY2007FY2007 FY2008FY2008FY2008FY2008FY2008 FY2009FY2009FY2009FY2009FY2009 FY2010EFY2010EFY2010EFY2010EFY2010E FY2011EFY2011EFY2011EFY2011EFY2011E FY2012EFY2012EFY2012EFY2012EFY2012E
TTTTTotal operating incomeotal operating incomeotal operating incomeotal operating incomeotal operating income 82,262 82,262 82,262 82,262 82,262 96,782 96,782 96,782 96,782 96,782 104,588 104,588 104,588 104,588 104,588 101,760 101,760 101,760 101,760 101,760 117,551 117,551 117,551 117,551 117,551 124,021 124,021 124,021 124,021 124,021
% chg 17.7 8.1 (2.7) 15.5 5.5
Total Expenditure 46,067 55,527 61,364 57,321 64,762 66,860
Net Raw Materials 18,263 25,070 28,975 25,339 27,381 26,181
Other Mfg costs 17,179 18,419 17,678 17,015 21,277 22,944
Personnel 2,380 1,328 1,162 1,407 1,411 1,860
Other 8,245 10,710 13,549 13,560 14,694 15,875
EBITDEBITDEBITDEBITDEBITDAAAAA 36,195 36,195 36,195 36,195 36,195 41,255 41,255 41,255 41,255 41,255 43,225 43,225 43,225 43,225 43,225 44,439 44,439 44,439 44,439 44,439 52,789 52,789 52,789 52,789 52,789 57,161 57,161 57,161 57,161 57,161
% chg 14.0 4.8 2.8 18.8 8.3
(% of Net Sales) 44.0 42.6 41.3 43.7 44.9 46.1
Depreciation& Amortisation 11,968 13,888 15,430 18,739 18,493 18,824
EBITEBITEBITEBITEBIT 24,227 24,227 24,227 24,227 24,227 27,367 27,367 27,367 27,367 27,367 27,794 27,794 27,794 27,794 27,794 25,700 25,700 25,700 25,700 25,700 34,295 34,295 34,295 34,295 34,295 38,337 38,337 38,337 38,337 38,337
% chg 13.0 1.6 (7.5) 33.4 11.8
(% of Net Sales) 29.5 28.3 26.6 25.3 29.2 30.9
Interest & other Charges 418 894 1,774 556 296 349
Other Income 4,739 4,541 5,072 5,298 4,200 3,100
(% of PBT) 16.6 14.6 16.3 17.4 11.0 7.5
Recurring PBTRecurring PBTRecurring PBTRecurring PBTRecurring PBT 28,548 28,548 28,548 28,548 28,548 31,014 31,014 31,014 31,014 31,014 31,093 31,093 31,093 31,093 31,093 30,441 30,441 30,441 30,441 30,441 38,199 38,199 38,199 38,199 38,199 41,089 41,089 41,089 41,089 41,089
% chg 8.6 0.3 (2.1) 25.5 7.6
Adj. related to prior period (Net) 1,275 93 (11) - - -
Extraordinary Expense/(Inc.) (475) - (66) - - -
PBT (reported)PBT (reported)PBT (reported)PBT (reported)PBT (reported) 27,747 27,747 27,747 27,747 27,747 30,921 30,921 30,921 30,921 30,921 31,169 31,169 31,169 31,169 31,169 30,441 30,441 30,441 30,441 30,441 38,199 38,199 38,199 38,199 38,199 41,089 41,089 41,089 41,089 41,089
Tax 9,845 10,700 11,009 10,714 13,284 14,316
(% of PBT) 35.5 34.6 35.3 35.2 34.8 34.8
PPPPPAAAAAT (reported)T (reported)T (reported)T (reported)T (reported) 17,902 17,902 17,902 17,902 17,902 20,221 20,221 20,221 20,221 20,221 20,160 20,160 20,160 20,160 20,160 19,728 19,728 19,728 19,728 19,728 24,915 24,915 24,915 24,915 24,915 26,773 26,773 26,773 26,773 26,773
Add: Share of associate 10.2 2.1 9.9 7.8 9.9 9.9
Less: Minority interest (MI) 142 351 375 332 420 410
PPPPPAAAAAT after MI (reported)T after MI (reported)T after MI (reported)T after MI (reported)T after MI (reported) 17,770 17,770 17,770 17,770 17,770 19,872 19,872 19,872 19,872 19,872 19,795 19,795 19,795 19,795 19,795 19,404 19,404 19,404 19,404 19,404 24,505 24,505 24,505 24,505 24,505 26,372 26,372 26,372 26,372 26,372
ADJADJADJADJADJ. P. P. P. P. PAAAAATTTTT 18,245 18,245 18,245 18,245 18,245 19,872 19,872 19,872 19,872 19,872 19,861 19,861 19,861 19,861 19,861 19,404 19,404 19,404 19,404 19,404 24,505 24,505 24,505 24,505 24,505 26,372 26,372 26,372 26,372 26,372
% chg 8.9 (0.1) (2.3) 26.3 7.6
(% of Net Sales) 22.2 20.5 19.0 19.1 20.8 21.3
Basic EPS (Rs)Basic EPS (Rs)Basic EPS (Rs)Basic EPS (Rs)Basic EPS (Rs) 83.1 83.1 83.1 83.1 83.1 92.9 92.9 92.9 92.9 92.9 92.5 92.5 92.5 92.5 92.5 90.7 90.7 90.7 90.7 90.7 114.6 114.6 114.6 114.6 114.6 123.3 123.3 123.3 123.3 123.3
FFFFFully Diluted EPS (Rs)ully Diluted EPS (Rs)ully Diluted EPS (Rs)ully Diluted EPS (Rs)ully Diluted EPS (Rs) 83.1 83.1 83.1 83.1 83.1 92.9 92.9 92.9 92.9 92.9 92.5 92.5 92.5 92.5 92.5 90.7 90.7 90.7 90.7 90.7 114.6 114.6 114.6 114.6 114.6 123.3 123.3 123.3 123.3 123.3
% chg 11.8 (0.4) (2.0) 26.3 7.6

June 28, 2010 18
Oil Price Deregulation | Event Update
Balance Sheet (Consolidated) Rs crore
Y/E MarchY/E MarchY/E MarchY/E MarchY/E March FY2007FY2007FY2007FY2007FY2007 FY2008FY2008FY2008FY2008FY2008 FY2009FY2009FY2009FY2009FY2009 FY2010EFY2010EFY2010EFY2010EFY2010E FY2011EFY2011EFY2011EFY2011EFY2011E FY2012EFY2012EFY2012EFY2012EFY2012E
SOURCES OF FUNDSSOURCES OF FUNDSSOURCES OF FUNDSSOURCES OF FUNDSSOURCES OF FUNDS
Equity Share Capital 2,139 2,139 2,139 2,139 2,139 2,139
Preference Capital - - - - - -
Reserves& Surplus 64,575 75,948 90,085 100,980 116,727 134,091
Shareholders FShareholders FShareholders FShareholders FShareholders Fundsundsundsundsunds 66,714 66,714 66,714 66,714 66,714 78,087 78,087 78,087 78,087 78,087 92,224 92,224 92,224 92,224 92,224 103,119 103,119 103,119 103,119 103,119 118,866 118,866 118,866 118,866 118,866 136,230 136,230 136,230 136,230 136,230
Minority Interest 832 1,145 1,411 1,735 2,146 2,546
Total Loans 1,601 944 6,559 7,100 7,400 7,750
Deferred Tax Liability 8,112 8,738 9,223 10,379 10,679 11,029
Liability for abandonment cost 15,186 12,932 17,145 17,145 17,145 17,145
Total Liabilities 92,444 101,846 126,562 139,478 156,235 174,699
APPLICAAPPLICAAPPLICAAPPLICAAPPLICATION OF FUNDSTION OF FUNDSTION OF FUNDSTION OF FUNDSTION OF FUNDS
Gross Block 137,145 149,493 169,748 203,470 222,770 244,770
Less: Acc. Depreciation 83,436 93,825 105,955 124,694 133,787 143,711
Net BlockNet BlockNet BlockNet BlockNet Block 53,710 53,710 53,710 53,710 53,710 55,668 55,668 55,668 55,668 55,668 63,794 63,794 63,794 63,794 63,794 78,777 78,777 78,777 78,777 78,777 88,983 88,983 88,983 88,983 88,983 101,060 101,060 101,060 101,060 101,060
Capital Work-in-Progress 11,030 14,423 24,758 12,300 14,500 14,000
Goodwill 3,062 2,578 11,404 11,404 11,404 11,404
InvestmentsInvestmentsInvestmentsInvestmentsInvestments 3,583 3,583 3,583 3,583 3,583 4,482 4,482 4,482 4,482 4,482 3,480 3,480 3,480 3,480 3,480 3,480 3,480 3,480 3,480 3,480 3,480 3,480 3,480 3,480 3,480 3,480 3,480 3,480 3,480 3,480
Current Assets 38,840 47,534 50,715 59,499 65,161 71,664
Cash 20,676 25,056 22,596 30,433 35,757 41,403
Loans & Advances 6,736 7,068 13,264 13,264 13,264 13,264
Other 11,429 15,411 14,855 15,802 16,139 16,997
Current liabilities 18,296 23,513 28,239 26,633 27,944 27,559
Net Current AssetsNet Current AssetsNet Current AssetsNet Current AssetsNet Current Assets 20,545 20,545 20,545 20,545 20,545 24,022 24,022 24,022 24,022 24,022 22,476 22,476 22,476 22,476 22,476 32,867 32,867 32,867 32,867 32,867 37,217 37,217 37,217 37,217 37,217 44,105 44,105 44,105 44,105 44,105
Mis. Exp. not written off 514 674 651 651 651 651
TTTTTotal Assetsotal Assetsotal Assetsotal Assetsotal Assets 92,444 92,444 92,444 92,444 92,444 101,846 101,846 101,846 101,846 101,846 126,562 126,562 126,562 126,562 126,562 139,478 139,478 139,478 139,478 139,478 156,235 156,235 156,235 156,235 156,235 174,699 174,699 174,699 174,699 174,699

June 28, 2010 19
Oil Price Deregulation | Event Update
Cash Flow Statement (Consolidated) Rs crore
Y/E MarchY/E MarchY/E MarchY/E MarchY/E March FY2007FY2007FY2007FY2007FY2007 FY2008FY2008FY2008FY2008FY2008 FY2009FY2009FY2009FY2009FY2009 FY2010EFY2010EFY2010EFY2010EFY2010E FY2011EFY2011EFY2011EFY2011EFY2011E FY2012EFY2012EFY2012EFY2012EFY2012E
Profit before tax 28,548 31,014 31,093 30,441 38,199 41,089
Depreciation 7,864 9,078 8,779 18,739 9,093 9,924
(Incr)/ Decr in Misc Exp (148) (180) 1 - - -
Change in Working Capital 2,689 2,415 2,355 (2,515) 723 (1,492)
Less: Other income (2,115) (2,903) (3,238) (5,298) (4,200) (3,100)
Direct taxes paid (8,520) (10,508) (10,244) (9,558) (12,984) (13,966)
Cash Flow from OperationsCash Flow from OperationsCash Flow from OperationsCash Flow from OperationsCash Flow from Operations 28,318 28,318 28,318 28,318 28,318 28,915 28,915 28,915 28,915 28,915 28,746 28,746 28,746 28,746 28,746 31,810 31,810 31,810 31,810 31,810 30,832 30,832 30,832 30,832 30,832 32,454 32,454 32,454 32,454 32,454
(Inc.)/ Dec. in Fixed Assets (13,566) (16,814) (21,639) (21,264) (21,500) (21,500)
(Inc.)/ Dec. in Investments (2,212) (1,260) 902 - - -
(Inc.)/ Dec. in loans and adv 35 (1) (1,951) - - -
Other income 1,356 2,078 3,365 5,298 4,200 3,100
Cash Flow from InvestingCash Flow from InvestingCash Flow from InvestingCash Flow from InvestingCash Flow from Investing (14,387) (14,387) (14,387) (14,387) (14,387) (15,996) (15,996) (15,996) (15,996) (15,996) (19,323) (19,323) (19,323) (19,323) (19,323) (15,967) (15,967) (15,967) (15,967) (15,967) (17,300) (17,300) (17,300) (17,300) (17,300) (18,400) (18,400) (18,400) (18,400) (18,400)
Issue of Equity 703 166 - - - -
Inc./(Dec.) in loans (661) (598) 4,968 541 300 350
Dividend Paid (Incl. Tax) (7,695) (7,822) (8,103) (8,547) (8,508) (8,758)
Others 5,291 (285) (8,748) - - -
Cash Flow from FCash Flow from FCash Flow from FCash Flow from FCash Flow from Financinginancinginancinginancinginancing (2,361) (2,361) (2,361) (2,361) (2,361) (8,538) (8,538) (8,538) (8,538) (8,538) (11,883) (11,883) (11,883) (11,883) (11,883) (8,006) (8,006) (8,006) (8,006) (8,006) (8,208) (8,208) (8,208) (8,208) (8,208) (8,408) (8,408) (8,408) (8,408) (8,408)
Inc./(Dec.) in Cash 11,570 4,380 (2,460) 7,838 5,324 5,646
Opening Cash balancesOpening Cash balancesOpening Cash balancesOpening Cash balancesOpening Cash balances 9,106 9,106 9,106 9,106 9,106 20,676 20,676 20,676 20,676 20,676 25,056 25,056 25,056 25,056 25,056 22,596 22,596 22,596 22,596 22,596 30,433 30,433 30,433 30,433 30,433 35,757 35,757 35,757 35,757 35,757
Closing Cash balancesClosing Cash balancesClosing Cash balancesClosing Cash balancesClosing Cash balances 20,676 20,676 20,676 20,676 20,676 25,056 25,056 25,056 25,056 25,056 22,596 22,596 22,596 22,596 22,596 30,433 30,433 30,433 30,433 30,433 35,757 35,757 35,757 35,757 35,757 41,403 41,403 41,403 41,403 41,403
June 28, 2010 20
Oil Price Deregulation | Event Update
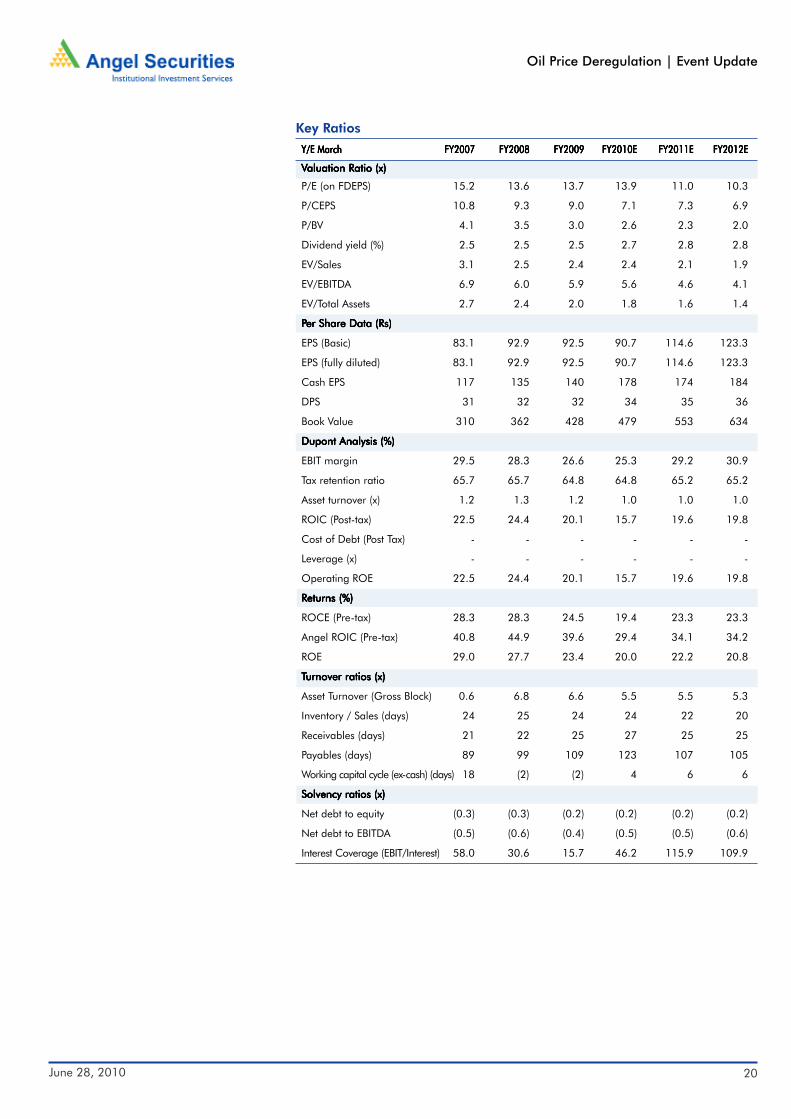
Key Ratios
Y/E MarchY/E MarchY/E MarchY/E MarchY/E March FY2007FY2007FY2007FY2007FY2007 FY2008FY2008FY2008FY2008FY2008 FY2009FY2009FY2009FY2009FY2009 FY2010EFY2010EFY2010EFY2010EFY2010E FY2011EFY2011EFY2011EFY2011EFY2011E FY2012EFY2012EFY2012EFY2012EFY2012E
VVVVValuation Ratio (x)aluation Ratio (x)aluation Ratio (x)aluation Ratio (x)aluation Ratio (x)
P/E (on FDEPS) 15.2 13.6 13.7 13.9 11.0 10.3
P/CEPS 10.8 9.3 9.0 7.1 7.3 6.9
P/BV 4.1 3.5 3.0 2.6 2.3 2.0
Dividend yield (%) 2.5 2.5 2.5 2.7 2.8 2.8
EV/Sales 3.1 2.5 2.4 2.4 2.1 1.9
EV/EBITDA 6.9 6.0 5.9 5.6 4.6 4.1
EV/Total Assets 2.7 2.4 2.0 1.8 1.6 1.4
PPPPPer Share Data (Rs)er Share Data (Rs)er Share Data (Rs)er Share Data (Rs)er Share Data (Rs)
EPS (Basic) 83.1 92.9 92.5 90.7 114.6 123.3
EPS (fully diluted) 83.1 92.9 92.5 90.7 114.6 123.3
Cash EPS 117 135 140 178 174 184
DPS 31 32 32 34 35 36
Book Value 310 362 428 479 553 634
Dupont Analysis (%)Dupont Analysis (%)Dupont Analysis (%)Dupont Analysis (%)Dupont Analysis (%)
EBIT margin 29.5 28.3 26.6 25.3 29.2 30.9
Tax retention ratio 65.7 65.7 64.8 64.8 65.2 65.2
Asset turnover (x) 1.2 1.3 1.2 1.0 1.0 1.0
ROIC (Post-tax) 22.5 24.4 20.1 15.7 19.6 19.8
Cost of Debt (Post Tax) - - - - - -
Leverage (x) - - - - - -
Operating ROE 22.5 24.4 20.1 15.7 19.6 19.8
Returns (%)Returns (%)Returns (%)Returns (%)Returns (%)
ROCE (Pre-tax) 28.3 28.3 24.5 19.4 23.3 23.3
Angel ROIC (Pre-tax) 40.8 44.9 39.6 29.4 34.1 34.2
ROE 29.0 27.7 23.4 20.0 22.2 20.8
TTTTTurnover ratios (x)urnover ratios (x)urnover ratios (x)urnover ratios (x)urnover ratios (x)
Asset Turnover (Gross Block) 0.6 6.8 6.6 5.5 5.5 5.3
Inventory / Sales (days) 24 25 24 24 22 20
Receivables (days) 21 22 25 27 25 25
Payables (days) 89 99 109 123 107 105
Working capital cycle (ex-cash) (days) 18 (2) (2) 4 6 6
Solvency ratios (x)Solvency ratios (x)Solvency ratios (x)Solvency ratios (x)Solvency ratios (x)
Net debt to equity (0.3) (0.3) (0.2) (0.2) (0.2) (0.2)
Net debt to EBITDA (0.5) (0.6) (0.4) (0.5) (0.5) (0.6)
Interest Coverage (EBIT/Interest) 58.0 30.6 15.7 46.2 115.9 109.9
Oil Price Deregulation
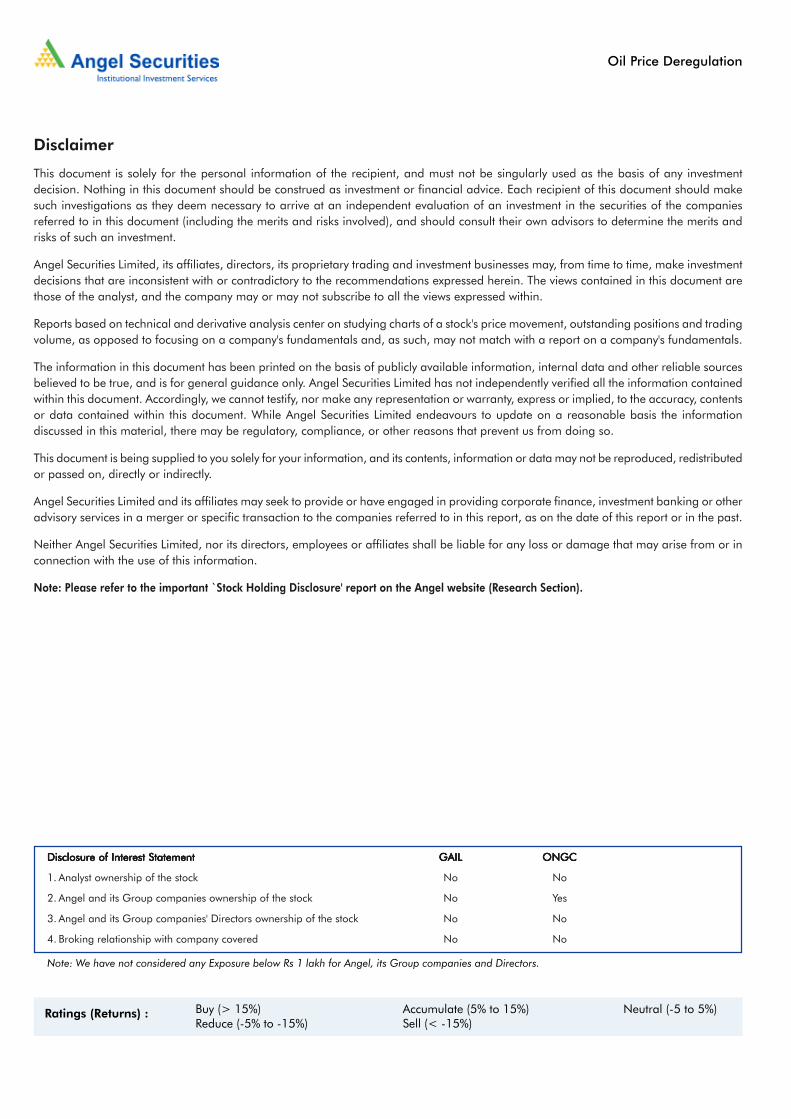
Buy (> 15%) Accumulate (5% to 15%) Neutral (-5 to 5%)Reduce (-5% to -15%) Sell (< -15%)
Ratings (Returns) :
Disclaimer
This document is solely for the personal information of the recipient, and must not be singularly used as the basis of any investmentdecision. Nothing in this document should be construed as investment or financial advice. Each recipient of this document should makesuch investigations as they deem necessary to arrive at an independent evaluation of an investment in the securities of the companiesreferred to in this document (including the merits and risks involved), and should consult their own advisors to determine the merits andrisks of such an investment.
Angel Securities Limited, its affiliates, directors, its proprietary trading and investment businesses may, from time to time, make investmentdecisions that are inconsistent with or contradictory to the recommendations expressed herein. The views contained in this document arethose of the analyst, and the company may or may not subscribe to all the views expressed within.
Reports based on technical and derivative analysis center on studying charts of a stock's price movement, outstanding positions and tradingvolume, as opposed to focusing on a company's fundamentals and, as such, may not match with a report on a company's fundamentals.
The information in this document has been printed on the basis of publicly available information, internal data and other reliable sourcesbelieved to be true, and is for general guidance only. Angel Securities Limited has not independently verified all the information containedwithin this document. Accordingly, we cannot testify, nor make any representation or warranty, express or implied, to the accuracy, contentsor data contained within this document. While Angel Securities Limited endeavours to update on a reasonable basis the informationdiscussed in this material, there may be regulatory, compliance, or other reasons that prevent us from doing so.
This document is being supplied to you solely for your information, and its contents, information or data may not be reproduced, redistributedor passed on, directly or indirectly.
Angel Securities Limited and its affiliates may seek to provide or have engaged in providing corporate finance, investment banking or otheradvisory services in a merger or specific transaction to the companies referred to in this report, as on the date of this report or in the past.
Neither Angel Securities Limited, nor its directors, employees or affiliates shall be liable for any loss or damage that may arise from or inconnection with the use of this information.
Note: Please refer to the important `Stock Holding Disclosure' report on the Angel website (Research Section).
Disclosure of Interest StatementDisclosure of Interest StatementDisclosure of Interest StatementDisclosure of Interest StatementDisclosure of Interest Statement GAILGAILGAILGAILGAIL ONGCONGCONGCONGCONGC
1. Analyst ownership of the stock No No
2. Angel and its Group companies ownership of the stock No Yes
3. Angel and its Group companies' Directors ownership of the stock No No
4. Broking relationship with company covered No No
Note: We have not considered any Exposure below Rs 1 lakh for Angel, its Group companies and Directors.
Oil Price Deregulation
Address: Acme Plaza, ‘A’ Wing, 3rd Floor, M.V. Road, Opp. Sangam Cinema, Andheri (E), Mumbai - 400 059.Tel : (022) 3952 4568 / 4040 3800
Angel Broking Ltd: BSE Sebi Regn No : INB 010996539 / CDSL Regn No: IN - DP - CDSL - 234 - 2004 / PMS Regn Code: PM/INP000001546 Angel Securities Ltd:BSE: INB010994639/INF010994639 NSE: INB230994635/INF230994635 Membership numbers: BSE 028/NSE:09946Angel Capital & Debt Market Ltd: INB 231279838 / NSE FNO: INF 231279838 / NSE Member code -12798 Angel Commodities Broking (P) Ltd: MCX Member ID: 12685 / FMC Regn No: MCX / TCM / CORP / 0037 NCDEX : Member ID 00220 / FMC Regn No: NCDEX / TCM / CORP / 0302
Research Team
Fundamental:
Sarabjit Kour Nangra VP-Research, Pharmaceutical [email protected]
Vaibhav Agrawal VP-Research, Banking [email protected]
Vaishali Jajoo Automobile [email protected]
Shailesh Kanani Infrastructure, Real Estate [email protected]
Anand Shah FMCG , Media [email protected]
Deepak Pareek Oil & Gas [email protected]
Puneet Bambha Capital Goods, Engineering [email protected]
Sushant Dalmia Pharmaceutical [email protected]
Rupesh Sankhe Cement, Power [email protected]
Param Desai Real Estate, Logistics, Shipping [email protected]
Sageraj Bariya Fertiliser, Mid-cap [email protected]
Viraj Nadkarni Retail, Hotels, Mid-cap [email protected]
Paresh Jain Metals & Mining [email protected]
Amit Rane Banking [email protected]
Jai Sharda Mid-cap [email protected]
Sharan Lillaney Mid-cap [email protected]
Amit Vora Research Associate (Oil & Gas) [email protected]
V Srinivasan Research Associate (Cement, Power) [email protected]
Aniruddha Mate Research Associate (Infra, Real Estate) [email protected]
Mihir Salot Research Associate (Logistics, Shipping) [email protected]
Chitrangda Kapur Research Associate (FMCG, Media) [email protected]
Vibha Salvi Research Associate (IT, Telecom) [email protected]
Pooja Jain Research Associate (Metals & Mining) [email protected]
Technicals:
Shardul Kulkarni Sr. Technical Analyst [email protected]
Mileen Vasudeo Technical Analyst [email protected]
Derivatives:
Siddarth Bhamre Head - Derivatives [email protected]
Jaya Agarwal Derivative Analyst [email protected]
Institutional Sales Team:
Mayuresh Joshi VP - Institutional Sales [email protected]
Abhimanyu Sofat AVP - Institutional Sales [email protected]
Nitesh Jalan Sr. Manager [email protected]
Pranav Modi Sr. Manager [email protected]
Sandeep Jangir Sr. Manager [email protected]
Ganesh Iyer Sr. Manager [email protected]
Jay Harsora Sr. Dealer [email protected]
Meenakshi Chavan Dealer [email protected]
Gaurang Tisani Dealer [email protected]
Production Team:
Bharathi Shetty Research Editor [email protected]
Bharat Patil Production [email protected]
Dilip Patel Production [email protected]