Embed Size (px)
Citation preview

TURKISH EQUITY MARKETS“BEARS ON PLAY”
(June 16, 2010)

2
TR BOND (as of June 16, 2010)
BOND. MONTHLY
Medium Term Expectations:• Excessive price movements unconfirmed by indicators are trading opportunities• We expect a rise in interest rates and still keep our “SELL” position for “10.50” target.

3
TR BOND (as of June 16, 2010)
BOND.intraday
Short Term Expectations:• We see: “expanding price movements” that indicates “fluctuations” • We expect interest rates going to “8.70 – 8.75” level for the indicator (optimized) is weaker than previous days

4
MARKET VIEW (as of June 16, 2010)
XU100. MONTHLY
Long Term Expectations:
• We are less “BULLISH” after June performance• Last signal is a “BUY” dated on May.2010 (@ 52.500)• Bearish trend duration expected: 1-2 weeks• We expect to be “BEARISH” @57.500 (where index is highly deviated from its moving average)
1
2

5
MARKET VIEW (as of June 16, 2010)
XU030/USD MONTHLY
Long Term Expectations:
• “BEARISH” pattern (not similar to XU100/TL)• Overbought conditions: support expected @30.000• Last signal as “SELL” in Apr.10 (@ 50.500)• Trend duration expected: 3-6 months

6
MARKET VIEW (as of June 16, 2010)
USD/TL MONTHLY
• We are more “BULLISH” as long as blue curve (1) stay above “0” level • Last signal as “BUY” in September.09 (@ 1.4650)• We expect to be more “BULLISH” as long as USD/TL stays over 1.5550 in June
1

7
HISTORIC PERFORMANCE: VIX030 daily (as of June 16, 2010)
• Correction time after excessive movements: although the indicator made new high of last days high deviation from average is “bullish” sign
• We expect price approaching to its moving average (first step)
• Our favoured “C-system” methodology has given a last signal as a SELL on 67.300 and continues remain bullish
Exhibit: Daily Chart vs. Our Recommendations
2
1

8
HISTORIC PERFORMANCE: VIX030 hourly (as of June 16, 2010)
• We are less “BULLISH” with last uptrend (15.06 – 16.06)
• We expect overbought market in several hours (intraday)
• Our favoured “C-system” methodology has given a last signal as a BUY on 70.900 and continues to remain bullish
Exhibit: Hourly Chart vs. Our Recommendations
2
1

9
BalticDRY vs ISE INDUSTRIALS (as of June 16, 2010) • We choose another indicator to analyze indexes ratio• The ratio has blurry signals: see the indicator near “0” : sign of horizantal trend.• Falling BDRY index limit ISE.IND positive momentum (they are highly correlated)• We think it will reach “0.11” level in 2010
Indexes are strongly correlated: R^2=0.82
10
CONTACT DETAILS
Cem Şengezer
Technical & Quantitative Analyst System Developer
GSM: 0532 382 85 92E-mail: [email protected]

11
RECOMMENDATIONS PERFORMANCE SUMMARY (as of June 16, 2010)
Quarterly Performance• Our model portfolio outperformed XU100 performance by 957% with high volume equities • We invested with equal capital to equities• Double digit gains relative to XU100 every quarter (47% on period average) (*)• Every period 4-5 equities are recommended to beat XU100• 8-10 transactions / quarter (average period for every equity is one quarter)• Max drawdown (occured at Q1.08): -24% (7 out of 28 recoms with negative performance)• portfolio performance average / portfolio standard deviation = 0,55• market performance average / market standard deviation = 0.14
* See next pages for details
AVERAGE GAIN / STD. DEVIATION
0,14
0,55
0,00
0,10
0,20
0,30
0,40
0,50
0,60
Model Portfolio Index
CUMULATIVE PERFORMANCE
0%
957%957%
0%
100%
200%
300%
400%
500%
600%
700%
800%
900%
1000%
Model Portfolio Index Relative
COMPARED PERFORMANCE CURVES
1057
100
100
17916912585
809
9548656370,24919875
100
1
10
100
1000
10000
2007 Q1.08 Q2.08 Q3.08 Q4.08 2009 2010
Model PortfolioXU100

12
RECOMMENDATIONS PERFORMANCE TABLE (as of June 16, 2010)
2008 (Q1) 2008 (Q2) 2008 (Q3) 2008 (Q4) 2009 2010 (YTD)
TCELL -%13 %5
TUPRS -%14 %9
EREGL -% 9
ASYAB -%24
IHEVA %43
EREGL %50
GUBRF %98 %27
BAGFS %35
ISCTR %34
VAKBN %34 %264
YKBNK %38 %29
AKBNK %54
KCHOL %17 %32
PETKM %5 %41
THYAO -%14 %438
GARAN -%15
TTKOM -%9 %24
KOZAA %423
ARCLK %285
XU100 -%42 -%11 %3 -%34 %97 %7
Sample selected from high volume equities

13
RECOMMENDATIONS PERFORMANCE ( 2008 )
Cumulative yield for a given period
Capital 100.000 TRL
Period 02.01.08 01.10.08 273 days
System
100.000 TRL
216.002 TRL 116%
Transa. 36
Commi. 0,3% 2.388 TRL
Net 100.000 TRL
213.614 TRL 114%
XU100 54.708 36.051 -34%
Relative 148%
* See next pages for details
PERFORMANCE CURVE
214
66
201
120
137
157
182
110
9581 85
76 7965
50
75
100
125
150
175
200
225
01.08 02.08 03.08 04.08 05.08 06.08 07.08 08.08 09.08
PORTFOLIOXU100

14
RECOMMENDATIONS PERFORMANCE TABLE (daily -2008)
Transactions table
lot date buy cost date sell cost P/L %0,3%
day
GUBRF 8.621 02.01.08 2,32
20.000
10.01.08 3,24
27.931 7.931 39%
144 8
TUPRS 620 07.01.08 32,25
20.000
11.01.08
35,25
21.860 1.860 9%
126 4
TCELL 2.151 22.01.08 9,3020.000
25.01.08
10,50
22.581 2.581 12%
128 3
AKBNK 3.175 22.01.08 6,30
20.000
04.02.08 6,85
21.746 1.746 8%
125 13
OZGYO 8.264 22.01.08 2,42
20.000
30.01.08 3,00
24.793 4.793 23%
134 8
THYAO 2.837 31.01.08 7,05
20.000
05.02.08 7,65
21.702 1.702 8%
125 5
ASYAB 5.634 08.02.08 3,55
20.000
27.02.08 4,40
24.789 4.789 23%
134 19
GARAN 4.878 08.02.08 4,10
20.000
15.02.08 4,80
23.415 3.415 16%
130 7
THYAO 14.925 08.02.08 1,34
20.000
19.02.08 1,45
21.642 1.642 8%
125 11
HALKB 2.837 11.02.08 7,05
20.000
14.02.08 8,00
22.695 2.695 13%
128 3
OZGYO 8.163 11.02.08 2,45
20.000
21.02.08 3,04
24.816 4.816 23%
134 10
GUBRF 6.623 15.02.08 3,02
20.000
10.03.08 6,10
40.397
20.397 101%
181 24
GSDHO 25.000 17.03.08 0,80
20.000
24.04.08 1,46
36.500
16.500 82%
170 38
GUBRF 3.077 08.04.08 6,50
20.000
24.04.08 9,40
28.923 8.923 44%
147 16
VESBE 5.882 05.05.08 3,4020.000
06.06.08 4,02
23.647 3.647 18%
131 32
FENER 400 09.06.08 50,0020.000
09.07.08
90,00
36.000
16.000 79%
168 30
AKBNK 5.128 01.07.08 3,90
20.000
29.09.08 6,35
32.564
12.564 62%
158 90

15
MARKET OUTLOOK (as of February 9, 2010)
We are bullish with (+2)% rise @XU100 for short term. More bearish than January in mid term. Our top mid term recommendations: THYAO, PETKM.
Short Term :XU100: Narrow band movements with limited profits
Medium Term: XU100 : We are bearish, with weak indicators
USDTL: Downtrend is ended with more positive momentumXU100 / USD: Limited momentum, bearish market
HIGHLIGHTS:
Short Term : (*) BUY TUPRS: Oversold market necessitates a correction BUY BIMAS: Need of a correction with strong indicators
Medium Term: (*) • BUY
THYAO : A strong uptrend since 10 months. Stock currently draws a risk-free formation but daily corrections needed for an healthy uptrend PETKM : Indicators tend to be near “1” level
• SELL BIMAS: An horizontal trend slightly negative
TUPRS: Oversold with mixed indicator signals
ISE-30 Relative Medium Term : (*)
• Outperform by %15 – %20:TUPRS: A very promising formation is in the making over the last 3 months with our favoured indicators rising since June.
• Outperform by %20 – %25:THYAO: Higher momentum in last 6 months and the stock makes a new high every month over the last 6 months
• Peer Trade in Medium Term: (*)• Outperform by %10 – %15:
SELL TUPRS / BUY PETKM : A new uptrend in PETKM is likely lead Tupras shares to perform better relative to TUPRS• Outperform by %20 – %25:
SELL ISCTR / BUY THYAO : Sacrifice a good stock for a better one. High possibilty for double digit gain for THYAO relative to ISCTR gain
(*) in the order of our conviction levels (higher to lower)

16
RECOMMENDATIONS CONVICTION LEVEL (as of February 9, 2010)
Short
term target
RECOM. Conviction
level
Medium term target
RECOM. Conviction
level
XU100 3.0 - 3.5 % BUY 80/100 (-) 10 - 15 % SELL 80/100
BIMAS 3.0 – 4.0 % BUY 80/100 (-) 5 -10 % SELL 75/100
PETKM 5.0 – 6.0 % BUY 80/100 (+) 10 - 15 % BUY 85/100
THYAO 2.0 – 3.0 % BUY 85/100 (+) 25 - 35 % BUY 85/100
TUPRS 5.0 – 7.0 % BUY 80/100 (-) 7 - 10 % SELL 70/100
USDYTL 0.5 – 1.0 % BUY 80/100 (+) 30 - 40 % BUY 75/100

17
MARKET VIEW (as of February 9, 2010)
XU100. DAILY
Short Term Expectations:• Oversold conditions ended: we are in a reaction days.• Our last call has been a “BUY” delivered @ 49.750• What we expect for a “SELL” signal:
• at least 3 days consolidation • smooth movements on pirce averages
Our propre priority momentum indicator eases market trend analysis notably

18
HISTORIC PERFORMANCE: TUPRS (Short Term View – BUY)
• Indicator is at new low since december.09 but averages are near “0”: bullish after -10% deviation from moving averages.
• Our favoured “C-system” methodology has given a BUY signal on TRL 27.25 and continues remain bullish
Exhibit: Daily Price Chart vs. Our Recommendatiostillns
2
1

19
HISTORIC PERFORMANCE: TUPRS (Long Term View - SELL)
• We are “BEARISH” after excessive price movements
• Our favoured “C-system” methodology has given a SELL signal on TRL 32.50 and continues remain bearish
Exhibit: Monthly Price Chart vs. Our Recommendations
1

20
HISTORIC PERFORMANCE: BIMAS (Short Term View – BUY)
• We are less “BULLISH”: indicator and its moving averages are under “0” but stock is oversold.
• Our favoured “C-system” methodology has given a BUY signal on TRL 65.50 and continues remain bullish
Exhibit: Daily Price Chart vs. Our Recommendatiostillns
2
1

21
HISTORIC PERFORMANCE: BIMAS (Long Term View - SELL)
• We are “BEARISH” : we expect prices dropping to moving average (1)
• Our favoured “C-system” methodology has given a SELL signal on TRL 73.50 and continues remain bearish
Exhibit: Monthly Price Chart vs. Our Recommendations
1
22
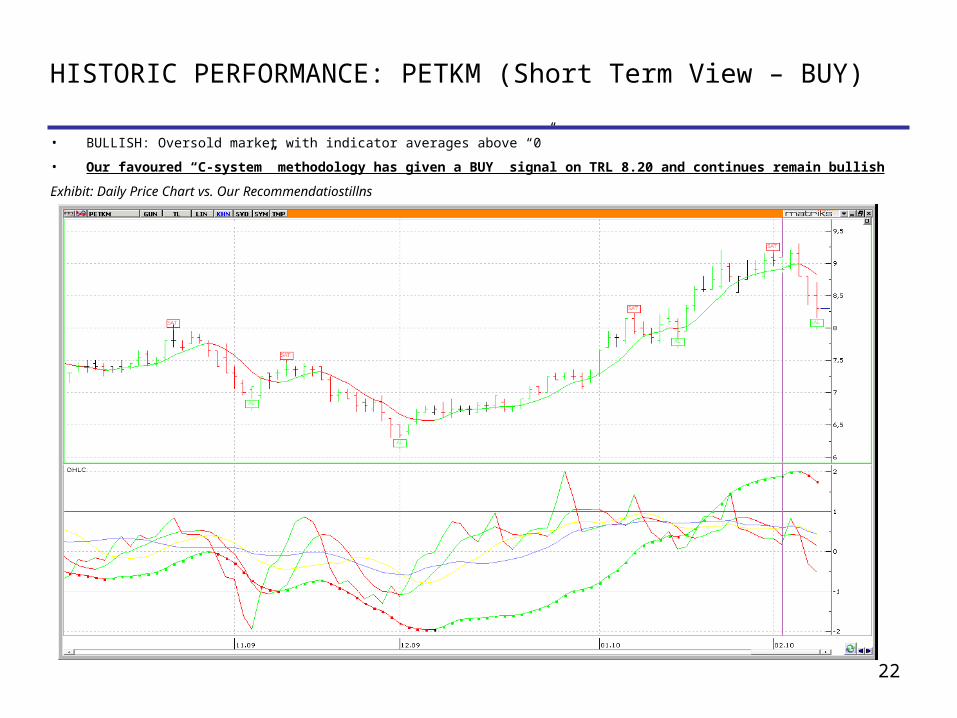
HISTORIC PERFORMANCE: PETKM (Short Term View – BUY)
• BULLISH: Oversold market with indicator averages above “0”
• Our favoured “C-system” methodology has given a BUY signal on TRL 8.20 and continues remain bullish
Exhibit: Daily Price Chart vs. Our Recommendatiostillns
1

23
HISTORIC PERFORMANCE: PETKM (Long Term View - BUY)
• We are “BULLISH” : indicator’s moving averages still rise and stock price is not overbought
• Our favoured “C-system” methodology has given a BUY signal on TRL6.40 and continues remain bullish
Exhibit: Monthly Price Chart vs. Our Recommendations
1
24
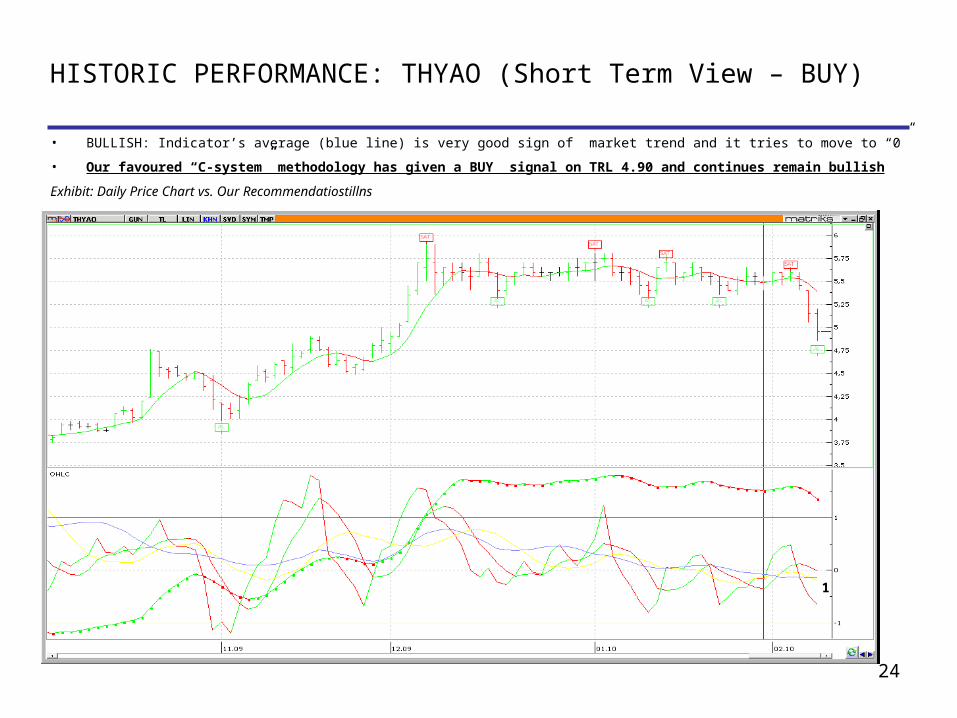
HISTORIC PERFORMANCE: THYAO (Short Term View – BUY)
• BULLISH: Indicator’s average (blue line) is very good sign of market trend and it tries to move to “0”
• Our favoured “C-system” methodology has given a BUY signal on TRL 4.90 and continues remain bullish
Exhibit: Daily Price Chart vs. Our Recommendatiostillns
1

25
HISTORIC PERFORMANCE: THYAO (Long Term View - BUY)
• We are “BULLISH” : indicator’s moving average (line 1) is very strong –near “1”
• Our favoured “C-system” methodology has given a BUY signal on TRL0.75 and continues remain bullish
Exhibit: Monthly Price Chart vs. Our Recommendations
1