Embed Size (px)
Citation preview

GRAYREPORTS Demand for Educational Programs
www.GrayAssociates.com
Results through February 2015

617.401.7662 www.GrayAssociates.com 2
GRAY For more information please contact Bob Atkins. Email: [email protected]
Who Is Gray?
GrayData
Completions and Enrollments IPEDS
Employment BLS/O*NET
Placement Rates Gray Research
Industry Inquiries GrayReports
Demographics US Census
Job Postings WANTED Analytics
Students Programs Strategy Locations § Demographic
priorities § Geo-priorities § Market share
§ City selection § Location selection § Relocation analysis § Consolidation
§ Program selection § Program development § Curriculum enhancement § Market reports
§ Business strategy § Strategy implementation § Pricing § Outcome improvement
Advanced Analytics Predictive Models
Geo-Analytics
Clients: Higher Educational Institutions and Investors
Program Pricing: Coming in 2015

617.401.7662 www.GrayAssociates.com 3
GRAY For more information please contact Bob Atkins. Email: [email protected]
What is GrayReports?
GrayReports tracks demand trends in higher education. § Overall industry trend reports are a free monthly service, which includes these webinars. § Custom reports on trends by market and programs, which we provide to our paid subscribers:
─ Monthly reports for their specific programs and markets ─ On-line access to detailed data for their programs and markets
Over 36 million qualified inquiries January 2012 to the present
Over 850,000 new inquiries in February 2015 Over 185 programs with over 10,000 inquiries
Over 300 cities with over 10,000 inquiries

617.401.7662 www.GrayAssociates.com 4
GRAY For more information please contact Bob Atkins. Email: [email protected]
Key Demand Trends and Observations
1. Year-over-year, inquiries dropped 12% in January, but only 9% in February.
2. Year-over-year...
1. Inquiries for on-line programs slowed their fall.
2. Inquiries for on-ground programs were roughly flat.
3. Conversion rates have been holding steady, but February got a weak start.
4. Average costs per converted inquiry continue to trend higher.
3. The largest programs and markets continue to lose inquiry volume.
4. While the gap narrowed in February, the market is still bifurcated: - Struggling institutions dropped over 11%. - Sustainers were down just 6%.

617.401.7662 www.GrayAssociates.com 5
GRAY For more information please contact Bob Atkins. Email: [email protected]
Agenda
1. National Inquiry Trends
2. Inquiries and Conversions: On-Line vs. On-Ground Programs
3. Views by Program and Segment
4. Geo-Targeting
5. Summary

617.401.7662 www.GrayAssociates.com 6
GRAY For more information please contact Bob Atkins. Email: [email protected]
Overall Student Inquiries
February inquiries fell 9% year-over-year, slightly better than January’s 12% fall. § Despite this decline, it is the second-highest monthly volume since August 2014.
-9% YOY -
200,000
400,000
600,000
800,000
1,000,000
1,200,000
Jan Feb Mar Apr May Jun Jul Aug Sep Oct Nov Dec
National Inquiries All Programs and Award Levels 2014 2015

617.401.7662 www.GrayAssociates.com 7
GRAY For more information please contact Bob Atkins. Email: [email protected]
1. Applications are counted in the month in which the inquiry was received (i.e., an inquiry that is received in January and converts in March will be counted as a January inquiry). Typically, the application rate will rise for at least three months after the month in which the inquiries were received.
3.4%
3.1%
3.6%
3.5%
3.6%
3.5%
3.8%
3.3%
3.3%
3.9%
2.8%
2.7%
2.3%
1.5%
2.3% 1.8%
2.7%
0.0%
0.5%
1.0%
1.5%
2.0%
2.5%
3.0%
3.5%
4.0%
4.5%
Jan Feb Mar Apr May Jun Jul Aug Sep Oct Nov Dec
Education Industry Inquiry Conversion Rates 2014 2015 Average Immature Conversion Rate
Inquiry to Application: Conversion Rates
February had a 1.5% first-month conversion rate, slightly below the 1.8% average for a first month. § December and January exactly matched the average third- and second-month conversion rates. § November is now mature, it had the lowest rate in 2014 (slightly behind November 2013’s rate of 2.9%).
Immature Months1
2014 Mature Average

617.401.7662 www.GrayAssociates.com 8
GRAY For more information please contact Bob Atkins. Email: [email protected]
Number of Conversions
Lower inquiry volumes are driving down conversions. § November - December conversion rates were average, but conversions declined substantially:
─ November conversions fell 36%. ─ December remains 26% behind—and is likely to finish below last year.
§ January and February may yet reach last year’s levels, but it is too soon to tell.
Immature Months1
1. Applications are counted in the month in which the inquiry was received (i.e., an inquiry that is received in January and converts in March will be counted as a January inquiry). Typically, the application rate will rise for at least three months after the month in which the inquiries were received.
- 5,000
10,000 15,000 20,000 25,000 30,000 35,000 40,000
Jan Feb Mar Apr May Jun Jul Aug Sep Oct Nov Dec
Education Industry Inquiry Conversions All Programs and Award Levels
2014 2015 2013
Immature Months1

617.401.7662 www.GrayAssociates.com 9
GRAY For more information please contact Bob Atkins. Email: [email protected]
Average Price for Pay-per-Lead Inquiries
The average price for external inquiries has continued to rise modestly in 2015 - up 1% in February. § Inquiry prices rose 5% year-over-year in February. § February inquiry prices are 1% higher than the average inquiry price ($43.92) for all of 2014.
$44.01 $44.24
$42.13 $42.24 $42.13 $42.87 $41.59
$44.97 $44.67 $44.86 $46.15 $46.44 $45.94
$43.11
$30
$32
$34
$36
$38
$40
$42
$44
$46
$48
Jan Feb Mar Apr May Jun Jul Aug Sep Oct Nov Dec
Average Price per Pay-per-Lead Inquiry All Programs and Award Levels
2015 2014
Note: Inquiry price is the average price for pay-per-lead inquiries.

617.401.7662 www.GrayAssociates.com 10
GRAY For more information please contact Bob Atkins. Email: [email protected]
Average Cost Per Converted Inquiry
Average cost per converted inquiry appears to be rising. § November, now a mature month, rose $252, or 18% year-over-year. § December and January are likely to finish at or below 2014 (approximately $1,300). § It is too soon to tell how February will turn out, but its conversion costs are likely to be higher than 2014.
Jan Feb Mar Apr May Jun Jul Aug Sep Oct Nov Dec 2014 1246.42 1345.38 1168.80 1223.72 1171.37 1270.42 1190.57 1374.26 1380.47 1203.00 1635.72 1569.48 2015 1940.26 3038.43 2013 1369.21 1523.08 1328.35 1389.38 1378.91 1136.96 1269.05 1324.84 1457.98 1409.12 1383.41 1381.01
$0
$500
$1,000
$1,500
$2,000
$2,500
$3,000
$3,500 Cost Per Converted Inquiry All Programs and Award Levels
Immature Months

617.401.7662 www.GrayAssociates.com 11
GRAY For more information please contact Bob Atkins. Email: [email protected]
Agenda
1. National Inquiry Trends
2. Inquiries and Conversions: On-Line vs. On-Ground Programs
3. Views by Program and Segment
4. Geo-Targeting
5. Summary

617.401.7662 www.GrayAssociates.com 12
GRAY For more information please contact Bob Atkins. Email: [email protected]
Inquiries for On-Line Programs Education Industry Inquiries: YOY Percent Change Inquiries for on-line programs fell just 5% year-over-year in February. § February inquiry levels were still higher than any month in 2014 since August. § This marks a substantial improvement from January’s 17% decline.
0
50,000
100,000
150,000
200,000
250,000
300,000
350,000
400,000
Jan Feb Mar Apr May Jun Jul Aug Sep Oct Nov Dec
Inquiries
Inquiries for On-Line Programs All Programs and Award Levels
2014 2015
-5% YOY

617.401.7662 www.GrayAssociates.com 13
GRAY For more information please contact Bob Atkins. Email: [email protected]
Student Inquiry Conversions for On-Line Programs
Lower on-line inquiry levels are translating into a continued decline in conversions. § November has the lowest conversion level of 2014 and is down 49% year-over-year. § December conversions are already higher than November, but will likely also finish down year-over-year.
1. Applications are counted in the month in which the inquiry was received (i.e., an inquiry that is received in January and converts in March will be counted as a January inquiry). Typically, the application rate will rise for at least three months after the month in which the inquiries were received.
-
2,000
4,000
6,000
8,000
10,000
12,000
Jan Feb Mar Apr May Jun Jul Aug Sep Oct Nov Dec
Inquiry Conversions for On-Line Programs All Programs and Award Levels
2014 2015 2013
Immature Months1

617.401.7662 www.GrayAssociates.com 14
GRAY For more information please contact Bob Atkins. Email: [email protected]
Inquiries for On-Ground Programs
Inquiries for on-campus programs only fell 1% year-over-year in February. § February has the best year-over-year inquiry growth rate in the past seven months.
2012
0 50,000
100,000 150,000 200,000 250,000 300,000 350,000 400,000 450,000 500,000
Jan Feb Mar Apr May Jun Jul Aug Sep Oct Nov Dec
Inquiries
Inquiries for On-Ground Programs All Programs and Award Levels
2014 2015
-1% YOY

617.401.7662 www.GrayAssociates.com 15
GRAY For more information please contact Bob Atkins. Email: [email protected]
November conversions bucked the positive recent trend and finished 36% below year-ago levels. § December, while higher than November, looks certain to finish below 2013 levels. § January and February inquiries have more time to mature, but are weak compared to prior-year results.
- 2,000 4,000 6,000 8,000
10,000 12,000 14,000 16,000 18,000 20,000
Jan Feb Mar Apr May Jun Jul Aug Sep Oct Nov Dec
Inquiry Conversions for On-Ground Programs All Programs and Award Levels
2014 2015 2013
Immature Months1
Student Inquiry Conversions for On-Ground Programs
1. Applications are counted in the month in which the inquiry was received (i.e., an inquiry that is received in January and converts in March will be counted as a January inquiry). Typically, the application rate will rise for at least three months after the month in which the inquiries were received.

617.401.7662 www.GrayAssociates.com 16
GRAY For more information please contact Bob Atkins. Email: [email protected]
-
2,000
4,000
6,000
8,000
10,000
12,000
14,000
16,000
18,000
20,000
Jan Feb Mar Apr May Jun Jul Aug Sep Oct Nov Dec
Conversions of External Inquiries All Programs and Award Levels
2014 2015 2013
Conversions of External Inquiries
Conversions of external inquiries are declining.
§ Now mature, November had the lowest conversion level in 2014; conversions fell 31% year-over-year. § With one month left to mature, December has outperformed November, but will likely fall shy of 2013.
Immature Months

617.401.7662 www.GrayAssociates.com 17
GRAY For more information please contact Bob Atkins. Email: [email protected]
Conversions of Internal Inquiries
November conversions of internal inquiries fell further than conversions of external inquiries.
§ November had the lowest conversion level and worst year-over-year comparison (-40%) of 2014. § Results for December, January and February conversions are immature, but seem relatively weak.
-
5,000
10,000
15,000
20,000
25,000
Jan Feb Mar Apr May Jun Jul Aug Sep Oct Nov Dec
Conversions of Internal Inquiries All Programs and Award Levels
2014 2015 2013
Immature Months

617.401.7662 www.GrayAssociates.com 18
GRAY For more information please contact Bob Atkins. Email: [email protected]
Agenda
1. National Inquiry Trends
2. Inquiries and Conversions: On-Line vs. On-Ground Programs
3. Views by Program and Segment
4. Geo-Targeting
5. Summary
617.401.7662 www.GrayAssociates.com 19
GRAY For more information please contact Bob Atkins. Email: [email protected]
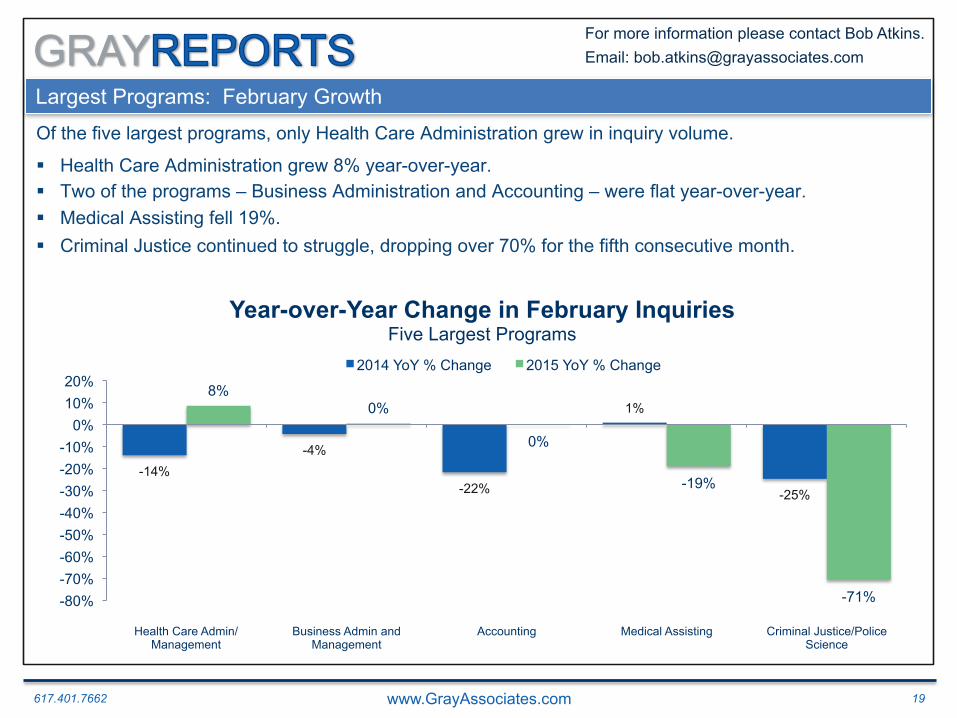
Largest Programs: February Growth
Of the five largest programs, only Health Care Administration grew in inquiry volume.
§ Health Care Administration grew 8% year-over-year. § Two of the programs – Business Administration and Accounting – were flat year-over-year. § Medical Assisting fell 19%. § Criminal Justice continued to struggle, dropping over 70% for the fifth consecutive month.
-14% -4%
-22%
1%
-25%
8% 0%
0%
-19%
-71% -80% -70% -60% -50% -40% -30% -20% -10%
0% 10% 20%
Health Care Admin/Management
Business Admin and Management
Accounting Medical Assisting Criminal Justice/Police Science
Year-over-Year Change in February Inquiries Five Largest Programs
2014 YoY % Change 2015 YoY % Change

617.401.7662 www.GrayAssociates.com 20
GRAY For more information please contact Bob Atkins. Email: [email protected]
Top 5 Fastest-Growing Programs in February
Inquiries for five fast-growing programs grew over 65% in February. § Welding Tech was the fast-growing program for the sixth consecutive month. § Registered Nursing also remained in the top five with 65% growth. § Computer Systems Networking, Addiction Counseling, and Education joined the list in February.
-34% -19%
206%
26% 15%
267%
77% 72% 65% 31%
-100%
-50%
0%
50%
100%
150%
200%
250%
300%
Welding Tech Computer Systems Networking and
Telecommunications
Substance Abuse/Addiction Counseling
Registered Nursing Education, General
Year-over-Year Change in February Inquiries Five Fastest-Growing Programs
2014 YoY % Change 2015 YoY % Change
1. Includes only the top 75 programs (based on inquiry volume since January 2012)

617.401.7662 www.GrayAssociates.com 21
GRAY For more information please contact Bob Atkins. Email: [email protected]
Largest Cities for Inquiries
February inquiries for four of the top five cities were down by more than 10%. § New York fared the best, with a 4% decline from year-ago levels. § Chicago had the worst performance – declining 22% from the prior year.
-3%
-7%
3% 2%
-9%
-4%
-11%
-16% -19%
-22% -25%
-20%
-15%
-10%
-5%
0%
5%
10%
New York Atlanta Los Angeles Philadelphia Chicago
Year-over-Year Change in February Inquiries Top Five Cities for Inquiries 2014 YoY % Change 2015 YoY % Change
Note: The market for each city is defined as a 15-mile radius around the population center of its CBSA.

617.401.7662 www.GrayAssociates.com 22
GRAY For more information please contact Bob Atkins. Email: [email protected]
Fastest-Growing Cities for All Inquiries
Three new cities joined the five fastest-growers this month – all with positive growth. § Oklahoma City and Jacksonville were again among the fastest-growing cities. § Three CA cities dropped off the list – Fresno, Modesto and Stockton. § Indianapolis, Kansas City and Hartford joined the list in February. § Four of the five cities achieved inquiry growth of more than 10%.
-12%
8%
-8% -4%
-8%
35%
19% 16%
12%
5%
-20%
-10%
0%
10%
20%
30%
40%
Oklahoma City, OK Jacksonville, FL Indianapolis, IN Kansas City, MO/KS Hartford, CT
Year-over-Year Change in February Inquiries Five Fastest-Growing Cities for All Inquiries
2014 YoY % Change 2015 YoY % Change
1. Includes only the top 75 cities by inquiry volume since January 2012. Data includes a 15-mile radius from the center of the CBSA.

617.401.7662 www.GrayAssociates.com 23
GRAY For more information please contact Bob Atkins. Email: [email protected]
Sustainers vs. Strugglers: Inquiry Volume
The gap between Sustainers and Strugglers narrowed to 5% in February. Is the shake-out ending?
-12% -15% -15% -12%
0%
-3% -13% -16%
-31% -44% -46%
-27%
47% 44%
28%
10% 9% 7%
-6% -13%
-7% -7% -11% -9%
-50%
-30%
-10%
10%
30%
50%
Jan Feb Mar Apr May Jun Jul Aug Sep Oct Nov Dec
Sustainers vs. Strugglers Year-over-Year Change in Inquiry Volumes 2014
-15% -11%
-6% -6%
-50%
-40%
-30%
-20%
-10%
0%
Jan Feb Mar Apr May Jun Jul Aug Sep Oct Nov Dec
Year-over-Year Change in Inquiry Volumes 2015
Strugglers
Sustainers

617.401.7662 www.GrayAssociates.com 24
GRAY For more information please contact Bob Atkins. Email: [email protected]
Decline in Inquiry Volumes by Category
Doctoral and Internal inquiries significantly outperformed the other inquiry categories during the period. § In addition to Doctoral and Internal inquiries, Master’s, Ground and Certificate program inquiries all
outperformed the average.
§ Inquiries for Associate’s programs fell the farthest – down 23%.
13% 10%
0% -5%
-8% -11%
-17% -18%
-20% -21%
-23%
-25% -15% -5% 5% 15%
Internal Doctorate Master's Ground Certificate Bachelor's Unknown Degree Online External Unknown Modality Associate's
Year-over-Year Percentage Change in Inquiries 2013/2014 vs. 2014/2015 (December – February)
Monthly Average

617.401.7662 www.GrayAssociates.com 25
GRAY For more information please contact Bob Atkins. Email: [email protected]
Agenda
1. National Inquiry Trends
2. Inquiries and Conversions: On-Line vs. On-Ground Programs
3. Views by Program and Segment
4. Geo-Targeting
5. Summary

617.401.7662 www.GrayAssociates.com 26
GRAY For more information please contact Bob Atkins. Email: [email protected]
0
1,000
2,000
3,000
4,000
5,000
6,000
<1
1-10
11
-20
21-3
0 31
-40
41-5
0 51
-60
61-7
0 71
-80
81-9
0 91
-100
10
1-11
0 11
1-12
0 12
1-13
0 13
1-14
0 14
1-15
0 15
1-16
0 16
1-17
0 17
1-18
0 18
1-19
0 19
1-20
0 20
1-21
0 21
1-22
0 22
1-23
0 23
1-24
0 24
1-25
0 25
1-26
0 26
1-27
0 27
1-28
0 28
1-29
0 29
1-30
0 30
1-31
0 31
1-32
0 32
1-33
0 33
1-34
0 34
1-35
0 35
1-36
0 36
1-37
0 37
1-38
0 38
1-39
0 39
1-40
0 40
1-41
0 41
1-42
0 42
1-43
0 43
1-44
0 44
1-45
0 45
1-46
0 46
1-47
0 47
1-48
0 48
1-49
0 49
1-50
0 >5
01
Count of Tracts
Inquiry Ranges
Count of Tracts by Number of Inquiries All Programs and Award Levels
2014
High-Opportunity Tracts Education Industry Inquiries: YOY Percent Change Relatively few census tracts typically account for a disproportionate share of inquiries.
High-Value Tracts: 4.5M Inquiries (>180 Inquires in 2014)

617.401.7662 www.GrayAssociates.com 27
GRAY For more information please contact Bob Atkins. Email: [email protected]
Example: Tracts > 100 inquiries in January 2015, and growth in 2013 and 2014.
High-Opportunity Tracts
GrayReports allows you to identify and target the tracts in your market that are large and growing.

617.401.7662 www.GrayAssociates.com 28
GRAY For more information please contact Bob Atkins. Email: [email protected]
Illustrative Findings: Demographics of Under-performing Tracts
In this case, under-performing tracts had a common characteristic—Hispanic ethnicity.
0%
20%
40%
60%
80%
100%
120%
140%
-
2,000
4,000
6,000
8,000
10,000
12,000
14,000
16,000
18,000
20,000
Bottom 10%
20% 30% 40% 50% 60% 70% 80% 90% Top 10%
Inquiry Share as % of All-Tract Average
Net Potential Annual Inquiry Increase
Hispanic Share of Population by Decile
Inquiry Share and Opportunity by Hispanic Share of Population
Opportunity Relative Share Index

617.401.7662 www.GrayAssociates.com 29
GRAY For more information please contact Bob Atkins. Email: [email protected]
Agenda
1. National Inquiry Trends
2. Inquiries and Conversions: On-Line vs. On-Ground Programs
3. Views by Program and Segment
4. Geo-Targeting
5. Summary

617.401.7662 www.GrayAssociates.com 30
GRAY For more information please contact Bob Atkins. Email: [email protected]
Key Findings
§ The mix of inquiries is shifting to :
- Internal
- On-ground
- Healthy schools (Sustainers).
- Higher degree levels
§ There are tremendous variations by city, program, and modality. - Three of the five fastest-growing cities are new to the list in February.
- Three of the five fastest-growing programs were also new arrivals.
§ You need a custom view that reflects the markets in which you compete.
§ You can use GrayReports to locate and target the high-value areas in your markets

617.401.7662 www.GrayAssociates.com 31
GRAY For more information please contact Bob Atkins. Email: [email protected]
Upcoming Gray Associates’ Webinars
Please join us next month!
April Webinar (March Results)
Friday, April 24th at 1:00 p.m. Eastern Time

617.401.7662 www.GrayAssociates.com 32
GRAY For more information please contact Bob Atkins. Email: [email protected]
Questions and Contacts
Please feel free to contact: Bob Atkins
CEO Gray Associates, Inc.
617-366-2836