Embed Size (px)
Citation preview
33THE MALE GENITILIA AND
URETHRA
DAVID SUTTON

DAVID SUTTON PICTURES
DR. Muhammad Bin Zulfiqar PGR-FCPS III SIMS/SHL
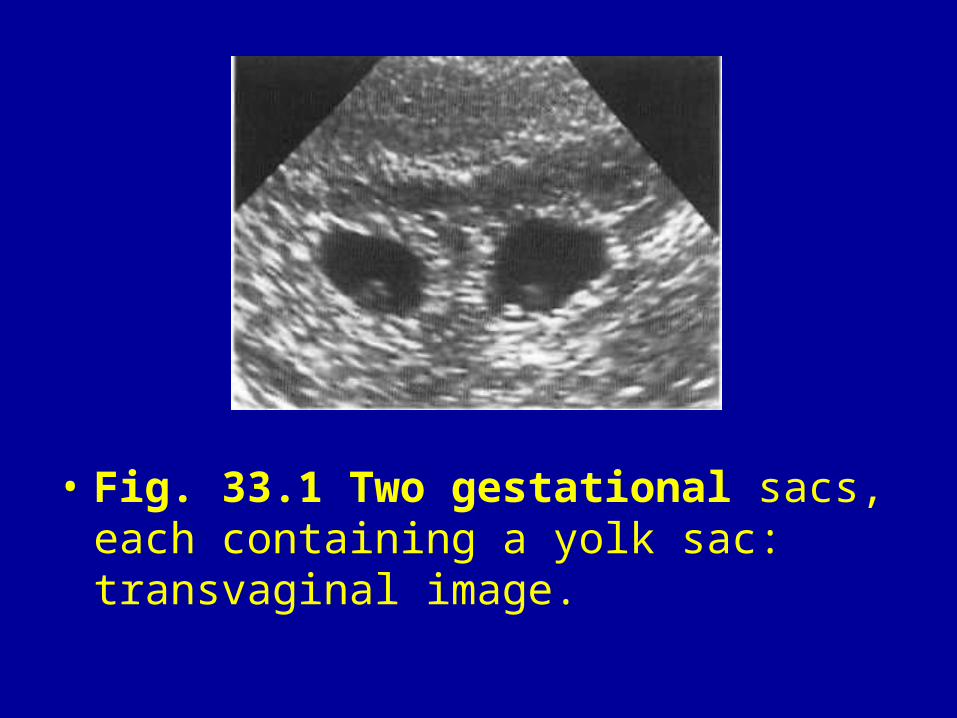
• Fig. 33.1 Two gestational sacs, each containing a yolk sac: transvaginal image.
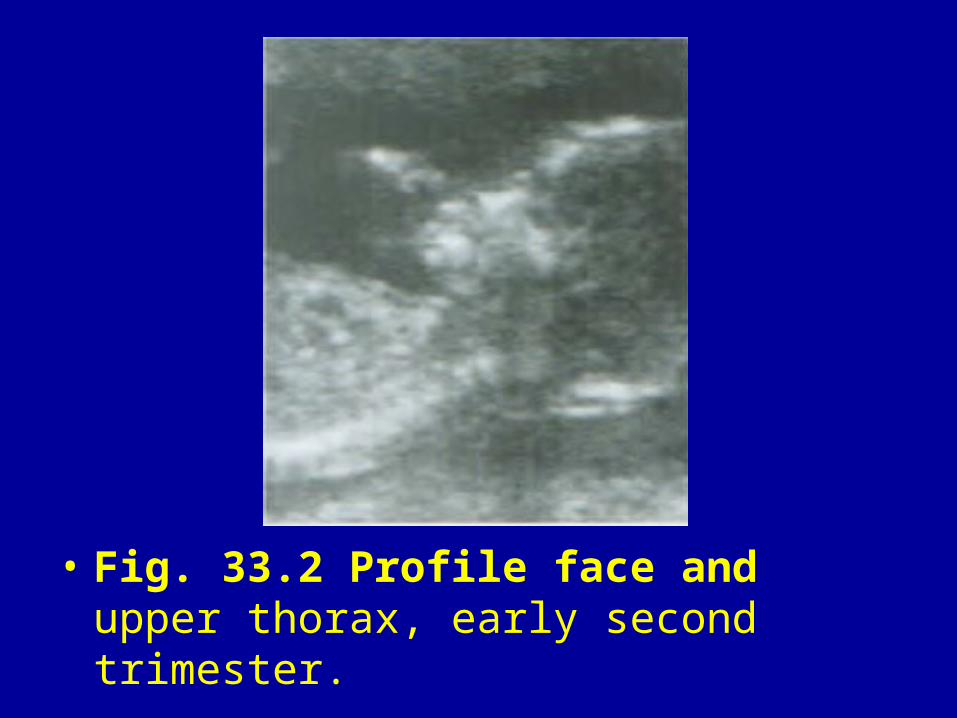
• Fig. 33.2 Profile face and upper thorax, early second trimester.
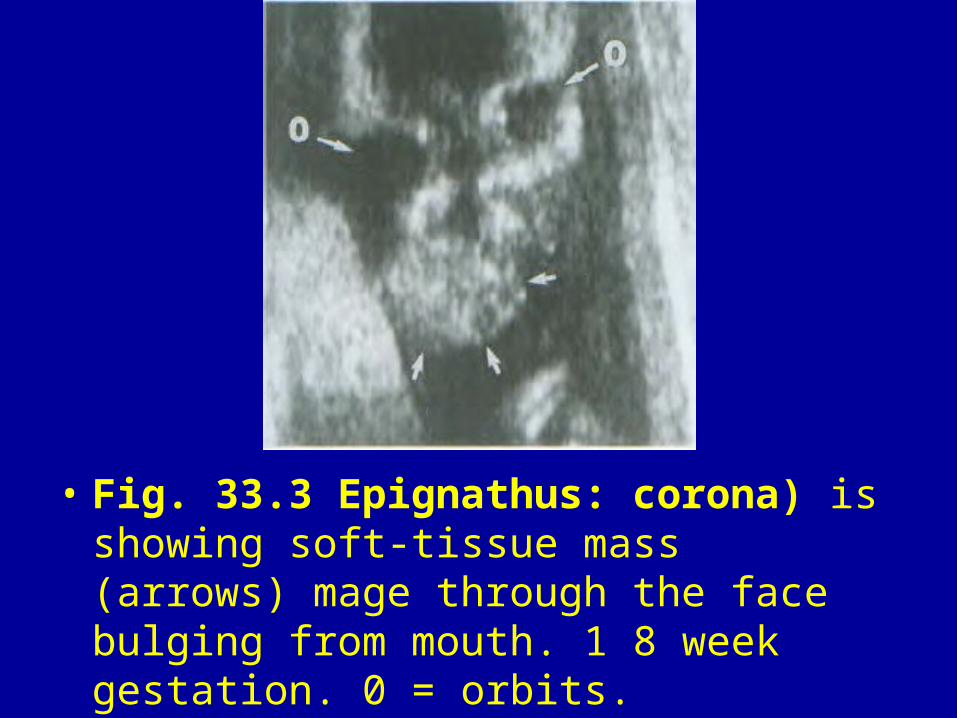
• Fig. 33.3 Epignathus: corona) is showing soft-tissue mass (arrows) mage through the face bulging from mouth. 1 8 week gestation. 0 = orbits.
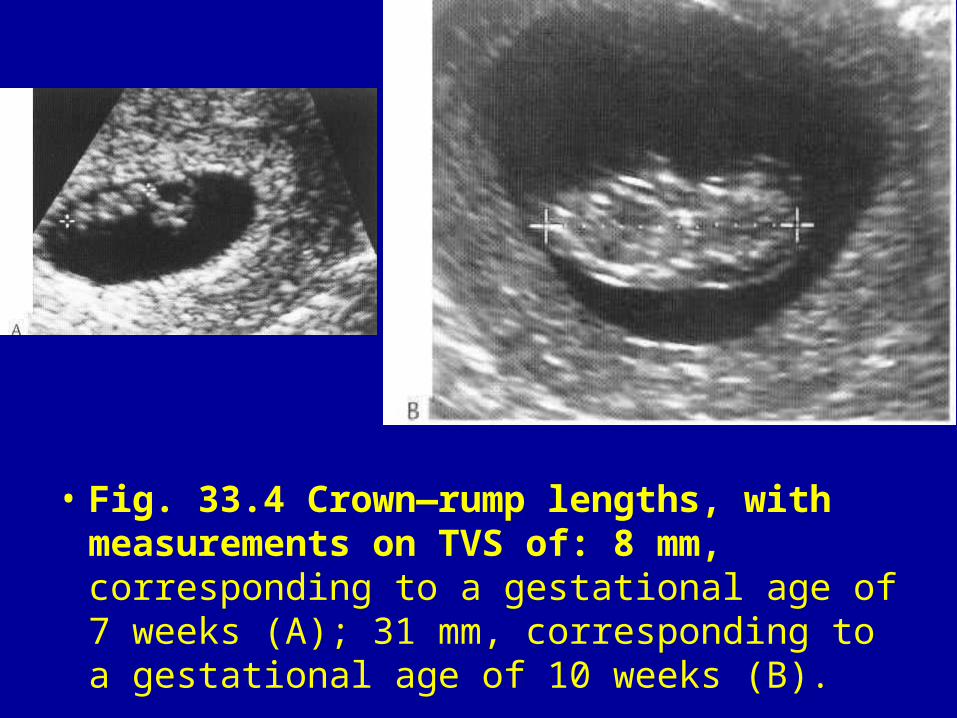
• Fig. 33.4 Crown—rump lengths, with measurements on TVS of: 8 mm, corresponding to a gestational age of 7 weeks (A); 31 mm, corresponding to a gestational age of 10 weeks (B).
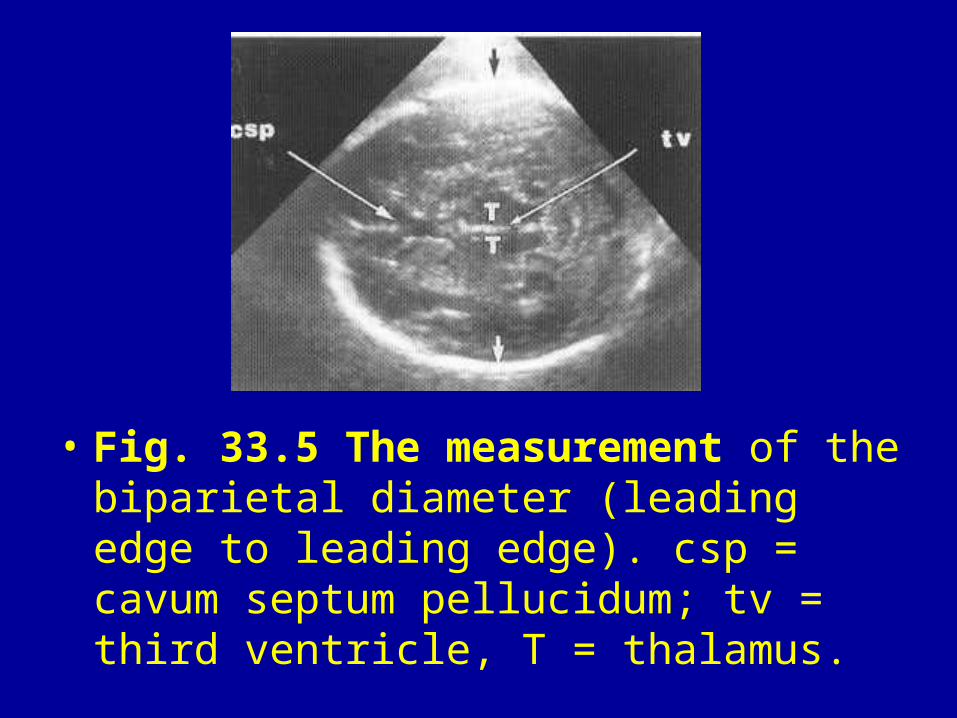
• Fig. 33.5 The measurement of the biparietal diameter (leading edge to leading edge). csp = cavum septum pellucidum; tv = third ventricle, T = thalamus.
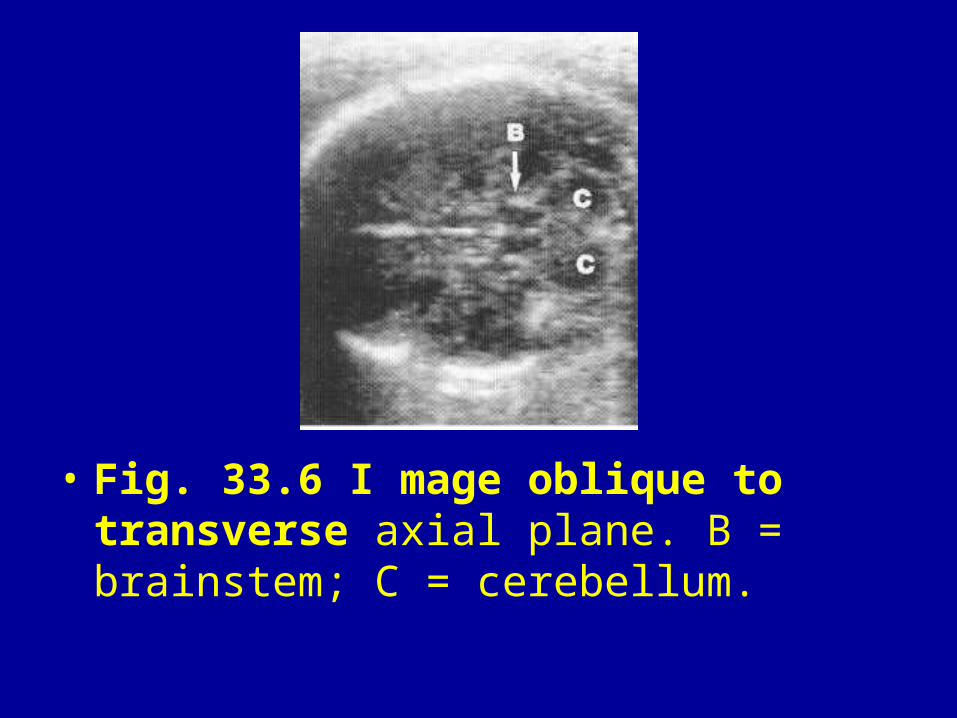
• Fig. 33.6 I mage oblique to transverse axial plane. B = brainstem; C = cerebellum.
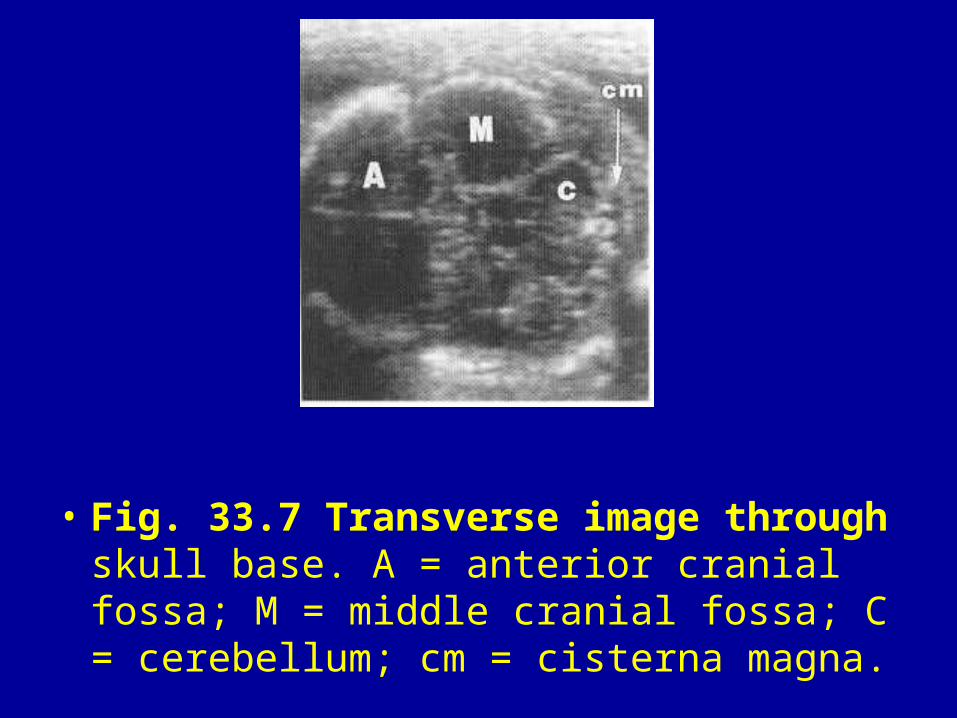
• Fig. 33.7 Transverse image through skull base. A = anterior cranial fossa; M = middle cranial fossa; C = cerebellum; cm = cisterna magna.
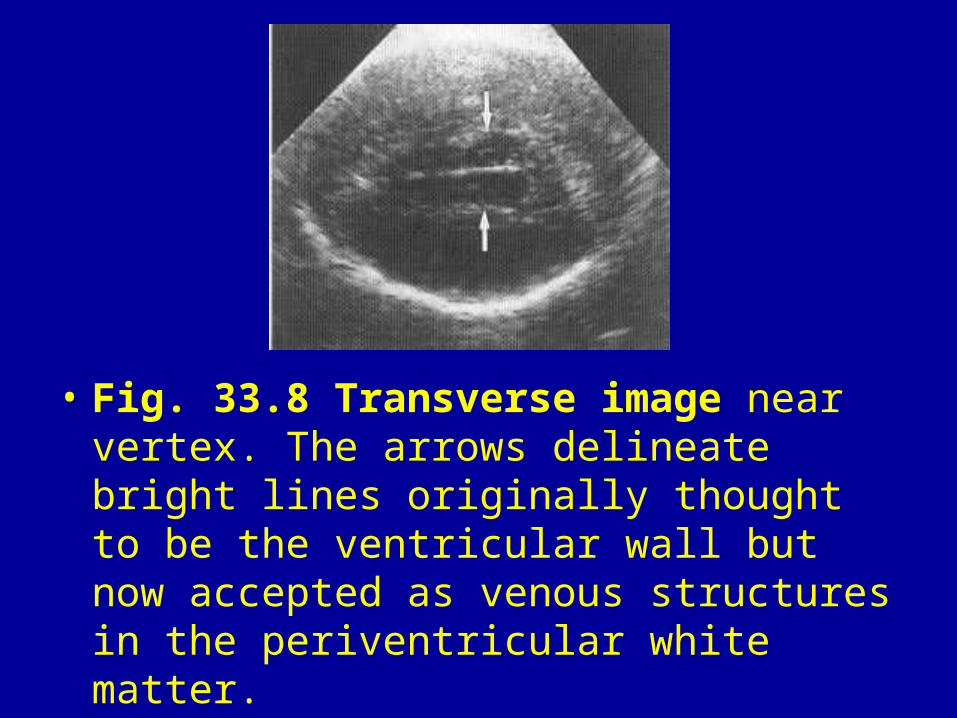
• Fig. 33.8 Transverse image near vertex. The arrows delineate bright lines originally thought to be the ventricular wall but now accepted as venous structures in the periventricular white matter.
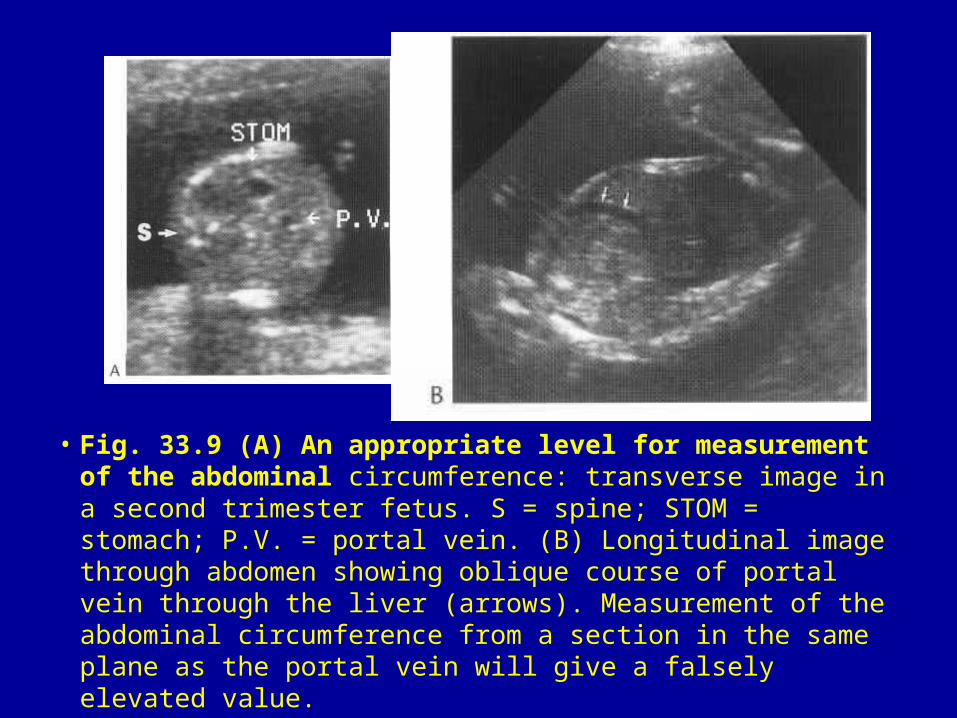
• Fig. 33.9 (A) An appropriate level for measurement of the abdominal circumference: transverse image in a second trimester fetus. S = spine; STOM = stomach; P.V. = portal vein. (B) Longitudinal image through abdomen showing oblique course of portal vein through the liver (arrows). Measurement of the abdominal circumference from a section in the same plane as the portal vein will give a falsely elevated value.
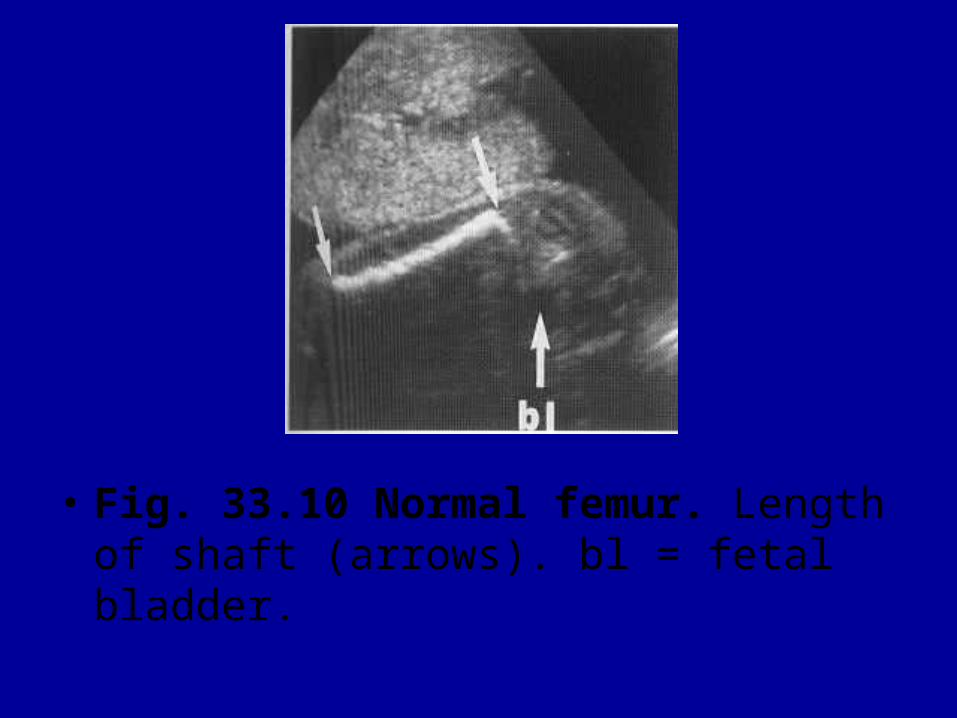
• Fig. 33.10 Normal femur. Length of shaft (arrows). bl = fetal bladder.
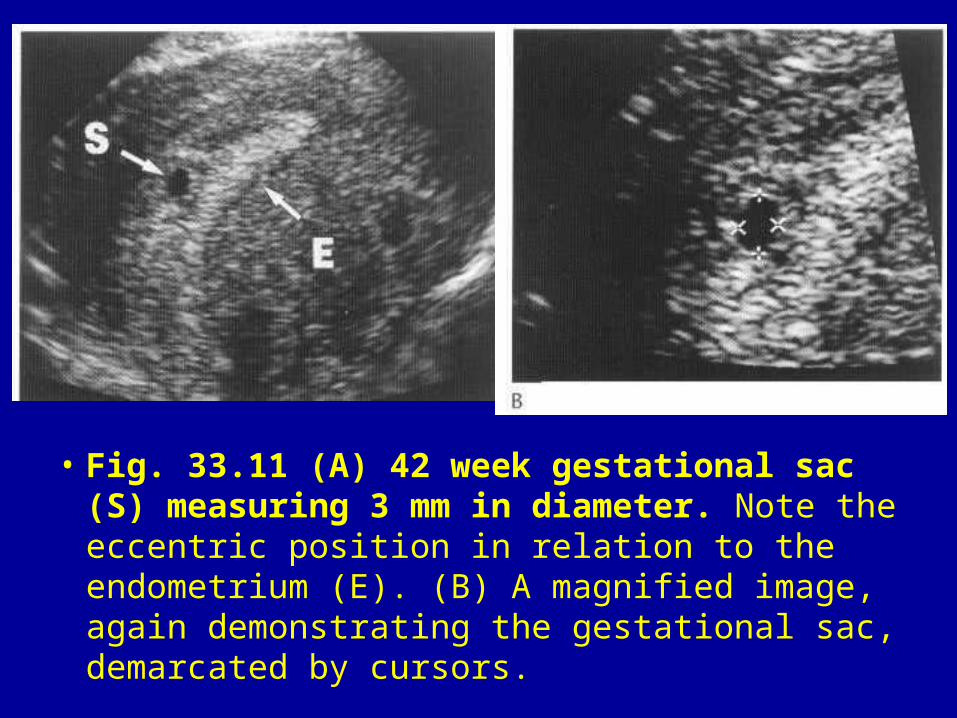
• Fig. 33.11 (A) 42 week gestational sac (S) measuring 3 mm in diameter. Note the eccentric position in relation to the endometrium (E). (B) A magnified image, again demonstrating the gestational sac, demarcated by cursors.
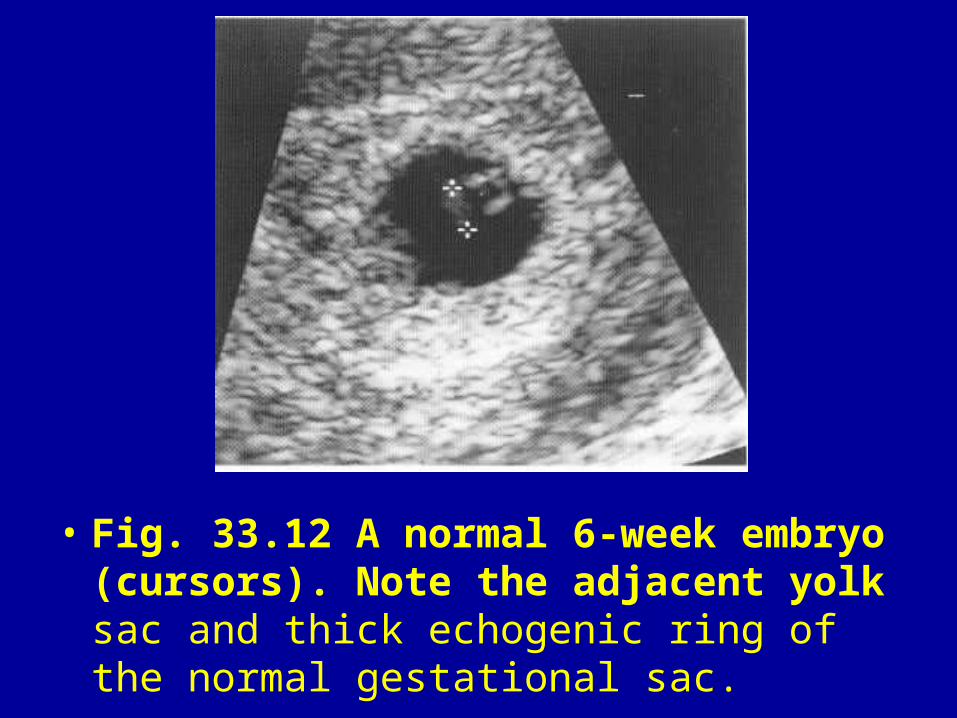
• Fig. 33.12 A normal 6-week embryo (cursors). Note the adjacent yolk sac and thick echogenic ring of the normal gestational sac.
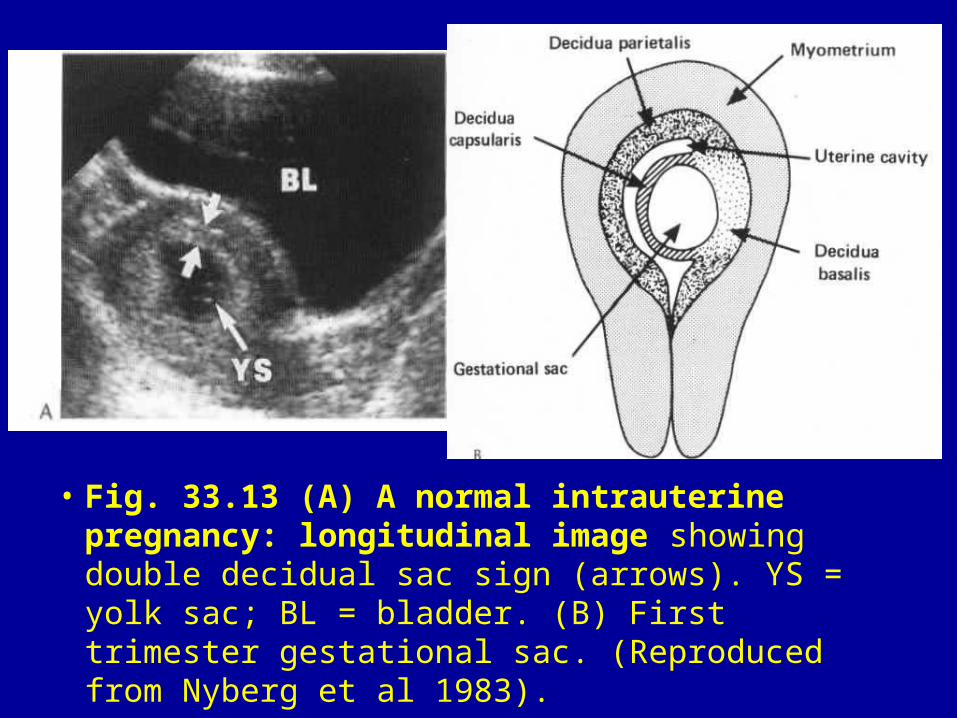
• Fig. 33.13 (A) A normal intrauterine pregnancy: longitudinal image showing double decidual sac sign (arrows). YS = yolk sac; BL = bladder. (B) First trimester gestational sac. (Reproduced from Nyberg et al 1983).
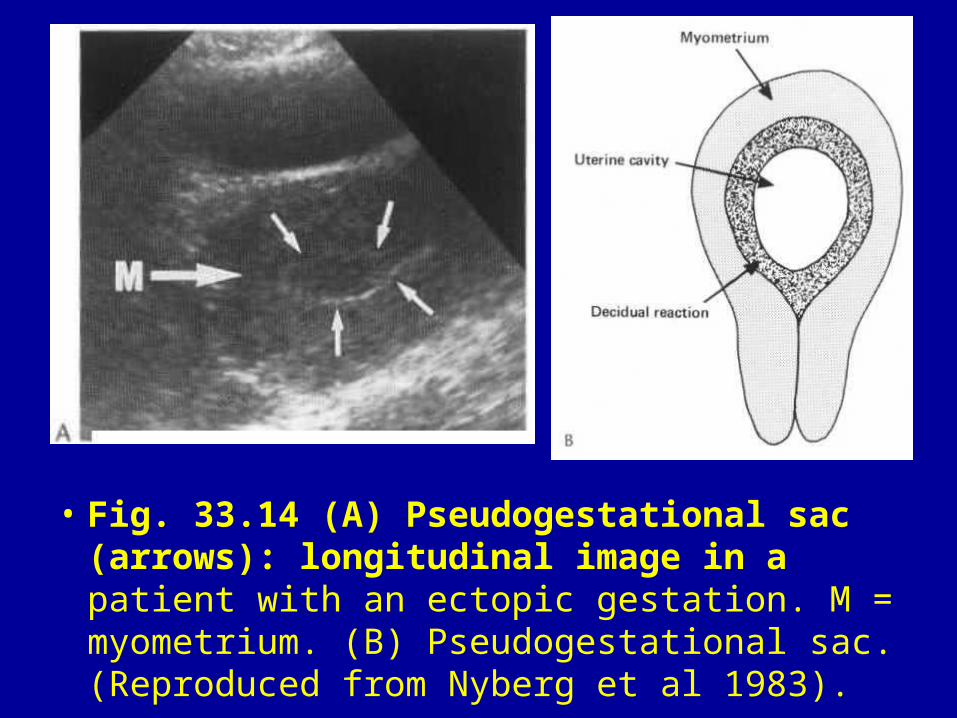
• Fig. 33.14 (A) Pseudogestational sac (arrows): longitudinal image in a patient with an ectopic gestation. M = myometrium. (B) Pseudogestational sac. (Reproduced from Nyberg et al 1983).
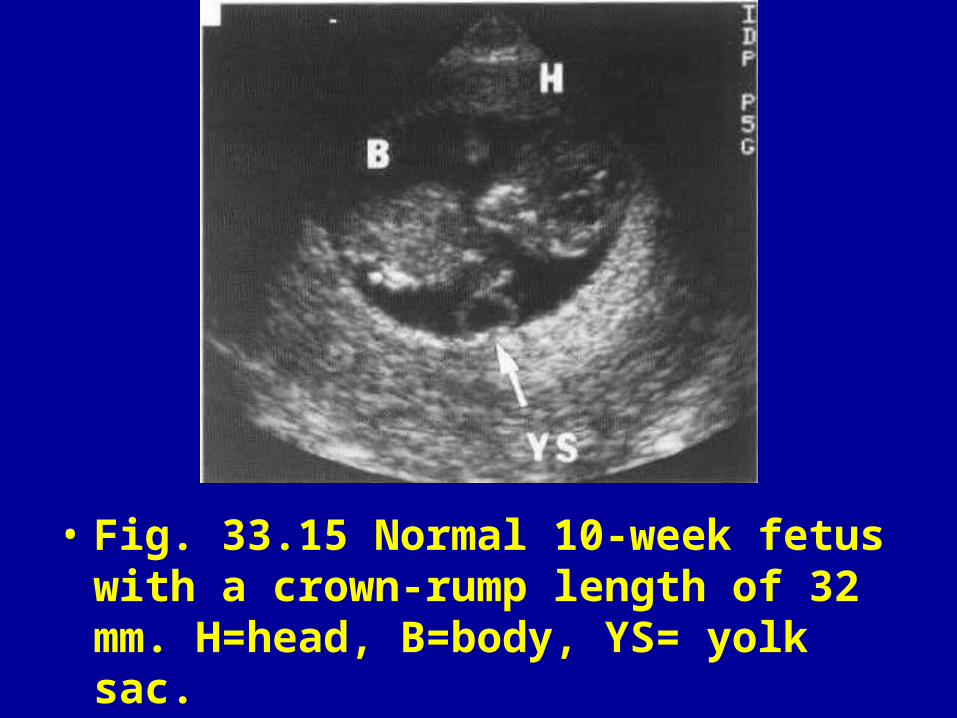
• Fig. 33.15 Normal 10-week fetus with a crown-rump length of 32 mm. H=head, B=body, YS= yolk sac.
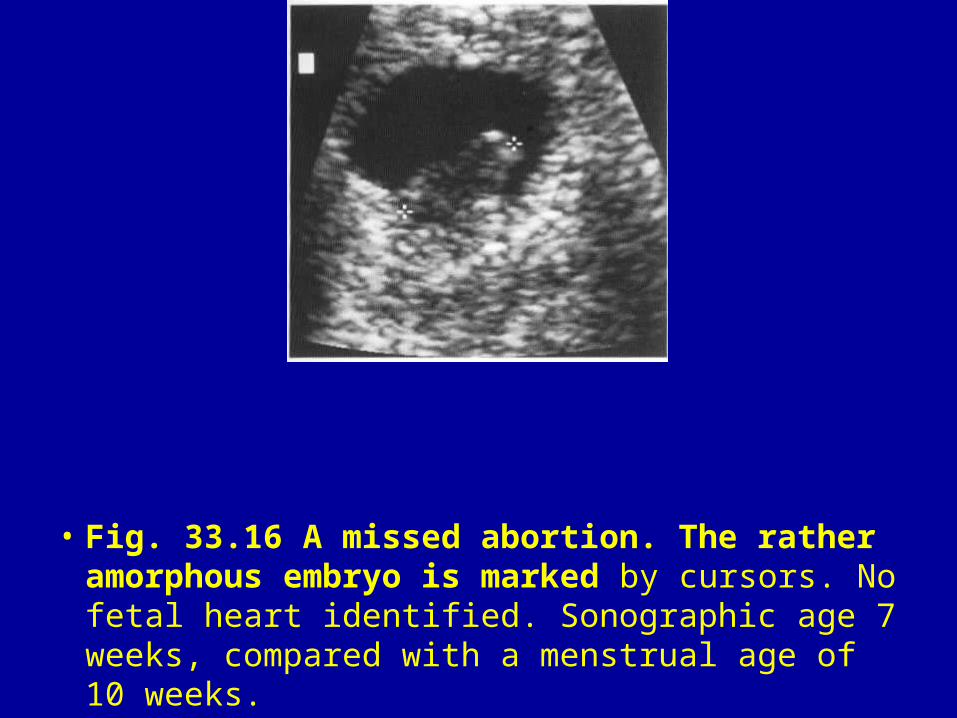
• Fig. 33.16 A missed abortion. The rather amorphous embryo is marked by cursors. No fetal heart identified. Sonographic age 7 weeks, compared with a menstrual age of 10 weeks.
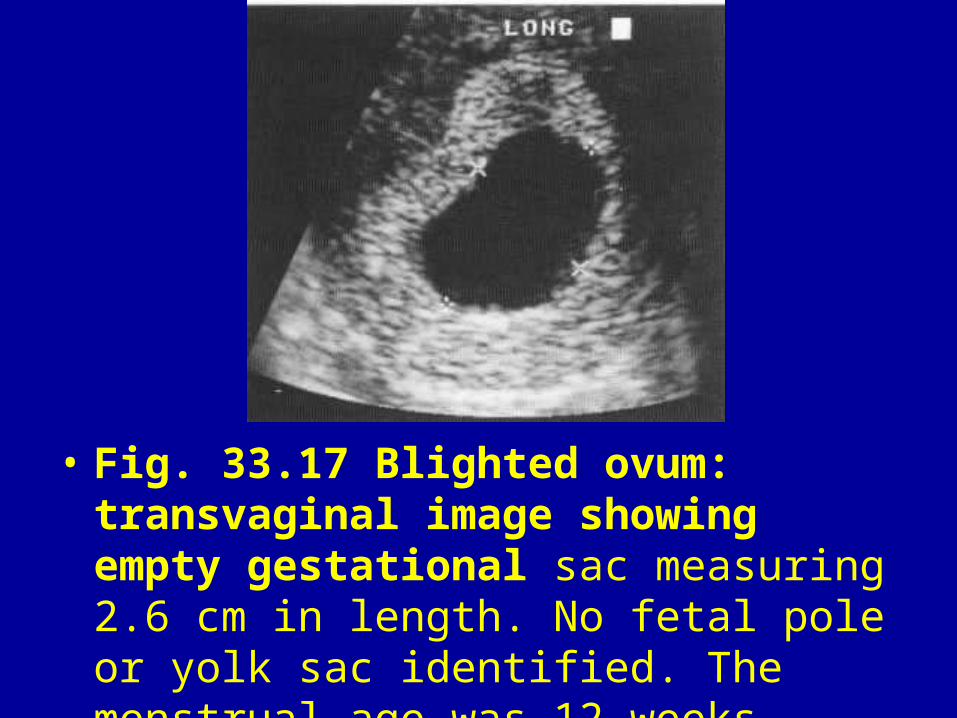
• Fig. 33.17 Blighted ovum: transvaginal image showing empty gestational sac measuring 2.6 cm in length. No fetal pole or yolk sac identified. The menstrual age was 12 weeks.
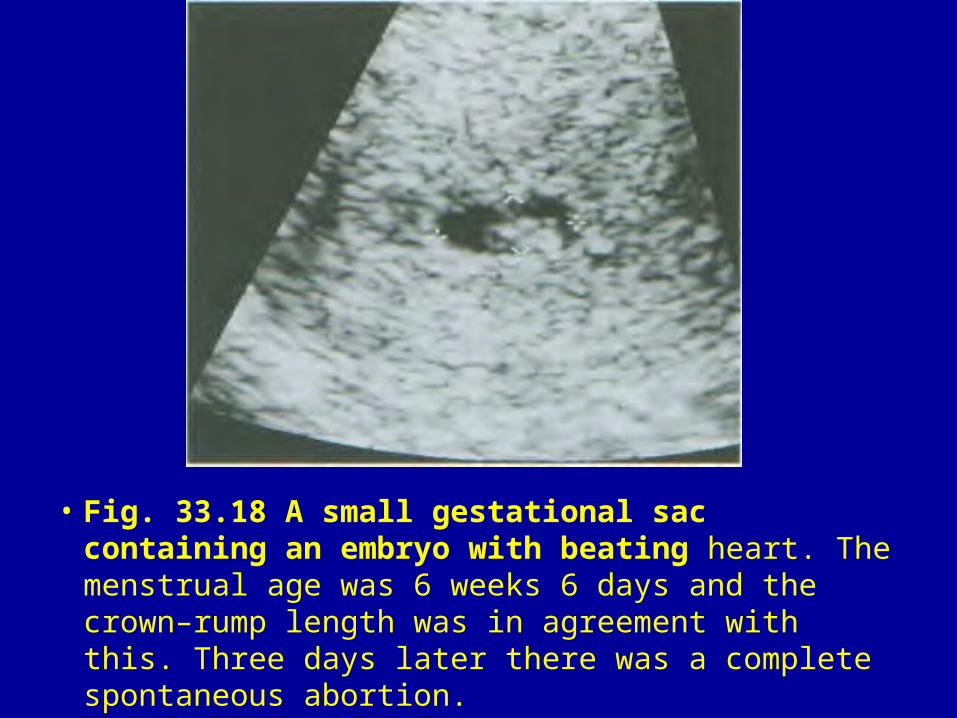
• Fig. 33.18 A small gestational sac containing an embryo with beating heart. The menstrual age was 6 weeks 6 days and the crown–rump length was in agreement with this. Three days later there was a complete spontaneous abortion.
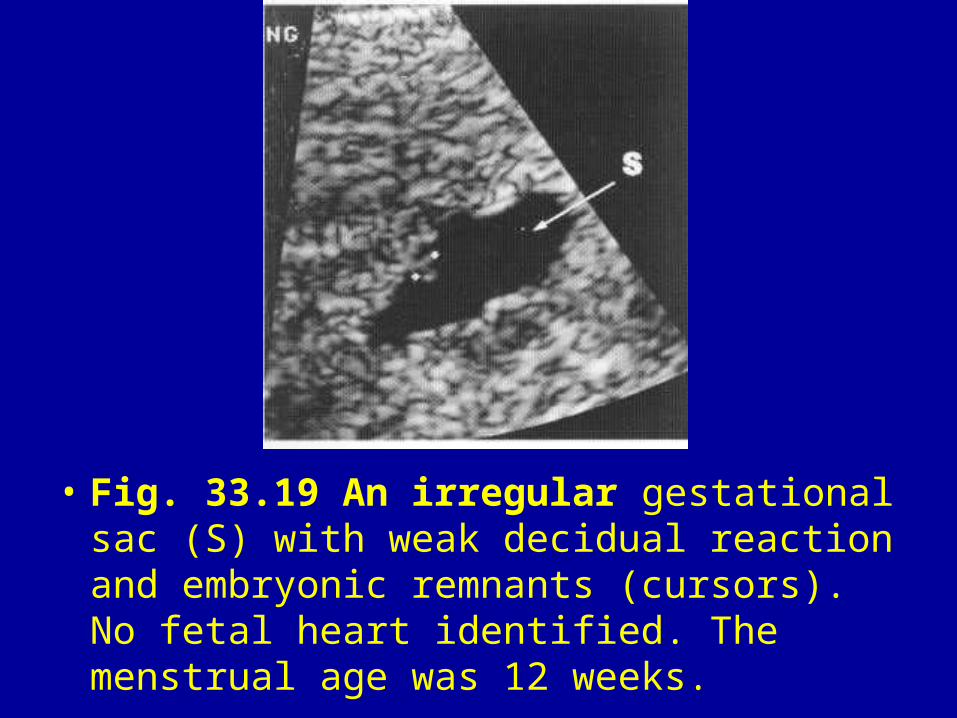
• Fig. 33.19 An irregular gestational sac (S) with weak decidual reaction and embryonic remnants (cursors). No fetal heart identified. The menstrual age was 12 weeks.
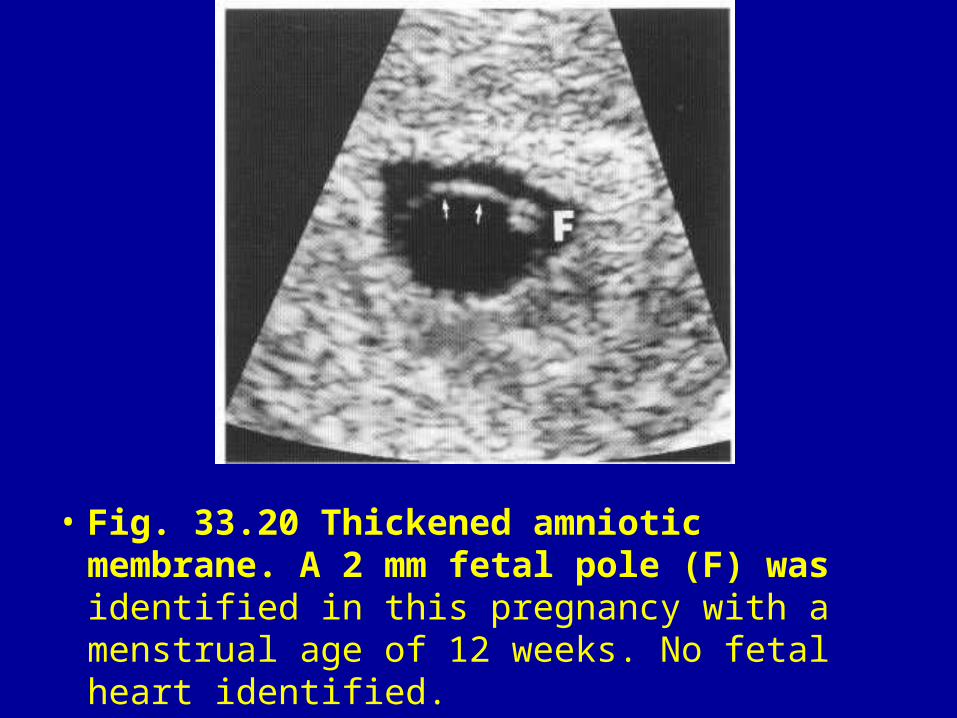
• Fig. 33.20 Thickened amniotic membrane. A 2 mm fetal pole (F) was identified in this pregnancy with a menstrual age of 12 weeks. No fetal heart identified.
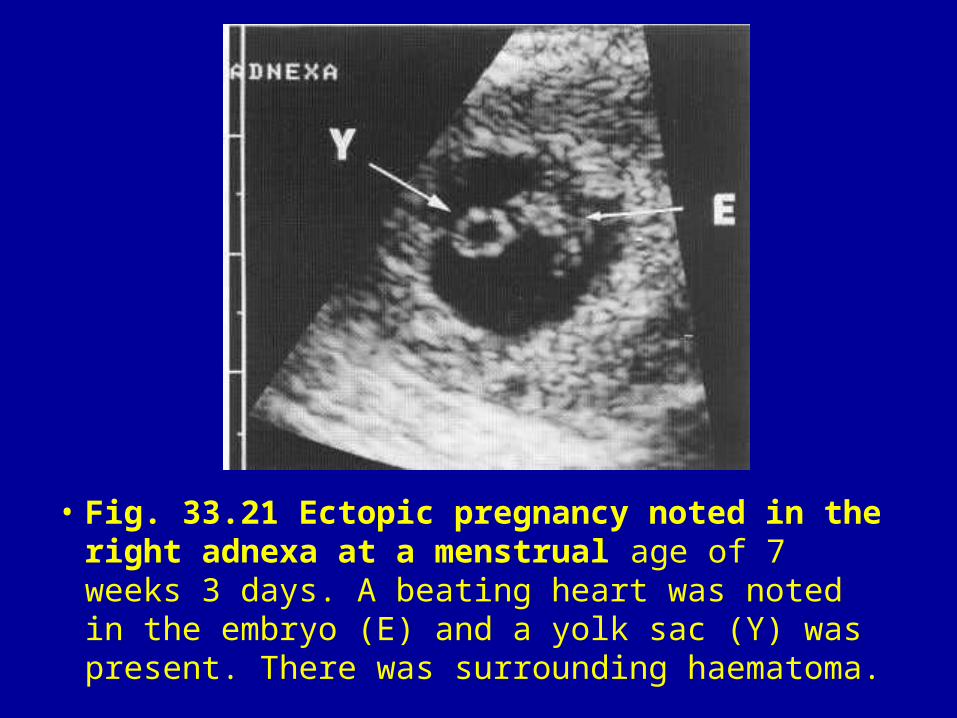
• Fig. 33.21 Ectopic pregnancy noted in the right adnexa at a menstrual age of 7 weeks 3 days. A beating heart was noted in the embryo (E) and a yolk sac (Y) was present. There was surrounding haematoma.
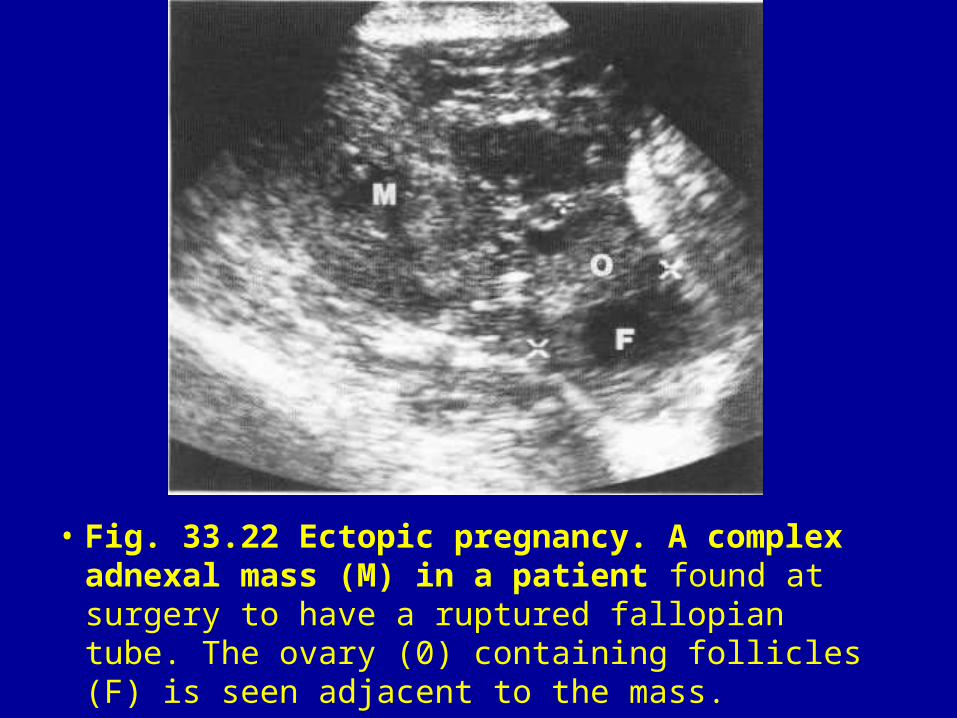
• Fig. 33.22 Ectopic pregnancy. A complex adnexal mass (M) in a patient found at surgery to have a ruptured fallopian tube. The ovary (0) containing follicles (F) is seen adjacent to the mass.
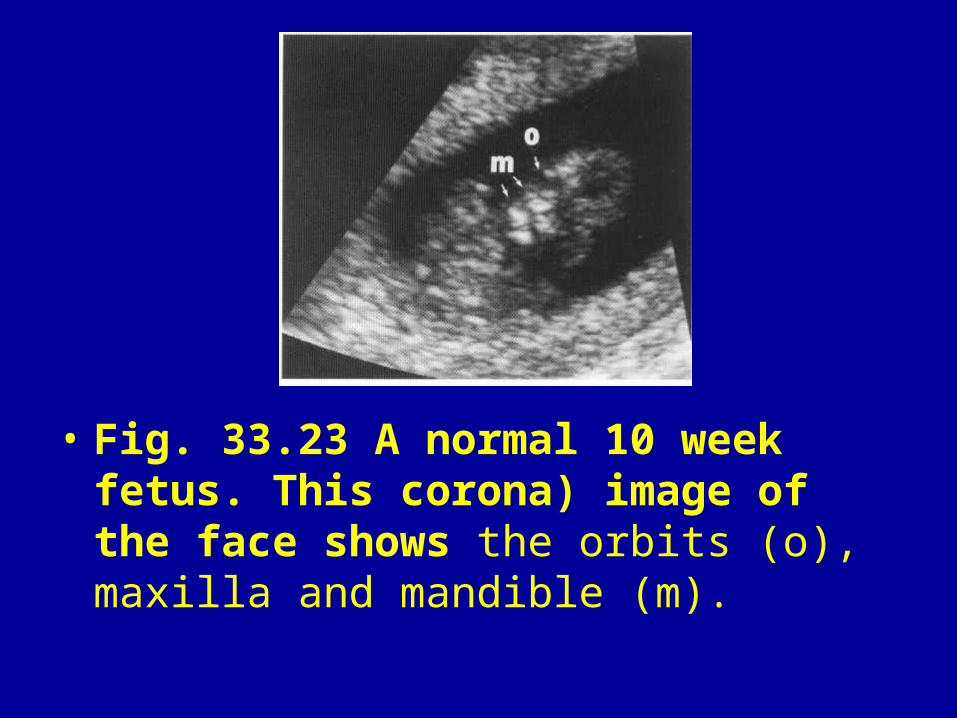
• Fig. 33.23 A normal 10 week fetus. This corona) image of the face shows the orbits (o), maxilla and mandible (m).
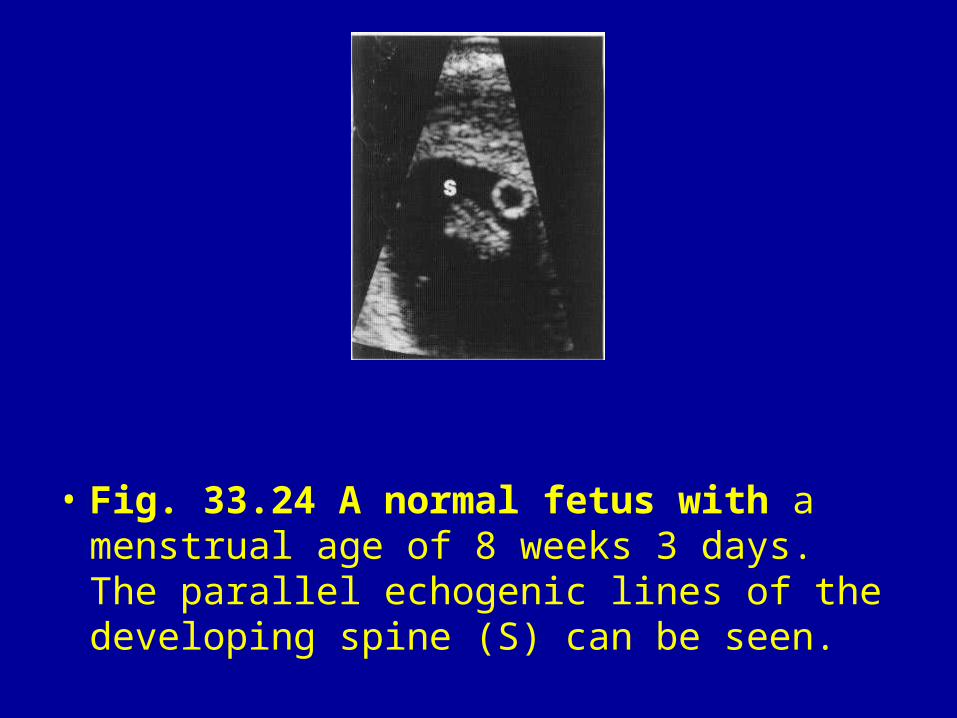
• Fig. 33.24 A normal fetus with a menstrual age of 8 weeks 3 days. The parallel echogenic lines of the developing spine (S) can be seen.
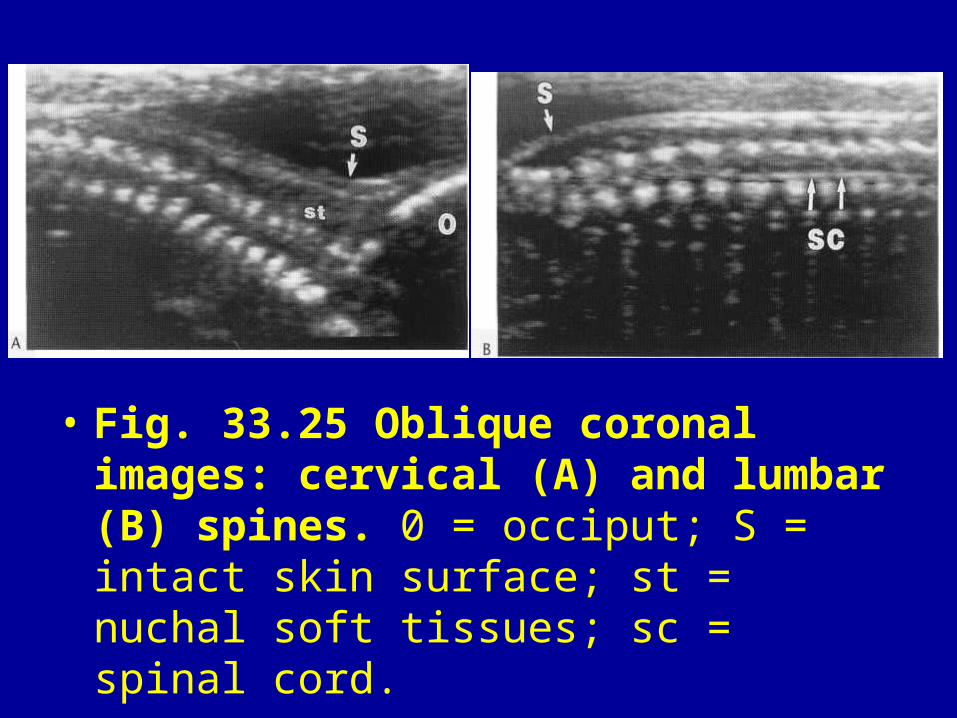
• Fig. 33.25 Oblique coronal images: cervical (A) and lumbar (B) spines. 0 = occiput; S = intact skin surface; st = nuchal soft tissues; sc = spinal cord.
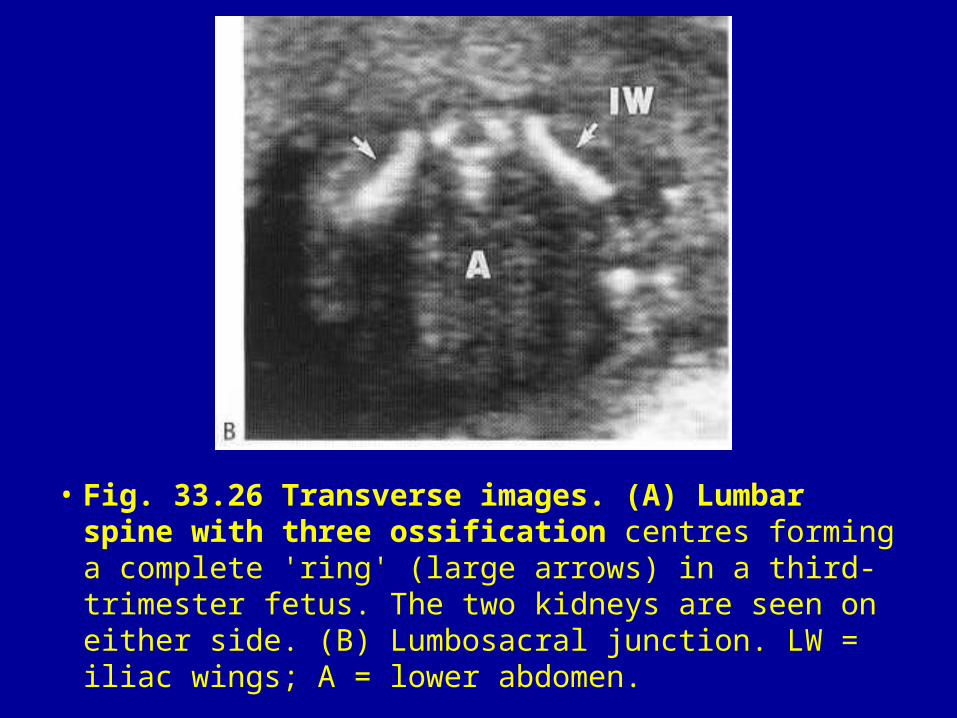
• Fig. 33.26 Transverse images. (A) Lumbar spine with three ossification centres forming a complete 'ring' (large arrows) in a third-trimester fetus. The two kidneys are seen on either side. (B) Lumbosacral junction. LW = iliac wings; A = lower abdomen.
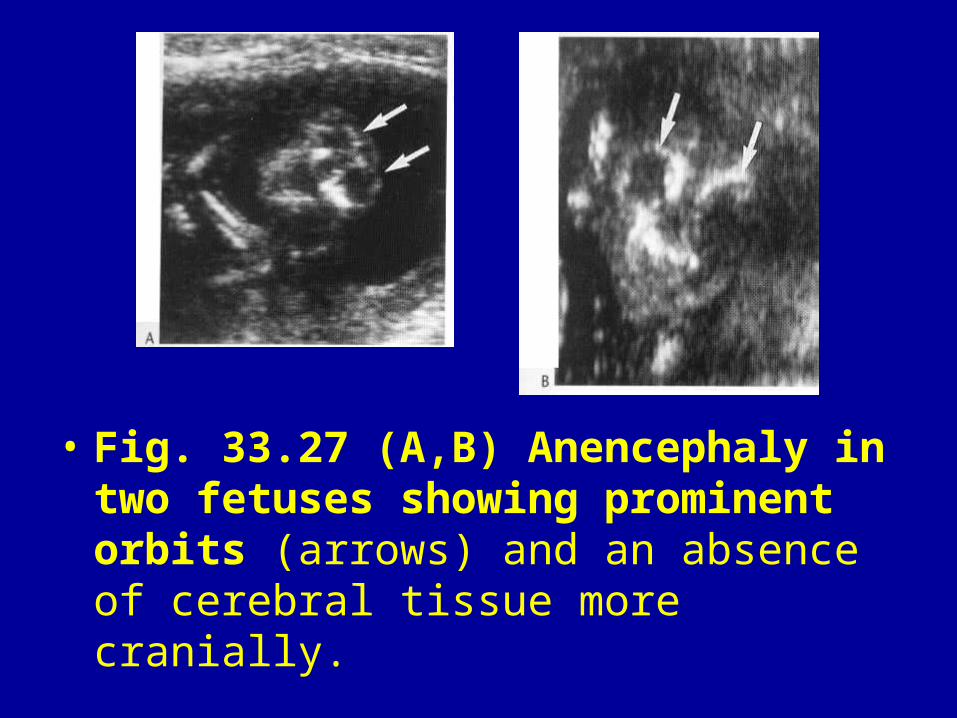
• Fig. 33.27 (A,B) Anencephaly in two fetuses showing prominent orbits (arrows) and an absence of cerebral tissue more cranially.
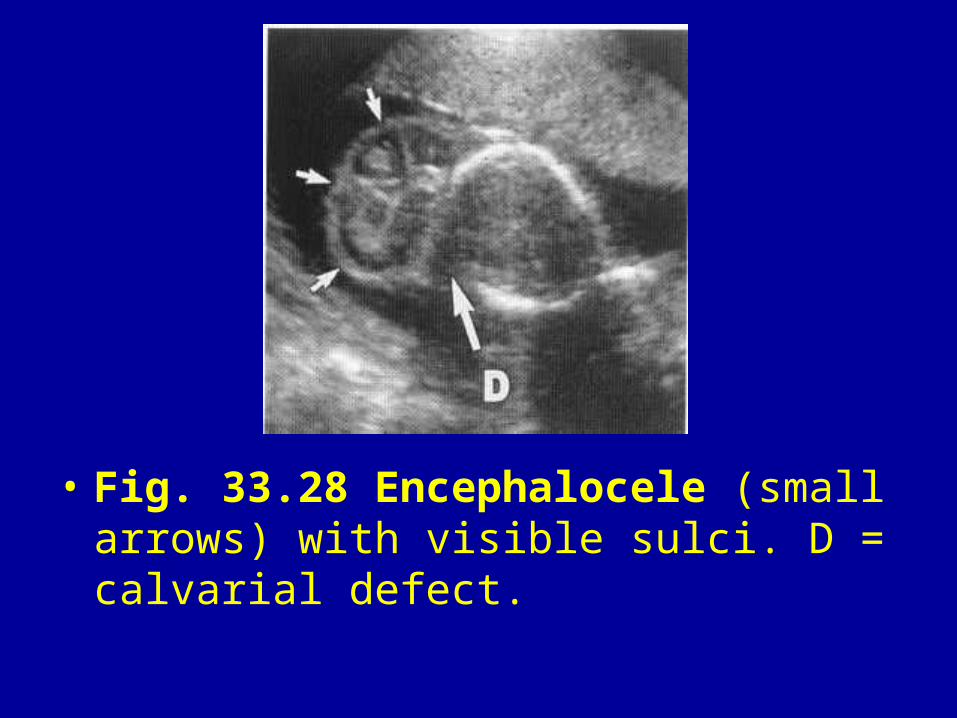
• Fig. 33.28 Encephalocele (small arrows) with visible sulci. D = calvarial defect.
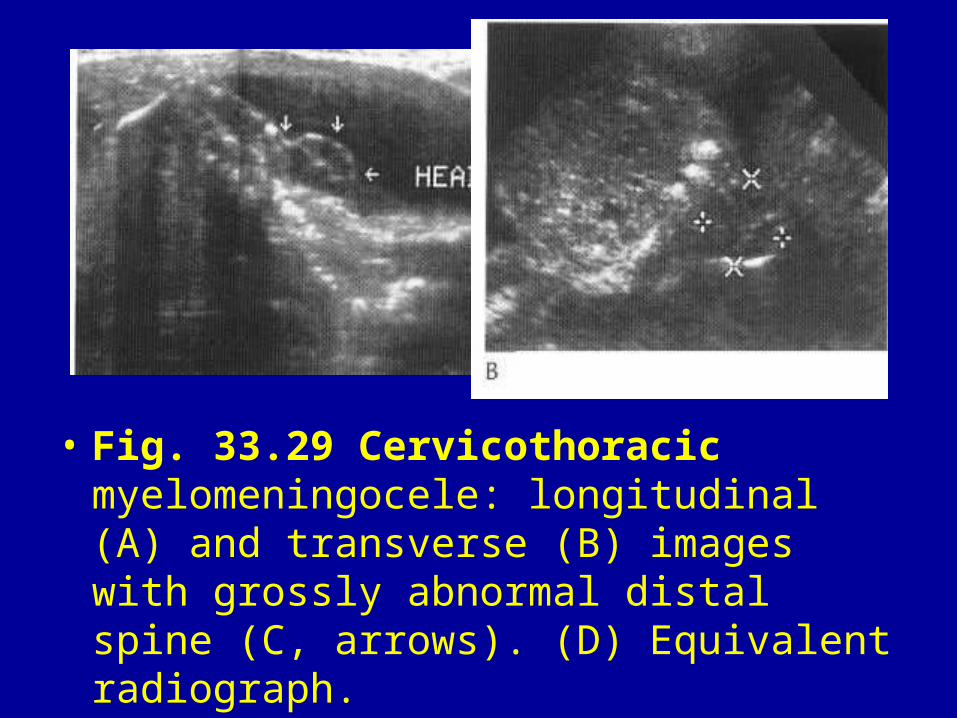
• Fig. 33.29 Cervicothoracic myelomeningocele: longitudinal (A) and transverse (B) images with grossly abnormal distal spine (C, arrows). (D) Equivalent radiograph.
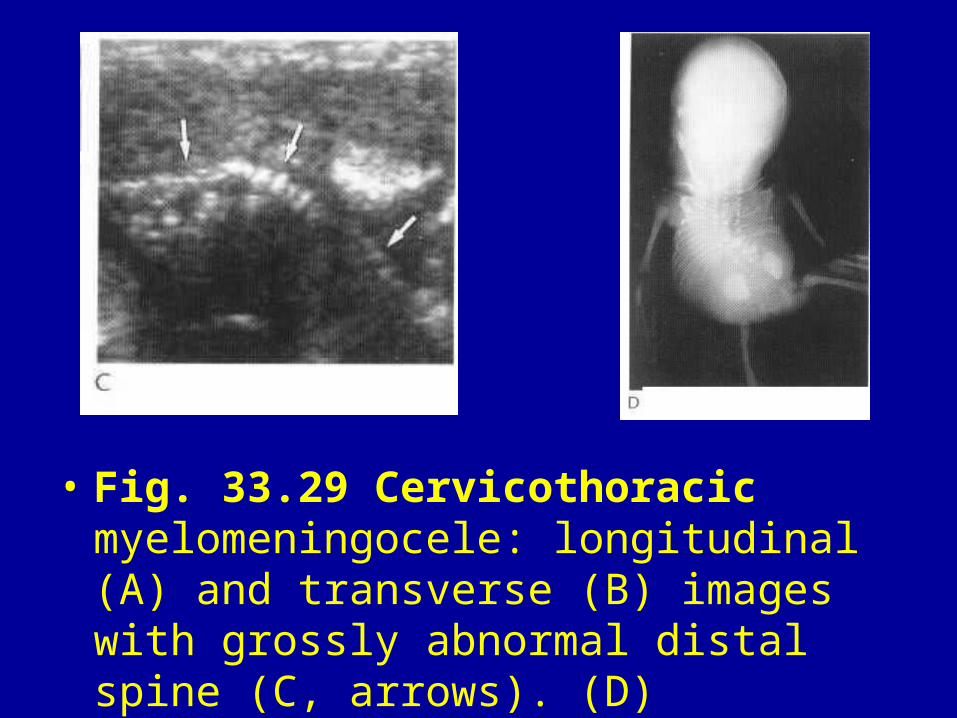
• Fig. 33.29 Cervicothoracic myelomeningocele: longitudinal (A) and transverse (B) images with grossly abnormal distal spine (C, arrows). (D) Equivalent radiograph.
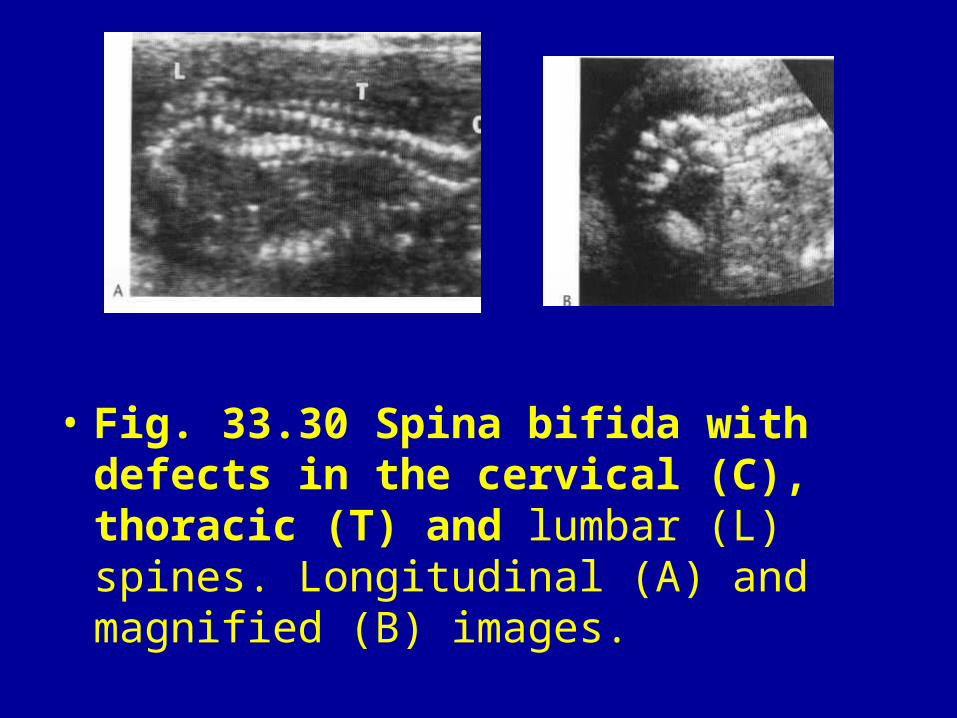
• Fig. 33.30 Spina bifida with defects in the cervical (C), thoracic (T) and lumbar (L) spines. Longitudinal (A) and magnified (B) images.
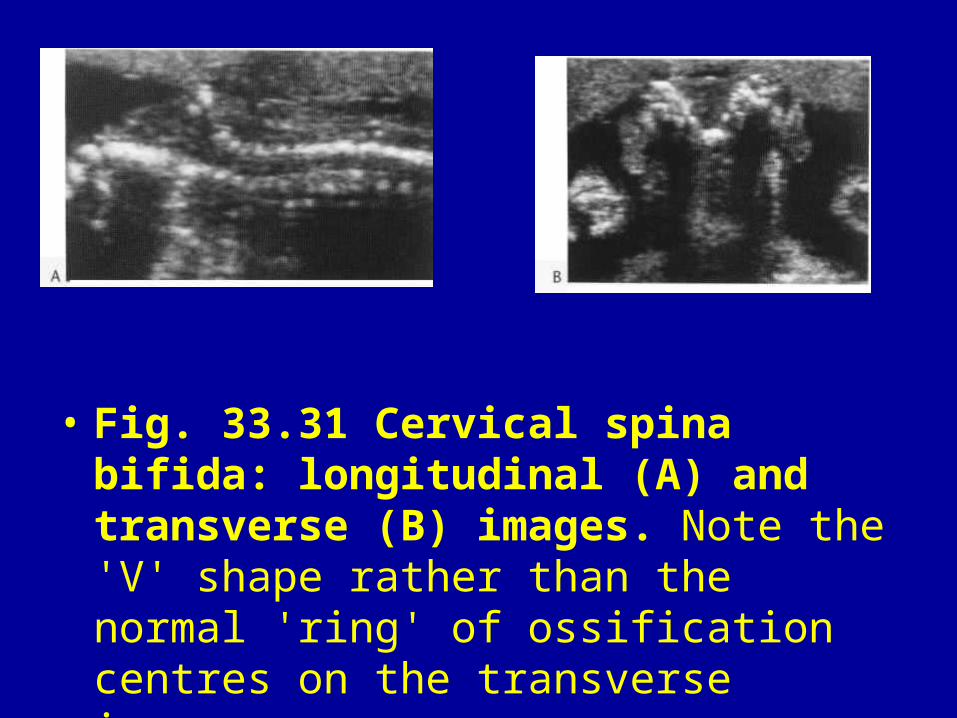
• Fig. 33.31 Cervical spina bifida: longitudinal (A) and transverse (B) images. Note the 'V' shape rather than the normal 'ring' of ossification centres on the transverse image.
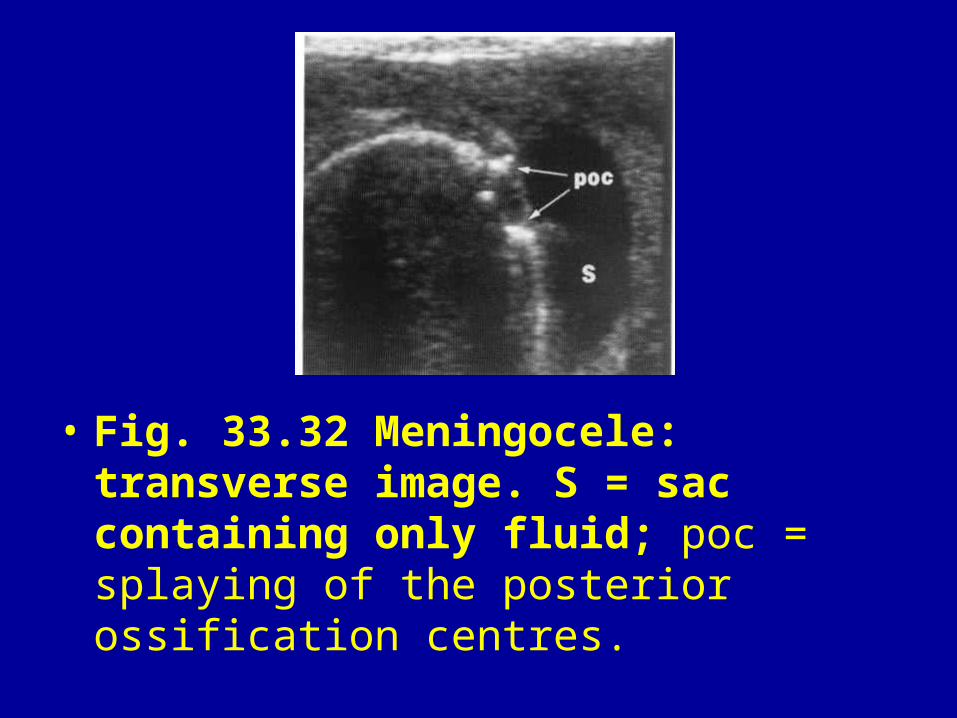
• Fig. 33.32 Meningocele: transverse image. S = sac containing only fluid; poc = splaying of the posterior ossification centres.
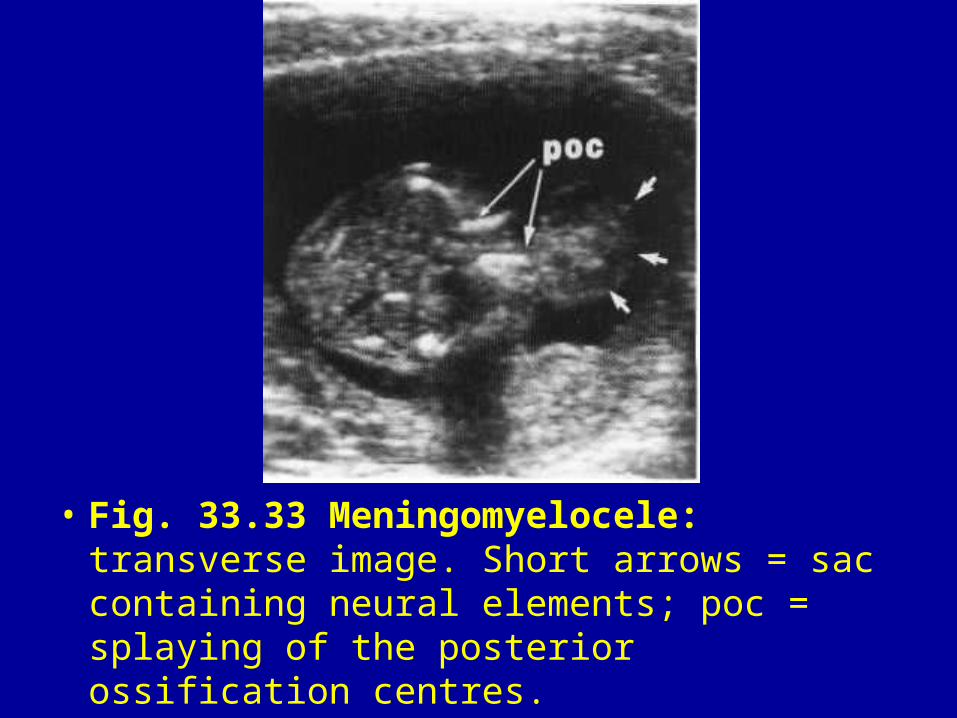
• Fig. 33.33 Meningomyelocele: transverse image. Short arrows = sac containing neural elements; poc = splaying of the posterior ossification centres.
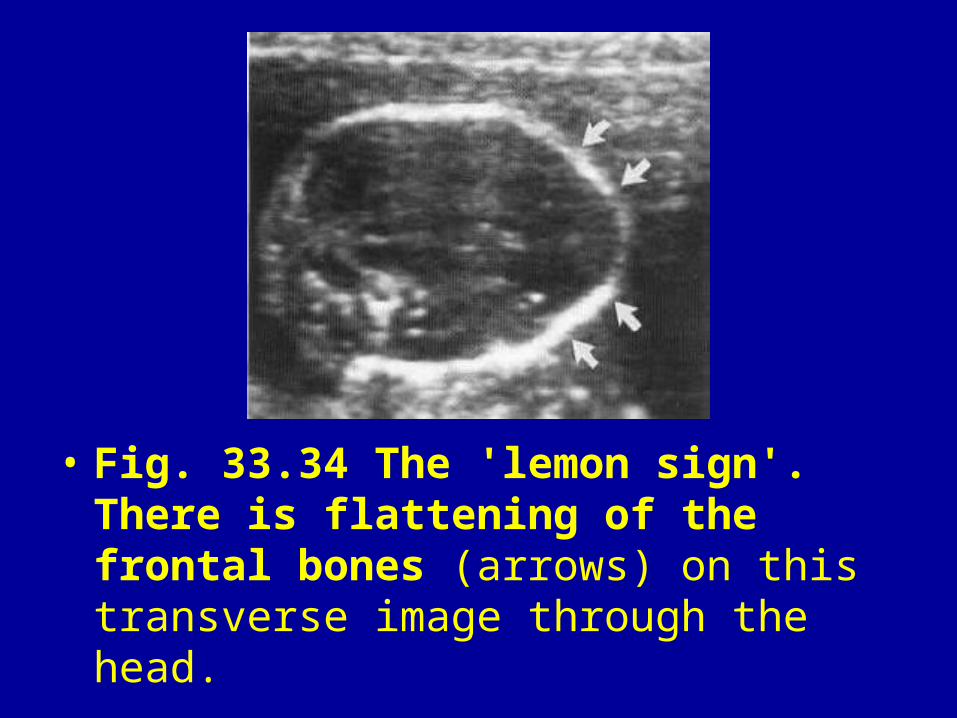
• Fig. 33.34 The 'lemon sign'. There is flattening of the frontal bones (arrows) on this transverse image through the head.
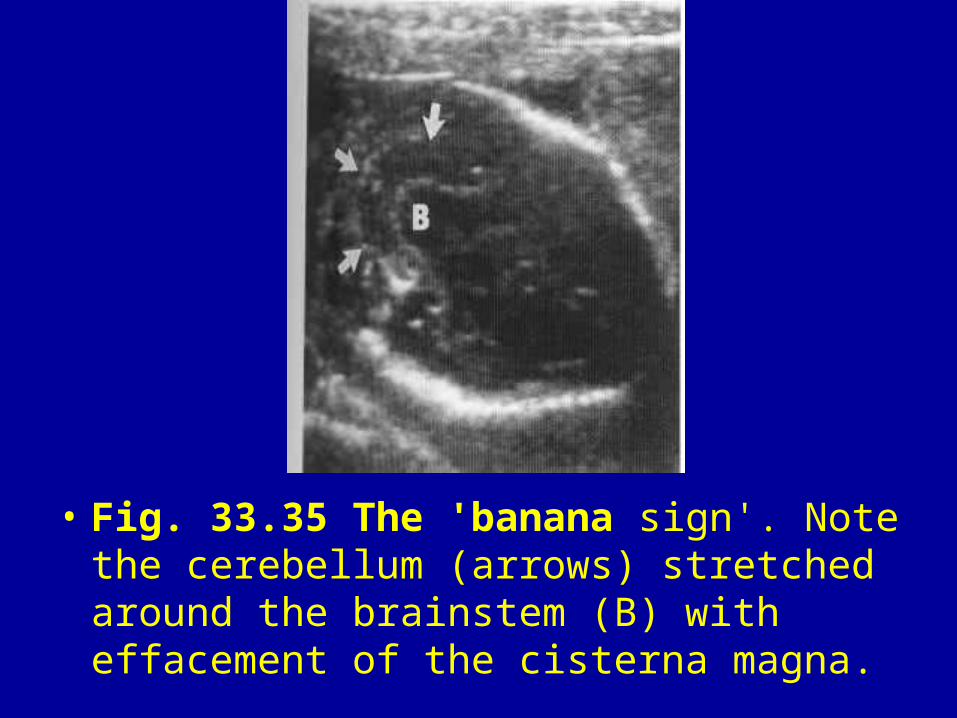
• Fig. 33.35 The 'banana sign'. Note the cerebellum (arrows) stretched around the brainstem (B) with effacement of the cisterna magna.
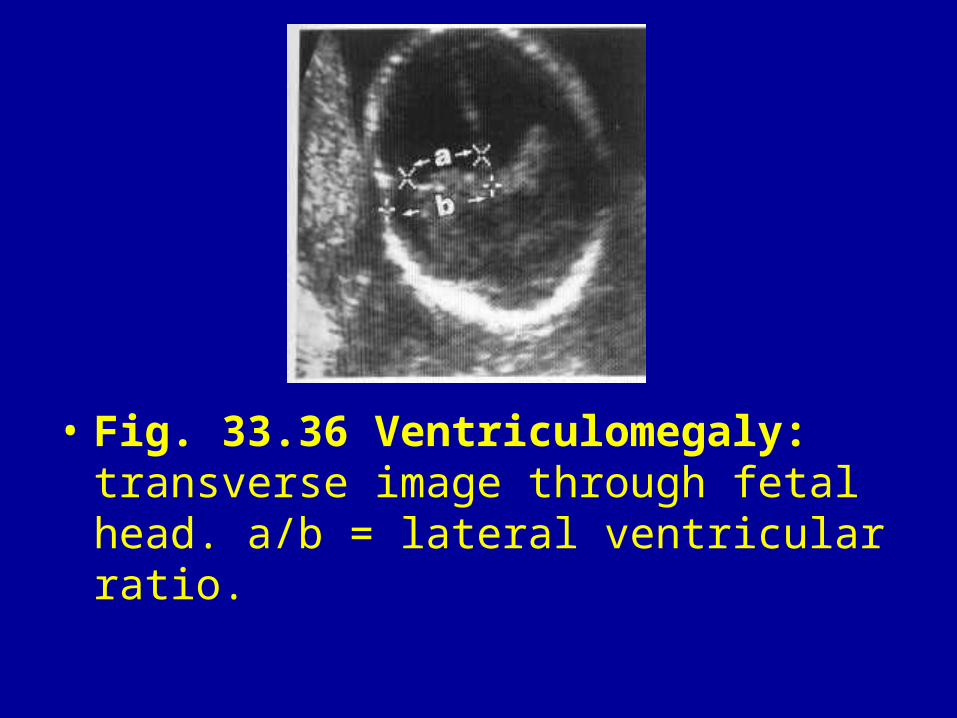
• Fig. 33.36 Ventriculomegaly: transverse image through fetal head. a/b = lateral ventricular ratio.
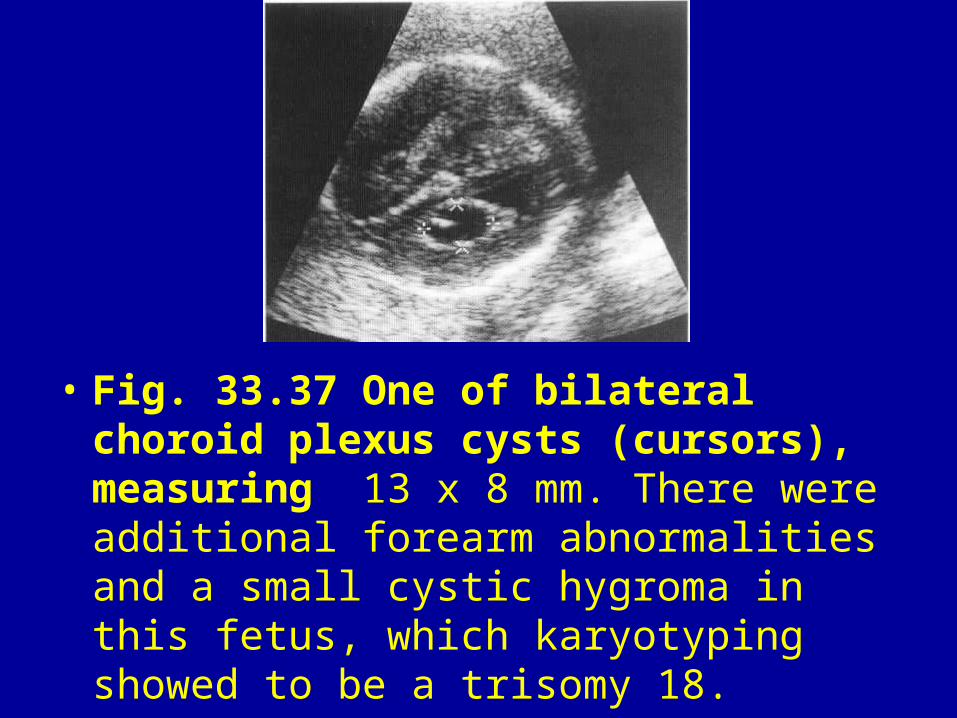
• Fig. 33.37 One of bilateral choroid plexus cysts (cursors), measuring 13 x 8 mm. There were additional forearm abnormalities and a small cystic hygroma in this fetus, which karyotyping showed to be a trisomy 18.
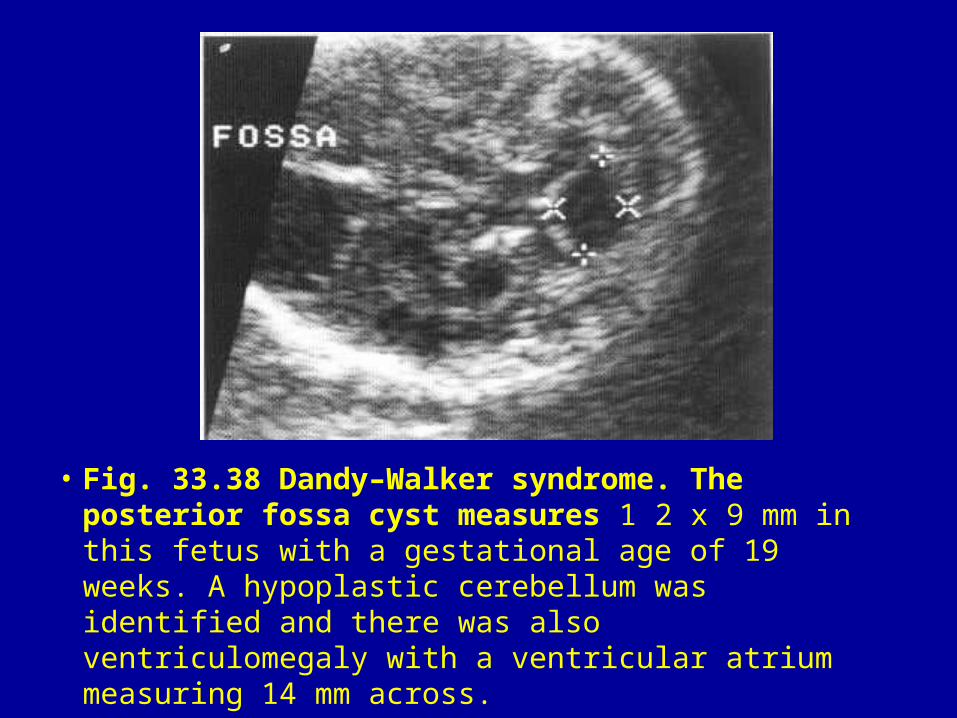
• Fig. 33.38 Dandy–Walker syndrome. The posterior fossa cyst measures 1 2 x 9 mm in this fetus with a gestational age of 19 weeks. A hypoplastic cerebellum was identified and there was also ventriculomegaly with a ventricular atrium measuring 14 mm across.
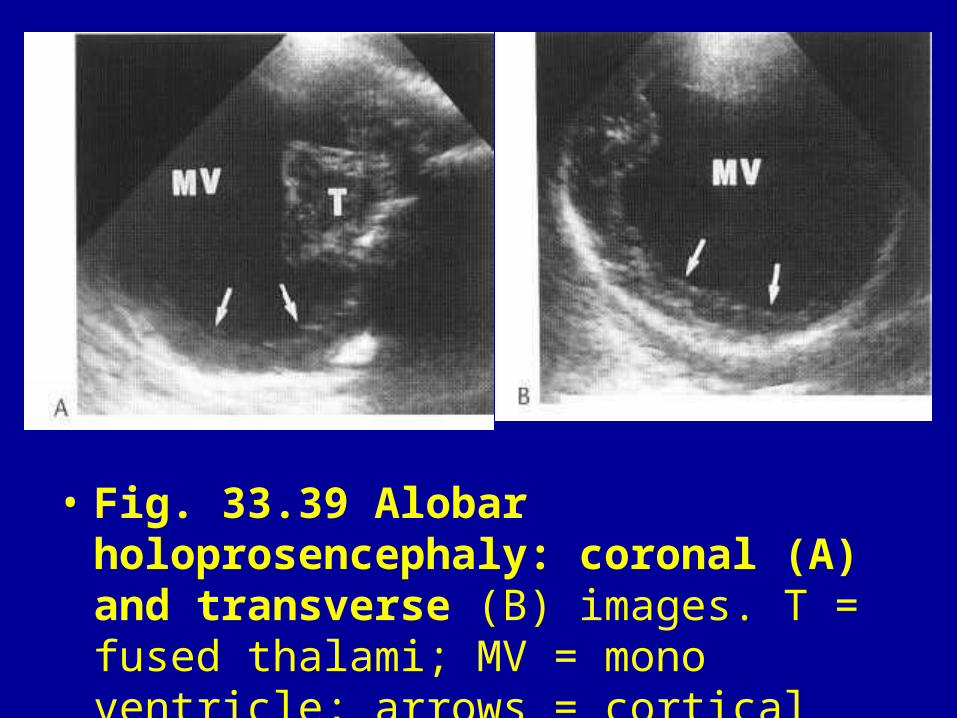
• Fig. 33.39 Alobar holoprosencephaly: coronal (A) and transverse (B) images. T = fused thalami; MV = mono ventricle; arrows = cortical mantle.
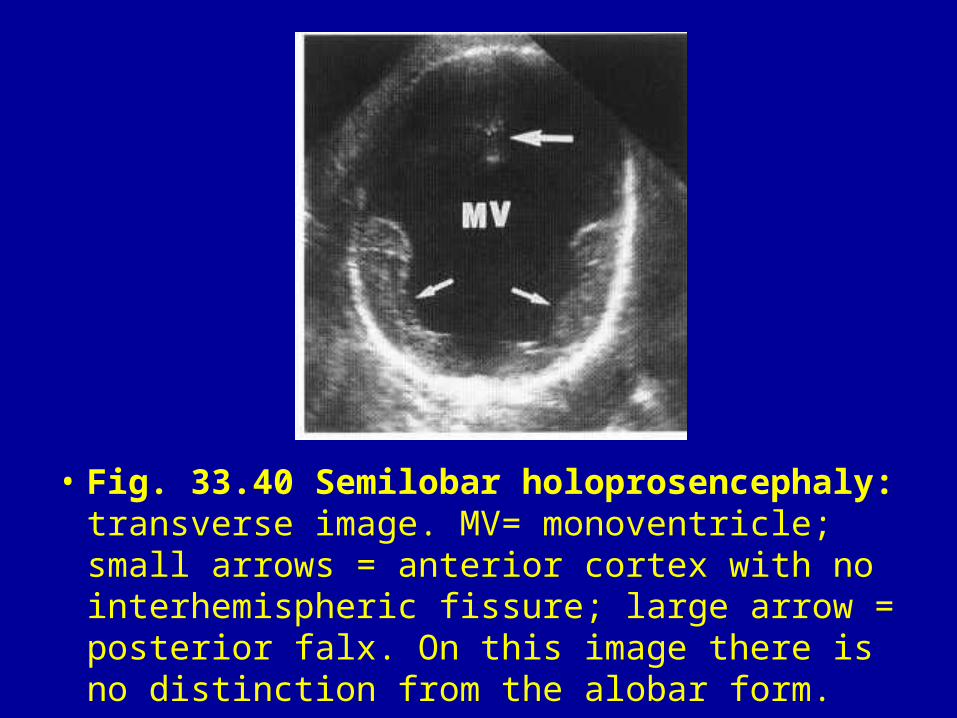
• Fig. 33.40 Semilobar holoprosencephaly: transverse image. MV= monoventricle; small arrows = anterior cortex with no interhemispheric fissure; large arrow = posterior falx. On this image there is no distinction from the alobar form.
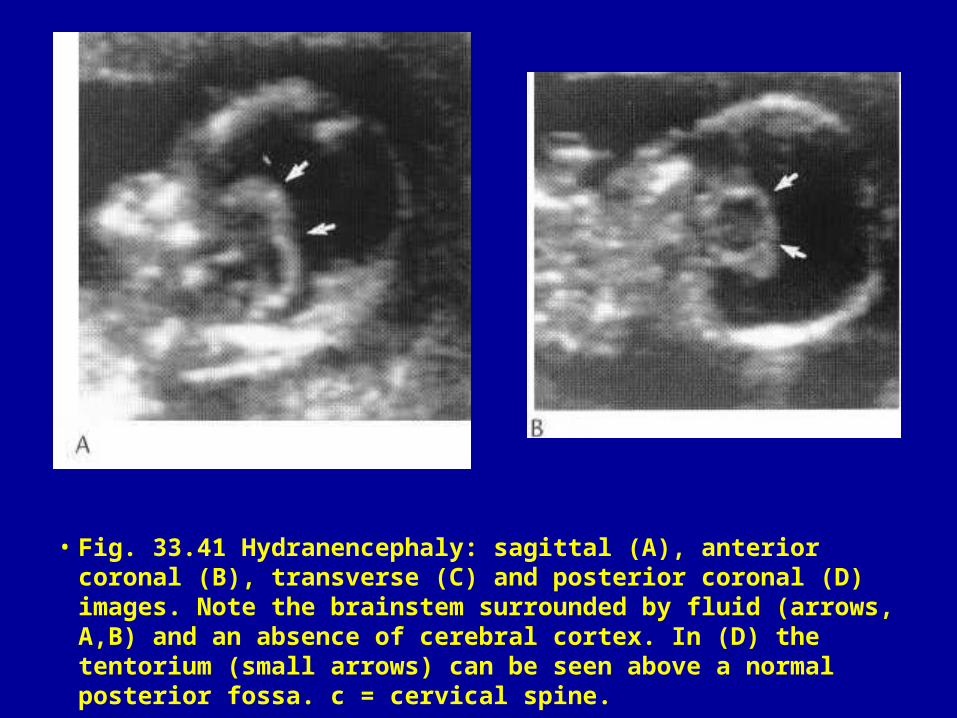
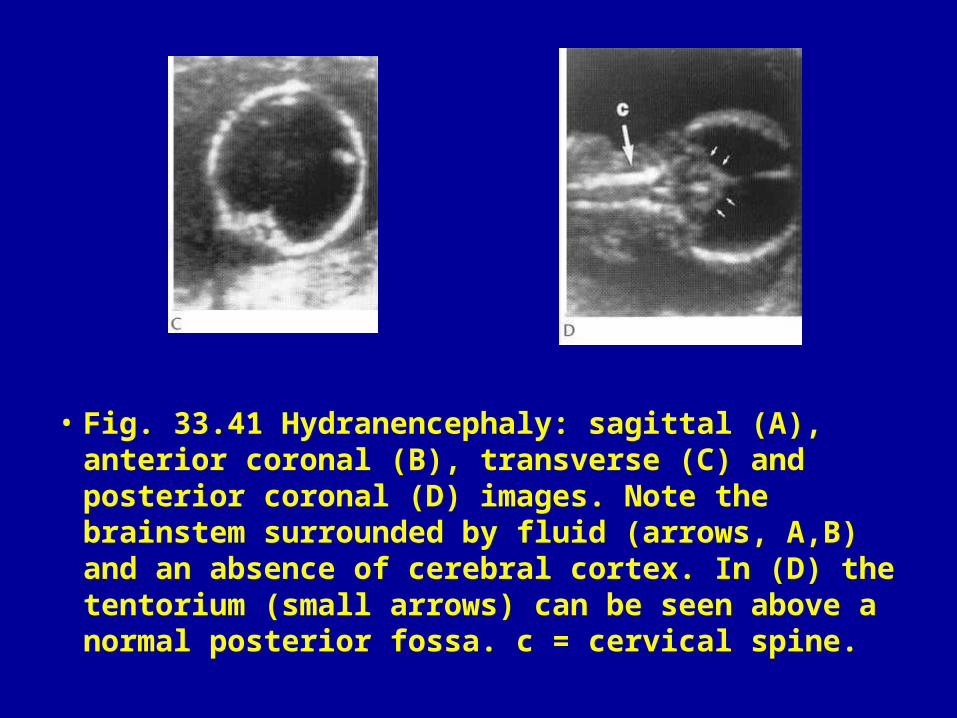
• Fig. 33.41 Hydranencephaly: sagittal (A), anterior coronal (B), transverse (C) and posterior coronal (D) images. Note the brainstem surrounded by fluid (arrows, A,B) and an absence of cerebral cortex. In (D) the tentorium (small arrows) can be seen above a normal posterior fossa. c = cervical spine.
• Fig. 33.41 Hydranencephaly: sagittal (A), anterior coronal (B), transverse (C) and posterior coronal (D) images. Note the brainstem surrounded by fluid (arrows, A,B) and an absence of cerebral cortex. In (D) the tentorium (small arrows) can be seen above a normal posterior fossa. c = cervical spine.
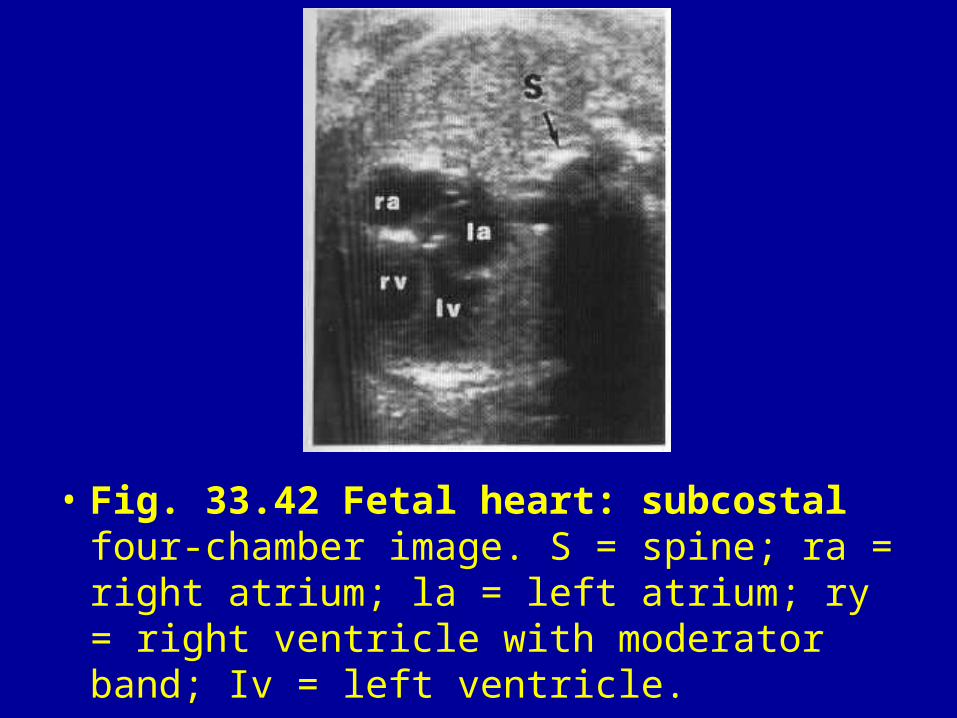
• Fig. 33.42 Fetal heart: subcostal four-chamber image. S = spine; ra = right atrium; la = left atrium; ry = right ventricle with moderator band; Iv = left ventricle.
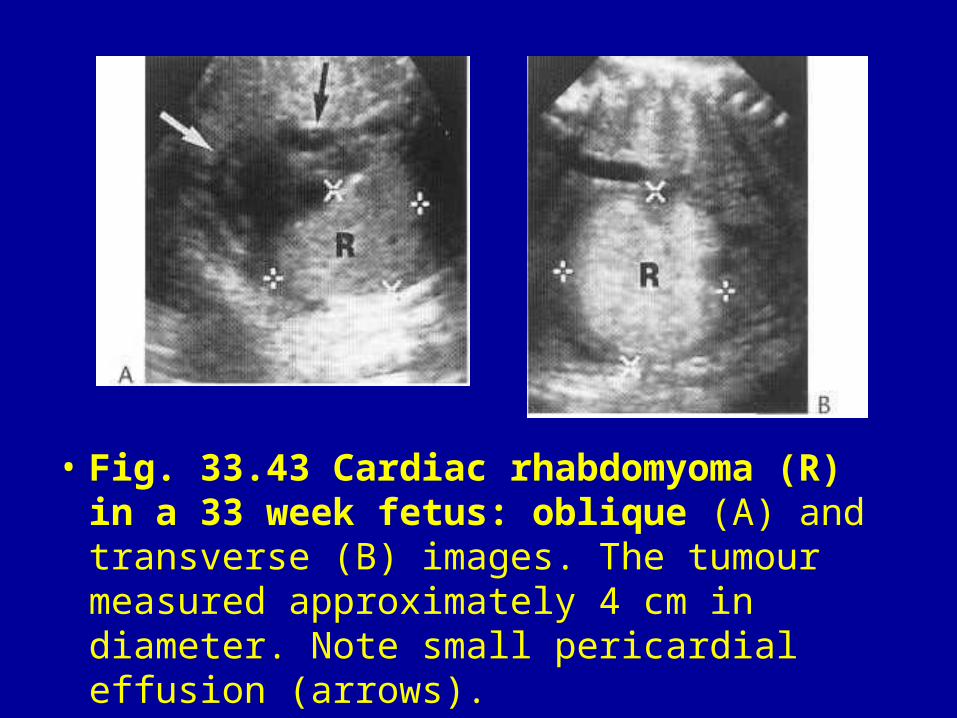
• Fig. 33.43 Cardiac rhabdomyoma (R) in a 33 week fetus: oblique (A) and transverse (B) images. The tumour measured approximately 4 cm in diameter. Note small pericardial effusion (arrows).
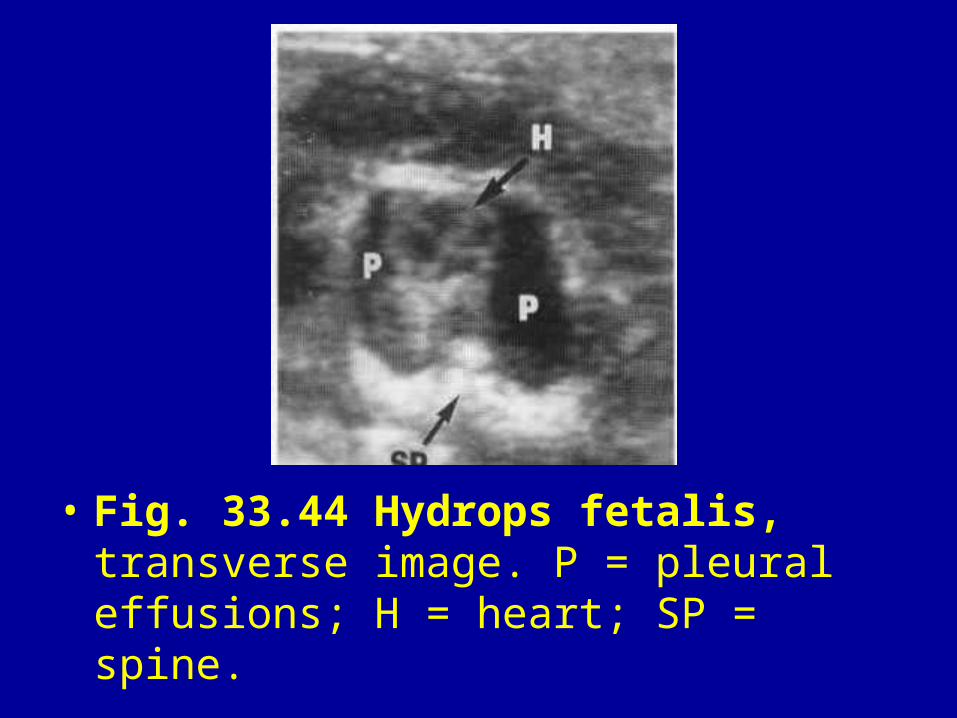
• Fig. 33.44 Hydrops fetalis, transverse image. P = pleural effusions; H = heart; SP = spine.
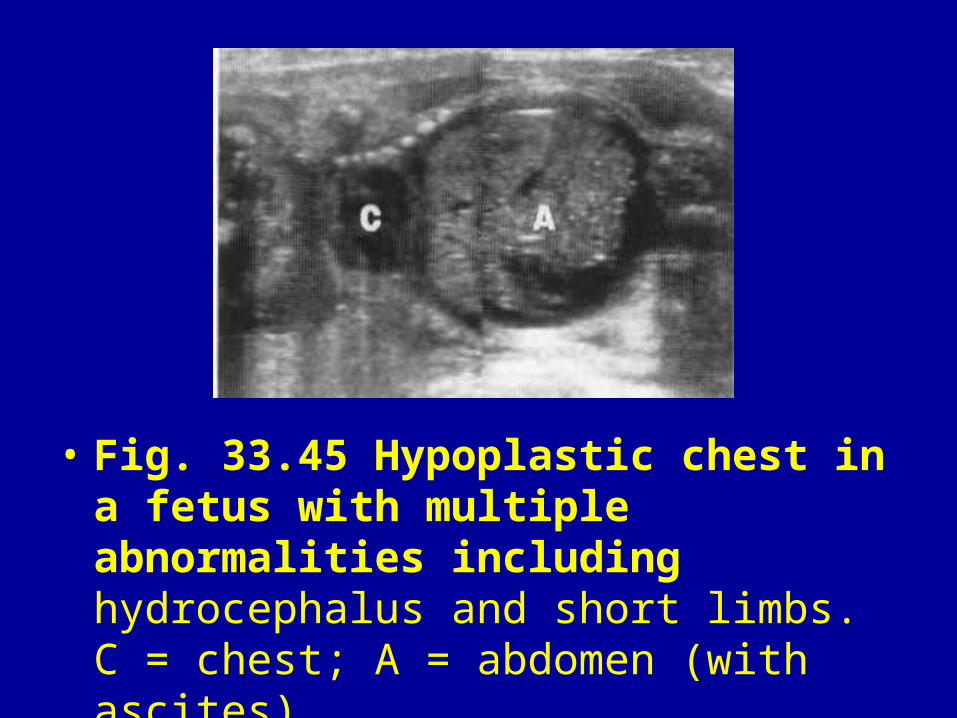
• Fig. 33.45 Hypoplastic chest in a fetus with multiple abnormalities including hydrocephalus and short limbs. C = chest; A = abdomen (with ascites).
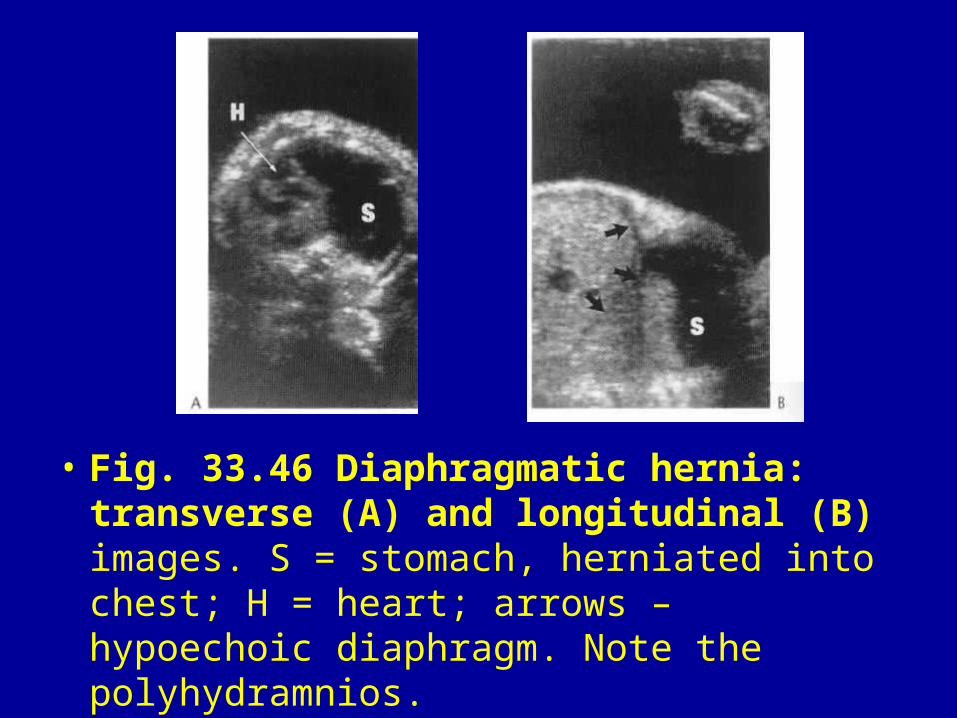
• Fig. 33.46 Diaphragmatic hernia: transverse (A) and longitudinal (B) images. S = stomach, herniated into chest; H = heart; arrows – hypoechoic diaphragm. Note the polyhydramnios.
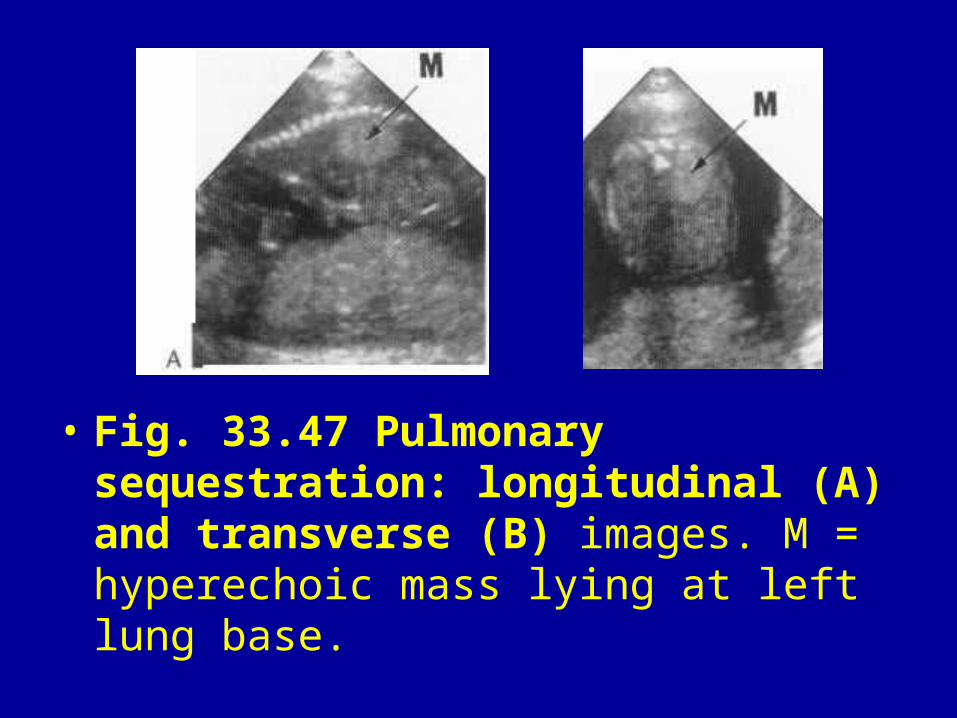
• Fig. 33.47 Pulmonary sequestration: longitudinal (A) and transverse (B) images. M = hyperechoic mass lying at left lung base.
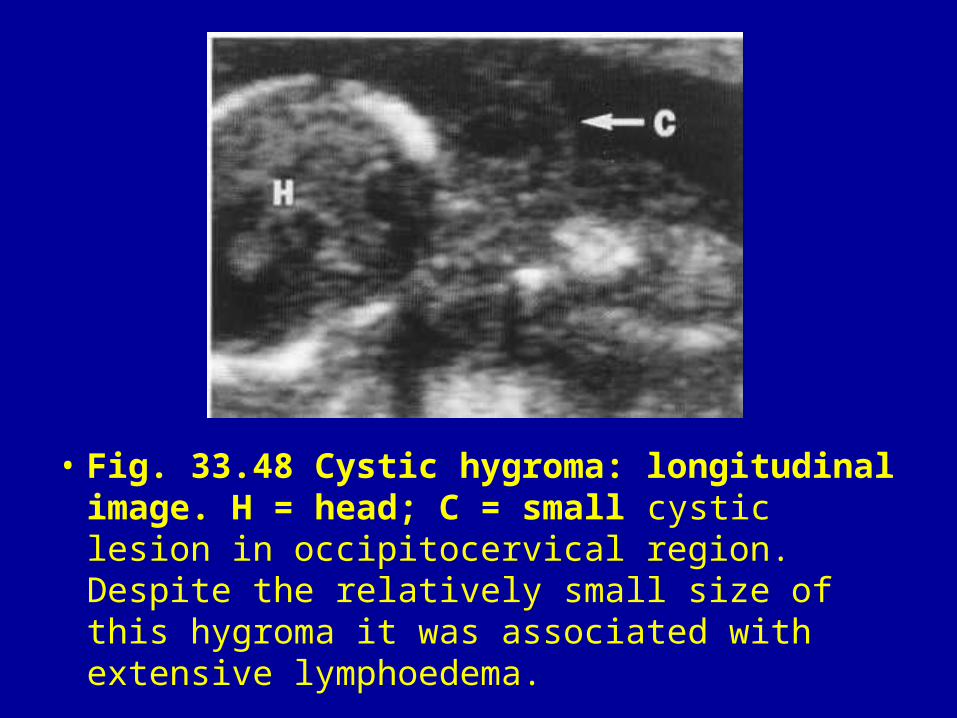
• Fig. 33.48 Cystic hygroma: longitudinal image. H = head; C = small cystic lesion in occipitocervical region. Despite the relatively small size of this hygroma it was associated with extensive lymphoedema.
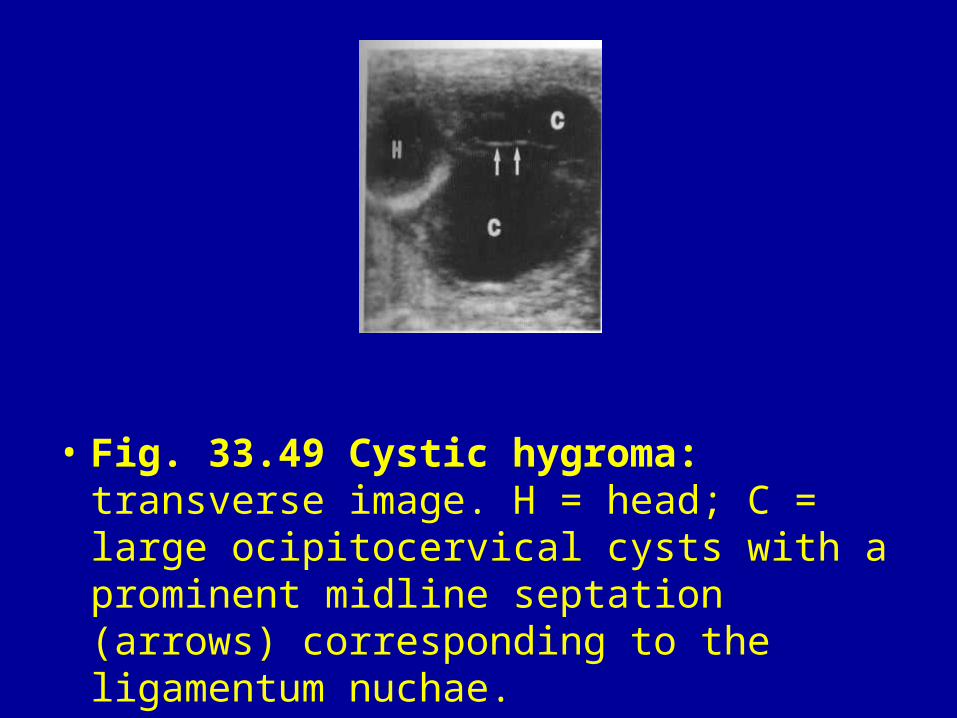
• Fig. 33.49 Cystic hygroma: transverse image. H = head; C = large ocipitocervical cysts with a prominent midline septation (arrows) corresponding to the ligamentum nuchae.
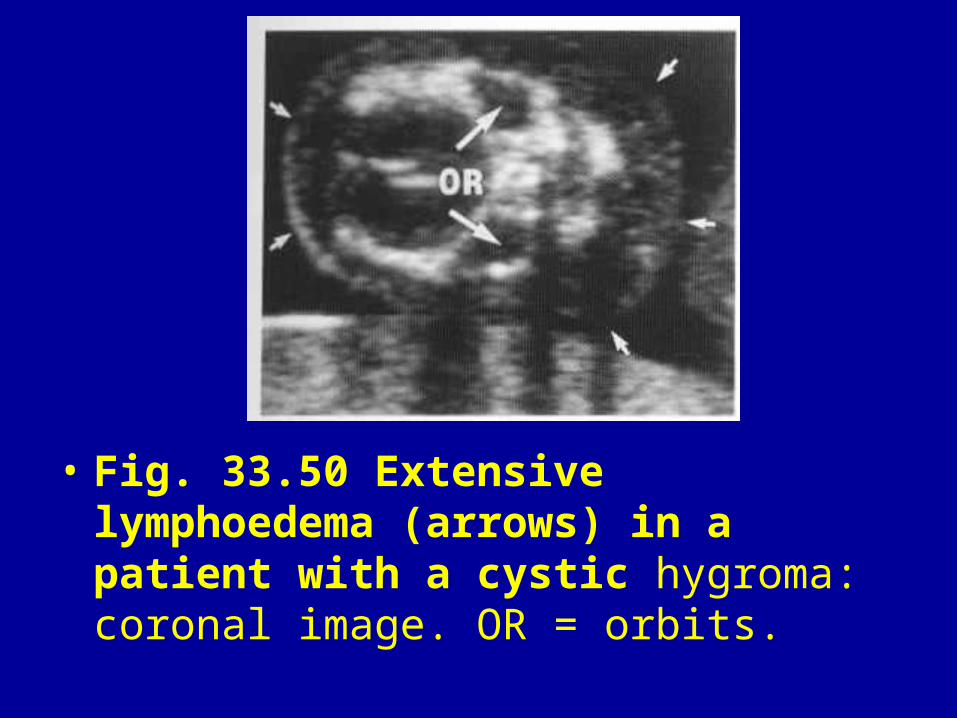
• Fig. 33.50 Extensive lymphoedema (arrows) in a patient with a cystic hygroma: coronal image. OR = orbits.
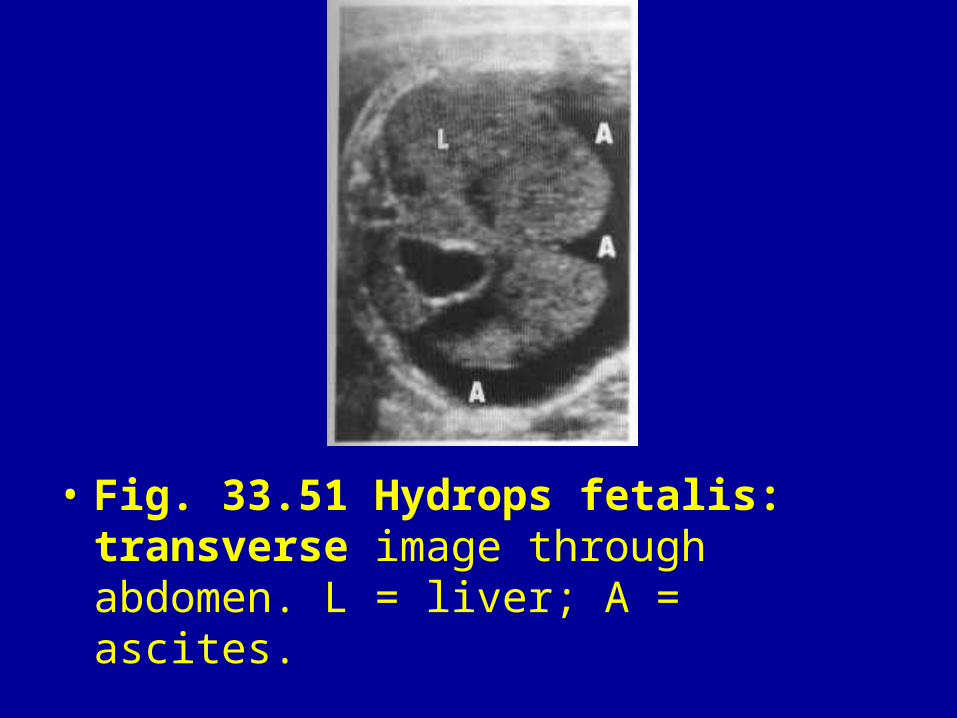
• Fig. 33.51 Hydrops fetalis: transverse image through abdomen. L = liver; A = ascites.
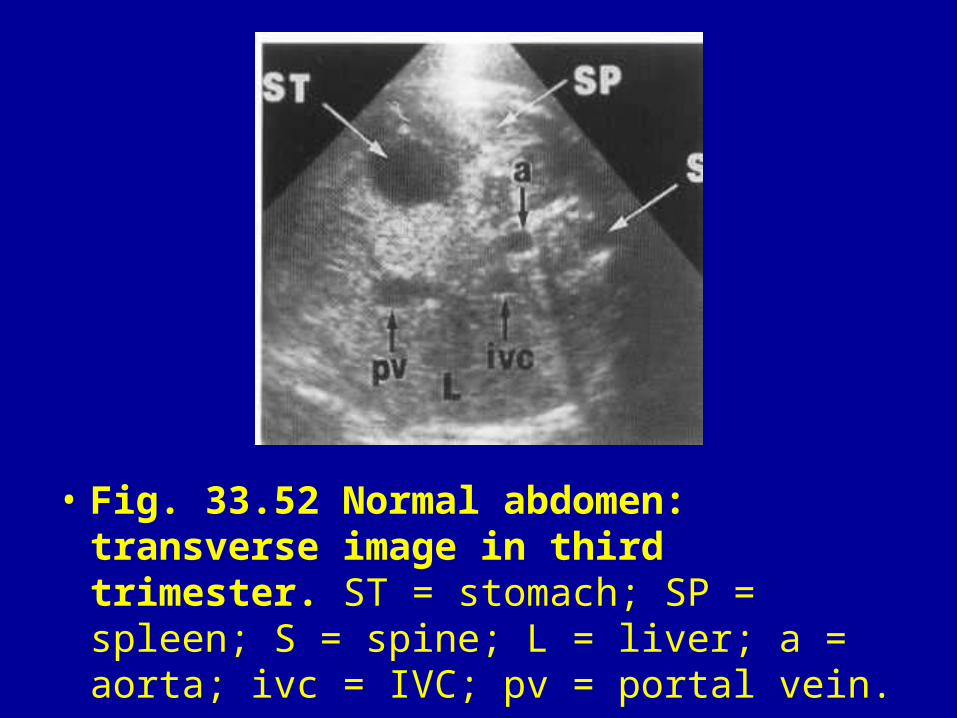
• Fig. 33.52 Normal abdomen: transverse image in third trimester. ST = stomach; SP = spleen; S = spine; L = liver; a = aorta; ivc = IVC; pv = portal vein.
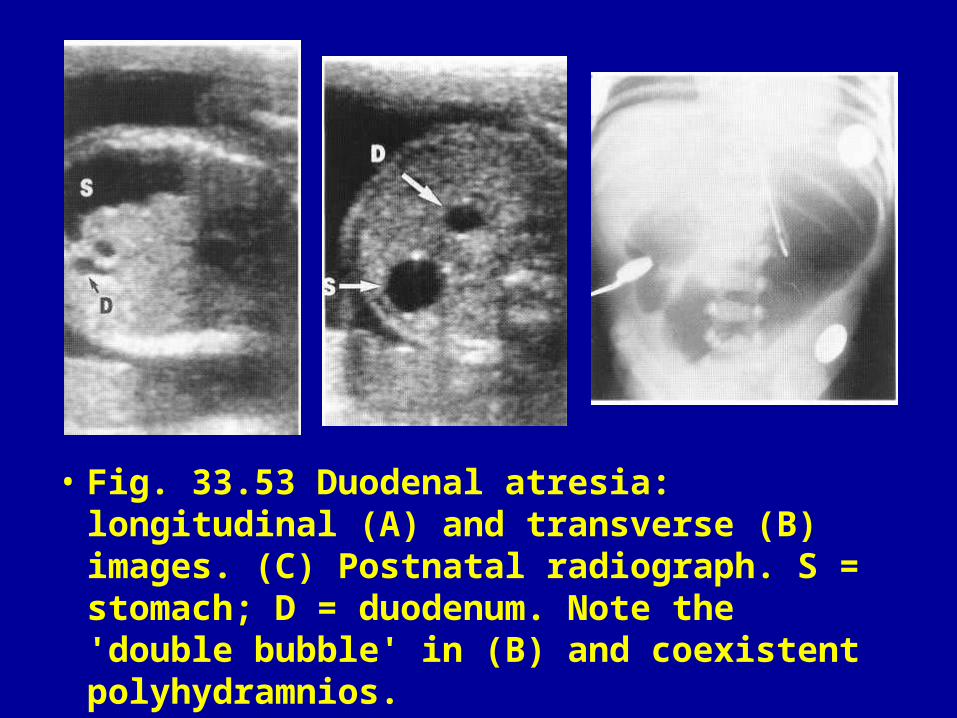
• Fig. 33.53 Duodenal atresia: longitudinal (A) and transverse (B) images. (C) Postnatal radiograph. S = stomach; D = duodenum. Note the 'double bubble' in (B) and coexistent polyhydramnios.
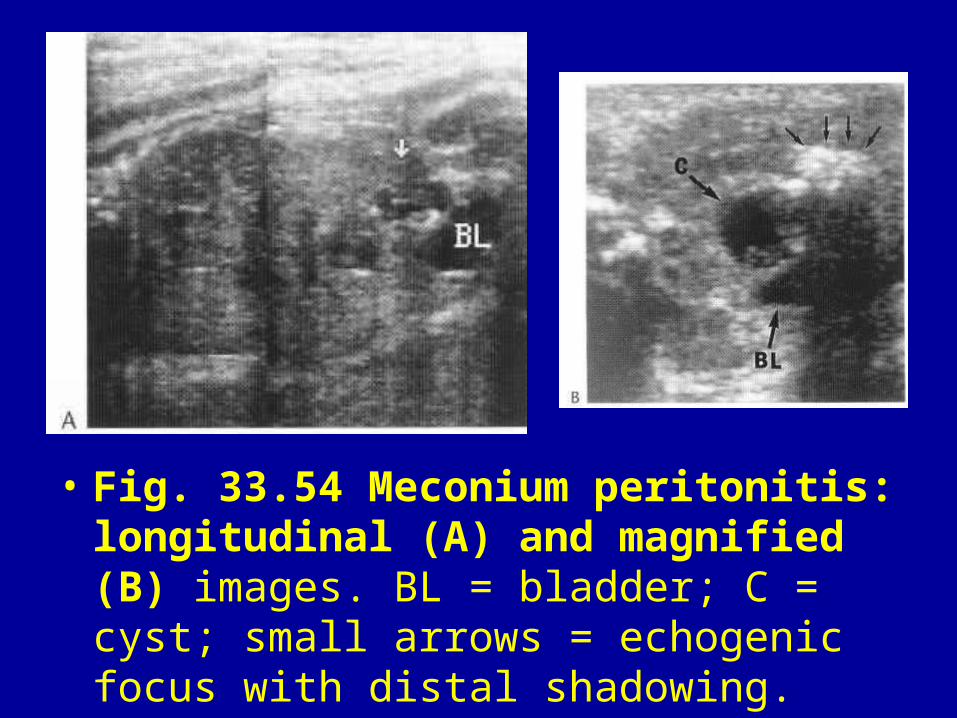
• Fig. 33.54 Meconium peritonitis: longitudinal (A) and magnified (B) images. BL = bladder; C = cyst; small arrows = echogenic focus with distal shadowing.
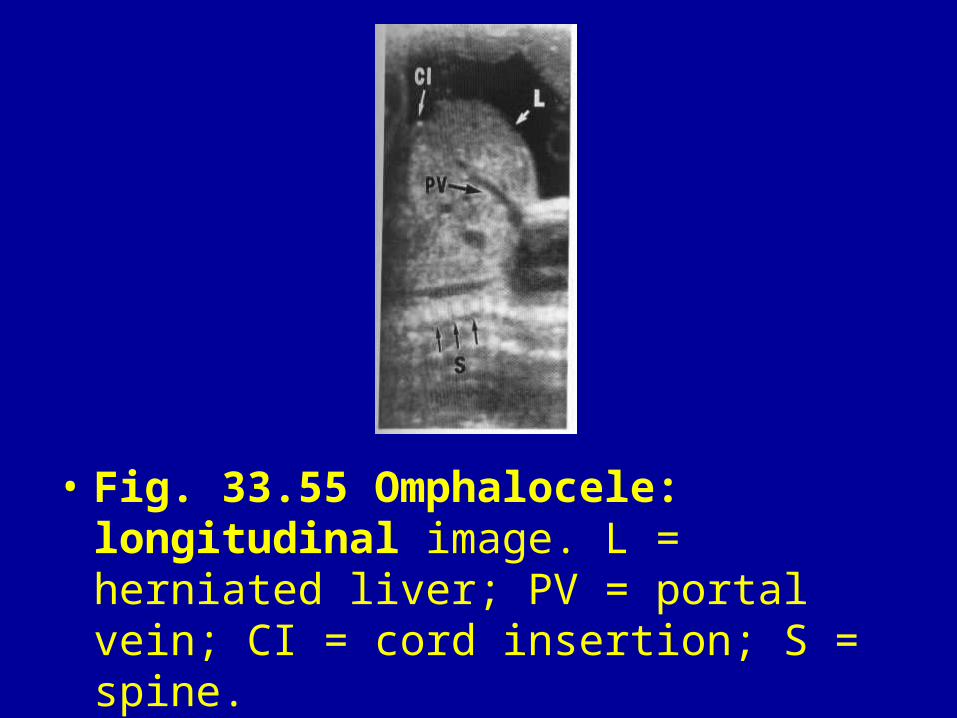
• Fig. 33.55 Omphalocele: longitudinal image. L = herniated liver; PV = portal vein; CI = cord insertion; S = spine.
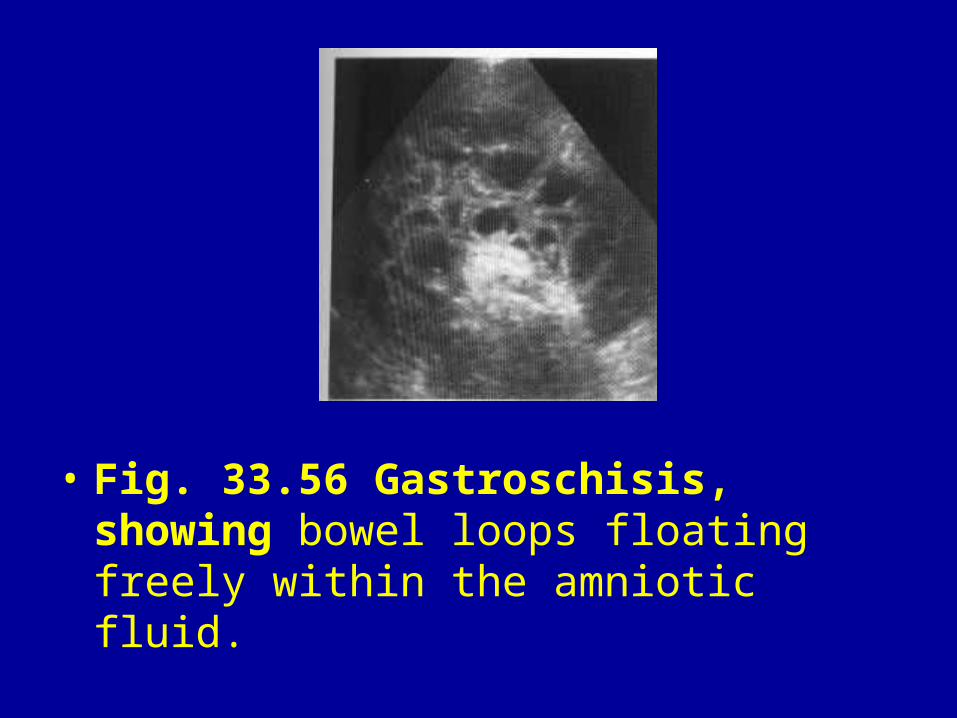
• Fig. 33.56 Gastroschisis, showing bowel loops floating freely within the amniotic fluid.
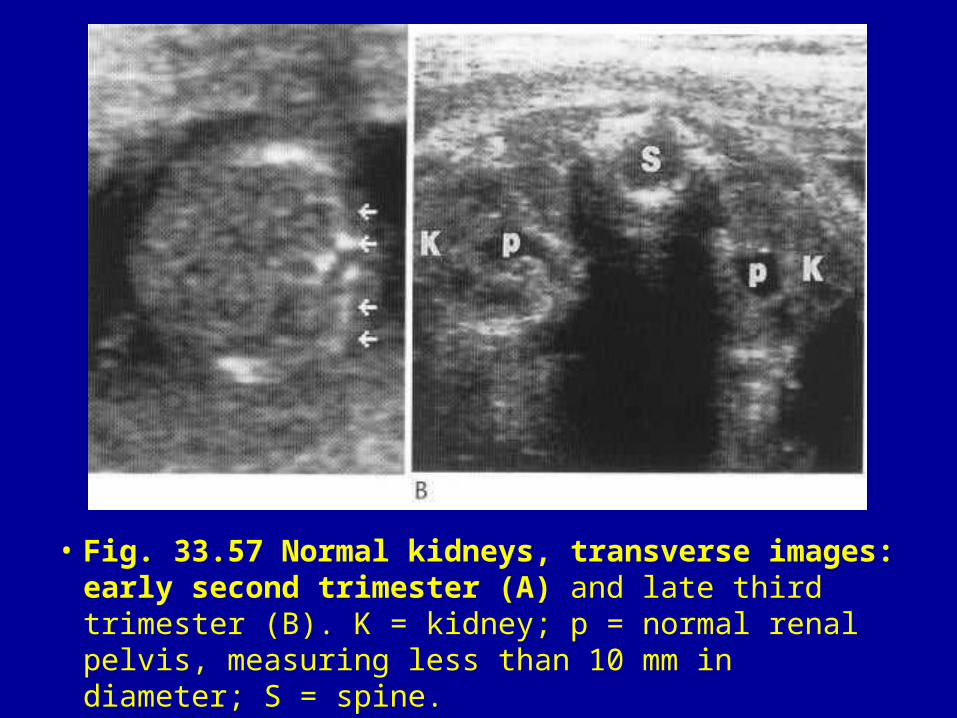
• Fig. 33.57 Normal kidneys, transverse images: early second trimester (A) and late third trimester (B). K = kidney; p = normal renal pelvis, measuring less than 10 mm in diameter; S = spine.
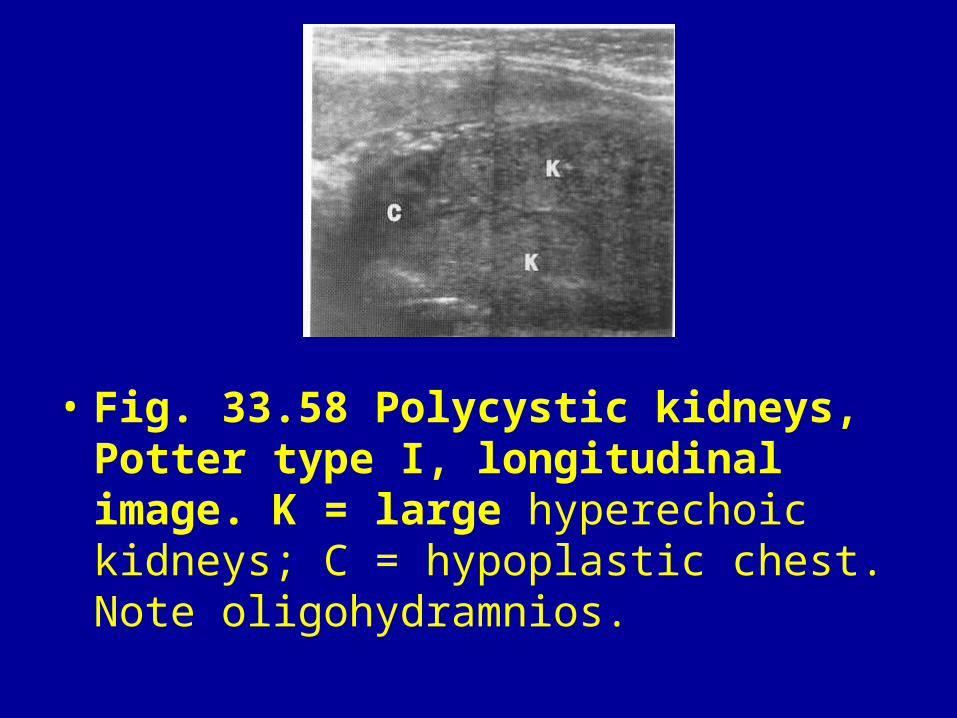
• Fig. 33.58 Polycystic kidneys, Potter type I, longitudinal image. K = large hyperechoic kidneys; C = hypoplastic chest. Note oligohydramnios.
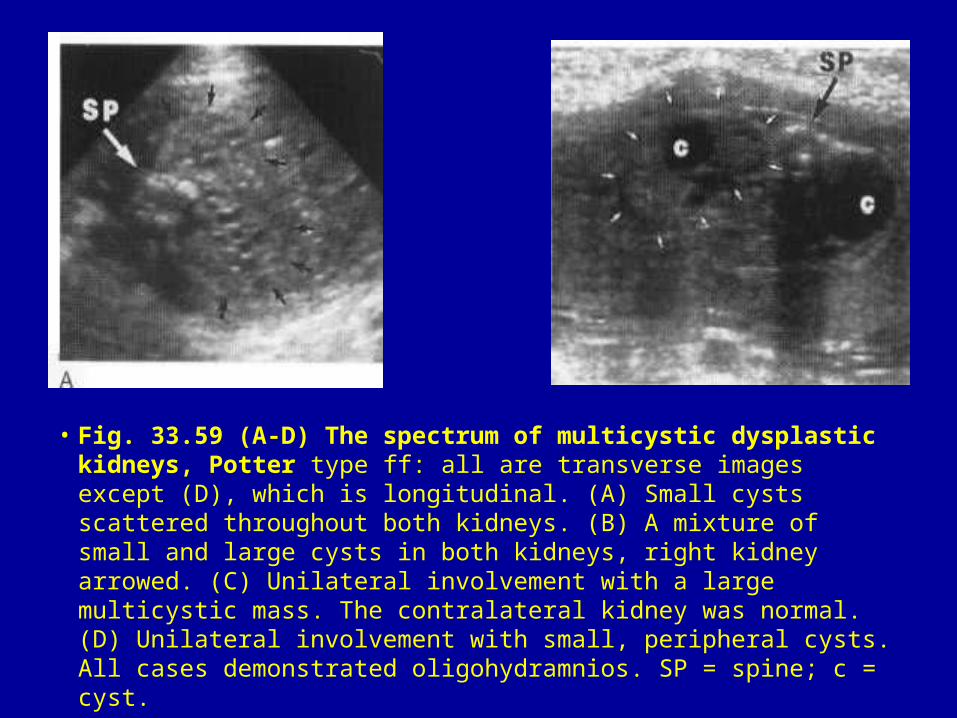
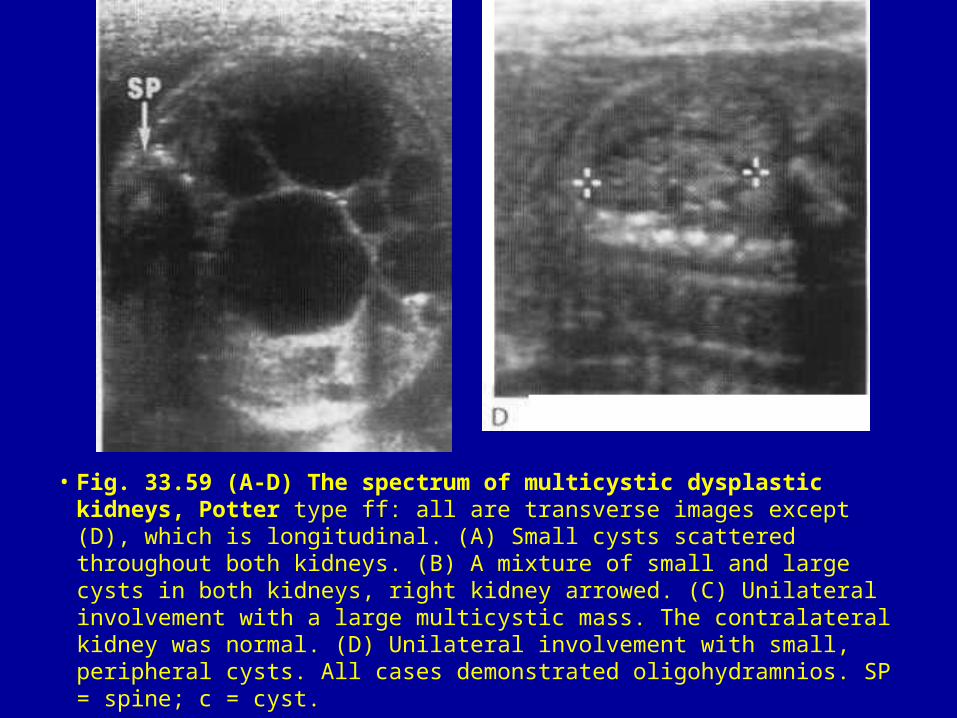
• Fig. 33.59 (A-D) The spectrum of multicystic dysplastic kidneys, Potter type ff: all are transverse images except (D), which is longitudinal. (A) Small cysts scattered throughout both kidneys. (B) A mixture of small and large cysts in both kidneys, right kidney arrowed. (C) Unilateral involvement with a large multicystic mass. The contralateral kidney was normal. (D) Unilateral involvement with small, peripheral cysts. All cases demonstrated oligohydramnios. SP = spine; c = cyst.
• Fig. 33.59 (A-D) The spectrum of multicystic dysplastic kidneys, Potter type ff: all are transverse images except (D), which is longitudinal. (A) Small cysts scattered throughout both kidneys. (B) A mixture of small and large cysts in both kidneys, right kidney arrowed. (C) Unilateral involvement with a large multicystic mass. The contralateral kidney was normal. (D) Unilateral involvement with small, peripheral cysts. All cases demonstrated oligohydramnios. SP = spine; c = cyst.
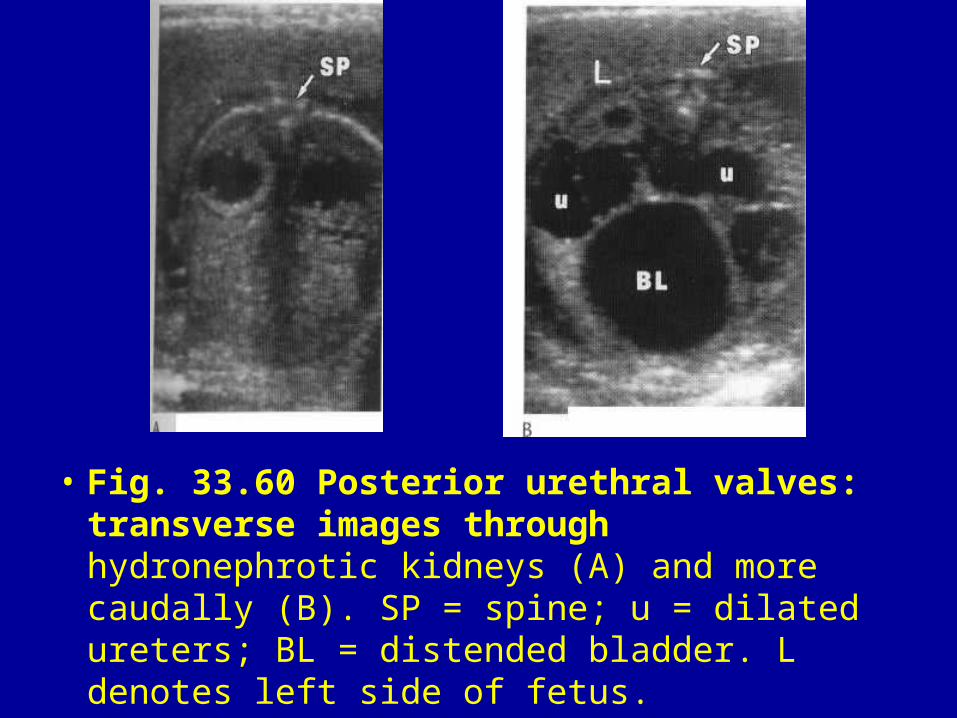
• Fig. 33.60 Posterior urethral valves: transverse images through hydronephrotic kidneys (A) and more caudally (B). SP = spine; u = dilated ureters; BL = distended bladder. L denotes left side of fetus.
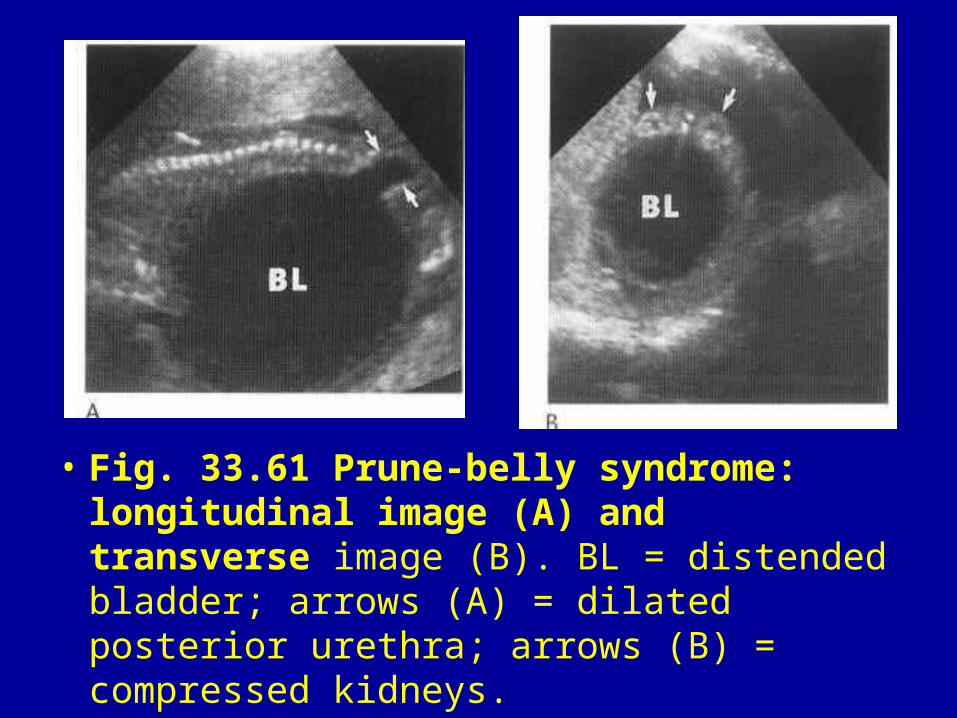
• Fig. 33.61 Prune-belly syndrome: longitudinal image (A) and transverse image (B). BL = distended bladder; arrows (A) = dilated posterior urethra; arrows (B) = compressed kidneys.
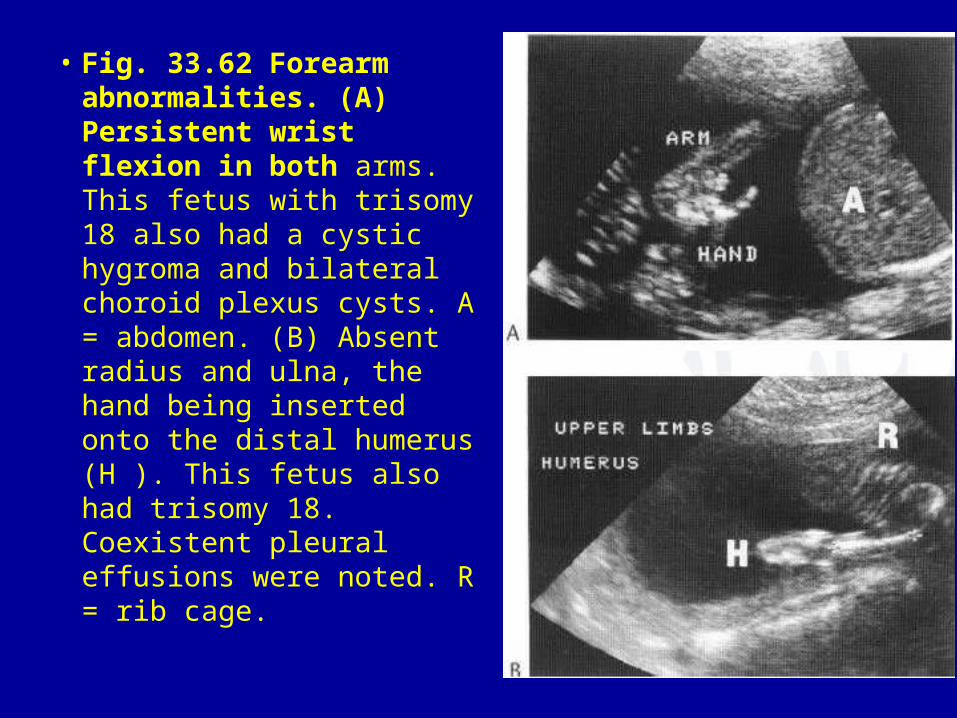
• Fig. 33.62 Forearm abnormalities. (A) Persistent wrist flexion in both arms. This fetus with trisomy 18 also had a cystic hygroma and bilateral choroid plexus cysts. A = abdomen. (B) Absent radius and ulna, the hand being inserted onto the distal humerus (H ). This fetus also had trisomy 18. Coexistent pleural effusions were noted. R = rib cage.
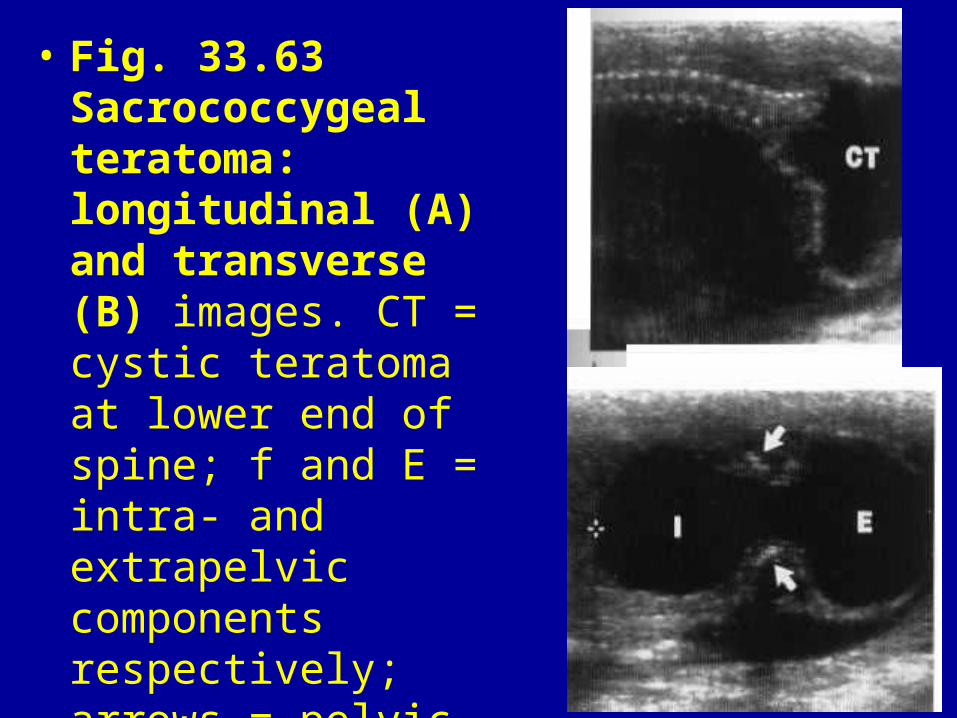
• Fig. 33.63 Sacrococcygeal teratoma: longitudinal (A) and transverse (B) images. CT = cystic teratoma at lower end of spine; f and E = intra- and extrapelvic components respectively; arrows = pelvic bones.
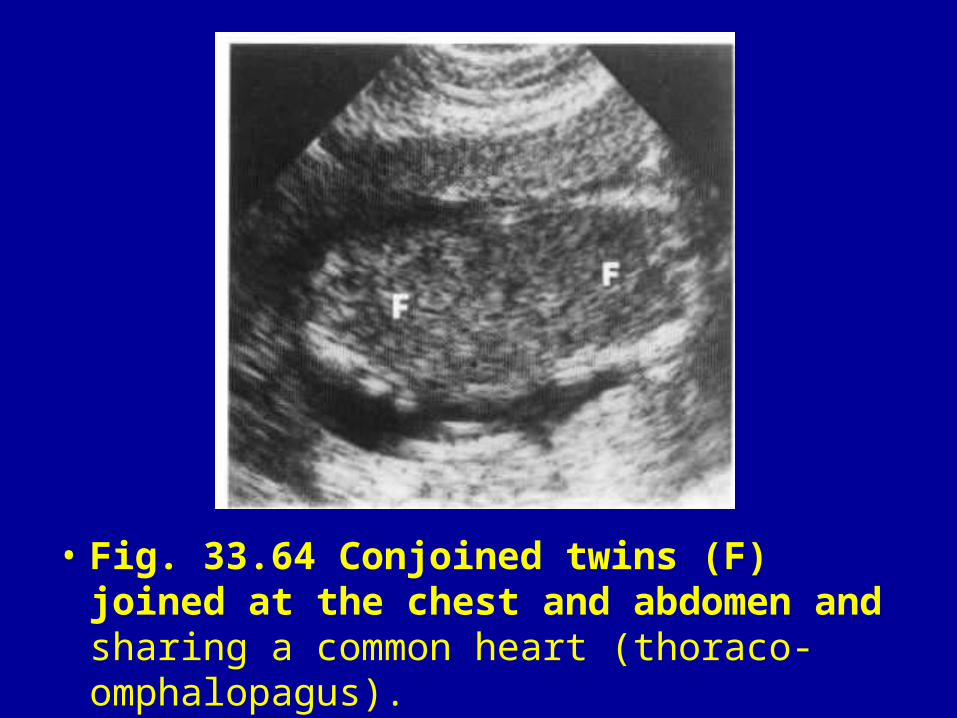
• Fig. 33.64 Conjoined twins (F) joined at the chest and abdomen and sharing a common heart (thoraco-omphalopagus).
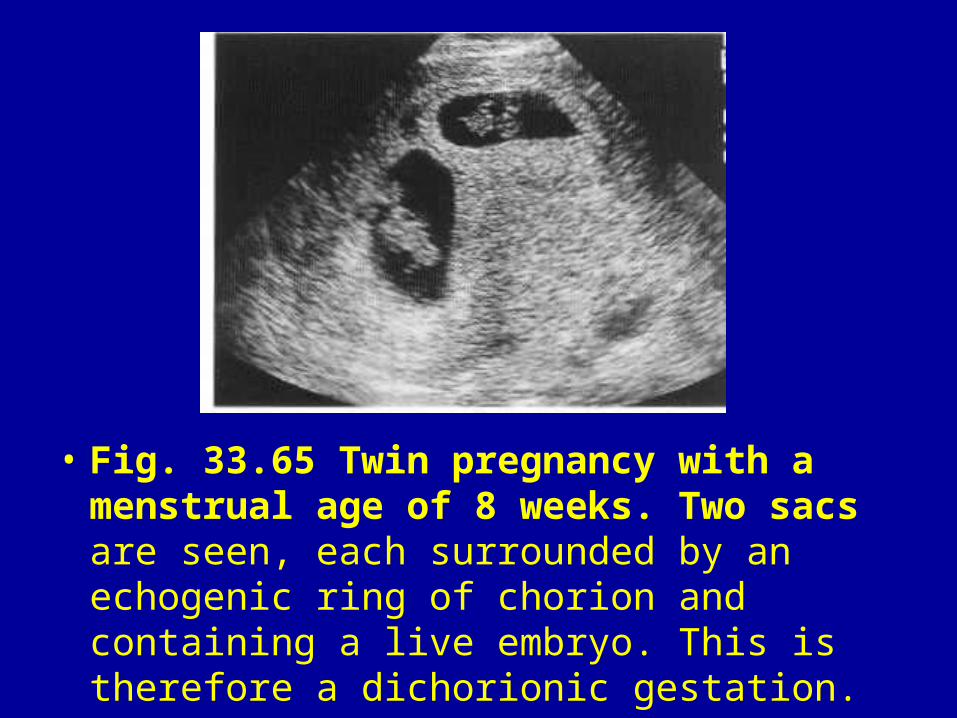
• Fig. 33.65 Twin pregnancy with a menstrual age of 8 weeks. Two sacs are seen, each surrounded by an echogenic ring of chorion and containing a live embryo. This is therefore a dichorionic gestation.
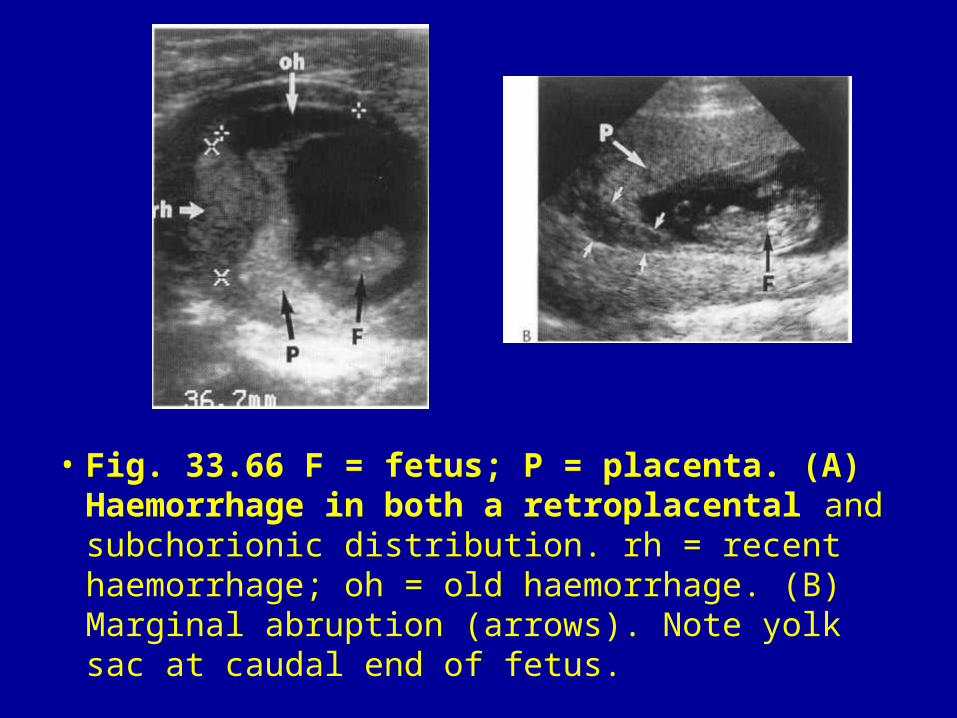
• Fig. 33.66 F = fetus; P = placenta. (A) Haemorrhage in both a retroplacental and subchorionic distribution. rh = recent haemorrhage; oh = old haemorrhage. (B) Marginal abruption (arrows). Note yolk sac at caudal end of fetus.
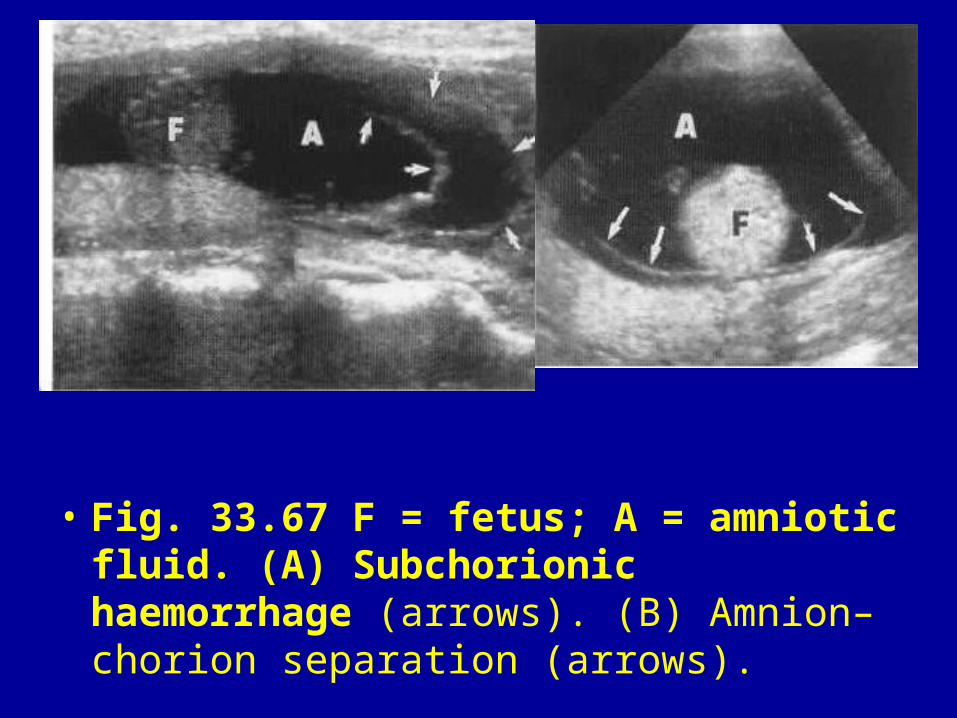
• Fig. 33.67 F = fetus; A = amniotic fluid. (A) Subchorionic haemorrhage (arrows). (B) Amnion–chorion separation (arrows).
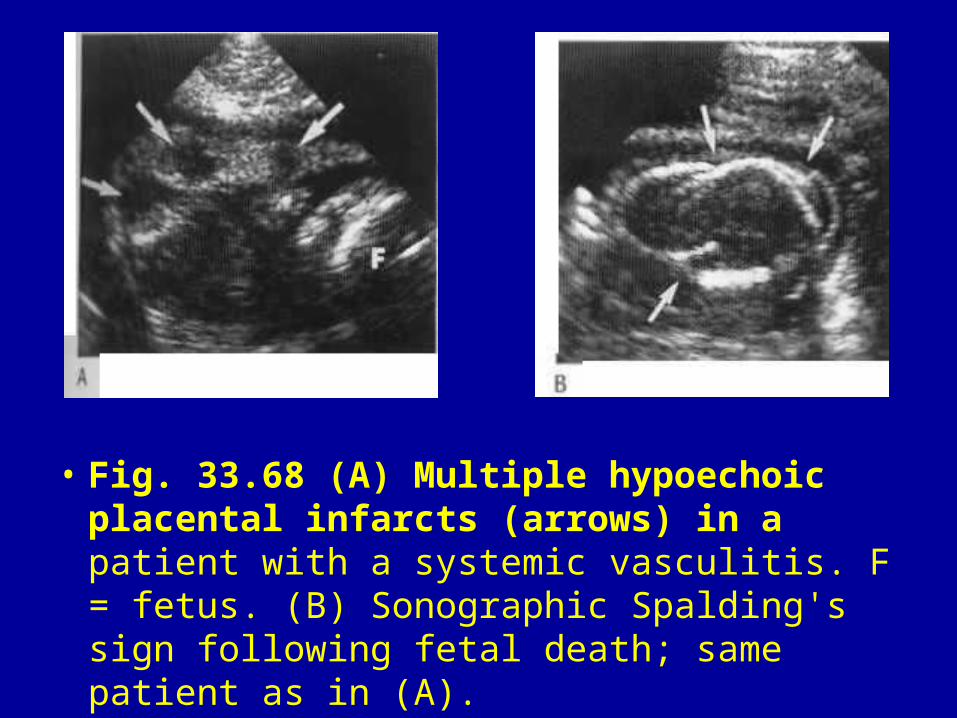
• Fig. 33.68 (A) Multiple hypoechoic placental infarcts (arrows) in a patient with a systemic vasculitis. F = fetus. (B) Sonographic Spalding's sign following fetal death; same patient as in (A).
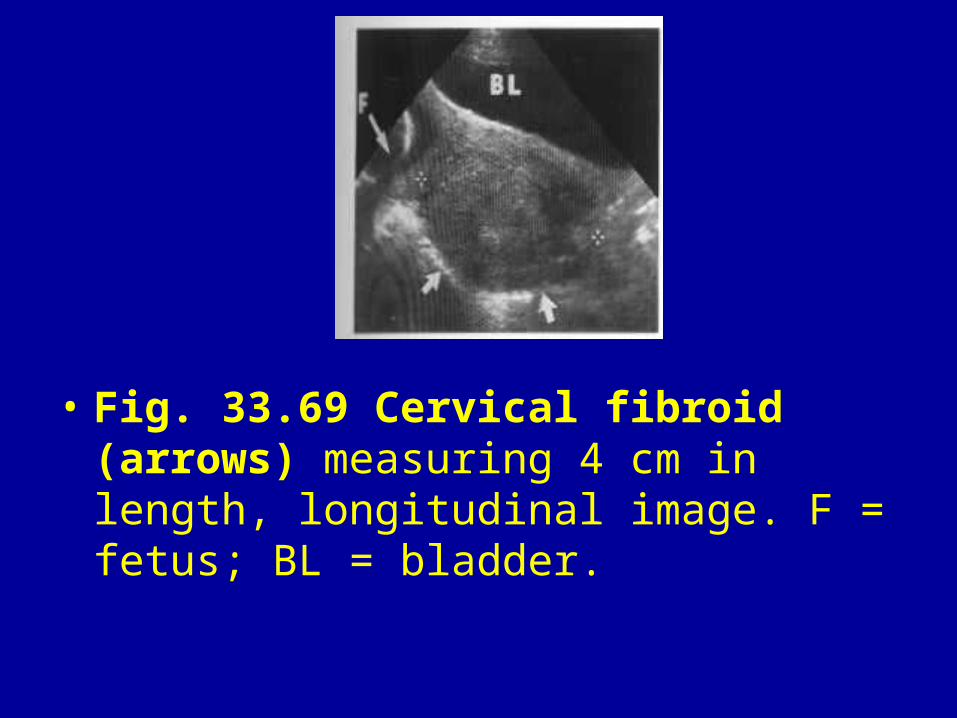
• Fig. 33.69 Cervical fibroid (arrows) measuring 4 cm in length, longitudinal image. F = fetus; BL = bladder.
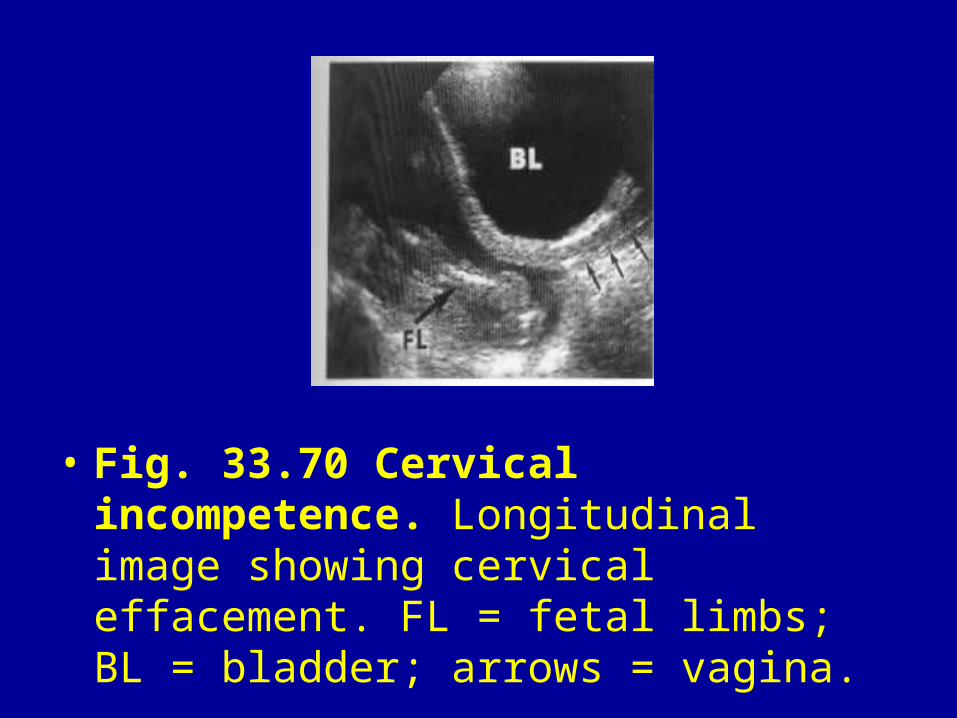
• Fig. 33.70 Cervical incompetence. Longitudinal image showing cervical effacement. FL = fetal limbs; BL = bladder; arrows = vagina.
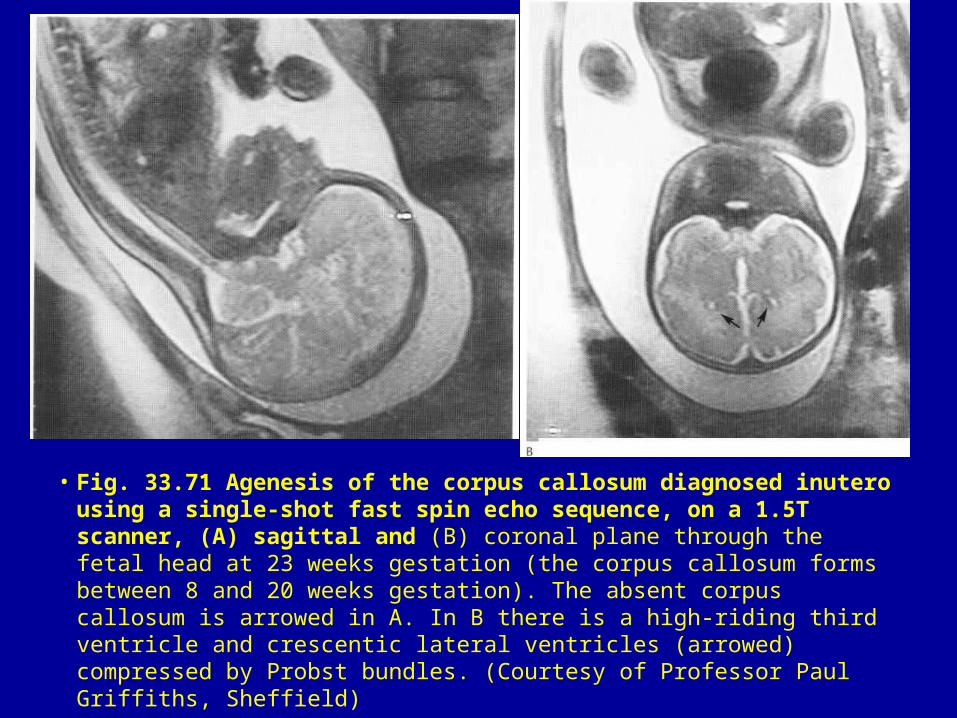
• Fig. 33.71 Agenesis of the corpus callosum diagnosed inutero using a single-shot fast spin echo sequence, on a 1.5T scanner, (A) sagittal and (B) coronal plane through the fetal head at 23 weeks gestation (the corpus callosum forms between 8 and 20 weeks gestation). The absent corpus callosum is arrowed in A. In B there is a high-riding third ventricle and crescentic lateral ventricles (arrowed) compressed by Probst bundles. (Courtesy of Professor Paul Griffiths, Sheffield)