Embed Size (px)
Citation preview

Welcome!You can download this presentation at the following address
John Cronin, Ph.D.Vice President of Education [email protected]
The role of the CAO in a “supportive” accountability framework
NWEAIs a not for profit assessment organization that partners with over 7,000 school systems in the U.S. and in 30 countries.
We are a leader in computer-adaptive and formative assessment.
During this session you’ll learn
What is the role of the chief accountability officer?
Job Requirements - Chief Accountability Officer: While performing the duties of this job, the employee is regularly required to talk or hear. The employee frequently is required to sit. The employee is occasionally required to stand and walk. The employee must occasionally lift and/or move up to 25 pounds. There are no specific vision abilities required by this job.
Accountability is not an inquisition
43:03

What is the role of the accountability officer?
• Create dialogue and action to improve the effectiveness of schools which centers on improvement of systems.
• Provide a transparent common set of facts (mastered by all leaders) that provide the basis for discussing student achievement.
• Implement structures, policies and procedures to ensure that data used to evaluate schools has integrity.
Create dialogue and action to improve the effectiveness of schools that is focused on improvement of systems.
1
Create dialogue and action to improve the effectiveness of schools that is focused on improvement of systems.
The management letter is the cornerstone.
1

The financial advisor metaphor
What is accountability?To be “answerable” means that accountability is a dialogue between the stakeholders and the leaders of their schools. One part of that dialogue is understanding the goals and objectives of the stakeholders. Another part of that dialogue is discussing how school leaders are doing in reaching those goals.
The most important part of the dialogue is what school leaders are doing to improve performance based on this information, which is leading.

1 The management letter
Is an opportunity to show leadership.
It is a conversation with stakeholders about the performance of schools. In it they explain their business, their successes and failures, and discuss their intended actions for improving the educational experience of students.
1 The management letter
Is not simply for the community…
It requires the school leaders to think seriously about their work and communicate coherently about the state of their school and their strategy. It forces them to reflect and clarify their thinking.

The four principles that guide your communications to your audiences.
• Clearly identify who your audience is.
• Understand what that audience wants to know about their schools and their performance.
• Be transparent about how you are performing on these objectives.
• Communicate your strategy to improve performance, and corrective action when strategy fails.
The tone of the management letter
• Should be optimistic• Should be plain yet thoughtful• Should be conversational• Should be realistic in addressing successes and
transparent about problems• Should be effusive in praising of subordinates,
critical of yourself.
• Be transparent about failures• Have a strategy in place to address it• Accept responsibility and temper expectations• Demonstrate progress
How to be transparent without getting killed
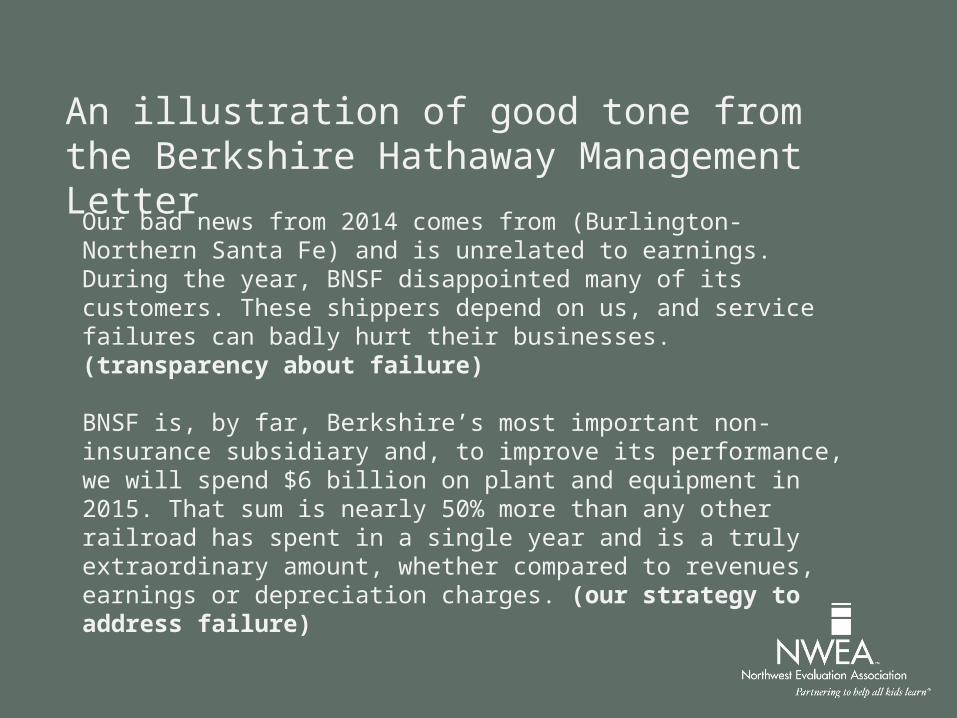
Our bad news from 2014 comes from (Burlington-Northern Santa Fe) and is unrelated to earnings. During the year, BNSF disappointed many of its customers. These shippers depend on us, and service failures can badly hurt their businesses. (transparency about failure)
BNSF is, by far, Berkshire’s most important non-insurance subsidiary and, to improve its performance, we will spend $6 billion on plant and equipment in 2015. That sum is nearly 50% more than any other railroad has spent in a single year and is a truly extraordinary amount, whether compared to revenues, earnings or depreciation charges. (our strategy to address failure)
An illustration of good tone from the Berkshire Hathaway Management Letter
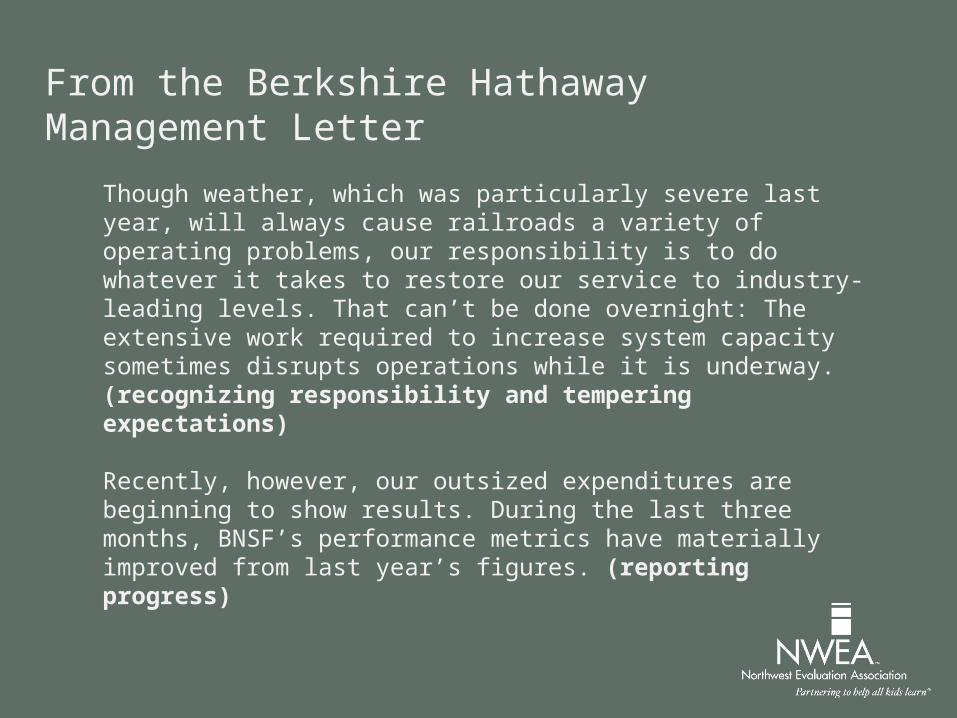
Though weather, which was particularly severe last year, will always cause railroads a variety of operating problems, our responsibility is to do whatever it takes to restore our service to industry-leading levels. That can’t be done overnight: The extensive work required to increase system capacity sometimes disrupts operations while it is underway. (recognizing responsibility and tempering expectations)
Recently, however, our outsized expenditures are beginning to show results. During the last three months, BNSF’s performance metrics have materially improved from last year’s figures. (reporting progress)
From the Berkshire Hathaway Management Letter
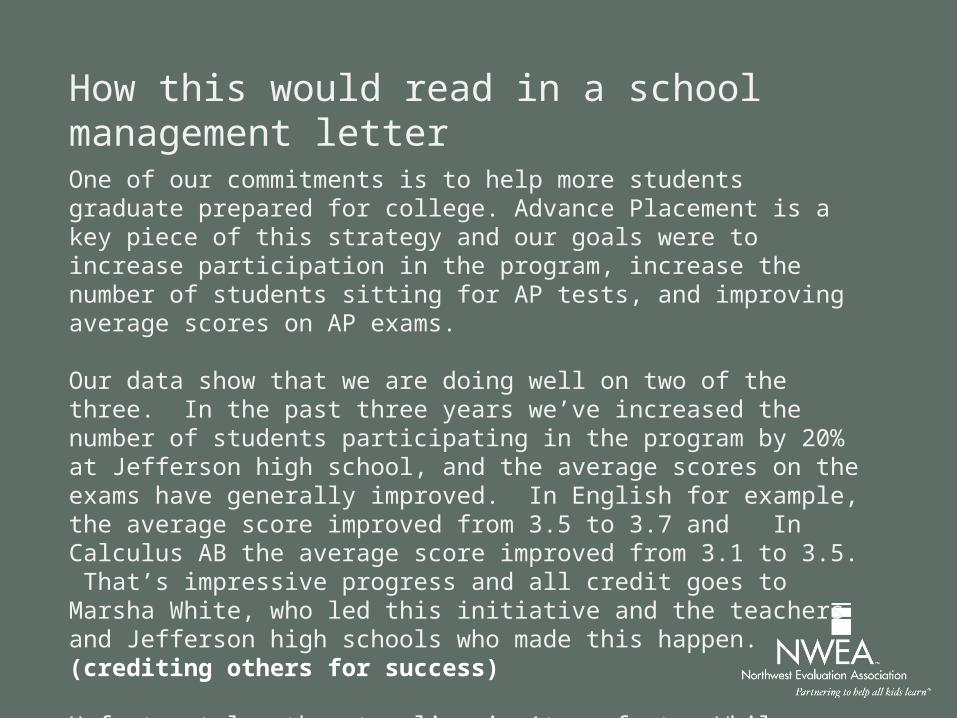
One of our commitments is to help more students graduate prepared for college. Advance Placement is a key piece of this strategy and our goals were to increase participation in the program, increase the number of students sitting for AP tests, and improving average scores on AP exams.
Our data show that we are doing well on two of the three. In the past three years we’ve increased the number of students participating in the program by 20% at Jefferson high school, and the average scores on the exams have generally improved. In English for example, the average score improved from 3.5 to 3.7 and In Calculus AB the average score improved from 3.1 to 3.5. That’s impressive progress and all credit goes to Marsha White, who led this initiative and the teachers and Jefferson high schools who made this happen. (crediting others for success)
Unfortunately, the storyline isn’t perfect. While more students want to take courses, we cut the number of available courses and the improvement the improvement in the number of students sitting for the tests reversed last year (Admit failure)
How this would read in a school management letter
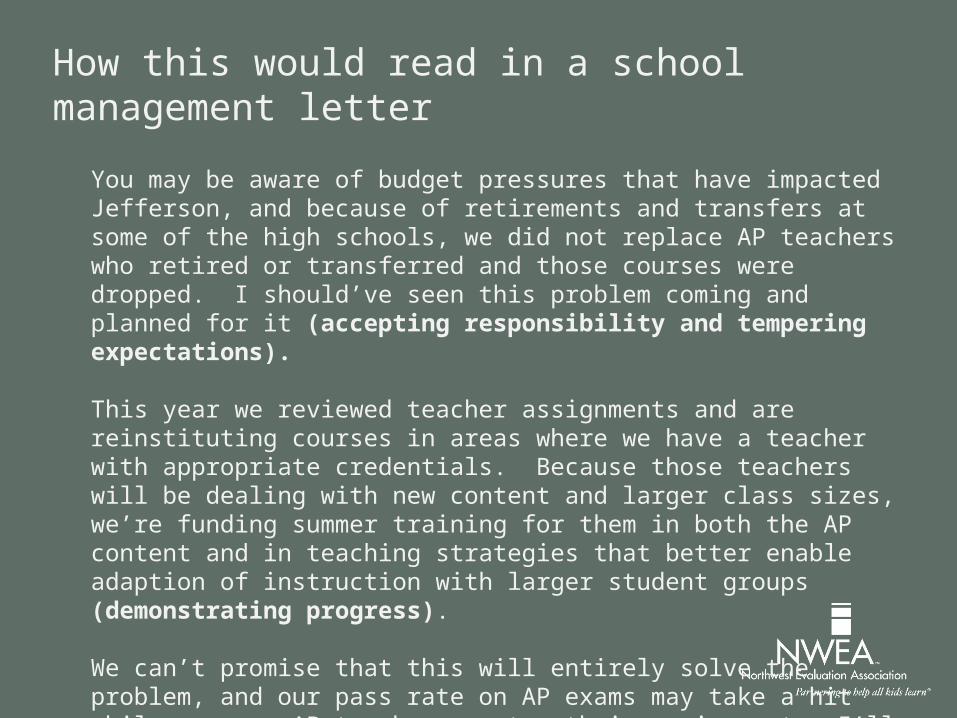
You may be aware of budget pressures that have impacted Jefferson, and because of retirements and transfers at some of the high schools, we did not replace AP teachers who retired or transferred and those courses were dropped. I should’ve seen this problem coming and planned for it (accepting responsibility and tempering expectations).
This year we reviewed teacher assignments and are reinstituting courses in areas where we have a teacher with appropriate credentials. Because those teachers will be dealing with new content and larger class sizes, we’re funding summer training for them in both the AP content and in teaching strategies that better enable adaption of instruction with larger student groups (demonstrating progress).
We can’t promise that this will entirely solve the problem, and our pass rate on AP exams may take a hit while our new AP teachers master their assignment. I’ll keep you apprised in my monthly newsletter as to how this is going.
How this would read in a school management letter
What is the role of the accountability officer?
• Create dialogue and action to improve the effectiveness of schools which centers on improvement of systems.
• Provide a transparent common set of facts (mastered by all leaders) that provide the basis for discussing student achievement.
• Implement structures, policies and procedures to ensure that data used to evaluate schools has integrity.
Provide a transparent common set of facts (mastered by all leaders) that provide the basis for discussing student achievement.
2
Provide a transparent common set of facts (mastered by all leaders) that provide the basis for discussing student achievement.
The report of learning indicators serves this purpose.
2
Everyone is entitled to their opinion, but not to their own facts.
Daniel Patrick Moynihan
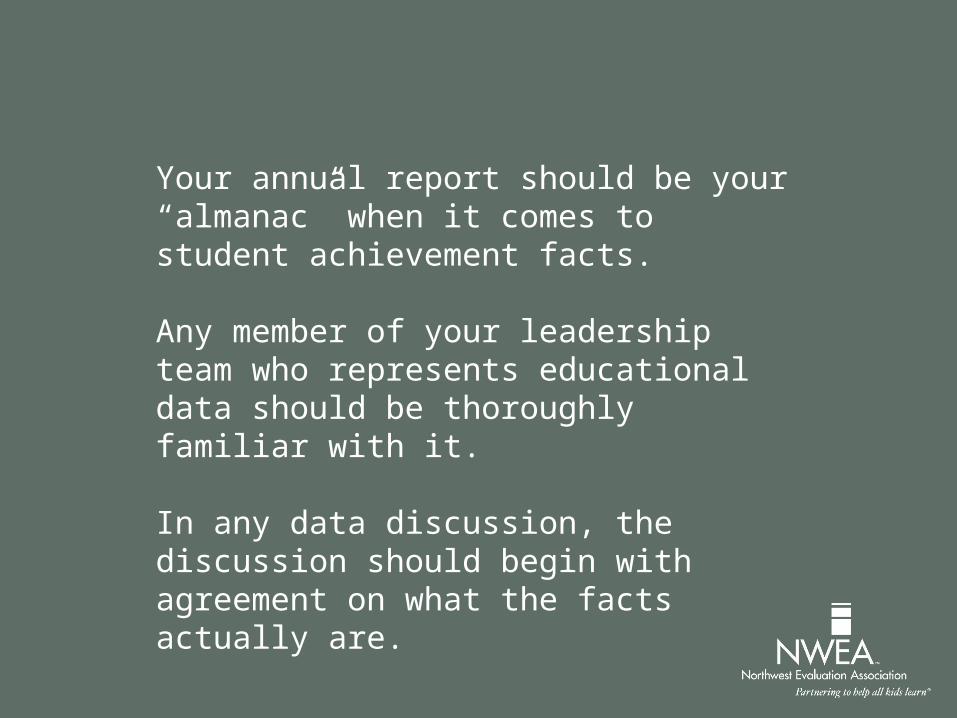
Your annual report should be your “almanac” when it comes to student achievement facts.
Any member of your leadership team who represents educational data should be thoroughly familiar with it.
In any data discussion, the discussion should begin with agreement on what the facts actually are.
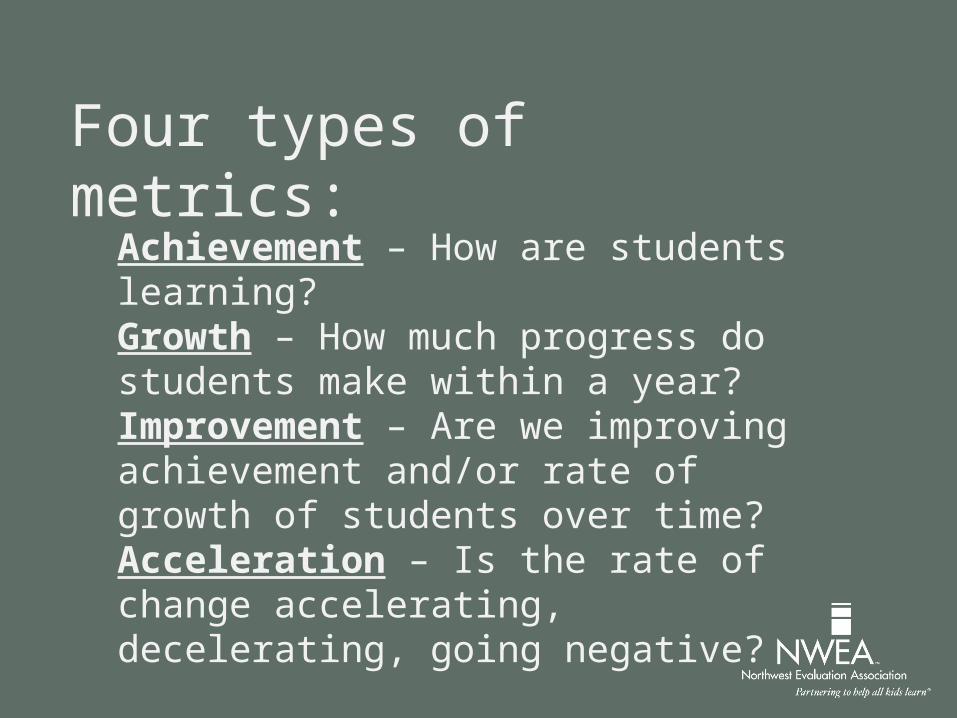
Four types of metrics:
Achievement – How are students learning?Growth – How much progress do students make within a year?Improvement – Are we improving achievement and/or rate of growth of students over time?Acceleration – Is the rate of change accelerating, decelerating, going negative?
2009 2010 2011 2012 2013 2014 2015 20160%
10%
20%
30%
40%
50%
60%
70%
80%
90%
100%
54%
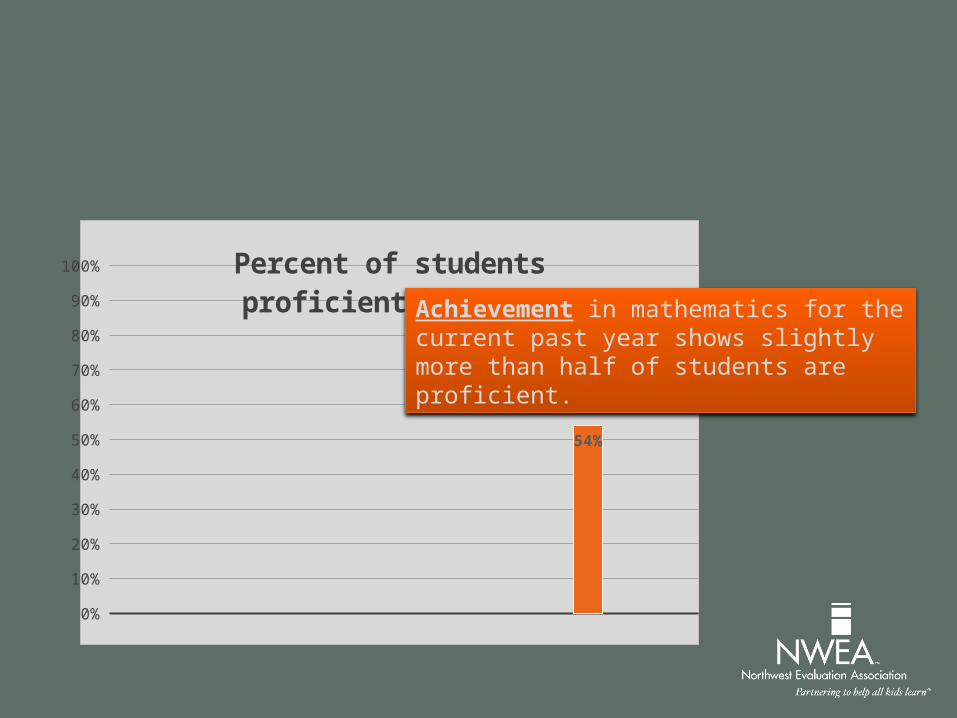
Percent of students proficient in math
Achievement in mathematics for the current past year shows slightly more than half of students are proficient.
2009 2010 2011 2012 2013 2014 2015 20160%
10%
20%
30%
40%
50%
60%
70%
80%
90%
100%
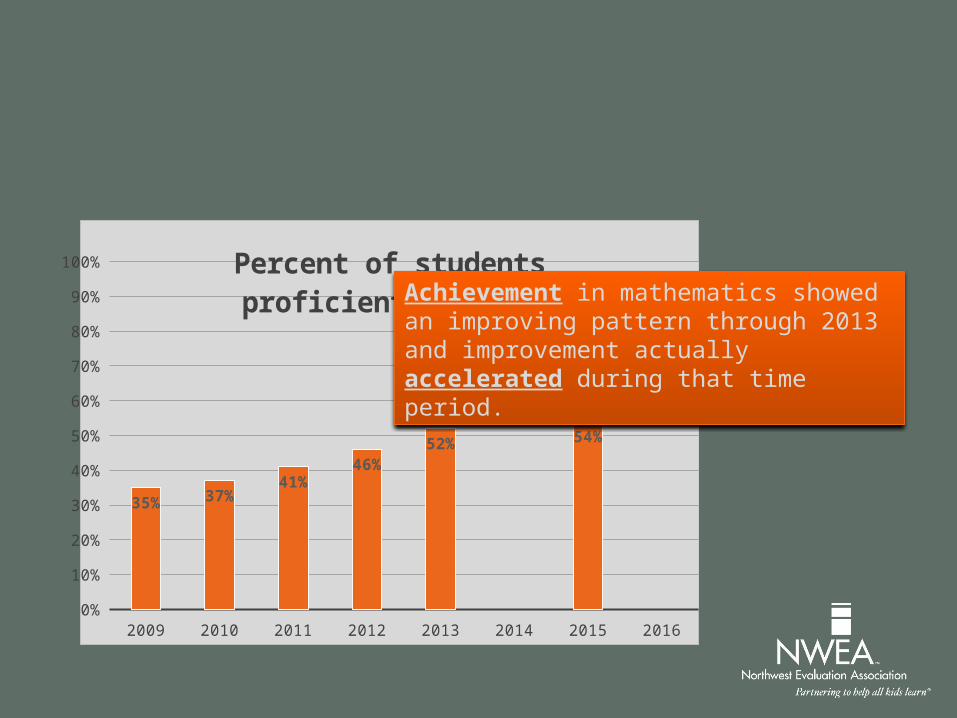
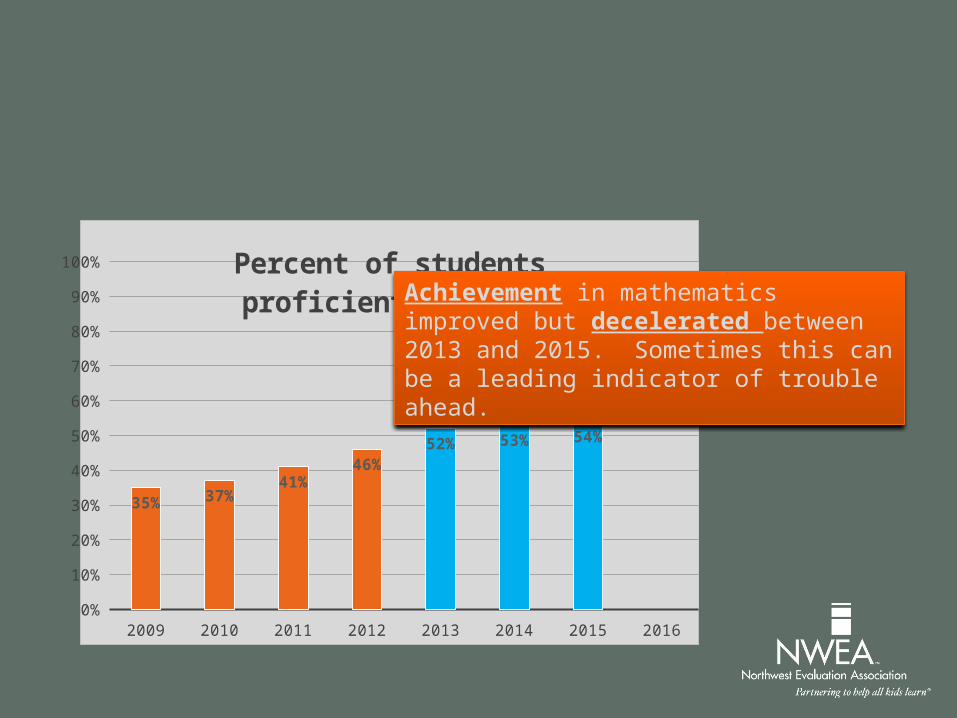
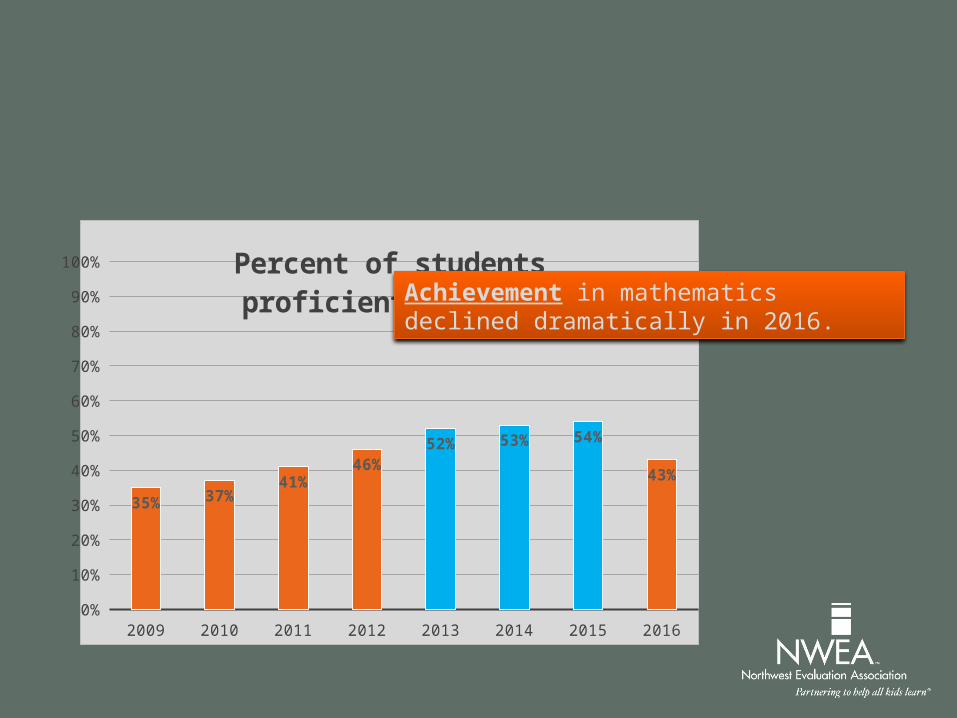
35% 37%41%
46%52% 54%
Percent of students proficient in mathAchievement in mathematics showed an improving pattern through 2013 and improvement actually accelerated during that time period.
2009 2010 2011 2012 2013 2014 2015 20160%
10%
20%
30%
40%
50%
60%
70%
80%
90%
100%
35% 37%41%
46%52% 53% 54%
Percent of students proficient in mathAchievement in mathematics improved but decelerated between 2013 and 2015. Sometimes this can be a leading indicator of trouble ahead.
2009 2010 2011 2012 2013 2014 2015 20160%
10%
20%
30%
40%
50%
60%
70%
80%
90%
100%
35% 37%41%
46%52% 53% 54%
43%
Percent of students proficient in mathAchievement in mathematics declined dramatically in 2016.
The choice of metrics matters. Poorly chosen metrics can distort reality.
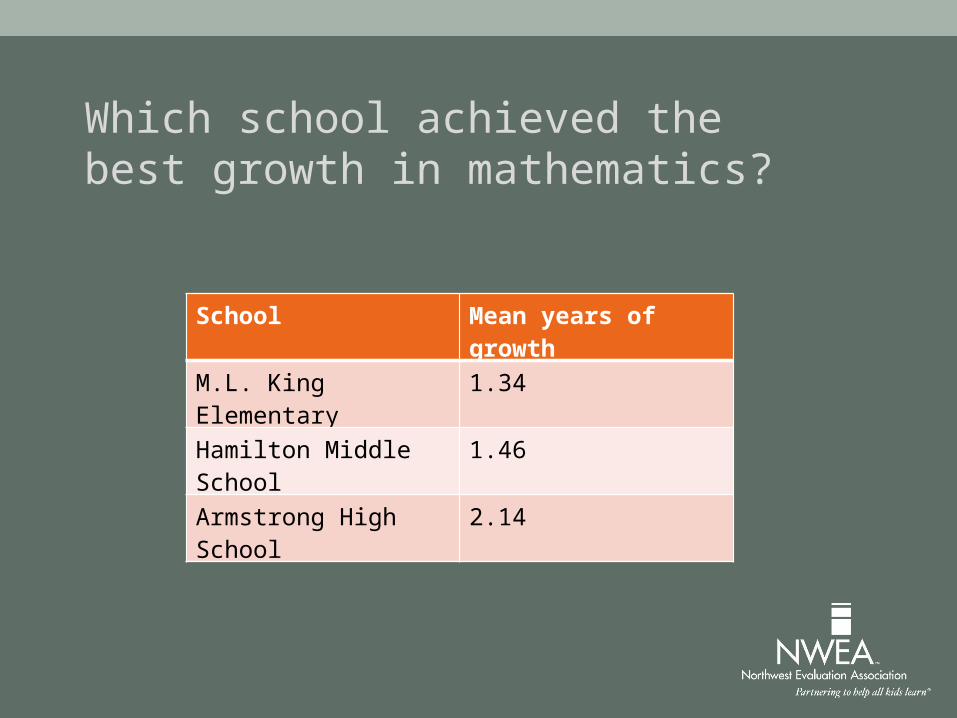
Which school achieved the best growth in mathematics?
School Mean years of growth
M.L. King Elementary 1.34
Hamilton Middle School 1.46
Armstrong High School 2.14
1 2 3 4 5 6 7 8 9 1002468
101214161820
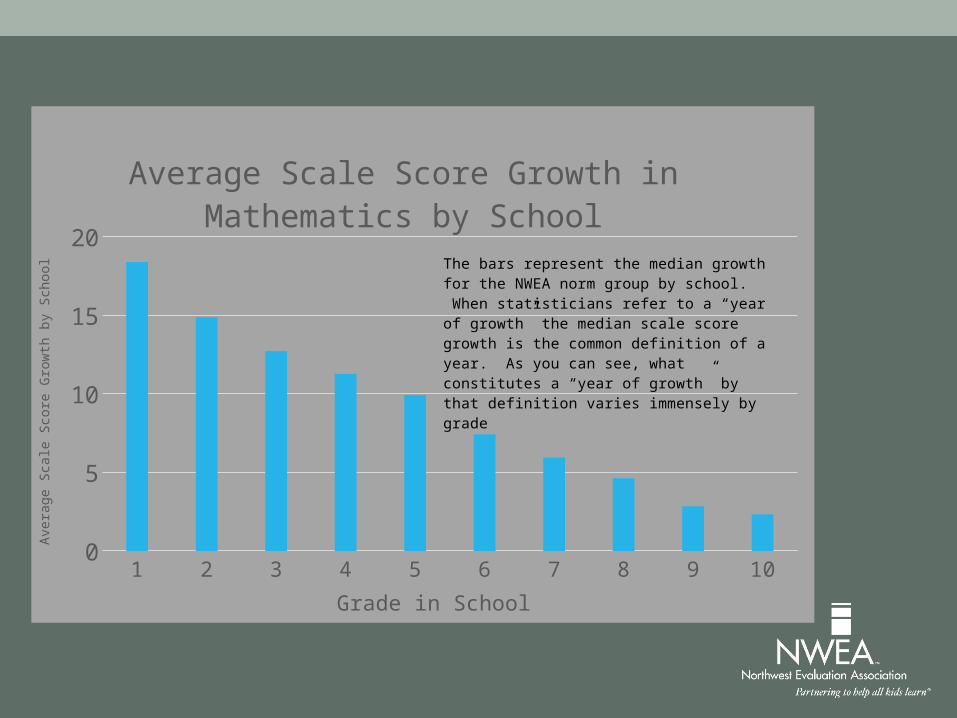
Average Scale Score Growth in Mathematics by School
Grade in School
Aver
age
Scal
e Sc
ore
Grow
th b
y Sc
hool
The bars represent the median growth for the NWEA norm group by school. When statisticians refer to a “year of growth” the median scale score growth is the common definition of a year. As you can see, what constitutes a “year of growth” by that definition varies immensely by grade
1 2 3 4 5 6 7 8 9 1002468
101214161820
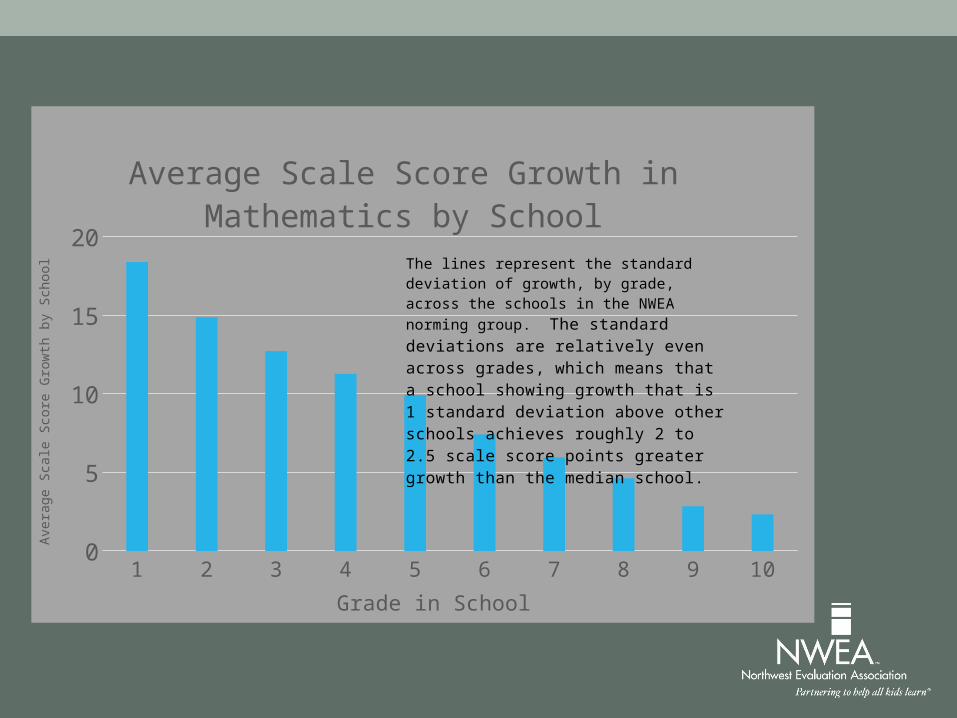
Average Scale Score Growth in Mathematics by School
Grade in School
Aver
age
Scal
e Sc
ore
Grow
th b
y Sc
hool
The lines represent the standard deviation of growth, by grade, across the schools in the NWEA norming group. The standard deviations are rela-tively even across grades, which means that a school showing growth that is 1 standard deviation above other schools achieves roughly 2 to 2.5 scale score points greater growth than the median school.
1 2 3 4 5 6 7 8 9 100
2
4
6
8
10
12
14
16
18
20
0.0
0.5
1.0
1.5
2.0
2.5
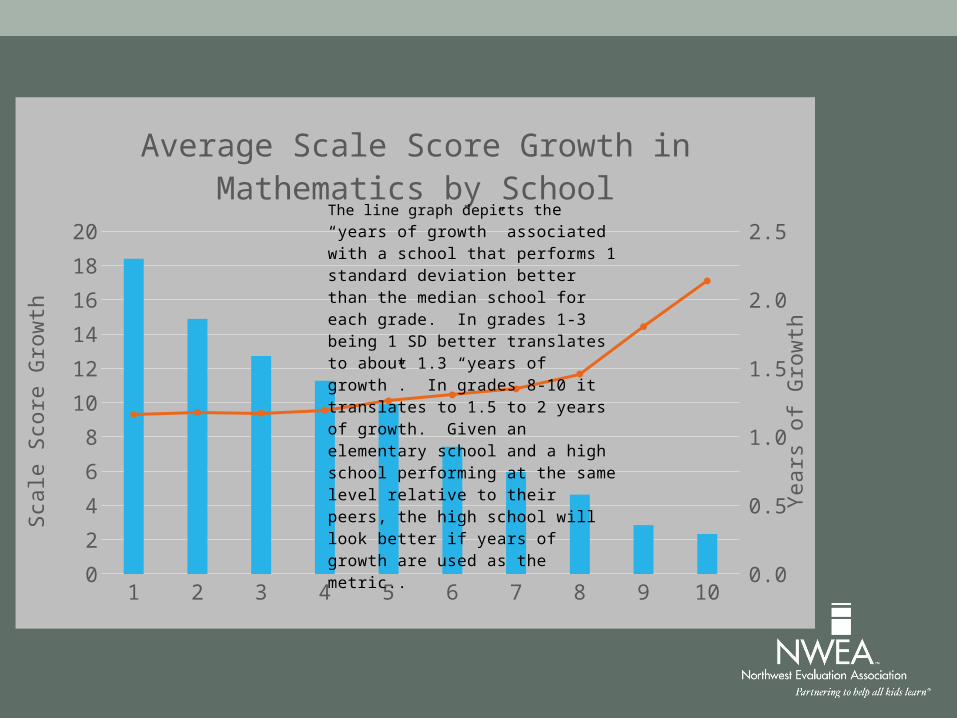
Average Scale Score Growth in Mathematics by School
Scal
e Sc
ore
Grow
th
Year
s of G
row
th
The line graph depicts the “years of growth” associated with a school that performs 1 stan-dard deviation better than the median school for each grade. In grades 1-3 being 1 SD bet-ter translates to about 1.3 “years of growth”. In grades 8-10 it translates to 1.5 to 2 years of growth. Given an elementary school and a high school performing at the same level rela-tive to their peers, the high school will look better if years of growth are used as the met-ric..
1 2 3 4 5 6 7 8 9 100
2
4
6
8
10
12
14
16
18
0.00
0.50
1.00
1.50
2.00
2.50
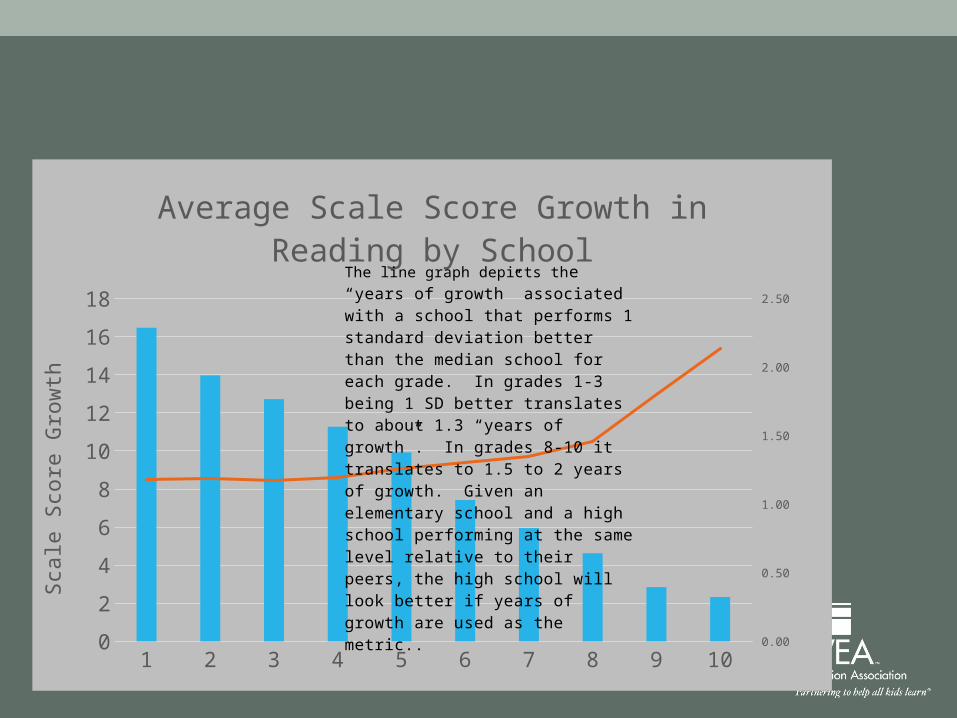
Average Scale Score Growth in Reading by School
Scal
e Sc
ore
Grow
th
The line graph depicts the “years of growth” associated with a school that performs 1 stan-dard deviation better than the median school for each grade. In grades 1-3 being 1 SD bet-ter translates to about 1.3 “years of growth”. In grades 8-10 it translates to 1.5 to 2 years of growth. Given an elementary school and a high school performing at the same level rela-tive to their peers, the high school will look better if years of growth are used as the met-ric..
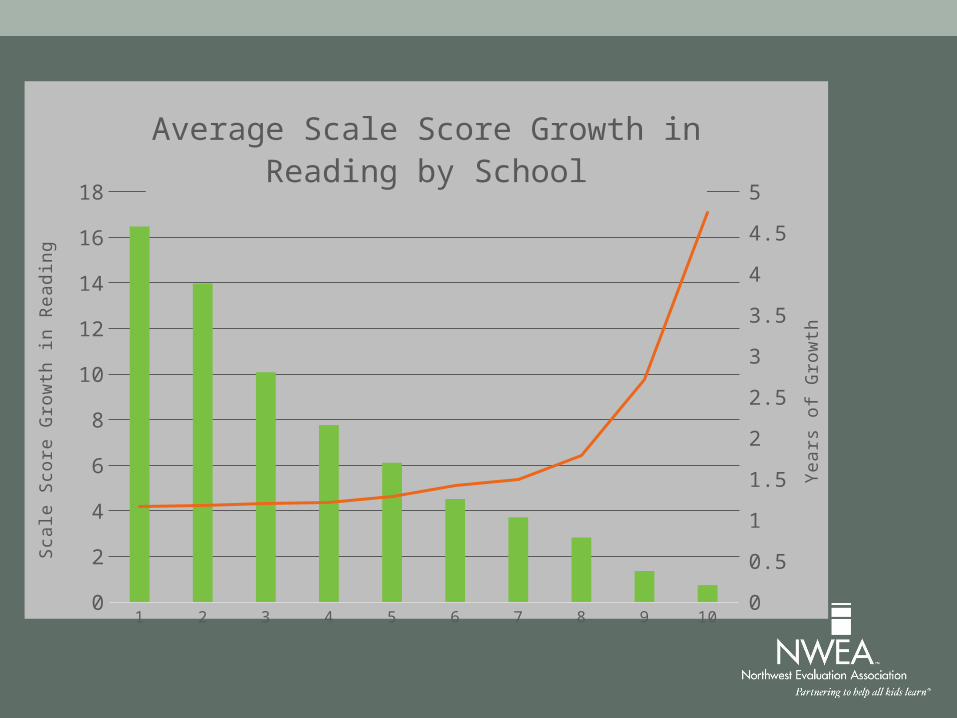
1 2 3 4 5 6 7 8 9 100
2
4
6
8
10
12
14
16
18
0
0.5
1
1.5
2
2.5
3
3.5
4
4.5
5
Average Scale Score Growth in Reading by School
Scal
e Sc
ore
Grow
th in
Rea
ding
Year
s of G
row
th
All students should be in play relative to a chosen metric.
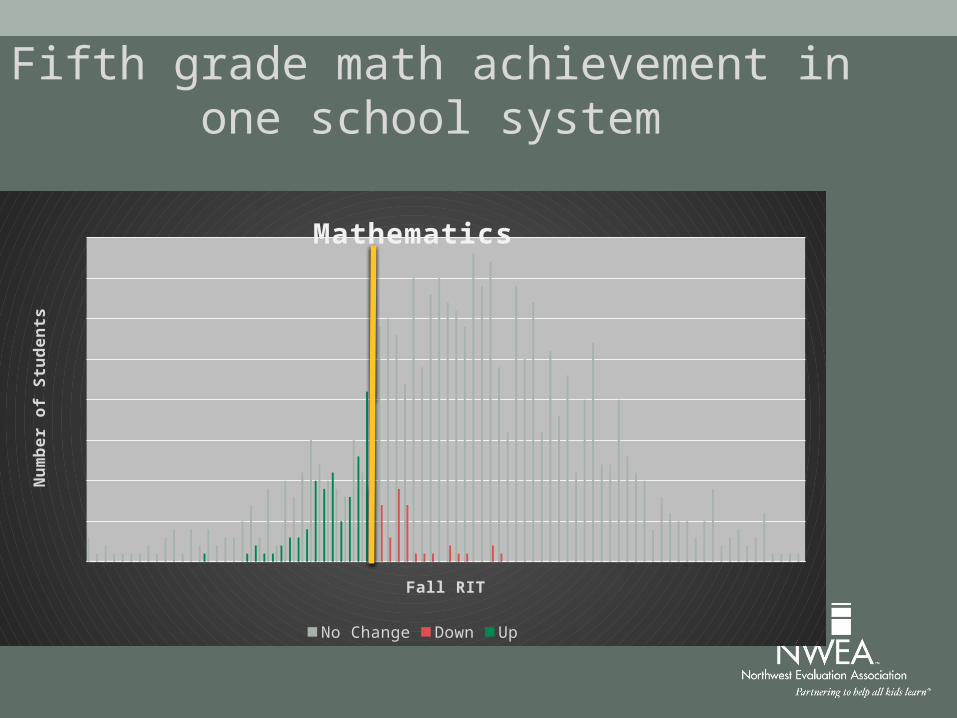
Fifth grade math achievement in one school system
Mathematics
No Change Down Up
Fall RIT
Num
ber o
f Stu
dent
s
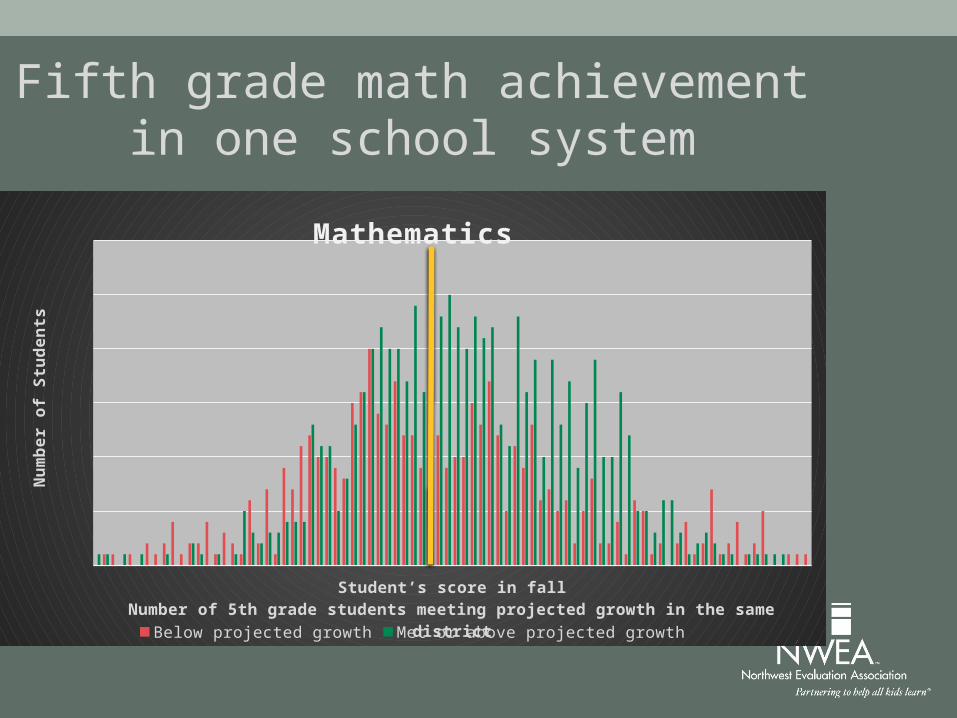
Mathematics
Below projected growth Met or above projected growth
Student’s score in fallNumber of 5th grade students meeting projected growth in the same district
Num
ber o
f Stu
dent
s
Fifth grade math achievement in one school system

It’s important to have a “racing form” for student achievement
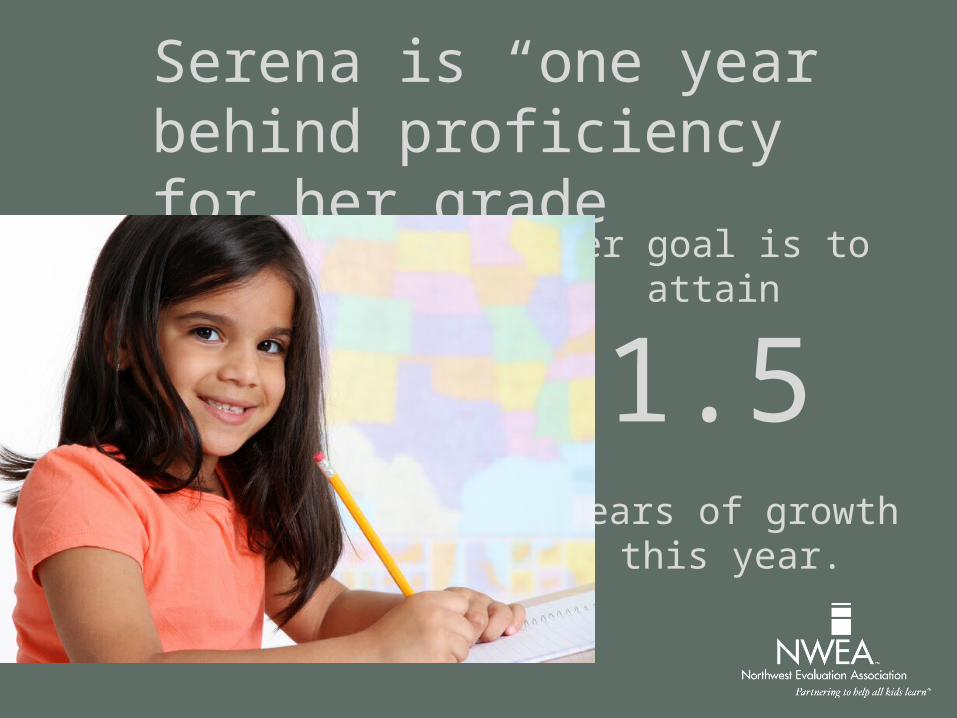
Serena is “one year” behind proficiency for her grade
1.5Her goal is to attain
years of growth this year.
10
9
8
7
6
5
4
3
2
1
K
0% 10% 20% 30% 40% 50% 60% 70% 80% 90% 100%
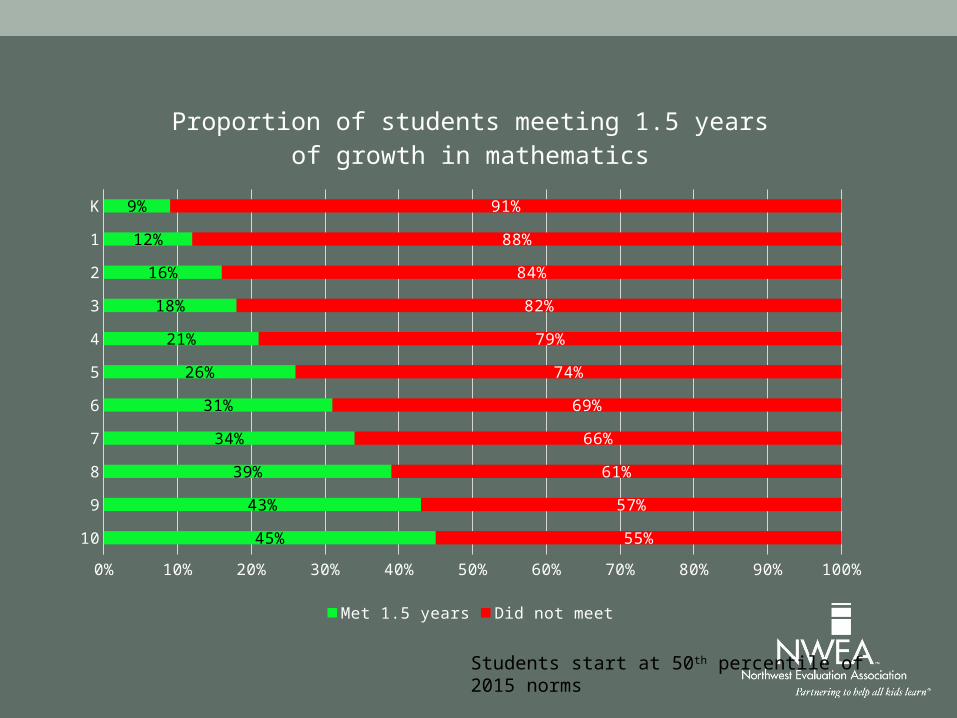
45%
43%
39%
34%
31%
26%
21%
18%
16%
12%
9%
55%
57%
61%
66%
69%
74%
79%
82%
84%
88%
91%
Proportion of students meeting 1.5 years of growth in math-ematics
Met 1.5 years Did not meet
Students start at 50th percentile of 2015 norms
10
9
8
7
6
5
4
3
2
1
K
0% 10% 20% 30% 40% 50% 60% 70% 80% 90% 100%
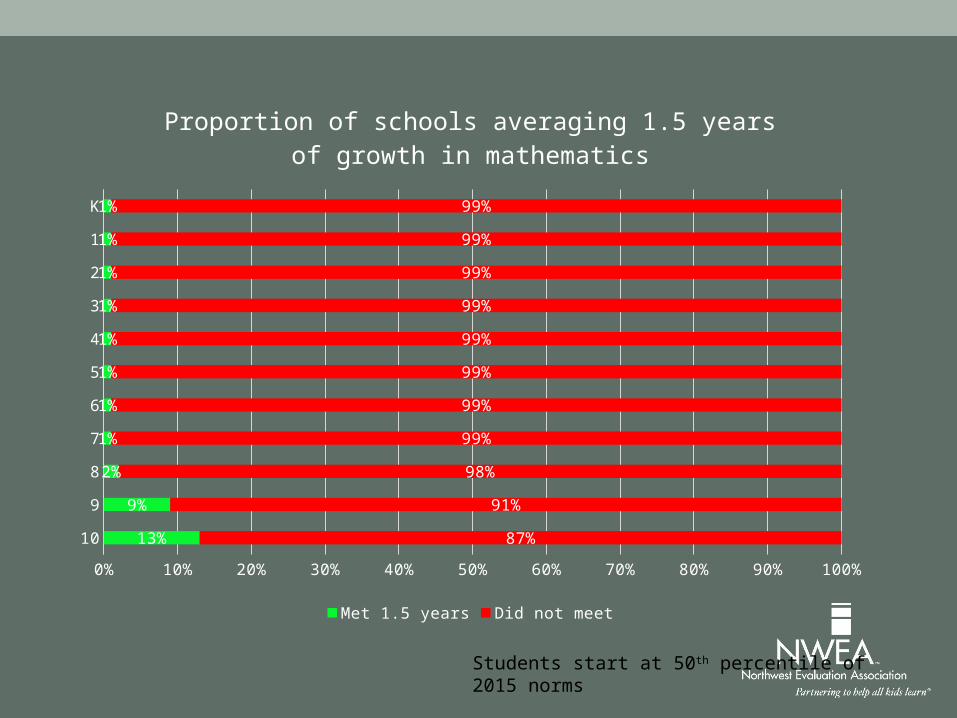
13%
9%
2%
1%
1%
1%
1%
1%
1%
1%
1%
87%
91%
98%
99%
99%
99%
99%
99%
99%
99%
99%
Proportion of schools averaging 1.5 years of growth in mathematics
Met 1.5 years Did not meet
Students start at 50th percentile of 2015 norms
10
9
8
7
6
5
4
3
2
1
K
0% 10% 20% 30% 40% 50% 60% 70% 80% 90% 100%
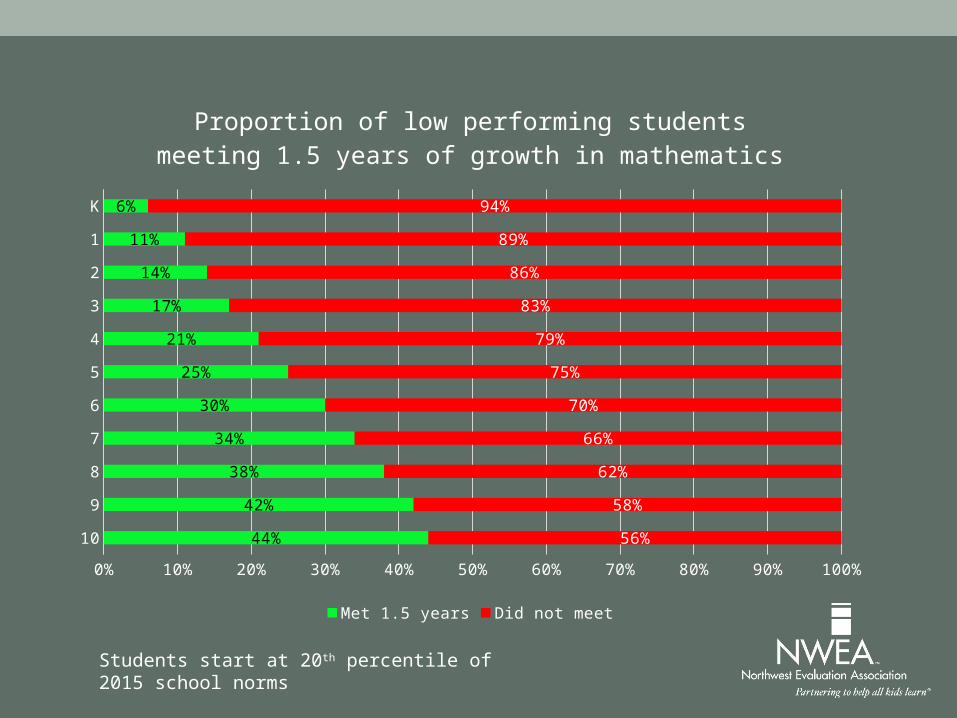
44%
42%
38%
34%
30%
25%
21%
17%
14%
11%
6%
56%
58%
62%
66%
70%
75%
79%
83%
86%
89%
94%
Proportion of low performing students meeting 1.5 years of growth in mathematics
Met 1.5 years Did not meet
Students start at 20th percentile of 2015 school norms
10
9
8
7
6
5
4
3
2
1
K
0% 10% 20% 30% 40% 50% 60% 70% 80% 90% 100%
9%
6%
1%
1%
1%
1%
1%
1%
1%
1%
1%
91%
94%
99%
99%
99%
99%
99%
99%
99%
99%
99%
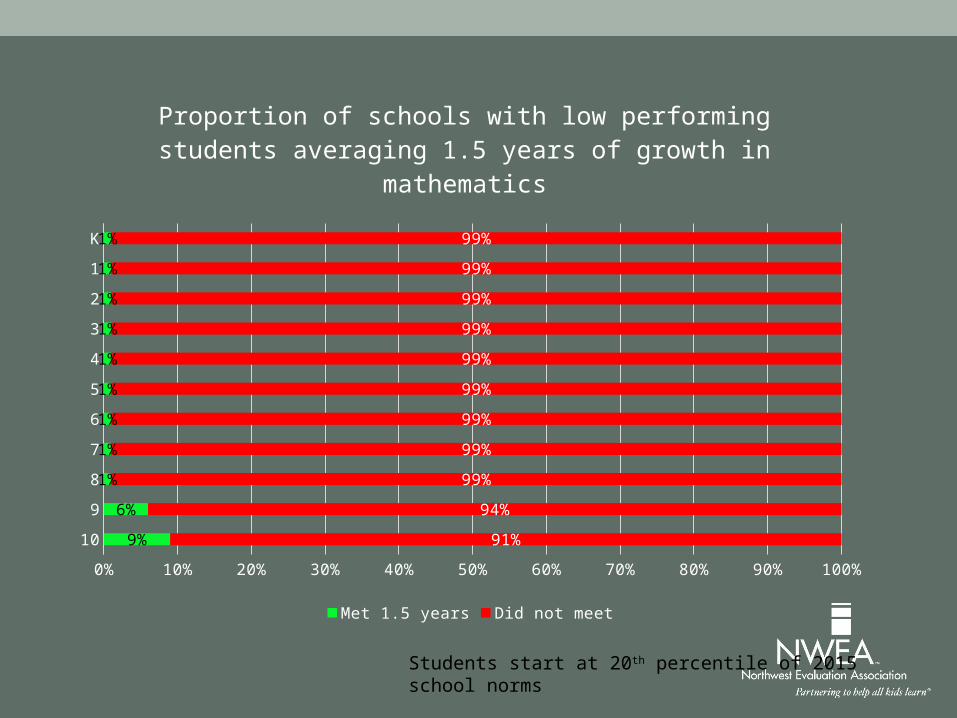
Proportion of schools with low performing students averaging 1.5 years of growth in mathematics
Met 1.5 years Did not meet
Students start at 20th percentile of 2015 school norms
Implement structures, policies and procedures to ensure that data used to evaluate schools has integrity.3
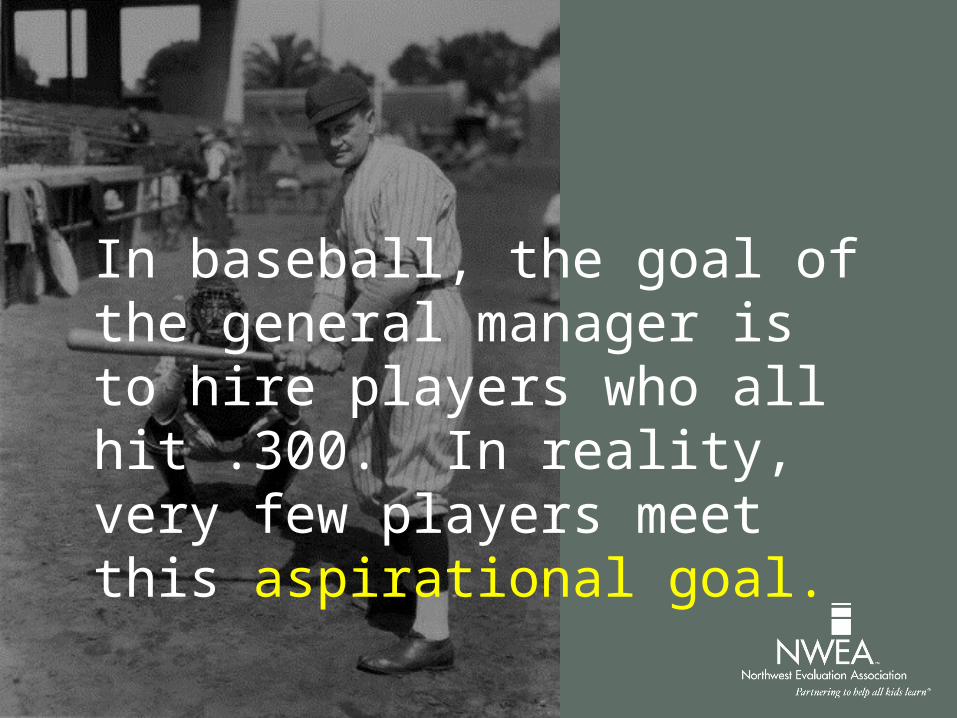
In baseball, the goal of the general manager is to hire players who all hit .300. In reality, very few players meet this aspirational goal.
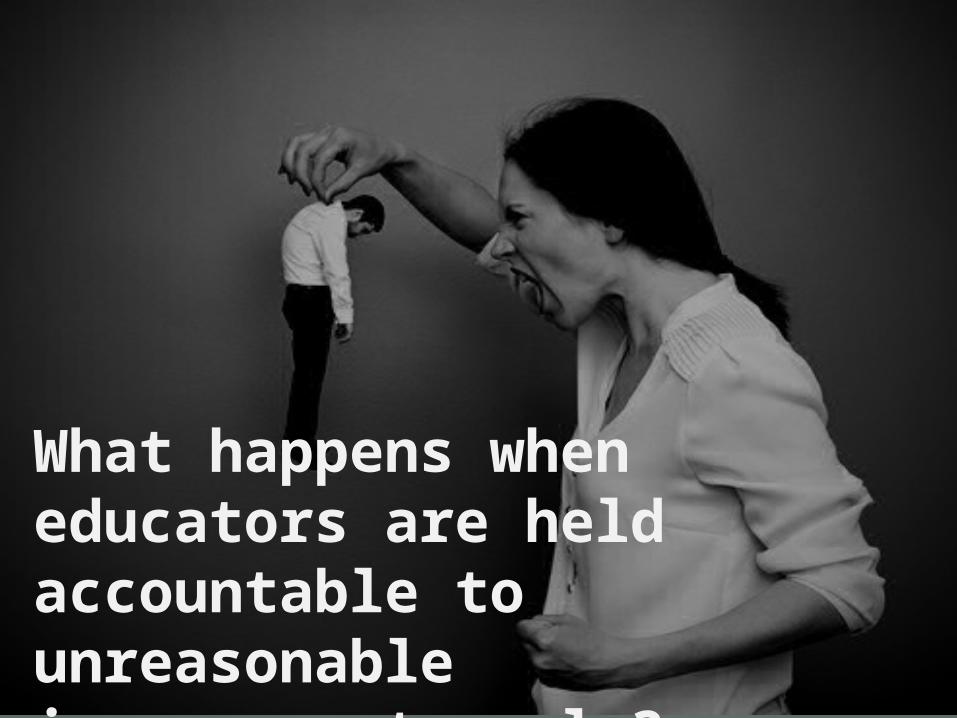
What happens when educators are held accountable to unreasonable improvement goals?
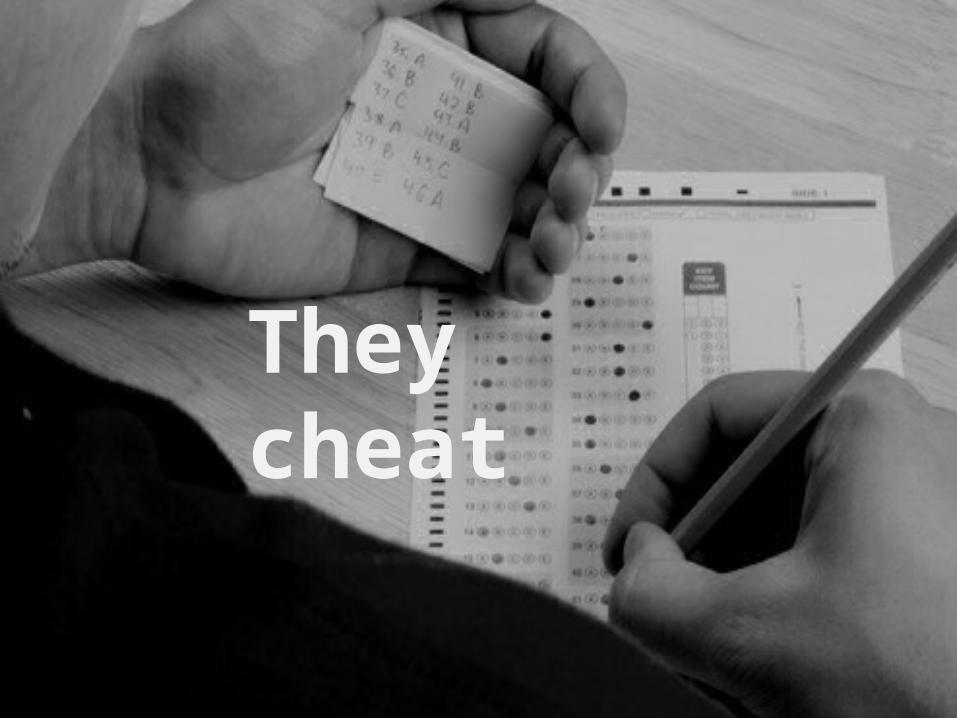
They cheat
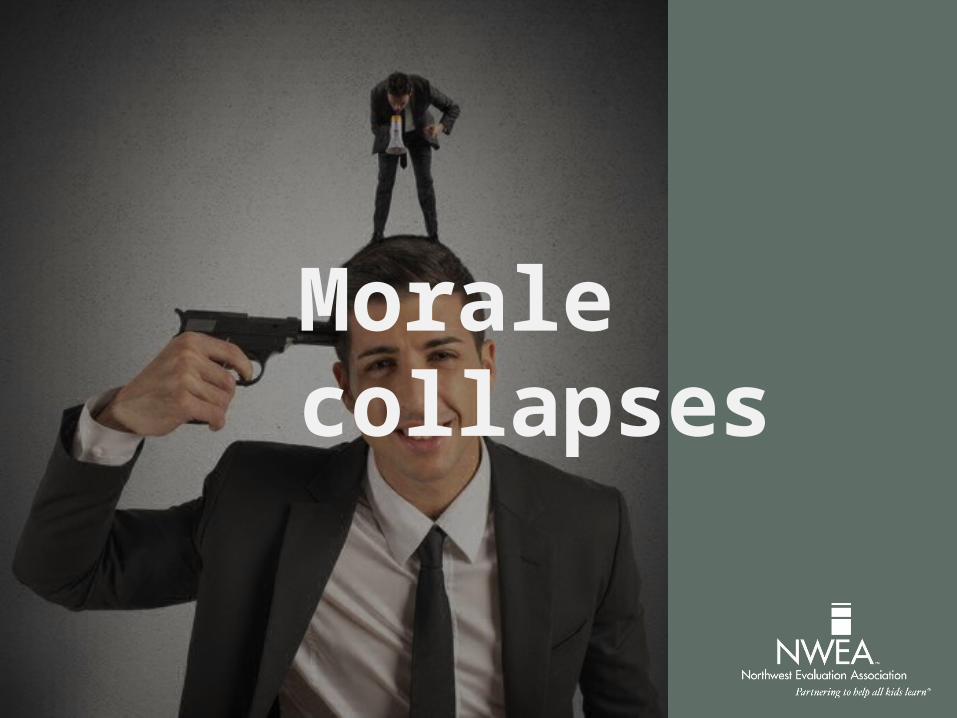
Morale collapses
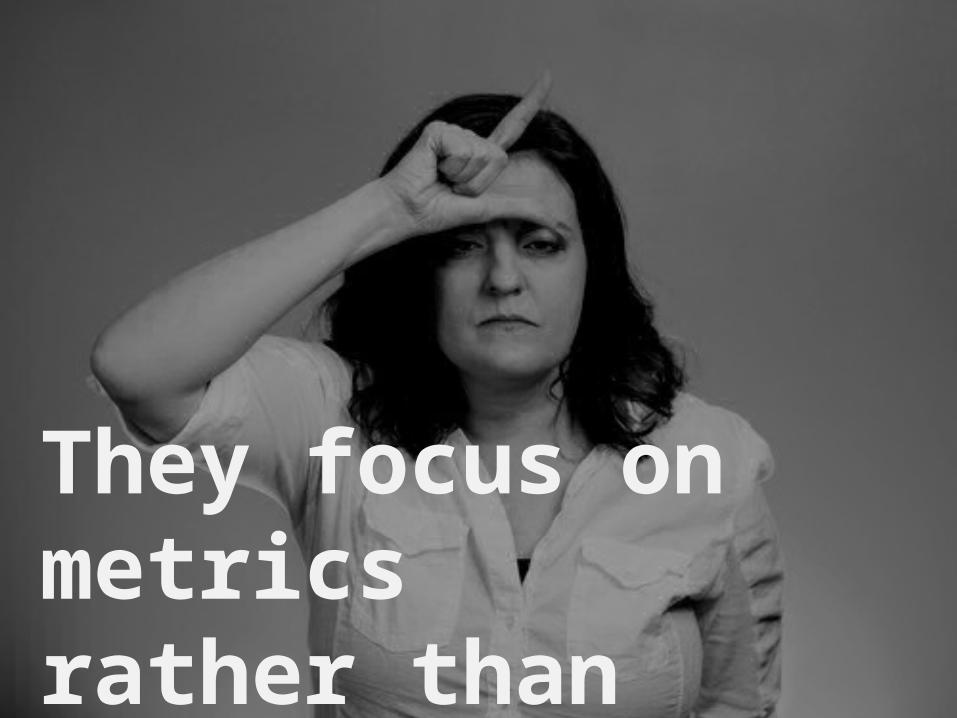
They focus on metrics rather than learning
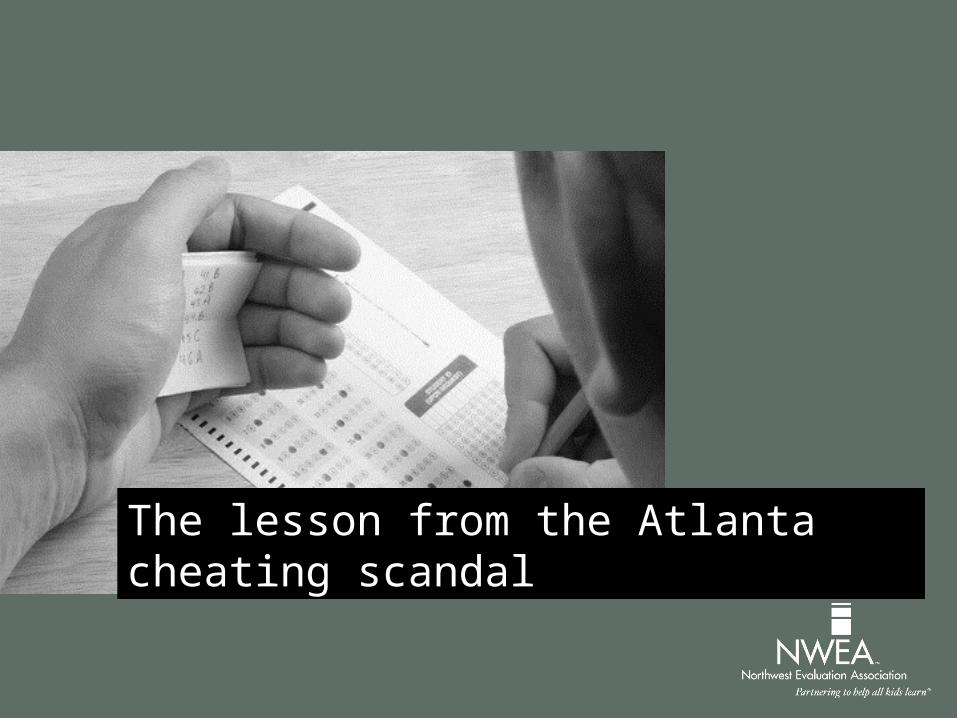
The lesson from the Atlanta cheating scandal
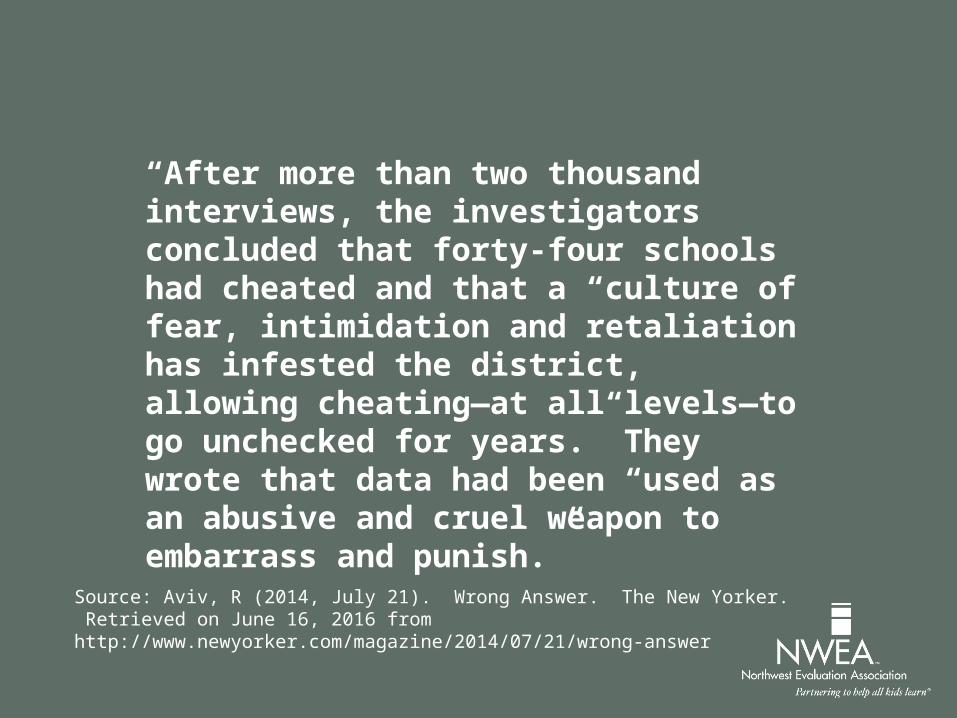
Source: Aviv, R (2014, July 21). Wrong Answer. The New Yorker. Retrieved on June 16, 2016 from http://www.newyorker.com/magazine/2014/07/21/wrong-answer
“After more than two thousand interviews, the investigators concluded that forty-four schools had cheated and that a “culture of fear, intimidation and retaliation has infested the district, allowing cheating—at all levels—to go unchecked for years.” They wrote that data had been “used as an abusive and cruel weapon to embarrass and punish.”
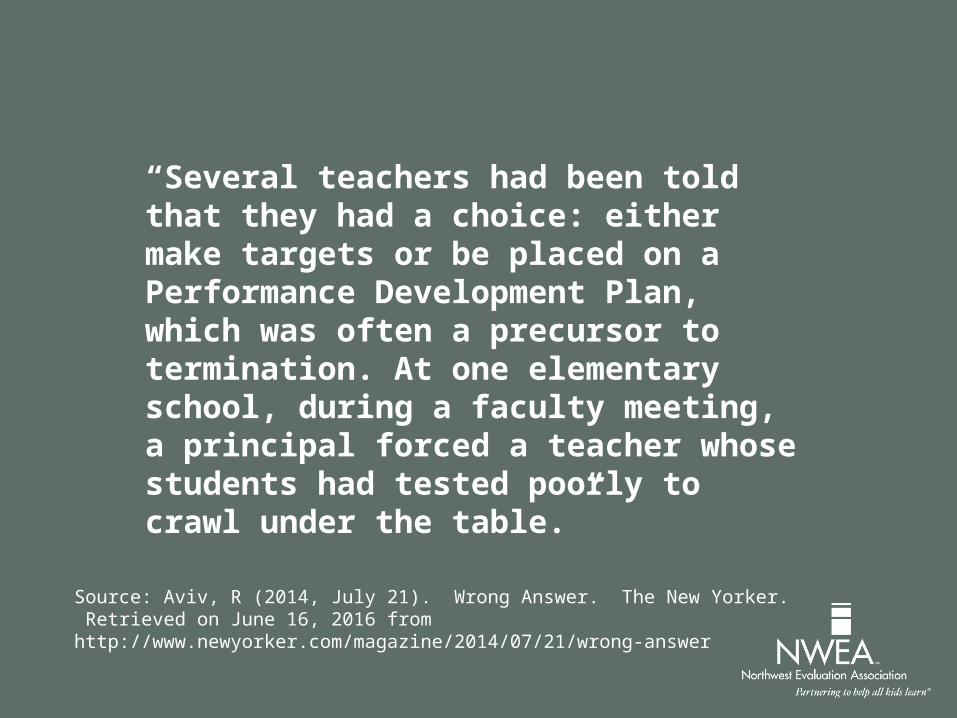
Source: Aviv, R (2014, July 21). Wrong Answer. The New Yorker. Retrieved on June 16, 2016 from http://www.newyorker.com/magazine/2014/07/21/wrong-answer
“Several teachers had been told that they had a choice: either make targets or be placed on a Performance Development Plan, which was often a precursor to termination. At one elementary school, during a faculty meeting, a principal forced a teacher whose students had tested poorly to crawl under the table.”
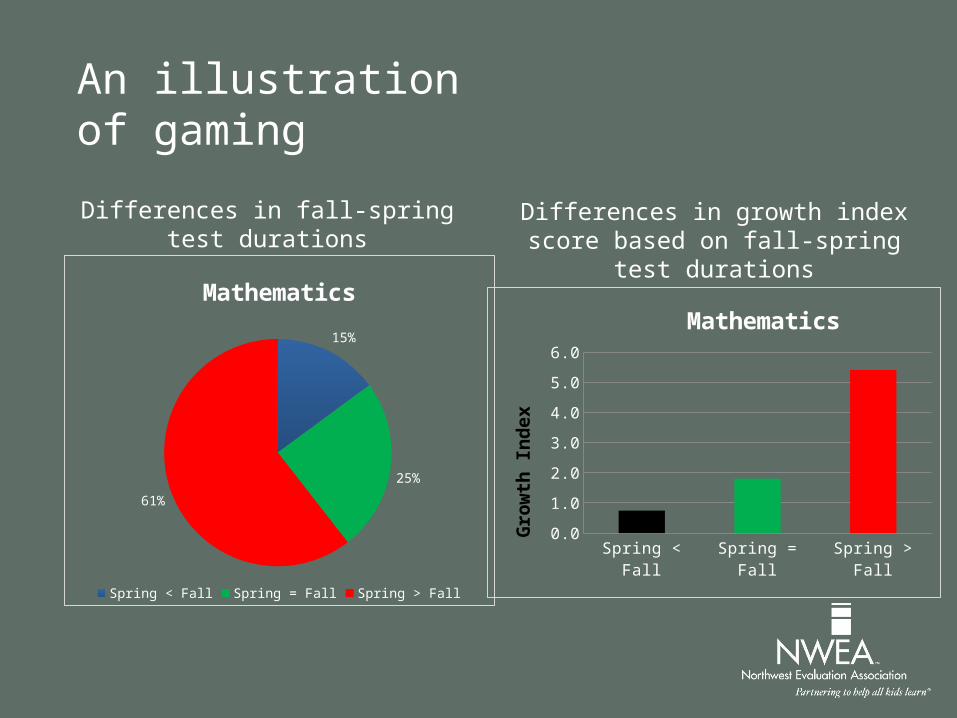
Differences in fall-spring test durations
An illustration of gaming
15%
25%
61%
Mathematics
Spring < Fall Spring = Fall Spring > FallSpring < Fall Spring = Fall Spring > Fall
0.0
1.0
2.0
3.0
4.0
5.0
6.0
Mathematics
Grow
th In
dex
Differences in growth index score based on fall-spring test durations

What constitutes a reasonable school improvement goal?
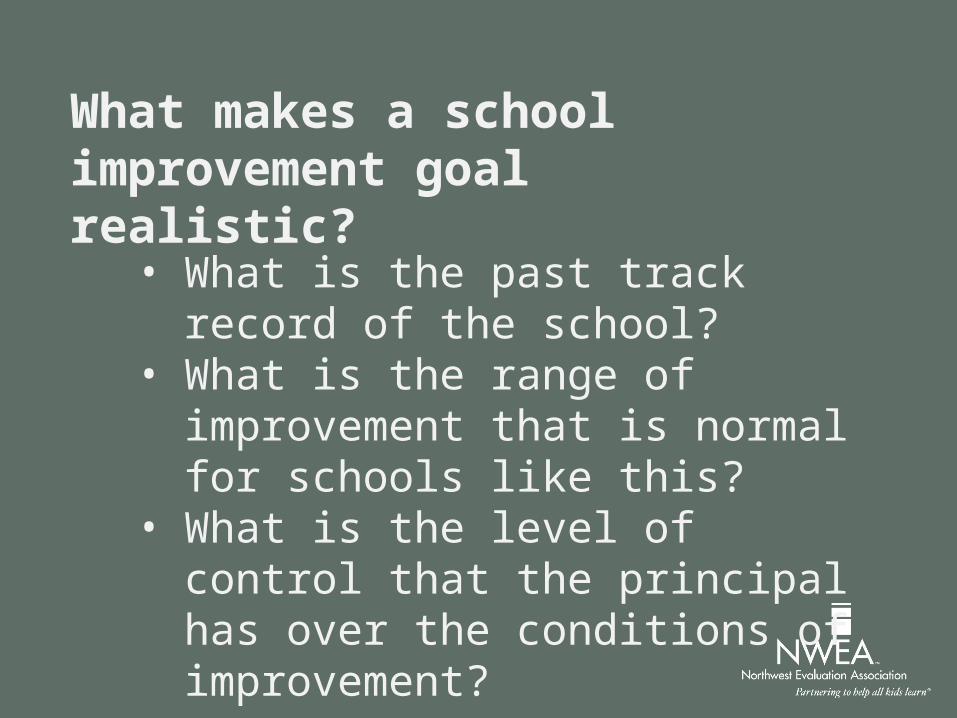
What makes a school improvement goal realistic?
• What is the past track record of the school?
• What is the range of improvement that is normal for schools like this?
• What is the level of control that the principal has over the conditions of improvement?

Three takeaways
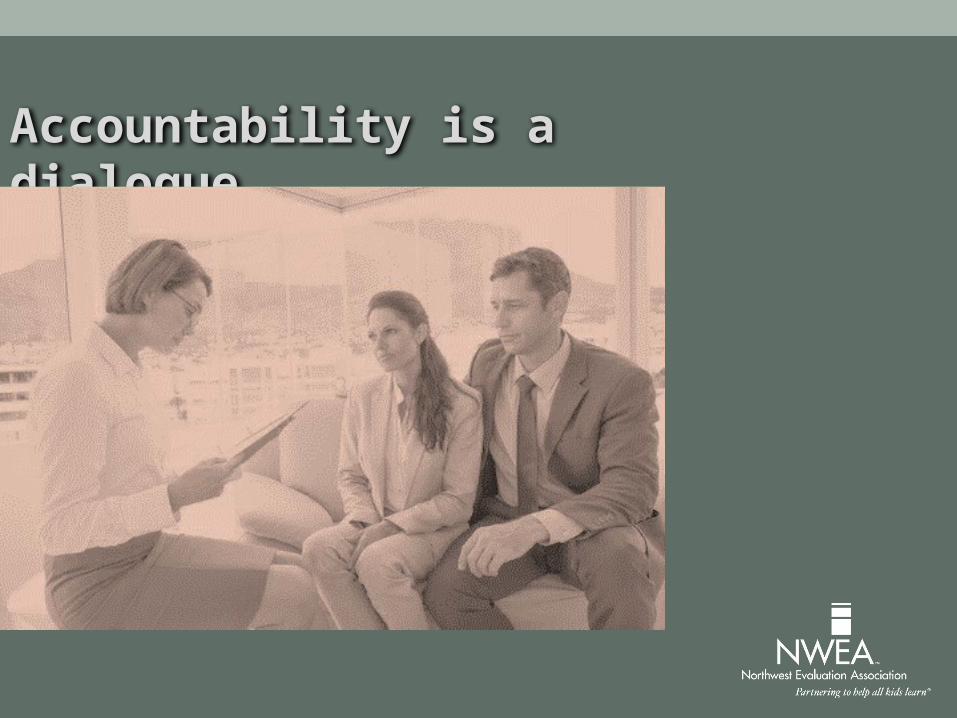
Accountability is a dialogue…

…not an inquisition
Metrics matter
Accountability isn’t about the absence of failure. Failure offers an opportunity to learn


![Accountability of Public Officers[1]](https://img.pdfslide.net/doc/110x75/577d2a791a28ab4e1ea943bf/accountability-of-public-officers1.jpg)