Embed Size (px)
Citation preview
Trading Confluences For High Probability Trading http://www.netpicks.com/my-kingdom-for-a-confluence/
If we agree that traders use different but often common methods of looking
at a chart, then is it possible to use that information for a higher
probability trade? The answer is a resounding YES!
Think of this..if many people are looking at "X" and then something happens at "X", expect a reaction. If many people are looking at "Y",
expect a reaction.
What if "X" and "Y" meet and you get twice as many people looking at the
same thing In trading, we call it a confluence. When two or more variables are
present, a confluence exists and these areas are ripe for the picking.
Think of traders who trade moving averages such as the 20 SMA. The
general trade plan is to look for pullbacks or rally to the moving
average and then take a trade in the direction of the trend.
Support and resistance traders look for price to move to their zone, hold, and
then trigger them into a trade. Fibonacci remains a popular method
as well and is generally used for clustering of levels or other
confluences
Let's plot a few things on the chart and see if anything lines up.
I wanted to keep things very rigid and unless price pulled right into the
confluence, I placed an X to indicate that close is not close enough.
While price may have hit one of the variables, to keep a strict trading plan
we would require price to be in the entire zone.
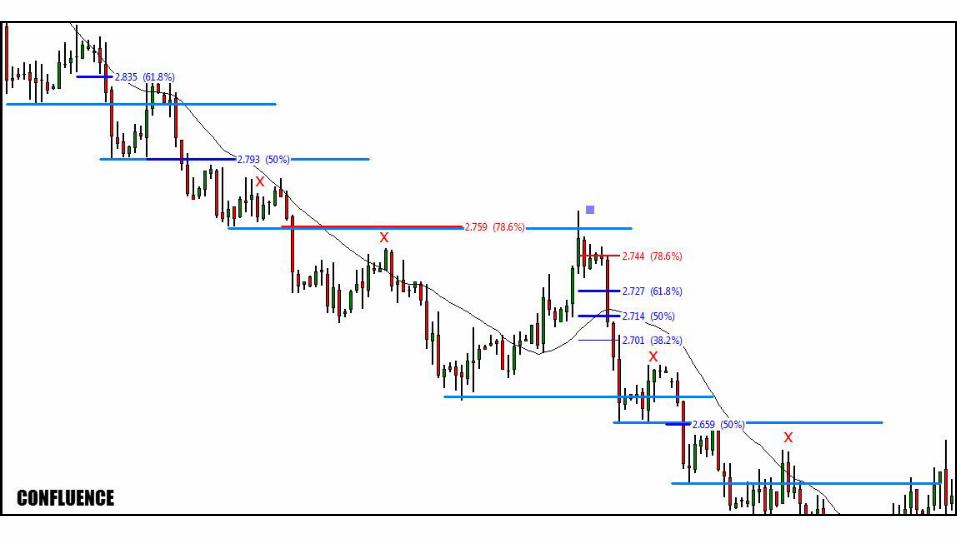
Pointing out the blue box which coincides with the biggest drop makes things interesting. Not shown on the
chart but price is hitting the 100 period SMA, pulling into a Fibonacci area, and an area that was former
support.
Do you get in on every trade? No and that is one of the good things about
looking for a few variables to come in line and that is..less trading.
There are many ways and tools you can use to find a confluence of factors
to influence your trading decisions. From simple price structure to
indicator usages, the list of combinations is virtually endless.
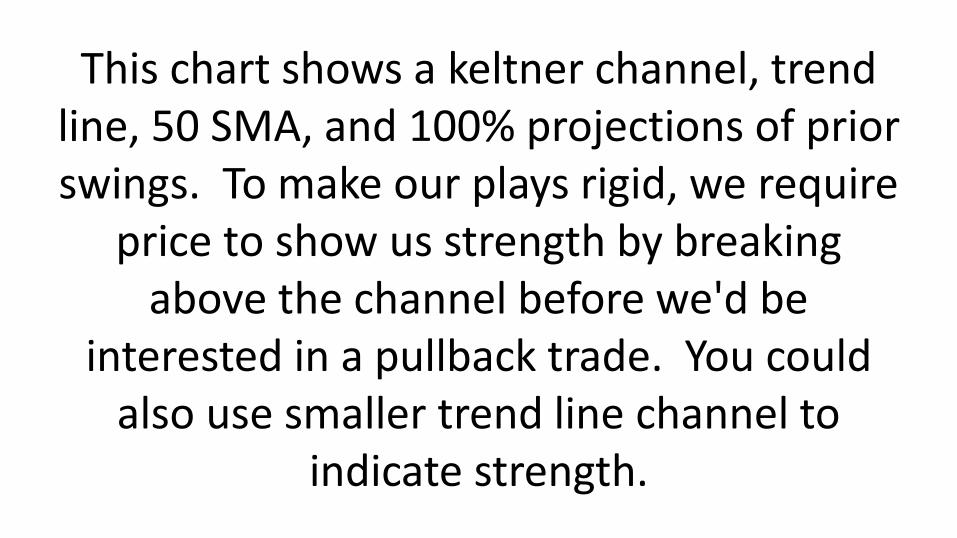
This chart shows a keltner channel, trend line, 50 SMA, and 100% projections of prior swings. To make our plays rigid, we require
price to show us strength by breaking above the channel before we'd be
interested in a pullback trade. You could also use smaller trend line channel to
indicate strength.
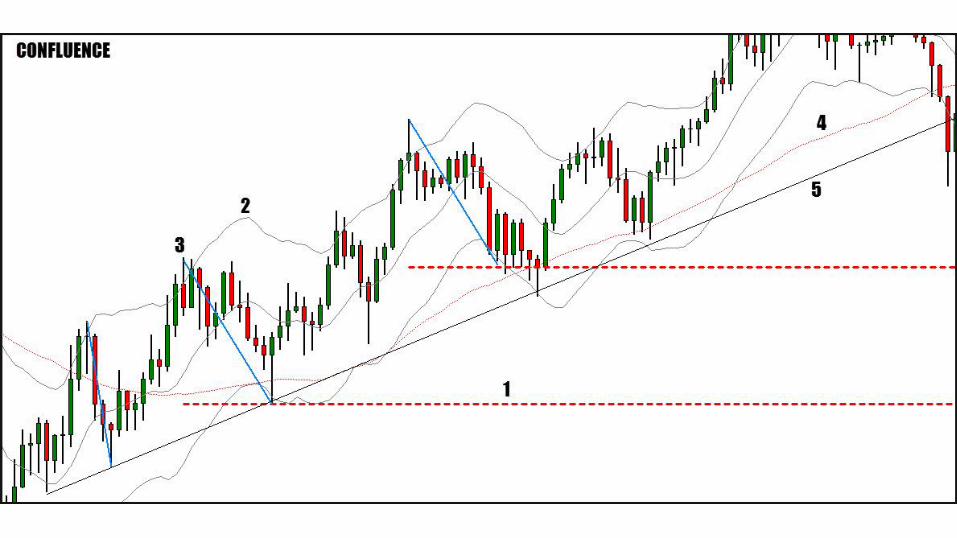
1. We need price to almost touch our 100% projection and only after price
moves outside the top of the channel.
2. The top of the channel must be penetrated.
3. These lines are for a visual clue for this article as to which corrective
swing we are using for our projections.
4. Our 50 SMA must come in to close proximity of the pullback.
5. Price need not touch the trend line but again, must come within a
reasonable distance.
To keep things fair, I've discounted areas that didn't have a line up of all our variables. In real trading, you'd
attempt to stay in the trend until you determine the current up move has
potential for a deep correction or even a total trend change.
This would limit your need for trade entries as you ride the move from your
initial trigger.
CONFLUENCE OF STOPS One group of people who use
confluence very well are those with the big money. What they like is a confluence of obvious swing levels,
range levels, and the group of traders who like tight stops for bigger position
sizing.
They like to use a confluence of traders decisions and tendencies.
We've all been in a trade where price starts in our direction, changes
direction taking out a low, our stop, and then continuing in our direction.
Even better, price exhibits a sharp move and pulls in counter-trend
traders who quickly see their position underwater and are forced to exit.
Understand that the larger players can't simply accumulate or close their positions any time they choose. Well,
they obviously can but at slippage amounts they'd prefer not to have.
The best place to do business for them is at areas where liquidity is added to
the market. One good place is where a cluster of stops will likely be.
Trigger stops
Accumulate/liquidate Prevent excessive slippage
Another area is at levels where counter-trend traders enter the market.
Push price counter to the overall bias.
Bring in those looking to pick tops and bottoms. Reverse the direction and stop them out.
This weekly charts overall bias is to the upside I used a daily chart to draw the
trend lines.
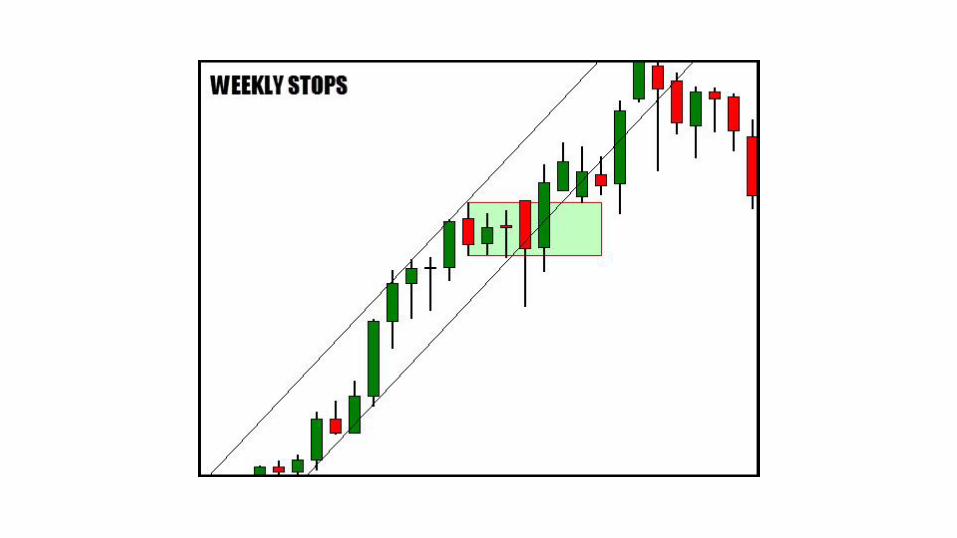
The daily price ranged near the top of the trend line, formed a smaller range
inside the range, and then price slammed hard. There is a strong break
of the trend line which is a sign for counter-trend traders to pile on the
down move.
Price drops lower and the bigger players begin to accumulate at lower
prices. Their buying forces the market higher causing the counter-trends to hit the panic button and exit and in doing so, add liquidity to the market which the bigger players scoop up.
If you require a few factors to line up to interest you in a trade, you will
probably be safe from the pitfalls of over trading. I don't think having
redundancy as part of your confluence system is a good thing though.
Having several trend indicators, momentum indicators, channels, trend
lines, and structure is overkill.
For pullback traders, having a structure point or some other tool to measure a pullback keeps you from taking those that are shallow and weak. Using a momentum indicator can show you when the rate of change in price is
turning in your favor.
Using a handful of tools is enough to pinpoint an area of confluence that has the potential for you to enter a
trade.
Break out traders, may look for a range and need to see a range form inside the range. Perhaps they will need to see failure tests of lows or highs to
validate the range and flushes in the opposing direction.
Looking for a confluence will keep you out of the "fear of missing out" and ensure you only take planned out trading opportunities and not be
seduced by the price moves alone.
As with all trading plans, the key is testing and consistency before you
decide to put the money on the line.