Embed Size (px)
Citation preview
Creating Interactive Dashboards
Excel 2010-2013
Jennifer Chadwick
Associate Vice President for Enrollment Management
University of North Georgia
EM Consultant
Loralyn Taylor, Ph.D.
Director of Analytics for University Student Success Initiatives
Ohio University

Jenn’s UNG Story
Keeping You and Your End Users Happy
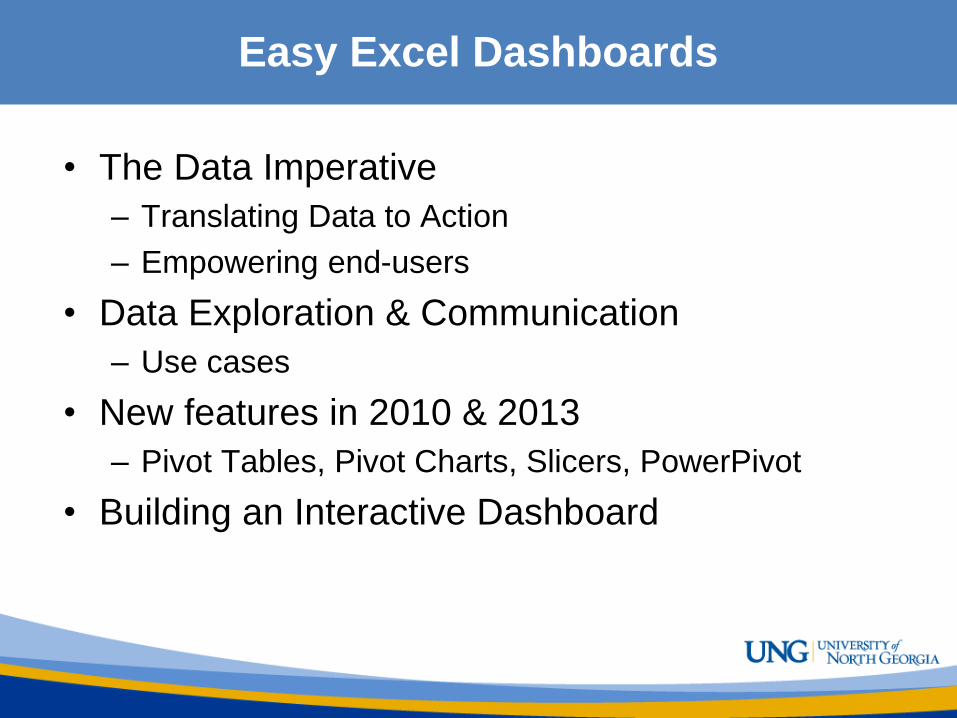
Easy Excel Dashboards
• The Data Imperative
– Translating Data to Action
– Empowering end-users
• Data Exploration & Communication
– Use cases
• New features in 2010 & 2013
– Pivot Tables, Pivot Charts, Slicers, PowerPivot
• Building an Interactive Dashboard
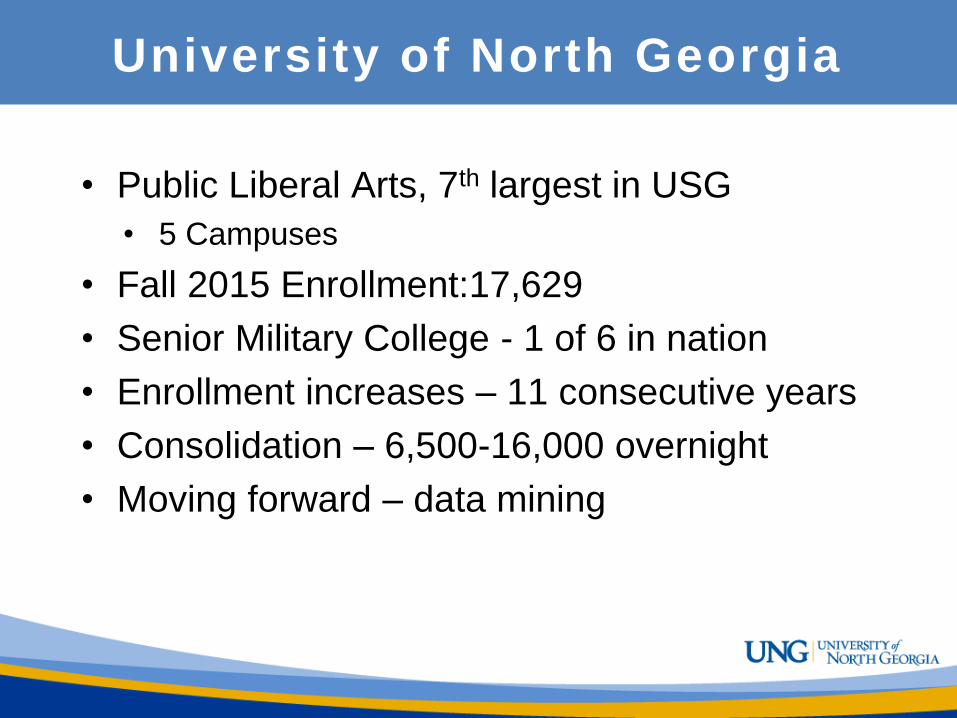
University of North Georgia
• Public Liberal Arts, 7th largest in USG
• 5 Campuses
• Fall 2015 Enrollment:17,629
• Senior Military College - 1 of 6 in nation
• Enrollment increases – 11 consecutive years
• Consolidation – 6,500-16,000 overnight
• Moving forward – data mining
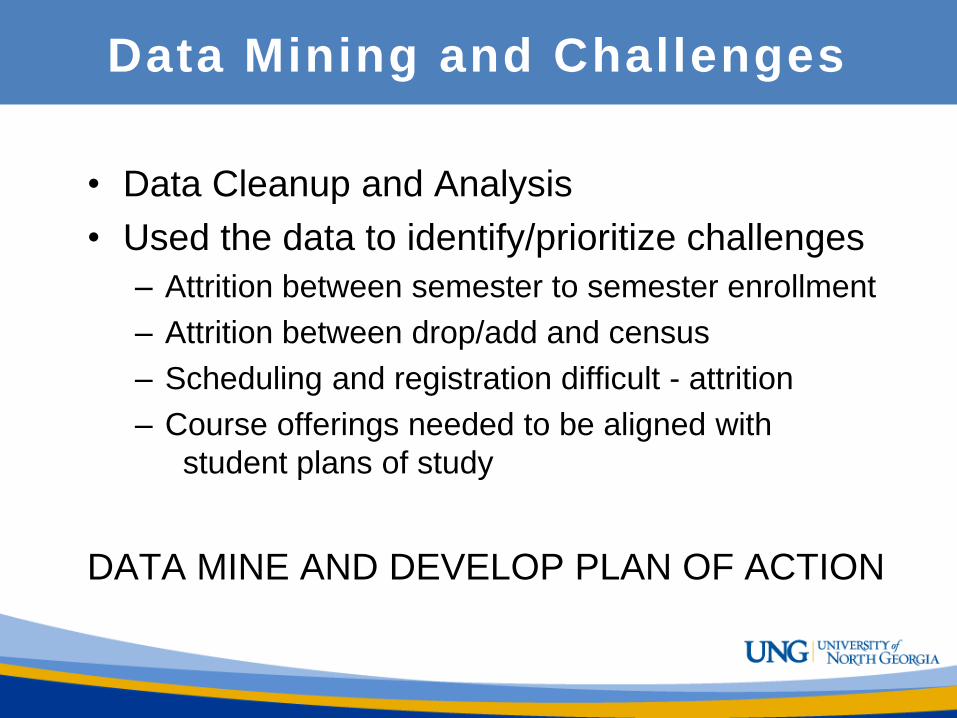
Data Mining and Challenges
• Data Cleanup and Analysis
• Used the data to identify/prioritize challenges
– Attrition between semester to semester enrollment
– Attrition between drop/add and census
– Scheduling and registration difficult - attrition
– Course offerings needed to be aligned with
student plans of study
DATA MINE AND DEVELOP PLAN OF ACTION
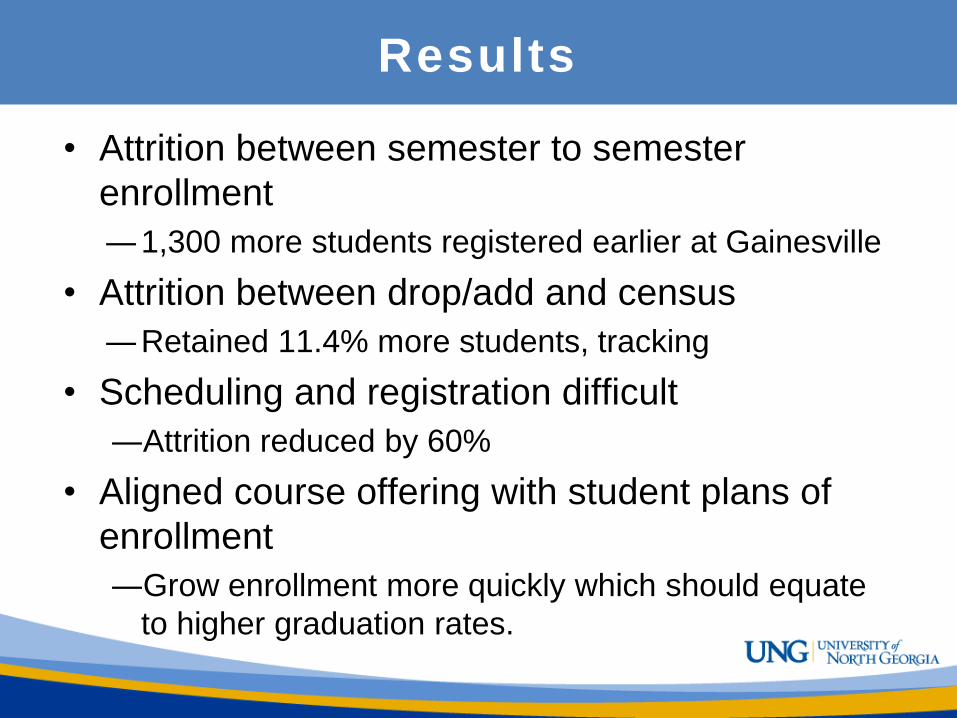
Results
• Attrition between semester to semester
enrollment
―1,300 more students registered earlier at Gainesville
• Attrition between drop/add and census
―Retained 11.4% more students, tracking
• Scheduling and registration difficult
―Attrition reduced by 60%
• Aligned course offering with student plans of
enrollment
―Grow enrollment more quickly which should equate
to higher graduation rates.

• Small, private
• Low selectivity
• High First Gen
• High Pell
• HS Ave: B
• SAT Total: 970


Graduation Rate Increases
Two Year on time Associate’s Degree: +74%
Four Year on time Bachelor’s Degree: +23%

Ohio University

DANGER
HIGHER ED
UNDER PRESSURE

Enrollment Management
The Goal
“…more and better information into the
hands of a greater number of people,
enabling informed decision-making.”
http://www.educause.edu/ero/article/academic-analytics-new-tool-new-era
Analytics
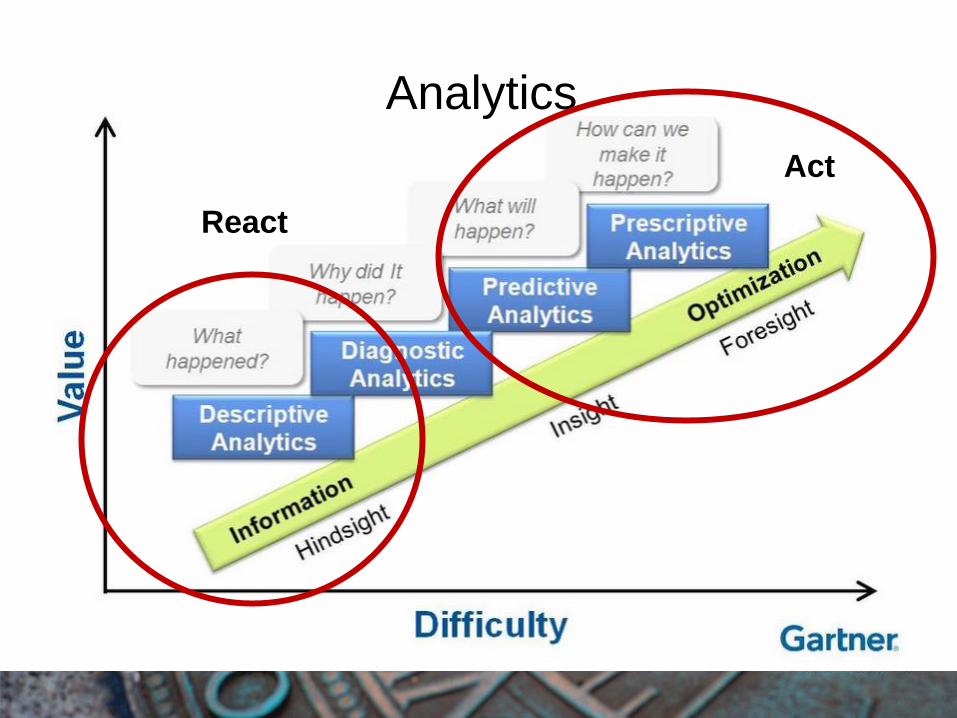
React
Act
Analytics
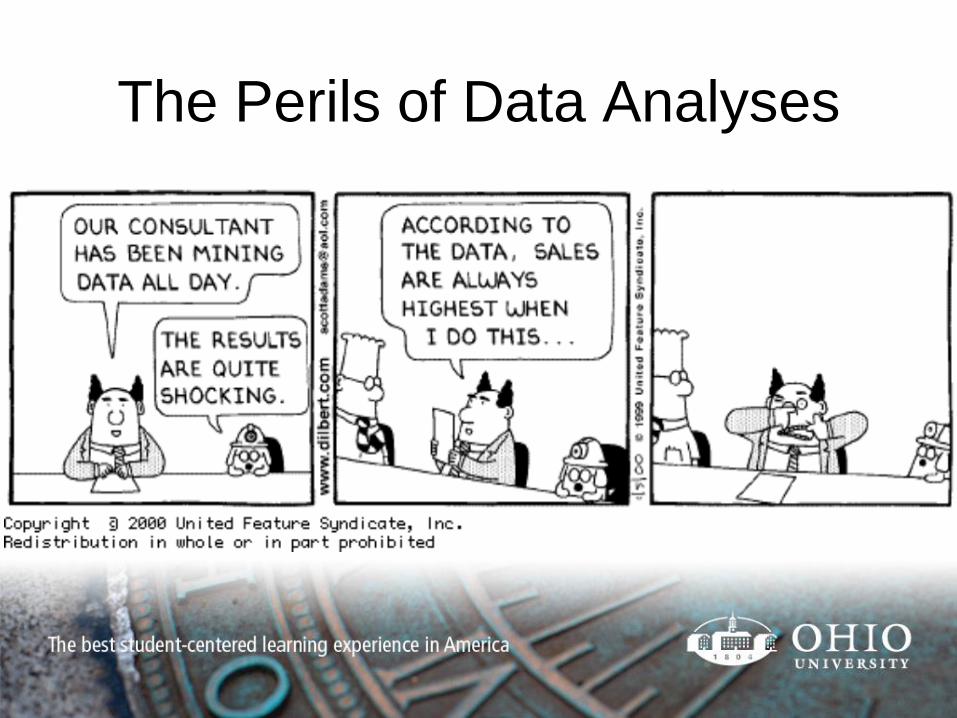
The Perils of Data Analyses
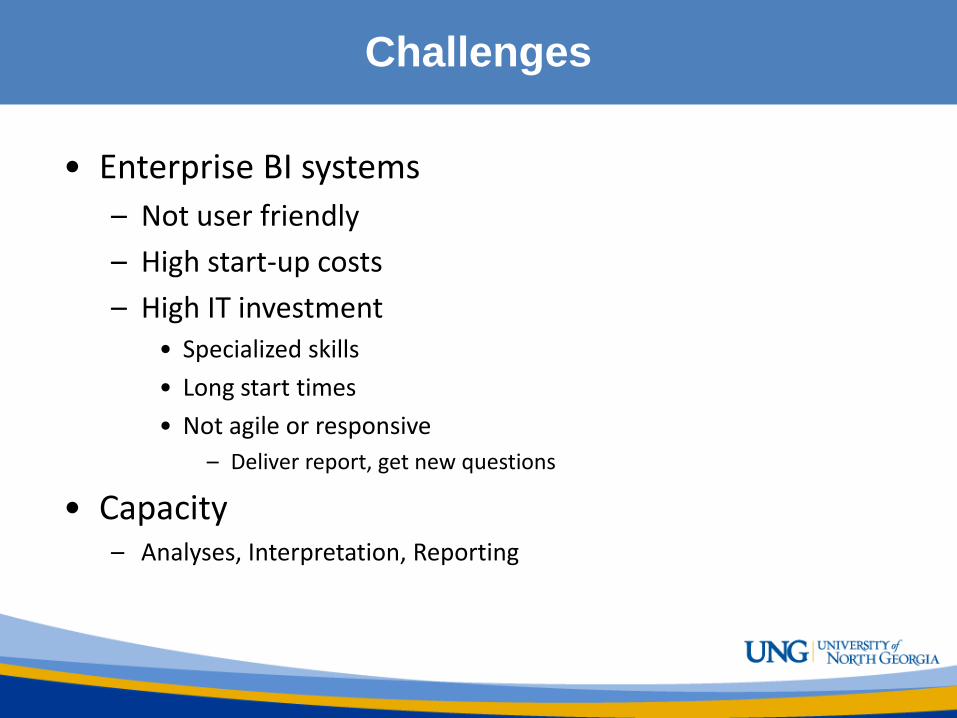
Challenges
• Enterprise BI systems
– Not user friendly
– High start-up costs
– High IT investment • Specialized skills
• Long start times
• Not agile or responsive
– Deliver report, get new questions
• Capacity – Analyses, Interpretation, Reporting

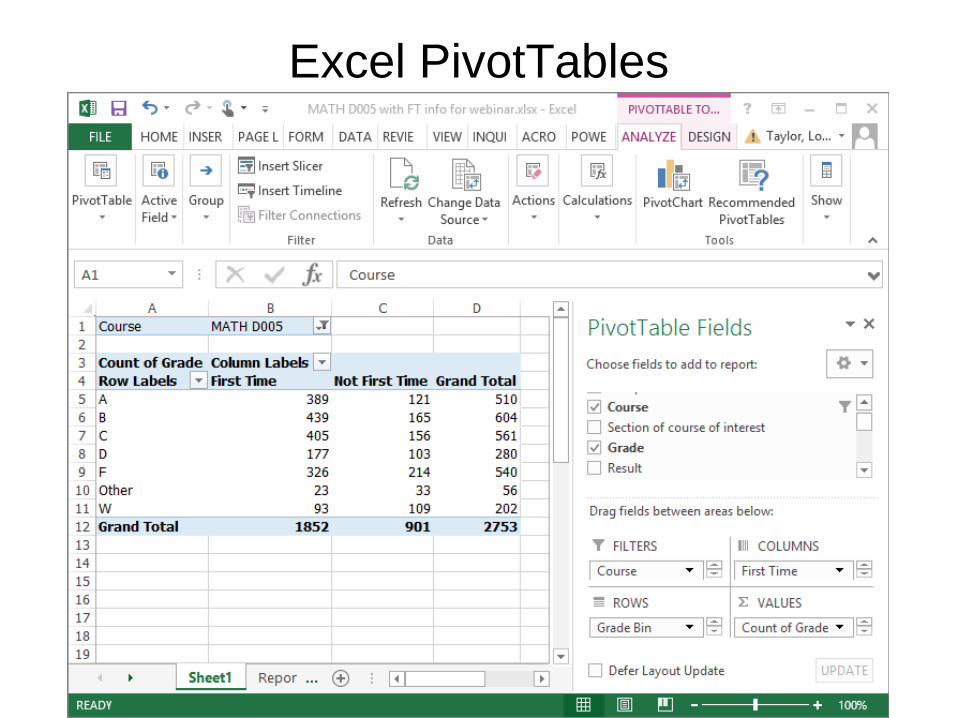
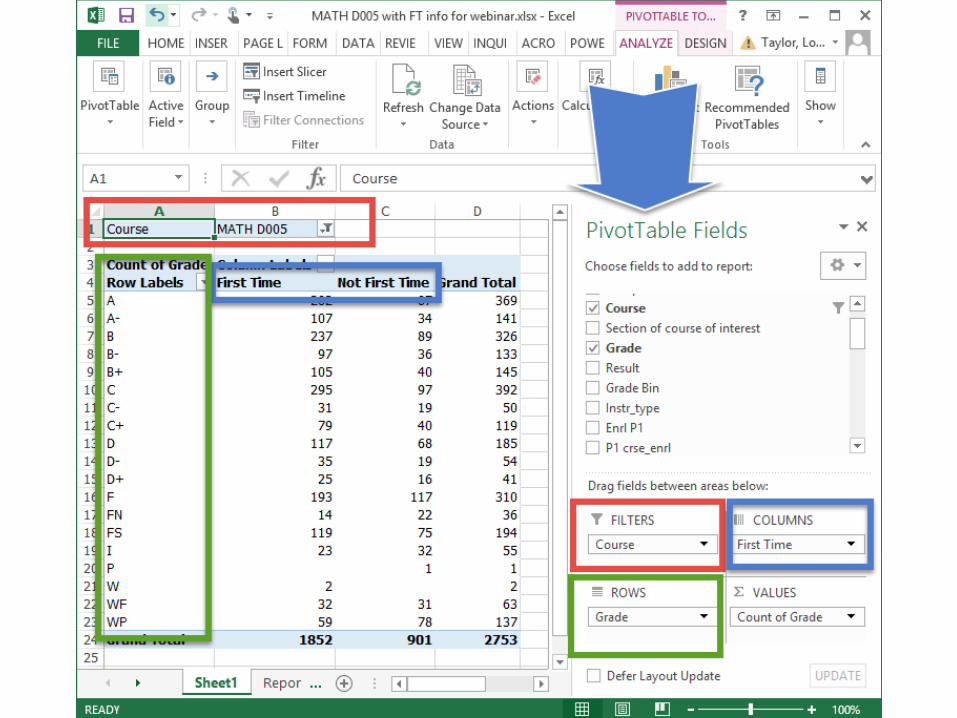
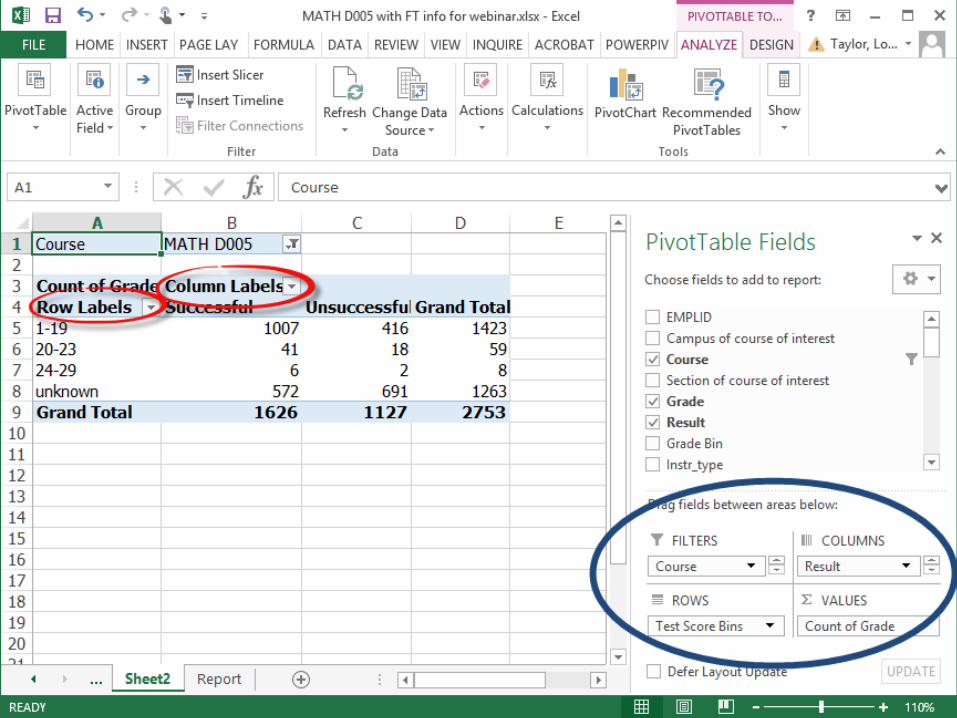
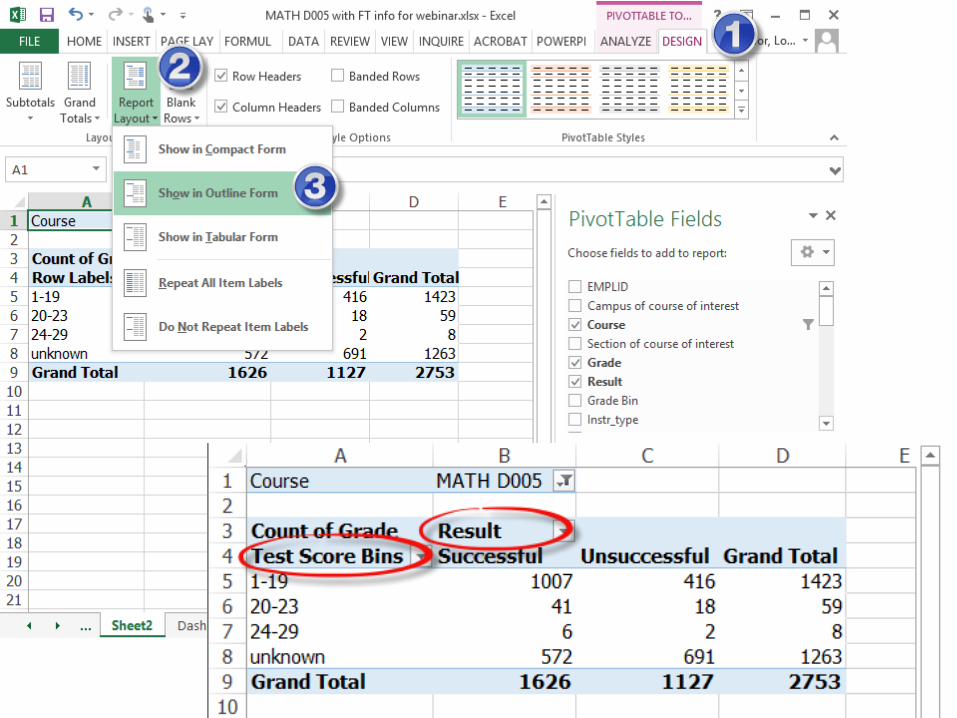
Excel PivotTables
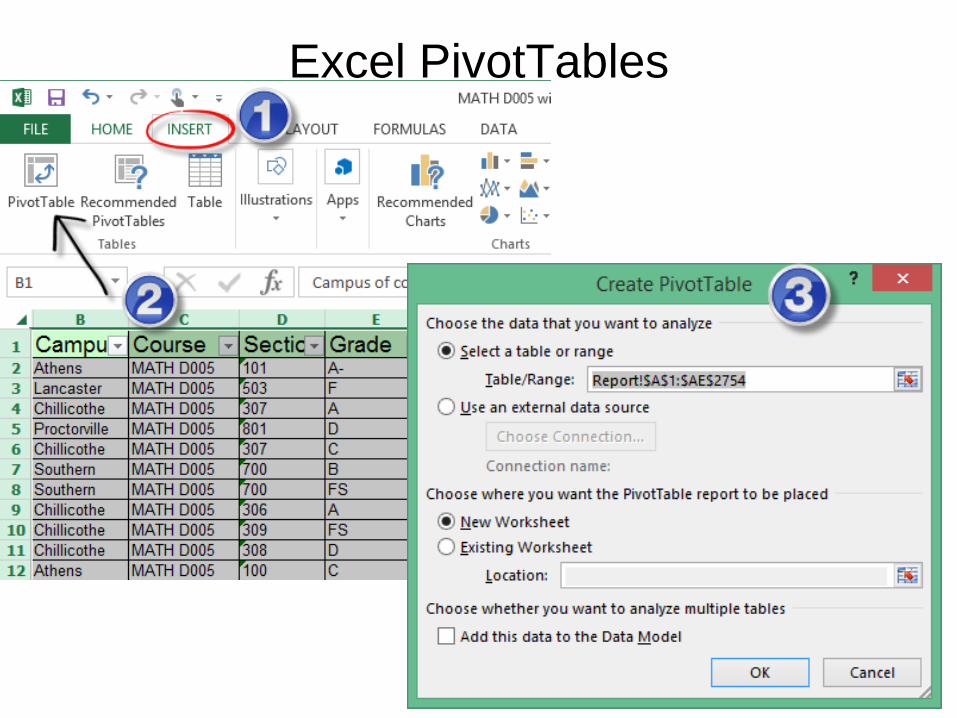
Excel PivotTables
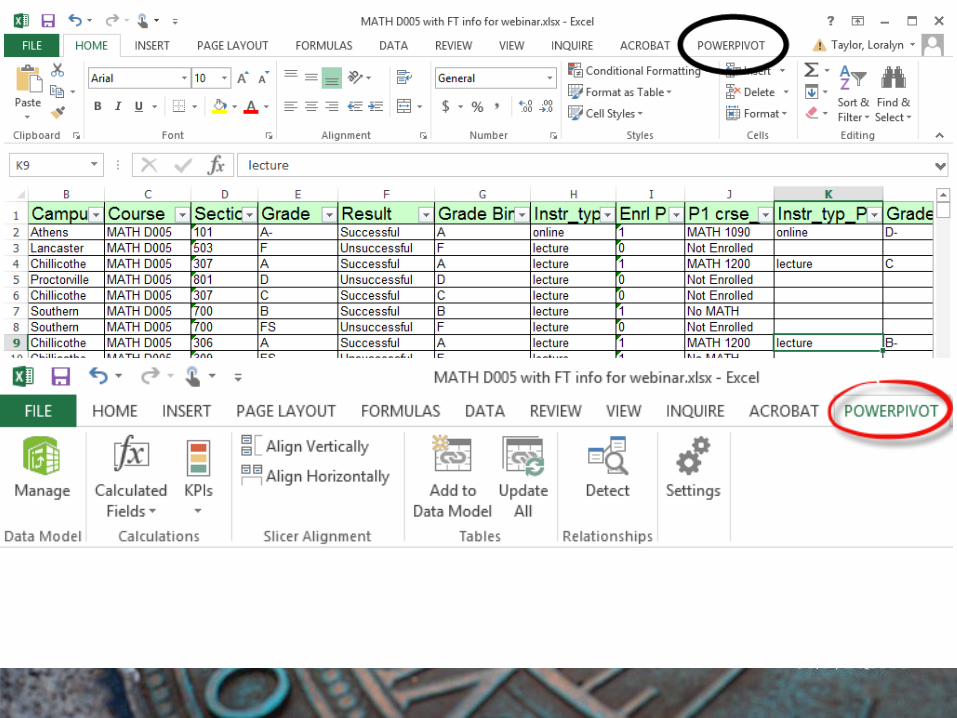
PowerPivot
• Microsoft add in to 2010 & 2013
– Free
– Microsoft Download Center
• www.Microsoft.com/en-us/download
• Search PowerPivot 2010 or 2013
• Powerful
– Still Excel PivotTables
• No programming
– Millions of records
– Combine & manipulate your data
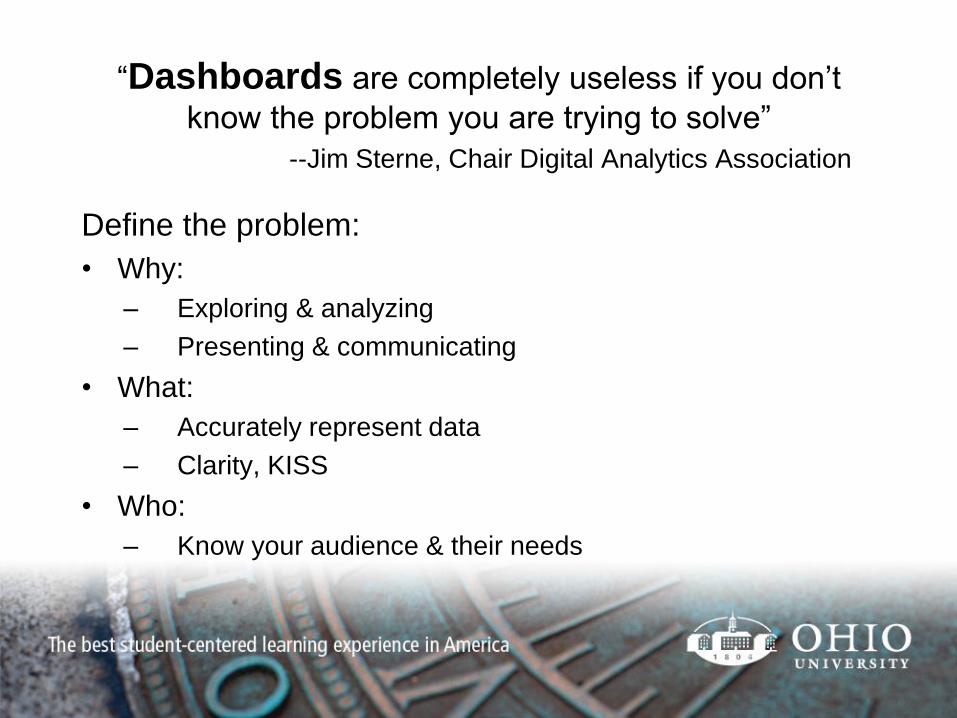
“Dashboards are completely useless if you don’t
know the problem you are trying to solve”
--Jim Sterne, Chair Digital Analytics Association
Define the problem:
• Why:
– Exploring & analyzing
– Presenting & communicating
• What:
– Accurately represent data
– Clarity, KISS
• Who:
– Know your audience & their needs
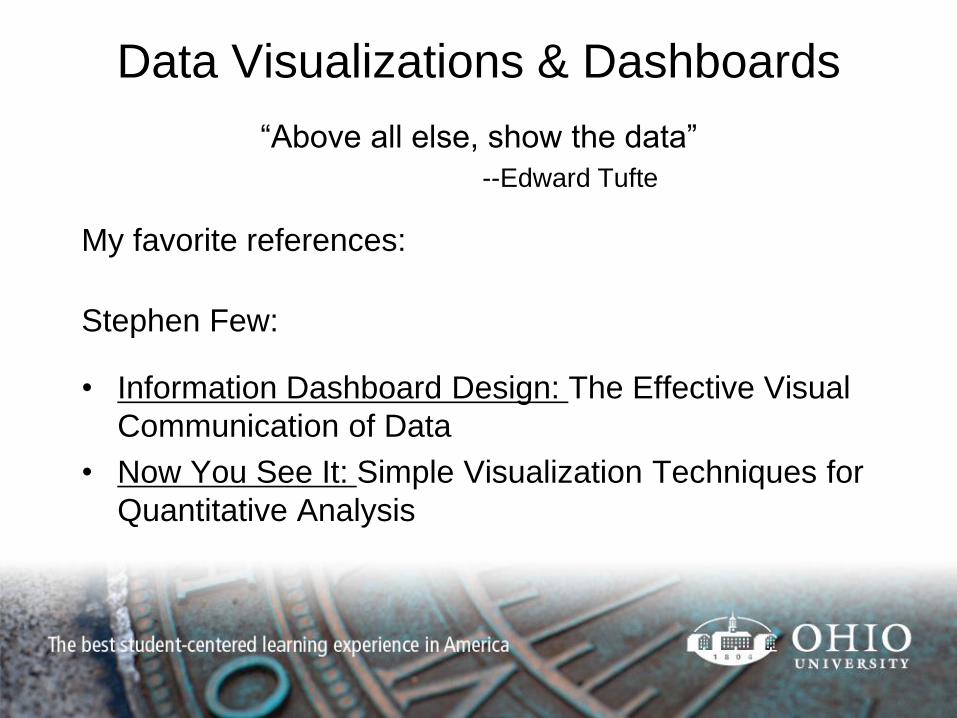
Data Visualizations & Dashboards
“Above all else, show the data”
--Edward Tufte
My favorite references:
Stephen Few:
• Information Dashboard Design: The Effective Visual
Communication of Data
• Now You See It: Simple Visualization Techniques for
Quantitative Analysis

Let’s Build!
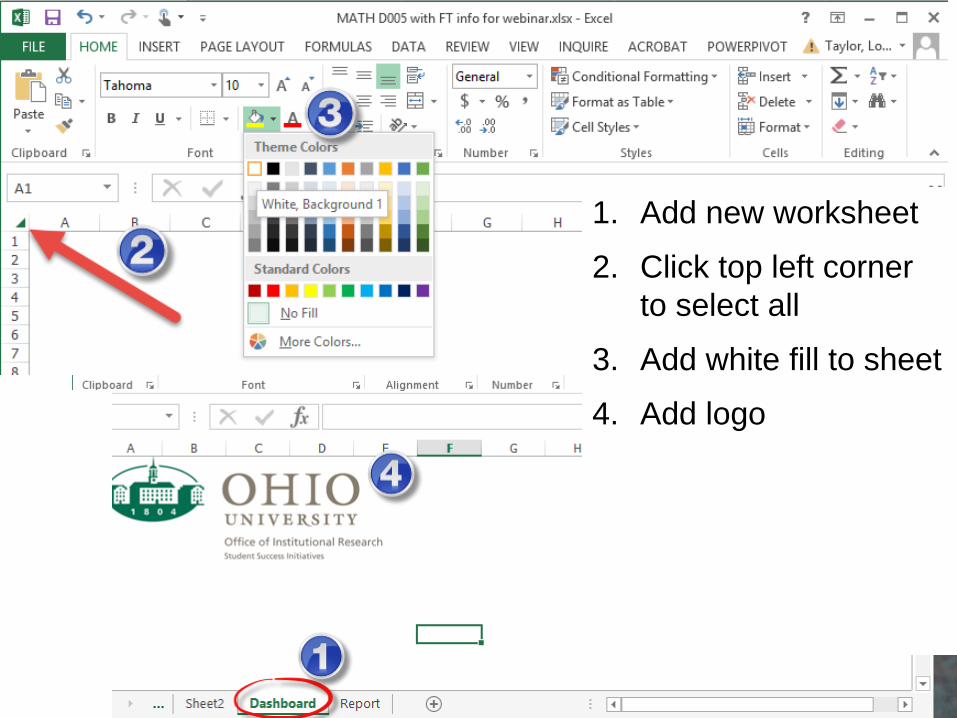
1. Add new worksheet
2. Click top left corner
to select all
3. Add white fill to sheet
4. Add logo

Excel PivotTables
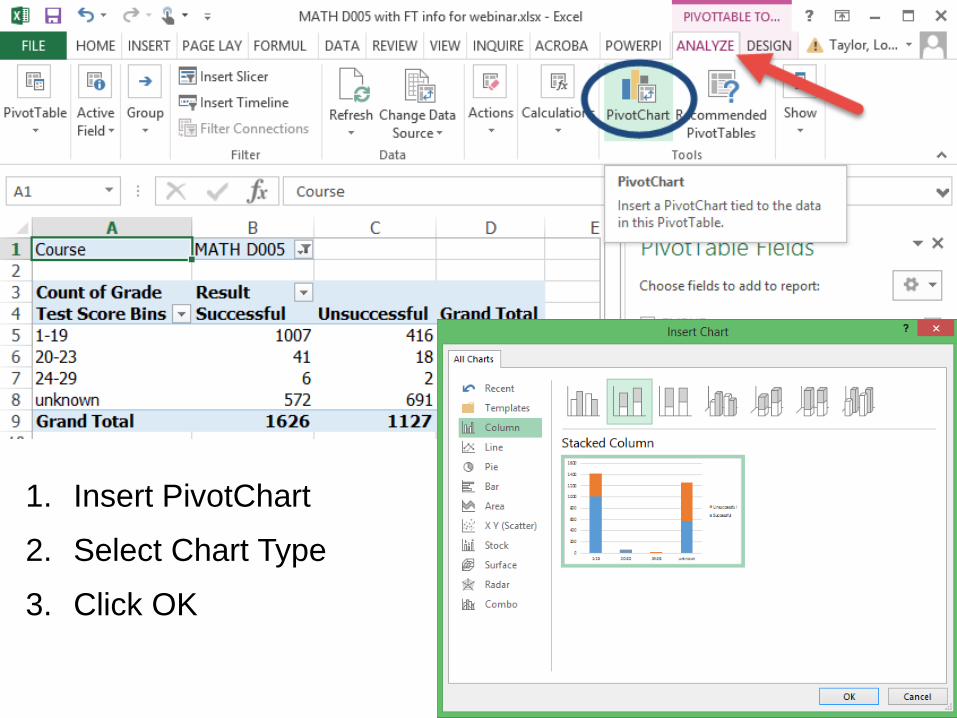
1. Insert PivotChart
2. Select Chart Type
3. Click OK
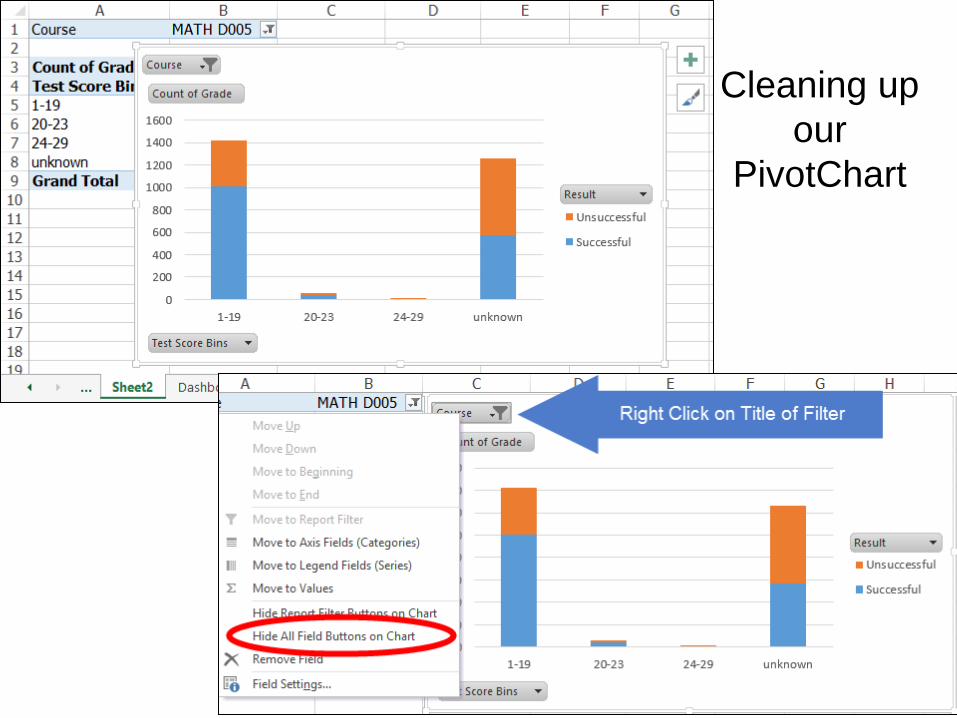
Cleaning up
our
PivotChart
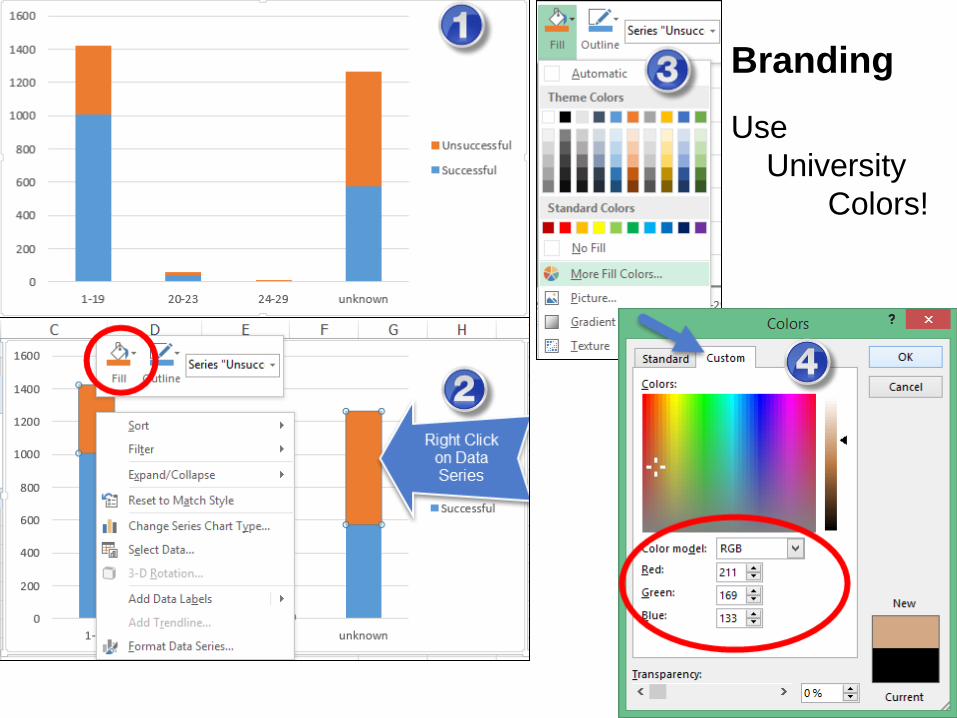
Branding
Use
University
Colors!
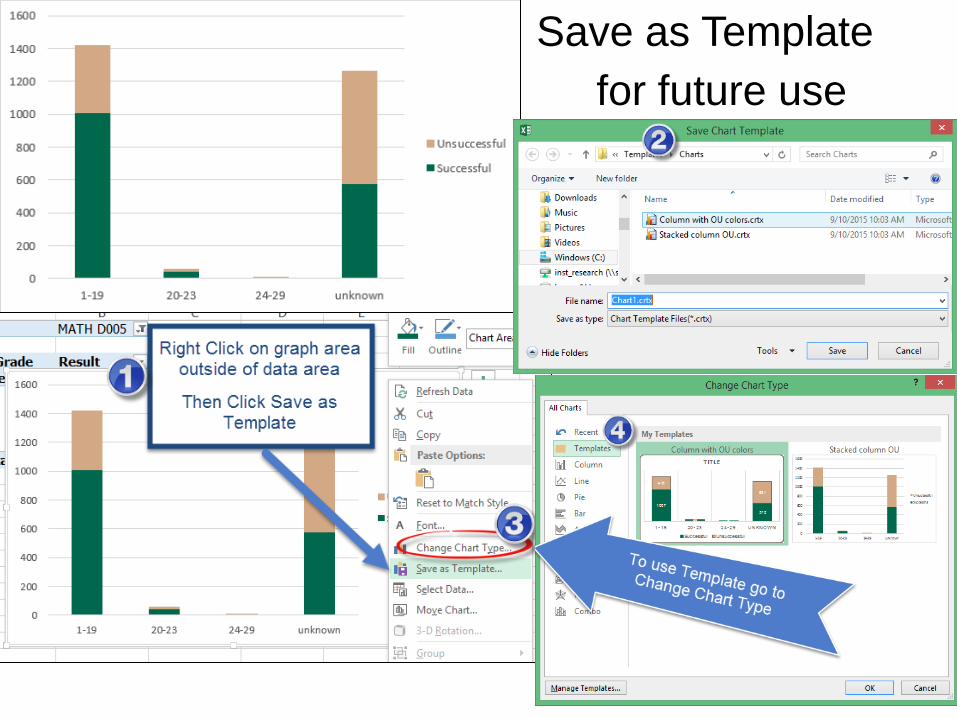
Save as Template
for future use
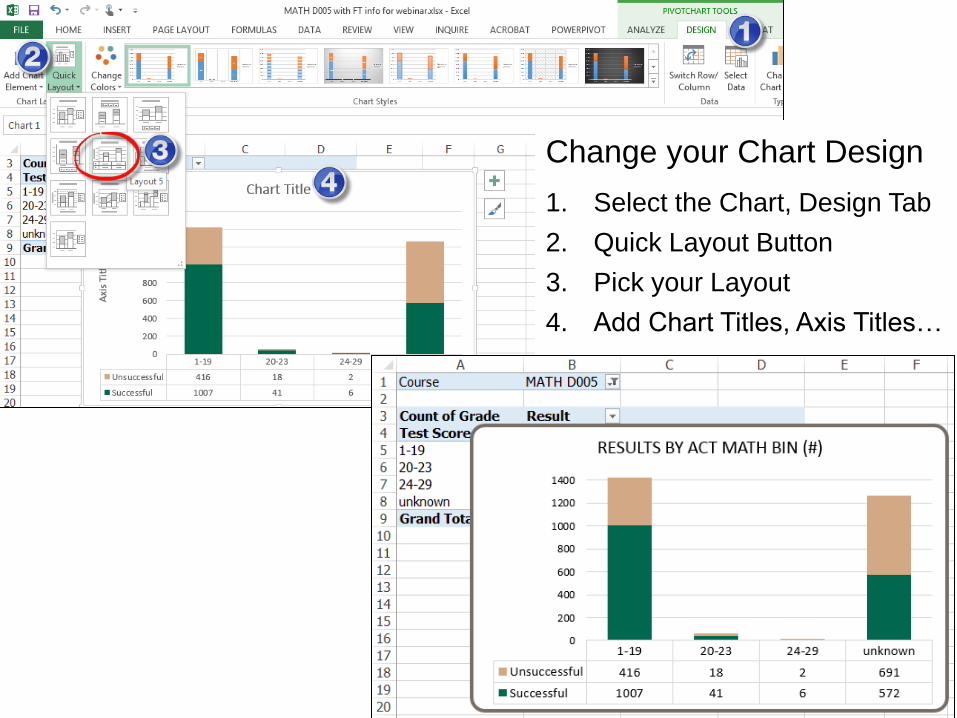
Change your Chart Design
1. Select the Chart, Design Tab
2. Quick Layout Button
3. Pick your Layout
4. Add Chart Titles, Axis Titles…
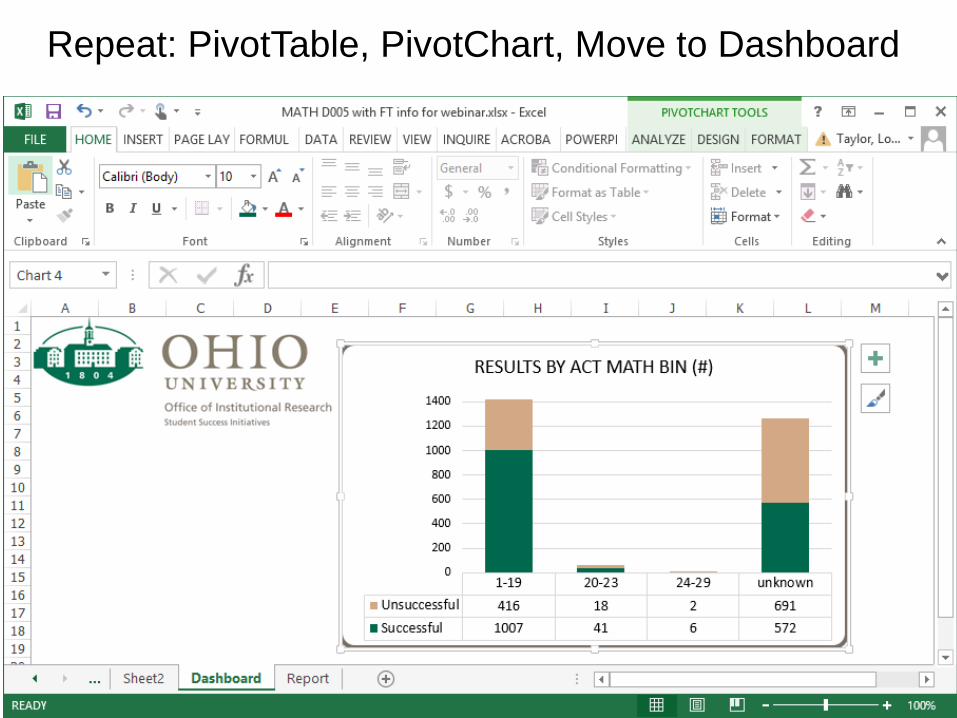
Repeat: PivotTable, PivotChart, Move to Dashboard
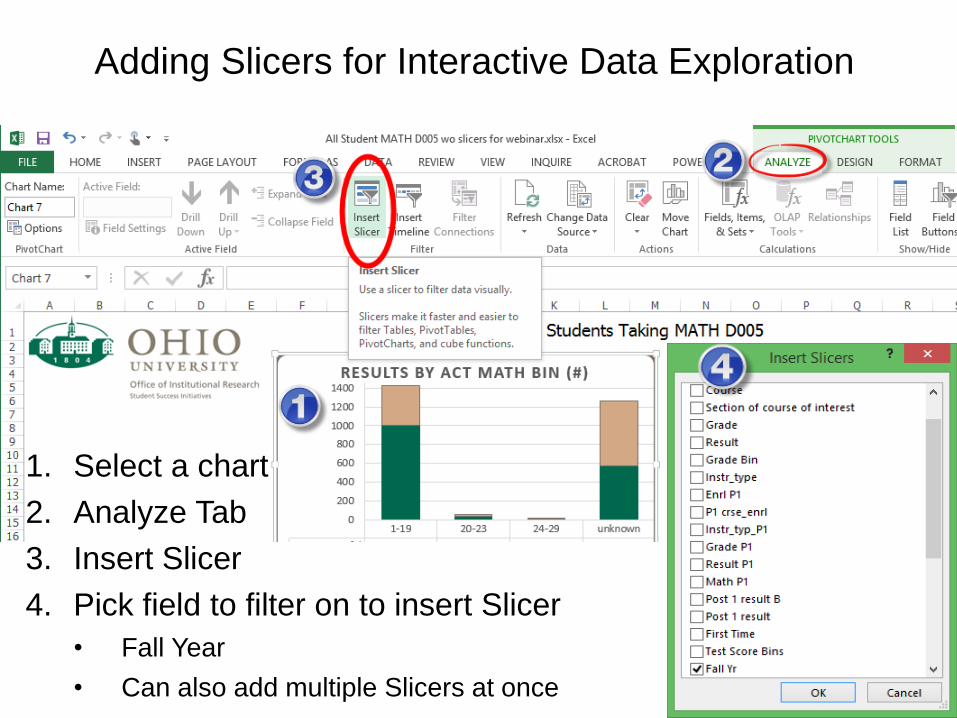
Adding Slicers for Interactive Data Exploration
1. Select a chart
2. Analyze Tab
3. Insert Slicer
4. Pick field to filter on to insert Slicer
• Fall Year
• Can also add multiple Slicers at once
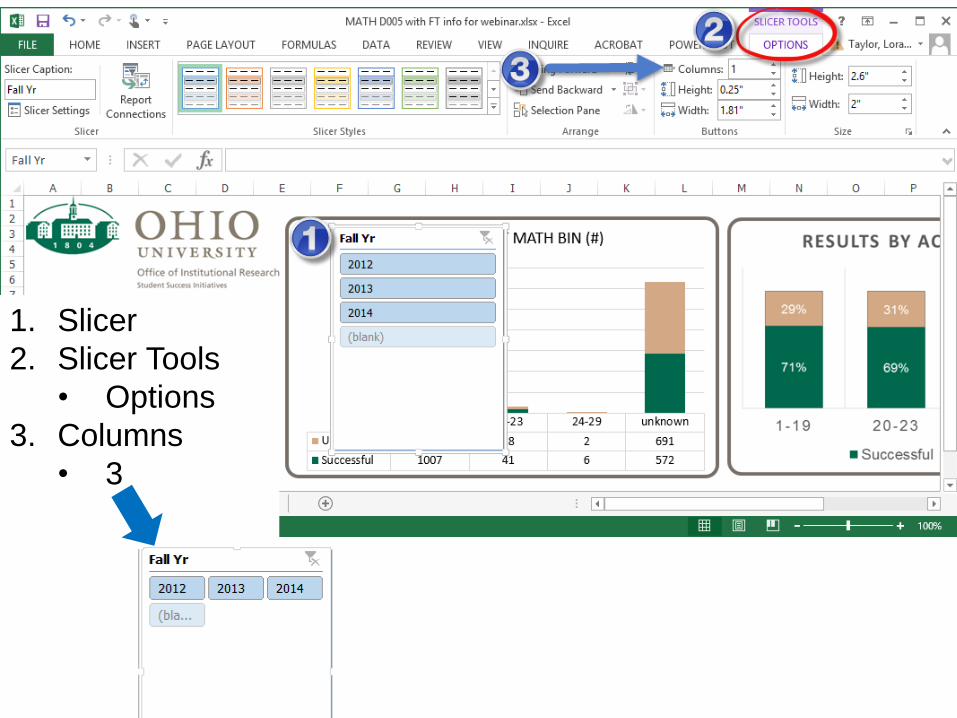
1. Slicer
2. Slicer Tools
• Options
3. Columns
• 3
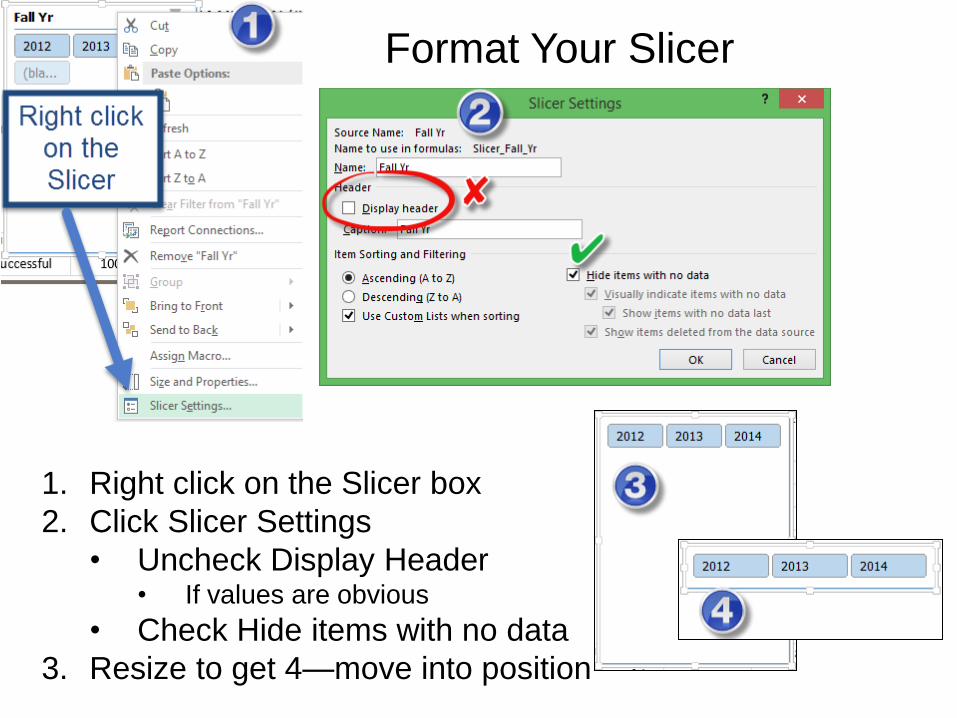
1. Right click on the Slicer box
2. Click Slicer Settings
• Uncheck Display Header • If values are obvious
• Check Hide items with no data
3. Resize to get 4—move into position
Format Your Slicer
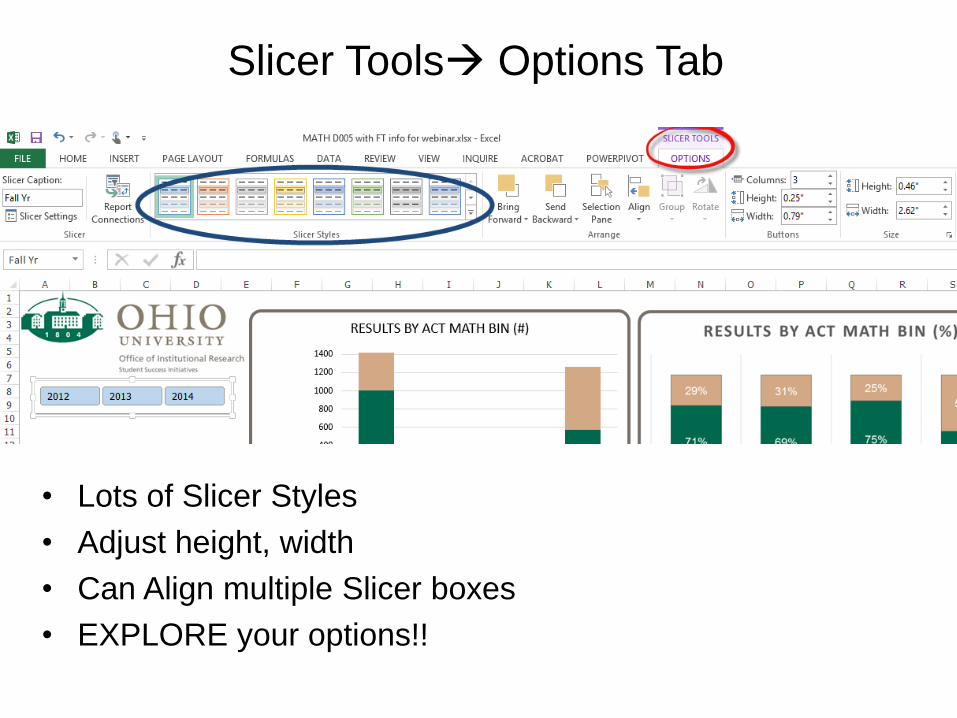
Slicer Tools Options Tab
• Lots of Slicer Styles
• Adjust height, width
• Can Align multiple Slicer boxes
• EXPLORE your options!!
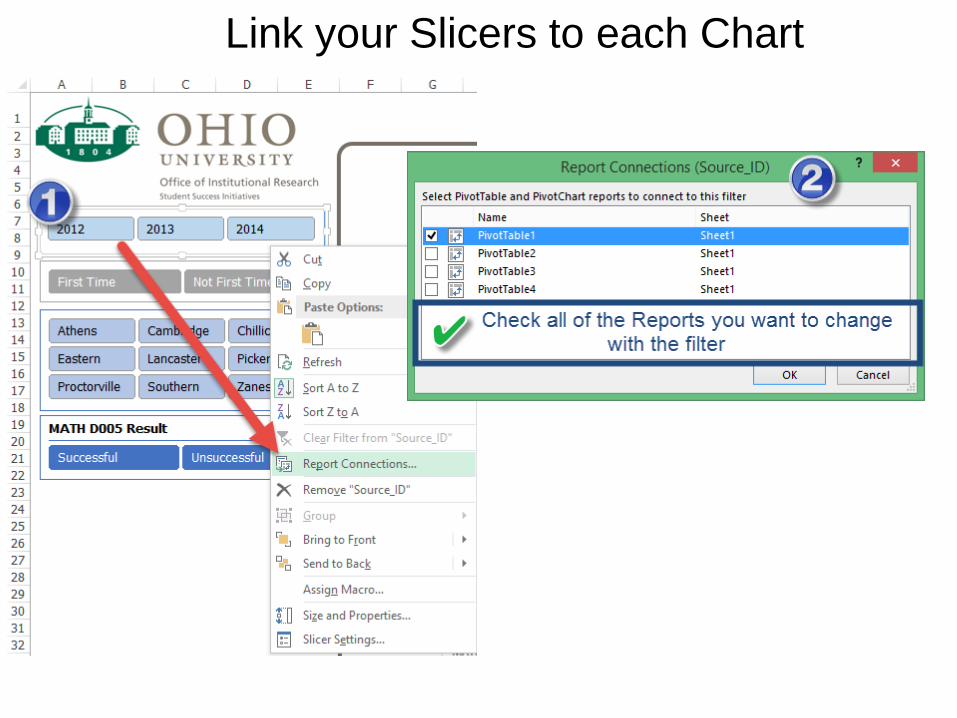
Link your Slicers to each Chart
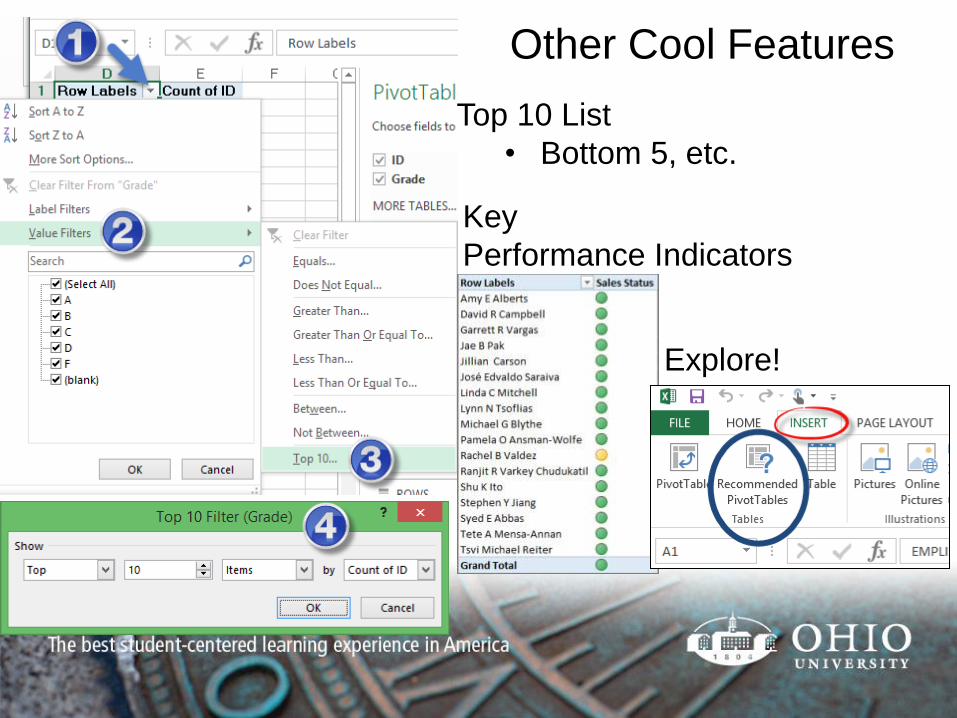
Other Cool Features
Key
Performance Indicators
Top 10 List
• Bottom 5, etc.
Explore!
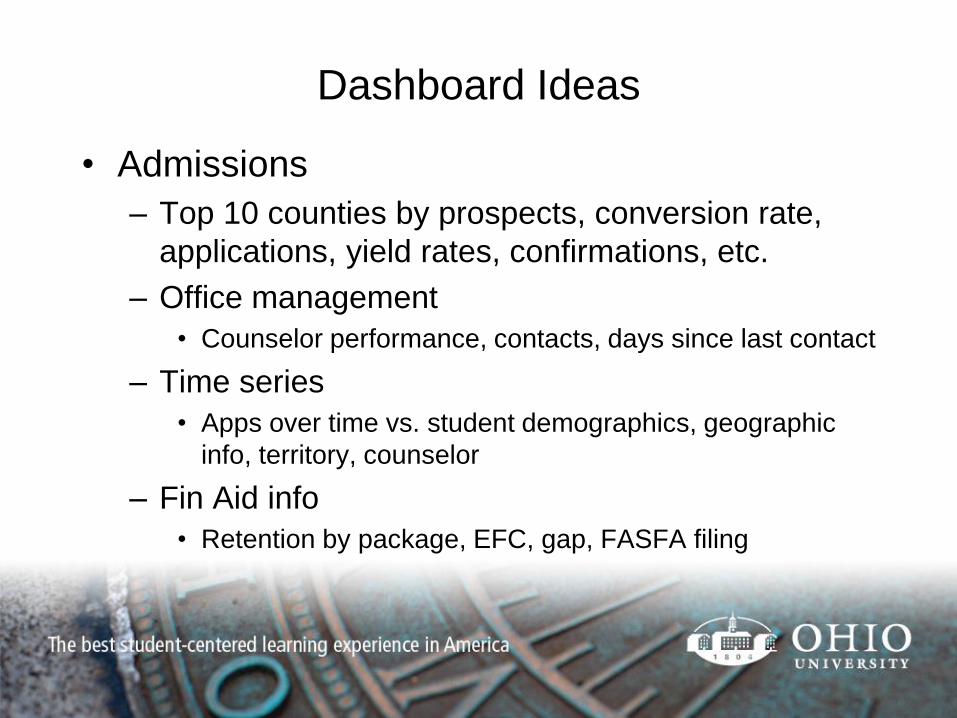
Dashboard Ideas
• Admissions
– Top 10 counties by prospects, conversion rate,
applications, yield rates, confirmations, etc.
– Office management
• Counselor performance, contacts, days since last contact
– Time series
• Apps over time vs. student demographics, geographic
info, territory, counselor
– Fin Aid info
• Retention by package, EFC, gap, FASFA filing
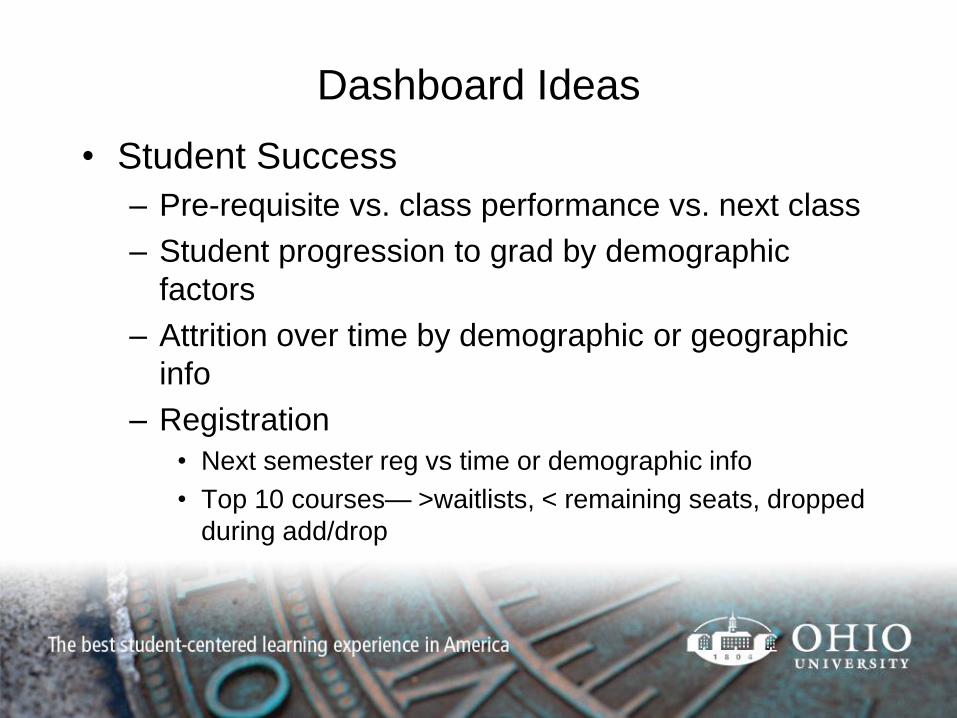
Dashboard Ideas
• Student Success
– Pre-requisite vs. class performance vs. next class
– Student progression to grad by demographic
factors
– Attrition over time by demographic or geographic
info
– Registration
• Next semester reg vs time or demographic info
• Top 10 courses— >waitlists, < remaining seats, dropped
during add/drop

Future Presentations
• SEM 25, Nov 4, 8am
– Analytics in Student Success: From Admissions to
Commencement
• AACRAO National
– Half-day workshop—Creating Interactive
Dashboards in Excel
– Analytics in Student Success: From Admissions to
Commencement
• March 23, 9:15am

Questions?
Loralyn Taylor, Ph.D.
Director of Analytics for University Student
Success Initiatives
@LoralynTaylor
www.linkedin.com/in/loralyntaylor/
Jennifer Chadwick
Associate Vice President of Enrollment
Management
https://www.linkedin.com/pub/
jennifer-chadwick/36/803/ba9
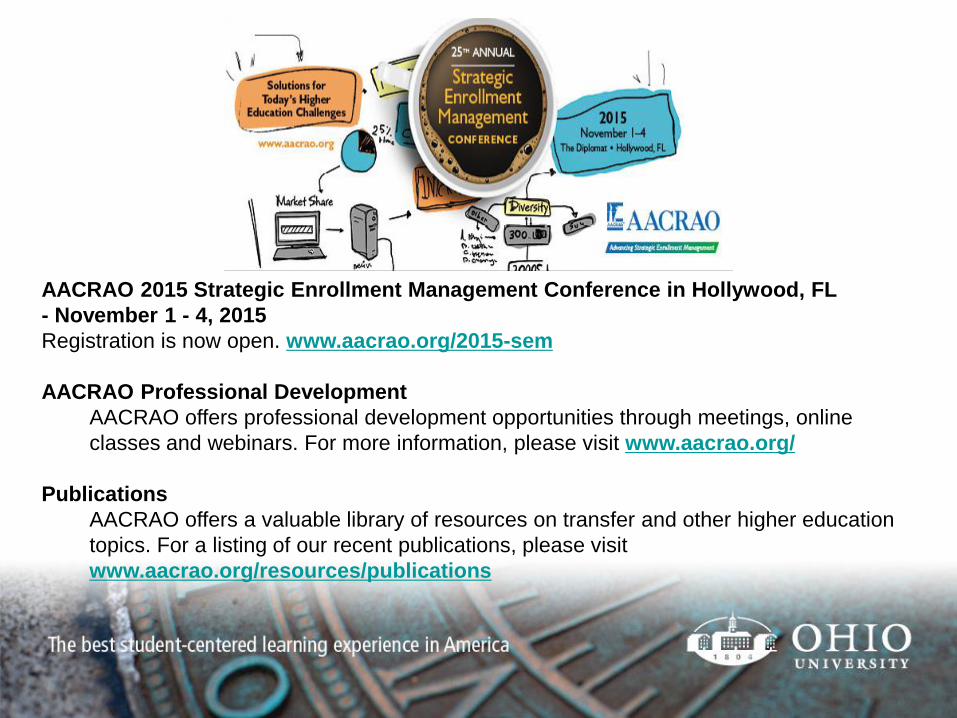
AACRAO 2015 Strategic Enrollment Management Conference in Hollywood, FL
- November 1 - 4, 2015
Registration is now open. www.aacrao.org/2015-sem
AACRAO Professional Development
AACRAO offers professional development opportunities through meetings, online
classes and webinars. For more information, please visit www.aacrao.org/
Publications
AACRAO offers a valuable library of resources on transfer and other higher education
topics. For a listing of our recent publications, please visit
www.aacrao.org/resources/publications