Embed Size (px)
Citation preview
1
Development and validation of
multimedia package in biology
2
Development and validation of multimedia package in biology
G.R. ANGADI
NOORJEHAN N. GANIHAR
© Bridge Center, 2015
BRIDGE CENTER
Buzau, Al. Marghiloman 245 bis, 120082
Tel. 0728394546
E-mail: [email protected]
Romania, European Union
Printed in Romania
First published, 2015
ISBN 978-606-93935-0-5
http://dx.doi.org/10.6084/m9.figshare.1417929
All rights reserved. No part of this publication may be
reproduced or transmitted, in any form or by any means,
without permission. Any person who does any unauthorised
act in relation to this publication may be liable to criminal
prosecution and civil claims for damages.
The publishers have applied for copyright permission for
those pieces that need copyright clearance and due
acknowledgement will be made at the first opportunity.
The views and contents of this book are solely of the author.
The author of the book has taken all reasonable care to ensure
that the contents of the book do not violate any existing
copyright or other intellectual property rights of any person
in any manner whatsoever. In the event the author has been
unable to track any source and if any copyright has been
inadvertently infringed, please notify the publisher in writing
for corrective action.
3
G. R. Angadi Noorjehan N. Ganihar
Development and validation of multimedia package in biology
Bridge Center 2015

4
5
CCOONNTTEENNTTSS
Chapter 1 - Introduction 16
1.1 Introduction
1.2 Computers in Education
1.3 Multimedia in Education
1.4 The Elements of Multimedia in Education
1.5 Multimedia Hardware Components
1.6 Educational Requirements
1.7 Multimedia in Schools
1.8 Multimedia in the Classroom
1.9 Multimedia in Biology Teaching
1.10 Need and Significance of the Study
1.11 Statement of the Study
1.12 Operational Definitions of the Key Terms Used
1.13 Objectives of the Study
1.14 Scope and Limitations of the Study
1.15 Organization of the Report
Chapter 2 - Review of related literature 40
2.1 Introduction
2.2 Studies Related to Various Media Based Instructional Strategies
2.3 Studies Related to Computer Assisted Instruction
2.4 Studies Related to Multimedia Based Instruction
2.5 Studies Related to Multimedia in Biology Instruction
2.6 Conclusion
Chapter 3 - Multimedia 64
3.0 Multimedia
3.1 Introduction to Multimedia
3.1.1 What is Multimedia?
3.1.2 Some more Quotations
6
3.1.3 Multimedia gives us
3.1.4 Multimedia terms/definitions
3.1.5 Medium
3.1.5.1 Types of medium
3.1.5.2 Classification of medium
3.1.6 Main properties of multimedia system
3.1.7 Classes of Multimedia system
3.1.8 Where to use multimedia
3.1.8.1 Multimedia in Business
3.1.8.2 Multimedia in Schools
3.1.8.3 Multimedia at Home
3.1.8.4 Multimedia in Public places
3.1.8.5 Virtual Reality
3.1.8.6 Video/Movie on demand
3.1.8.7 Information on Demand
3.1.8.8 Telemedicine
3.1.8.9 Videophone and Video conference
3.1.8.10 Co-operative work
3.1.9 What we need?
3.1.9.1 Hardware
3.1.9.2 Software
3.1.9.3 Creativity
3.1.9.4 Organization
3.1.10 Why Digital representation
3.1.11 Structure of a multimedia system.
3.2 Multimedia Hardware and Software
3.2.1 Introduction
3.2.2 Multimedia Hardware Components
3.2.2.1. Memory and Storage Devices
3.2.2.2. RAM (Random Access Memory)
3.2.2.3. Floppy Disks and Hard Disks
3.2.2.4. Input Devices
3.2.2.5. Output Devices
3.2.3 Modem as a Communication Device
7
3.2.4 Multimedia Hardware Requirements
3.2.4.1 Central Processing Unit
3.2.4.2 Monitor
3.2.4.3 Video Grabbing Card
3.2.4.4 Sound Card
3.2.4.5 CD-ROM Device
3.2.4.6 Scanner
3.2.4.7 Touch screen
3.2.5 Multimedia Software Tools
3.2.5.1 Painting and Drawing Tools
3.2.5.2 3-D Modeling and Animation Tools
3.2.5.3 Image Editing Tools
3.2.5.4 OCR Software
3.2.5.5 Sound Editing Programs
3.2.5.6 Animation, Video and Digital Movies
3.2.5.7 Video Formats
3.3 Multimedia Data Types
3.3.1 Introduction
3.3.2 Text
3.3.2.1 Using text in multimedia
3.3.2.2 Text in computers
3.3.2.3 Text editing and design tools
3.3.2.4 Hypermedia and Hypertext
3.3.3 Sound/Audio
3.3.3.1 Basic sound concepts
3.3.3.2 Computer representation of sound
3.3.3.3 Sound hardware
3.3.3.4 Audio file formats
3.3.4 Images
3.3.4.1 Basic concepts
3.3.4.2 Digital Image representation
3.3.4.3 Image file formats
3.3.4.3.1 Captured image format
3.3.4.3.2 Stored image format
8
3.3.4.3.3 Graphical image format
3.3.4.4 Computer Image Processing
3.3.4.4.1 Image Synthesis
3.3.4.4.2 Image Analysis
3.3.4.5 Image transmission
3.3.4.5.1 Raw image data transmission
3.3.4.5.2 Compressed image transmission
3.3.4.5.3 Symbolic image data transmission
3.3.5 Animation
3.3.5.1 Basic concepts
3.3.5.2 Animation languages
3.3.6 Video
3.3.6.1 Basic concepts
3.3.6.2 An analog video system
3.3.6.3 A digital video system
3.4 Multimedia Compression Techniques and Standards
3.4.1 Introduction
3.4.2 Data Compression
3.4.2.1 Storage space and Compression Requirements
3.4.2.2 Source, entropy and Hybrid Coding
3.4.2.3 Major steps in Data compression
3.4.2.4.1 Some Basic Compression techniques
3.4.2.4.2 Huffman coding
3.4.2.4.2 Waveform coding
3.4.2.5 JPEG
3.4.2.5.1 JPEG operation
3.4.2.6 MPEG
3.4.2.6.1 Video encoding
3.5 Networks for Multimedia Systems
3.5.1 Introduction
3.5.2 Design goals of multimedia systems
3.5.3 Network characteristics suitable for multimedia communications.
3.5.3.1 Network speed or bandwidth
3.5.3.2 Efficient Sharing of Network Resources
9
3.5.3.3 Network should provide performance guarantees
3.5.3.4 Network Scalability
3.5.3.5 Multicasting capability
3.5.3.6 Networks suitable for multimedia communications
3.6 Multimedia Communication Systems
3.6.1 Introduction
3.6.2 Application Subsystem
3.6.2.1 Collaborative computing
3.6.2.2 Collaborative Dimensions
3.6.2.3 Group Communication Architecture
3.6.2.4 Group Rendezvous
3.6.2.5 Sharing applications
3.6.2.6 Conferencing
3.6.3 Session Management
3.6.3.1 Architecture
3.6.3.2 Control
3.6.4 Transport Subsystem
3.6.4.1 Requirements
3.6.4.2 User and Application Requirements
3.6.4.3 Processing and Protocol constraints
3.6.5 Transport Layer
3.6.5.1 Internet Transport Protocols
3.6.5.2 Real-time Transport Protocol
3.6.5.3 Xpress Transport Protocol
3.7 Multimedia Operating Systems
3.7.1 Introduction
3.7.2 Resource Management
3.7.2.1 Resources
3.7.2.2 Requirements
3.7.2.3 Components and phases
3.7.2.4 Phases of Resource Reservation and Management process
3.7.2.5 Allocation phase
3.7.3 Process Management
3.8 Multimedia File Systems
10
3.8.1 Introduction
3.8.2 File Systems
3.8.3 Traditional File Systems
3.8.3.1 File structure
3.8.3.2 Directory structure
3.8.3.3 Disk scheduling algorithms
3.8.4 Multimedia File Systems
3.8.4.1 Storage Devices
3.8.4.2 File Structure and Placement on Disk
Chapter 4 - Methodology of the study 165
4.1 Introduction
4.2 Design of the Study
4.3 Rationale for Experimental Design
4.4 Population
4.5 Sample
4.6 Variables Involved in the Study
4.7 Development of Multimedia Package
4.7.1 Designing of Instructional Media
4.7.2 Design of Multimedia
4.7.3 Medium
4.7.4 Types of Medium
4.7.5 Classification of Medium on Different Criteria
4.7.6 Steps in Multimedia Software Development
4.7.7 Problem Specification
4.7.8 Design
4.7.9 Properties of Multimedia System
4.8 Hypotheses
4.9 Materials and Tools Used for Experiment and Data Collection
4.9.1 Raven’s Standard Progressive Matrices
4.9.2 Achievement Test
4.9.3 Opinionnaire
4.9.4 Observation Schedule
4.10 Procedure of Experiment
11
4.11 Procedure of Data Collection
4.12 Statistical Techniques Used for Data Analyses
Chapter 5 - Analyses and interpretation of data 190
5.1 Introduction
5.2 Scores on Raven’s Standard Progressive Matrices
5.3 Analyses of Scores on Achievement Test
5.4 Testing of Hypotheses
5.5 Analysis of Multimedia Package as Observed by the Teachers
5.6 Opinion of Experimental Group Students about Multimedia Package
Chapter 6 - Summary and conclusions 216
6.1 Introduction
6.2 Statement of the Study
6.3 Objectives of the Study
6.4 Hypotheses
6.5 Design of the Study
6.5.1 Sample of the Study
6.5.2 Development of Multimedia Package
6.5.3 Materials and Tools Used for Experiment and Data Collection
6.5.4 Variables Involved in the Study
6.5.5 Experiment Conducted
6.5.6 Data Collection
6.5.7 Analyses of Data
6.6 Findings of the Study
6.7 Analysis of Multimedia Package Observed by the Teachers
6.8 Experimental Group Students Opinion about Multimedia Package
6.9 Discussion and Conclusion
6.10 Educational Implications of the Study
6.11 Possibilities of Multimedia Method of Instruction in Indian Schools
6.12 Suggestions for Further Research
Bibliography

12
13
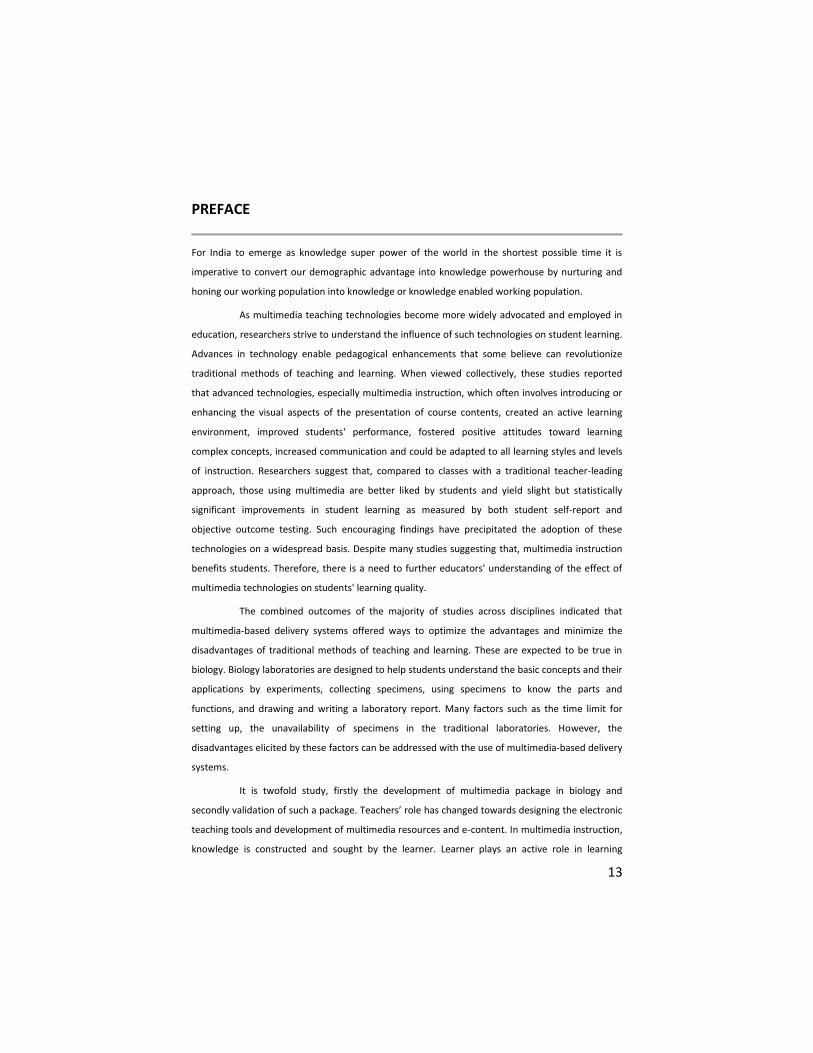
PREFACE
For India to emerge as knowledge super power of the world in the shortest possible time it is
imperative to convert our demographic advantage into knowledge powerhouse by nurturing and
honing our working population into knowledge or knowledge enabled working population.
As multimedia teaching technologies become more widely advocated and employed in
education, researchers strive to understand the influence of such technologies on student learning.
Advances in technology enable pedagogical enhancements that some believe can revolutionize
traditional methods of teaching and learning. When viewed collectively, these studies reported
that advanced technologies, especially multimedia instruction, which often involves introducing or
enhancing the visual aspects of the presentation of course contents, created an active learning
environment, improved students' performance, fostered positive attitudes toward learning
complex concepts, increased communication and could be adapted to all learning styles and levels
of instruction. Researchers suggest that, compared to classes with a traditional teacher-leading
approach, those using multimedia are better liked by students and yield slight but statistically
significant improvements in student learning as measured by both student self-report and
objective outcome testing. Such encouraging findings have precipitated the adoption of these
technologies on a widespread basis. Despite many studies suggesting that, multimedia instruction
benefits students. Therefore, there is a need to further educators' understanding of the effect of
multimedia technologies on students' learning quality.
The combined outcomes of the majority of studies across disciplines indicated that
multimedia-based delivery systems offered ways to optimize the advantages and minimize the
disadvantages of traditional methods of teaching and learning. These are expected to be true in
biology. Biology laboratories are designed to help students understand the basic concepts and their
applications by experiments, collecting specimens, using specimens to know the parts and
functions, and drawing and writing a laboratory report. Many factors such as the time limit for
setting up, the unavailability of specimens in the traditional laboratories. However, the
disadvantages elicited by these factors can be addressed with the use of multimedia-based delivery
systems.
It is twofold study, firstly the development of multimedia package in biology and
secondly validation of such a package. Teachers’ role has changed towards designing the electronic
teaching tools and development of multimedia resources and e-content. In multimedia instruction,
knowledge is constructed and sought by the learner. Learner plays an active role in learning
14
process. Learning is individualized, self-faced and hands on. It is also designed to move beyond
theory and to prove through research that certain multimedia interventions reduce cognitive load
and make learning more effective and efficient when presenting the information through
multimedia. The developed package was evaluated for effectiveness through an experimental
study that compared the learning outcomes of the students who used and did not use the
multimedia package. The results showed that the program is as effective as traditional learning.
The researcher also investigated the learners’ perceptions of the experiences with the multimedia
package. The advantages and challenges were both discussed. More importantly, the study
provided valuable recommendations for educators if they see the potential of adopting this
program in their instruction.
At this most accomplished movement of publication of the thesis, the researcher kindly
wishes to put on record his humble gratitude to persons who have helped and cooperated
wholeheartedly in the completion of this study.
The work presented in this study was accomplished under the inspiring and scholarly
suggestions, constructive comments and unstinted supervision of Prof. (Smt) Noorjehan N.
Ganihar. Professor, Post Graduate Department of Studies in Education, Karnatak, University
Dharwad. The researcher feels at loss of words to express the feelings of gratitude to his respected
supervisor for her keen guidance throughout this study. No words can adequately express the
depth of his gratitude of this graciously offered help at all times.
The researcher wishes to acknowledge his heartfelt gratitude to Honorable and dignified
Dr. P. S. Balasubramanian, Retd. Professor and Head, Department of Studies in Education,
University of Madras Chennai, for his unstinted guidance in the framework of this study.
The researcher is also thankful to all the respected beloved teachers in the Department
of Education, Karnatak University, Dharwad and his Colleagues in BLDEA’s JSS College of Education,
and PG and Research Centre in Education, Vijayapur (Karnataka). The researcher wishes to put on
record the help provided by the experts who validated the instrument of the study.
The researcher feels extremely obliged to express his thanks to Head Mistress, teachers
and students of IX standard in BDE Society’s PDJ ‘A’ High School Vijayapur City, who were the
sources of data for this research and experimentation of the study. Researcher affectionately
wishes to acknowledge the timely help advice and cooperation received from them from time to
time.
15
Researcher further wishes to express his heartfelt gratitude to his beloved parents and
wife Mrs. Sharada G. Angadi, for their continuous cooperation and encouragement to complete
this research study.
At the last the researcher wishes to thank all his friends who have inspired and helped
him, directly and indirectly at various stages of this research study, and Dr. Ecaterina Patrascu,
Editor-in-Chief, and her team members of Bridge Center, Romania for publication online and offline
and in bringing this investigation at global level.
Dr. G.R. Angadi
16
Introduction
1.1 Introduction
In the beginning of the last century, children were taught in a rigidly formal and stereotyped way.
Education was then conceived as a process of transmission of factual knowledge only. The teacher
adopted an authoritarian attitude. The facts learned by children were tested from time to time but
such tests were neither concerned with conceptual understanding nor effective performance. The
emphasis was on testing memory. They very often used the lecture method, which was not much
effective for meaningful learning. The teacher did not use other visual material to supplement the
oral teaching.
The teacher of today does not consider the student as a vessel waiting to be filled up
with facts nor as a pliable plastic material, which can be transformed into any shape enabling to
project his ideas on it. The modern teacher considers each student as akin to plant and helps the
student to grow according to their abilities and aptitudes. Teacher can help the student to learn.
Teacher realizes that ‘to teach is to nourish or cultivate the growing student or to give intellectual
exercise or to train in the horizontal sense of directing or guiding the growth’. The modern teacher
sees education as a process of interaction between the student and his environment. Student
learns by doing and learns how to learn in groups and individually, as well.
Increase in population and explosion of knowledge are affecting the pattern of human
life and inflicting its full impact on education. The explosion of population and knowledge has
raised the serious question of both quantity and quality of education. Educationists are of the
opinion that the educational problems relating to the quantity and quality could be tackled by
applying systematic approach of instructional technology. Therefore, there has been a rapid
development of communication technology in education at all levels with a purpose of extending
educational facilities and upgrading instructions. Instructional technology aids to improve the
process of human learning. Instructional technology is a field made up of elements of other fields.
There is very little content, which is unique. It has taken elements of cognitive psychology,
perception psychology, measurement, evaluation, communication, management, media and
systems engineering. These elements are arranged synergistically to a point where the whole is
1
17
greater than sum of its parts. The field has rapidly evolved from audio-visual education through
educational communications to instructional technology. There is overlapping of ideas mainly
between three terminologies namely, educational technology, instructional technology and
communication technology.
Though the term instructional technology is often used interchangeably with
educational technology, it presents certain refinements that are not found in the meaning of
educational technology. Venkataiah (1996), describes instructional technology as ‘The media born
of the communications revolution which can be used for instructional purposes alongside the
teacher, text book and blackboard’, and ‘A systematic way of designing, carrying out and evaluating
the total process of learning and teaching in terms of specific objectives based on research in
human learning and communication, and employing a combination of human and non-human
resources to bring out more effective instruction’. Venkataiah (1996) further stated ‘technology of
instruction can make an ordinary person capable of superior performance and a means, either
printed or electronic, to distribute that instruction’.
Instructional technology as considered by Leedham (1967) concerns the systematic use
of modern methods and technologies in teaching and learning. It involves teachers in a variety of
roles, some of which are traditional, some still emerging. In this definition, special consideration is
given to the adaptive role of the teacher. One purpose of studying instructional technology is surely
to help to make the best use of capabilities of individual teachers. Instructional technology is
fundamentally aimed at improving the efficiency of the educational system by increasing the rate,
depth, precision, and value of the learning, which takes place.
As the major field of education, Bioscience was taught in an authoritarian manner as a
‘dogma’ of facts, principles and laws to be memorized and handed back during the examinations.
Characteristics of Bioscience that is excitement of discovery and critical thinking were missing in
bioscience teaching. There was considerable reliance on chalk-talk method for teaching bioscience
and very little emphasis on laboratory activities and that was without the use of low cost
inexpensive instructional materials.
Therefore, Bruner (1969) gave a word of caution when he said, ‘I do not restrict
discovery to an act of finding out something that before was unknown to mankind, but rather
include all forms of obtaining knowledge for oneself by the use of one’s own mind’. One cannot,
therefore, expect the pupils at secondary level to make original contributions to the accumulated
scientific knowledge of the world. What will be found, no doubt, is already known and probably
found in some textbook. In short, discovery does not mean to discover something new and
completely unknown.
18
When the students are helped or guided to discover a generalization imposed, student
may develop the rational powers, gaining understanding of content and the process of learning.
Authoritarian teaching consists of imposing upon the students the generalizations which are truly
their own. Students who learn science by discovery approach will discover for themselves the true
structure of the discipline in complete harmony with modern philosophy of science education.
The new trends towards biotechnology again are increasing and the students at the
secondary level are at the threshold of selecting Biology based careers by and large.
The objectives of bioscience are to introduce students to a body of knowledge
investigating living things and studying work of scientists, to develop in students the habit and
ability of independent study. The teaching learning resource material on secondary school Biology
consists of textbook, students’ manual and teachers guide for secondary school students. There is
no denying the fact that knowledge is a universal commodity but the matter of its presentation is
an individualized effort.
Teaching method, which is traditionally used, for teaching Biology in secondary schools
is a combination of lecture method, textbook recitation method and to some extent, chalkboard, is
used. The lecture method is a teaching procedure with one way channel of communication. The
instructor makes an oral presentation of information to which students’ role is passive. The student
is never put into the situation from where one can move to logical reasoning and critical thinking
that reduces the learning process.
Instructional technology can enhance learning process. Instructional technology is made
up of the things of learning, the devices and the materials, which are used in the process of
learning and teaching. Instructional technology emphasizes the interaction between student and
relative environment, which is the basic requirement of Biology syllabus. The teaching of Biology is
very important because the knowledge of Biology helps in improving the quality of life, Biology
covers all aspects of life, so it goes without saying that Biology should be taught in order to succeed
in life. Knowledge of Biology helps in solving many social problems relating to health, poverty, food
shortage and crop production and environmental conservation.
1.2 Computers in Education
Indian experiments in taking computers to schools involved the participation of a large number of
institutions for tasks such as the supply of hardware and software, the development of Computer
Assisted Learning (CAL) packages, and the training of teachers. A project called Computer Literacy
and Studies in School (CLASS) launched in 1984 was a joint initiative of MHRD, Department of
Electronics, and NCERT. It covered 42 Resource Centers and 2,582 schools. It made use of
19
microcomputers provided by the BBC. The evaluation of the project by SAC revealed the need for
greater interaction between resource centers and project schools, the need to reduce the time gap
between the training of teachers, the installation of systems, and the initiation of activities in
schools, the imparting of adequate hands-on experience to teachers and students, and the
provision of computer literacy programs in the timetable. The project had only a limited success,
and has been described at best as a “spectator sport”.
A revised CLASS project during 1993–2004 saw the introduction of PC machines in
keeping with broad global trends. Subsequently, the government initiated the CLASS 2000 program
with the aim of providing computer literacy in 10,000 schools, computer-assisted learning in 1,000
schools, and computer-based learning in 100 schools. These 100 schools were called smart schools,
and were designed to be agents of change seeking to promote the extensive use of computers in
the teaching-learning process. This, too, has not yielded the expected results. In the words of Mallik
(1993), “Ambiguity of purpose, tentative policies and faltering practices marked the major
computing initiatives in India during the last two decades . . . Schools are using IT as an add-on, not
as an integral part of a new pedagogy.”
Though all these interventions did make some impact, where the schools and teachers
went the extra mile to avail of the facilities provided using their own ingenuity, many of these
schemes have been half-hearted attempts even at the conceptual level. Computer literacy is not so
much about knowing the technical jargon, but rather learning to use computers in a meaningful
way, which is, meaningful to children.
Two programs illustrate this fact quite well. The first project-which the media has
dubbed the Hole in the Wall, uses the method of Minimal Invasive Education (MIE).
The second program was carried out by the TelNet, Mukhopadhyay et al (1993)
Utilization of media facilities in schools: An evaluative study of the ET scheme of the Ministry of
HRD. Mukhopadhyaya describes his study not as a study of an educational technology scheme, but
rather as a study of the utilization of media facilities. A study of CLASS, as part of a larger
international study entitled “Schools, Teachers, Students, and Computers: A Cross-national
Perspective, IEA 1993, University of Twente.
1.3 Multimedia in Education
The world in which we live is changing rapidly and the field of education is experiencing
these changes in particular as it applies to Media Services. The old days of an educational
institution having an isolated audio-visual department are long gone! The growth in use of
20
multimedia within the education sector has accelerated in recent years, and looks set for continued
expansion in the future.
Teachers primarily require access to learning resources, which can support concept
development by learners in a variety of ways to meet individual learning needs. The development
of multimedia technologies for learning offers new ways in which learning can take place in schools
and homes. Enabling teachers to have access to multimedia learning resources, which support
constructive concept development, allows the teacher to focus more on being a facilitator of
learning while working with individual students. Extending the use of multimedia learning
resources to the home represents an educational opportunity with the potential to improve
student learning.
The elements used in multimedia have all existed before. Multimedia simply combines
these elements into a powerful new tool, especially in the hands of teachers and students.
Interactive multimedia weaves five basic types of media into the learning environment: text, video,
sound, graphics and animation. Since the mode of learning is interactive and not linear, a student
or teacher can choose what to investigate next. For example, one does not start on the first page of
a linear document and read to the end. Interactive multimedia learning mode is more like
constructing a spider’s web, with one idea linked to another, allowing choices in the learner’s path.
The multimedia technologies that have had the greatest impact in education are those
that augment the existing curriculum, allowing both immediate enhancement and encouraging
further curriculum development. For example, the www serves as a storehouse of information that
individual learners can search for subject matter content that specifically fits their learning
agendas. Multimedia applications for computers have been developed for single computing
platforms such as the personal computer.
1.4 The Elements of Multimedia in Education
It is very tempting to use the latest computer wizardry to represent information and
develop computer enhanced learning materials. However, the instructional design of these systems
should be based on a careful examination and analysis of the many factors, both human and
technical, relating to visual learning. When is sound more meaningful than a picture? How much
text is too much? Does the graphic overwhelm the screen? For a student, this allows them to test
all of their skills gained in every subject area. Students must be able to select appropriate
multimedia tools and apply them to the learning task within the learning environment in order for
effective learning to take place.
21
A Multimedia learning environment involves a number of components or elements in
order to enable learning to take place. Hardware and software are only part of the requirement as
mentioned earlier, multimedia learning integrates five types of media to provide flexibility in
expressing the creativity of a student and in exchanging ideas.
Text
Out of all of the elements, text has the maximum impact on the quality of the multimedia
interaction. Generally, text provides the important information. Text acts as the keystone tying all
other media elements together. It is well written text that makes a multimedia communication
wonderful.
Sound
Sound is used to provide emphasis or highlight a transition from one page to another. Sound
synchronized to screen display, enables teachers to present lots of information at once. This
approach is used in a variety of ways, all based on visual display of a complex image paired with a
spoken explanation (for example, art-pictures are ‘glossed’ by the voiceover; or math a proof fills
the screen while the spoken explanation plays in the background). Sound used creatively, becomes
a stimulus to the imagination; used inappropriately it becomes a hindrance or an annoyance. For
instance, a script, some still images and a sound track, allow students to utilize their own power of
imagination without being biased and influenced by the inappropriate use of video footage. A great
advantage is that the sound file can be stopped and started very easily.
Video
The representation of information by using the visualization capabilities of video can be immediate
and powerful. While this is not in doubt, it is the ability to choose how to view, and interact, with
the content of digital video that provides new and exciting possibilities for the use of digital video
in education. There are many instances where students, studying particular processes, may find
themselves faced with a scenario that seems highly complex when conveyed in purely text form, or
by the use of diagrams and images. In such situations the representational qualities of video help in
placing a theoretical concept into context.
Video can stimulate interest if it is relevant to the rest of the information on the page,
and is not ‘overdone’. Video can be used to give examples of phenomena or issues referred to in
the text. For example, while students are reading notes about a particular issue, a video showing a
short clip of the author/teacher emphasizing the key points can be inserted at a key moment;
alternatively, the video clips can be used to tell readers what to do next. On the other hand, it is
unlikely that video can completely replace the face-to-face lecture: rather, video needs to be used
to supplement textual information.
22
One of the most compelling justifications for video may be its dramatic ability to elicit an
emotional response from an individual. Such a reaction can provide a strong motivational incentive
to choose and persist in a task.
The use of video is appropriate to convey information about environments that can be
either dangerous or too costly to consider, or recreate, in real life. For example, video images used
to demonstrate particular chemical reactions without exposing students to highly volatile
chemicals, or medical education, where real-life situations can be better understood via video.
Animation
Animation is used to show changes in state over time, or to present information slowly to students
so they have time to assimilate it in smaller chunks. Animations, when combined with user input,
enable students to view different versions of change over time depending on different variables.
Animations are primarily used to demonstrate an idea or illustrate a concept. Video is
usually taken from life, whereas animations are based on drawings. There are two types of
animation: Cell based and Object based. Cell based animation consists of multiple drawings, each
one a little different from the others. When shown in rapid sequence, for example, the operation of
an engine’s crankshaft, the drawings appear to move. Object based animation (also called slide or
path animation) simply moves an object across a screen. The object itself does not change.
Students can use object animation to illustrate a point- imagine a battle map of Gettysburg where
troop movement is represented by sliding arrows.
Graphics
Graphics provide the most creative possibilities for a learning session. They can be photographs,
drawings, graphs from a spreadsheet, pictures from CD-ROM, or something pulled from the
Internet. With a scanner, hand-drawn work can be included. Standing commented that, “the
capacity of recognition memory for pictures is almost limitless”. The reason for this is that images
make use of a massive range of cortical skills: color, form, line, dimension, texture, visual rhythm,
and especially imagination.
Multimedia is woven combination of text, graphic art, sound, animation and video
elements. When an end user is allowed the viewer, of a multimedia project to control, what
elements are delivered and when, it is interactive multimedia.
When a structure is provided of linked elements through which the user can navigate,
interactive multimedia it becomes hypermedia.
23
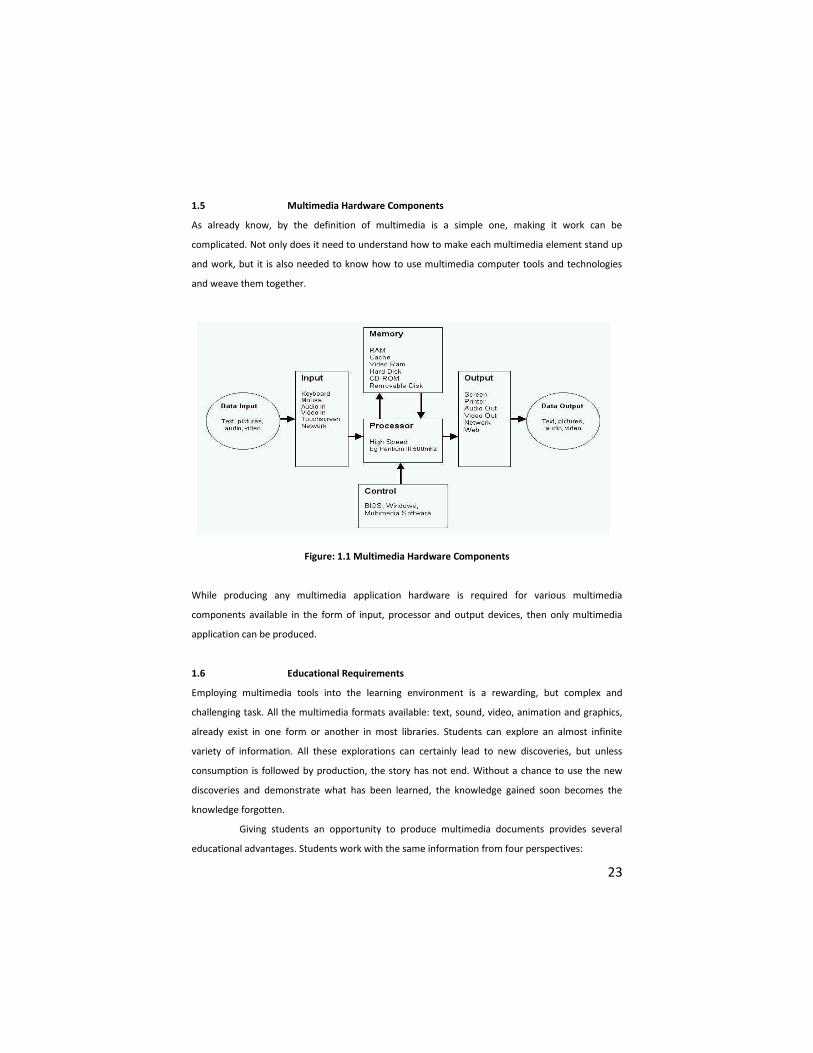
1.5 Multimedia Hardware Components
As already know, by the definition of multimedia is a simple one, making it work can be
complicated. Not only does it need to understand how to make each multimedia element stand up
and work, but it is also needed to know how to use multimedia computer tools and technologies
and weave them together.
Figure: 1.1 Multimedia Hardware Components
While producing any multimedia application hardware is required for various multimedia
components available in the form of input, processor and output devices, then only multimedia
application can be produced.
1.6 Educational Requirements
Employing multimedia tools into the learning environment is a rewarding, but complex and
challenging task. All the multimedia formats available: text, sound, video, animation and graphics,
already exist in one form or another in most libraries. Students can explore an almost infinite
variety of information. All these explorations can certainly lead to new discoveries, but unless
consumption is followed by production, the story has not end. Without a chance to use the new
discoveries and demonstrate what has been learned, the knowledge gained soon becomes the
knowledge forgotten.
Giving students an opportunity to produce multimedia documents provides several
educational advantages. Students work with the same information from four perspectives:
24
1) as researcher, student must locate and select the information needed to understand the chosen
topic;
2) as authors, student must consider their intended audience and decide what amount of
information is needed to give their readers an understanding of the topic;
3) as designers, students must select the appropriate media to share the concepts selected; and
4) as writers, students must find a way to fit the information to the container including the manner
of linking the information for others to retrieve.
When defining the appropriate medium to use it is vital to ‘know’ the audience and the
technical specification of users’ machines. There may be technical reasons for choosing which
multimedia element will best communicate certain concepts. Whatever medium is chosen, to apply
a principle mentioned earlier to all digital media elements, visuals must be congruent, relevant, and
consistent with other information presented in order to be effective. Whatever the latest
technological advance, instructional design principles apply. For example, care needs to be taken
when using visuals for aesthetic reasons. The misuse of a single visual element can cause
misrepresentation of information and become a barrier to content and impede learning, even if the
program overall may, in all other aspects, follow the principles of instructional design. It is
important to bear in mind the nature of the audience, especially their age group and culture mix.
Human-Computer Interface
Multimedia applications like any other application, appliance or tool, benefit from being
easy to use, with minimal training or self-learning. The need for a well-designed human – computer
interface, which may be screen or audio based is well accepted. The standards for computer-based
publications are set by the publishers of books, music, Walt Disney cartoons and television
producers. With the development of High Definition TV and beyond, it is likely that there will be a
continual increase in the demands placed on computer based multimedia systems.
Access, Delivery, Scheduling and Recording
On-demand access times to computer information need to be below one second to be
usable in real time. Alternatively, the delivery of information later is acceptable if it can be
scheduled, as in a TV broadcast schedule. Scheduling can have advantages for users over on
demand delivery. In open learning situations, learners can control their program by requesting a
multimedia unit at a convenient time. Computer users will wish to record a film, session, or
learning experience for future reference.
Interactivity
Computer based multimedia needs the same degree of interactivity that a school
exercise book or a laboratory experiment has in order to remain credible as a learning medium.
25
Educationists have shown that certain forms of learning becomes easier, and is retained more
permanently if the learner participates in some way with the learning material. The generation of
computer, based virtual reality is an extension of this process. The incorporation of interactivity is
really the job of the application designer. The incorporation of interactivity is assisted if the
network is capable of two-way communication, and for some applications, the sense of
interactivity is aided by the ability to deliver a moving picture, or a sound very quickly, so that a
sense of two-way human participation can be generated. Real time video conferencing is an
example.
1.7 Multimedia in Schools
Multimedia finds place in lot of applications. Multimedia is appropriate whenever a human
interface connects a person to electronic information of any kind. Multimedia enhances
traditional text only computer interfaces and yields measurable benefit be gaining and holding
attention and interest. Multimedia improves information retention, when properly woven.
Schools are perhaps the neediest destination for multimedia. Traditional teaching
methods are changed. Teachers are becoming more like guides and mentors along a learning
path, not the primary providers of information and understanding the students, not teachers ,
become the core of the teaching and learning process. Various advanced electronic teaching tools
are designed and developed due to multimedia.
1.8 Multimedia in the Classroom
Numerous technologies provide multimedia integration and education in the classroom (Mayer and
Moreno, 2003). This includes a tremendous influx of technologies such as personal computers,
PDAs, cell phones, integrated and interactive power point presentation slides, integrated audio,
iPod casting, instant messaging, along with integrated multimedia applications and features
inherent to these products. Almost 100% of the secondary and college level classes use some form
of multimedia instruction (Marrison and Frick, 1993; Johnson, and Stanne, 1985). However, Mayer
(2002) states that students seem to lack the ability to navigate multimedia lessons and directions
such as those provided in the MTE (Modular Technology Education) program. This is important
since a majority of the modular multimedia learning experience presentations are presented in a
self-instructional format, which was first coined by Russell (1974).
26
1.9 Multimedia in Biology Teaching
The use of multimedia in teaching the growing popularity of, in the process of using high school
Biology teaching-related issues have emerged, and to reflect on these aspects: processing good
teachers, computers, student relationship, properly handle the screen, blackboard, and student
relationship. All parts of content creation production of courseware and courseware interactive
use, there must be selective use of courseware authoring software. Multimedia-assisted instruction
is computer technology, network technology, multimedia, and the integration of modern
educational theory, who, it is illustrated, the picture dynamic, visual image, to enable students to
audio-visual synchronization, mind and used to optimize the teaching environment and
atmosphere, and greatly enhanced the student learning interest. Students can fully mobilize the
enthusiasm and initiative, to develop student’s awareness of innovation, to improve classroom
efficiency and reduce the burden on students. "To the teaching content, textbooks, the reform of
systems and methods based on educational technology platform." With the rapid development of
computer technology, the population gradually through the peaks and the continuous
development of socio-economic and long-term with multimedia devices are increasingly affected
by the pro-gaze of classes, and will increasingly reflect its advantages.
The multimedia teaching equipment, after-school classes of biological problems
encountered with the thoughts, mainly the use of multi-media aspects: first, deal with teachers,
computers, student relationship in terms of equipment multimedia classes, teaching advanced
equipment, teachers can direct care to each student. Changed the original "classroom-centered,
teacher-centered, to textbook-centered" teaching system, students from a passive position, give
full play to their principal role. Should be said that classes in multimedia equipment, regardless of
mode of instruction, teaching content, teaching methods, teaching methods, or in the mobilization
of students, sensory, and raise their interest in both cognitive and physical and mental
development of students consistent with the law, but in practice, or there are many problems to be
discussed. In conventional teaching, Biology teachers to teach directly to their knowledge to their
students. In the equipment, multimedia classes, teachers are teaching through their own
understanding of the presets to the computer and then pass on to students. In the teaching
process, first teaching content is preset and cannot be adjusted according to actual classroom
work; it is likely to cause the actual teaching and the students out of touch.
Second, since the content is a pre-built, not very flexible, and easy to put the students
detained in the computer program is not conducive to the cultivation of creativity of students.
Third, the lesson in the manner often used to complete the courseware, teachers, easy to own
most of the time spent on the operation of multimedia devices, the relative shortening the time for
27
emotional communication teachers and students. As time goes by, will alienate teacher-student
relationship is not conducive to the establishment of the students of biological study and emotion.
Thus equipped with multimedia teaching of Biology classes to deal with good teachers,
computers, the relationship between the students cannot evade reality.
How to deal with these three relationships? First, teachers must be clear of modern
teaching media is an extension of traditional teaching media, and development, it has many
advantages, but it is after all not a "panacea." In traditional teaching media, there are deficiencies;
there are many aspects that can never be outdated and invalid. One thing is certain, the most
advanced teachers teaching media cannot be replaced.
Second, the Biology teacher in lesson preparation must better understand the students’
practical, taking into account each student to occur, resulting in a comprehensive consideration to
the problem and set to the courseware to prevent the teaching out of touch.
Third, we must provide more heuristic problem, so that every student in the class had
answered, participation, and fully utilizing the opportunity of thinking. Teachers should allow
students to feel that teachers have their eyes everywhere. As long as Biology teachers pay more
attention in class and this is easily done in.
Fourth, in order to go to the students, teachers must be able to skillfully use and
operation of multimedia equipment. For example, the use of remote control mouse both teachers
go to students, but also manipulate the teaching platform to control the teaching content. Essential
and timely consolidation of practice Biology lessons, teachers, students to practice manipulating
the stage when you cannot just stand, cannot be completed immediately after the students
through the courseware, or other media player results. But in practice the process of view, to
guide, and to discover in the course of inspection of various issues and students the correct
answers through in-kind projector to display and compare students to discover and summarized.
This will not only eliminates the distance between teachers and students, but also played the main
role of the students.
Fifth, the use of courseware in the classroom teacher is best not to voice input, as fully
play courseware is easy to enable students to become the audience, ignoring the dominant
position of students, restrict student explorations of abstract thinking ability and innovation,
through the screen and teachers direct talks and to achieve better results. Modern teaching and
learning process in the classroom, should be familiar with the characteristics of modern
educational technology, must skillfully use these technical features, in order to achieve the
teaching objectives. Only by continuously summing up multimedia equipment, teaching classes,
28
dealing with good teachers, computers, and the relationship between the students can really play a
large area to improve the quality of Biology teaching effect.
This is an age of knowledge explosion where traditional methods of verbal instruction
could not help to keep pace with the development of knowledge. The word has crossed the
threshold of new information, multimedia era, which is the mantra of today. Multimedia is the
latest buzzword in the educational process.
Multimedia is extensively used in education, especially in schools, and at classrooms.
Multimedia education facilitates one to proceed at his or her pace. Television program combine
sound, video, graphics and text. While the multimedia has all these facilitate. It also has special
capacity to interact. A multimedia user is able to decide what information should be delivered by
the newscaster and in what sequence. The user controls the program by pressing a key or clicking a
mouse button or touching a screen.
There are two kinds of interactivity: functional interactivity and intentional interactivity.
While functional interactivity manages the human to machine interface and describes with a
machine and its software and in intentional interactivity the communication takes place between
the investigator and his target, describing the re-construction of a dialogue between a physically
absent investigator and his interlocutor. Obviously, television and video programs seem less
interactive than the computer at a functional level.
The books read the content written and the television watched, lack creativity. With the
inclusion of key board and mouse, a computer can easily accept a user’s input. Here, the user is
allowed to take control of program execution. When the user clicks the ‘hotspot’
(hypertext/hypermedia), it will display another file in the program, which is linked (hyperlink) file,
which can be sound file, a digital video clip or image file with new information. In this way, a
personal computer is becoming the interactive multimedia today.
Multimedia comprises computer graphics, images, sound, motion, animation, text and
text reproductive system (Sullivan, 1955). Heim (1993) maintains that the key aspect of multimedia
is offering a replica of real environment of objects that fools our senses into perceiving the
multimedia as real. Computer multimedia is built from real world situations. Because reality is
complex, models are built to simplify the reality so that it can be easier to study its most important
features. Students can never write well about something until they had thought well about it.
Multimedia are opportunities to work with how to think well about fairly complex matters. Thus,
multimedia exemplifies how to enhance the learning effectiveness by utilizing various technologies
and methods.
29
Educational multimedia is metaphors designed to focus learners attention towards
concepts, which allow them to explore artificial environment, imaginary based on reality. The
educational multimedia also provides a good opportunity for exploration, experimentation and
interaction. The learners can experience the consequence of their actions without facing a risk.
Leon and Leon (1990) maintain that with a multimedia, the students are in control of the learning
environment. It is up to them to find and use information in order to draw conclusions. Multimedia
allow students to have experiences that would not be possible otherwise. Instead of simply
spewing facts, multimedia provide a context for knowledge. Thus, these multimedia technologies
offer an opportunity to bring elements of active practices into the classroom.
Biology occupies a unique position in the school curriculum. Biology is central to many
science related courses such as medicine, pharmacy, agriculture, nursing, biochemistry, and
genetics so on. It is obvious that no student intending to study these disciplines can do without
Biology. These factors, among others, have drawn attention of researchers and curriculum planners
towards Biology as a subject in the school curriculum (Kareem, 2003). In spite of the importance
and popularity of Biology among students, performance at secondary school level had been poor
(Ahmed, 2008). The desire to know the causes of the poor performance in Biology has been the
focus of researchers for some time now. It has been observed that poor performance in the
sciences is caused by the poor quality of science teachers, overcrowded classrooms, and lack of
suitable and adequate science equipment, among others (Abdullahi, 1982; Bajah, 1979; Kareem,
2003; Ogunniyi, 1979). Students perform poorly in Biology because the Biology classes are usually
too large and heterogeneous in terms of ability level. In addition, the laboratories are ill equipped
and the Biology syllabus is over loaded (Ahmed, 2008; Ajayi, 1998).
As multimedia teaching technologies become more widely advocated and employed in
education, researchers strive to understand the influence of such technologies on student learning.
Advances in technology enable pedagogical enhancements that some believe can revolutionize
traditional methods of teaching and learning (Gatlin-Watts, Arn, Kordsmeier, 1999; Persin, 2002).
Studies of multimedia-based instruction report a variety of outcomes (Cabrero, Rodriguez-Conde,
Juanes, and Cabrero, 2005; Dimitrov, McGee, and Howard, 2002; Everhart, Harshaw, Everhart,
Kernodle, and Stubblefield, 2002; Feeg, Bashatah, and Langley, 2005; Homer et al., 2000; Kealy,
2003; Liao, 1999; Mayer, 1997; McKethan and Everhart, 2001; Moreno and Valdez, 2005; Neuhoff,
2000; Smith, 1997; Smith and Woody, 2000; Sneddon, Settle, and Triggs, 2001; Trindade, Fiolhais,
and Almeida, 2002; Welsh, 1993). When viewed collectively, these studies reported that advanced
technologies, especially multimedia instruction, which often involves introducing or enhancing the
visual aspects of the presentation of course contents, created an active learning environment,
30
improved students' performance, fostered positive attitudes toward learning complex concepts,
increased communication, and could be adapted to all learning styles and levels of instruction
(Harris, 2002).
Researchers suggest that, compared to classes with a traditional teacher-leading
approach, those using multimedia are better liked by students and yield slight but statistically
significant improvements in student learning as measured by both student self-report and
objective outcome testing (Dimitrov et al.; Feeg et al.; Mayer, 1997; McKethan and Everhart;
Moreno and Valdez; Sneddon et al., 2001; Worthington, Welsh, Archer, Mindes, and Forsyth,
1996). Such encouraging findings have precipitated the adoption of these technologies on a
widespread basis. Despite many studies suggesting that multimedia instruction benefits students,
there are also some that found no significant differences between multimedia classes and
traditional classes (Everhart et al., 2002; Homer et al., 2000; Lee, Gillan, and Harrison, 1996; Stoloff,
1995). Therefore, there is a need to further educators' understanding of the effect of multimedia
technologies on students' learning quality.
Thus to ascertain the effectiveness of Multimedia it would be reasonable to compare it
with classroom instruction. A number of studies (cited in Najjar, 1996) have been conducted in the
area to ascertain the effectiveness of multimedia instruction. Analysis has been done by Bosco,
1986; Fletcher, 1989, 1990; Khalili and Shashaani, 1994; Kulik, Bangert, and Williams, 1983; Kulik,
Kulik, and Bangert-Drowns, 1985; Kulik, Kulik, and Cohen, 1980; Kulik, Kulik, and Schwalb, 1986;
Schmidt, Weinstein and Niemic, and Walberg, 1985 by examining 200 over studies. The information
included sciences, foreign languages and electronics. The control group normally learnt the
information via classroom or lecture combined with hands-on experiments. The comparison group
learnt information via interactive videodiscs or computer based instruction. The achievement of
learning was measured via tests taken at the end of the lessons. Over this wide range of students,
meta-analysis found that learning was higher when computer-based education was used. Learning
also appeared to take less time when multimedia instruction was used.
1.10 Need and Significance of the Study
Whether it is the teacher or a trained instructional designer, understanding when multimedia use
can be effective and recognizing why it is effective, is essential. As research exposes more
understanding about human perception, cognition, and learning, current educational multimedia
design principles can be polished and new more effective principles can be developed (Najjar,
1998). The existing guidelines for education multimedia design, according to Najjar, are based
almost entirely on the opinions of experts (Allen, 1973; Arens, Hovy, and Vossers, 1993; Feiner and
31
McKeown, 1990, 1991; Reiser and Gagne, 1982) rather than on the results of empirical research.
Therefore, the foundation is weakened on which to make effective educational multimedia design
decisions.
Since the recommendations of the Secondary Education Commission Reports of 1952-53
Science (Biology) has been taught on compulsory basis throughout the school stages (from primary
to secondary level) because of its multifarious and many sided values to human beings. The new
curriculum in Biology at secondary school level demands rapid learning and clear understanding of
concepts. In this curriculum more concepts, and theories have to be taught and students have to
be trained in remembering and understanding in-depth of the concepts and theories.
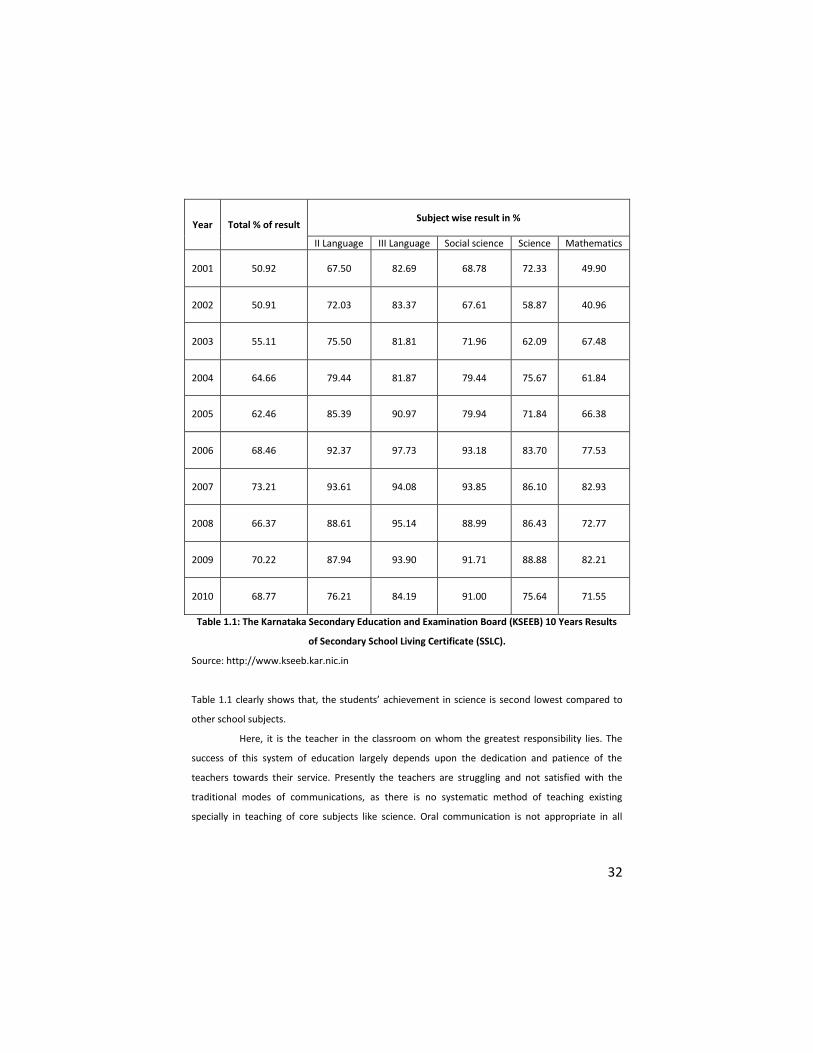
The researcher has ten years of teaching experience and has observed the achievement
of the students in Biology at secondary level. It is researcher’s experience that the achievement of
some students may be optimum in science (Biology) and at the same time the rate of failure in
science and in different examinations is considerably second higher than the other subjects. The
same case is observed in the Karnataka Secondary Education and Examination Board (KSEEB)
results of Secondary School Living Certificate (SSLC). The pass percentage in science is second
lowest compared to other school subjects as shown in Table 1.1
32
Year Total % of result Subject wise result in %
II Language III Language Social science Science Mathematics
2001 50.92 67.50 82.69 68.78 72.33 49.90
2002 50.91 72.03 83.37 67.61 58.87 40.96
2003 55.11 75.50 81.81 71.96 62.09 67.48
2004 64.66 79.44 81.87 79.44 75.67 61.84
2005 62.46 85.39 90.97 79.94 71.84 66.38
2006 68.46 92.37 97.73 93.18 83.70 77.53
2007 73.21 93.61 94.08 93.85 86.10 82.93
2008 66.37 88.61 95.14 88.99 86.43 72.77
2009 70.22 87.94 93.90 91.71 88.88 82.21
2010 68.77 76.21 84.19 91.00 75.64 71.55
Table 1.1: The Karnataka Secondary Education and Examination Board (KSEEB) 10 Years Results
of Secondary School Living Certificate (SSLC).
Source: http://www.kseeb.kar.nic.in
Table 1.1 clearly shows that, the students’ achievement in science is second lowest compared to
other school subjects.
Here, it is the teacher in the classroom on whom the greatest responsibility lies. The
success of this system of education largely depends upon the dedication and patience of the
teachers towards their service. Presently the teachers are struggling and not satisfied with the
traditional modes of communications, as there is no systematic method of teaching existing
specially in teaching of core subjects like science. Oral communication is not appropriate in all
33
situations, sign language is not universal and total communication method is not at all effective in
its fullest measures to convey the messages.
So learning is not properly enjoyed by the students. Therefore, it is time for the
educators of the science to evaluate seriously the effectiveness of traditional procedures in the
context of latest technological developments.
A variety of technologies supports literacy development and hence achievement of
students lack behind in an average achievement. Multimedia offers students alternative ways to
access knowledge and information. Technologies and media range from simple graphics to
integration of text, photographs, video, images, animation, sound, hyperlinks and hypermedia in
multimedia technology. Increasingly, teachers are discovering multimedia projects that can tap
undiscovered strengths and talents that enable students with learning disability to more fully
participate in the learning process. These projects address the needs of the students with various
learning styles, many of whom experience repeated failures with mono media- talk and hear or
pencil and paper.
Media like computers can link text, visual imagery and other effects in a hyperlinks and
hypermedia with hypertext presentation. It can engage students prior knowledge and help them to
form mental images and hence to deepen their conceptual understanding. Multimedia encourage
learning disabilities students to use all of their senses and reflect on the ways they learn best.
Surely, good instruction coupled with the multimedia can yield success in the teaching of Biology.
Technology can change how tasks are performed day today. Schools across the country
are gravitating towards technology driven classrooms, which offer multimedia instructional tools
for everyday use. The integration of various technologies including electronic media has changed
the learning environment from a teacher-centered one to a learner-centered one. The challenges
of integrating technology into educational environment must be examined from the human angle
rather than from the technological. It can change the attitude as well as the performance of each
individual with respect to the specific educational need.
A tolerant approach in the education of Biology teaching is the need of today.
Individuals differ widely in their cognitive experiences, psychomotor skills, success and failure in
learning, interest and perception. It can be said that no two learners are alike physically, mentally
or intellectually. Since learners differ in their prior learning experiences, and in what they already
know, they differ in what they need to learn. So learners should be allowed to learn independently
at their own pace and according to their interest and abilities.
The most effective method of teaching is through individual instruction, where the
teacher is able to provide every student individual attention. Naturally, this kind of attention can be
34
given to relatively very few students, perhaps at the expense of others. It is impossible for one or
two teachers to give each student the amount of attention that individualized instruction implies,
or to keep track of the many details involved in each student’s performance.
Most efforts at individualizing instruction have concentrated on allowing students to
work at their own pace, which require individualized scheduling. Since learning is visually oriented,
a visually structured and activity based system of education which is self-monitoring would help
them. The introduction of ‘learner autonomy’ based on individualized instructing system with the
help of advanced educational technological media in ordinary curriculum is more advisable and
feasible.
Research on education in various subject areas indicate that few science teachers
working with innovative practices for students learning. Many teachers felt that their students are
not being adequately prepared for college level science and technology courses (Ghate, 1999).
A close reviews of the related literature reveals that most of the studies on the
psychological aspects. Very few scientific studies have been focused on the core subjects like
science and mathematics. It is imperative that every student be a successful science learner. If the
learning needs cannot be met by standard school curriculum, alternative teaching and learning
strategies based on educational technology have to be developed to meet the challenges of
aspirant science students. Studies and research works on different instructional strategies in core
subjects in the specific area are rarely touched by investigators especially in India. The learners’
cognitive and psychomotor make-up needs and multimedia are the key points in the development
of any system of education that is relevant to them.
Considering the existing demands, an attempt has been made by the present
investigator to develop and validate multimedia oriented instructional packages that could help to
realise the educational needs of science students to meet the challenges in the curriculum. It is also
designed to move beyond theory and to research hands-on instructional activities with typical
students to prove that certain multimedia interventions reduce cognitive load and make learning
more efficient when presenting information through multimedia.
1.11 Statement of the Study
The present study is entitled “Development and Validation of Multimedia Package in Biology”.
35
1.12 Operational Definitions of the Key Terms Used
Development (in general)
It is a dynamic process of improvement, which implies a change, an evolution, growth and
advancement.
Validation
By validation, the investigator means, establishing the efficacy of the procedures based on
empirical testing. Validation is the process of checking if something satisfies a certain criterion.
Multimedia
Multimedia is woven combination of text, graphic art, sound, animation and video elements. When
the viewer of a multimedia project is allowed to control, what elements are delivered and when, it
is interactive multimedia.
Multimedia Package
By multimedia package investigator means, an organized learning system for auto instructional
purpose which includes an interrelated use of different media from modern communication
methods, and various learning and teaching strategies to create effective learning experiences. This
package may have several media that uses multiple forms of information content and information
processing (for example Text, Audio, Graphics, Animation, Video and Interactivity) to inform the
target audience.
Biology
A division of the natural sciences dealing with life is known as Biology. It is the science of
living organisms.
Research Reviews Reveals the Multimedia Definition
Multimedia is a term that has been used by educators and those in the industry for many years. It
has numerous definitions throughout the literature. In the 1960’s, the term multimedia meant the
use of several media devices in a coordinated fashion (for example-synchronized slides with
audiotape); it also described the combined use of several media, such as films, video, and music.
Najjar (1996) described multimedia as the simultaneous presentation of information using more
than one mode of information transmission. It combines the use of various media such as text,
graphics, animation, pictures, video, and sound, to present information. The term also has been
used to refer to everything from slide shows to extravaganzas complete with multiple monitors,
animation, video, sound, and text. Borsook and Higginbotham-Wheat (1992) state: It would be easy
to remember that multimedia stands for multiple media except that the term media can mean
many things. ‘Media’ can include slides, audio tapes, videotapes, videoconferencing, animation,
36
films, music, voice, paper, or even someone shouting through a megaphone. Media can be
instructional or not; it can be interactive or not; and it can be computer-based or not.
Poole (1995) explains that multimedia has become closely associated with the computer
controlled instructional delivery systems. Instead of using several devices to present multiple forms
of media, these media are now presented using one device (Kozma, 1987). Moore et al. (1996)
augment this point by noting obviously that the computer plays a central role in the organization of
the learning environment. Lee (1996) describes computer-mediated multimedia (CMM), as the
integration of two or more communication media, controlled or manipulated by the user via a
computer, to present information. CMM can be combinations of text, images, animation, sound,
color, and video in a single, computer-controlled presentation. The computer also allows the
element of interactivity. Therefore, there has been a virtual explosion of the use of computer-
based multimedia learning (Bagui, 1998). It can then be speculated that as technology and software
continue to improve and costs decrease, multimedia usage will continue to increase.
1.13 Objectives of the Study
1. To develop and validate a multimedia package on the topics: The Living World and The
Study of Cells, in IX Standard Biology (science part 2) of the Karnataka State Board Text Book.
2. To find out the significant difference between post-test mean scores of students under
multimedia method of instruction and conventional method of instruction in Biology.
3. To find out the significant difference between post-test mean scores of boys under
multimedia of instruction and conventional method of instruction in Biology.
4. To find out the significant difference between post-test mean scores of girls under
multimedia of instruction and conventional method of instruction in Biology.
5. To find out the significant difference between post-test mean scores of boys and girls
students under conventional method of instruction and multimedia method of instruction in
Biology.
6. To find out the significant difference between pre-test and post-test mean scores of
students under conventional method of instruction and multimedia method of instruction in
Biology.
7. To find out the significant difference between pre-test and post-test mean scores of
boys students under conventional method of instruction and multimedia method of instruction in
Biology.
37
8. To find out the significant difference between pre-test and post-test mean scores of girls
students under conventional method of instruction and multimedia method of instruction in
Biology.
9. To find out the significant difference between pre-test and post-test mean scores of
boys and girls students under conventional method of instruction and multimedia method of
instruction in Biology.
10. To find out the significant difference between post-test mean scores of conventional
method of instruction of the boys and girls students on the topic of The Living World.
11. To find out the significant difference between post-test mean scores of multimedia
method of instruction of the boys and girls students on the topic The Living World.
12. To find out the significant difference between post-test mean scores of conventional
method of instruction of the boys and girls students on the topic of The Study of Cells.
13. To find out the significant difference between post-test mean scores of multimedia
method of instruction of the boys and girls students on the topic The of Study of Cells.
14. To find out the significant difference between pre-test and post-test mean scores of
conventional method of instruction of the boys students on the topic of The Living World.
15. To find out the significant difference between pre-test and post-test mean scores of
multimedia method of instruction of the boys students on the topic of The Living World.
16. To find out the significant difference between pre-test and post-test mean scores
conventional method of instruction of the girls’ students on the topic The of Living World.
17. To find out the significant difference between pre-test and post-test mean scores of
multimedia method of instruction of the girls students on the topic of The Living World.
18. To find out the significant difference between pre-test and post-test mean scores of
conventional method of instruction of the boys students on the topic of The Study of Cells.
19. To find out the significant difference between pre-test and post-test mean scores of
multimedia method of instruction of the boys students on the topic of The Study of Cells.
20. To find out the significant difference between pre-test and post-test mean scores
conventional method of instruction of the girls’ students on the topic of The Study of Cells.
21. To find out the significant difference between pre-test and post-test mean scores of
multimedia method of instruction of the girls students on the topic of The Study of Cells.
22. To find out the significant difference between pre-test and post-test mean scores of
students under conventional method of instruction on the topic of The Living World.
23. To find out the significant difference between pre-test and post-test mean scores of
students under multimedia method of instruction on the topic of The Living World.
38
24. To find out the significant difference between pre-test and post-test mean scores of
students under conventional method of instruction on the topic of The Study of Cells.
25. To find out the significant difference between pre-test and post-test mean scores of
students under multimedia method of instruction on the topic of The Study of Cells
26. To know students’ opinions towards multimedia method of instruction (multimedia
package software)
27. To know teachers’ observation towards multimedia package
1.14 Scope and Limitations of the Study
This study is an attempt to development and validation of multimedia package in Biology. The
experiment was conducted on a specified group of sample of high school students of IX standard of
a recognized institution that is BDE Society’s PDJ High School ‘A’ in Bijapur city, in the state of
Karnataka, India.
Utmost care was taken in the preparation of lessons by the investigator in consultation
with experts in the field of research, specialist of general science, teacher educators, high school
teachers and grammar experts in the field of general education, before and during the present
study to make the concepts more clear and vivid. Considering the background of the students,
special care was taken to make the mode of presentation in simple language. Multimedia
presentations are the modified versions of the modular lessons with text, audio, animation, image
and graphics with hyperlinks (hypertext), the package is useful for future purposes too. Expert
technical assistance was also sought for the smooth functioning of the system. A standardized
achievement test was used for measuring the performance of students.
Most of the studies conducted in this field are generally in developed countries. But this
study has been modified to suit Indian classroom conditions. It is expected that the findings of this
investigation will help the educational experts, teacher educators, teachers of secondary schools
and teachers in general classrooms who stand for mainstreaming and curriculum framers to take
necessary changes in the teaching of science to the secondary school students.
The responsibility of the researcher is to see that the study is conducted with maximum
care and to avoid faults, in order to be reliable. However, the following limitations have entered in
the present study.
A statewide sample representing high school students of Karnataka is ideal for the
study. But due to practical constraints, the study was confined to students of studying in IX
standard science part-2 (Biology) of the Karnataka State Board Text Book, assuming that it is the
representative of the three standards of high school education. The investigator limited the area of
39
investigation to only one branch of science, which is Biology. The investigator was able to prepare
multimedia package focused on two chapters in Biology of IX standard. Considering the availability
of the sample, the study has been concentrated on IX standard high school students of Bijapur city
of Karnataka State in India. The investigator is a postgraduate in both Information Technology and
Education with specialization in Educational Technology and also master of philosophy in Computer
Science and Education, even though not competent in producing multimedia packages as
professional multimedia programmer, this problem is overcome by consulting professional
multimedia programmer during the development of multimedia package.
Although these are some limitations, the investigator feels that these may not affect the
scope and validation of the present study. Possible precautions and care was taken by the
investigator to attain the highest degree of accuracy in respect of these factors.
1.15 Organization of the Report
The report of the study has been structured into five chapters based on the materials presented in
each of them.
Chapter One: The introduction chapter contains the need and significance of the study,
statement of problem, operational definitions of key terms, objective of the study, scope and
limitations of the study and organization of the report.
Chapter Two: An account of literature and studies related to the areas of media based
instructional strategies, computer assisted instruction, and multimedia-based instruction and
multimedia in Biology instruction are included in this chapter.
Chapter Three: The methodology chapter details on the study in retrospect, method
adopted, experimental design, details of the sample, development of multimedia package,
description of the materials and tools used and administration of the tools, the procedure followed
and the description of the statistical technique adopted.
Chapter Four: This chapter has information regarding organization, compiling, and
analyses of data and the interpretation.
Chapter Five: The summary and conclusions based on the findings of the study,
tenability of hypotheses, educational implications of the study, suggestions for improving
educational practices and suggestions for further studies are grouped in this chapter.
Thus, it is hereby hoped that the net result of this work would be useful to the students
and the teacher at large.

40
Review of related literature
2.1 Introduction
The review of related studies throws light on the nature of work done in the area and helps the
investigator in designing the study, formulating the objectives and selecting the methods, tools and
techniques of the study.
In this chapter attempt has been made to closely examine if there is any empirical
evidence to support the assertion that multimedia improves effectiveness. It is also aimed to derive
scientific conclusions based on various studies done by educationists, practitioners and teachers in
the following different areas. At present the most commonly used education method is classroom
instruction.
2.2 Studies Related to Various Media Based Instructional Strategies
Carmigani (1973) found that learning activity modules are effective in high school students to learn
cognitive and psychomotor skills.
Observation of Windell (1975) showed that the self-instructional teacher training
modules are effective to produce reliable changes in trainees’ knowledge and skill in the use of
techniques for determining reading level of the children.
Shah (1979) states that the teachers who were exposed to the treatment of self-
instructional multimedia course on effective questioning showed significant improvement in all the
skills except one, in the context of micro teaching.
Basu (1981) developed a multimedia program using semi programmed text, tape-slide,
workbook, film, kit transparency etc. In addition, concluded that this strategy enabled learners to
reach the level of mastery learning
While Varghese (1981) experienced the higher effectiveness of teacher assisted
programmed approach over the conventional approach in teaching Biology in Kerala high schools,
Ravindranath (1992) observed the inductive and deductive programmed learning methods are
equally effective and more than conventional method in teaching Biology in schools of Baroda.
Golani (1982) explained the non-availability of trained personnel in audio-visual
education; problems of equipment, inexperience in production of materials and lack of guidance
are some of the reasons for declining the technology based education in secondary schools.
2
41
Pereira (1982) found out that audio-laboratory method is more effective than formal
method of teaching in science and it is superior in the attainment of higher objectives like
understanding, application and skill in primary school children.
Ravindranath (1982) in his study on development of multimedia instructional strategy
for teaching science at secondary school level noted that the strategy was effective to the extent
that 70 percent of the experimental group students obtained 60 percent and above on all unit
tests.
A multimedia package for teaching a course on audio-visual education including
programmed slides programmed print material non-projected visual aids, self-instructional
materials etc. was developed by Krishnan (1983) and was found quite effective.
Seth (1983) described that educational television program increases the language
development, higher acquisition of information and learning efficiency in children.
Singh (1983) strongly advocated that the use of media treatment in the teaching-
learning process is capable of creating high scores in students.
Through his research, Vardhini (1983) shows that for achievement of different
instructional objectives, a systematically validated multimedia strategy can be implemented at
school level with suitable cost and time components.
Greenberg (1984) compared the effectiveness of computer assisted videocassette
lessons with that of videocassette lessons and paper- pencil practice. The findings revealed that
there was no significant difference existed between the post-test performances of the two groups.
Menon (1984) used a multimedia approach, validated the strategy for postgraduate
levels in different areas, and found it satisfactory.
Wed (1984) investigated the scope of media based communication using documentary
analysis and library research and opined that scope of media is restricted because lack of adequate
participation of students, teachers and parents in these programs.
In an attempt by Ginapp (1985), the influence of teacher assessment module tapes on
student teachers’ performance showed that students in the experimental group received higher
overall ratings by groups of student teachers, supervising teachers and co-operating teachers
indicating the effectiveness of module tapes.
The results of the experiment designed by Horton, Lovitt and Givens (1988)
demonstrated the effectiveness of computer-assisted instruction for teaching content terminology
to high school students by classifying as learning disabled, remedial or in general education.
42
Lang (1989) has tackled the topic academic development and preparation for work, a
highly neglected area and found that a very little work is done in academic subjects such as science,
mathematics and social studies in the education of hearing impaired students.
Lowerbraun and Thomson (1989) have described research designed to discover the
relative efficacy of the new and old approaches and to make recommendations for further research
as well as regulatory and policy changes. They also stressed the need to study the effectiveness of
use of new media and technology such as captioned films, transparencies programmed instruction
sequences computer software etc.
Goel and Mahajan (1990) in their study on computer-based question bank at B.Ed level
observed that Science group scored significantly higher than the Arts group but no significant
difference existed between males and females, Maths and non-maths students on their
achievement in computer education.
Koul and Bhadwal (1991) indicated that instruction using linear programmed text on
‘Atomic structure’ effectively reduced test anxiety among students compared to conventional
method of teaching irrespective of the use of formative evaluation tests.
Sinnathambi (1991) developed a video program on energetics in chemistry for higher
secondary students and Samy (1991) prepared a video program to teach Tamil vocabulary for sixty
grade students. Both of them conclude that the performance of experimental groups were superior
to the control group.
The studies by Madhumohan (1990), Santhoshkumar (1990), Mollykutty (1991),
Gopalan (1992) and Jissy (1997) confirm the superiority of teacher study module over the
traditional text book approach in teaching high school chemistry, high school Physics.
Madhumohan also found that computer assisted instruction is more effective than modular
approach.
Smith and Jones (1991) present recent changes in technologies, expansion of
courseware, and distribution of courseware as a significant part of the undergraduate chemistry
curriculum at the University of Illinois since 1986.
The findings of the study conducted by Jayamani and Chandramani (1992) revealed that
the experiment which used simulation model of teaching through computer-assisted instruction
was significantly better in performance than the control group which used the traditional method,
but sex wise comparison proved to be insignificant.
Katz and Pyryt (1992) undertook a project that focuses on improving students’ self-
image, self-motivation and decision making skills by using technology like audio cassette,
microphone, video animation and computer software package, for sixth grade students.
43
Litchfied (1992) identified different factors such as the nature of the investigation,
advantages of the program over a laboratory investigation, number and types of higher order
thinking skills required, concepts related to inquiry and the level of inquiry are the evaluation
criteria that may be used to determine the usefulness of science education computer software.
According to Yang (1992) and Crain (1994), computer based instruction provide better
opportunity for creativity, sustained motivation and immediate recall of learnt facts.
Couch (1993) gives the importance of visual literacy along with scientific literacy among
middle school students in the teaching of earth and life science classes.
Arbour (1994) developed a multimedia package that includes videocassette, a guide, six
posters to provide a teaching outlines on Great Lakes Fisheries for middle and high school. The
package was found effective in both formal and informal school settings.
Beichner (1994) examined the cognitive and affective impact of multimedia editing to
promote science learning. He also found that students were highly motivated to work
cooperatively and without teacher supervision in such environments.
Investigation of Kanning (1994) describes that the multimedia approach is most
successful in helping students to reach existing curricular goals.
Burton (1995) experienced the effectiveness of Computer Assisted Instruction over
traditional instruction on academic performance of adult students in Mathematics and reading
sections of the Test of Adult Basic Education. Age and sex had no effect on the method of
instruction.
Herimann and others (1995) suggested that interactive child initiated software packages
can stimulate reading and communication but a detailed planning and monitoring from teachers,
parents and clinicians are required in the case of children with autism.
Sewell, Stevens and Lewis (1995) found out that the overall response of under graduate
students using multimedia computer packages were favorable. The study concluded that
multimedia computer technology presents a powerful aid in the teaching and assessment of
biological science.
Callaway (1996) identified that effectiveness of an interactive multimedia computer
package designed to accommodate a number of cognitive and learning style is much higher for
learning difficult topic such as ‘photosynthesis’ for high schools than the typical class room method.
A science curriculum based on technology and students-centered learning for high
school students was developed by Ebert and Strudler (1996). They found that creativity, interest,
performance and work habits of the students increased tremendously using low cost multimedia.
44
Studies conducted by Edmundson (1996) showed that computer assisted instruction
students performed significantly better in their achievement of intermediate English.
Hardy amd Jost (1996) found that the inclusion of music could stimulate and operate in
the mental processing of computer supported instructional messages in ninth grade lessons on
physical science topics.
Steyn, Alexander and Rohm (1996) established the learning outcome of the computer-
aided lessons for first year analytical chemistry by comparing the results of students obtained for
an assignment. Although results of the students who did the course were significantly better only
at 80% confidence level, they responded positively and wanted more exposure to computer.
Adamson (1997) found that student gender did not have a significant effect on either
interactions of attitude in multimedia instruction and students in mostly female groups scored
significantly higher than mostly male or equal gender groups in their performance for small group
learning.
Cavender and Rutter (1997) described some of the multimedia techniques that address
the difficulties in teaching both large introductory and small advanced level classes in the life
science.
Research work of Crosby and Iding (1997) examined high school students’ performance
on an interactive multimedia computer tutorial for learning Physics concepts in conjunction with
their individual differences and indicated that this approach is more effective.
Hedberg and others (1997) developed a package incorporating high quality visual
material in the form of graphics, sound, text and video for high school students that challenges the
students to become active participants and investigators in the learning process.
Lafronza (1997) examined the effects of different software formats on learning process
by varying the degree of structure employed in a computer assisted learning environment and
arrived at the conclusion that cognitive styles play significant role in adult learners, performance.
Lalley (1997) compared the effectiveness of textual feedback to video feedback that
included sound during computer assisted learning and indicated that video feedback resulted in
superior learning and comprehension than text and students preferred video to text as feedback.
Reddy (1997) studied the effectiveness of multimedia instructional strategy in teaching
science to slow learners and the result reveals that it enabled the slow learners to cope with
normal students to a considerable extent.
From his study, Schnakenberg (1997) showed that a relatively full version of computer-
based instructional program is more effective for improving student achievement and learner
control in an instructional program is more appealing for students than program control.
45
Shoba (1997) studied the efficacy of learning contract as a self-instructional tool for
learning Biology at the secondary school level and arrived at the inference the learning contract
approach is superior to the conventional teaching procedure in terms of students’ achievements.
Watts (1997) opined that to realize the high potential for interactive language-learning
multimedia, designers must develop a more learner-based orientation as the primary feature of
designing.
Ayres and Melear (1998) found that there is increased learning of physical science
concepts via multimedia when compared to the traditional hands – on exhibit in a science museum.
Emerson and Mosteller (1998) conclude that computer technology can support good
teaching and can provide active participation. They also found that multimedia has advantages
using multiple senses and can accommodate varying needs of students and enhance learning
efficiency.
In his study, Madanakumar (1998) found that media based instructional strategy is more
effective in creating environmental theory and application awareness that conventional text book
approach among primary school pupils of Kerala.
Mehryar (1998) conducted a survey on the effectiveness of a web-based interactive
multimedia system in tertiary education. The results of the survey conducted during the course
indicated that students were enthusiastic towards the new multimedia packages.
Yasmin et al. (1998) designed a project on collaborative educational multimedia and the
findings indicated that students improved significantly in their science understanding programming
skills.
Luppicini (2007) studied on recent developments in computer-mediated communication
(CMC) research for educational applications. The review draws on 170 recent research articles
selected from 78 journals representing a wide range of disciplines. The review focuses on peer-
reviewed empirical studies, but is open to a variety of methodologies. The review is divided into
two sections addressing major areas of current research: (a) general CMC research in education,
and (b) factors affecting computer-mediated learning. The review covers a variety of key research
areas revolving around CMC in education, including, media effect and comparison, on-line courses
and networks, course and program evaluations, learning and learning processes, problem solving,
writing, decision-making, argumentation, group decision-making, group dynamics, peer
evaluations, gender differences, anonymity, teaching practice effects, technology integration,
teacher styles and characteristics, socio-cultural factors, and professional development effects.
Findings suggest partial advantages of CMC in writing, task focused discussion, collaborative
decision-making, group work, and active involvement in knowledge construction during group
46
interactions. Other research findings revealed influences of peer interaction, group composition,
group cohesion, goal commitment, group norm development, and process training, mixed-sex
groups, and virtual cross-functional teams. Mixed-findings are revealed for performance
advantages of computer-mediated versus face-to-face learning environments on various tasks and
for the presence of gender differences in computer-mediated environments.
Sorgo (2010) experienced in his study, about two-thirds of Slovene secondary schools
received computers equipped with data loggers and sensors to be used in teaching Physics,
Chemistry and Biology. Later it was recognized that only a couple of Biology teachers were using
the donated equipment in their classrooms or laboratories. The questionnaire, intended to
investigate the situation, was posted to schools, which had received a donation.
Based on the answers, it was possible to assign computer applications from one of the
three groups. In the first group were these applications (word processing, e-mail and internet use)
towards which teachers have positive attitudes and that they do use for school work. The common
element is that teachers can work at home and then use the materials in the classroom. In the
second group were applications (presentations, use of data loggers, computer programs and virtual
laboratory) towards which attitudes are positive, but which teachers do not use because of the
overloaded curriculum, lack of equipment, and inappropriate training. In the third group are
applications (computer games and programming), about which attitudes are negative and which
teachers do not use. The Introduction of such applications into teaching is at the moment far from
realistic.
2.3 Studies Related to Computer Assisted Instruction
Studies conducted by Atkinson (1968) showed that computer assisted instruction students
performed significantly better in their achievement in reading at Stanford’s computer assisted
instruction program than their peers in normal classrooms.
In a review of empirical studies on CAI, Cotton (1997) concluded, among others, that the
use of CAI as a supplement to conventional instruction produces higher achievement than the use
of conventional instruction alone, research is in conclusive regarding the comparative effectiveness
of conventional instruction alone and CAI alone, and that computer-based education (CAI and
other computer applications) produce higher achievement than conventional instruction alone. In
addition, students learn instructional contents faster with CAI than with conventional instruction
alone, they retain what they have learned better with CAI than with conventional instruction alone,
and CAI activities appear to be at least as cost effective as and sometimes more computer assisted
47
instruction has been found to enhance students’ performance than the conventional instructional
method in counselor education (Karper, et al, 2005).
However, Mill’s (2001) findings revealed that CAI was found to be as effective as
classroom for fact-based learning, but not as effective for topics requiring critical thinking or
mathematical problem solving. In addition, the time required for by learners to use CAI was higher
overall than conventional classroom instruction. Students taught using traditional instruction
combined with the use of computer performed significantly better than students taught using
traditional instruction in a college setting Akour, (2006). Similarly, college students taught statistics
using lecture-plus-CAI obtained higher averages on midterm and final exams than students taught
using lecture method only Basturk, (2005). Based on a review of several studies and shortcoming
on studies comparing CAI with conventional instruction, CAI can be considered as effective as
traditional instruction. Furthermore, how CAI is delivered can affect its effectiveness, and that new
studies are needed to clarify the effect of CAI in contemporary student environment (Jenk and
Springer, 2002). Thus, empirical findings on the use of CAI have been mixed.
Gender issues too have been linked with performance of students in academic tasks in
several studies but without any definite conclusion. But there is a general conclusion that general
imbalance exist in computer use, access, career and attitude. That is why Davies, Klawe, Ng, Nyhus,
and Sullivan, based on their review suggested that current ender imbalance in technology and the
role that technology will play in the future should be a concern for men and women, practitioners,
policy makers and parents. Some studies revealed that male students perform better than the
females in Physics, Chemistry, and Biology (Danmole, 1998; Novak and Mosunda, 1991; Okeke and
Ochuba, 1986) while others revealed that female students are better off than males (Kelly, 1978:
Wonzencreaft, 1963). Some studies such as those of Bello (1990) did not find any form of influence
being exerted by gender on students’ academic performance in the sciences.
Gender factor on the use of CAI has also been of interest to researchers. Collazos,
Guerrero, Llana, and Oetzel, examined gender influence on collaborative use of computer based
communication. They found that group with minority women had low index of collaboration
compared to homogenous group and group with majority women.
Zyoud (1999) reveal that when the computer is used to its full potential, it can help the
students achieve more in learning vocabulary, grammar and comprehension to the learners with
different IQ, motivation and attitude. It helps the students learn better because it provides them
with a lot of freedom and responsibility to learn at their own pace. The students were found to
have positive attitude towards Computer Assisted English Language instruction.
48
Khirwadkar (1999) developed a CAI package in subject of Chemistry for standard XI
Science Students studying GSTB syllabus and studied the effectiveness of the developed software in
terms of instructional time and achievement of students. Also, she studied the effect of software
package on students’ achievement in relation to students’ intelligence level, motivation level, and
attitude towards the package and the attitude of the students and teachers regarding the
effectiveness of the CAI package with respect to contents, presentation, examples, illustrations,
graphs and figures, evaluation items, utility of software and instructions given in the instructional
manual. The developed software package was found to be effective in terms of academic
achievement of the students. The students and teachers were found to have favorable opinion
towards the software package. There was found an interaction effect of IQ, motivation and opinion
of students on their academic achievement.
Christmann and Badgett, (2000) made a progressive comparison of the effectiveness of
computer assisted instruction on science achievement: This study compared science students who
were exposed to traditional methodology with those who received traditional methodology
supplemented with computer-assisted instruction (CAI). From the 24 conclusions, an overall mean
effect size of 0.266 was calculated, indicating that, on the average, students receiving traditional
instruction supplemented with CAI attained higher academic achievement than did 60.4% of those
receiving only traditional instruction. The effect sizes were categorized into four subject areas. In
descending order, the mean effect sizes in general science, Physics, Chemistry, and Biology are:
0.707, 0.280, 0.085, and 0.042, respectively.
Differences in educational settings revealed that CAI is most effective among science
students in urban areas; followed by those in suburban areas; and weakest among rural students.
However, a -0.335 correlation between effect size and years indicates that the effect of CAI on
academic achievement has declined during this period.
Sanjna (2001) conducted a comparative study of the effectiveness of CAI and CMI on
Pupil’s achievement in Science, their self-concept and study involvement. Both CAI and CMI were
found to be contributing significantly towards the achievement of pupils in science, in developing
their self-concept and in increasing their study involvement.
Spence (2004) found no significant influence of gender on the achievement of college
students in mathematics when they were exposed to mathematics courseware in online and
traditional learning environment. However, female online learners were significantly less likely to
complete the course compared to their traditional female counterpart or male online counterparts.
In a review of studies on access, use, attitude, and achievement with computer, Kirkpatrick and
Cuban (1998) concluded that when female and male students at all levels of education had the
49
same amount and types of experiences on computers, female achievement scores and attitudes
are similar in computer classes and classes using computer.
Cooperative learning is meant to enhance students’ learning and develop their social
skills like decision-making, conflict management, and communication (Bonwell and Eison, 1991).
Through cooperative learning methods students share ideas together so that they can learn to
work together and to learn that they are responsible for one another’s learning as well as their own
learning (Slavin, 1991). Cooperative learning tends to be more carefully structured and delineated
than most other forms of small-group learning (Newberry). Four key elements of cooperative
learning are: positive interdependence, individual accountability, group rewards, and group
training (Johnson and Johnson, 1987; Slavin, 1995). The close affinity and links between
technologies had been noted by Millis and Cottell (1998) in their assertion that cooperative
learning and technology are natural partners. This is because use of technology involves human
dimensions of caring, community, and commitment. Furthermore, using technology in ways that
promote sequenced learning within groups can lead to more in-depth processing of course content
and, hence, more retention of information.
Communication is at the heart of Knowledge Transfer (KT). But studies of KT barriers do
not explicitly consider the relationship and impact of specific communication modalities on KT. The
modalities of Computer-Mediated Communication (CMC), namely email, Voiceover, Internet,
Protocol, Instant Messaging (IM) and the like are generally viewed as a group 'CMC'. David
Schwartz (2001) conclude with a model that presents the categorized KT barriers in a
communication channel model that can be addressed by CMC modalities and that can potentially
break down those barriers.
In a study effectiveness of CAI in Biology at Secondary School Level (Sivraj Pandian,
2004) reveals, that the CAI students demonstrated significantly higher achievement gains in
Biology. The variables self-esteem, attitude towards Biology and computer were influenced by the
CAI. In contrast, the attitude of students towards school could not be influenced.
Ann, Barbara, and Deborah (2009) have studied effectiveness of computer-assisted
instruction for teaching consumer credit. This study tested the effectiveness of computer-assisted
instruction (CAI) versus supervised reading for teaching consumer credit to secondary school home
economics students and investigated the effects of students' IQ, grade point average, attitude
toward computers, and familiarity with computers on amount of information learned by subjects
taught by CAI. A random sample of 68 students, randomly assigned to experimental and control
groups, was drawn from a population of X through XII graders in a large rural high school. Analysis
of covariance, controlling for differences in IQ and grade level, was used to test differences in mean
50
gain scores of pre-test, post-test, and second post-test. Results indicated that the experimental
(CAI) group learned more between pre-test and both post-tests than did the control group. Results
of three stepwise multiple regression analyses indicated that student learning via CAI did not vary
by IQ, GPA, attitude toward computers, or familiarity with computers, which suggests that CAI is an
effective teaching method for teaching consumer credit with diverse types of high school students.
Barad (2010) in his study the Effectiveness of CAI for Science teaching in urban area. It
reveals that science teaching through CAI program was equal effective for boys and girls. Science
teaching through CAI program was more effective for high IQ students then low IQ students.
Effectiveness of sex was shown of teaching method was shown on mean achievement score of
post-test. Effectiveness of IQ was shown on mean achievement score of posttest. Interaction
effects of sex and teaching method was not shown on mean achievement score of post-test.
Interaction effects of sex and IQ was not shown on mean achievement score of post-test.
Interaction effects of teaching method and IQ was not shown on mean achievement score of post-
test. Interaction effects of sex, teaching method and IQ was not shown on mean achievement score
of post-test.
Owusu, (2010) Studied the effects of computer-assisted instruction on performance of
senior high school Biology students in Ghana. This study investigated the comparative efficiency of
computer-assisted instruction (CAI) and conventional teaching method in Biology on senior high
school students. A science class was selected in each of two randomly selected schools. The pre-
test-post-test nonequivalent quasi-experimental design was used.
The students in the experimental group learned science concepts (cell cycle) through
the CAI, whereas the students in the control group were taught the same concepts by the
conventional approach. The conventional approach consisted of lecture, discussions, question, and
answer teaching methods. Mann–Whitney U tests were used to analyze students’ pre-test and
post-tests scores. The results indicated that students that were instructed by the conventional
approach performed better on the posttest than those instructed by the CAI. However, the
performance of low achievers within the experimental group improved after they were instructed
by the CAI. Even though the CAI group did not perform better than the conventional approach
group, the students in the CAI group perceived CAI to be interesting when they were interviewed.
2.4 Studies Related to Multimedia Based Instruction
Multimedia is a term that has been used by educators and those in the industry for many years. It
has numerous definitions throughout the literature. In the 1960’s, the term multimedia meant the
51
use of several media devices in a coordinated fashion (for example, synchronized slides with
audiotape); it also described the combined use of several media, such as films, video, and music.
Najjar (1996) described multimedia as the simultaneous presentation of information
using more than one mode of information transmission. It combines the use of various media such
as text, graphics, animation, pictures, video, and sound, to present information. The term also has
been used to refer to everything from slide shows to extravaganzas complete with multiple
monitors, animation, video, sound, and text.
Borsook and Wheat (1992) state that it would be easy to remember that multimedia
stands for multiple media except that the term media can mean many things. ‘Media’ can include
slides, audio tapes, videotapes, videoconferencing, animation, films, music, voice, paper, or even
someone shouting through a megaphone. Media can be instructional or not; it can be interactive or
not; and it can be computer-based or not.
Poole (1995) explained that multimedia has become closely associated with the
computer controlled instructional delivery systems. Instead of using several devices to present
multiple forms of media, these media are now presented using one device (Kozma, 1987).
Moore et al. (1996) augmented this point by noting it is obvious that the computer plays
a central role in the organization of the learning environment.
Lee (1996) describes computer-mediated multimedia (CMM), as the integration of two
or more communication media, controlled or manipulated by the user via a computer, to present
information. CMM can be combinations of text, images, animation, sound, color, and video in a
single, computer-controlled presentation. The computer also allows the element of interactivity.
Therefore, there has been a virtual explosion of the use of computer-based multimedia learning
(Bagui, 1998). It can then be speculated that as technology and software continue to improve and
costs decrease, multimedia usage will continue to increase.
Liao (1999) Effects of multimedia on learning in third world children, multimedia is
increasingly being used in computer-based learning, and the general indication is that this trend
will persist for a while to come. One rationale for this trend is the assumption that multimedia has
properties that can aid learning, particularly the learning of abstract subject matter. One area that
has long been seen as a target for the use of learning aid is children's learning. However, although
the use of multimedia in this area is rapidly increasing, particularly in the form of numerous
commercial applications, there still appears to be a lack of adequate research into the extent to
which multimedia is effective in childrens’ mathematics, given factors such as culture and
environment. This study investigated the effectiveness of multimedia on the learning performance
of non-English-speaking third world children. The performance scores of two groups of 18 children
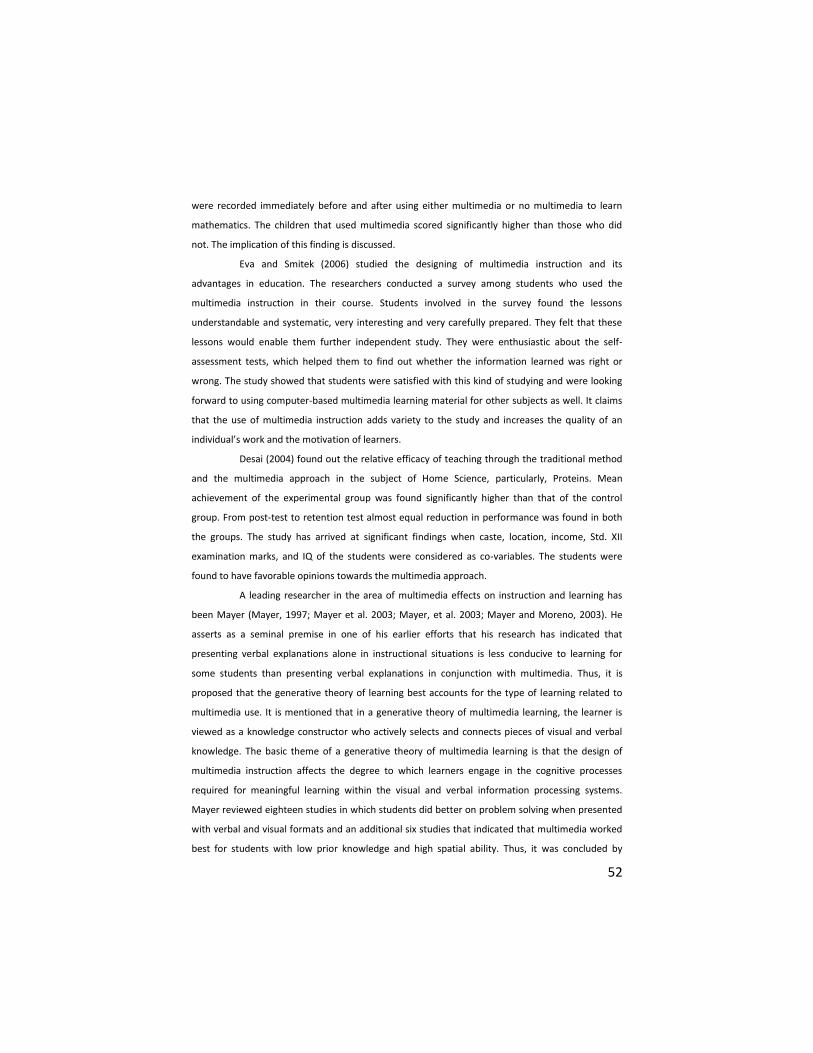
52
were recorded immediately before and after using either multimedia or no multimedia to learn
mathematics. The children that used multimedia scored significantly higher than those who did
not. The implication of this finding is discussed.
Eva and Smitek (2006) studied the designing of multimedia instruction and its
advantages in education. The researchers conducted a survey among students who used the
multimedia instruction in their course. Students involved in the survey found the lessons
understandable and systematic, very interesting and very carefully prepared. They felt that these
lessons would enable them further independent study. They were enthusiastic about the self-
assessment tests, which helped them to find out whether the information learned was right or
wrong. The study showed that students were satisfied with this kind of studying and were looking
forward to using computer-based multimedia learning material for other subjects as well. It claims
that the use of multimedia instruction adds variety to the study and increases the quality of an
individual’s work and the motivation of learners.
Desai (2004) found out the relative efficacy of teaching through the traditional method
and the multimedia approach in the subject of Home Science, particularly, Proteins. Mean
achievement of the experimental group was found significantly higher than that of the control
group. From post-test to retention test almost equal reduction in performance was found in both
the groups. The study has arrived at significant findings when caste, location, income, Std. XII
examination marks, and IQ of the students were considered as co-variables. The students were
found to have favorable opinions towards the multimedia approach.
A leading researcher in the area of multimedia effects on instruction and learning has
been Mayer (Mayer, 1997; Mayer et al. 2003; Mayer, et al. 2003; Mayer and Moreno, 2003). He
asserts as a seminal premise in one of his earlier efforts that his research has indicated that
presenting verbal explanations alone in instructional situations is less conducive to learning for
some students than presenting verbal explanations in conjunction with multimedia. Thus, it is
proposed that the generative theory of learning best accounts for the type of learning related to
multimedia use. It is mentioned that in a generative theory of multimedia learning, the learner is
viewed as a knowledge constructor who actively selects and connects pieces of visual and verbal
knowledge. The basic theme of a generative theory of multimedia learning is that the design of
multimedia instruction affects the degree to which learners engage in the cognitive processes
required for meaningful learning within the visual and verbal information processing systems.
Mayer reviewed eighteen studies in which students did better on problem solving when presented
with verbal and visual formats and an additional six studies that indicated that multimedia worked
best for students with low prior knowledge and high spatial ability. Thus, it was concluded by
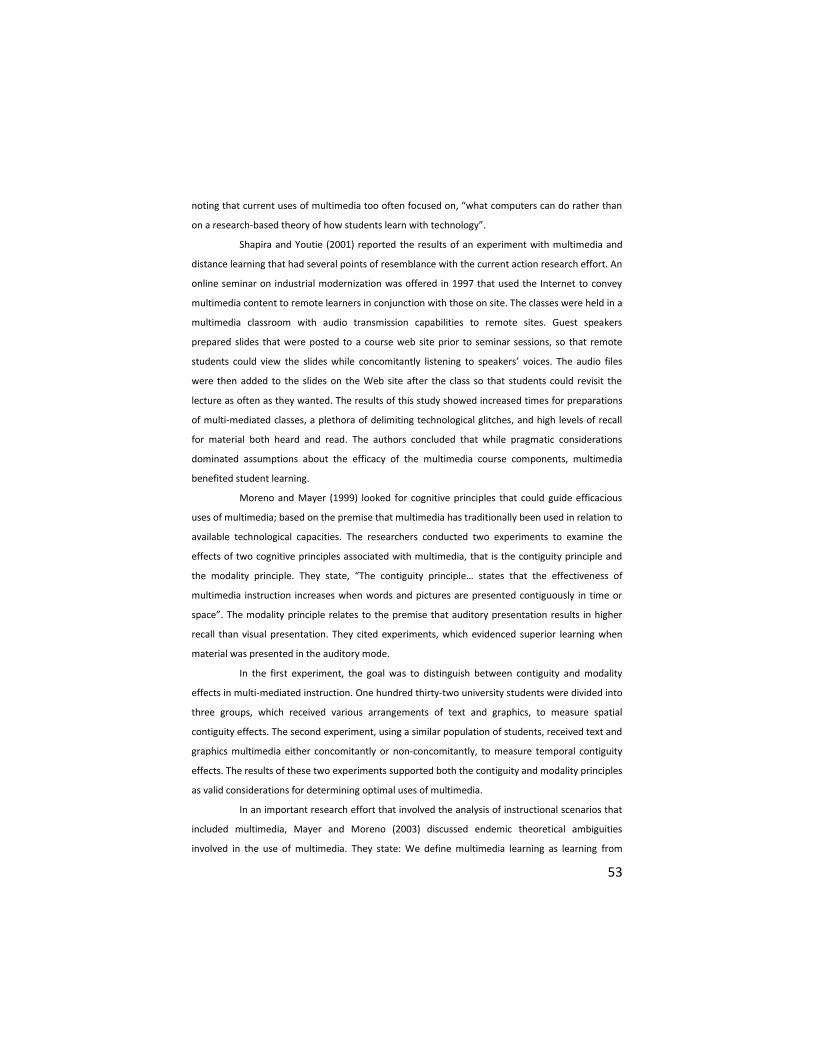
53
noting that current uses of multimedia too often focused on, “what computers can do rather than
on a research-based theory of how students learn with technology”.
Shapira and Youtie (2001) reported the results of an experiment with multimedia and
distance learning that had several points of resemblance with the current action research effort. An
online seminar on industrial modernization was offered in 1997 that used the Internet to convey
multimedia content to remote learners in conjunction with those on site. The classes were held in a
multimedia classroom with audio transmission capabilities to remote sites. Guest speakers
prepared slides that were posted to a course web site prior to seminar sessions, so that remote
students could view the slides while concomitantly listening to speakers’ voices. The audio files
were then added to the slides on the Web site after the class so that students could revisit the
lecture as often as they wanted. The results of this study showed increased times for preparations
of multi-mediated classes, a plethora of delimiting technological glitches, and high levels of recall
for material both heard and read. The authors concluded that while pragmatic considerations
dominated assumptions about the efficacy of the multimedia course components, multimedia
benefited student learning.
Moreno and Mayer (1999) looked for cognitive principles that could guide efficacious
uses of multimedia; based on the premise that multimedia has traditionally been used in relation to
available technological capacities. The researchers conducted two experiments to examine the
effects of two cognitive principles associated with multimedia, that is the contiguity principle and
the modality principle. They state, “The contiguity principle… states that the effectiveness of
multimedia instruction increases when words and pictures are presented contiguously in time or
space”. The modality principle relates to the premise that auditory presentation results in higher
recall than visual presentation. They cited experiments, which evidenced superior learning when
material was presented in the auditory mode.
In the first experiment, the goal was to distinguish between contiguity and modality
effects in multi-mediated instruction. One hundred thirty-two university students were divided into
three groups, which received various arrangements of text and graphics, to measure spatial
contiguity effects. The second experiment, using a similar population of students, received text and
graphics multimedia either concomitantly or non-concomitantly, to measure temporal contiguity
effects. The results of these two experiments supported both the contiguity and modality principles
as valid considerations for determining optimal uses of multimedia.
In an important research effort that involved the analysis of instructional scenarios that
included multimedia, Mayer and Moreno (2003) discussed endemic theoretical ambiguities
involved in the use of multimedia. They state: We define multimedia learning as learning from
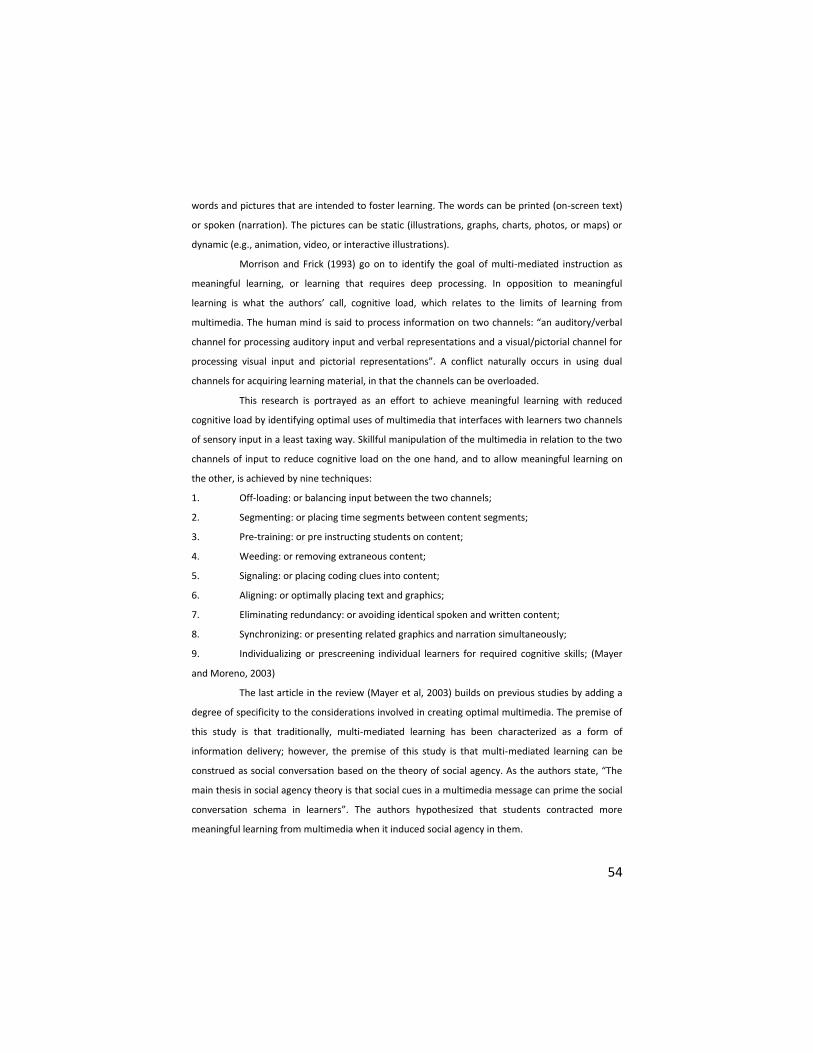
54
words and pictures that are intended to foster learning. The words can be printed (on-screen text)
or spoken (narration). The pictures can be static (illustrations, graphs, charts, photos, or maps) or
dynamic (e.g., animation, video, or interactive illustrations).
Morrison and Frick (1993) go on to identify the goal of multi-mediated instruction as
meaningful learning, or learning that requires deep processing. In opposition to meaningful
learning is what the authors’ call, cognitive load, which relates to the limits of learning from
multimedia. The human mind is said to process information on two channels: “an auditory/verbal
channel for processing auditory input and verbal representations and a visual/pictorial channel for
processing visual input and pictorial representations”. A conflict naturally occurs in using dual
channels for acquiring learning material, in that the channels can be overloaded.
This research is portrayed as an effort to achieve meaningful learning with reduced
cognitive load by identifying optimal uses of multimedia that interfaces with learners two channels
of sensory input in a least taxing way. Skillful manipulation of the multimedia in relation to the two
channels of input to reduce cognitive load on the one hand, and to allow meaningful learning on
the other, is achieved by nine techniques:
1. Off-loading: or balancing input between the two channels;
2. Segmenting: or placing time segments between content segments;
3. Pre-training: or pre instructing students on content;
4. Weeding: or removing extraneous content;
5. Signaling: or placing coding clues into content;
6. Aligning: or optimally placing text and graphics;
7. Eliminating redundancy: or avoiding identical spoken and written content;
8. Synchronizing: or presenting related graphics and narration simultaneously;
9. Individualizing or prescreening individual learners for required cognitive skills; (Mayer
and Moreno, 2003)
The last article in the review (Mayer et al, 2003) builds on previous studies by adding a
degree of specificity to the considerations involved in creating optimal multimedia. The premise of
this study is that traditionally, multi-mediated learning has been characterized as a form of
information delivery; however, the premise of this study is that multi-mediated learning can be
construed as social conversation based on the theory of social agency. As the authors state, “The
main thesis in social agency theory is that social cues in a multimedia message can prime the social
conversation schema in learners”. The authors hypothesized that students contracted more
meaningful learning from multimedia when it induced social agency in them.
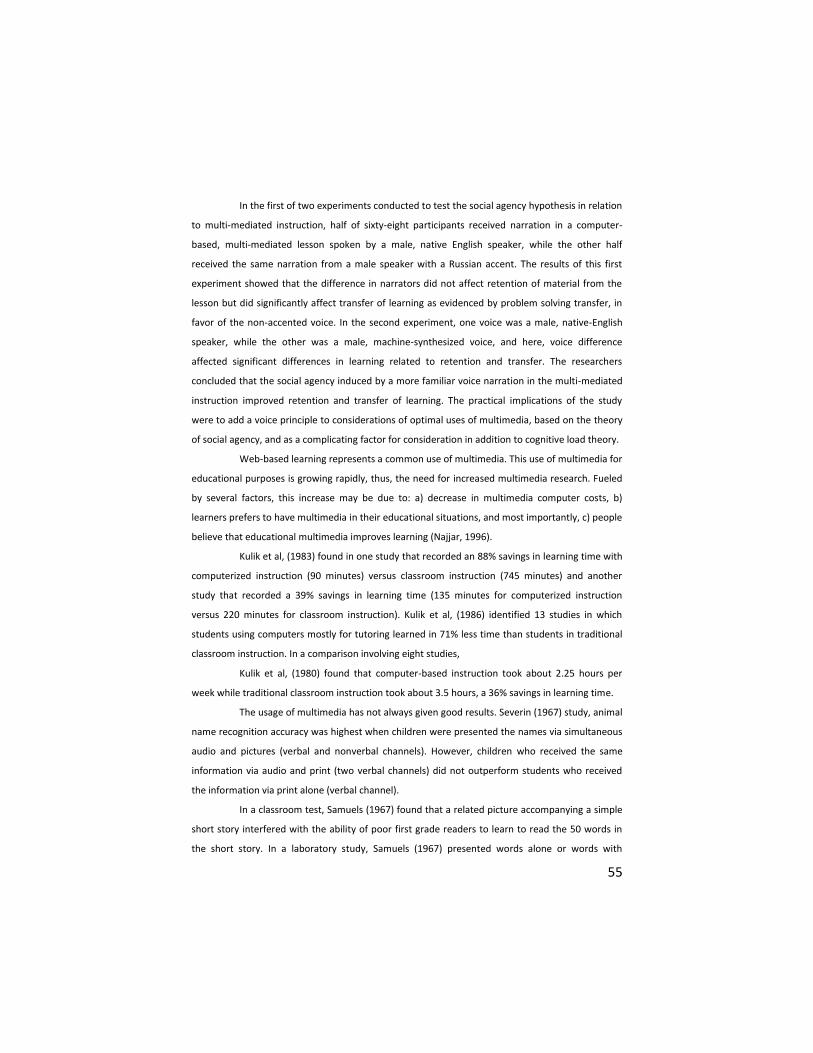
55
In the first of two experiments conducted to test the social agency hypothesis in relation
to multi-mediated instruction, half of sixty-eight participants received narration in a computer-
based, multi-mediated lesson spoken by a male, native English speaker, while the other half
received the same narration from a male speaker with a Russian accent. The results of this first
experiment showed that the difference in narrators did not affect retention of material from the
lesson but did significantly affect transfer of learning as evidenced by problem solving transfer, in
favor of the non-accented voice. In the second experiment, one voice was a male, native-English
speaker, while the other was a male, machine-synthesized voice, and here, voice difference
affected significant differences in learning related to retention and transfer. The researchers
concluded that the social agency induced by a more familiar voice narration in the multi-mediated
instruction improved retention and transfer of learning. The practical implications of the study
were to add a voice principle to considerations of optimal uses of multimedia, based on the theory
of social agency, and as a complicating factor for consideration in addition to cognitive load theory.
Web-based learning represents a common use of multimedia. This use of multimedia for
educational purposes is growing rapidly, thus, the need for increased multimedia research. Fueled
by several factors, this increase may be due to: a) decrease in multimedia computer costs, b)
learners prefers to have multimedia in their educational situations, and most importantly, c) people
believe that educational multimedia improves learning (Najjar, 1996).
Kulik et al, (1983) found in one study that recorded an 88% savings in learning time with
computerized instruction (90 minutes) versus classroom instruction (745 minutes) and another
study that recorded a 39% savings in learning time (135 minutes for computerized instruction
versus 220 minutes for classroom instruction). Kulik et al, (1986) identified 13 studies in which
students using computers mostly for tutoring learned in 71% less time than students in traditional
classroom instruction. In a comparison involving eight studies,
Kulik et al, (1980) found that computer-based instruction took about 2.25 hours per
week while traditional classroom instruction took about 3.5 hours, a 36% savings in learning time.
The usage of multimedia has not always given good results. Severin (1967) study, animal
name recognition accuracy was highest when children were presented the names via simultaneous
audio and pictures (verbal and nonverbal channels). However, children who received the same
information via audio and print (two verbal channels) did not outperform students who received
the information via print alone (verbal channel).
In a classroom test, Samuels (1967) found that a related picture accompanying a simple
short story interfered with the ability of poor first grade readers to learn to read the 50 words in
the short story. In a laboratory study, Samuels (1967) presented words alone or words with

56
identifying pictures to kindergarten children who were learning to read four words. After the
children saw each word or word and picture, the experimenter read the word to the children.
When the experimenter tested learning using only words, the children who saw only words
performed better than the children who saw words with pictures. For this latter test, it appears
that the pictures distracted the children. A review of related literature (Samuels, 1970) also
concluded that pictures interfered with learning to read.
Khirwadkar (1999) the developed software package which was found to be effective in
terms of academic achievement of the students. The students and teachers were found to have
favourable opinion towards the software package. There was found an interaction effect of IQ,
motivation and opinion of students on their academic achievement.
Yadav (2000) conducted the effectiveness of the computer software for students of
standard I. There was a significant gain in terms of mean achievement on the software on
Alphabets and Animals. Most of the students were found to have positive reactions towards the
software. Teachers welcomed the media integrated approach towards learning.
Starbek et al, (2010) have experienced that teaching genetics with multimedia results in
better acquisition of knowledge and improvement in comprehension. The main goal of this study
was to explore whether the use of multimedia in genetics instruction contributes more to students'
knowledge and comprehension than other instructional modes. Study also was concerned with the
influence of different instructional modes on the retention of knowledge and comprehension. In a
quasi-experimental design, four comparable groups of III and IV grade high school students were
taught the process of protein synthesis: group 1 was taught in the traditional lecture format (n =
112 students), group 2 only by reading text (n = 124 students), group 3 through multimedia that
integrated two short computer animations (n = 115 students) and group 4 by text supplemented
with illustrations (n = 117 students).
All students received one pre-test in order to estimate their prior knowledge and two
post-tests in order to assess knowledge and comprehension immediately after learning and again
after 5 weeks. Results showed that students comprising groups 3 and 4 acquired better knowledge
and improved comprehension skills than the other two groups. Similar results were observed for
retention of acquired knowledge and improved comprehension. These findings lead to the
conclusion that better learning outcomes can be obtained by the use of animations or at least
illustrations when learning genetic
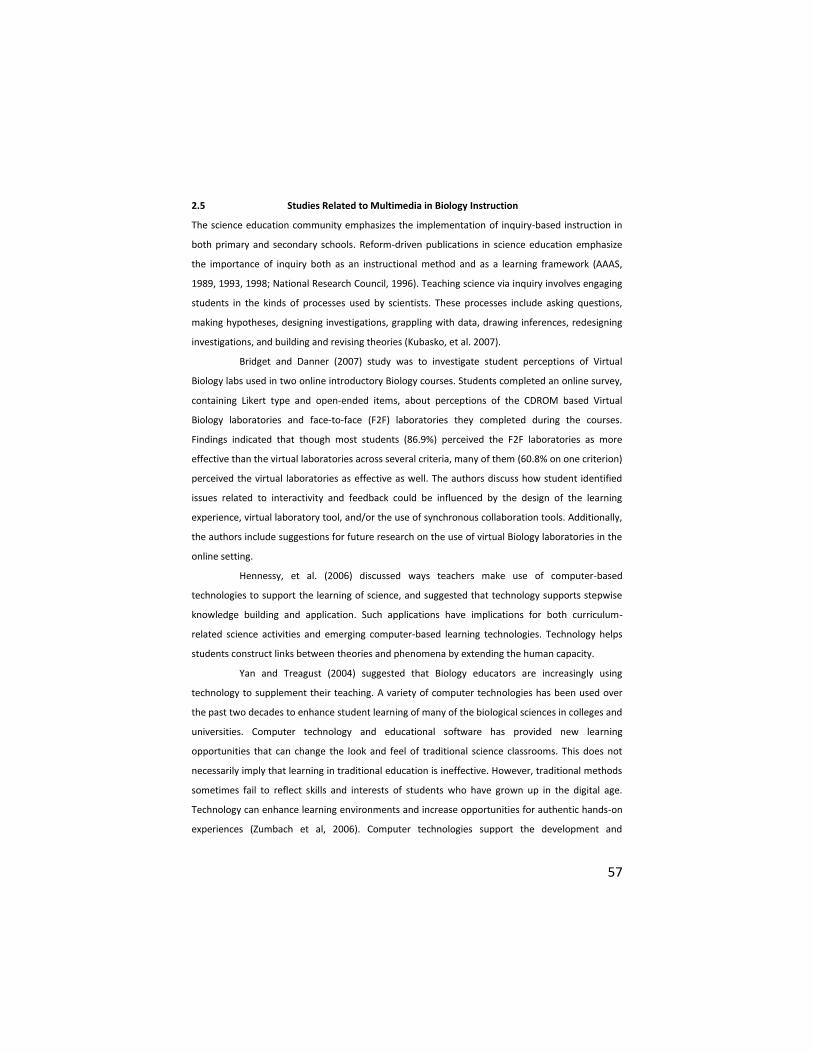
57
2.5 Studies Related to Multimedia in Biology Instruction
The science education community emphasizes the implementation of inquiry-based instruction in
both primary and secondary schools. Reform-driven publications in science education emphasize
the importance of inquiry both as an instructional method and as a learning framework (AAAS,
1989, 1993, 1998; National Research Council, 1996). Teaching science via inquiry involves engaging
students in the kinds of processes used by scientists. These processes include asking questions,
making hypotheses, designing investigations, grappling with data, drawing inferences, redesigning
investigations, and building and revising theories (Kubasko, et al. 2007).
Bridget and Danner (2007) study was to investigate student perceptions of Virtual
Biology labs used in two online introductory Biology courses. Students completed an online survey,
containing Likert type and open-ended items, about perceptions of the CDROM based Virtual
Biology laboratories and face-to-face (F2F) laboratories they completed during the courses.
Findings indicated that though most students (86.9%) perceived the F2F laboratories as more
effective than the virtual laboratories across several criteria, many of them (60.8% on one criterion)
perceived the virtual laboratories as effective as well. The authors discuss how student identified
issues related to interactivity and feedback could be influenced by the design of the learning
experience, virtual laboratory tool, and/or the use of synchronous collaboration tools. Additionally,
the authors include suggestions for future research on the use of virtual Biology laboratories in the
online setting.
Hennessy, et al. (2006) discussed ways teachers make use of computer-based
technologies to support the learning of science, and suggested that technology supports stepwise
knowledge building and application. Such applications have implications for both curriculum-
related science activities and emerging computer-based learning technologies. Technology helps
students construct links between theories and phenomena by extending the human capacity.
Yan and Treagust (2004) suggested that Biology educators are increasingly using
technology to supplement their teaching. A variety of computer technologies has been used over
the past two decades to enhance student learning of many of the biological sciences in colleges and
universities. Computer technology and educational software has provided new learning
opportunities that can change the look and feel of traditional science classrooms. This does not
necessarily imply that learning in traditional education is ineffective. However, traditional methods
sometimes fail to reflect skills and interests of students who have grown up in the digital age.
Technology can enhance learning environments and increase opportunities for authentic hands-on
experiences (Zumbach et al, 2006). Computer technologies support the development and
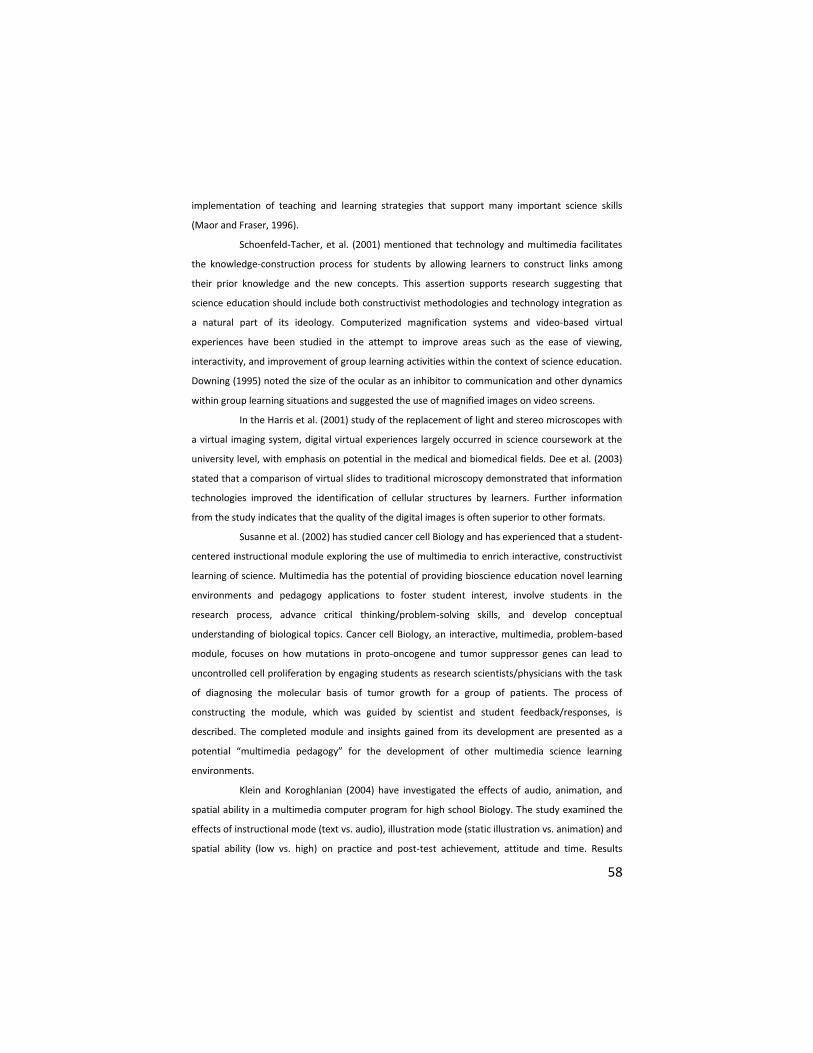
58
implementation of teaching and learning strategies that support many important science skills
(Maor and Fraser, 1996).
Schoenfeld-Tacher, et al. (2001) mentioned that technology and multimedia facilitates
the knowledge-construction process for students by allowing learners to construct links among
their prior knowledge and the new concepts. This assertion supports research suggesting that
science education should include both constructivist methodologies and technology integration as
a natural part of its ideology. Computerized magnification systems and video-based virtual
experiences have been studied in the attempt to improve areas such as the ease of viewing,
interactivity, and improvement of group learning activities within the context of science education.
Downing (1995) noted the size of the ocular as an inhibitor to communication and other dynamics
within group learning situations and suggested the use of magnified images on video screens.
In the Harris et al. (2001) study of the replacement of light and stereo microscopes with
a virtual imaging system, digital virtual experiences largely occurred in science coursework at the
university level, with emphasis on potential in the medical and biomedical fields. Dee et al. (2003)
stated that a comparison of virtual slides to traditional microscopy demonstrated that information
technologies improved the identification of cellular structures by learners. Further information
from the study indicates that the quality of the digital images is often superior to other formats.
Susanne et al. (2002) has studied cancer cell Biology and has experienced that a student-
centered instructional module exploring the use of multimedia to enrich interactive, constructivist
learning of science. Multimedia has the potential of providing bioscience education novel learning
environments and pedagogy applications to foster student interest, involve students in the
research process, advance critical thinking/problem-solving skills, and develop conceptual
understanding of biological topics. Cancer cell Biology, an interactive, multimedia, problem-based
module, focuses on how mutations in proto-oncogene and tumor suppressor genes can lead to
uncontrolled cell proliferation by engaging students as research scientists/physicians with the task
of diagnosing the molecular basis of tumor growth for a group of patients. The process of
constructing the module, which was guided by scientist and student feedback/responses, is
described. The completed module and insights gained from its development are presented as a
potential “multimedia pedagogy” for the development of other multimedia science learning
environments.
Klein and Koroghlanian (2004) have investigated the effects of audio, animation, and
spatial ability in a multimedia computer program for high school Biology. The study examined the
effects of instructional mode (text vs. audio), illustration mode (static illustration vs. animation) and
spatial ability (low vs. high) on practice and post-test achievement, attitude and time. Results
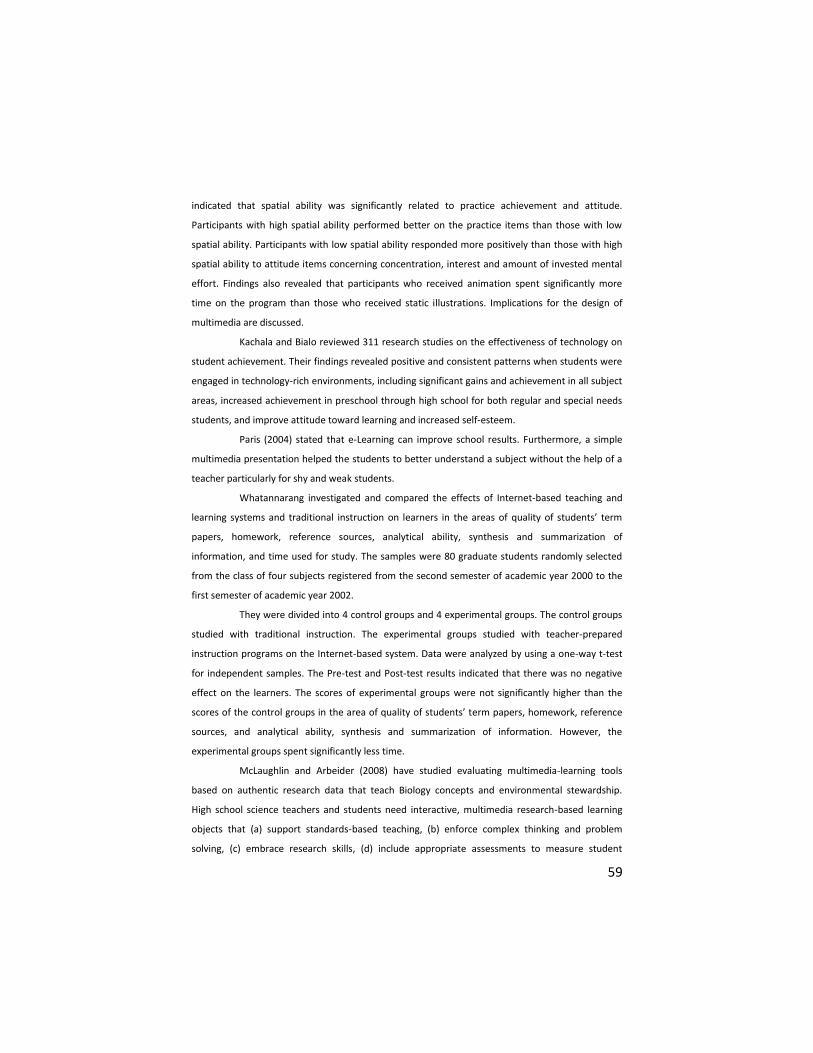
59
indicated that spatial ability was significantly related to practice achievement and attitude.
Participants with high spatial ability performed better on the practice items than those with low
spatial ability. Participants with low spatial ability responded more positively than those with high
spatial ability to attitude items concerning concentration, interest and amount of invested mental
effort. Findings also revealed that participants who received animation spent significantly more
time on the program than those who received static illustrations. Implications for the design of
multimedia are discussed.
Kachala and Bialo reviewed 311 research studies on the effectiveness of technology on
student achievement. Their findings revealed positive and consistent patterns when students were
engaged in technology-rich environments, including significant gains and achievement in all subject
areas, increased achievement in preschool through high school for both regular and special needs
students, and improve attitude toward learning and increased self-esteem.
Paris (2004) stated that e-Learning can improve school results. Furthermore, a simple
multimedia presentation helped the students to better understand a subject without the help of a
teacher particularly for shy and weak students.
Whatannarang investigated and compared the effects of Internet-based teaching and
learning systems and traditional instruction on learners in the areas of quality of students’ term
papers, homework, reference sources, analytical ability, synthesis and summarization of
information, and time used for study. The samples were 80 graduate students randomly selected
from the class of four subjects registered from the second semester of academic year 2000 to the
first semester of academic year 2002.
They were divided into 4 control groups and 4 experimental groups. The control groups
studied with traditional instruction. The experimental groups studied with teacher-prepared
instruction programs on the Internet-based system. Data were analyzed by using a one-way t-test
for independent samples. The Pre-test and Post-test results indicated that there was no negative
effect on the learners. The scores of experimental groups were not significantly higher than the
scores of the control groups in the area of quality of students’ term papers, homework, reference
sources, and analytical ability, synthesis and summarization of information. However, the
experimental groups spent significantly less time.
McLaughlin and Arbeider (2008) have studied evaluating multimedia-learning tools
based on authentic research data that teach Biology concepts and environmental stewardship.
High school science teachers and students need interactive, multimedia research-based learning
objects that (a) support standards-based teaching, (b) enforce complex thinking and problem
solving, (c) embrace research skills, (d) include appropriate assessments to measure student
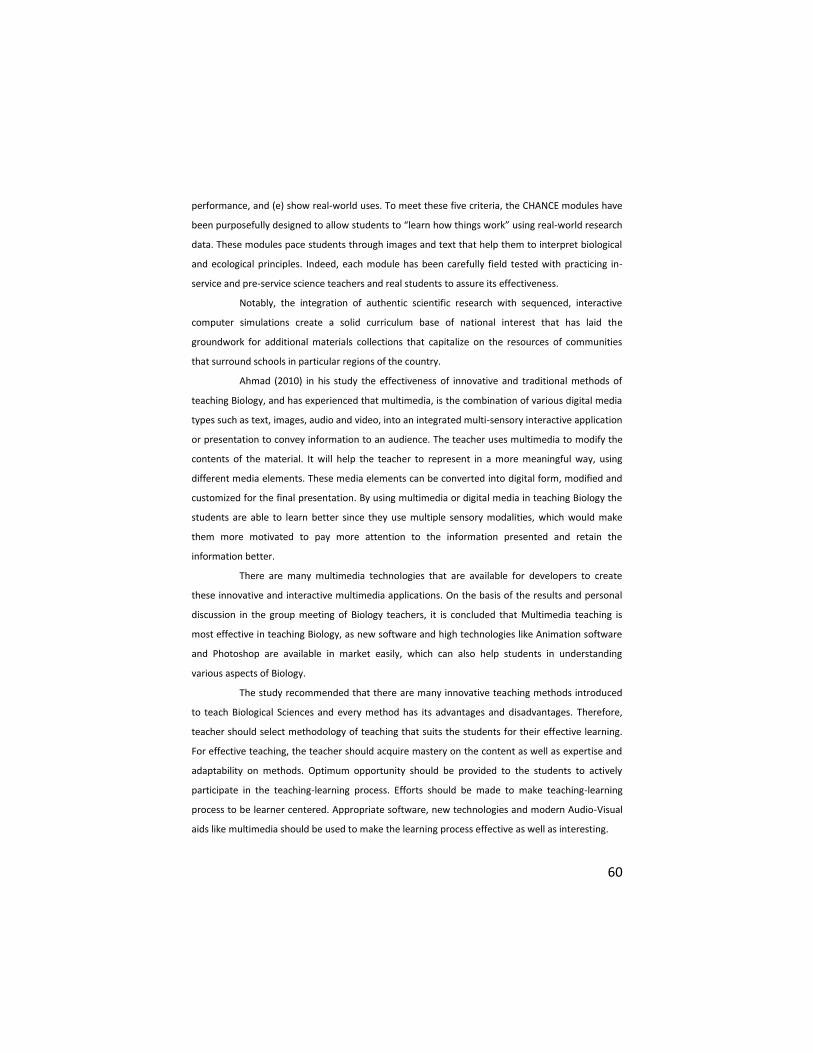
60
performance, and (e) show real-world uses. To meet these five criteria, the CHANCE modules have
been purposefully designed to allow students to “learn how things work” using real-world research
data. These modules pace students through images and text that help them to interpret biological
and ecological principles. Indeed, each module has been carefully field tested with practicing in-
service and pre-service science teachers and real students to assure its effectiveness.
Notably, the integration of authentic scientific research with sequenced, interactive
computer simulations create a solid curriculum base of national interest that has laid the
groundwork for additional materials collections that capitalize on the resources of communities
that surround schools in particular regions of the country.
Ahmad (2010) in his study the effectiveness of innovative and traditional methods of
teaching Biology, and has experienced that multimedia, is the combination of various digital media
types such as text, images, audio and video, into an integrated multi-sensory interactive application
or presentation to convey information to an audience. The teacher uses multimedia to modify the
contents of the material. It will help the teacher to represent in a more meaningful way, using
different media elements. These media elements can be converted into digital form, modified and
customized for the final presentation. By using multimedia or digital media in teaching Biology the
students are able to learn better since they use multiple sensory modalities, which would make
them more motivated to pay more attention to the information presented and retain the
information better.
There are many multimedia technologies that are available for developers to create
these innovative and interactive multimedia applications. On the basis of the results and personal
discussion in the group meeting of Biology teachers, it is concluded that Multimedia teaching is
most effective in teaching Biology, as new software and high technologies like Animation software
and Photoshop are available in market easily, which can also help students in understanding
various aspects of Biology.
The study recommended that there are many innovative teaching methods introduced
to teach Biological Sciences and every method has its advantages and disadvantages. Therefore,
teacher should select methodology of teaching that suits the students for their effective learning.
For effective teaching, the teacher should acquire mastery on the content as well as expertise and
adaptability on methods. Optimum opportunity should be provided to the students to actively
participate in the teaching-learning process. Efforts should be made to make teaching-learning
process to be learner centered. Appropriate software, new technologies and modern Audio-Visual
aids like multimedia should be used to make the learning process effective as well as interesting.
61
Sangodoyin (2010) studied computer animation and the academic achievement of
Nigerian senior secondary school students in Biology. This study investigated the effects of
computer animation on the academic achievement of Nigerian senior secondary school students in
Biology. The moderating effects of mental ability and gender were also investigated. The pre-test
and post-test, control group, quasi-experimental design with a 2x2x2 factorial matrix was adopted
for the study. One hundred and eighty-nine senior secondary school Year II Biology students from
two randomly selected Federal Government Colleges in two states in Southwestern Nigeria were
the participants. Findings show that there is a significant main effect of treatment on students’
achievement in Biology. The computer animation was effective in improving students’ achievement
therefore, computer animation is recommended as a means of teaching Biology to students in
Nigerian secondary schools.
According to Ali (2004), the significant role of technology in teaching and learning is
limited as an instructional delivery medium and not a key determinant of learning. It can only
support the classroom learning.
Thus, there is empirical evidence to suggest both the positive and negative effects of
multimedia. The key is to analyze these findings and find out the precise reasons and the situations
in which multimedia is useful and in which it is not. While Multimedia seems to be improving the
learning rate, it is not a universal fact. In the next section contains discussion on the main
conditions in which multimedia would be useful.
Today’s teachers are concerned with how to use technology to enhance and enrich their
learning environment. According to Cline, the role of technology in the classroom is not to replace
traditional educational methods, it does act as an enhancement for teaching students to think
critically, communicate creatively and solve problems in analytical way.
Students can learn “from” computers – where technology is used essentially as tutors
and serves to increase students basic skills and knowledge; and can learn “with” computers- where
technology is used as a tool that can be applied to a variety of goals in the learning process and can
serve as a resource to help develop higher order thinking, creativity and research skills.
2.6 Conclusion
Biology occupies a unique position in the school curriculum. Biology is central to many science
related courses such as medicine, pharmacy, agriculture, nursing, biochemistry, and genetics and
so on. It is obvious that no student intending to study these disciplines can do without Biology.
These factors, among others, have drawn attention of researchers and curriculum planners
towards Biology as a subject in the school curriculum (Kareem, 2003). In spite of the importance
62
and popularity of Biology among students, performance at senior secondary school level had been
poor (Ahmed, 2008). The desire to know the causes of the poor performance in Biology has been
the focus of researchers for some time now.
It has been observed that poor performance in the sciences is caused by the poor
quality of teaching strategies and science teachers, overcrowded classrooms, and lack of suitable
and adequate science equipment, among others (Abdullahi, 1982; Bajah, 1979; Kareem, 2003;
Ogunniyi, 1979). Students perform poorly in Biology because the Biology classes are usually too
large and heterogeneous in terms of ability level. In addition, the laboratories are ill-equipped and
the Biology syllabus is over loaded (Ahmed, 2008; Ajayi, 1998).
As multimedia teaching technologies become more widely advocated and employed in
education, researchers strive to understand the influence of such technologies on student learning.
Advances in technology enable pedagogical enhancements that some believe can revolutionize
traditional methods of teaching and learning (Gatlin-Watts, Arn, Kordsmeier, 1999; Persin, 2002).
Studies of multimedia-based instruction report a variety of outcomes (Cabrero, Rodriguez-Conde,
Juanes, and Cabrero, 2005; Dimitrov, McGee, and Howard, 2002; Everhart, Harshaw, Everhart,
Kernodle, and Stubblefield, 2002; Feeg, Bashatah, and Langley, 2005; Homer et al., 2000; Kealy,
2003; Liao, 1999; Mayer, 1997; McKethan and Everhart, 2001; Moreno and Valdez, 2005; Neuhoff,
2000; Smith, 1997; Smith and Woody, 2000; Sneddon, Settle, and Triggs, 2001; Trindade, Fiolhais,
and Almeida, 2002; Welsh, 1993). When viewed collectively, these studies reported that advanced
technologies, especially multimedia instruction, which often involves introducing or enhancing the
visual aspects of the presentation of course contents, created an active learning environment,
improved students' performance, fostered positive attitudes toward learning complex concepts,
increased communication, and could be adapted to all learning styles and levels of instruction
(Harris, 2002).
Researchers suggest that, compared to classes with a traditional teacher-leading
approach, those using multimedia are better liked by students and yield slight but statistically
significant improvements in student learning as measured by both student self-report and
objective outcome testing (Dimitrov et al.; Feeg et al.; Mayer, 1997; McKethan and Everhart;
Moreno and Valdez; Sneddon et al., 2001; Worthington, Welsh, Archer, Mindes, and Forsyth,
1996). Such encouraging findings have precipitated the adoption of these technologies on a
widespread basis. Despite many studies suggesting that multimedia instruction benefits students,
there are also some that found no significant differences between multimedia classes and
traditional classes (Everhart et al., 2002; Homer et al., 2000; Lee, et al., 1996; Stoloff, 1995).
63
Therefore, there is a need to further educators' understanding of the effect of multimedia
technologies on students' learning quality.
Thus to ascertain the effectiveness of Multimedia it would be reasonable to compare it
with classroom instruction. A number of studies (cited in Najjar, 1996) have been conducted in the
area to ascertain the effectiveness of multimedia instruction. Analysis has been done by Bosco,
1986; Fletcher, 1989, 1990; Khalili and Shashaani, 1994; Kulik, Bangert, and Williams, 1983; Kulik,
Kulik, and Bangert-Drowns, 1985; Kulik, Kulik, and Cohen, 1980; Kulik, Kulik, and Schwalb, 1986;
Schmidt, Weinstein and Niemic, and Walberg, 1985 by examining 200 over studies. The information
included sciences, foreign languages and electronics. The control group normally learnt the
information via classroom or lecture combined with hands-on experiments. The comparison group
learnt information via interactive videodiscs or computer based instruction. The achievement of
learning was measured via tests taken at the end of the lessons. Over this wide range of students,
meta-analysis found that learning was higher when computer-based education was used. Learning
also appeared to take less time when multimedia instruction was used.
64
Multimedia
3.0 Multimedia Development
3.1.1 Introduction to Multimedia
This section introduces the fundamental concepts of multimedia. Multimedia is any combination of
text, graphic art, sound, animation, and video delivered to us by computer. The explosive growth of
the Internet is the most exciting development for multimedia since the introduction of CD-ROM. In
this section, we will try to discuss the definition of multimedia, the uses of multimedia and
different areas and what we need to develop a multimedia project.
3.1.2 What is Multimedia?
Strictly speaking, Multimedia refers to the combined use of text, graphics, animation, sound and
video to present information to the user via the computer. Another definition says multimedia is
any combination of text, graphics art, animation, audio and video. Multi is due to usage of more
than one media - multimedia. Although five to six separate media type are identified, many
packages on multimedia use two or three of the above components. This is either because the use
of all the media types simply is not appropriate to the information being conveyed, or because the
means of delivery of the package prevents some media being used.
3.1.2.1 Some more Quotations
Some of the quotations about the multimedia concept are as follows:
"Multimedia excites eyes, ears, fingertips and most importantly the head"
"Dazzling pictures and animations engaging sound compelling video clips-we can
electrify the thought and action centers of people minds"
"To use technology and imagination to gain, empowerment and freedom for ideas"
"Definition of multimedia is a simple one, making it works can be complicated"
3.1.2.2 Multimedia gives us
The usage of multimedia gives us the following ideas
• To know how to use text and fonts
• To know how to make and edit colorful graphic images
3
65
• To know how to record and edit digital sound
• To know how to animate graphic images and played back
• To know how to store video clips and played back into movies
3.1.2.3 Multimedia definitions
Multimedia is woven combination of text, graphic art, sound, animation and video elements. When
we allow an end user - the viewers of a multimedia project to control what elements are delivered
and when, it is interactive multimedia.
When we provide a structure of linked elements through which the user can navigate,
interactive multimedia becomes hypermedia. As already we know, the definition of multimedia is a
simple one, making it works can be complicated. Not only do we need to understand how to make
each multimedia element stand up and work, but we also need to know how to use multimedia
computer tools and technologies and weave them together.
The people who weave multimedia into meaningful tapestries are called multimedia
developers. The software, the messages, and the content presented on a computer together
constitute a multimedia project. If the project will be shipped or sold to consumers or end users,
typically in a box or sleeve, with or without instructions, it is a multimedia title.
A multimedia project need not be interactive to be called multimedia; users can sit back
and watch it just as they do a movie or the television. In such cases, the project is linear, starting at
a beginning and running through to an end. When the users are given navigational control and can
wonder through the content at will, multimedia becomes nonlinear and interactive, and a very
powerful personal gateway to information.
Multimedia elements are typically sewn together into a project using authoring tools.
These software tools are designed to manage individual multimedia elements and provide user
interaction. In addition to providing a method for users to interact with the project, most authoring
tools also offers facilities for creating and editing text and images. Sounds and movies are usually
created with editing tools dedicated to these media, and then the elements are imported into the
authoring system for playback and how it is presented to the viewer is the human interface. This
interface is just as much the rules for what happens to the user's input as it is the actual graphics
on the screen. The hardware and software that govern the limits of what can happen are the
multimedia platform or environment.
66
3.1.2.4 Medium
Medium is very important as we are discussing about multimedia concepts. Media refers to the
types of information or types of information carriers. In general, one describes medium as a means
for distribution and presentation of information. Examples of medium are alphanumeric data,
images, audio, and video.
There are many ways to classify media. Common classifications are based on physical
formats and media relationships with time, and different criteria like perception, representation,
presentation, storage, transmission, and information exchange.
3.1.2.4.1 Types of medium
Under the classification of physical formats and media relationship with time, the media is
classified based on whether there is a time dimension to the media. Under this classification, there
are two classes of med static and dynamic (or time continuous)
Static media do not have a time dimension, and their contents and meanings do not
depend on the presentation time. Static media is also called discrete media. Static media include
alphanumeric data, graphics and still images.
Dynamic media have a time dimension, and their meanings and correctness depend on
the rate at which they are presented. Dynamic media include animation, audio, and video. These
media have their intrinsic unit interval or rate. For example, to have a perceptually smooth
movement, video must be played back at 25 frames per second, sometimes 30 frames per second,
depending on the video system used. Similarly, where we play back a recorded voice message or
music, only one playback rate is natural or sensible. Play back at a slower or faster rate distorts the
meaning or the quality of the sound. Because these media must be played back continuously at a
fixed rate, they are often called continuous media. They are also called isochronous media because
of the fixed relationship between each media unit and time.
3.1.2.4.2 Classification of medium on different criteria
As we have already discussed the media can also be classified with respect to different criteria like
perception, representation, presentation, storage, transmission, and information exchange.
The perception medium: Perception media help humans to sense their environment.
The perception of information occurs mostly through seeing or hearing the information. There is a
primary difference between seeing and hearing information when using a computer. For the
perception of information through seeing, the visual media such as text, image and video are used.
67
For the perception of information through hearing, auditory media such as music, noise, and
speech are relevant.
The representation medium: Representation media are characterized by internal
computer representations of information. The various formats are used to represent media
information in a computer. For example
• A text character is coded in ASCII or EBCDIC code.
• Graphics are coded according to standard GKS (graphics kernel system)
• An audio stream can be represented using a simple PCM (pulse coding method) with a
linear quantization of 16 bits per sample.
• An image can be coded in JPEG or GIF format.
• A combined audio/video sequence can be coded in different TV standard formats, and
stored in the computer using an MPEG format.
The presentation medium: Presentation media refer to the tools and devices for the
input and output of information. The media like paper, screen, and speaker are used to deliver the
information by the computer (output media), keyboard, mouse, camera and microphone are the
input media.
The storage medium: Storage media refer to a data carrier which enables storage of
information. The various media's are microfilm; floppy disk, hard disk, and CD ROM’s are examples
of storage media.
The transmission medium: The transmission medium characterizes different information
carriers that enable continuous data transmission. The media's used for transmitting information
are, over networks, which use wire and cable for transmission, such as coaxial cable and fiber
optics, as well as free air space transmission, which is used for wireless traffic.
The information exchange medium: The information exchange medium includes all
information carriers for transmission, i.e., all storage and transmission media. Here the
information exchange can be done through intermediate storage media, where the storage
medium is transported outside the computer networks to the destination, through direct
transmission using computer networks, or through combined usage of storage and transmission
media (example is electronic mailing system).
3.1.2.5 Main properties of Multimedia system
Already we know multimedia system is any system which supports more than a single kind of
media. Not only text and graphics there are several other Medias like animation, sound and video.
68
A multimedia system uses all these different Medias in any combination. A multimedia system
distinguishes itself from other systems through several properties. The properties are:
Combination of media
Not every arbitrary combination of media justifies the usage of the term multimedia. A simple text
processing program with incorporated images is often called a multimedia application because two
media are processed through one program. But one should talk about multimedia only when both
continuous and discrete media are utilized. A text processing program with incorporated images is
therefore not a multimedia application.
Independence
An important aspect of different media is their level of independence from each other. In general,
there is a request for independence of different media, but multimedia may require several levels
of independence. The media are dependent or independent depends on application. For example,
video recorder stores audio and video information, but there is an inherently tight connection
between the two type of media.
Computer supported integration
The multimedia system should support all media that we are using and should provide the
possibility of combining media in arbitrary forms. Therefore, we must emphasize on the term
integrated multimedia system. Simply say, in such systems, everything can be presented with video
and sound that is presented with text and graphics today. For example in conventional systems, a
text message can be sent to the other users, but, a multimedia system with a high level of
integration allows this function also for audio messages or even for a combination of audio and
text.
Communication systems
Communication capable multimedia systems must be approached. A reason for this is that most of
today's computers are interconnected, considering multimedia functions from only the local
processing viewpoint would be a restriction. Another reason is that distributed environments
enable particularly interesting multimedia applications. Here multimedia information cannot only
be created, processed, presented and stored, but also be distributed above the single computer’s
boundary.
3.1.2.6 Classes of multimedia system
Multimedia systems are classified into stand alone and distributed systems.
Standalone systems use dedicated system resources. The amount of multimedia
information may be limited and multimedia data communications is not supported.
69
Distributed systems share both system resources and information resources and can
support communication among users. Distributed systems can be further classified into four basic
classes.
Conversational services: Conversational services imply interaction between a human
user and another human user or a system. This class includes interpersonal services such as video
conference and video phony. It also includes services such as telesurveillance and teleshopping.
Messaging services
Messaging services cover the asynchronous exchange of multimedia data through electronic mail
boxes.
Retrieval services
Retrieval services cover all types of access to multimedia information severs. Typically, the user
sends a request to the server and the requested information is delivered to the user in real time.
VOD (Video on Demand) is an example of these services.
Distribution services
Distribution services cover services where the information is distributed on the initiative of a
server. An example of these services is TV program broad cast. They require real time multimedia
data transmission in only one direction.
3.1.3 Where to use Multimedia
Multimedia finds place in lot of applications. Multimedia is appropriate whenever a human
interface connects a person to electronic information of any kind. Multimedia enhances traditional
text only computer interfaces and yields measurable benefit be gaining and holding attention and
interest. Multimedia improves information retention. When properly woven, multimedia can also
be profoundly entertaining.
Multimedia finds place in:
• Business
• Schools
• Home
• Public places and
• Virtual reality
Some more applications of multimedia are
• Video/Movie on demand (VOD)
• Information on demand
• Telemedicine
70
• Video phone and Video conference
• Co-operative work
3.1.3.1 Multimedia in Business
Business applications for multimedia include presentations, training, marketing, advertising,
product demos, databases, catalogues and networked communications. Voices mail and video
conferencing are also provided on many local and wide area networks.
When presentations are made, the most presentation software packages have facility to
add audio and video clips to the usual "slide show" of graphics and text material.
Multimedia in training has become wide spread. Flight attendants learn to manage
international terrorism and security through simulation. Mechanics learn to repair engines.
Salesman learns about their products. Multimedia around the office has become more common
place. Video conferencing is common.
3.1.3.2 Multimedia in schools
Schools are perhaps the neediest destination for multimedia. Traditional teaching methods are
changed. Teachers are becoming more like guides and mentors along a learning path, not the
primary providers of information and understanding- the students, not teachers , become the
core of the teaching and learning process.
Various advanced electronic teaching tools are designed and developed due to
multimedia.
3.1.3.3 Multimedia at Home
Most multimedia projects will reach at home via television sets or monitors with built in
interactive user inputs. Users at home will download number of new games, catalog of treks, trips
and safaris to destination around the world.
3.1.3.4 Multimedia in Public places
In Hotels, train stations, shopping malls, museums, and grocery stores, multimedia are becoming
available at stand-alone terminals or kiosks to provide information and help. Such installations
reduce demand on traditional information booths and personnel, add value, and they can work
round the clock, even in the middle of the night, when live help is off-duty.
71
A supermarket kiosk provides a menu screen which shows services ranging from meal
planning to coupons. Hotel kiosks list nearby restaurants, maps of the city, airline schedules, and
provide guest services such as automated checkout. Printers are often attached so users can walk
away with a printed copy of the information. Museum kiosks allow visitors to browse through richly
detailed information specific to that display.
3.1.3.5 Virtual reality
At the convergence of technology and creative invention in multimedia is virtual reality - VR.
Goggles, helmets, special gloves, and bizarre human interfaces attempt to place us "inside" a life
like experience.
Using high speed dedicated computers, multi-million-dollars flight simulators built by
companies helps making dry runs before doing the real thing. Merchant marine officer training
schools, computer controlled simulators teach the intricate loading and unloading of oil tankers
and container ships.
Specialized public game arcades have been built recently to offer VR combat and flying experiences
for a price.
3.1.3.6 Video/Movie on demand
Currently, we watch TV Programs and movies passively, we cannot control the time we want to
watch them. Video /Movie on demand services are being developed to overcome these limitations
and provide other capabilities. In VOD, large collections of video are stored on video servers. Users
or clients access these videos through a network.
Distinct features of VOD are:
• We do not have to leave home to watch our favorite video. Our "advanced television" is
connected to video services through an advanced network. All we need to do is to dial a number
and select the video through a user-friendly menu on the TV screen.
• Because video servers are centralized and provide services to large populations, their
collections are large and updated. If one Video server does not have the video we want, it may
refer us to some other servers that likely hold the video. In theory, we can watch what we want
without leaving home; Further, many users can view the same video without user knows.
• We can watch our favorite video or movies anytime we want
• We can pause, and fast-forward and backward, we may be able to search for a
particular scene.
72
• We have guaranteed high quality because video is stored in digital form. The quality will
not degrade with increased viewing.
3.1.3.7 Information on demand (IOD)
A similar system to VOD is information on demand (IOD). The major difference is that IOD stores
other types of information as well as video. To users, it is a large versatile library. The most
important ability of the system is indexing and searching vast amounts of multimedia information.
I OD systems have many applications including.
• Acting as a general encyclopedia of information.
• Providing newspaper and magazine online service.
• Providing home shopping service - one can view the product and service on the screen
and order goods and services without leaving home.
• Providing current information on weather, public transport time tables, and the like
online.
The World Wide Web (WWW) can be seen as a primitive IOD system.
3.1.3.8 Telemedicine
Telemedicine is another important multimedia application, especially in emergency cases and
remote locations. In telemedicine, all patient records are stored electronically. Medical institutions
and equipment are connected through a multimedia network. Telemedicine provides the following
• Instant consultation with remote medical experts using high quality audio and video.
• Access to patients’ records anywhere and anytime by medical personnel in case of
emergency.
• World wide access of information such as availability of and need for a special type of
blood or organs.
3.1.3.9 Video phone and Video conference
Video phone and video conference systems allow dispersed users to carry out effective
communication through audio and video transmission. Most current video conference systems use
dedicated specific machines and circuit - switched networks. They are expensive and not easily
available.
Videophones will be as common as current phones. People will be able to see each other while
they talk on the phone.
73
3.1.3.10 Co-operative work
A sophisticated videoconference system will support co-operative work. People far apart will be
able to work on the same project through transparent multimedia information transmission among
them. They will be able to access multimedia databases and other resources easily. This is an
ultimate goal of computer supported co-operative work (CSCW)
3.1.4 What we need?
We need, hardware, software, and good ideas to make multimedia. To make good multimedia, we
need talent and skill, we also need to stay organized, as the multimedia project goes
underway.
3.1.4.1 Hardware
The personal computers what we are using for general purpose applications does not support
multimedia applications. Multimedia computers require some minimal specifications to work.
Those computers which supports multimedia applications are called the multimedia PC
platform, in short MPC. The MPC computer is not a hardware unit per se, but rather a standard
that includes minimum specifications to turn Intel - microprocessor based computers into
multimedia computers. In fact, there are currently three MPC standards, MPC level 1, MPC level 2
and MPC level 3. MPC level 1 and MPC level 2 are not much in use or obsolete.
Here are the MPC level three specifications, which is necessary to run multimedia
applications:
Microprocessor: CPU must pass MPC test suite bench marked on a 75 MHz Pentium
processor.
Ram: Minimum of 8 MB
Hard drive: Minimum of 540 MB
CD-ROM Drive: A sustained transfer rate of 600K per second (quad speed), average
access time of 250 ms, CD-ROM XA ready, multi session capable.
Audio: 16-bit digital sound, wave table, MIDI plays back, speakers tested at minimum of
3 watts/channel.
Graphics performance: Color space conversion and scaling capability, direct access to
frame buffer for video enabled graphics subsystem with a resolution of 352x240 at
30 fps (or 352x288 at 25 fps) at 15 bits/pixel, without cropping.
Video Playback: Hardware and software support for MPEG1.
74
User input: 101 key IBM style keyboard or keyboard that delivers same functionality,
two button mouse, MIDI, joystick, serial, parallel ports.
System software: Windows 3.11, Windows 95 onwards.
3.1.4.2 Software
The basic tool set for building multimedia projects contains one or more authoring systems and
various editing applications for text, images, sounds, and motion video. A few additional
applications are also useful for capturing images from the screen, translating file formats, and
moving files among computers. The different authoring tools (software) required for multimedia
applications are as follows:
a. Painting and Drawing tools
b. 3-D modeling and animation tools
c. Image editing tools
d. Sound editing programs
e. Animation, Video and digital movies
3.1.4.3 Creativity
Before coming up with a multimedia project, we must first develop a sense of its scope and
content. The project should take shape in our head and we should think through how to put it for
viewers. It is very difficult to learn creativity, the better we the medium, the better able we are to
express our creativity. For multimedia, this means we need to know our hardware and software
first.
3.1.4.4 Organization
It’s essential that we develop an organized outline and a plan of our project that rationally details
the skills, time, budget, tools and resources at hand. These should be in place before we start to
use graphics, sounds, and other components, and they should continue to be monitored
throughout the project’s execution.
3.1.5 Why digital representation?
Multimedia uses digital computer. All building blocks of multimedia are represented in digital form.
There are number of advantages for representing in digital form. The following are the advantages
for using all digital representation.
First, Computer systems that we are using for multimedia only handle digital data.
When they are in digital form, images, audio, and video can be easily handled (processing,
75
transmission and presentation) by computer systems. Digital multimedia data can easily be
integrated with other data type and they can share the common computing resources and
networks. In other words, when all the media are represented in digital form, we can use the same
storage, computers, and networks to handle all media types.
Second, it is easier to interact with digital media by using a computer system.
Third, if communications security is required, it is easier to encrypt digital signals than to
encrypt analog signals.
The final advantage is that the digital system is more reliable. Digital representation is
more tolerable to noise than its analog counterpart. In analog form, signal amplitude is continuous
within a certain range - the signal value is changed if there is noise or interference. The error
caused by noise or interference is cumulative from one stage of process to another. There is no
way to correct this type of error. In binary digital form, there are only two signal levels High (1) and
Low (0). If the error caused by interference or noise is below a certain threshold (say half the signal
magnitude), the signal can still be recognized correctly. Furthermore, at each stage of digital
processing or transmission, the 'clean' digital signals are reconstructed, thus error is not
cumulative.
Because of the error tolerance feature of digital signals, digital systems are more reliable
than analog systems. For the same reason, digital media can be used and copied many times
without losing quality. This can always be illustrated by the following example.
If we do multiple copies of an analog audio tape from A to B, B to C, C to D, D to E, and E
to F, then the audio quality stored on tapes decreases in the order A,B,C,D,E and F. If the copying
process continuous the accumulated noise or error will eventually be stronger than the audio signal
and the audio signal will be lost in noise. But if data on a computer disk are copied in the similar
process, correct data will remain no matter how many times the data are copied, provided the
disks are not physically damaged.
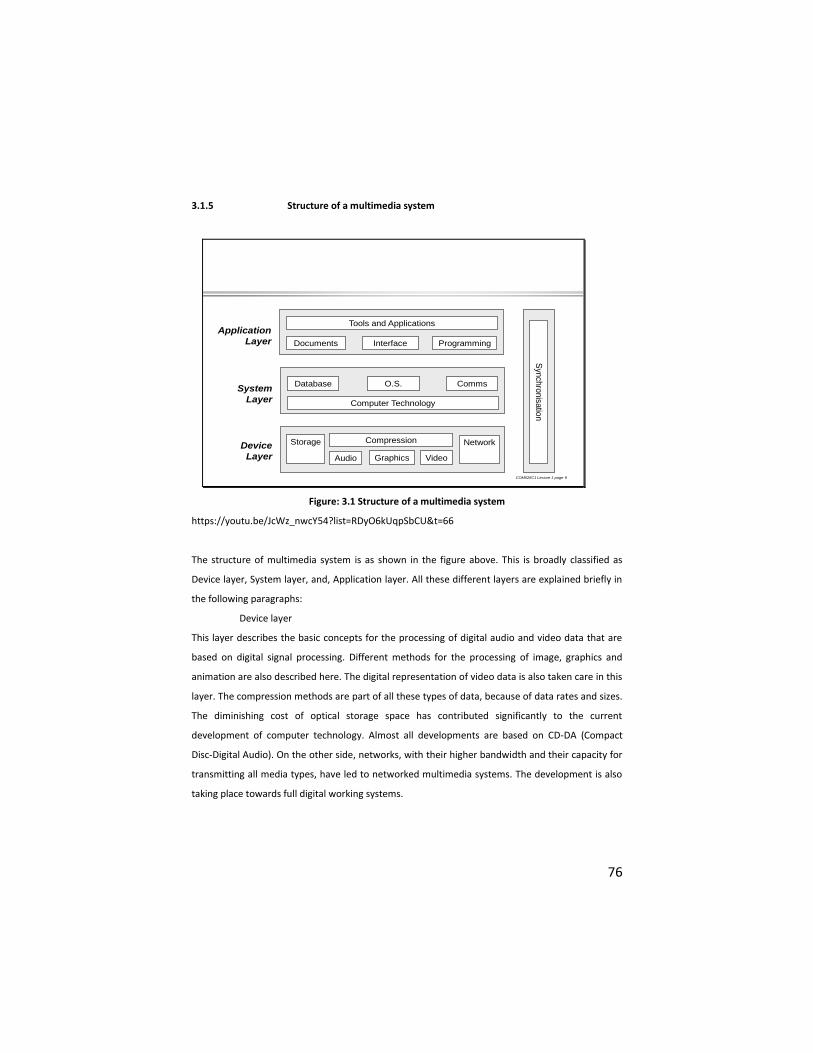
76
3.1.5 Structure of a multimedia system
COM526C1 Lecture 1 page 9
Storage Network
Audio Graphics Video
Compression
Computer Technology
Database O.S. Comms
Tools and Applications
Documents Interface Programming
Application
Layer
System
Layer
Device
Layer
Syn
chro
nis
atio
n
Figure: 3.1 Structure of a multimedia system
https://youtu.be/JcWz_nwcY54?list=RDyO6kUqpSbCU&t=66
The structure of multimedia system is as shown in the figure above. This is broadly classified as
Device layer, System layer, and, Application layer. All these different layers are explained briefly in
the following paragraphs:
Device layer
This layer describes the basic concepts for the processing of digital audio and video data that are
based on digital signal processing. Different methods for the processing of image, graphics and
animation are also described here. The digital representation of video data is also taken care in this
layer. The compression methods are part of all these types of data, because of data rates and sizes.
The diminishing cost of optical storage space has contributed significantly to the current
development of computer technology. Almost all developments are based on CD-DA (Compact
Disc-Digital Audio). On the other side, networks, with their higher bandwidth and their capacity for
transmitting all media types, have led to networked multimedia systems. The development is also
taking place towards full digital working systems.
77
System layer
The interface between the device layer and the system layer is specified by the computer
technology. To utilize the device layer, several system services are required. Three such services
exist. These services are mostly implemented in software.
• The operating system serves as an interface between computer hardware/system
software and all other software components. It provides the user with a programming and
computational environment, which should be easy to operate. In its function as an interface, the
operating system provides different services that relate to the computer resources, such as:
processor, main memory, secondary memory, input and output devices and network
• The database system allows a an access to the data stored and a management of large
databases
• The communication system is responsible for data transmission according to the timing
and reliability requirements of the networked multimedia application.
Application layer
The services of the system layer are offered to the application layer through proper programming
abstractions. Application layer is also capable of handling documents, a document consists of a set
of structured information, represented in different media, and generated or recorded at the time
of presentation. Many functions of document handling and other applications are accessible and
presented to the user through a user interface.
3.2.0 Multimedia Hardware and Software
3.2.1 Introduction
All the physical components of the computer we are using are nothing but hardware. Lot of
hardware components are required to develop a multimedia project. If we are using content such
as sound effects, music, graphic art, animation, video clippings, we need to have different
hardware components for all these things. Multimedia products depend on the ability of a
computer to capture, process, and present text, pictures, audio and video. This means that the
hardware requirements for multimedia are quite specific and demanding. A multimedia capable
computer requires CPU, Monitor, Video grabbing card, Sound card, CD-ROM drive, Scanner and
touchscreen (optional). The basic tool set for building multimedia projects contains one or more
authoring systems and various editing applications for text, images, sounds, and motion video. The
tools are used for creating and editing multimedia elements on computers, they do paint and
image processing, image editing, drawing and illustration, 3-D and CAD, OCR and text editing,
78
sound recording and editing, video and movie-making, and various housekeeping tasks. We are
trying to give the concept of all these as a part of this unit.
3.2.2 Multimedia Hardware Components
All the physical components of the computer we are using are nothing but hardware. Lot of
hardware components are required to develop a multimedia project. The equipment required for
developing multimedia project will depend on the content of the project as well as its design.
Definitely, we need a fast computer, with lots of RAM and disk storage space. If we are
using content such as sound effects, music, graphic art, animation, video clippings, we need to have
different hardware components for all these things. Multimedia products depend on the ability of a
computer to capture, process, and present text, pictures, audio and video. This means that the
hardware requirements for multimedia are quite specific and demanding. Here we are trying to
describe the hardware components necessary to translate a user's commands, queries, and
responses into computer activity, to deliver and display multimedia project, to store a project and
to use it whenever is required.
3.2.2.1 Memory and Storage Devices
If we add more memory and storage space to our computer, we can always expect more
computing needs. If we want to estimate the memory requirements of a multimedia project, like,
the space required on a floppy disk, hard disk, or the latest CD-ROM, we must know the multimedia
projects content and scope. The RAM (random access memory) is also important. Text, graphics,
color images, sound files, animation files, video clips, and the programming code required to have
all of these together. If we are making multimedia, we will also need to allocate memory for storing
and archiving files used during production, original audio and video clips, edited pieces, final mixed
pieces, and memory required for storing the backup files.
3.2.2.2 RAM (Random Access Memory)
If we using the computer to run a small multimedia project, the RAM requirement will be very
limited. That is we can always produce a multimedia project on a slow or limited-memory
computer. On the other hand, if we are trying to keep multiple multimedia applications and files
opened simultaneously, we will need more memory. 16 MB of RAM is sufficient for any multimedia
application. 32 MB of RAM is adequate, but even 64MB and 128 MB systems are becoming more
common because while digitizing audio or video, we can store much more data much more quickly
in RAM. Most of the multimedia software's can quickly use the available RAM space. For example,
79
Microsoft office requires at least 16 MB of RAM. Photoshop requires 5MB Minimum, 20 MB is
recommended. PageMaker requires at least 8 MB. More the RAM we use more will be the
response from the system. Faster copying/pasting of large graphics, audio and video files are
possible.
3.2.2.3 Floppy Disks and Hard Disks
Large and adequate storage space required for any multimedia application can always be provided
by using, large capacity hard disks, removable cartridges, optical media, CDR (compact disk-
recordable), tape, floppy disks or any combination of the above devices. Removable media like,
diskettes, hard disks, and cartridges, are easy to handle, all these fits into a small cover. Floppy
disks and hard disks are mass storage devices for binary data, data that can be easily read by the
computer. Hard disks can contain more information than the floppy disks and are able to operate
far greater data transfer rates. Hard disks of the capacity 10GB, 20 GB are available. The floppy
disks are of limited capacity with 5.25 inch and 3.5 inch is available. The 3.5 inch floppy disk are
becoming the industry standard now a days.
A floppy disk is made of flexible Mylar plastic coated with a very thin layer of special
magnetic material. A hard disk is actually a stack of hard metal platters coated with magnetically-
sensitive material, with a series of recording heads or sensors that touches a hairbreadths above
the fast spinning surface, magnetizing or de-magnetizing spots along formatted tracks using
technology similar to that used by floppy disks. The similar technology is also used in audio and
video recording. Hard disks are most commonly used mass-storage device used by the computers.
For any multimedia application, we need to have one more large-capacity hard disk drives.
Now a day as multimedia has reached the user’s desktops, hard disks with large capacity
are more common to find. Hard disks manufacturers are also selling millions of units of hard disks.
3.2.2.4 Input Devices
A great variety of input devices-from the familiar keyboard and handy mouse to touchscreens to
voice recognition setups-can is used for development and delivery of a multimedia Application. If
we are designing our project for a public kiosk, use a touchscreen. If our project is for a lecturing
professor who likes to wander about the classroom, use a remote hand-held mouse. Consider a
pressure-sensitive styles and a drawing tablet, if we create a great deal of original computer-
rendered art.
List of input devices - include but not necessarily limited to the following:
• Keyboards
80
• Mouse - also, track balls, joysticks and similar devices
• Graphic tablets (using a pen device for drawing and painting applications)
• Scanner
• Digital camera (still and video)
• Touch screens where keyboards are not practical or desirable
• Analog audio input from microphones and audio players
• Analog video input from video tapes
• Modem
• Voice recognition systems with specialized microphones
Keyboards
A keyboard is the most common method of interaction with a computer. Keyboards provide
various tactile responses and they have various layouts depending upon our computer system and
keyboard model. Keyboards are typically rated for at least 50 million cycles (the number of times a
key can be pressed before it might suffer breakdown). The most common keyboard for PCs is the
101 style (which provides 101 keys, although many styles are available with more or four special
keys, LED's, and other features, such as a plastic membrane cover for industrial or food service
applications.
Mouse
A mouse is the standard tool for interacting with a graphical user interface (GUI). All personal
computers require a mouse, as point-and-click device. Windows environment accepts keyboard
entry in lieu of mouse point-and-click actions, our multimedia projects should typically be designed
with the mouse or touch-screen in mind. The buttons on the mouse provide additional user input,
such as pointing and double-clicking to open a document, or the click-and-drag operation, in which
the mouse button is pressed and held drown to drag (move) an object or to move to and select an
item on a pull-down menu. We have mouse with two buttons as well as three buttons. Any of them
can be used depending on requirement.
Trackballs
Trackballs are similar to mice, except that the cursor is moved by using one or more fingers to roll
across the top of the ball. The trackball does not need the flat space required by a mouse; this is
important in small confined environments and for portable laptop computers. Trackballs have at
least two buttons: one for the user to click or double-click, and the other to provide the press-and-
hold condition necessary to select from menus and drag objects.
81
Touch screens
Touch screens are monitors that usually have a textured coating across the glass face. This coating
is sensitive to pressure and registers the location of the user's finger when it touches the screen.
The TouchMate system actually measures the pitch, roll, and yaw rotation of the monitor when
pressed by a finger, and determines how much force was exerted and the location where the force
was applied, and has no coating. Other touch screens us invisible beams of infrared light that
crisscross the front of the monitor to calculate where a finger was pressed. Pressing twice on the
screen in quick succession simulates the double-click action of a mouse. Touching the screen and
dragging the finger, without lifting it, to another location simulates a mouse click-and-drag. A
keyboard is sometimes simulated using an on-screen representation so users can input names,
numbers, and other text by pressing "keys".
Touch screens are not recommended for day-to-day computer work, but they are
excellent for multimedia applications in a kiosk, at a trade show, or in a museum delivery system-
anything involving public input and simple tasks. When our project is designed to use a touch
screen, the monitor is the only input device required, so we can secure all other system hardware
behind locked doors to prevent theft or tampering.
Magnetic Card Encoders and Readers
Magnetic (mag) card setups are useful when we need an interface for a database application or
multimedia project that tracks users. It requires both a card encoder and a card reader for this type
of interface. The encoder connects to the computer at a serial port and transfers information to a
magnetic strip of tape on the back of the card. A visitor to a museum, for example, could slide an
encoded card through a reader at any exhibit station and be rewarded with personalized or
customized response from an intelligent database or presentation system.
Graphics Tablets
Flat-surface input devices are attached to the computer in the same way as a mouse or trackball. A
special pen is used against the pressure-sensitive surface for the tablet to move the cursor.
Graphics tablets provide substantial control for editing finely detailed graphic elements; a future is
very useful to graphic artists and interface designers. Tablets can also be used as input devices for
end users: we can design a printed graphic, place it on the surface of the tablet, and let users work
with a pen directly on the input surface. On a floor plan, for instance, visitors might draw a track
through the hallways and rooms they wish to see and then receive a printed list of things to note
along the route. Some tablets are pressure-sensitive and are good for drawing: the harder we press
the stylus, for example, the wider or darker the line we draw.
82
Scanners
A scanner is a most useful piece of equipment for producing multimedia applications. Most
commonly available are gray-scale and color flatbed scanners that provide a resolution of 300 or
600 dpi (dots per inch). Hand-held scanners are also available, and can be useful for scanning small
images and columns of text, but they may prove inadequate for multimedia application
development. Scanned images, particularly those at high resolution and in color, demand an
extremely large amount of storage space on hard disk, regardless of which scanner is used. Most of
the scanners offer at least 300 dpi resolution, and most allow user to set the scanning resolution.
Scans helps we to make clear electronic images of existing art work such as photos,
drawings advertisements, and cartoons.
Optical character recognition (OCR) devices
Scanners enable us to use optical character recognition software, to convert printed matter to
ASCII text files in our computer. With OCR software and a scanner, the paper documents can be
converted into a word processing document without retyping a re-keying.
Barcode readers are probably the most familiar optical character recognition devices,
which are in use today in all most all the places, like, markets, shops, libraries and other places.
Using photocells and laser beams, barcode readers recognize the numeric characters of the
Universal Product Code that are printed in a pattern of parallel black bars on merchandise labels.
With OCR or "bar coding", retailers can efficiently process goods in and out of their stores and
maintain better inventory control.
An OCR terminal can be of use to a multimedia application developer because it is a tool
that can not only recognize printed characters, but soon handwriting as well. This facility may be
beneficial at a kiosk or in a general education environment where user friendliness is a goal.
Infrared Remotes
An infrared remote unit lets a user interact with the multimedia project while the user is freely
moving around. Remotes work like mice and trackballs, except they use infrared light to direct the
cursor. Infrared remotes work well for a lecture or other presentation in an auditorium or similar
environment, when the speaker needs to move around the room.
Voice Recognition Systems
Voice recognition systems facilitate hands-free interaction with the multimedia project. These
systems usually provide a unidirectional cardioid, noise-canceling microphone that automatically
filters out background noise. Most of the currently available voice recognition systems can trigger
common menu events such as save, Open, Quit , and, Print and also we can make the system to
83
recognize some commands, which are more useful for us, and specific to the multimedia
application.
Digital cameras
Digital cameras can record up to 50 images on a reusable two-inch floppy disk. Images captured
can be played back directly from the camera to any standard TV monitor or can be used with a
digitizer for computer input. Software controls the image capture, image adjustment, and image
save functions of the digitizer. Once the image is saved in the computer environment, it can easily
be exported to various applications depending on the requirement. The images can be
incorporated into desktop publishing setups, can be used to enhance a database of specific
pictures, are can be added as graphic image to a multimedia presentation.
3.2.2.5 Output Devices
Presentation of the audio and visual components of the multimedia application requires hardware
that may or may not be included with the computer itself. Speakers, amplifiers, monitors, motion
video devices and capable storage systems. The better the equipment, the better the presentation.
There is no greater test of the benefits of these devices without using them. The audio system can
be checked by sending the output to an external amplifier system.
List of output devices - include but not necessarily limited to the following:
• High resolution monitors - the larger the monitor generally the better
• Specialized projection devices to replace or supplement a computer monitor. E.g. A
multimedia projector to project enlarged images for presentations to a group
• Audio output to speakers or to other audio devices such as amplifiers or tape devices
• Video output to monitor or TV
• Modem - output to the web and/or intranets
• Monitors
The monitor, which is to be used for development of multimedia application, depends on its
requirement, and the computer we are using. A wide variety of monitors is available in the market.
High end, large screen graphics monitors are also available, but they are expensive. It is important
to develop the multimedia applications on monitors of the same size and resolution as those to be
used for its delivery.
Projectors
When we want show multimedia application to more number of viewers than on to a single
computer monitor, we need to project it onto a large screen. CRT (Cathode Ray Tube) projectors,
LCD (Liquid crystal display) panels attached to an overhead projector, stand-alone LCD projectors,
84
can be used for this purpose. CRT projectors can be connected to computers. LCD panels can also
be used, by connecting it to computer. These devices help producing large images on to the screen.
Audio devices
All most all the computers of today are equipped with an internal speaker and a dedicated sound
chip, and they are capable of audio output without additional hardware and/or software. It is
always possible to connect external speakers as a part of multimedia device. Digitizing sound on
computer requires an external microphone, and sound editing/recording software such as sound
recorder form Ms-Windows. PCs are not capable of multimedia audio until a sound board is
installed. Multimedia PC (Normally called MPC) computers are configured for sound from start.
Suitable drivers are to be installed for this.
The speakers which are to be used during project's presentation may not be adequate
for its representation. Speakers with built-in amplifiers or attached to an external amplifier are
important when the multimedia project will be presented to a large audience or in a noise
environment.
Video Devices
We can make a good impact on the audience by means of using video. With the video digitizing
installed in our computer, we can display a television picture on the computer monitor. Display of
video on any computer platform requires manipulation of an enormous amount of data. When
used along with videodisc players. Which gives precise control over the images being viewed, video
card place an image into a window on the computer monitor? In windows operating system, video
cards are controlled through the Media Control Interface (MCI).
3.2.3 Modem as a communication device
Modems can be connected to the computer externally (external modem), at the serial port or
internally (internal modem) as a separate board. Modem speed, measured in baud, is the most
important when we buy a modem. The multimedia files which are to be transferred contain the
graphics, audio resources, and, video samples, which are to be moved within short span of time.
Modem is one of the important devices used for communication purpose.
The key for multimedia communications is bandwidth which is the amount of
information that can be transmitted across a network of computers within a fixed period.
Bandwidth is measured in megabits per second (Mbps) for cable connections and bits per second
(bps) for modem connections. A good quality modem will transfer data at 56,000 bps. A good
network setup using quality twisted pair cable can transmit data at 100Mbps.
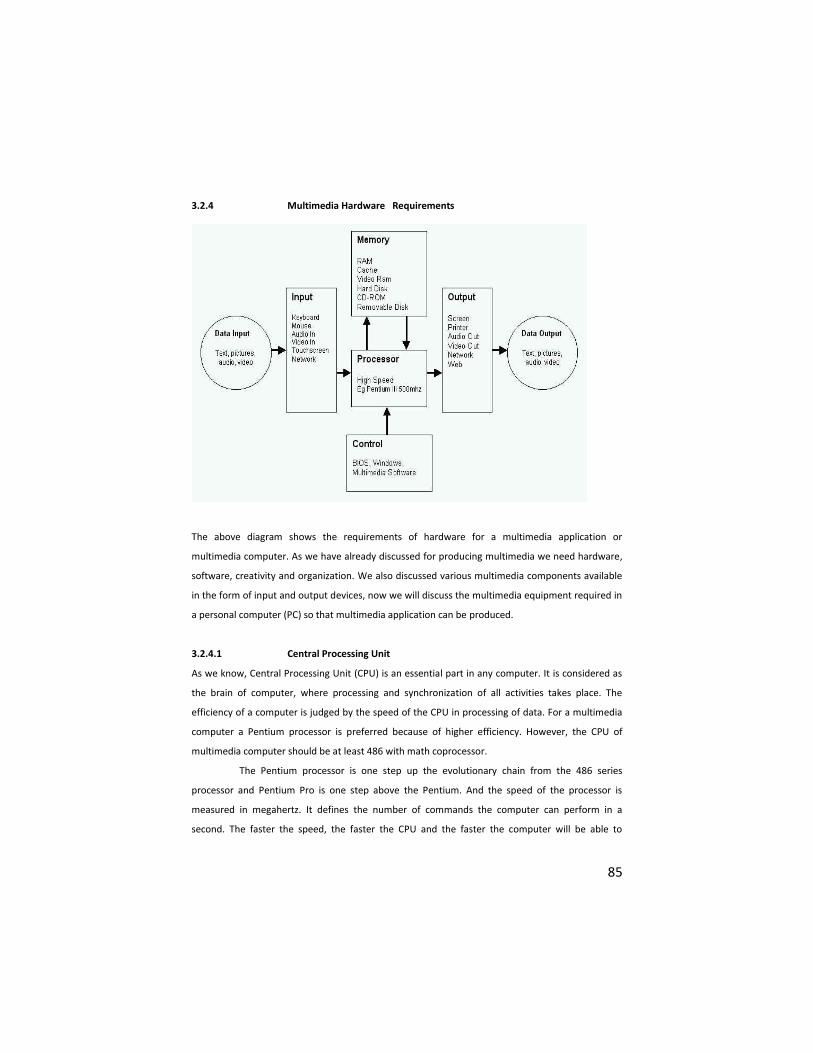
85
3.2.4 Multimedia Hardware Requirements
Figure: 3.2 Multimedia Hardware Components
Figure: 3.2 Multimedia Hardware Components
The above diagram shows the requirements of hardware for a multimedia application or
multimedia computer. As we have already discussed for producing multimedia we need hardware,
software, creativity and organization. We also discussed various multimedia components available
in the form of input and output devices, now we will discuss the multimedia equipment required in
a personal computer (PC) so that multimedia application can be produced.
3.2.4.1 Central Processing Unit
As we know, Central Processing Unit (CPU) is an essential part in any computer. It is considered as
the brain of computer, where processing and synchronization of all activities takes place. The
efficiency of a computer is judged by the speed of the CPU in processing of data. For a multimedia
computer a Pentium processor is preferred because of higher efficiency. However, the CPU of
multimedia computer should be at least 486 with math coprocessor.
The Pentium processor is one step up the evolutionary chain from the 486 series
processor and Pentium Pro is one step above the Pentium. And the speed of the processor is
measured in megahertz. It defines the number of commands the computer can perform in a
second. The faster the speed, the faster the CPU and the faster the computer will be able to
86
perform. As the multimedia involves more than one medial element, including high-resolution
graphics, high quality motion video, and one need a faster processor for better performance.
In today’s scenario, a Pentium processor with MMX technology and a speed of 166 to
200 MHz (Megahertz) is an ideal processor for multimedia. In addition to the processor one will
need a minimum 16 MB RAM to run WINDOWS to edit large images or video clips. But a 32 or 64
MB RAM enhances the capacity of multimedia computer.
3.2.4.2 Monitor
As we know that monitor is used to see the computer output. Generally, it displays 25 rows and 80
columns of text. The text or graphics in a monitor is created because of an arrangement of tiny
dots, called pixels. Resolution is the amount of details the monitor can render. Resolution is
defined in terms of horizontal and vertical pixel (picture elements) displayed on the screen. The
greater the number of pixels, better visualization of the image.
Like any other computer device, monitor requires a source of input. The signals that
monitor gets from the processor are routed through a graphics card. But there are computers
available where this card is in-built into the motherboard. This card is also called the graphics
adapter or display adapter. This card controls the individual pixels or tiny points on a screen that
make up image. There are several types of display adapter available. But the most popular one is
Super Virtual Graphics Arrays (SVGA) card and it suits the multimedia requirement. The advantage
of having a SVGA card is that the quality of graphics and pictures is better.
Now the PCs, which are coming to the market, are fitted with SVGA graphics card. That
allows images of up to 1024 X 768 pixels to be displayed in up to 16 million of colors. What
determines the maximum resolution and color depth is the amount of memory on the display
adapters. Often we can select the amount of memory required such as 512KB, 1MB, 2MB, 4MB,
etc. However, standard multimedia requirement is a 2MB of display memory (or Video RAM). But
one must keep in mind that this increases the speed of the computer, also it allows displaying more
colors and more resolutions. One can easily calculate the minimum amount of memory required for
display adapter as (Max. Horizontal Resolution x Max. Vertical Resolution x Color Depths. In
Bits)/8192 = the minimum video (or display) memory required in KB.
For example, if SVGA resolution (800 x 600) with 65,536 colors (with color depth of 16
bits) we will need (800 x 600 x 16) / 8192 = 937.5 KB, i.e., approximately 1 MB of display memory.
Another consideration should be the refresh rate, i.e., the number of times the images is
painted on the screen per second. More the refresh rate, better the image formation. Often a
87
minimum of 70-72 MHz is used to reduce eye fatigue. In fact, higher resolution requires higher
refresh rates to prevent screen flickers.
3.2.4.3 Video Grabbing Card
As we have already discussed, we need to convert the analog video signal to digital signal for
processing in a computer. Normal computer will not be able to do it alone. It requires special
equipment called video grabbing card and software to this conversion process. This card translates
the analog signal it receives from conventional sources such as a VCR or a video camera, and
converts them into digital format. The software available with it will capture this digital signal and
store them into computer file. It also helps to compress the digitized video so that it takes lesser
disk space as compared to a non-compressed digitized video.
This card is fitted into a free slot on the motherboard inside the computer and gets
connected to an outside source such as TV, VCR or a video camera with the help of a cable. This
card receives both video and audio signal from the outside source and conversion from analog to
digital signal takes place. This process of conversion is known as sampling. This process converts
the analog signal to digital data streams so that this signal can be stored in binary data format of 0’s
and 1’s. This digital data stream is then compressed using the video capturing software and stores
them in the hard disk as a file. This file is then used for incorporation into multimedia. This digitized
file can also be edited according to the requirements using various editing software such as Adobe
Premiere.
A number of digitizer or video grabbing cards are available in the market. However, one
from Intel called Intel Smart Video Recorder III does a very good job of capturing and compressing
video.
3.2.4.4 Sound Card
Today’s computers are capable of creating the professional multimedia needs. Not only we can use
computer to compose our own music, but it can also be used for recognition of speech and
synthesis. It can even read back the entire document for us. But before all this happens, we need to
convert the conventional sound signal to computer understandable digital signals. This is done
using a special component added to the system called sound card. This is installed into a free slot
on the computer motherboard. As in the case of video grabber card, sound card will take the sound
input from outside source (such as human voice, pre-recorded sounds, natural sounds etc.) and
convert them into digital sound signal of 0’s and 1’s. The recording software used along with the
88
sound card will store this digitized sound stream in a file. This file can later be used with multimedia
software. One can even edit the digitized sound file and add special sound effects into it.
Most popular sound card is from Creative Systems such as Sound Blaster-16, AWE32,
etc. AWE32 sound card supports 16 channel, 32 voice and 128 instruments and 10 drums sound
reproduction. It also has CD-ROM interface.
3.2.4.5 CD-ROM Drive
CD-ROM is a magnetic disk of 4.7 inches diameter and it can contain data up to 680 Megabytes. It
has become a standard by itself for its massive storage capacity, faster data transfer rate. To access
CD-ROM a very special drive is required and it is known as CD-ROM drive. Let us look into the term
ROM that stands for ‘Read Only Memory’. It means the material contained in it can be read (as
many times, as we like) but the content cannot be changed. As multimedia involves high resolution
of graphics, high quality video and sound, it requires large amount of storage space and at the
same time require a media, which can support faster data transfer. CD-ROM solves this problem by
satisfying both requirements.
Similar to the hard disk drive, the CD-ROM drive has certain specification, which will
help to decide which drive suit best to our multimedia requirement.
• Transfer Rate: Transfer rate is the amount of data the drive is capable of transferring at
a sustained rate from the CD to the CPU. This is measured in KB per second. For example, 1x drive
is capable of transferring 150KB of data from the CD to the CPU. In other terms, 1x CD drive will
sustain a transfer rate of 150KB/sec, where x stands for 150 KB. This is the base measurement and
all higher rates are multiple of this number, x. Latest CD-ROM drive available is of 64x, that means
it is capable of sustaining a data transfer rate of 64x150=9600 KB =9.38MB per second from the CD
to the CPU.
• Average Seek time: The amount of time lapses between request and its delivery is
known as average seeks time. The lower the value, better the result and time is measured in
milliseconds. A good access time is 150ms.
Recently computer technology has made tremendous progress. We can now have CDs
which can ‘write many, read many’ times. This means we can write our files in to a blank CD
through a laser beam. The written material can be read many times and they can even be erased
and re-written again. This re-writable CD’s can be used a simple floppy disk.
89
3.2.4.6 Scanner
Multimedia requires high quality of images, graphics to be used. And it takes lot of time creating
them. However, there are ready-made sources such as real life photographs, books, arts, etc.
available from where one easily digitized the required pictures. To convert these photographs to
digital format, one need a small piece of equipment called scanner attached to the computer. A
scanner is a piece of computer hardware that sends a beam of light across a picture or document
and records it. It captures images from various sources such as photograph, poster, magazine,
book, and similar sources. These pictures then can be displayed and edited on a computer. The
captured or scanned pictures can be stored in various formats like:
JPEG - Joint Photographic Experts Group - a format that compresses files and lets us choose
compression versus quality.
MPEG - Motion Pictures Expert Group - a format that compresses audio and video data files
TIFF - Tagged Image File Format - a widely used format compatible with both Macintosh and
Windows systems
Windows BMP - A format commonly used on MS-DOS and MS-Windows computers
GIF - Graphics Interchange Format - a format used on the Internet, GIF supports only 256 colors or
grays
Scanners are available in various shapes and sizes like hand-held, feed-in, and flatbed
types. They are also for scanning black-and-white only or color. Some of the reputed vendors of
scanner are Epson, Hewlett-Packard, Microtek and Relisys.
3.2.4.7 Touch screen
As the name suggests, touch screen is used where the user is required to touch the surface of the
screen or monitor. It is basically a monitor that allows user to interact with computer by touching
the display screen. This uses beams of infrared light that are projected across the screen surface.
Interrupting the beams generates an electronic signal identifying the location of the screen. And
the associated software interprets the signal and performs the required action. For example,
touching the screen twice in quick succession works as double clicking of the mouse. Imagine how
useful this will be for visually handicapped people who can identify things by touching a surface.
Touch screen is normally not used for development of multimedia; it is rather used for multimedia
presentation arena like trade show, information kiosk, etc.
90
3.2.5 Multimedia Software Tools
The basic tool set for building multimedia projects contains one or more authoring systems and
various editing applications for text, images, sounds, and motion video. A few additional
applications are also useful for capturing images form the screen, translating file formats, and
moving files among computers. The software in our multimedia toolkit and our skill at using it
determine what kind of multimedia work we can do and how fine and fancy we can render it.
The tools used for creating and editing multimedia elements on computers, they do
paint and image processing, image editing, drawing and illustration, 3-D and CAD, OCR and text
editing, sound recording and editing, video and movie-making, and various housekeeping tasks.
3.2.5.1 Painting and Drawing Tools
Painting and drawing tools as well as 3-D modelers are the most important of all the multimedia
elements; the graphical impact of our project will likely have the greatest influence on the end
user. Painting software like Fractal Design Painter is dedicated to producing crafted bitmap images.
Drawing software like CorelDraw and Canvas is dedicated to producing vector-based line art easily
printed to paper using PostScript. Some software applications combine both drawing and painting
capabilities, but many authoring systems can important only bitmapped images. Typically,
bitmapped images provide the greatest choice and pour to the artist for rendering fine detail and
effects, and bitmaps are used in multimedia more often than drawn objects.
These features in a drawing or painting package are to be considered for a best tool to
be selected.
• An intuitive graphical user interface with pull-down menus, status bars, palette control,
and dialog boxes for quick, logical selection
• Scalable dimensions, so we can resize, stretch, and distort both large and small bitmaps
• Paint tools to create geometric shapes from squares to circles and from curves to
complex polygons
• Ability to pour a color, pattern, or gradient into any area
• Ability to paint with patterns and clip art
• Customizable pen and brush shapes and sizes
• Eyedropper tool that samples colors
• An auto-trace tool that turns bitmap shapes into vector-based outlines
• Support for scalable text fonts and drop shadows
• Multimedia undoes capabilities, to try again
91
• Painting features such as smoothing coarse-edged objects into the background with
anti-aliasing
• Zooming, for magnified pixel editing
• All common color depths: 1-, 4-, 8-, 16- or 24-bit color, and gray-scale
• Good file importing and exporting capability for image
If we are new to multimedia and to these tools, we should take time to examine more than one
graphics software package.
3.2.5.2 3-D modeling and Animation Tools
3-D modeling software has increasingly entered the mainstream of graphic design as its ease-of-use
improves. As a result, the graphic production values and expectations for multimedia projects have
risen. With 3-modeling software, objects rendered in perspective appear more realistic.
A good 3-D modeling tool should include the following features:
• Multiple windows that allow we to view our model in each dimension, from the
camera's perspective, and in a rendered preview
• Ability to drag and drop primitive shapes into a scene
• Color and texture mapping
• Ability to add realistic effects such as transparency, shadowing and fog
• Ability to add spot, local, and global lights, to place them anywhere, and manipulate
them for special lighting effects.
• Unlimited camera with focal length control
• Draw spline-based paths for animation
3.2.5.3 Image Editing Tools
Image editing applications are specialized and powerful tools for enhancing are retouching existing
bitmapped images. These applications also provide many of the features and tools of painting and
drawing programs and can be used to create images from scratch as well as images digitized from
scanners, video frame-grabbers, digital cameras, clip art files, or original artwork files created with
a painting or drawing package.
Here are some features typical of image editing applications
• Multiple windows, which provide views of more than one image at a time
• Conversion of major image-data types and industry-standard file formats
• Direct inputs of images from scanner and video sources
92
• Employment of a virtual memory scheme that uses hard disk space as RAM for images
that require large amounts of memory
• Capable selection tools, such as rectangles, to select portions of a bitmap
• Image and balance controls for brightness, contrast, and color balance
• Good masking features
• Multiple undoes and restores features
• Anti-aliasing capability, and sharpening and smoothing controls
• Color-mapping controls for precise adjustment of color balance
• Tools for retouching, blurring, sharpening, lightening, darkening, smudging, and tinting
• Geometric transformation such as flip, skew, rotate, distort and perspective changes
• Ability to resample and resize an image
• 2, 4-bit color, 8- or 4-bit indexed color, 8-bit gray-scale, black-and-white and
customizable color palettes
• Ability to create images from scratch, using line, rectangle, square, circle, ellipse,
polygon, airbrush, paintbrush, pencil, and eraser tools, with customizable brush shapes and user-
definable bucket and gradient fills
• Multiple typefaces, styles, sizes, type manipulation and masking routines
3.2.5.4 OCR software
Often we will have printed matter and other text to incorporate into our project, but no electronic
text file. With optical character recognition software, a flat-bed scanner, and our computer, we can
save, many hours of retyping printed words, and get the job done faster and more accurately than
a roomful of typists. OCR software turns bitmapped characters into electronically recognizable
ASCII text. A scanner is typically used to create the bitmap. Then the software breaks the bitmap
into chunks according to whether it contains text or graphics, by examining the texture and density
of areas of the bitmap and by detecting edges. The text areas of the image are then converted to
ASCII characters.
3.2.5.5 Sound Editing Programs
Sound editing tools for both digitized and MIDI sound let we see music as well as hear it. By
drawing a representation of sound in fine increments, whether a score or a waveform, we can cut,
copy, paste, and otherwise edit segments of it with great precision-something impossible to do in
real time (that is, with the music playing).
93
System sounds are shipped with Windows systems and they are available as soon as we
install the operating system. System sounds are the beeps used to indicate an error, warning, or
special user activity. Using sound editing software, we can make our own sound effects and install
them as system beeps.
For digital waveform sounds, Windows ships with the Sound Recorder program, which
provides some rudimentary features for sound editing; most sound boards for PCs, however,
include editing software such as Creative Lab's WaveStudio.
3.2.5.6 Animation, Video, and Digital Movies
Animations and digital video movies are sequences of bitmapped graphic scenes (frames), rapidly
played back. But animations can also be making within the authoring system by rapidly changing
the location of objects to generate an appearance of motion. Most authoring tools adopt either a
frame-or object-oriented approach to animation. Movie-making tools take advantage of Microsoft
Video for Windows (also known as AVI, or Audio Video inter-leaved) technology and let we create,
edit, and present digitized motion video segments, usually in small window in our project.
To make movies from video we need special hardware to convert the analog video
signal to digital data. Movie-making tools such as Premiere, VideoShop, and MediaStudio Pro let we
edit and assemble video clips captured from camera, tape, other digitized movie segments,
animations, scanned images, and from digitized audio or MIDI files. The completed clip, often with
added transition and visual effects, can then be played back-either stand-alone or windowed within
our project.
Morphing is an animation technique that allows we to dynamically blend two still
images, creating a sequence of in-between pictures that, when played back rapidly, a racing car
transforms itself into a tiger; a mother's face becomes her daughter's.
3.2.5.7 Video Formats
Formats and systems for storing and playing digitized video to and from disk files are available with
AVI. Technologies provide a methodology for interleaving or blending audio data with video data so
that sound remains synchronized with the video. And technology allows data to stream from disk
into memory in a buffered and organized manner.
In Windows, the Media Control Interface (MCI) is a more traditional organizing. MCI
provides a uniform command interface for managing audio and video that interleaves audio and
video together in the file, hence the Audio Video interleaved name for the technology.
94
Microsoft Video for Windows
Audio Video interleaved (AVI) is Microsoft-developed software that plays full-motion interleaved
video and audio sequences in Windows, without specialized hardware, at about 15 frames per
second in a small window. With acceleration hardware, we can run AVI video sequences at 30
frames per second. Video data are interleaved with audio portion of the movie remains
synchronized to the video portion.
AVI provides the following features:
• Playback from hard disk or CD-ROM
• Playback on computers with limited memory; data are streamed from the hard disk or
CD-ROM player without using great amounts of memory
• Quick loading and playing, because only a few frames of video and a portion of audio
are accessed at a time
• Video compression to boost the quality of our video sequences and reduce their size
AVI includes two tools to capture and edit video sequences and play them back; VidCap and
VidEdit, respectively. AVI also includes data preparation tools (BitEdit, PalEdit, and WaveEdit);
MCIAVI.DRV, the MCI driver for AVI; MediaPlayer; and sample video sequences.
3.3.0 Multimedia Data Types
3.3.1 Introduction
In the previous unit, we have discussed about the multimedia concepts like its definition, its uses in
different areas. We know the definition of multimedia says, it is any combination of text, graphics,
sound, animation and video on digital computers. The text, graphics, sound, animation and video
are the basic building blocks multimedia. We use all these for the development of any multimedia
project. Hence, the characteristics of these building blocks are to be studied.
3.3.2 Text
Words and symbols in any form, spoken or written, are the most common system of
communication. They deliver the most widely understood meaning to the greatest number of
people - accurately and in detail. Because of this, the text is vital elements of multimedia menus,
navigation systems and content. Even a single word can be used for many meanings, so as we
begin working with any medium it is important to cultivate accuracy and conciseness in the
specific word we choose. In multimedia, these words will appear in titles, menus, and navigation
aids.
95
Multimedia authors weave words, symbols, sounds, and images and then blend text into
the mix to create integrated tools and interfaces for acquiring, displaying, and disseminating
messages and data, using computers.
3.3.2.1 Using Text in multimedia
A project can always be designed that uses no text at all. Pictures and symbols can be used to
navigate through the project, voice can also be incorporated, but this process may be tiresome,
because users have to pay more attention to spoken words than browsing the text.
A single item of menu text accompanied by a single action (a keystroke, a mouse click,
or finger pressed to the monitor) needs little expertise or training and is easy, clean and immediate.
Use text in multimedia projects for titles and headlines (to know what's all about), for menus
(where to go), for navigation (how to get there), and for content (what we see when we get there).
If our messages are part of a user driven, we can use a great deal of text information on
to the screen. Users can travel along the navigational pathways, stopping to scroll through text
fields and pausing to study the screen in detail. Computer screens provide a very small workspace
for developing complex ideas. We need to deliver a high impact or concise text messages on the
screen. From a design perspective, our choice of font size and the number of headlines we place on
a particular screen must be related both to the complexity of our message and to its venue.
Fonts to use for text, and how to pick them is difficult in multimedia projects. Depending
on what text, we are giving and where on the screen, the text and its fonts can be used effectively.
An interactive multimedia project typically consists of a body of information through
which a user navigates by pressing a key, clicking a mouse button, or pressing a touch screen. The
simplest menus consist of text lists of topics, we choose a topic, click it, and go there. As
multimedia and graphical user interfaces become pervasive in the computer community, certain
intuitive actions are being widely learned.
Text is very helpful to provide all these menu items in different form. In multimedia,
buttons are the objects that do lot of things when clicked. These buttons are normally associated
with text to tell us what action will be carried out if pressed. The text for these buttons must be
carefully chosen and different types of fonts can be used to present it.
We are already using the text; experiments have shown that reading text on a computer
screen is slower and more difficult than reading the same text in hard copy or book form. Indeed,
many users would rather print out their reports, e-mail messages, and read them on paper than
page through screens of text. Reading hard copy is still more comfortable. Unless the very purpose
96
of our multimedia project is to display large blocks of text, try to present to the user only a few
paragraphs of text per page. Use a font that is easy to read.
The standard document format used for pages on the World Wide Web is called
Hypertext Markup Language (HTML). In an HTML document, we can specify type fonts, sizes,
colors, and other properties common to text documents by marking up the text in the document
with the help of tags available. For this, the text can be extensively used and marking up
documents is simple.
The text we are using in the project can be animated, this retain a viewer's attention
when displaying the text. Animation of text can be used extensively like we might fly in some
keywords, dissolve others, rotate or spin others and so forth.
3.3.2.2 Text in Computers
The text is widely used in computers for all purposes. Normally a resolution of 72 pixels per inch
will be used to display the text on to the screen. This matches the standard font resolution of the
printing industry and allowed desktop publishers and designers to actually see on the monitor what
their printed output will look like (Called “What we See Is What We Get or WYSIWIG). The VGA
video standard was adopted to display the text, where it uses square shaped pixels, with a
resolution of 640 x 480 pixels. The 640 x 480, square pixel screen has become the most common
for the production of multimedia.
In 1985, the desktop publishing revolution took place many word processing and page
lowest software products flooded the computer market. These software products enabled a high
resolution 300-dpi laser printer using special software to draw the shapes of characters on the
basis of the geometry of the character. This special software was Adobe's Post script page
description and outline font language. The different kinds of fonts to be used for text came into
market, the important one are Adobe type manager, and small typefaces. Before we can use a font,
it must be recognized by the computer operating system. We need to install the fonts that we want
to use. There are many font manufacturers; collections of fonts are available through retail
channels or directly from the manufacturers.
Always be sure our fonts travel with our application when we are delivering software to
run on a hardware platform other than the one where the application was created. This avoids
many font display problems, particularly for menus and headlines.
Many types of character sets are used to create text. The ASCII (American Standard
Code for Information Interchange) character set, which uses 8-bit to represent each character, the
UNICODE which handles various international language alphabets are the important character sets.
97
Knowing that there is a wide selection of characters available to us on our computer and
understanding how we can create and use special and custom-made characters will broaden our
creative range when we design and build multimedia projects.
3.3.2.3 Text editing and Design tools
There are many special font editing tools are available in the market. These special font editing
tools can be used to make our own type, so we can communicate exactly an idea or graphic feeling.
Special characters required for the project can be always designed. The following are such tools
available.
ResEdi - ResEdit is resource editor available from Apple that is useful for creating and
changing graphic resources such as cursors, icons, dialog boxes, patterns, keyboard maps, and bit
mapped fonts on the Macintosh platform.
Fontographer - Fontographer, supplied by Macromedia, is a specialized graphics editor
for both Macintosh and Windows platforms. Fontographer's features include a freehand drawing
tool to create professional and precise inline and outline drawings of calligraphic and script
characters, using mouse. Fontographer allows the creation of multiple font designs from two
existing typefaces, and we can design lighter or heavier fonts by modifying the weight of an entire
typeface.
Type-Designer - Type-Designer for Windows from DS design is font editor that lets we
create, convert and manipulate various types of fonts.
Font Monger - Font Monger is a font editing tool for Macintosh.
Font Chameleon – Font chameleon from Ares software for both the Macintosh and
Windows platforms builds millions of different fonts from a single master font outline.
With the proper tools and a creative mind, we can create endless variations of text, and
we not only choose, but customize the styles that will fit with our design needs. Most image
editing and painting applications let we make text using the fonts available in our system. We can
colorize the text, stretch, squeeze, and rotate it.
3.3.2.4 Hypermedia and Hypertext
Multimedia - the combination of text, graphic, and audio elements into a single collection or
presentation – becomes interactive multimedia when the user is given with some control over the
information that is viewed and when it is viewed.
Interactive multimedia becomes hypermedia when its designer provides a structure of
linked elements through which a user can navigate and interact.
98
When a hypermedia project includes large amounts of text or symbols, this content can
be indexed and its elements then linked together to make rapid electronic retrieval of the
associated information. We call this as a hypertext system where words keyed or indexed to other
words. The World Wide Web is full of hypertext. This text is called because the words, sections are
linked together, the user of the web can navigate through text in a nonlinear fashion, quickly.
A word can be made 'HOT', just like a button, the when the user clicks on it leads to
another reference. These words are normally underlined words in blue color. In a fully indexed
hypertext system, all words can be found immediately. The search can be made for any specific
words; we may find whopping references or hits. Special programs for information management
and hypertext have been designed and used.
3.3.3 Sound / Audio
Sound is a physical Phenomenon produced by the vibrations of matter, show as a vision string,
dropping of a block of wood, knocking door, ringing a bell etc. As the matter vibrates, pressure
variations are created in the air surrounding it. This attenuation of high and low pressure is
propagated through the air in a wave-like motion. When a wave reaches the human ear, a sound is
heard.
In multimedia applications sound is very important because, it uses audio in the form of
music and/or speech, hence it is necessary to know basic concepts and formats of sound,
representation of sound in computers, as well as speech synthesis, speech recognition and speech
transmission.
3.3.3.1 Basic sound concepts
Sound is produced by the vibration of the matter. During the vibration, pressure variations are
created in the air surrounding it. The pattern of the oscillation is called a waveform.
The waveform repeats the same shape at regular intervals and this portion is called a
period. Since sound waves occur naturally, they are never perfectly smooth or uniformly periodic.
However, sounds that display a recognizable periodicity tend to be more musical than those that
are non-periodic. Examples of periodic sound sources are musical instruments, vowel sounds, and
the whistling wind and bird songs. Non periodic sound sources include pitched percussion
instruments, coughs, sneezes, and gushing water.
Frequency: The frequency of a sound is the reciprocal value of the period; it represents
the number of periods in a second and is measured in hertz (Hz) or cycles per second (CPS). A
99
convenient abbreviation, kHz (kilohertz), is used to indicate thousands of oscillations per second, 1
kHz equals 1000 HZ.
The frequency range is divided into:
Infra-sound from 0 to 20 Hz
Human hearing frequency range from 20 Hz to 20 KHz
Ultrasound from 20 KHz to 1 GHz
Hyper-sound from 1 GHz to 10 GHz
Multimedia systems typically make use of sound only within the frequency range of
human hearing. This sound is called audio and waves in this frequency range are called acoustic
signals. Speech and music signals have a frequency range between 20 Hz to 20 kHz. Apart from
speech and music, any other audio signal becomes noise.
Amplitude: A sound also has amplitude, a property subjectively heard as loudness. The
amplitude of sound is the measure of the displacement of the air pressure wave from its mean or
quiescent state. This audio amplitude is expressed in decibels (dB).
3.3.3.2 Computer representation of Sound
The smooth, continuous course of a sound waveform is not directly represented in a computer. A
computer measures the amplitude of the waveform at regular time intervals to produce a series of
numbers. Each of these measurements is a sample.
The mechanism that converts an audio signal into digital samples is the analog-to-digital
converter (ADC), the reverse conversion is performed by digital to analog (DAC). Most of the
multimedia systems support an external microphone and speaker.
Sampling: The process of converting continuous time into discrete values is called
sampling. The rate at which a continuous waveform is sampled is called sampling rate. Like
frequencies, sampling rates are measured in Hz. The CD standard sampling rate of 44100 Hz means
that the waveform is sampled at 44100 times/second. This is above the frequency range the human
can hear. Put the bandwidth (20000Hz-20Hz=19980Hz). The digitally sampled audio signal can
represent is at most equal to half of the CD standard sampling rate (44100Hz). This is an
application of the NY quest sampling theorem. The theorem says "for loss less digitization, the
sampling rate should be at least twice the maximum frequency responses". Hence, a sampling rate
of 44100Hz can only represent frequencies up to 22050 Hz, a boundary much closer to that of
human hearing.
Quantization: The process of converting continuous sample values into discrete values is
called quantization. As the waveform is sampled at discrete times, the value of the sample is also
100
discrete. The resolution or quantization of a sample value depends on number of bits used in
measuring the height of the waveform. An 8.bit quantization yields 256 possible values: 16-bit CD-
quality quantization results in over 65536 values.
Coding: The process of representing quantized values digitally is called coding.
Depending on number of quantizing levels is used no-bits are used to code each sample.
3.3.3.3 Sound hardware
Before sound can be processed, a computer needs input/output devices. Microphone and built-in
speakers are devices connected to an ADC and DAC, respectively for the input and output of audio.
3.3.3.4 Audio file formats
We have two formats voice-quality audio, and CD-quality audio. Voice-quality audio uses an 8-bit
mu-law encoded quantization and a sampling rate of 8000Hz. This representation is considered fast
and accurate enough for telephone-quality speech input.
CD-quality audio is generated if the stereo DAC operates at 44100 samples per second
with a 16-bit linear PCM (pulse code modulation) encoded quantization. If the sampling rate and
the number of quantization levels are high enough. The digitized signal will be close representation
of the original analog signal.
3.3.4 Images
An image is a special representation of an object, a two dimensional or three dimensional scenes or
another image. It can be real or virtual.
A recorded image may be in a photo-graphic, analog video signal or digital format. In
computer vision, an image is usually a recorded image, such as a video image, digital image or a
picture. In computer graphics, an image is always a digital image. In multimedia applications, all
formats can be presented.
3.3.4.1 Basic Concepts
An image might be thought of as a function with resulting values of the light intensity at each point
over a planar region. For digital computer operations, this function needs to be sampled at discrete
Intervals. The sampling quantizes the intensity values into discrete levels.
101
3.3.4.2 Digital Image representation
A digital image is represented by a matrix of numeric values each representing a quantized
intensity value. When I is a two dimensional matrix I (r, c) is the intensity value at the position
corresponding to row r and column c of the matrix.
The points at which an image is sampled are known as picture elements, commonly
abbreviated as pixels. The pixel values of intensity images are called GRAY SCALE LEVELS (we
encode here the `COLOR` of the image). The intensity at each pixel is represented by an integer and
is determined from the continuous image by averaging over a small neighborhood around the
pixel location. If there are just two intensity values, for example, black and white, they are
represented by number 0 and 1; such images are called binary-valued images. When 8-bit integers
are used to store each pixel value the gray levels range from 0 (black) to 255 (white).
It is common to use a square sampling grid with pixels equally spaced along the two
sides of the grid. The distance between grid points obviously affects the accuracy with which the
original image is represented, and it determines how much detail can be resolved. The resolution
depends on the imaging system as well. Digital pictures are often very large requires lot of storage
space depending on gray scale levels or resolution.
3.3.4.3 Image file formats
There are different kinds of image formats are possible and are available in the literature. But we
consider the image format that comes out of an image frame grabber i.e., the captured image
format, and the format when images are stored i.e., the stored image format. The graphics image
format is also another type of image file format.
3.3.4.3.1 Captured image format
The image format is specified by two main properties special resolution which is specified as pixels
x pixels and color encoding, which is specified as bits/pixel. Both parameter values depend on
hardware and software for input/output of images.
For example, we can have special resolution of 320 x 240 pixels. The color can be
encoded with 1-bit (a binary image format), 8-bit (color or gray scale) or 24 bit (color - RGB).
We can also use other resolutions like 640 x 480, 1280 x 1024 pixels. It is also possible to use 16-bit,
24-bit color encoding for image representation.
102
3.3.4.3.2 Stored Image format
When we store an image, we are storing a two- dimensional array of values, in which each value
represents the data associated with a pixel in the image. For a bit map, this value is a binary digit.
For a color image, the value may be collection of:
• Three numbers representing the intensities of the red, green, and blue components of
the color at the pixel.
• Three numbers that are indices into tables of red, green and blue intensities.
• A single number that is an index to a table of color triples.
• Four or five spectral samples for each color.
In addition, each pixel may have other information associated with it. Flexible formats
like RIFF (Resource interchange file format), and other image file formats like GIF ( Graphical
interchange format), JPEG (Joint photographic expert group), TIFF (Tagged image file format)
will be used for storing the image.
3.3.4.3.3 Graphics image format
Graphics image formats are specified through graphics primitives and their attributes. To the
category of graphics primitives belong lines, rectangles, circles and ellipses, text strings, two
dimensional or three dimensional objects. A graphics package determines which primitives are
supported. Attributes such as line style, line width and color affect the outcome of the graphical
image.
Graphics primitives and their attributes represent a higher level of an image
representation, i.e., the graphical images are not represented by a pixel matrix.
Some graphics packages like SRGP (Simple raster graphics package) provide such a
conversion means they take the graphics primitives and attributes and generate either a bitmap or
pixmap. A bit map is an array of pixel values that map one by one pixel on the screen. The pixel
information is stored in 1-bit, so we get a binary image. Pixmap is a more general term describing a
multiple bit per pixel image. Low end color systems have 8-bits/pixel, allowing 256 colors
simultaneously. Systems that are more expensive have 24 bits/pixel, allowing the choice of any of
16 million colors. We have also packages like PHIGS (Programmers hierarchical interactive graphics
system) and GKS (Graphics kernel system)
3.3.4.4 Computer Image Processing
Computer graphics concern the pictorial synthesis of real or imaginary objects from their
computer-based models. The related field of image processing treats the converse process: the
103
analysis of scenes or the reconstruction of models from pictures of 2D or 3D objects. In the
following sections, we describe basic principles of image synthesis (generation) and image analysis
(recognition).
3.3.4.4.1 Image Synthesis
Image synthesis is an integral part of all computer user interfaces and is the basic requirement for
visualizing 2D, 3D, and higher-dimensional objects. Image synthesis is used in the areas as diverse
as education, science, engineering, medicine, advertising and entertainment all rely on graphics,
and we will look at some representative samples:
• User Interfaces: Applications running on personal computers and workstations have
user interfaces that rely on desktop window system to manage multiple simultaneous activities,
and on point-and-click facilities to allow users to menu items, icons and objects on the screen.
• Office Automation and Electronic Publishing: The use of graphics for the creation and
dissemination of information has increased enormously since the advent of desktop publishing on
personal computers. Office automation and electronic publishing can produce both traditional
printed documents and electronic documents that contain text, tables, graphs and other forms of
drawn or scanned-in graphics. Hypermedia systems that allow browsing networks of interlinked
multimedia documents are not uncommon.
• Simulation and Animation for Scientific Visualization and Entertainment: Computer-
produced animated movies and displays of time-varying behavior of real and simulated objects are
becoming increasingly popular for scientific and engineering visualization. We can use them to
study abstract mathematical entities and models of such phenomena as fluid flow, relativity and
nuclear and chemical reactions. Cartoon characters will increasingly be modeled in computers as
3D shape descriptions whose movements are controlled by computers rather than by the figures
drawn annually by cartoonists. Television commercials featuring flying logos and more exotic visual
trickery have become common, as have elegant special effects in movies.
Interactive computer graphics are the most important means of producing images
(pictures) since the invention of photography and television; it has the added advantage that we
can make pictures not only of concrete, "real word" objects, but also of abstract, synthetic objects
such as mathematical surfaces in 4D.
• Dynamics in Graphics. Graphics are not confined to static pictures. Pictures can be
dynamically varied; for example, a user can control animation by adjusting the speed, portion of
the total scene in view, amount of detail shown, etc. Hence, dynamics is an integral part of graphics
104
(dynamic graphics). Much of interactive graphics technology contains hardware and software for
user-controlled motion dynamics and update dynamics.
• Motion Dynamics: With motion dynamics, objects can be moved and enabled with
respect to a stationary observer. The object can also remain stationary and the view around them
can move. In many cases, both the objects and the camera and moving. A typical example is a flight
simulator which contains a mechanical platform, which supports a mock cockpit and a display
screen. The computer controls platform motion, gauges and the simulated world of both stationary
and moving objects through which the pilot navigates.
• Update Dynamics: Update dynamics is the actual change of the shape, color, or other
properties of the objects being viewed. For instance, a system can display the deformation of an in-
flight airplane structure in response to the operator's manipulation of the many control
mechanisms. The smoother are the change, the more realistic and meaningful, and the result.
Dynamic, interactive graphics offer a large number of user-controllable models with which to
encode and communicate information, e.g., the 2D or 3D shape of objects in a picture, their gray
scale or color and the time variations of these properties.
• The Framework of Interactive Graphics Systems. Images can be generated by video
digitizer cards that capture analog signals and create a digital image. These kinds of digital images
are used, for example, in image processing for image recognition and in communication for video
conferencing.
Graphical images are generated using interactive graphic systems. An example of such a
graphics system is SRGP (Simple Raster Graphics Package). The high-level conceptual framework of
almost any interactive graphics system consists of three software components; an application
model, an application program and a graphics system, and a hardware component: graphics
hardware.
The application model represents the data or objects to be pictured on the screen; it is
stored in an application database. The model typically stores descriptions of primitives that define
the shape of components of the object, object attributes and connectivity relationships that
describe how the components fit together. The model is application-specific and is created
independently of any particular display system. Therefore, the application program must convert a
description of the portion of the model to whatever procedure calls commands the graphics system
uses to create an image. This conversion process has two phases. First, the application program
traverses the application database that stores the model to extract the portions to be viewed, using
some selection or query system. Second, the extracted geometry is put in a format that can be sent
to the graphics system.
105
The application program handles user input. It produces views by sending to the third
component, the graphics system, and a series of graphics output commands that contain both a
detailed geometric description of what is to be viewed and the attributed describing how the
objects should appear.
The graphics system is responsible for actually producing the picture from the detail
descriptions and for passing the user's input to the application program for processing. The
graphics system is thus an intermediary component between the application program and the
display hardware. It effects an output transformation from the objects in the application model to a
view of the model. Symmetrically, it effects an input transformation from user actions to
application program inputs that cause the application to make changes in the model and/or
picture. The graphics system typically consists of a set of output subroutines corresponding to
various primitives, attributes and other elements. These are collected in a graphics subroutine
library or package. The application program specifies geometric primitives and attributes to these
subroutines, and the subroutines then drive the specific display device and cause it to display the
image.
At the hardware level, a computer receives input from interaction devices and outputs
images to display devices.
• Graphics Hardware-Input. Current input technology provides us with the ubiquitous
mouse, the data tablet and the transparent, touch-sensitive panel mounted on the screen. Even
fancier input devices that supply, in addition to (x, y) screen location, 3D and higher-dimensional
input values (degrees of freedom), are becoming common, such as track-balls, space-balls or the
data glove.
Track Balls
Track-balls can be made to sense rotation about the vertical axis in addition to that about the two
horizontal axes. However, there is no direct relationship between hand movements with the device
and the corresponding movement in 3D space.
Space-ball
A space-ball is a rigid sphere containing strain gauges. The user pushes or pulls the sphere in any
direction, providing 3D translation and orientation. In this case, the directions of movement
correspond to the user's attempts to move the rigid sphere, although the hand does not actually
move.
Data Glove
The data glove records hand position and orientation as well as finger movements. It is a glove
covered with small, lightweight sensors. Each sensor consists of a short fiber-optic cable with a
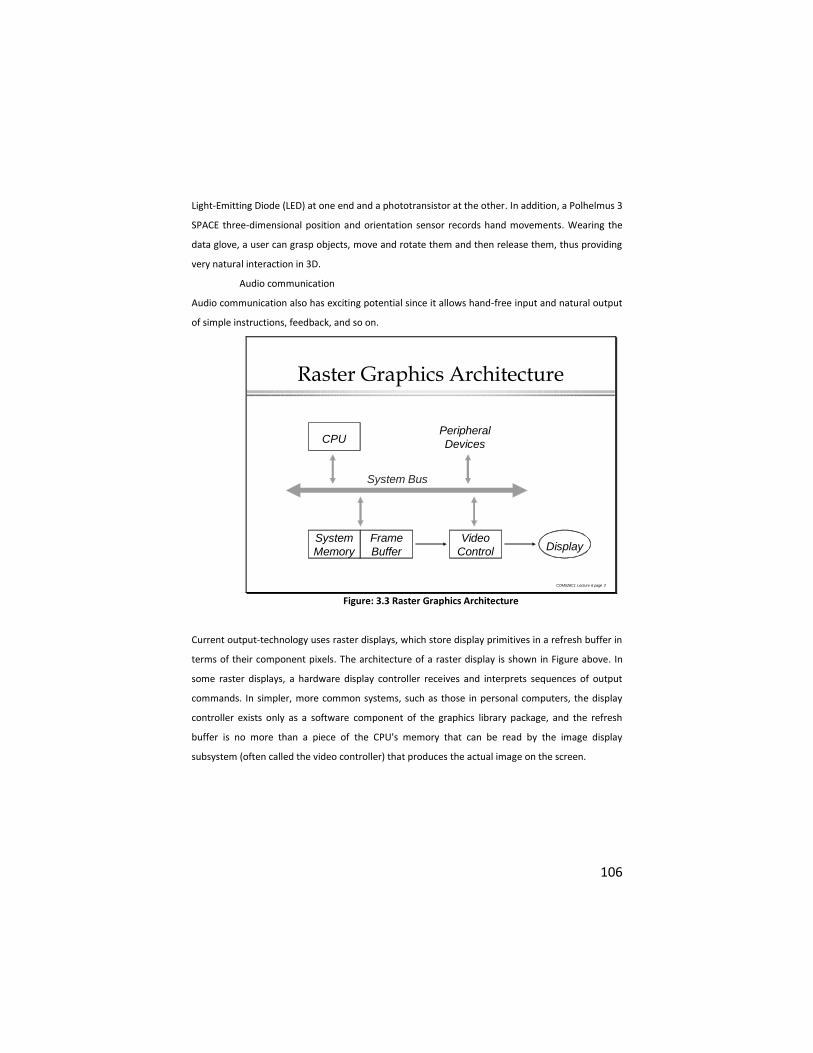
106
Light-Emitting Diode (LED) at one end and a phototransistor at the other. In addition, a Polhelmus 3
SPACE three-dimensional position and orientation sensor records hand movements. Wearing the
data glove, a user can grasp objects, move and rotate them and then release them, thus providing
very natural interaction in 3D.
Audio communication
Audio communication also has exciting potential since it allows hand-free input and natural output
of simple instructions, feedback, and so on.
COM526C1 Lecture 6 page 2
Raster Graphics Architecture
CPU
System
Memory
Frame
Buffer
Video
Control Display
System Bus
Peripheral
Devices
Figure: 3.3 Raster Graphics Architecture
Current output-technology uses raster displays, which store display primitives in a refresh buffer in
terms of their component pixels. The architecture of a raster display is shown in Figure above. In
some raster displays, a hardware display controller receives and interprets sequences of output
commands. In simpler, more common systems, such as those in personal computers, the display
controller exists only as a software component of the graphics library package, and the refresh
buffer is no more than a piece of the CPU's memory that can be read by the image display
subsystem (often called the video controller) that produces the actual image on the screen.
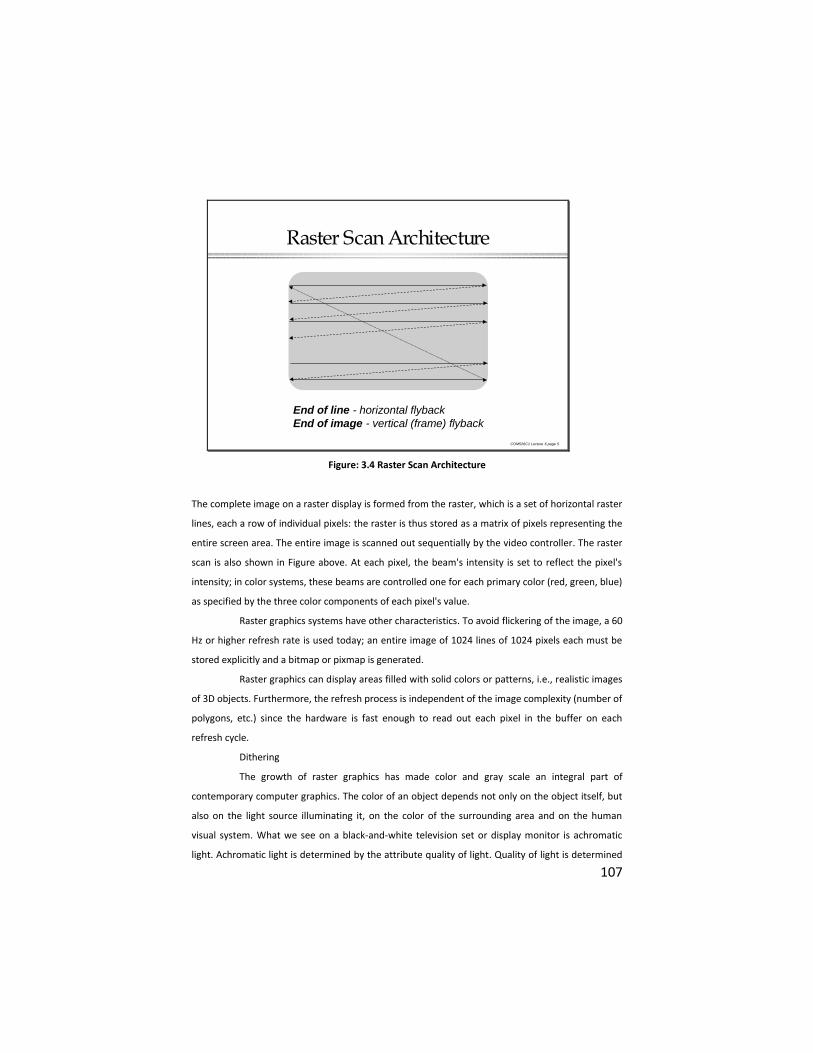
107
COM526C1 Lecture 6 page 5
Raster Scan Architecture
End of line - horizontal flyback
End of image - vertical (frame) flyback
Figure: 3.4 Raster Scan Architecture
The complete image on a raster display is formed from the raster, which is a set of horizontal raster
lines, each a row of individual pixels: the raster is thus stored as a matrix of pixels representing the
entire screen area. The entire image is scanned out sequentially by the video controller. The raster
scan is also shown in Figure above. At each pixel, the beam's intensity is set to reflect the pixel's
intensity; in color systems, these beams are controlled one for each primary color (red, green, blue)
as specified by the three color components of each pixel's value.
Raster graphics systems have other characteristics. To avoid flickering of the image, a 60
Hz or higher refresh rate is used today; an entire image of 1024 lines of 1024 pixels each must be
stored explicitly and a bitmap or pixmap is generated.
Raster graphics can display areas filled with solid colors or patterns, i.e., realistic images
of 3D objects. Furthermore, the refresh process is independent of the image complexity (number of
polygons, etc.) since the hardware is fast enough to read out each pixel in the buffer on each
refresh cycle.
Dithering
The growth of raster graphics has made color and gray scale an integral part of
contemporary computer graphics. The color of an object depends not only on the object itself, but
also on the light source illuminating it, on the color of the surrounding area and on the human
visual system. What we see on a black-and-white television set or display monitor is achromatic
light. Achromatic light is determined by the attribute quality of light. Quality of light is determined
108
by the intensity and luminance parameters. For example, if we have hardcopy devices or displays
which are only bi-leveled, which means they produce just two intensity levels, then we would like
to expand the range of available intensity.
The solution lies in our eye's capability for spatial integration. If we view a very small
area from a sufficiently large viewing distance, our eyes average fine detail within the small area
and record only the overall intensity of the area. This phenomenon is exploited in the technique
called half toning, or clustered-dot ordered dithering (half toning approximation). Each small
resolution unit is imprinted with a circle of black ink whose area is proportional to the blackness 1-I
(I = intensity) of the area in the original photograph. Graphics output devices can approximate the
variable-area circles of halftone reproduction. For example, a 2*2 pixel area of a bi-level display can
be used to produce five different intensity levels at the cost of halving the spatial resolution along
each axis. The patterns can be filled by 2*2 areas, with the number of 'on' pixels proportional to the
desired intensity. The patterns can be represented by the dither matrix. This technique is used on
devices which are not able to display individual dots (e.g., laser printers). This means that these
devices are poor at reproducing isolated 'on' pixels). All pixels that are 'on' for a particular intensity
must be adjacent to other 'on' pixels.
A CRT display is able to display individual dots; hence, the clustering requirement can be
relaxed and a dispersed-dot ordered dither can be used. Monochrome dithering techniques can
also be used to extend the number of available colors, at the expense of resolution. Consider a
color display with three bits per pixel, one for red, green and blue. We can use a 2*2 pattern area
to obtain 125 colors as follows: each pattern can display five intensities for each color, by using the
halftone patterns, resulting in 5*5*5=125 color combinations.
3.3.4.4.2 Image Analysis
Image analysis is concerned with techniques for extracting descriptions from images that are
necessary for higher-level scene analysis methods. By itself, knowledge of the position and value of
any particular pixel almost conveys no information related to the recognition of an object, the
description of an object's shape, its position or orientation; the measurement of any distance on
the object or whether the object is defective. Hence, image analysis techniques include
computation of perceived brightness and color, partial or complete recovery of three-dimensional
data in the scene, location of discontinuities corresponding to objects in the scene and
characterization of the properties of uniform regions in the image.
Image analysis is important in many areas: aerial surveillance photographs, slow scan
television images of the moon or of planets gathered from space probes, television images taken
109
from an industrial robot's visual sensor, X-ray images and computerized axial tomography (CAT)
scans. Subareas of image processing include image enhancement, pattern detection and
recognition and scene analysis and computer vision.
Image enhancement deals with improving image quality by eliminating noise
(extraneous or missing pixels) or by enhancing contrast.
Pattern detection and recognition deal with detecting and clarifying standard patterns
finding distortions from these patterns. A particularly important example is Optical Character
Recognition (OCR) technology, which allows for the economical bulk input of pages of typeset,
typewritten or even hand-printed characters. The degree of accuracy of handwriting recognition
depends on the input device. One possibility is that the user prints characters with a continuous-
positioning device, usually a tablet stylus (a pen-based environment), and the computer recognizes
them (online recognition). This is easier than recognizing scanned in characters because the tablet
records the sequence, direction and sometimes speed and pressure of strokes, and a pattern-
recognition algorithm can match these factors to stored templates for each character. The
recognizer may evaluate patterns without considering how the pattern has been created static
character recognition) or it may focus on strokes, edges in strokes or drawing speed (a dynamic
recognizer). A recognizer can be trained to identify different styles of block printing. The
parameters of each character are calculated from samples drawn by the users.
Scene analysis and computer vision deal with recognizing and reconstructing 3D models
of a scene from several 2D images. An example is an industrial robot sensing the relative sizes,
shapes, positions and colors of objects.
To fully recognize an object in an image means knowing that there is an agreement
between the sensory projection and the observed image. How the object appears in the image has
to do with the spatial configuration of the pixel values. Agreement between the observed spatial
configuration and the expected sensory projection requires the following capabilities:
• Infer explicitly or implicitly an object's position and orientation from the
spatial configuration.
• Confirm that the inference is correct.
To infer an object's (e.g., a cup) position, orientation and category or class from the
spatial configuration of gray levels requires the capability to infer which pixels is part of the object.
Further, from among those pixels that are part of the object, it requires the capability to distinguish
observed object features, such as special markings, lines, curves, surfaces or boundaries (e.g.,
edges of the cup). These features themselves are organized in a spatial relationship on the image
and the object.
110
Analytic inference of object shape, position and orientation depends on matching the
distinguishing image features (in 2D, a point, line segment or region) with corresponding object
features (in 3D, a point, line segment, are segment, or a curved or planar surface).
The kind of object, background, imaging sensor and viewpoint of the sensor all
determine whether the recognition problem is easy or difficult. For example, suppose that the
object is a white planar square on a uniform black background, a simple corner feature extractor
could identify the distinguishing corner points, the match between the image corner features and
the object corner features is direct. Just relates the corners of the image square to the corners of
the object square in clockwise order, starting from any arbitrary correspondence. Then, use the
corresponding points to establish the sensor orientation relative to the plane of the square. If we
know the size of the square, we can completely and analytically determine the position and
orientation of the square relative to the position and orientation of the camera. In this simple
instance, the unit of pixel is transformed to the unit of match between image corners and object
corners. The unit of match is then transformed to the unit of object position and orientation
relative to the natural coordinate system of the sensor.
On the other hand, the transformation process may be difficult. There may be a variety
of complex objects that need to be recognized. For example, some objects may include parts if
other objects, shadows may occur or the object reflectance may be varied, and the background
may be busy.
Which kind of unit transformation must be employed depends on the specific nature of
the vision task, the complexity of the image and the kind of information available.
Computer recognition and inspection of objects is, in general, a complex procedure,
requiring a variety of steps that successively transform the iconic data into recognition information.
A recognition methodology must pay substantial attention to each of the following six steps: image
formatting, conditioning, labeling, grouping, extracting and matching.
Image Recognition Steps
We will give a brief overview of recognition steps, but a deeper analysis of these steps can be found
in computer vision literature.
Image formatting means capturing an image from a camera and bringing it into a digital
form. It means that we will have a digital representation of an image in the form of pixels.
Conditioning, labeling, grouping, extracting and matching constitute a canonical
decomposition of the image recognition problem, each step preparing and transforming the data to
facilitate the next step. Depending on the application, we may have to apply this sequence of steps
at more than one level of the recognition and description processes. As these steps work on any
111
level in the unit transformation process, they prepare the data for the unit transformation, identify
the next higher-level unit and interpret it. The five transformation steps, in more detail, are:
Conditioning
Conditioning is based on a model that suggests the observed image is composed of an informative
pattern modified by uninteresting variations that typically add to or multiply the informative
pattern. Conditioning estimates the informative pattern on the basis of the observed image. Thus,
conditioning suppresses noise, which can be thought of as random unpatterned variations affecting
all measurements. Conditioning can also perform background normalization by suppressing
uninteresting systematic or patterned variations. Conditioning is typically applied uniformly and is
context-independent.
Labeling
Labeling is based on a model that suggests the informative pattern has structure as a spatial
arrangement of events, each spatial event being a set of connected pixels. Labeling determines in
what kinds of spatial events each pixel participates.
An example, of a labeling operation is edge detection. Edge detection is an important
part of the recognition process. Edge detection techniques find local discontinuities in some image
attribute, such as intensity or color (e.g., detection of cup edges). These discontinuities are of
interest because they are likely to occur at the boundaries of the objects. An edge is said to occur
at a point in the image if some image attribute changes in value discontinuously at that point. Edge
detection recognizes many edges, but not all of them are significant. Therefore, another labeling
operation must occur after edge detection, namely thresholding. Thresholding specifies which
edges should be accepted and which should not; the thresholding operation filters only the
significant edges from the image and labels them. Other edges are removed. Other kinds of
labeling operations include corner finding and identification of pixels that participate in various
shape primitives.
Grouping
The labeling operation labels the kids of primitive spatial events in which the pixel participates. The
grouping operation identifies the events by collecting or identifying maximal connected sets of
pixels participating in the same kind of event. A grouping operation, where edges are grouped into
lines, is called line-fitting
The grouping operation involves a change of logical data structure, the observed image;
the conditioned image and the labeled image are all digital image data structures. Depending on
the implementation, the grouping operation can produce either an image data structure in which
each pixel is given an index associated with the spatial event to which it belongs or a data structure
112
that is collection of sets. Each set corresponds to a spatial event and contains the pairs of positions
(row, column) that participate in the event. In either case, a change occurs in the logical data
structure. The entities of interest prior to grouping are pixels; the entities of interest after grouping
are sets of pixels.
Extracting
The grouping operation determines the new set of entities, but they are left naked in the sense
that the only thing they possess is their identity. The extracting operation computes for each group
of pixels a list of properties. Example properties might include its centroid, area, orientation, spatial
moments, gray tone moments, spatial-gray tone moments, circumscribing circle, inscribing circle,
and so on. Other properties might depend on whether the group is considered a region or an area.
If the group is a region, the number of holes might be a useful property. If the group is an are,
average curvature might be a useful property.
Extraction can also measure topological or spatial relationship between two are more
groupings. For example, an extracting operation may make explicit that two groupings touch, or are
spatially close, or that one grouping is above another.
Matching
After the completion of the extracting operation, the events occurring on the image have been
identified and measured, but the events in and on them have no meaning. The meaning of the
observed spatial events emerges when a perceptual organization has occurred such that a specific
set of spatial events in the observed spatial organization clearly constitutes an imaged instance of
some previously known object, such as a chair or the letter A. Once an object or set of object parts
has been recognized, measurements (such as the distance between two parts, the angle between
two lines or the area of an object part) can be made and related to the allowed-tolerance, as may
be the case in an inspection scenario. It is the matching operation that determines the
interpretation of some related set of image events, associating these events with some given three-
dimensional object or two-dimensional shape.
There are a wide variety of matching operations. The classic example is template
matching, which compares the examined pattern with stored models (templates) of known
patterns and chooses the best match.
3.3.4.5 Image transmission
Image transmission takes into account transmission of digital images through computer networks.
There are several requirements on the networks when the images are transmitted.
113
• The network must accommodate bursty data transport because image transmission is
bursty (the burst is caused by the large size of the image)
• Image transmission requires reliable transport (coaxial cable, fiber optics, free air space)
• Time dependence is not a dominant characteristic of the image in contrast to
audio/video transmission.
Image size depends on the image representation format used for transmission. There
are several possibilities.
3.3.4.5.1 Raw image data transmission.
In this case, the image is generated through a video digitizer and transmitted in digital
format. The size of the image can be computed in the following manner .
Size = Spatial resolution x Pixel quantization.
For example, the transmission of an image with a resolution 640 x 480 pixels and pixel
quantization of 8 bits/pixel requires transmission of 307,200 bytes through the network.
3.3.4.5.2 Compressed image transmission
In this case, the image is generated through a video digitizer and compressed before transmission.
Methods such as JPEG or MPEG are used to down size the image. The reduction of image size
depends on the compression method and compression rate.
3.3.4.5.3 Symbolic image data transmission.
In this case, the image is represented through symbolic data representation as image primitives
(example 2D or 3D geometric representation), attributes and other control information. This image
representation is used in computer graphics. Image size is equal to the structure size, which carries
the transmitted symbolic information of the image.
3.3.5 Animation
A computer based animation is an animation performed by a computer using graphical tools to
provide visual effects.
To animate something is, literally to bring it to life. An animation covers all changes that
have a visual effect. Visual effect can be of different nature. They might include time varying
positions (motion dynamics). Shape, color, transparency structure and texture of an object (update
dynamics) and changes in lighting, camera position, orientation and focus.
114
3.3.5.1 Basic concepts.
Input process: Before the computers can be used for animation, drawings must be digitized
because key frames meaning frames in which the entities being animated must be drawn. Key
frames are first and last frame of an action.
Animation is possible because of a biological phenomenon known as persistence of
vision. An object seen by the human eye remains mapped on the eye's retina for a brief time after
viewing. This makes it possible for a series of images that are changed very slightly and very
rapidly, one after the other , to seemingly blend together into a visual illusion of movement. In
other words, if we just change slightly the location or shape of an object rapidly enough, the
eye will perceive the changes as motion.
Composition stage: The composition stage, in which foreground and background figures
are combined to generate the individual frames for the final animation, can be performed with
image composition techniques.
In between process: The animation of movement from one position to another needs a
composition of frames with intermediate positions (intermediate frames) in between the key
frames. This is called the in between process. This process of in between is performed in computer
based animation through linear interpolation called LERPING. The system gets only the starting and
ending positions, other intermediate positions are generated. This is also called betweening.
Changing colors: For changing colors, computer based animation uses CLUT (color look
up table) or LUT in a frame buffer and the process of double buffering. The LUT animation is
generated by manipulating of LUT. Thus changing colors of the various pieces of the image.
3.3.5.2 Animation languages
There are many animation languages for describing animation. They fall into three categories:
Linear list notations: In linear list notations for animation, each event in the animation is
described by a starting and ending frame number and an action that is to take place.
General purpose languages: Another way is to embed an animation capability within a
general purpose programming language. ASAS (A simple animation language) is an example of such
language. It is built on top of LISP.
Graphical languages: One problem with textual languages is inability to visualize the
action by looking at the script, but graphical languages substitute a visual paradigm for a textual
one. Rather than explicitly writing out descriptions of actions, the animator provides a picture of
the action. Examples of such systems and languages are GENESYS, DIAL, S-Dynamics system.
115
3.3.6 Video
As we have already discussed about animation, one more basic media is video or pictures in
motion. This is possible on the digital computers and video can be used extensively in multimedia
systems. Of all the multimedia elements, video places the highest performance demand on our
computer and its memory. Carefully planned, well executed video clips can make a dramatic
difference in a multimedia project.
3.3.6.1 Basic concepts
The human eye views pictures and motion pictures. The immanent properties of the eye
determine, in connection with neuronal processing, some essential conditions related to video
systems. In conventional black and white TV sets, the video signal is displayed using a CRT (cathode
ray tube). An electron beam carries corresponding pattern of information, such as intensity in a
viewed scene.
Video signal representation includes three aspects the visual representation,
transmission and digitization.
A central objective of visual representation is to offer the viewer a sense of presence in
the scene and of participation in the events portrayed. To meet this objective the televised image
should convey spatial and temporal content of the scene.
Video signals are transmitted to receivers through a single television channel.
In digitization, before a picture or motion video can be processed by a computer or
transmitted over a computer network, it needs to be converted from analog to digital
representation. That means, digitization consists of sampling the gray (color) level in the picture
P x Q array of points . Since the gray level at these points may take any value in the continuous
range, for digital processing, the gray level must be quantized. Here what we do is, we divide the
range of gray levels into K intervals, and require the gray level at any point to take on only one of
these values. For a picture reconstructed from quantized samples to be acceptable, it may be
necessary to use 100 or more quantizing levels. When samples are obtained by using an array of
points or finite strings, a fine degree of quantization is very important for samples taken in regions
of a picture where the gray (color) levels change slowly. The result of sampling and quantizing is an
image (picture), at which point we have obtained a rectangular array of integer values representing
pixels. The next step in the creation of digital motion video is to digitize images per second that
approximates analog motion video.
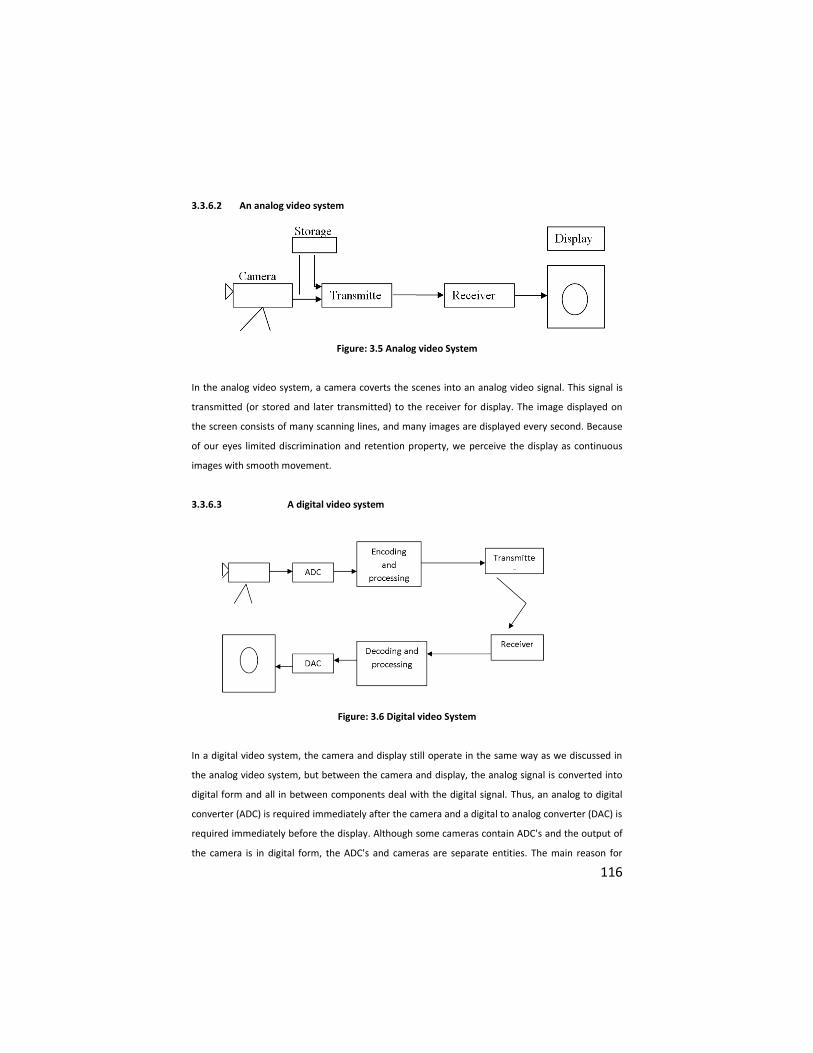
116
3.3.6.2 An analog video system
Figure: 3.5 Analog video System
In the analog video system, a camera coverts the scenes into an analog video signal. This signal is
transmitted (or stored and later transmitted) to the receiver for display. The image displayed on
the screen consists of many scanning lines, and many images are displayed every second. Because
of our eyes limited discrimination and retention property, we perceive the display as continuous
images with smooth movement.
3.3.6.3 A digital video system
Figure: 3.6 Digital video System
In a digital video system, the camera and display still operate in the same way as we discussed in
the analog video system, but between the camera and display, the analog signal is converted into
digital form and all in between components deal with the digital signal. Thus, an analog to digital
converter (ADC) is required immediately after the camera and a digital to analog converter (DAC) is
required immediately before the display. Although some cameras contain ADC's and the output of
the camera is in digital form, the ADC's and cameras are separate entities. The main reason for
117
converting analog signals into digital signals is that digital signals are easier to process, encode and
integrate with other digital media. Thus, it is common to have encoding and decoding processing
components in a digital system.
Therefore, when we say digital video we are referencing to the in-between stage when
the video signals are handled in digital form. For digital video, the common storage devices are
hard disks and CD-ROM's. The processing devices, transmitters and receivers are computers. The
transmission network is commonly a packet switched network. Digital video and audio place
stringent requirements on these components
One of the design aims of the digital video system is that the final display quality should
be no worse than that of the original analog system.
3.4.0 Multimedia compression Techniques and Standards
3.4.1 Introduction
The data compression which is very important for multimedia applications because uncompressed
graphics, audio, and video data require considerable storage capacity. Compressing a data file
reduces its size, and hence it can be easily transferred over the digital network. The amount of
compression depends on the compression method and compression rate. The terms compression
and coding are treated as synonyms.
3.4.2 Data compression
As already we know the multimedia applications makes use of various components like text,
graphics art, audio, animation and video. All these are stored in the form of files and it contains
binary numbers 0 and 1. Uncompressed graphics, audio and video data files require considerable
storage capacity, in case of uncompressed video, the requirement is even more, and given the
today's technology, it is not even possible. The same is true for multimedia communications, where
different files are to be transferred to various locations on the network. Data transfer
uncompressed video on the digital network requires very high bandwidth to be provided for a
single point-to-point communication. To provide feasible and cost effective solutions, most
multimedia systems handle compressed digital video and audio data streams. Compressing a data
file reduces its size, and hence it can be easily transferred over the digital network. The amount of
compression depends on the compression method and compression rate. The terms compression
and coding are treated as synonyms.
118
There are many compression techniques for multimedia information compression. They
can be classified in many ways according to different criteria. Some classification is based on the
compression algorithms used in the compression techniques.
Some classify them based on the results of the compression techniques. The second
type of classification is more useful to end users and developers who design and develop systems
to support compressed multimedia data. Two classifications in this category are whether the
original data can be reconstructed exactly after using a compression technique, and whether the
output of a compression system is of constant bit rate.
If the original data can be reconstructed exactly after using compression technique, we
call this compression technique lossless, otherwise, it is lossy.
Lossless compression techniques are normally used for compressing computer programs
and legal and medical documents where no error or loss is allowed. Lossless compression
techniques exploit only data statistics (Data redundancy). The compression ratio achievable is
normally low.
Lossy compression techniques are normally used for compressing digital audio, image,
and video in most multimedia applications where some errors or loss can be tolerated. They use
both data statistics and human perception properties. Thus, they can produce very high
compression ratio.
3.4.2.1 Storage space and compression requirements
We use text, graphics, audio, and video in multimedia projects. Images have considerably higher
storage requirements than text; audio and video have even higher storage space than the images.
Not only the huge amount of storage required, but the data rates for the communication of
continuous media are also important. Here are the some specifications which gives us an idea
about how much storage space is required.
• For the presentation of text, two bytes are used for each character; each character is
displayed using 8x8 pixels, which is sufficient for display of ASCII characters.
• For the representation of vector graphics, a typical still image composed of 500 lines,
each line is defined by its horizontal position, vertical position and an 8-bit attribute field. The
horizontal axis is represented using 10 bits, and the vertical axis is coded using 9 bits.
• In very simple color display modes, a single pixel of a bitmap can be represented by 256
different colors, therefore, one byte per pixel is needed.
119
• An uncompressed audio signal of telephone quality is sampled at 8 kHz and quantized
with 8-bits per sample. This leads to a bandwidth requirement of 64 bits/second and storage
requirements of 64 Kbits to store one second of play back.
• An uncompressed stereo audio signal of CD quality is sampled at the rate of 44.1 kHz
and is quantized with 16 bits per sample, hence, the storage requirements is 705.6 Kbits to store
one second of audio and playback.
• The video data requirements are even more, depending on the specifications.
By going through the above storage requirements for various components of
multimedia, we can image the volume of data to be stored and transmitted. Therefore,
compression plays very important role in these cases.
Compression in multimedia systems is subject to certain constraints.
• The quality of the coded and later on, decoded data should be as good as possible.
• To make a cost-effective implementation possible.
• The complexity of the technique used should be minimal.
• The processing of the algorithms must not exceed certain time spans.
For each compression technique, there are requirements that differ from those of other
compression techniques. One can distinguish between requirements of an application running in a
'dialogue' mode and in a 'retrieval mode', where a dialogue mode means an interaction among
human users via multimedia information and a retrieval mode means a retrieval of multimedia
information by a human user from a multimedia data base.
In a dialogue mode application, the following requirement, based on human perception
characteristics must be considered, the end-to-end delay should not exceed 150 milliseconds (for
compression and decompression). A delay in the range of 50 milliseconds should be achieved to
support face-to-face dialogue applications. The number 50 milliseconds relates to the delay
introduced by compression and decompression only. The overall end-to-end delay additionally
comprises any delay in the network, in the involved communication protocol processing at the end
system and in the data transfer from and to the respective input and output devices.
In a retrieval mode application, the following demands arise.
• Fast forward and backward data retrieval with simultaneous display should be possible.
This implies a fast search for information in multimedia databases.
• Random access to single images and audio frames of a data stream should be possible,
making the access time less than 0.5 second. This access should be faster than a conventional CD
audio system to maintain the interactive character of the application.
120
• Decomposition of images, video or audio should be possible without a link to other data
units. This allows random access and editing.
3.4.2.2 Source, entropy and Hybrid coding
Compression techniques fit into different categories, for their use in multimedia systems. We can
distinguish among source, entropy and hybrid coding. Entropy encoding is a lossless process, while
source encoding is a lossy process. Most multimedia applications use hybrid techniques, which are
a combination of the entropy and source coding.
Entropy compression is used regardless of the media's specific characteristics. The data
stream to be compressed is considered a simple digital sequence and the semantics of the data is
ignored. Entropy encoding is an example of lossless encoding as the decompression process
regenerates the data completely. Run-length coding, Huffman coding and Arithmetic coding are the
examples for entropy coding.
Source coding takes into account the semantics of data. The degree of compression that
can be reached by source coding depends on the data contents. Source encoding is lossy process,
In the case of lossy compression techniques, a one way relation between the original data stream
and the encoded data stream exists, the data streams are similar but not identical. Different source
encoding techniques make extensive use of the characteristics of the specific medium. We have
many classifications in source coding; they are prediction, transformation and layered coding. The
Differential pulse code modulation (DPCM) and the Delta modulation (DM) are the examples for
prediction type source coding. The Fast Fourier Transformation (FFT), the discrete cosine
transformation (DCT) is the examples for transformation type source coding. Bit-position, sub
sampling and sub-band coding are the examples for layered type of source coding.
Hybrid coding makes use of the both source and entropy encoding techniques. The
examples for hybrid coding are JPEG, MPEG, and DVI. Most of the compression techniques used in
multimedia is hybrid techniques.
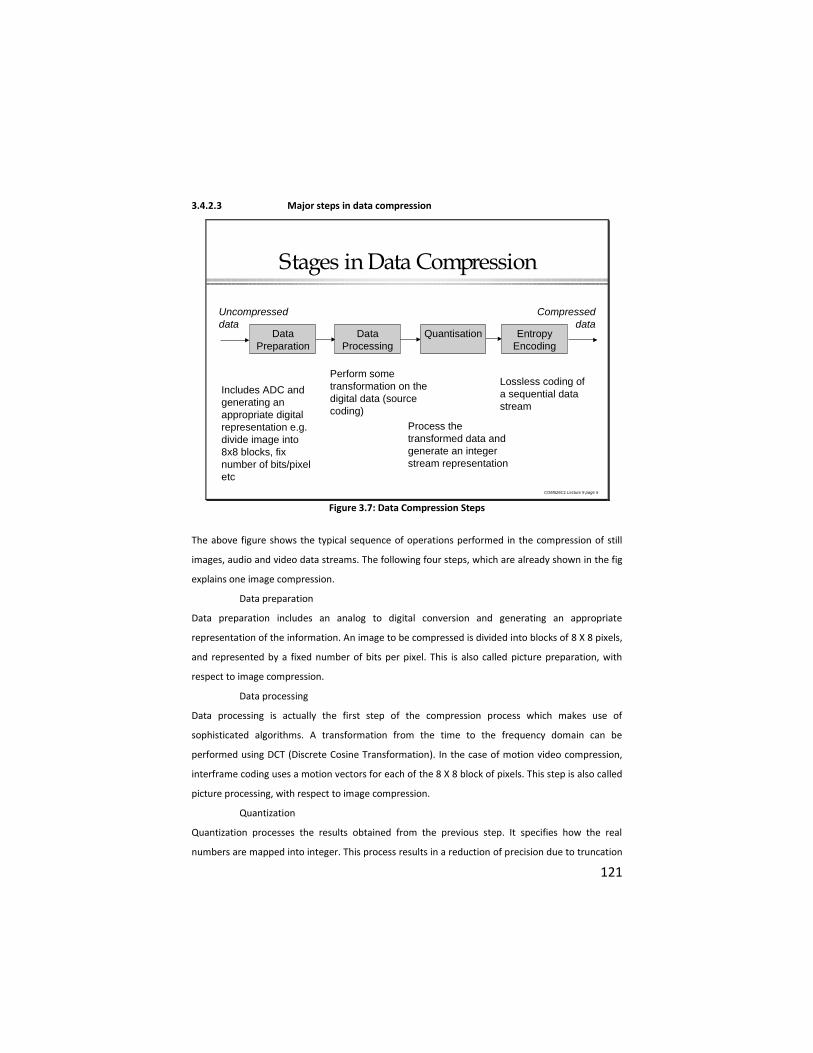
121
3.4.2.3 Major steps in data compression
COM526C1 Lecture 9 page 5
Stages in Data Compression
Data
Preparation
Data
Processing
Quantisation Entropy
Encoding
Uncompressed
data
Compressed
data
Includes ADC and
generating an
appropriate digital
representation e.g.
divide image into
8x8 blocks, fix
number of bits/pixel
etc
Perform some
transformation on the
digital data (source
coding)
Process the
transformed data and
generate an integer
stream representation
Lossless coding of
a sequential data
stream
Figure 3.7: Data Compression Steps
The above figure shows the typical sequence of operations performed in the compression of still
images, audio and video data streams. The following four steps, which are already shown in the fig
explains one image compression.
Data preparation
Data preparation includes an analog to digital conversion and generating an appropriate
representation of the information. An image to be compressed is divided into blocks of 8 X 8 pixels,
and represented by a fixed number of bits per pixel. This is also called picture preparation, with
respect to image compression.
Data processing
Data processing is actually the first step of the compression process which makes use of
sophisticated algorithms. A transformation from the time to the frequency domain can be
performed using DCT (Discrete Cosine Transformation). In the case of motion video compression,
interframe coding uses a motion vectors for each of the 8 X 8 block of pixels. This step is also called
picture processing, with respect to image compression.
Quantization
Quantization processes the results obtained from the previous step. It specifies how the real
numbers are mapped into integer. This process results in a reduction of precision due to truncation
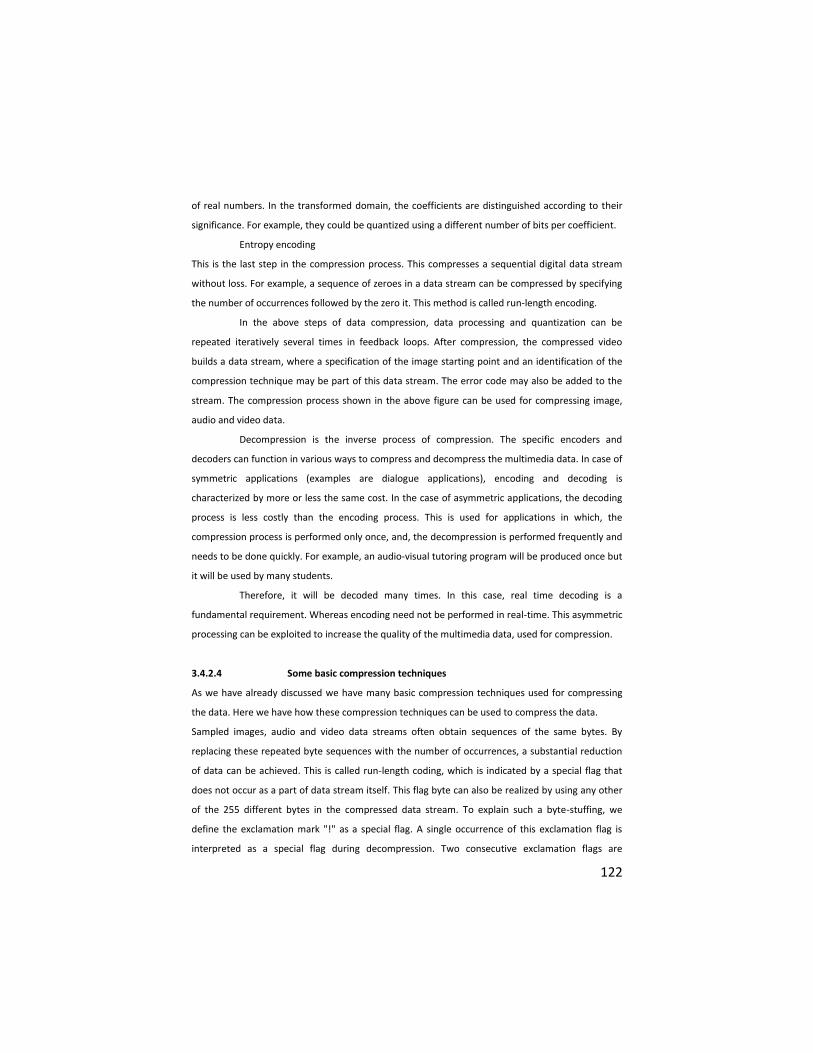
122
of real numbers. In the transformed domain, the coefficients are distinguished according to their
significance. For example, they could be quantized using a different number of bits per coefficient.
Entropy encoding
This is the last step in the compression process. This compresses a sequential digital data stream
without loss. For example, a sequence of zeroes in a data stream can be compressed by specifying
the number of occurrences followed by the zero it. This method is called run-length encoding.
In the above steps of data compression, data processing and quantization can be
repeated iteratively several times in feedback loops. After compression, the compressed video
builds a data stream, where a specification of the image starting point and an identification of the
compression technique may be part of this data stream. The error code may also be added to the
stream. The compression process shown in the above figure can be used for compressing image,
audio and video data.
Decompression is the inverse process of compression. The specific encoders and
decoders can function in various ways to compress and decompress the multimedia data. In case of
symmetric applications (examples are dialogue applications), encoding and decoding is
characterized by more or less the same cost. In the case of asymmetric applications, the decoding
process is less costly than the encoding process. This is used for applications in which, the
compression process is performed only once, and, the decompression is performed frequently and
needs to be done quickly. For example, an audio-visual tutoring program will be produced once but
it will be used by many students.
Therefore, it will be decoded many times. In this case, real time decoding is a
fundamental requirement. Whereas encoding need not be performed in real-time. This asymmetric
processing can be exploited to increase the quality of the multimedia data, used for compression.
3.4.2.4 Some basic compression techniques
As we have already discussed we have many basic compression techniques used for compressing
the data. Here we have how these compression techniques can be used to compress the data.
Sampled images, audio and video data streams often obtain sequences of the same bytes. By
replacing these repeated byte sequences with the number of occurrences, a substantial reduction
of data can be achieved. This is called run-length coding, which is indicated by a special flag that
does not occur as a part of data stream itself. This flag byte can also be realized by using any other
of the 255 different bytes in the compressed data stream. To explain such a byte-stuffing, we
define the exclamation mark "!" as a special flag. A single occurrence of this exclamation flag is
interpreted as a special flag during decompression. Two consecutive exclamation flags are
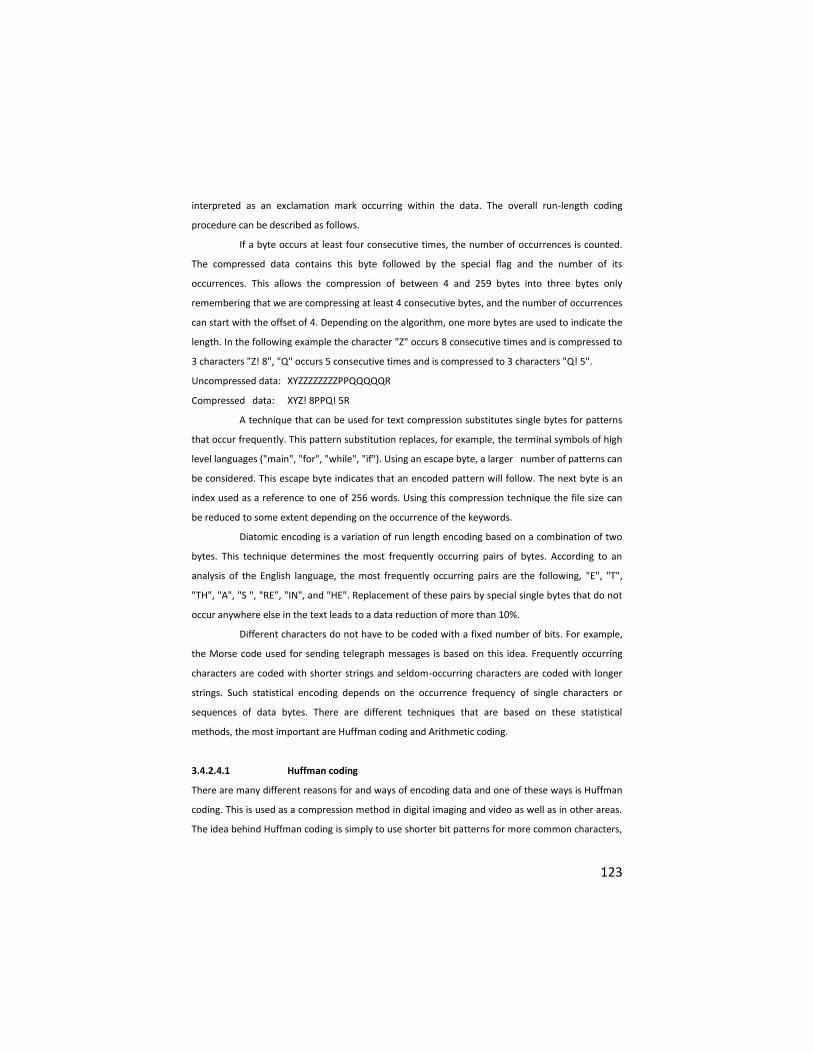
123
interpreted as an exclamation mark occurring within the data. The overall run-length coding
procedure can be described as follows.
If a byte occurs at least four consecutive times, the number of occurrences is counted.
The compressed data contains this byte followed by the special flag and the number of its
occurrences. This allows the compression of between 4 and 259 bytes into three bytes only
remembering that we are compressing at least 4 consecutive bytes, and the number of occurrences
can start with the offset of 4. Depending on the algorithm, one more bytes are used to indicate the
length. In the following example the character "Z" occurs 8 consecutive times and is compressed to
3 characters "Z! 8", "Q" occurs 5 consecutive times and is compressed to 3 characters "Q! 5".
Uncompressed data: XYZZZZZZZZPPQQQQQR
Compressed data: XYZ! 8PPQ! 5R
A technique that can be used for text compression substitutes single bytes for patterns
that occur frequently. This pattern substitution replaces, for example, the terminal symbols of high
level languages ("main", "for", "while", "if"). Using an escape byte, a larger number of patterns can
be considered. This escape byte indicates that an encoded pattern will follow. The next byte is an
index used as a reference to one of 256 words. Using this compression technique the file size can
be reduced to some extent depending on the occurrence of the keywords.
Diatomic encoding is a variation of run length encoding based on a combination of two
bytes. This technique determines the most frequently occurring pairs of bytes. According to an
analysis of the English language, the most frequently occurring pairs are the following, "E", "T",
"TH", "A", "S ", "RE”, "IN", and "HE". Replacement of these pairs by special single bytes that do not
occur anywhere else in the text leads to a data reduction of more than 10%.
Different characters do not have to be coded with a fixed number of bits. For example,
the Morse code used for sending telegraph messages is based on this idea. Frequently occurring
characters are coded with shorter strings and seldom-occurring characters are coded with longer
strings. Such statistical encoding depends on the occurrence frequency of single characters or
sequences of data bytes. There are different techniques that are based on these statistical
methods, the most important are Huffman coding and Arithmetic coding.
3.4.2.4.1 Huffman coding
There are many different reasons for and ways of encoding data and one of these ways is Huffman
coding. This is used as a compression method in digital imaging and video as well as in other areas.
The idea behind Huffman coding is simply to use shorter bit patterns for more common characters,
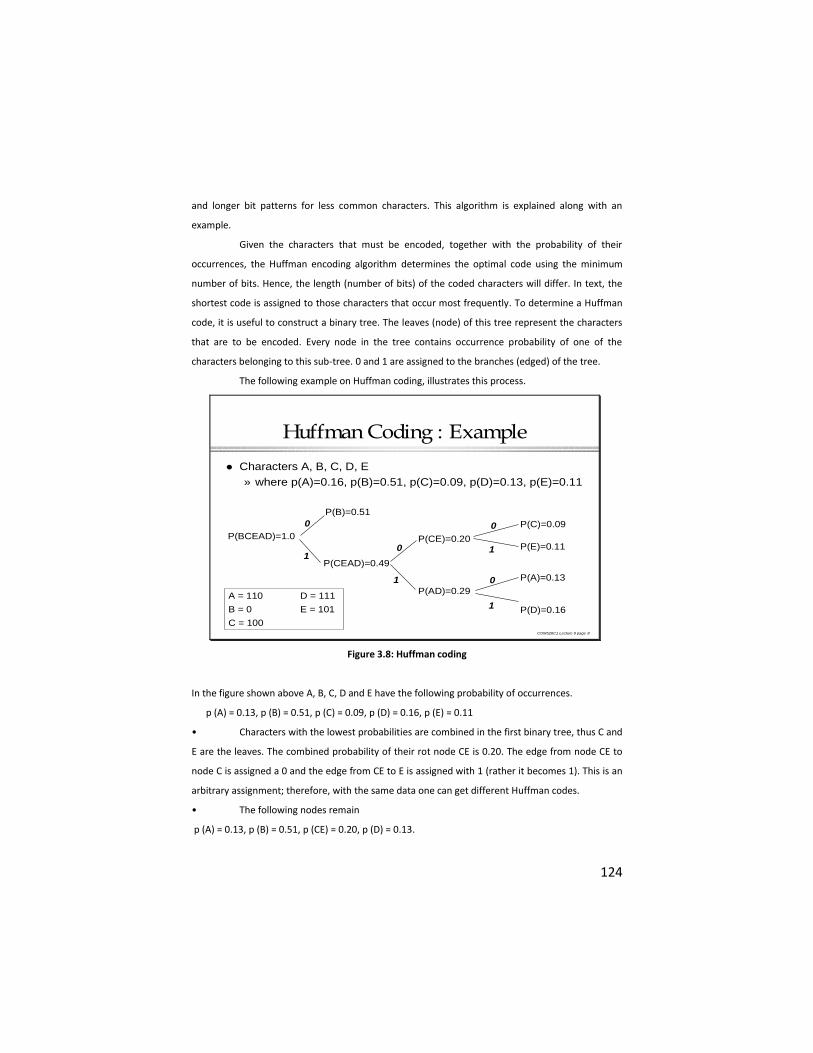
124
and longer bit patterns for less common characters. This algorithm is explained along with an
example.
Given the characters that must be encoded, together with the probability of their
occurrences, the Huffman encoding algorithm determines the optimal code using the minimum
number of bits. Hence, the length (number of bits) of the coded characters will differ. In text, the
shortest code is assigned to those characters that occur most frequently. To determine a Huffman
code, it is useful to construct a binary tree. The leaves (node) of this tree represent the characters
that are to be encoded. Every node in the tree contains occurrence probability of one of the
characters belonging to this sub-tree. 0 and 1 are assigned to the branches (edged) of the tree.
The following example on Huffman coding, illustrates this process.
COM526C1 Lecture 9 page 8
Huffman Coding : Example
Characters A, B, C, D, E
» where p(A)=0.16, p(B)=0.51, p(C)=0.09, p(D)=0.13, p(E)=0.11
P(C)=0.09
P(E)=0.11P(CE)=0.20
P(A)=0.13
P(D)=0.16
P(AD)=0.29
P(CEAD)=0.49
P(B)=0.51
P(BCEAD)=1.0
1
0
1
1
0
0
0
1
A = 110 D = 111
B = 0 E = 101
C = 100
Figure 3.8: Huffman coding
In the figure shown above A, B, C, D and E have the following probability of occurrences.
p (A) = 0.13, p (B) = 0.51, p (C) = 0.09, p (D) = 0.16, p (E) = 0.11
• Characters with the lowest probabilities are combined in the first binary tree, thus C and
E are the leaves. The combined probability of their rot node CE is 0.20. The edge from node CE to
node C is assigned a 0 and the edge from CE to E is assigned with 1 (rather it becomes 1). This is an
arbitrary assignment; therefore, with the same data one can get different Huffman codes.
• The following nodes remain
p (A) = 0.13, p (B) = 0.51, p (CE) = 0.20, p (D) = 0.13.
125
• Again the two nodes with the lowest probabilities are combined into a binary sub-tree,
the nodes A and D are such leaves and the combined probability of their root AD is 0.29. The edge
from AD to A is assigned a 0 and the edge from AD to D a 1. If there are root nodes of different sub-
trees with the same probabilities, the trees with the shortest maximal path between their roots
and their nodes should be combined. This process keeps the code length more constant.
• The following nodes remain
P (AD) = 0.29, p (B) = 0.51, p (CE) = 0.20
• The nodes with the smallest probabilities are AD and CE they are combined into a binary
tree. The combined probability of their root node CEAD is 0.49. The edge from CEAD to AD is
assigned a 1 and the edge from CEAD to CE is assigned 0.
• Two nodes remain
p (CEAD) = 0.49, p (B) = 0.51
• They are combined to a binary tree with the root BCEAD. The edge from BCEAD to B is
assigned a 0, and the edge from BCEAD to CEAD is assigned with 1.
• Figure shows the resulting Huffman code in the form of a binary tree. The following is
the resultant code that is to be stored in a table.
A = 110
B = 0
C = 100
D = 111
E = 101
If the information of an image can be transformed into a bit stream, such a table can be used to
compress the data without any loss. The simplest way to generate a bit stream is to code the pixels
individually and read them line by line. Such as stream can be determined for each image or for a
set of images. For videos, a Huffman table can be used for a single sequence of images, for a set of
scenes or even for an entire film clip. The same Huffman coding table must be used for both
encoding and decoding
3.4.2.4.2 Waveform coding
Waveform coding tries to encode the waveform itself in an efficient way. The signal is stored in
such a way that upon decoding, the resulting signal will have the same general shape as the
original. Waveform coding techniques apply to audio signals in general.
126
The simplest form of waveform coding is PCM encoding the signal. But a signal can be
processed further to reduce the amount of storage needed for the waveform. In general, such
techniques are lossy: the decoded data can differ from the original data.
Differential coding
Differential coding tries to exploit the fact that with audio signals the value of one sample can be
somewhat predicted by the values of the previous samples. Given a number of samples, the
algorithms will calculate a prediction of the next sampled value. They will then only store the
difference between this predicted value and the actual value. This difference is usually not very
large and can therefore be stored with four bits than the actual sampled value, resulting in
compression. Because of the use of a predicted value, differential coding is also referred to as
predictive coding or relative coding.
Differential PCM (DPCM)
Differential PCM merely calculates the difference between the predicted and actual values of a
PCM signal and uses a fixed number of bits to store this difference. The number of bits used to
store this difference determines the maximum slope that the signal can have if errors are to be
avoided. If this slope is exceeded, the value of a sample can only be approximated, introducing an
amount of error.
Adaptive DPCM (ADPCM)
An extension to DPCM is adaptive DPCM. With this encoding method, there are still a fixed number
of bits used to store the difference. In contrast to the previous technique which simply used all of
those bits to store the difference, ADPCM uses some of the bits to encode a quantization level. This
way, the resolution of the difference can be adjusted.
Delta modulation (DM)
Delta modulation can be seen as a very simple form of DPCM. With this method, only one bit is
used to encode the difference. One value then indicates an increase of the predicted value with a
certain amount, the other indicates a decrease.
A variant of this scheme is called adaptive delta modulation (ADM). Here, the step size
used to increase or decrease the predicted value can be adapted. This way, the original signal can
be approximated more closely.
Vector quantization
With vector quantization, the input is divided into equally sized pieces which are called vectors.
Essential to this type of encoding is the presence of a `codebook', an array of vectors. For each
vector of the input, the closest match to a vector in the codebook is looked up. The index of this
codebook entry is then used to encode the input vector.
127
It is important to note that this principle can be applied to a wide variety of data, not
only to PCM data. For example, vector quantization could be used to store an approximation of the
error term of other compression techniques.
Transform coding
When we are considering PCM data, we are in fact looking at a signal in the time domain. With
transform coding, the signal is transformed to its representation in another domain in which it can
be compressed better than in its original form. When the signal is decompressed, an inverse
transformation is applied to restore an approximation of the original signal.
One of the domains to which a signal could be transformed is the frequency domain.
Using information about human vocal and auditory systems, a compression algorithm can decide
which frequency components are most important. Those components can then be encoded with
more precision than others. Examples of transformation schemes which are used for this purpose
are the Discrete Fourier Transform (DFT) and the Discrete Cosine Transform (DCT).
3.4.2.5 JPEG (Joint Photographic Expert Group)
JPEG is the first international digital image compression standard for continuous tone (multi-level)
still images, both gray scale and color. It represents the best image compression technology at
that time i.e., I 1992. It may be one of the best compression technologies today. This compression
technique was developed by joint photographic expert group namely ITU-US and ISO. JPEG is now
used widely in applications involving images. It has been implemented in both hardware and
software. Although its initial intention was to compress still images, real time JPEG encoding and
decoding have been implemented to handle full motion video. This application is called Motion
JPEG or MJPEG.
JPEG compresses about 20:1 before visible image degradation occurs, but at higher
compression rates, it is lossy, sacrificing a lot of image data. When a compression ratio of 30:1 is
applied to a full color frame of video, the image storage requirement is reduced from 1,000K to
33K, and the data transfer rate is reduced to about 1MB per second, well within the capabilities of
most storage devices.
To compress image with JPEG, the image is divided into 8x8 pixel blocks, and the
resulting 64 pixels (called a search range) are mathematically described relative to the
characteristic of the pixel in the top-left corner. The binary description of this relationship requires
far less than 64 pixels, so more information can be transmitted in less time. JPEG compresses
slowly - about one to three seconds for 1MB image - depending upon computer speed, but JPEG
can compress images as much as 75:1 with loss.
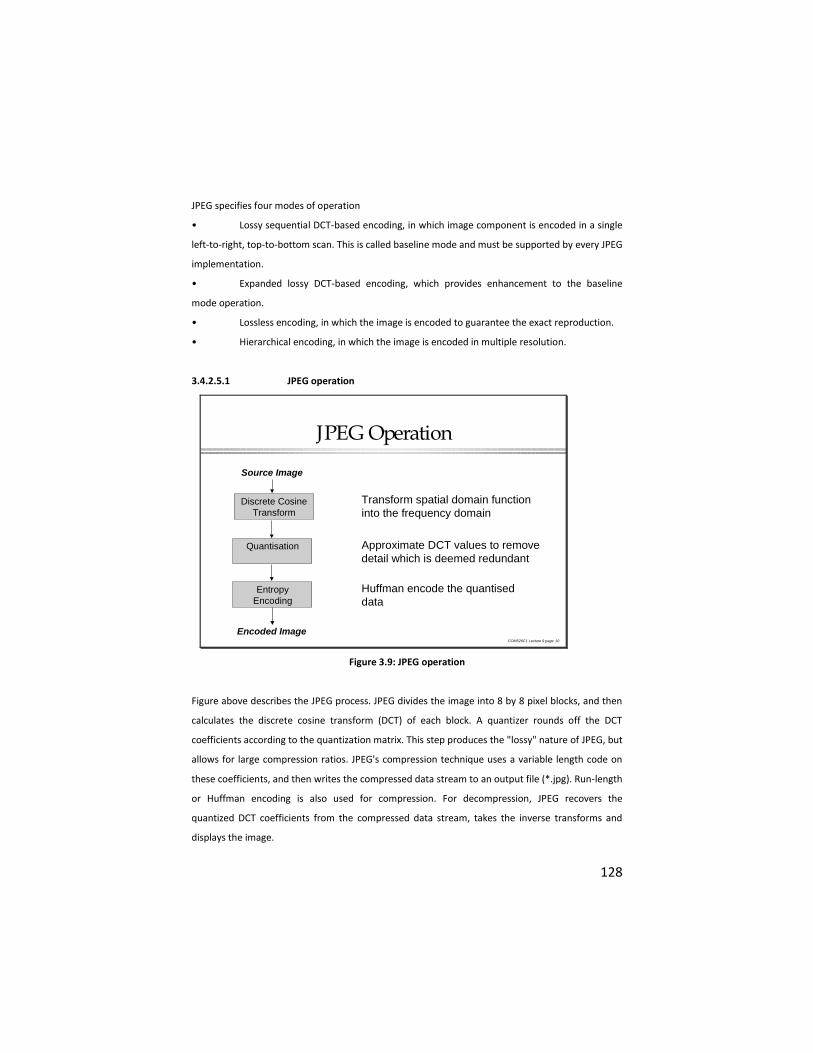
128
JPEG specifies four modes of operation
• Lossy sequential DCT-based encoding, in which image component is encoded in a single
left-to-right, top-to-bottom scan. This is called baseline mode and must be supported by every JPEG
implementation.
• Expanded lossy DCT-based encoding, which provides enhancement to the baseline
mode operation.
• Lossless encoding, in which the image is encoded to guarantee the exact reproduction.
• Hierarchical encoding, in which the image is encoded in multiple resolution.
3.4.2.5.1 JPEG operation
COM526C1 Lecture 9 page 10
JPEG Operation
Source Image
Discrete Cosine
Transform
Quantisation
Entropy
Encoding
Encoded Image
Transform spatial domain function
into the frequency domain
Approximate DCT values to remove
detail which is deemed redundant
Huffman encode the quantised
data
Figure 3.9: JPEG operation
Figure above describes the JPEG process. JPEG divides the image into 8 by 8 pixel blocks, and then
calculates the discrete cosine transform (DCT) of each block. A quantizer rounds off the DCT
coefficients according to the quantization matrix. This step produces the "lossy" nature of JPEG, but
allows for large compression ratios. JPEG's compression technique uses a variable length code on
these coefficients, and then writes the compressed data stream to an output file (*.jpg). Run-length
or Huffman encoding is also used for compression. For decompression, JPEG recovers the
quantized DCT coefficients from the compressed data stream, takes the inverse transforms and
displays the image.
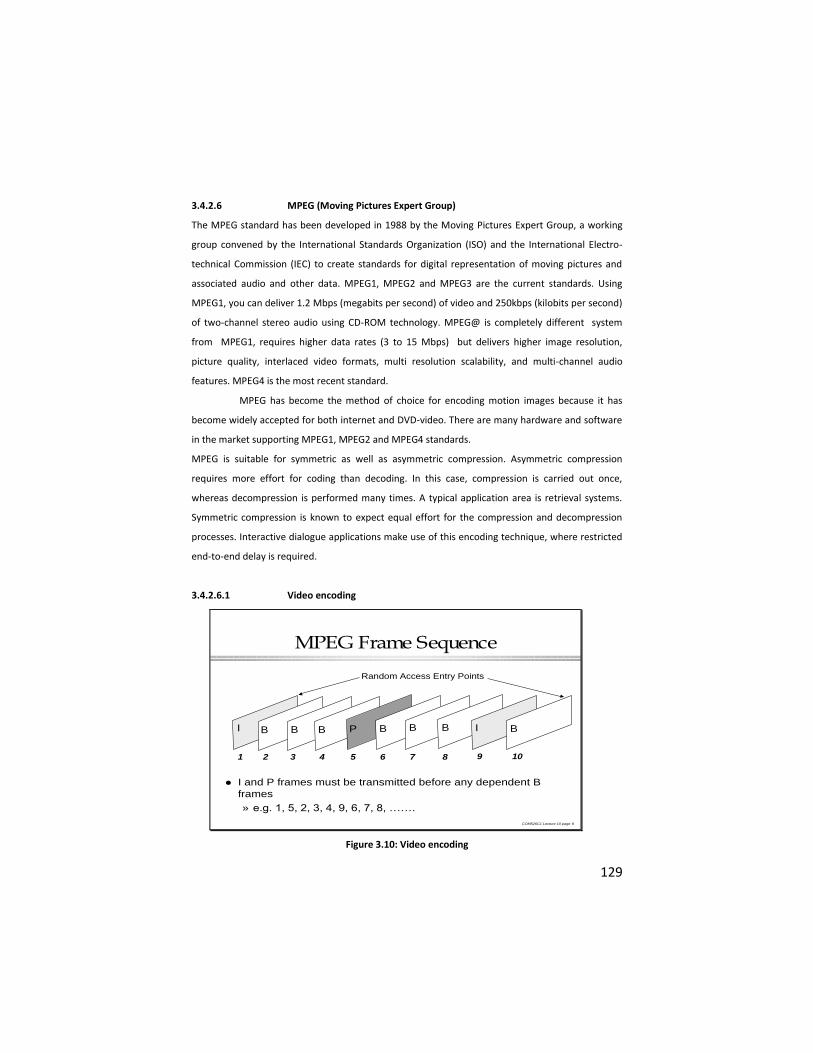
129
3.4.2.6 MPEG (Moving Pictures Expert Group)
The MPEG standard has been developed in 1988 by the Moving Pictures Expert Group, a working
group convened by the International Standards Organization (ISO) and the International Electro-
technical Commission (IEC) to create standards for digital representation of moving pictures and
associated audio and other data. MPEG1, MPEG2 and MPEG3 are the current standards. Using
MPEG1, you can deliver 1.2 Mbps (megabits per second) of video and 250kbps (kilobits per second)
of two-channel stereo audio using CD-ROM technology. MPEG@ is completely different system
from MPEG1, requires higher data rates (3 to 15 Mbps) but delivers higher image resolution,
picture quality, interlaced video formats, multi resolution scalability, and multi-channel audio
features. MPEG4 is the most recent standard.
MPEG has become the method of choice for encoding motion images because it has
become widely accepted for both internet and DVD-video. There are many hardware and software
in the market supporting MPEG1, MPEG2 and MPEG4 standards.
MPEG is suitable for symmetric as well as asymmetric compression. Asymmetric compression
requires more effort for coding than decoding. In this case, compression is carried out once,
whereas decompression is performed many times. A typical application area is retrieval systems.
Symmetric compression is known to expect equal effort for the compression and decompression
processes. Interactive dialogue applications make use of this encoding technique, where restricted
end-to-end delay is required.
3.4.2.6.1 Video encoding
COM526C1 Lecture 10 page 8
MPEG Frame Sequence
I B B B B B B BIP
Random Access Entry Points
1 2 3 4 5 6 7 8 9 10
I and P frames must be transmitted before any dependent B
frames
» e.g. 1, 5, 2, 3, 4, 9, 6, 7, 8, …….
Figure 3.10: Video encoding
130
MPEG distinguishes four types of image coding for processing, which is as shown in the above
figure. The reasons for this are to achieve efficient coding and fast random access. To achieve a
high compression ratio, temporal redundancies of subsequent pictures must be exploited, this
requires interframe coding. Whereas the demand for fast random access requires intra-frame
coding. The following types of frames are distinguished in MPEG.
• I-frames (Intra-coded frames) are coded without reference to other frames. They
provide access points to the coded sequence where decoding can begin but are coded with only
moderate compression. They also serve as reference frames for predictive coded frames. MPEG
makes use of JPEG for I-frames. I-frames use 8 X 8 blocks defined within a macro black, on which a
DCT is performed. The DC-coefficients are then DPCM coded.
• P-frames (Predictive-coded frames) that are coded more efficiently using motion
compensated prediction from a past I-frame and are generally used as a reference for further
prediction
• B-frames are bidirectional predictive coded frames that provide the highest degree of
compression but require both past and future reference frames for motion compensation. B-
frames are never used as references for prediction.
• D-frames are DC-coded frames that are coded without reference to other frames. Of the
DCT coefficients, only the D ones are present. The D-frames are not used in a sequence containing
any other picture types. D-pictures are intended only for a fast-forward search mode.
I-frames and P-frames are generally called reference frames, and P-frames and B-frames
are generally called predictive-coded frames. The organization of the three types of frames in a
video sequence is very flexible. The choice is left to the encoder and depends on the requirements
of the application. Typically, an I-frame may occur every half-second to give reasonably fast access,
with two B-frames inserted between each pair of I or P-frames.
An example frame sequence is shown in figure. Frames 1 and 9 are I-frames and coded
without reference to other frames. Frame 5 is a P-frame and coded with reference to frame 1.
Frames 2, 3 and 4 are B-frames and coded with reference to both frames 1 and 5. If B-frames are
used some reordering of the frame is necessary. Because B-frames are coded using bidirectional
motion-compensated prediction, they can only be decoded after the future reference frame (I or P
frame) has been decoded.
Therefore, the frames are ordered by the encoder so that the frames arrive at the
decoder in the order for decoding, called bit stream order. The natural order of frame sequence
when they’re captured and in which frames should be displayed is called display order. The display
131
order is recovered by the decoder. For example, frames in the above figure are shown in display
order. When they are transmitted, they should be reordered by the encoder into the following bit
stream order. 1(I), 5(P), 2(B),3(B),4(B), 9(I), 6(B), 7(B), 8(B) ,….. When B-frames are used in a frame
sequence, a significant delay occurs at both the encoder and decoder.
At the encoder, B-frames are encoded only when the future reference frame has been
buffered. If the future reference frame is n frames away from the B-frame , then the B-frame must
wait for a time period equal to n frames time. For example, if n is equal to 2 and the frame rate is
25 frames per second, then the B-frame must wait for 80 ms before it can be decoded. At the
decoder, the future reference frame must be decoded first but cannot be displayed until the B-
frames using it as the future reference frame have been decoded and displayed. Therefore, B-
frames should not be used for real-time applications; otherwise, the end-to-end delay is excessive.
3.5.0 Networks for Multimedia Systems
3.5.1 Introduction
The features of various networks, suitable for multimedia information transmission: a Multimedia
networking system allows for the data exchange of discrete and continuous media among
computers. This communication requires proper services and protocols for data transmission. The
most important issue in multimedia networking is to provide performance guarantees while at the
same time using the network resources efficiently. There are many important design goals for
multimedia systems. There are five criteria's to be satisfied for multimedia communication to
happen. Also, there are many networks like LAN, MAN and WAN, which are capable of transmitting
multimedia information. For example FDDI for LAN, and, DQDB for MAN, are the good candidates
for multimedia communications. ATM is also suitable for multimedia communications.
3.5.2 Design goals of multimedia systems
The important common design goals of any multimedia system are, the system should have
sufficient resources to support multimedia applications
• The system should be able to use available resources efficiently
• The system should be able to guarantee application QOS requirements
• The systems should be scalable.
Each subsystem should have sufficient types and amounts of resources TP support multiple
applications simultaneously. An end system should be able to process multiple applications.
Networks, servers, and storage devices, we are using, should be able to support a number of
sessions or streams simultaneously.
132
This number must be high enough to make the operation of the system economical. For
example it does not make any sense if only ones user can access and use a video server at a time,
the idea is served only if many are capable are accessing the video server. Similarly happens in the
case of audio also. Whatever the resources, we are using in a multimedia system are shared among
many applications, they must be shard in an efficient way so that the maximum number of
applications can be supported given a certain amount of resources. This can be achieved by making
use of the fact that multimedia information needs only a statistical or soft guarantee and
compressed multimedia data are bursty. So we can always use statistical multiplexing to make
efficient use of network bandwidth and use different traffic priorities to achieve the best
presentation quality by transmitting the minimum amount of data.
It is undesirable if the available resources are shared by many multimedia applications,
but no application gets the required service quality. Therefore, the important challenge is to use
resources efficiently and at the same time to guarantee Quality of |Service (QOS) for each
multimedia application.
Lastly, multimedia communications architecture should be scalable and extensible to
meet growth in user requirements and demands. Scalability refers to the system ability to adapt to
change in the number of users to be supported, the amount of information to be stored and
processed, and the geographical area to be covered by the network.
3.5.3 Network characteristics suitable for multimedia communications
We discussed the four general design goals of multimedia systems in the previous paragraph. The
following are the four different criteria to determine the suitability of a particular network
technology for a multimedia communications, to achieve the design goals.
The five important criteria are:
• The network bandwidth should be sufficiently high to support many applications at the
same time.
• Network resources should be shared efficiently among applications so that as many
applications as possible are supported given certain resources
• The network should provide performance guarantees, if required, to applications
• The network should be scalable.
• Multicasting capability
133
3.5.3.1 Network speed or bandwidth
High bandwidth is the basic requirement for supporting multimedia communications. Without
sufficient bandwidth, the network is definitely unsuitable for multimedia communications as high
bandwidth is the basic characteristics of multimedia applications. The networks transmission
capability is normally referred as its speed. The speed at which the data bits are transmitted over
different networks and transmission media are more or less similar.
Network speed is determined by the physical transmission medium used, protocols,
distance between immediate nodes, and switching speed of intermediate nodes. Among twisted
pair, coaxial cable, and optic fiber, we are using for this purpose; optical fiber offers the highest
transmission bandwidth. In theory, a single optical fiber can support transmission of few terabits of
information.
We should distinguish speed at two different points of a network. One point is a user
access point. The bandwidth at this point is called user access bandwidth. With compression, each
user needs a few Mbits/s to support multimedia applications. For example, receiving and
transmitting a high-quality video channel, a number of audio channels and some other data at the
same time require a bandwidth of about 10 Mbits/s for each user access point for both directions.
Note that for information-retrieval-type applications, the outgoing channel bandwidth required is
very small, perhaps a few hundred Kbits/s is sufficient.
But to support both conversational and retrieval applications using single network
access point, the same amount of bandwidth should be available for both directions.
Another important network bandwidth is between network exchanges over a long
distance. This bandwidth is often called aggregate bandwidth and should be at least a few hundred
Mbits/s to support a reasonable number of users and applications at the same time. At this speed
over a long distance, optical fiber is a better choice.
3.5.3.2 Efficient sharing of network resources
Because each user requires a large amount of bandwidth, network bandwidth is very valuable.
Multimedia data are bursty, especially after compression. Therefore, if each user reserves a
bandwidth equal to its peak bit rate, some bandwidth is wasted when the output bit rate is not at
the highest. The best approach is to use the principle of bandwidth or demand or statistical
multiplexing: an application can use as much bandwidth as it needs subject to a maximum value.
When the application is not using some or all its maximum bandwidth, other applications can use it
It is clear that circuit-switching technology is not suitable, because it sets up a circuit of
fixed bandwidth between source and destination even though the bandwidth may not be used
134
fully. Likewise, synchronous time division multiplexing (STDM) packet switching is not suitable
because the bandwidth for each channel is fixed regardless of its usage, therefore a form of packet-
switching network is more suitable for efficient use of network resources. Note that this discussion
on bandwidth-use efficiency is valid in a wide area context where many connections are used.
3.5.3.3 Network should provide performance guarantees
The network which we are using for multimedia applications should provide performance
guarantees, if required to applications. The following techniques are needed to use network
resources efficiently and at the same time to guarantee application performance:
• Characteristics of different types of traffic should be determined in terms of peak data
rate, average date rate, bursty intervals, delay, and delay jitter requirements. This traffic
information should be conveyed to the network when a connection for the traffic is requested. The
network uses this information to decide whether to accept the connection request. The network
also uses this information to check whether the channel violates its requested requirement during
the session. Traffic characteristics can be thought of as a set of QOS requirements at the network
level.
• Network access time should be guaranteed.
• Network resources (bandwidth and buffer queues) should be managed efficiently so
that as many applications as possible are supported with performance, guarantees. This area is
sometimes called network dimensioning, which studies how many connections can be supported
given a certain amount of network resources and traffic characteristics, so that the performance of
each connection is guaranteed . Stated in another way, the goal of network dimensioning is to
determine the amount of resources or equipment required to satisfy the specified traffic demand.
3.5.3.4 Network scalability
There are three types of scalability: distance, bandwidth, and the number of users. In terms of
distance, we have. LANs, MANs and WANs, the same network architecture and protocol should be
able to operate on all of these. The interconnection between these networks is easy, when the
architecture and protocols are same. In terms of bandwidth, the network bandwidth should be able
to grow with the growth of user's bandwidth demands without changing the network protocol. The
network should be able to support a large number of users and the available bandwidth to each
should not be affected by the number of active stations connected to the network. Most LANs use
a shared medium; all stations being attached to a common transmission medium and share the
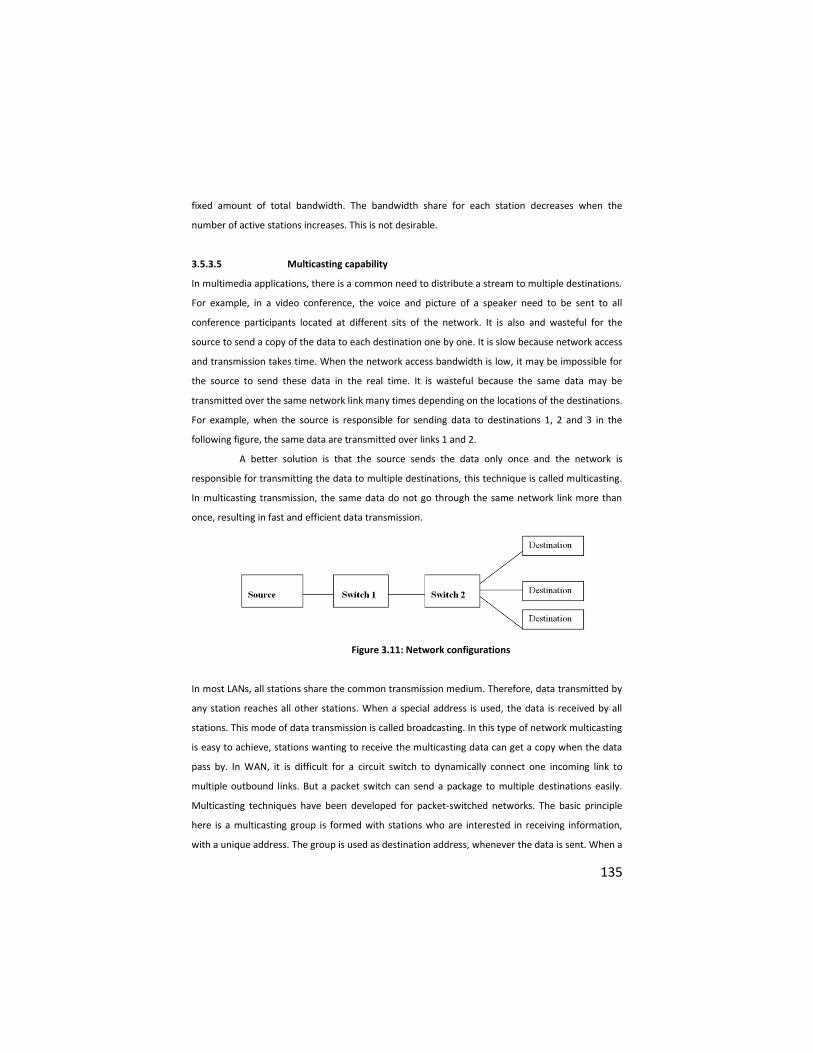
135
fixed amount of total bandwidth. The bandwidth share for each station decreases when the
number of active stations increases. This is not desirable.
3.5.3.5 Multicasting capability
In multimedia applications, there is a common need to distribute a stream to multiple destinations.
For example, in a video conference, the voice and picture of a speaker need to be sent to all
conference participants located at different sits of the network. It is also and wasteful for the
source to send a copy of the data to each destination one by one. It is slow because network access
and transmission takes time. When the network access bandwidth is low, it may be impossible for
the source to send these data in the real time. It is wasteful because the same data may be
transmitted over the same network link many times depending on the locations of the destinations.
For example, when the source is responsible for sending data to destinations 1, 2 and 3 in the
following figure, the same data are transmitted over links 1 and 2.
A better solution is that the source sends the data only once and the network is
responsible for transmitting the data to multiple destinations, this technique is called multicasting.
In multicasting transmission, the same data do not go through the same network link more than
once, resulting in fast and efficient data transmission.
Figure 3.11: Network configurations
In most LANs, all stations share the common transmission medium. Therefore, data transmitted by
any station reaches all other stations. When a special address is used, the data is received by all
stations. This mode of data transmission is called broadcasting. In this type of network multicasting
is easy to achieve, stations wanting to receive the multicasting data can get a copy when the data
pass by. In WAN, it is difficult for a circuit switch to dynamically connect one incoming link to
multiple outbound links. But a packet switch can send a package to multiple destinations easily.
Multicasting techniques have been developed for packet-switched networks. The basic principle
here is a multicasting group is formed with stations who are interested in receiving information,
with a unique address. The group is used as destination address, whenever the data is sent. When a
136
switch receives a packet with the group address, it will send packets on the links leading to stations
belonging to this group, the same packet will not be sent twice over the same link.
One more situation related to multicasting is when a station needs to communicate with
more than one other station through one network access point. For example, a user may need to
retrieve information from more than one server at the same time while he or she is communicating
with another person using audio and video. This is not achievable using a circuit-switched network,
though it is with packet-switched network, which allows the setup of multiple virtual circuits from
one access point to multiple stations. The conclusion is packet switched networks are more suitable
for multimedia communications.
3.5.3.6 Networks suitable for multimedia communications.
The network technologies which are suitable for multimedia communication should meet the
following requirements.
• The individual access bandwidth should be at least a few Mbps. The aggregate band
width should be at least in the order of 100 Mbps at the local area, and higher for WANs.
• The network should be based on packet switched statistical multiplexing instead of
dedicated circuits for efficient sharing of network resources.
• The network should provide throughput, error rate, delay, and jitter guarantee to
applications.
• The network should be scalable in terms of bandwidth, the number of users, and
distance covered.
• The network should have multicasting capability. It is easier to implement multicasting
in packet-switched networks than in circuit switched networks.
With the above requirements, we need to determine which networks are
potentially suitable for multimedia communications. The following are the list, which gives a brief
idea. We know, there are three network categories, they are, LAN (Local Area Networks), MAN
(Metropolitan Area Networks), and WAN (Wide Area Networks).
In the LAN category the common Networks are:
• 10-Mbps Ethernet based on CSMA/CD (IEEE 802.3)
• 10-Mbps token bus (IEEE 802.4)
• 4- or 16-Mbps token ring (IEEE 802.5)
• 100-Mbps FDDI
• ATM LAN
137
The common MAN is 100-Mbps DQDB. The FDDI is also sometimes classified as MAN. The following
networks provide WAN services:
• Circuit-switching ISDN
• X.25
• Frame relay
• Switched Multimegabit Data Service (SMDS)
• ATM networks.
Even though, we have listed many networks, above, we will not use all of them for
multimedia communications. We eliminate some of the networks which are not suitable for
multimedia communications based on the five requirements listed in the previous paragraph.
The bandwidth of common LANs except FDDI and ATM LAN is too low to support
general-purpose multimedia applications. Therefore, common LANs, except FDDI and ATM LAN are
not suitable for multimedia communications.
FDDI and DQDB are reasonably fast and have features suitable for supporting real time
communications, so they can be used as multimedia LANs or MANs. Both of the above network
technologies uses shared medium. Hence available bandwidth to each station decreases as the
number of active stations increases. Scalability is a problem in these networks.
ATM technology has been used in LANs. Currently these ATM LANs are mainly used to
carry conventional computer data; they are potentially suitable for carrying multimedia data.
Circuit-switching networks (including ISDN) can provide performance guarantees within
the bandwidth supported. But they cannot use resources efficiently and cannot support
multicasting and multiple connections over one access point. Therefore, these networks are not
good candidates for general purpose multimedia applications. These types of networks are
normally used for videophone and videoconference.
X.25, frame relay, and SMDS are designed for carrying non-real-time data and cannot
provide performance guarantees, hence these are not considered for multimedia communications.
ATM is the network, which promises to meet all the five requirements and is potentially suitable for
multimedia applications. B-ISDN supports all types of applications. The ATM was originally designed
for WANs; it can be used for in LANs to overcome the scalability problem of shared medium of
other LANs. In addition to the above networking technologies, which are suitable for multimedia
communications, there is another class of networking technology specifically for the home
multimedia needs. The basic characteristics of this class of technology is to use existing telephone
lines and TV cables to provide digital services such as video on demand (VOD), by using advanced
modulation techniques.
138
3.6.0 Multimedia Communication Systems
3.6.1 Introduction
The various multimedia applications supports the view that, the local systems, we are using are
expanding towards distributed solutions. Multimedia applications such as, multimedia mail, various
types of kiosks, collaborative work systems, virtual reality applications, and other applications
require high speed networks with a high transfer rate (bandwidth) and communication systems
with adaptive, lightweight transmission protocols, on top of these networks. In the previous unit,
we discussed, high speed network requirements, like, low latency for interactive operations, high
bandwidth of the order of above 10 Mbps, and low error bit rate. Several networks were discussed
that are capable of supporting multimedia applications. The networks are high speed Ethernet,
FDDI, and ATM networks with bandwidth of 100 Mbps and above.
The important issues related to multimedia communication systems above the data link
layer. Multimedia communication system is divided into two subsystems: an application subsystem
and a transport subsystem. The application sub-systems are associated with, management and
service issues. The transport subsystem includes the transport and network layer protocols that are
used for standard multimedia applications.
3.6.2 Application Subsystem
3.6.2.1 Collaborative computing
The currently available infrastructure for networked workstations and personal computers (PCs),
and availability of audio and video at these end points, makes the people easier to cooperate and
bridge space and time. That means, because of network connectivity, and end-point integration of
multimedia provides users with a collaborative computing environment. Collaborative computing is
generally known as Computer-Supported Cooperative Work (CSCW). For this CSCW, many tools are
available. The tools such as electronic mail (simply E-mail) bulletin boards (Usenet news), text
based conferencing systems, screen sharing tools, telephone conference systems, and video
conference systems are the examples. Also, many CSCW systems are already implemented and are
available in the literature. We are looking at the framework for collaborative computing and
general issues with respect to different systems and tools.
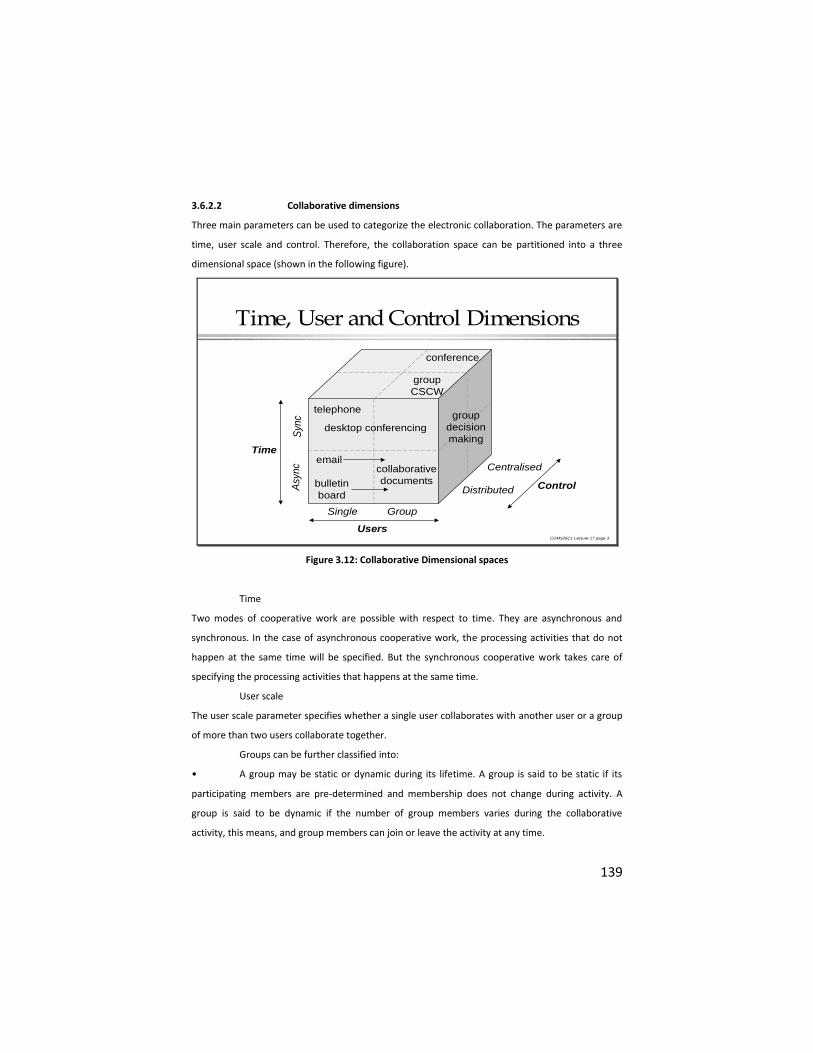
139
3.6.2.2 Collaborative dimensions
Three main parameters can be used to categorize the electronic collaboration. The parameters are
time, user scale and control. Therefore, the collaboration space can be partitioned into a three
dimensional space (shown in the following figure).
COM526C1 Lecture 17 page 3
Time, User and Control Dimensions
Time
Asy
nc
Syn
c
Users
Single Group
ControlDistributed
Centralisedemail
bulletin
board
telephone
desktop conferencing
collaborative
documents
conference
group
CSCW
group
decision
making
Figure 3.12: Collaborative Dimensional spaces
Time
Two modes of cooperative work are possible with respect to time. They are asynchronous and
synchronous. In the case of asynchronous cooperative work, the processing activities that do not
happen at the same time will be specified. But the synchronous cooperative work takes care of
specifying the processing activities that happens at the same time.
User scale
The user scale parameter specifies whether a single user collaborates with another user or a group
of more than two users collaborate together.
Groups can be further classified into:
• A group may be static or dynamic during its lifetime. A group is said to be static if its
participating members are pre-determined and membership does not change during activity. A
group is said to be dynamic if the number of group members varies during the collaborative
activity, this means, and group members can join or leave the activity at any time.
140
• Group members may have different roles in the CSCW, in which they are participating.
For example a member of group (if already listed in the group definition), a participant of a group
activity (who successfully joins the conference), a conference initiator, a conference chairman, a
token holder or an observer.
• Groups may consist of members who have homogeneous or heterogeneous
characteristics and requirements of their collaborative environment, in which they are
participating.
Control
Control during the collaboration can be centralized or distributed. Centralized control means that
there is a chairman (for example main manger) who controls the collaborative work and every
group member (for example the user agent) reports to him or her. Distributed control means that
every group member has control over his or her own tasks in the collaborative work and
distributed control protocols are in place to provide consistent collaboration.
Apart from above three parameters like time, user scale and control, other partition
parameters may include are locality, collaboration awareness.
Locality
Locality partition means that a collaboration can occur either in the same place (example is a group
meeting in an office or conference room) or among users located in different places via Tele-
collaboration (for example conversation between the persons sitting in various rooms via
equipment).
Collaboration awareness
This parameter divides group communication systems into collaboration-transparent, and
collaboration aware systems. The collaboration transparent system is an existing application
extended for collaboration. For example, some new document editing systems are collaboration
transparent because single user document editors can be expanded for simultaneous editing of a
shared document among several users. The text processor or spread sheet packages are example
for this. The collaborative-aware system is a dedicated software application for CSCW. For example,
a teleconferencing or video conferencing system is a collaborative-aware system.
Group communication systems can be further categorized into computer-augmented
collaboration systems, where collaboration is used to maximum extent, and collaboration-
augmented computing systems, where the concentration is on computing.
Computer-augmented collaboration is centered on a social activity, for example, the
case of discussion or decision making. The computers and networks help to improve the activity.
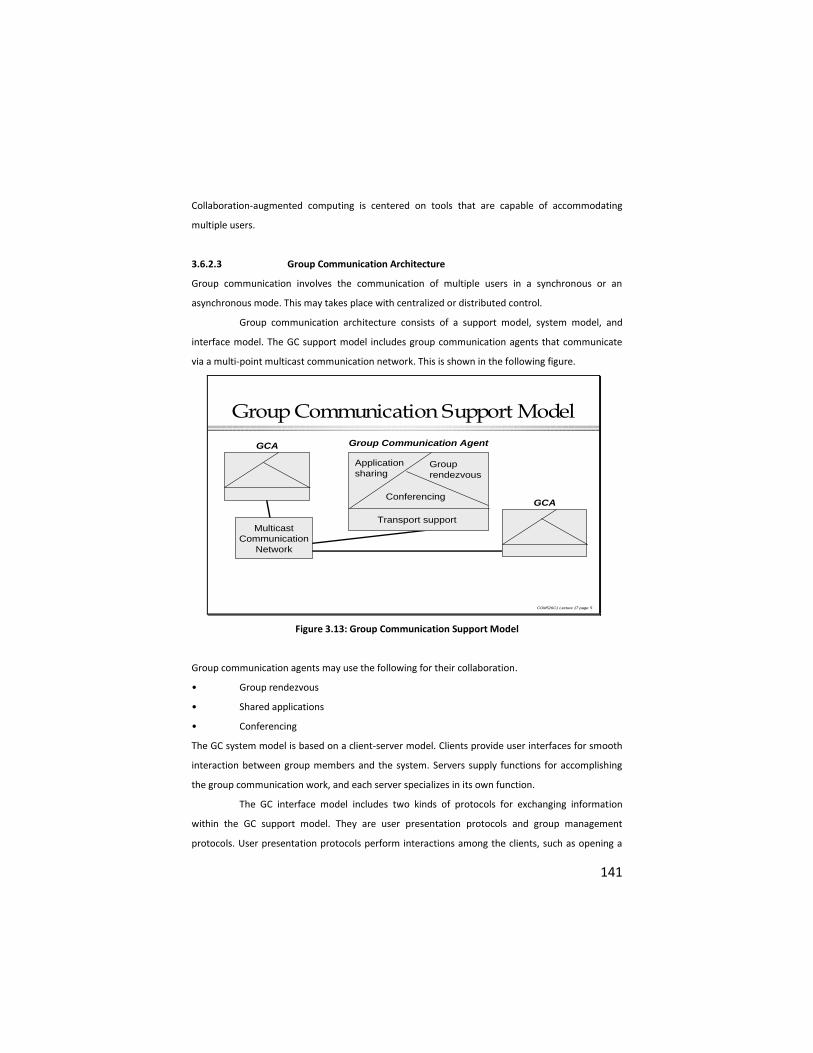
141
Collaboration-augmented computing is centered on tools that are capable of accommodating
multiple users.
3.6.2.3 Group Communication Architecture
Group communication involves the communication of multiple users in a synchronous or an
asynchronous mode. This may takes place with centralized or distributed control.
Group communication architecture consists of a support model, system model, and
interface model. The GC support model includes group communication agents that communicate
via a multi-point multicast communication network. This is shown in the following figure.
COM526C1 Lecture 17 page 5
Group Communication Support Model
Group
rendezvous
Conferencing
Application
sharing
Transport support
Group Communication Agent
GCA
GCA
Multicast
Communication
Network
Figure 3.13: Group Communication Support Model
Group communication agents may use the following for their collaboration.
• Group rendezvous
• Shared applications
• Conferencing
The GC system model is based on a client-server model. Clients provide user interfaces for smooth
interaction between group members and the system. Servers supply functions for accomplishing
the group communication work, and each server specializes in its own function.
The GC interface model includes two kinds of protocols for exchanging information
within the GC support model. They are user presentation protocols and group management
protocols. User presentation protocols perform interactions among the clients, such as opening a
142
conference, closing a conference, dynamic joining and leaving of a meeting and floor passing.
Group work management protocols specify the communication between the clients and servers.
Services such as registration of active conferences and queries for further conference information
are supported by these protocols.
3.6.2.4 Group Rendezvous
Group rendezvous denotes a method which allows one to organize meetings and to get
information about the group, ongoing meetings and other static and dynamic information. The
group rendezvous tools provide a single set of session (example is conference) and activity
information at the user interface. There are synchronous and asynchronous methods for group
rendezvous.
• Synchronous rendezvous methods: Synchronous rendezvous methods use directory
services and explicit invitations. Directory services access information stored in a knowledge base
about the conference, such as the name of the conference, registered participants, authorized
users and name and role of the participants. The explicit invitations method sends either point-to-
point or point-to-multipoint to conference participants. The problem in this case is that calling
others requires the initiator of the conference to know where the user resides.
• Asynchronous rendezvous methods: asynchronous rendezvous methods may be
implemented by means of using -mail or bulletin boards. Already existing e-mail infrastructure can
be used for this. This helps to distribute the information as well as addressing the end users.
Bulletin boards are used to support asynchronous rendezvous. The seminars, classes, conferences
and other open meetings are already announced on the internet. The World Wide Web (WWW) is
successfully used for this purpose.
3.6.2.5 Sharing applications
Sharing applications is recognized as a vital mechanism for supporting group communication
activities. Sharing applications means that when a shared application program executes any input
from a participant, all execution results performed on the shared object is distributed among all the
participants. For example, the editor can be used to share the document text among several users.
Shared objects are displayed, generally in shared windows.
Application sharing is most often implemented in collaboration transparent systems.
But this can also be developed through collaboration-aware, special purpose applications. Shared
applications may be used as conversational props in tele-conferencing situations for collaborative
document editing and collaborative software development.
143
An important issue in application sharing is shared control. While designing the sharing
applications the primary decision is to determine whether they should be centralized or replicated.
The decision is to design for centralized architecture, in this case a single copy of the shared
application runs at one sit. All participants input to the application is forwarded to the local site and
the applications output i.e., shared object is then distributed to all sites. The advantage of the
centralized approach is easy maintenance because there is only one copy of the application that
updates the shared object. The disadvantage of centralized architecture is high traffic network
because the output of the application needs to be distributed every time. In the case of images, the
output data traffic may be significant. This means that a high-bandwidth network is needed.
In case of replicated architecture, a copy of the shared application runs locally at each
site. Input events to each application are distributed to all sites and each copy of the shared
application is executed locally at each site. The advantage of this architecture are low network
traffic, because only input events are distributed among the sites , and low response times, since all
participants get their output from local copies of the application. The disadvantages are the
requirement of the same execution environment for the application at each site, and the difficulty
in maintaining consistency.
3.6.2.6 Conferencing
Conferencing supports collaborative computing, which is called synchronous collaboration.
Conferencing is a management service that controls the communication among multiple users via
multiple media, such as video and audio, to achieve simultaneous face-to-face communication.
Video is used in technical discussions to display view-graphs and to indicate how many
users are still physically present at a conference. Video walls, PCs, or workstations can be used for
visual support.
Audio is an important component in teleconferencing for describing and clarifying visual
information. Therefore, quality audio is maintained.
Conferencing services rely on low network latency for acceptable user interactivity and
high bandwidth for potentially data-intensive media. They also relay on distributed messaging for
transmission of data and/or control information. Conferencing services control a conference, and
these include several functions.
• Establishing a conference, where the conference participants agree upon a common
state, such as identity of a chairman, access rights and audio encoding. Conference systems may
perform registration, admission, and negotiation services during the conference establishment
144
phase, but they must be flexible and allow participants to join and leave individual media sessions
or the whole conference.
• Closing a conference.
• Adding new users and removing users who leave the conference.
Conference states can be stored either on a central machine, means centralized control,
where a central application acts as the repository for all information related to the conference, or
in a distributed form. The control model follows from the location of the conference state.
Accordingly, the control model may be either centralized or distribute.
3.6.3 Session management
Another important part of multimedia communication architecture is session management. It is the
core part which separates the control, needed during the transport, from the actual transport.
3.6.3.1 Architecture
Session management architecture is built around an entity called session manager, which separates
the control from the transport. By creating a reusable session manager, which is separated from
the user-interface, conference oriented tools avoid a duplication of their effort.
The following are the components of the session control architecture:
Session Manager
The activities of the session manager include local and remote functionalities.
Local functionality’s may include:
• Membership control management, such as participant authentication r presentation of
coordinated user interfaces.
• Control management for shared workspace, such as floor control
• Media control management, such as intercommunication among media agents or
synchronization
• Configuration management, such as exchange of parameters or selection of appropriate
services.
• Conference control management such as an establishment, modification and a closing
of a conference.
Remotely, the session manager communicates with other session managers to exchange
session state information which may include the floor information, configuration information etc.
Depending on the conference systems, the conference control and floor control can be embedded
either in the application layer or in the session layer
145
Media Agents
Media agents are separate from the session manager and they are responsible for decisions
specific to each type of media. This modularity allows a replacement of agents. Each agent
performs its own control mechanism over the particular medium, such as mute, unmute, change
video quality, audio quality, start sending, stop sending, etc.
Shared Workspace Agent
The shared workspace agent transmits shared objects among the shared application. The graphical
or textual objects are the examples for shared object.
3.6.3.2 Control
Each session is described through its session state. The session state information includes, time of
session, policies associated with the session, session name, etc. this state information is either
private, in case of local resources, or shared among all session participants , for all conference
participants.
Session management includes two steps to process the session state: an establishment
and a modification of the session. During the establishment, the session manager negotiates,
agrees, and sets the logical state of its own session. Also, it negotiates, agrees and sets billing policy
and any other policies with the session managers. Next, it permits publishing a session, allowing
others to locate and join a session. It negotiates and defines the transport topology with the
transport subsystem.
Depending on the functions, which an application requires and a session control
provides, several control mechanisms are embedded in session management.
Floor control: if we are using shared workspaces, the floor control is employed to
provide access to the shared workspace. The floor control in shared applications is often used to
maintain data consistency. In the simplest form of floor control, applications use a floor passing
mechanism. The floor passing mechanism means that at any time, only one participant has the
floor. The floor is handed off to another participant when requested. To obtain the floor, the
participant must explicitly take action to signal a floor change.
Conference control: for conferencing applications, conference control is employed.
Conference control functions are, establishing a conference, closing a conference, and, adding new
users and removing users who leave the conference.
Media control: Media control mainly includes functionality, such as the synchronization
of media streams.
146
Configuration control: configuration control includes a control of media quality, QoS
(quality of service) handling, resource availability and other system components to provide a
session according to users’ requirements.
Membership control: Membership control may include services, for example, invitation
to a session, registration into a session, modification of the membership during the session etc.
3.6.4 Transport Subsystem
Transport subsystem is associated with transport and network protocol and their functionalities,
which are used for multimedia information transmission. Depending on the task and its suitability,
these protocols are used. Here we have a brief discussion about these protocols.
3.6.4.1 Requirements
If we are using distributed multimedia applications, these applications put new requirements on
application designers, as well as network protocol and system designers. The following are the
most important enforced requirements with respect to the multimedia transmission.
3.6.4.2 User and Application requirements
Networked multimedia applications by themselves impose new requirements onto data handling in
computing and communications because they need
• Substantial data throughput
• Fast data forwarding
• Service guarantees
• Multicasting
Substantial data throughput: Audio and video data, demand, high data throughput, even
in a compressed mode. In a workstation or network, several of these files may exist concurrently
demanding a high throughput. In these cases, the data copying can create a bottleneck in the
system, because of their size.
Fast Data Forwarding: Fast data forwarding imposes a problem on end-systems where
we are using different applications in the same end-system. Each of these end-systems may require
data movement ranging from normal, error free data transmission to new time constraint data
transmission. In a retrieval system, like IOD (Information on demand, or VOD (video on demand), a
delay of up to one second may be easily tolerated. But in the dialogue, application like videophone
or videoconference demands less than 200 msecs of end-to-end delay, which gives a natural
communication between the users.
147
Service guarantees: Distributed multimedia applications need service guarantees;
otherwise, their acceptance does not come through as these systems. Working with continuous
media, compete against other services like radio and television. To achieve service guarantees,
resource management must be used. Without resource management in end systems and
switches/routers, multimedia systems cannot provide reliable quality of service to their users
because transmission over unreserved resources leads to delayed or dropped packets.
Multicasting: multicasting is important for multimedia applications in terms of sharing
resources like the network bandwidth and the communication protocol processing at end-systems.
3.6.4.3 Processing and Protocol constraints
Communication protocols have some constraints which need to be considered when we want to
match application requirements to system platforms.
A typical multimedia application does not require processing of audio and video to be
performed by the application itself. Usually the data are obtained from a source (microphone,
cameras, disk, and network) and are forwarded to a sink (speaker, display, and network). In such
cases the requirements of continuous media, data is satisfied by transferring via shortest possible
path. This is possible by connecting the sources to sinks directly with appropriate switches. In
practice, we encounter headers and trailers surrounding continuous media data coming from
devices and being delivered to devices. In the case of compressed video data, for example MPEG,
MPEG2. The program stream contains several layers of headers compared with the actual group of
pictures to be displayed.
Protocols involve a lot of data movement because of the layered structure of the
communication architecture. But copying of data is expensive and has become a major bottleneck.
The lower layer of protocols must be done in hardware, or through efficient mechanisms in
software. Some parts of the protocols may use retransmission error recovery mechanism which
imposes requirements on buffer space for queues at the expense of large end-to-end delays. The
new underlying packet/cell networks which work in an asynchronous transfer mode put
requirements on the protocol design for continuous media.
3.6.5 Transport Layer
Transport protocols, which support multimedia information transmission, need to have new
features and must provide the following functions.
• Timing information
• Reliability
148
• Multicasting
• NAK (None-acknowledgement) base error recovery mechanism
• Rate control
TCP and UDP are the transport protocols, which are used in the internet protocol stack for
multimedia transmission. There are new emerging standards for transport protocols, such as RTP,
XTP and other protocols, which are suitable for multimedia transmission. Here we are briefly
discussing all these protocols.
3.6.5.1 Internet Transport Protocols
The Internet protocol stack includes two types of transport protocols, they are:
1. Transmission Control Protocol (TCP)
Early implementations of some multimedia applications were implemented on top of the TCP
protocol. The best example for this is video conferencing. TCP provides a reliable, serial
communication path, or virtual circuit, between processes exchanging a full duplex stream of bytes.
Each process is assumed to be in an Internet host that is identified by an IP address. Each process
has a number of logical, full-duplex ports through which it can set up and use as full-duplex TCP
connections.
Multimedia applications do not always require full-duplex connection for the transport
of continuous media. An example is a TV broadcast over LAN, which requires a full-duplex control
connection, but often a simplex continuous media connection is sufficient.
During the data transmission over the TCP connection, TCP must achieve reliable,
sequenced delivery of stream of bytes by means of an underlying, unreliable datagram service. To
achieve this, TCP makes use of retransmission on timeouts and positive acknowledgments upon
receipt of information. Because retransmission can cause both out-of-order arrival and duplication
of data, sequence numbering is crucial. Flow control in TCP makes use of a window technique in
which the receiving side of the connection reports to the sending side the sequence numbers it
may transmit at any time and those it has received continuously thus for.
For multimedia applications, the positive acknowledgement causes substantial overhead
as all packets are sent with a fixed rate. Using the negative acknowledgement would be a better
idea. The TCP is not suitable for real time applications like video and audio transmission because its
retransmission mechanism may cause a violation of deadlines which disrupt the continuity of the
continuous media streams. TCP was designed as a transport protocol suitable for non-real-time
reliable applications, such as file transfer where it performs the best.
149
2. User Datagram Protocol (UDP)
UDP is a simple extension to the Internet network protocol IP that supports multiplexing of
datagrams exchanged between pairs of internet hosts. It offers only multiplexing and
checksumming. Higher level protocols using UDP must provide their own retransmission,
packetization, reassembly, flow control, congestion avoidance, etc.
Many multimedia applications use this protocol because it provides to some degree the
real-time transport property, although loss of PDUs may occur. In general, UDP is not suitable for
continuous media streams because it does not provide the notion of connections, at the transport
layer, therefore, different service guarantees cannot be provided.
Several extensions are proposed to increase the performance of TCP and UDP protocols
so that larger group of applications, including multimedia applications can use them. Large
windows and time stamps are now standardized. Also, selective acknowledgement might be taken
in.
6.5.2 Real-time Transport Protocol (RTP)
RTP is an end-to-end protocol providing network transport functions suitable for applications
transmitting real time data such as audio, video and animation over multicast or unicast network
services. RTP has a companion protocol RTCP (RTP-control protocol) to convey information about
the participants of a conference. RTP provides functions such as;
• Determination of media encoding
• Synchronization
• Framing
• Error detection
• Encryption
• Timing and source identification
RTCP is used for monitoring of QoS and for conveying information about the participants in the
ongoing session. The first aspect of RTCP, the monitoring, is done by an application called a QoS
monitor, which receives the RTCP messages. This monitor estimates the current QoS for
monitoring, fault diagnosis, and long-term statistics. The second aspect of RTCP is used for loosely
controlled sessions. RTP and RTCP information is transmitted through separate ports.
RTP does not address resource reservation and does not guarantee QoS for real-time
services. This means that it does not provide mechanisms to ensure timely delivery of data or
guaranteed delivery, but relies on lower-layer services to do so. Further, it does not guarantee
delivery or prevent out-of-order delivery, nor does it assume that the underlying network is reliable
150
and delivers packets in sequence. The RTP header carries sequence numbers to allow the end
system to reconstruct the sender's packet sequence, but also they can be used to properly place
the packet, example is in case of video decoding. RTP makes use of the network protocols ST-II or
UDP/IP for the delivery of data. It relies on the underlying protocols to provide demultiplexing.
3.6.5.3 Xpress Transport Protocol (XTP)
XTP was designed to be an efficient protocol, taking into account the low error ratios and higher
speeds of current networks. XTP integrates transport and network protocol functionalities to have
more control over the environment in which it operates. XTP is useful in a wide variety of
environments, from real-time control systems to remote procedure calls in distributed operating
systems and distributed databases to bulk data transfer. It denies the following six services for this
purpose, they are:
• Connection
• Transaction
• Unacknowledged datagram
• Acknowledged datagram
• Isochronous stream
• Bulk data
In XTP, the end-user is represented by a context becoming achieved within an XTP implementation.
Two contexts, may be several in multicast mode, are joined together to form an association. The
path between the two XTP sites is called a route. There are two types of XTP packets: information
packets which carry user data, and control packets which are used for protocol management.
For flow control, XTP uses sliding window, or rate-based flow control. If window based
control is selected, the window size is negotiated during the connection setup. To advance the flow
control window, XTP uses a combined mechanism between a cumulative acknowledgement and a
selective acknowledgement, with a run-length encoding.
Data packet retransmissions are triggered by the arrival of status reports showing
missing data. Status reports are requested and a certain timer controls the duration of the
response to the request. After the timer expires and a status report as not received, a new status
report is issued, and XTP enters a synchronizing handshake, where all further data transmission are
halted until the correct status is received. Therefore, XTP will never retransmit a data packet
without positive indication that it has not been received.
The error management is different for each of these service types. Therefore, XTP error
control is primary a set of building blocks, known as mechanism, from which a variety of error
151
control policies can be constructed. XTP allows the error features can be tailored to the needs of
the user.
XTP has some features, which meet the requirements for multimedia communications,
they are:
• XTP provides a connection-oriented transport and network transmission; XTP can be
used on ATM networks.
• Different transport services are provided. The services are connection-mode,
connectionless-mode, and transaction mode.
• Flexible error management allows the retransmission mechanism to be turned off,
which is useful for multimedia applications.
• XTP has rate-based flow control which allows it to provide a convenient mechanism for
throughput and bandwidth reservation when QoS request is issued.
There are some problems with XTP in regard to supporting continuous media transmission such as
audio, video and animation, which are a part of multimedia applications:
• XTP has a larger header, which creates an overhead of 44 bytes regardless of mode. For
example, if an audio stream, with 160-bytes of packet size (may be less for compressed audio
coding) is being transmitted, h he header overhead represents 27% of the body content.
• XTP was designed to be implemented in VLSI to achieve high performances, because it is
too complex. But most of the current implementations of XTP are done using software and their
performance is too slow for transmission of continuous media streams.
• Source identification and discrimination are missing in XTP. Source discrimination refers
to the necessity to discriminate among several sync and content sources, all arriving through the
same network transport association.
• If the round rotation time of underlying network (for example Ethernet) frequently
fluctuates, XTP constantly enters the synchronizing handshake which is very undesirable in high-
speed networks and for continuous media transmission
• Internetworking with other protocols available is not worked out properly, to provide
QoS handling and resource reservation.
3.7.0 Multimedia Operating systems
3.7.1 Introduction
The operating system is the shield of the computer hardware against all software components. It
provides a comfortable environment, for the execution of programs, and it ensures effective
152
utilization of the computer hardware. The operating system offers various services related to the
essential resources of a computer CPU, main memory, storage and all input and output devices.
For the processing of audio and video, multimedia application demands that humans
perceive these media in a natural, error freeway. These continuous media data originate at sources
like microphones, cameras and files. From these sources, the data are transferred to destinations
like, loudspeakers, video windows, and files located at the same computer or at a remote station.
On the way from source to sink, the digital data are processed by at least some type of move, copy
or transmit operation. In this data manipulation process there are always many resources which
are under the control of operating system. The integration of discrete and continuous multimedia
data demands additional services from many operating system components.
The major aspect is real time processing of continuous media data. Process
management must take into account the timing requirement imposed by the handling of
multimedia data. Appropriate scheduling methods should be applied. In contrast to the traditional
real-time operating system, multimedia operating systems also have to consider tasks without hard
timing restrictions under the aspect of fairness.
To obey timing requirements, single components are conceived as resources that are
reserved to prior to execution. This concept of resource reservation has to cover all resources on a
data path i.e., all resources that deal with continuous media. The communication and
synchronization between single processes must meet the restrictions of real-time requirements
and timing relations among different media. The main memory is available as a shared resource to
single processor.
In multimedia systems, memory management has to provide access to data with a
guaranteed timing delay and efficient data manipulation functions. For instance, physical data copy
operations must be avoided due to their negative impact on performance, buffer management
operations must be used.
Since the operating system shields devices from applications programs, it must provide
services for device management too. In multimedia systems, the important issue is the integration
of audio and video devices in a similar way to any other input/output device. The addressing of a
microphone can be performed similar to the addressing of keyboard in the same system. The
addressing of speakers can be performed similar to the addressing of the printer in the same
system, although most current systems do not apply this technique.
As the essential aspect of any multimedia operating system is the notion of real-time. A
real time process is process which delivers the results of the processing in a given time span.
Programs for the processing of data must be available during the entire run-time of the system. The
153
real time operating system has the permanent task of receiving information from the environment,
occurring spontaneously or in periodic time intervals, and/or delivering it to the environment given
certain time constraints.
There are many additional issues that the multimedia operating system should take care
of:
• Inter-process communication and synchronization.
• Memory management
• Device management
3.7.2 Resource Management
Multimedia systems with integrated audio and video processing are at the limit of their capacity,
even with data compression and utilization of new technologies. Current computers do not allow
processing of data according to their deadlines without any resource reservation and real-time
process management. Processing in this context refers to any kind of manipulation and
communication of data. This stage of development is known as the window of insufficient
resources. With CD-DA (Compact Disc Digital Audio) quality, the highest audio requirements are
satisfied. In video technology, the required data transfer rate will go up with the development of
digital HDTV and TV screens.
In a multimedia system, the given timing guarantees for the processing of continuous
media must be adhered to by every hardware and software system component along the data
path. The actual requirements depend on the type of media and the nature of the applications
supported. For example, a video image should not be presented late because the communication
system has been busy with a transaction from a database management system. In any realistic
scenario, we encounter several multimedia applications which concurrently make use of shared
resources. Hence, even high bandwidth networks and huge processing capabilities require the use
of real-time mechanisms to provide guaranteed data delivery. Further, the concept of integration
does not allow solving this problem just by a slight modification of the system for traditional
applications.
Thus, in an integrated distributed multimedia system, several applications compete for
system resources. This shortage of resources requires careful allocation. The system management
must employ adequate scheduling algorithms to serve the requirements of the applications.
Thereby, the resource is first allocated and then managed.
Resource management in distributed multimedia systems covers several computers and
the involved communication networks. It allocates all resources involved in the data transfer
154
process between sources and sinks. For instance, a CD-ROM / XA device must be allocated
exclusively, each CPU on the data path must provide 20% of its capacity, the network must allocate
a certain amount of its bandwidth and the graphic processor must be reserved up to 50% for such a
process. The required throughput and a certain delay are guaranteed. At the connection
establishment phase, the resource management ensures that the new "connection" does not
violate performance guarantees already provided to existing connections. Applied to operating
systems, this model covers the CPU (including process management), memory management, and
the file system and device management. The following paragraphs explain the resources in general.
The resource reservation is identical for all resources, whereas the management is different for
each.
3.7.2.1 Resources
A resource is a system entity required by tasks for manipulating data. Each resource has a set of
distinguishing characteristics classified using the following scheme:
• A resource can be active or passive. An active resource is the CPU or a network adapter
for protocol processing; it provides a service. A passive resource is the main memory,
communication bandwidth or a file system; it denotes some system capability required by active
resources.
• A resource can be either used exclusively by one process at a time or shared between
various processes. Active resources are often exclusive, passive resources can usually be shared
among processes.
• A resource that exists only once in the system is known as a single, otherwise it is a
multiple resource. In a transporter-based multiprocessor system, the individual CPU is a multiple
resource.
Each resource has a capacity which results from the ability of a certain task to perform
using the resource in a given time-span. In this context, capacity refers to CPU capacity, frequency
range or, for example, the amount of storage. For real-time scheduling, only the temporal division
of resource capacity among real-time processes is of interest. Process management belongs to the
category of active, shared, and most often single resources. A file system on an optical disk with
CD-ROM XA format is a passive, shared, single resource.
3.7.2.2 Requirements
The requirements of multimedia applications and data stream must be served by the single
components of a multimedia system. The resource management maps these requirements onto
155
the respective capacity. The transmission and processing requirements of local and distributed
multimedia applications can be specified according to the following characteristics:
• The throughput is determined by the needed data rate of a connection to satisfy the
application requirements. It also depends on the size of the data units.
• We distinguish between local and global (end-to-end) delay:
• The delay "at the resource" is the maximum time span for the completion of a certain
task at this resource.
• The end-to-end delay is the total delay for a data unit to be transmitted form the source
to its destination, for example, the source of a video telephone is the camera; the destination is the
video window on the screen of the partner.
• The jitter (or delay jitter) determines the maximum allowed variance in the arrival of
data at the destination.
• The reliability defines error detection and correction mechanism used for the
transmission and processing of multimedia tasks. Errors can be ignored, indicated and/or
corrected. It is important to notice that error correction through re-transmission is rarely
appropriate for time critical data because the re-transmitted data will usually arrive late. Forward
error correction mechanisms are more useful. In terms of reliability, we also mean the CPU errors
due to unwanted delays in preceding a task which exceed the demanded deadlines.
In accordance with communication systems, these requirements are also known as
Quality of Service parameters (QoS).
3.7.2.3 Components and phases
One possible realization of resource allocation and management is based on the interaction
between clients and their respective resource managers. The client selects the resource and
requests a resource allocation by specifying its requirements through QoS specification. This is
equivalent to a workload request. First, the resource manager checks its own resource utilization
and decides if the reservation request can be served or not. All existing reservations are stored.
This way, their share in terms of the respective resource capacity is guaranteed. Moreover, this
component negotiates the reservation request with other resource managers, if necessary.
The following example of a distributed multimedia system illustrates this generic
scheme. During the connection establishment phase, the QoS parameters are usually negotiated
between the requester (client application) and the addressed resource manager. The negotiation
starts in the simplest case with specification of the QoS parameters by the application. The
resource manager checks whether these requests can be guaranteed or not. A more elaborate

156
method is to optimize single parameters. In this case, two parameters are determined by the
application (e.g., throughput and reliability), and the resource manager calculates the best
achievable value for the third parameter (e.g., delay). To negotiate the parameter for end-to-end
connections over one or more computer networks, resource reservation protocols like ST-H are
employed. Here, resource managers of the single components of the distributed system allocate
the necessary resources.
3.7.2.4 Phases of the Resource Reservation and Management Process
A resource manager provides components for the different phases of the allocation and
management process:
1. Schedulability Test: The resource manager checks with the given QoS parameters (e.g.,
throughput and reliability to determine if there is enough remaining resource capacity available to
handle this additional request.
2. Quality of Service Calculation: After the Schedulability test, the resource manager
calculates the best possible performance (e.g., delay) the resource can guarantee for the new
request.
3. Resource Reservation: The resource manager allocated the required capacity to meet
the QoS guarantees for each request.
4. Resource Scheduling: Incoming messages form connections are scheduled according to
the given QoS guarantees. For process management, for instance, the allocation of the resource is
done by the scheduler at the moment the data arrive for processing.
With respect to the last phase, for each resource a scheduling algorithm is defined. The
Schedulability test, QoS calculation and resource reservation depend on this algorithm used by the
scheduler.
3.7.2.5 Allocation Scheme
Reservation of resources can be made either in a pessimistic or optimistic way:
• The pessimistic approach avoids resource conflicts by making reservations for the worst
case, i.e., resource bandwidth for the longest processing time and the highest rate which might
ever be needed by a task is reserved. Resource conflicts are therefore avoided. This leads
potentially to an underutilization of sources. In a multimedia system, the remaining processor time
(i.e., the time reserved for traffic but not used) can be used by discrete media tasks. This method
results in a guaranteed QoS.
157
• With the optimistic approach, resources are reserved according to an average workload
only. This means that the CPU is only reserved for the average processing time. This approach may
overbook resources with the possibility of unpredictable packet delays. QoS-parameters are met as
far as possible. Resources are highly utilized, though an overload situation may result in failure. To
detect an overload situation and to handle it accordingly a monitor can be implemented. The
monitor may, for instance, preempt processes according to their importance.
The optimistic approach is considered an extension of the pessimistic approach. It
requires that additional mechanisms to detect and solve resource conflicts be implemented.
3.7.3 Process Management
Process management deals with the resource main processor. The capacity of this resource is
specified as processor capacity. The process manager maps single processes onto resources
according to a specified scheduling policy such that all processes meet their requirements. In most
systems, a process under control of the process manager can adopt one of the following states:
• In the initial state, no process is assigned to the program. The process is in the idle state.
• If a process is waiting for an event, i.e., the process lacks one of the necessary resources
for processing, it is in the locked state.
• If all necessary resources are assigned to the process, it is ready to run. The process only
needs the processor for the execution of the program.
• A process is running as long as the system processor is assigned to it.
The process manager is the scheduler. This component transfers a process into the
ready-to-run state by assigning it a position in the respective queue of the dispatcher, which is the
essential part of the operating system kernel. The dispatcher manages the transition from ready-to-
run to run. In most operating systems, the next process to run is chosen according to a priority
policy. Between processes with the same priority, the one with the longest ready time is chosen.
3.8 Multimedia File Systems
3.8.1 Introduction
A file is a sequence of information held as a unit for storage and use in a computer system. Files are
stored in secondary storage, so they can be used by different applications. The file system provides
access and control functions for the storage and retrieval of files. The file system is said to be the
most visible part of an operating system. Most programs write or read files. There, program code,
as well as user data, is stored in files. The organization of the file system is an important factor for
the usability and convenience of the operating system. Here we will give you a brief
158
characterization of traditional file systems and disk scheduling algorithms. Subsequently, we also
give different-approaches to organize multimedia files and disk scheduling algorithms for the use in
multimedia systems.
3.8.2 File Systems
The file system is said to be the most visible part of an operating system. Most programs write or
read files. There, program code, as well as user data, is stored in files. The organization of the file
system is an important factor for the usability and convenience of the operating system. A file is a
sequence of information held as a unit for storage and use in a computer system.
Files are stored in secondary storage, so they can be used by different applications. The
life-span of files is usually longer than the execution of a program. In traditional file systems, the
information types stored in files are sources, objects, libraries and executables of programs,
numeric data, text, payroll records, etc.
In multimedia systems, the stored information also covers digitized video and audio
with their related real-time "read" and "write" demands. Therefore, additional requirements in the
design and implementation of file systems for multimedia must be considered.
The file system provides access and control functions for the storage and retrieval of
files. Form the user's viewpoint; it is important how the file system allows file organization and
structure. The internals, which are more important for us, i.e., the organization of the file system,
deal with the representation of information in files, their structure and organization in secondary
storage. Because of its importance for multimedia, disk scheduling is also presented in the context.
3.8.3 Traditional File Systems
The two main goals of traditional files systems are:
1. To provide a comfortable interface for file access to the user
2. To make efficient use of storage media.
Whereas the first goal is still an area of interest for research (e.g., indexing for file
systems and intelligent file systems for the contest-based associative access of file system data ,the
structure, organization and access of data stored on disk have been extensively discussed and
investigated over the last decades. To understand the specific multimedia developments in this
area, this section gives a brief overview on files, file system organizations and file access
mechanisms. Later, disk scheduling algorithms for file retrieval are discussed.
159
3.8.3.1 File Structure
We commonly distinguish between two methods of file organization. In sequential storage, each
file is organized as a simple sequence of bytes or records. Files are stored consecutively on the
secondary storage media. They are separated from each other by a well-defined "end of file" bit
pattern, character or character sequence. A file descriptor is usually placed at the beginning of the
file and is, in some systems, repeated at the end of the file. Sequential storage is the only possible
way to organize the storage on tape, but it can also be used on disks. The main advantage is its
efficiency for sequential access, as well as for direct access. Disk access time for reading and writing
is minimized.
Additionally, for further improvement of performance with catching, the file can be read
ahead of the user program. In systems where file creation, deletion and size modification occur
frequently, sequential storage has major disadvantages. Secondary storage is split and fragmented,
through creation and deletion operations, and files cannot be extended without copying the whole
file into a large space. The files may be copied such that all files are adjacently located, i.e., without
any "holes" between them.
In non-sequential storage, the data items are stored in a non-contiguous order. There
exist mainly two approaches:
• One way is to use linked blocks, where physical blocks containing consecutive logical
locations are linked using pointers. The file descriptor must contain the number of blocks occupied
by the file, the pointer to the first block and it may have the pointer to the last block. A serious
disadvantage of these methods is the cost of the implementation for random access because all
prior data must be read. In MS-DOS, a similar method is applied. A File Allocation Table (FAT) is
associated with each disk. One entry in the table represents one disk block. The directory entry of
each file holds the block number of the first block. The number in the slot of an entry refers to the
next block of a file. The slot of the last block of a file contains an end-of-file mark.
• Another approach is to store block information in mapping tables. Each file is associated
with a table where, apart from the block numbers, information like owner, file size, creation time,
last access time, etc., are stored. Those tables usually have a fixed size, which means that the
number of block references is bounded. Files with more blocks are referenced indirectly by
additional tables assigned to the files. In UNIX, a small table (on disk) called an I-node is associated
with each file. The Indexed sequential approach is an example for multi-level mapping; here, logical
and physical organization is not clearly separated.
160
3.8.3.2 Directory Structure
Files are usually organized in directories. In traditional systems, a common technique to reduce disk
access is block caches. Using a block cache, blocks are kept in memory because it is expected that
future read or write operations access these data again. Thus, performance is enhanced due to
shorter access time. Another way to enhance performance is to reduce disk arm motion. Block that
is likely to be accessed in sequence is placed together on one cylinder. To refine this method,
rotational positioning can be taken into account. Consecutive blocks are placed on the same
cylinder, but this is in an interleaved way. Another important issue is the placement of the mapping
tables (e.g., I-nodes in UNIX) on the disk. If they are placed near the beginning of the disk, the
distance between them and the blocks will be, on average, half the number of cylinders. To
improve this, they can be placed in the middle of the disk. Hence, the average seek time is roughly
reduced by a factor of two. In the same way, consecutive blocks should be placed on the same
cylinder. The use of the same cylinder for the storage of mapping tables and referred blocks also
improves performance.
3.8.3.3 Disk Scheduling
Sequential storage devices (e.g., tapes) do not have a scheduling problem, for random access
storage devices, every file operation may require movements of the read/write head. This
operation, known as "to seek", is very time consuming, i.e., a seek time in the order of 250ms for
CDs is still state-of-the-art. The actual time to read or write a disk block is determined by:
• The seek time (the time required for the movement of the read/write head).
• The latency time or rotational delay (the time during which the transfer cannot proceed
until the right block or sector rotates under the read/write head).
• The actual data transfer time needed for the data to copy from disk into main memory.
Usually the seek time is the largest factor of the actual transfer time. Most systems try
to keep the cost of seeking low by applying special algorithms to the scheduling of disk read/write
operations. The access of the storage device is a problem greatly influenced by the file allocation
method. For instance, a program reading a contiguously allocated file generates requests which are
located close together on a disk. Thus, head movement is limited. Linked or indexed files with
blocks, which are widely scattered, because many head movements. In multi-programming
systems, where the disk queue may often be non-empty, fairness is also a criterion for scheduling.
Most systems apply one of the following scheduling algorithms:
With this algorithm, the disk driver accepts requests one-at-a-time and serves them in
incoming order. This is easy to program and an intrinsically fair algorithm. However, it is not
161
optimal with respect to head movement because it does not consider the location of the other
queued requests. This result in a high average seeks time.
• Shortest-Seek-Time first (SSTF)
At every point in time, when a data transfer is requested, SSTF selects among all requests the one
with the minimum seek time from the current head position. Therefore, the head is moved to the
closest track in the request queue. This algorithm was developed to minimized seek time and it is in
this sense optimal. SSTF is a modification of Shortest Job First (SJF), and like SJF, it may cause
starvation of some requests. Request targets in the middle of the disk will get immediate service at
the expense of requests in the innermost and outermost disk areas.
• SCAN
Like SSTF, SCAN orders requests to minimize seek time. In contrast to SSTF, it takes the direction of
the current disk movement into account. It first serves all requests in one direction until it does not
have any requests in this direction anymore. The head movement is then reversed and service is
continued. SCAN provides a very good seek time because the edge tracks get better service times.
Not that middle tracks still get a better service then edge tracks. When the head movement is
reversed, it first serves tracks that have recently been serviced, where the heaviest density of
request, assuming a uniform distribution, is at the other end of the disk
• C-SCAN
C-SCAN also moves the head in one direction, but it offers fairer service with more uniform waiting
times. It does not alter the direction, as in SCAN. Instead, it scans in cycles, always increasing or
decreasing, with one idle head movement from one edge to the other between two consecutive
scans. The performance of C-SCAN is somewhat less than SCAN.
Traditional file systems are not designed for employment in multimedia systems. They
do not, for example, consider requirements like real-time which are important to the retrieval of
stored audio and video. To serve these requirements, new policies in the structure and
organization of files, and in the retrieval of data from the disk, must be applied. The next section
outlines the most important developments in this area.
3.8.4 Multimedia File Systems
Compared to the increased performance of processors and networks, storage devices have become
only marginally faster. The effect of this increasing speed mismatch is the search for new storage
structures, and storage and retrieval mechanisms with respect to the file system. Continuous media
data are different from discrete data:
162
• Real Time Characteristics: As mentioned previously, the retrieval, computation and
presentation of continuous media is time-dependent. The data must be presented (read) before a
well-defined deadline with small jitter only. Thus, algorithms for the storage and retrieval of such
data must consider time constraints, and additional buffers to smooth the data steam must be
provided.
• File Size: Compared to text and graphics, video and audio have very large storage space
requirements. Since the file system has to store information ranging from small, unstructured units
like text files to large, highly structured data units like video and associated audio, it must organize
the data on disk in a way that efficiently uses the limited storage. For example, the storage
requirements of uncompressed CD-quality stereo audio are 1.1 Mbits/s; low but acceptable quality
compressed video still requires about 1Mbit/s using, e.g., MPEG-1.
• Multiple Data Streams: A multimedia system must support different media at one time.
It does not only have to ensure that all of them get a sufficient share of the resources; it also must
consider tight relations between different streams arriving from different sources. The retrieval of a
movie, for example, requires the processing and synchronization of audio and video.
There are different ways to support continuous media in file systems. There are two
approaches. In the first approach, the organization of file on disk remains as is. The necessary real-
time support is provided through special disk scheduling algorithms and sufficient buffer to avoid
jitter. In the second approach, the organization of audio and video files on disk is optimized for
their use in multimedia systems. Scheduling of multiple data streams remains an issue of research.
3.8.4.1 Storage Devices
The storage subsystem is a major component of any information system. Due to the immense
storage space requirements of continuous media, conventional magnetic storage devices are often
not sufficient. Tapes, still in use in some traditional systems, are inadequate for multimedia
systems because they cannot provide independent accessible streams, ad random access is slow
and expensive.
Apart from common disks with large capacity, some multimedia applications, such as
kiosk systems, use CD-ROMs to store data. In general, disks can be characterized in two different
ways:
• First, how information is stored on them. There are re-writeable (magnetic and optical)
disks, write-once (WORM) disks and read-only disks like CD-ROMs.
• The second distinctive feature is the method of recording. It is distinguished between
magnetic and optical disks. The main differences between them are the access time and track
163
capacity. The seek time on magnetic disks is typically above 10 ms, whereas on optical disks, 200
ms is a common lower bound. Magnetic disks have a constant rotation speed (Constant Angular
Velocity, CAV).
Thus, while the density varies, the storage capacity is the same on inner and outer
tracks. Optical disks have varying rotation speed (Constant Linear Velocity, CLV) and hence, the
storage density is the same on the whole disk.
Therefore, different algorithms for magnetic and optical disks are necessary. File systems on CD-
ROMs are defined in ISO 9660. They are considered to be closely related to CD-ROMs and CD-ROM-
XA. Very few variations are possible.
3.8.4.2 File Structure and Placement on Disk
In conventional file systems, the main goal of the file organization is to make efficient use of the
storage capacity, (i.e., to reduce internal and external fragmentation) and to allow arbitrary
deletion and extension of files.
In multimedia systems, the main goal is to provide a constant and timely retrieval of
data. Internal fragmentation occurs when blocks of data are not entirely filled. On average, the last
block of a file is only half utilized. The use of large blocks leads to a larger waste of storage due to
this internal fragmentation.
External fragmentation mainly occurs when files are stored in a contiguous way. After
the deletion of a file, the gap can only be filled by a file with the same or a smaller size. There are
usually small fractions between to files that are not used; storage space for continuous media is
wasted.
As mentioned above, the goals for multimedia file systems can be achieved through
providing enough buffers for each data stream and the employment of disk scheduling algorithms,
especially optimized for real-time storage and retrieval of data. The advantage of this approach
(where data blocks of single files are scattered) is flexibility. External fragmentation is avoided and
the same data can be used by several streams (via references).
Even using only one stream might be of advantage; for instance, it is possible to access
one block twice, e.g., when a phrase in a sonata is repeated. However, due to the large seek
operations during playback, even with optimized disk scheduling, large buffers must be provided to
smooth to smooth hitter at the data retrieval phase. Therefore, there are also long initial delays at
the retrieval of continuous media.
Approaches which use specific disk layout take the specialized nature of continuous
media data into account to minimize the cost of retrieving and storing streams. The much greater
164
size of continuous media files and the fact that they will usually be retrieved sequentially because
of the nature of the operation performed on them (such as play, pause, fast forward, etc.) are
reasons for an optimization of the disk layout. Hence, it seems to be reasonable to stores
continuous media data in large data blocks contiguously on disk. Files that are likely to be retrieved
together are grouped together on the disk. Thus, interference due to the concurrent access of
these files in minimized. With such a disk layout, the buffer requirements and seek times decrease.
The disadvantage of the contiguous approach is external fragmentation and coping
overhead during insertion and deletion. To avoid this without scattering blocks in a random
manner over the disk, a multimedia file system can provide constrained block-allocation of the
continuous media. Some systems using scattered storage make use of a special disk space
allocation mechanism to allow fast and efficient access. Another topic to be considered is the
placement of different streams. With interleaved placement, all nth blocks of each stream are in
close physical proximity on disk. A continuous interleaved placement is possible, as well as a
scattered interleaved placement. With interleaved data streams, synchronization is much easier to
handle.
165
Methodology of the study
4.1 Introduction
The present study aims at ascertaining the effectiveness of multimedia method of instruction
(multimedia package) with conventional method of instruction in the subject of Biology IX standard
students at high school level. The purpose of the study were two fold, firstly the development of
multimedia package in Biology and secondly validation of such a package. Comparison of
Multimedia Method of Instruction (MMI) and Conventional Method of Instruction (CMI) is not only
comparison of two modes of instruction but two theoretical paradigms. Conventional method of
instruction represents a paradigm whereby knowledge is transmitted from teacher to student.
Something is poured in learners’ brain and the learner is a passive recipient of knowledge. Teacher
plays an active part in this mode of instruction.
Multimedia method of instruction represents a paradigm where knowledge is
constructed and sought by the learner. Learner plays an active role in learning process. Learning is
individualized, self-paced and hands on.
This study has been completed in two phases, during the first phase a multimedia
method of instruction package was developed by the researcher. The second phase of the study
was experimentation with multimedia method of instruction package to determine its effectiveness
in terms of student learning. Researcher also constructed three instruments has been used in the
study. These instruments included an observation schedule for teachers was used to evaluate the
quality of multimedia package, achievement test was used as pre-test and post-test performance
measurement of the students and opinionnaire was used to collect experimental group students
opinion towards multimedia package, support for learning Biology.
4.2 Design of the Study
The design found to be most useful for the purpose of this study was the pre-test and post-test,
experimental and control groups design. These groups were obtained through paired matching on
the basis of intellectual capacity of the students. Raven’s Progressive Matrices were used to
measure the intellectual capacity of the students. Forty pairs of equal intellectual capacity were
selected and assigned randomly to the experimental and control groups.
4
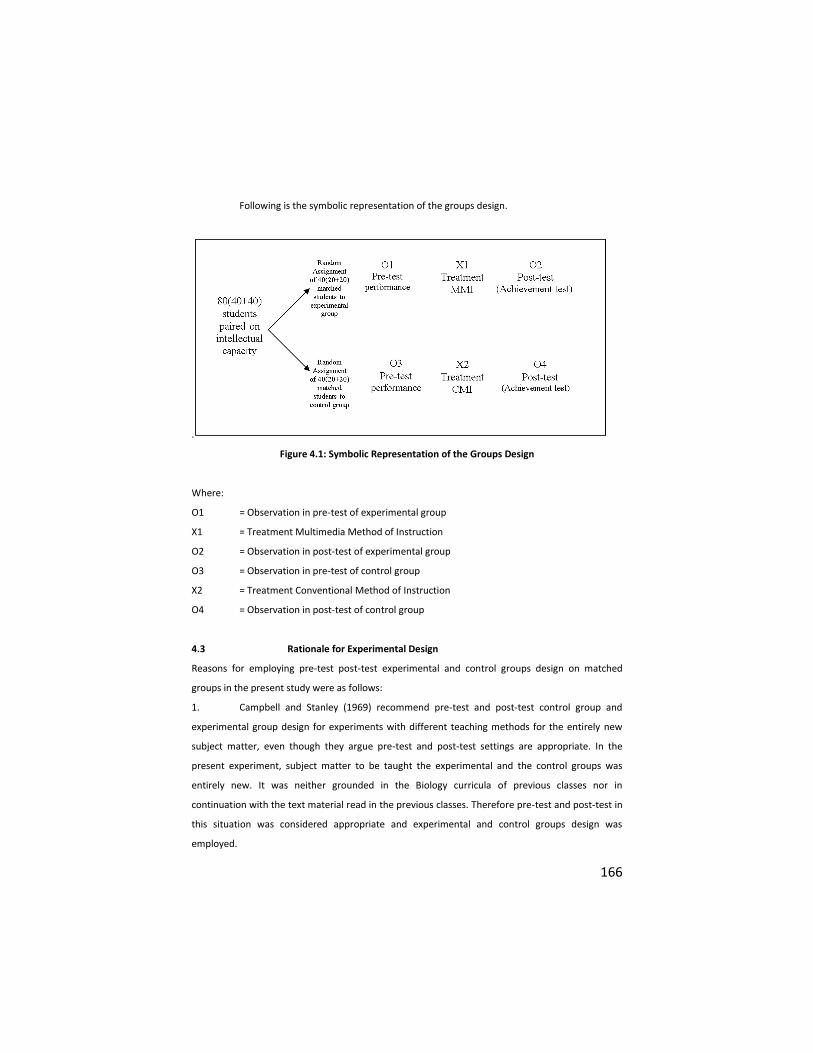
166
Following is the symbolic representation of the groups design.
.
Figure 4.1: Symbolic Representation of the Groups Design
Where:
O1 = Observation in pre-test of experimental group
X1 = Treatment Multimedia Method of Instruction
O2 = Observation in post-test of experimental group
O3 = Observation in pre-test of control group
X2 = Treatment Conventional Method of Instruction
O4 = Observation in post-test of control group
4.3 Rationale for Experimental Design
Reasons for employing pre-test post-test experimental and control groups design on matched
groups in the present study were as follows:
1. Campbell and Stanley (1969) recommend pre-test and post-test control group and
experimental group design for experiments with different teaching methods for the entirely new
subject matter, even though they argue pre-test and post-test settings are appropriate. In the
present experiment, subject matter to be taught the experimental and the control groups was
entirely new. It was neither grounded in the Biology curricula of previous classes nor in
continuation with the text material read in the previous classes. Therefore pre-test and post-test in
this situation was considered appropriate and experimental and control groups design was
employed.
167
2. Randomization does not ensure equality for small groups. Group size in the present
study was initially decided to be twenty students. A group of less than thirty students is considered
a small group. Therefore, paired matching was considered necessary to ensure equality of groups
on mediating variable having a strong effect on student learning i.e., intellectual capacity of the
students. Pairing was possible in three ways:
• On the basis of previous knowledge
• On the basis of intellectual capacity
• On the basis of both the previous knowledge and intellectual capacity.
Previous knowledge reflecting the standing of the student with respect to the subject
was not relevant to the text material to be taught during the experiment. As the concepts to be
taught during treatment had no foundation in the previous learning of the students, the impact of
previous knowledge was not considered as a significant contributor towards student learning.
Intellectual capacity of the student is a major contributor towards student learning. It would be a
strong mediating factor if not controlled. Therefore, both the experimental and the controlled
groups were matched on intellectual capacity. Matching of groups on two traits requires a large
initial sample (Fraenkel and Wallen, 1993; Gay, 1996). As a large initial sample was not available, it
was not possible to match the groups on two traits i.e., previous knowledge and intellectual
capacity.
4.4 Population
The purpose of this study was to development and validation of multimedia package and to
observe the effectiveness of multimedia method of instruction by using multimedia package in
comparison with conventional method of instructional on the academic achievement of high school
students in the subject of Biology of IX standard students. Therefore, high school students of IX
standard, studying Biology subject constituted the population of the study.
4.5 Sample
A state wide sample representing high school students of Karnataka is ideal for the study. But due
to practical constraints, the study was confined to students of studying in IX standard Biology
(science part-2) of the Karnataka state board text book. Assuming that it is the representative of
the three standards of high school education. The investigator limited the area of investigation to
only one branch of science that is Biology. The investigator was able to prepare multimedia
package focussed on two chapters in Biology of IX standard. Considering the availability of the
168
sample, the study has been concentrated on IX standard high school students of Bijapur city of
Karnataka state in India.
Sample of the study was 80 students (40 boys and 40 girls) out of total 117 students in
the age group 13.5 to 14.5 who are studying in IX standard, PDJ high school Bijapur city, Karnataka.
Sample of the study was drawn on the basis of intellectual capacity measured on Raven’s Standard
Progressive Matrices (Raven’s SPM), the instrument to measure intellectual capacity. Raven’s SPM
was administered to all 117 students in the IX standard, those all are present on the day of
administration of the instrument. 117 students were classified into four intellectual capacity grades
i.e., intellectually superior, above the average in intellectual capacity, intellectually average and
below average in intellectual capacity. Seven students were intellectually superior (Grade I), nine
students were above the average in intellectual capacity (Grade II), forty one students were found
in intellectually average (Grade III) and sixty students were found to be below average in
intellectual capacity (Grade IV).
Forty pairs of equal intellectual capacity were to be taken as a sample of the study. It
could be done in three ways that is proportionately, randomly and selectively. Scores on SPM
revealed that six percent students were intellectually superior, eight percent students were above
the average in intellectual capacity, thirty two students were intellectually average and fifty one
percent students were found to be below average in intellectual capacity. In case of proportionate
selection twenty eight pairs out of forty would have been selected from below average intellectual
capacity students, eight from average and two pair from above average students, and only two
pairs from students were intellectually superior. Similarly, random selection also might have
increased the number of below average students. Excessive number of similar category that is
below average intellectual capacity students could cause decreased variability in achievement
scores. Therefore, keeping in view the composition of the group, all possible pairs form superior,
above average and average students were selected to maximize their representation. In spite of
that, selected forty pairs included forty five percent superior, above average and average students
and fifty five percent below average students.
4.6 Variables Involved in the Study
Controlled variables: Age of the students, Intelligence and Treatment (Conventional Method of
Instruction and Multimedia Method of Instruction)
Dependent variable: Achievement means scores.
Independent variables: Sex of the students.

169
4.7 Development of Multimedia Package (Software)
4.7.1 Designing of Instructional Media
Instructional design refers to application of well-defined procedural steps for designing
instructional resources materials. A number of related activities, such as identification of
objectives, formulation of instructional strategies, and development of media based components
and evaluation of learning outcomes are also involved in the designing.
Figure 4.2: Basic Steps of Designing Instructional Media
A group of academicians Heinich, Molenda, Russel and Smaldno in USA (1990) propose the ASSURE
model for designing, planning and delivering instructions that incorporates media. This model
forces on planning, surrounding the actual classroom use of media. The acronym ASSURE stands for
six steps for designing an instructional procedure.
Step 1 Analyze the Learner
Identification of learners is the first step in planning. The learners can be analyzed in terms of
general characteristics, specific entry competencies, knowledge, skills and attitudes about the
topic.
Step 2 State Objectives
The next step is to state objectives specifically. The objectives may be derived from a course
syllabus taken from curriculum guide or developed by the investigator. The objectives should be
stated in terms of what the learner will be able to do because of instructions.
170
Step 3 Select Materials
Once the identification of the learners and statement of objectives are established, the selection of
available media and materials, modification of them and designing new materials are the three
options before the instructors. The most important step in preparation of any media based
resource material is the development of a script. Script is the sequence of pages/scenes, frames or
units in which desired media format is arranged for presentation. It helps one to think clearly and
take correct decision, save time and cost, ensure continuity and puts the director in total
command.
Step 4 Utilize Materials
Having selected, modified or designed the materials, plan how the materials will be used
and how much time will be spent in them. Next step is to prepare the class, ready the necessary
equipment and present the materials using the ‘showmanship’ techniques in which the instructor
can direct and hold the attention of the learners during presentation.
Step 5 Require Learner Performance
Learners must practice what they are expected to learn and should be reinforced for the
correct response. There should be activities within the lessons that allow learner to respond and to
receive feedback on the appropriateness of their performance or response.
Step 6 Evaluate and Revise
Finally, it is important to validate the materials developed, its impact and effectiveness
in the process of instruction. The media option should be evaluated for its academic and
motivational values. The concepts treated should be relevant to the objectives and help in ensuring
the learning outcomes.
4.7.2 Design of Multimedia
As no multimedia package (software), covering the topics of high school level Biology was available,
multimedia package (Appendix-vi) to be used in the experiment was developed by the researcher.
It was decided to develop the multimedia package (software) in English medium IX standard
Biology of Karnataka State Board Syllabus.
The first step in designing an application is to decide which methodology to use. For the
vast majority of computer applications it is hard to say that one correct implementation is better
than another. There is always a certain amount of artistry involved in evaluating two correct
implementations usually involving subjective arguments based on the preferences of the evaluator.
An investigator may, for instance, prefer one method for developing a certain type of application
while another person prefers another. In a package such as this where, there is only one
171
programmer involved, an investigator would say that the design methodology to use is the one that
the programmer can achieve results with most confidence. The methodology does not have to
agree exactly with any well-known methodology.
Personally, an investigator feels most confident with mixed design methodology. An
investigator had selectively used the objects of, top-down and bottom-up design based on the
current task to solve the problem. Overall, the development structure could be called evolutionary
with some rapid prototyping. Most of the professional programmers that the investigator knows
use some variation of the technique when designing small to medium sized applications. It allows
the flexibility of matching a particular style to the task in hand.
Perhaps the best way to illustrate the method is to go through the design process of the
package in roughly chronological order. It has to be said that the design did not occur wholly before
the implementation; rather it was an ongoing process throughout the implementation. The
separation of the design from implementation is something that is inherent to the Waterfall
method of designing a method which is widely regarded as a nice idea, and perhaps even the ideal,
but not something that accurately reflects programming reality. A design is not properly assessed
until it is implemented, by which time, according to the Waterfall method, it is too late to change
the design. This is even more apparent in experimental studies, such as this one, where there is
little readily available knowledge as to which package design is correct because nobody has
implemented experimentally this kind of package before. The objective for designing this package
was to develop an experimental time constrained package, implement it, assess the design,
redesign if necessary and then move on to the next part of the package.
A multimedia project need not be interactive to be called multimedia; users can sit back
and watch it just as they do a movie or the television. In such cases, the project is linear, starting at
a beginning and running through to an end. When the users are given navigational control and can
wonder through the content at will, multimedia becomes nonlinear and interactive, and a very
powerful personal gateway to information.
Multimedia elements are typically sewn together into a project using authoring tools.
These software tools are designed to manage individual multimedia elements and provide user
interaction. In addition to providing a method for users to interact with the project, most authoring
tools also offers facilities for creating and editing text and images. Sounds and movies are usually
created with editing tools dedicated to these media, and then the elements are imported into the
authoring system for playback and how it is presented to the viewer is the human interface. This
interface is just as much the rules for what happens to the user's input as it is the actual graphics
172
on the screen. The hardware and software that govern the limits of what can happen are the
multimedia platform or environment.
4.7.3 Medium
Medium is very important while discussing about multimedia concepts. Media refers to the types
of information or types of information carriers. In general, one describes medium as a means for
distribution and presentation of information. Examples of medium are alphanumeric data, images,
audio, and video.
There are many ways to classify media. Common classifications are based on physical
formats and media relationships with time, and different criteria like perception, representation,
presentation, storage, transmission, and information exchange.
4.7.4 Types of Medium
Under the classification of physical formats and media relationship with time, the media is
classified based on whether there is a time dimension to the media. Under this classification,
there are two classes of media: static and dynamic (or time continuous).
Static media do not have a time dimension, and their contents and meanings do not
depend on the presentation time. Static media is also called discrete media. Static media include
alphanumeric data, graphics and still images.
Dynamic media have a time dimension, and their meanings and correctness depend
on the rate at which they are presented. Dynamic media include animation, audio, and video.
These media have their intrinsic unit interval or rate. For example, to have a perceptually smooth
movement, video must be played back at 25 frames per second, sometimes 30 frames per second,
depending on the video system used. Similarly, where we play back a recorded voice message or
music, only one playback rate is natural or sensible. Play back at a slower or faster rate distorts the
meaning or the quality of the sound. Because these media must be played back continuously at a
fixed rate, they are often called continuous media. They are also called isochronous media because
of the fixed relationship between each media unit and time.
4.7.5 Classification of Medium on Different Criteria
As has been already discussed the media can also be classified with respect to different criteria like
perception, representation, presentation, storage, transmission, and information exchange.
173
The Perception Medium
Perception media help humans to sense their environment. The perception of information occurs
mostly through seeing or hearing the information. There is a primary difference between seeing
and hearing information when using a computer. For the perception of information through seeing,
the visual media such as text, image and video are used. For the perception of information through
hearing, auditory media such as music, noise, and speech are relevant.
The Representation Medium
Representation media are characterized by internal computer representations of information. The
various formats are used to represent media information in a computer. For example
• A text character is coded in ASCII or EBCDIC code.
• Graphics are coded according to standard GKS (graphics kernel system)
• An audio stream can be represented using a simple PCM (pulse coding method) with a
linear quantization of 16 bits per sample.
• An image can be coded in JPEG or GIF format.
• A combined audio/video sequence can be coded in media flash and different TV
standard formats, and stored in the computer using an MPEG format.
• Macromedia flash 8.0
• Adobe Photoshop CS-3
• Sound Forge
The Presentation Medium
Presentation media refer to the tools and devices for the input and output of information. The
media like paper, screen, and speaker are used to deliver the information by the computer (output
media), keyboard, mouse, camera and microphone are the input media.
The Storage Medium
Storage media refer to a data carrier which enables storage of information. The various media's are
floppy disk, hard disk, and CD ROM's are examples of storage media.
The Transmission Medium
The transmission medium characterizes different information carriers that enable continuous data
transmission. The media's used for transmitting information are, over networks, which use wire
and cable for transmission, such as coaxial cable and fiber optics, as well as free air space
transmission, which is used for wireless traffic.
The Information Exchange Medium
The information exchange medium includes all information carriers for transmission, i.e., all
storage and transmission media. Here the information exchange can be done through
174
intermediate storage media, where the storage medium is transported outside the computer
networks to the destination, through direct transmission using computer networks, or through
combined usage of storage and transmission media (example is electronic mailing system).
4.7.6 Steps in Multimedia Software Development
• Clear understanding of the problem on hand. Problem specification.
• Careful solution design paying attention to all the constraints.
• Transform design into a multimedia program. Abstraction and coding.
• Complete debugging. Error removal.
• Thorough testing.
• Maintenance dictated by the environmental changes.
4.7.7 Problem Specification
The essential function of Biology instruction is to teach theory and process of changes in their
evolution. The computer software may be found suitable for communicating process of Biology
work effectively to the students.
4.7.8 Design
a. Output Design
Output, generally refers to the results and information that are generated by the application. For
many end-users, output is the main reason for developing the system and the basis on which they
will evaluate the usefulness of the application, when designing output, investigator accomplished
the following:
1. Determine what information is to be presented.
2. Decide whether to display, print, or sound the information and select the output
medium.
3. Arrange the presentation of information in an acceptable format.
4. Decide how to distribute the output to intended recipients.
b. Design of Input
The design of input includes the following input design details:
1. How to navigate.
2. What medium to use.
3. How the information should be arranged or coded.
4. The voice to guide users to go ahead.
175
5. Right answers and transactions needing validation to detect errors.
6. Methods for performing input validation and steps to follow when errors occur in
evaluation.
c. Design of Procedure
Procedures specify what tasks must be performed in using the application. The
important procedures include:
• Navigation procedures: Methods for how to move towards the information on the
screen.
• Run-Time procedure: Steps and actions taken by end-users who are interacting with the
application to achieve the desired results.
• Error-handling procedures: Actions to take when unexpected answers occur in
evaluation.
d. Design of Program Specification
Designing computer software is important to ensure that:
• The actual programs produced perform all tasks and do so in the manner intended.
• The structure of the software permits suitable testing and validation to be sure
procedures are correct.
• Future modifications can be made in an efficient manner.
e. Stages in the Development
According to Akkar (1999), development focuses on complex and innovative tasks.
Usually very few validated principles are available for structuring and supporting the design and
developmental activities of the package that are developed.
The development deal with the development of multimedia including the video and the computer
presentations as well as the development of the tests and the problems encountered during
development.
The development of multimedia involved the following:
• Literature search to gather information regarding the development of study material.
• Accumulating the necessary graphics-digital images and drawings.
• Mastering the software to compile the programs.
• Creating the video and the computer presentations.
• A model was designed based on the information and the purpose of the study.
• The model was tested against the real life equivalent. This process is called validation, as
shown in Figure 4.3.
• A multimedia model was created, as shown in the Figure 4.4
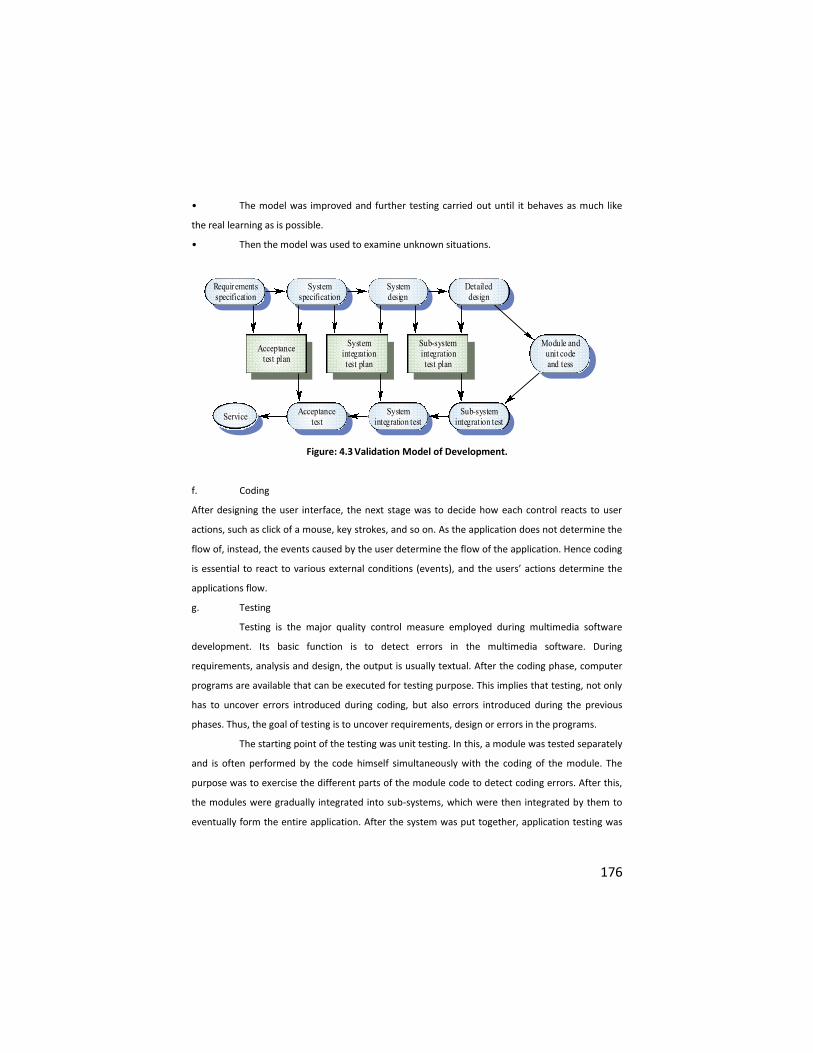
176
• The model was improved and further testing carried out until it behaves as much like
the real learning as is possible.
• Then the model was used to examine unknown situations.
Figure: 4.3 Validation Model of Development.
f. Coding
After designing the user interface, the next stage was to decide how each control reacts to user
actions, such as click of a mouse, key strokes, and so on. As the application does not determine the
flow of, instead, the events caused by the user determine the flow of the application. Hence coding
is essential to react to various external conditions (events), and the users’ actions determine the
applications flow.
g. Testing
Testing is the major quality control measure employed during multimedia software
development. Its basic function is to detect errors in the multimedia software. During
requirements, analysis and design, the output is usually textual. After the coding phase, computer
programs are available that can be executed for testing purpose. This implies that testing, not only
has to uncover errors introduced during coding, but also errors introduced during the previous
phases. Thus, the goal of testing is to uncover requirements, design or errors in the programs.
The starting point of the testing was unit testing. In this, a module was tested separately
and is often performed by the code himself simultaneously with the coding of the module. The
purpose was to exercise the different parts of the module code to detect coding errors. After this,
the modules were gradually integrated into sub-systems, which were then integrated by them to
eventually form the entire application. After the system was put together, application testing was
Requirementsspecification
Systemspecification
Systemdesign
Detaileddesign
Module andunit codeand tess
Sub-systemintegrationtest plan
Systemintegrationtest plan
Acceptancetest plan
ServiceAcceptance
testSystem
integration testSub-system
integration test
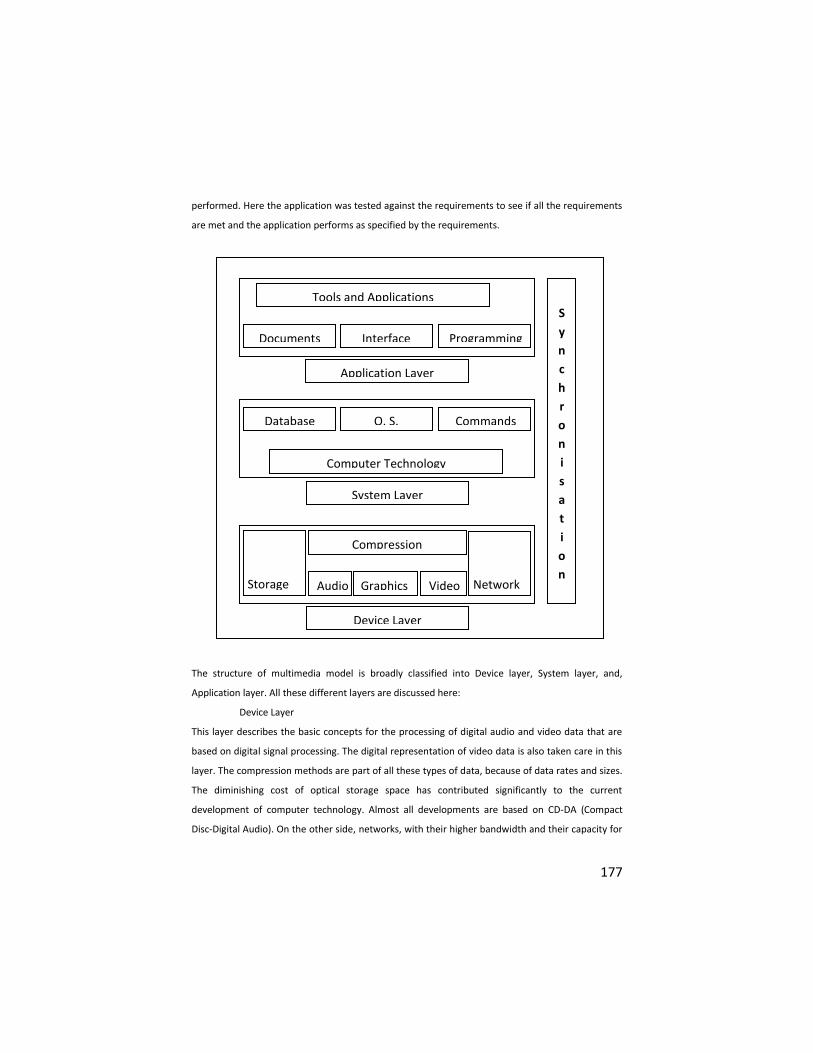
177
performed. Here the application was tested against the requirements to see if all the requirements
are met and the application performs as specified by the requirements.
Figure 4.4: Structure of Multimedia Model
The structure of multimedia model is broadly classified into Device layer, System layer, and,
Application layer. All these different layers are discussed here:
Device Layer
This layer describes the basic concepts for the processing of digital audio and video data that are
based on digital signal processing. The digital representation of video data is also taken care in this
layer. The compression methods are part of all these types of data, because of data rates and sizes.
The diminishing cost of optical storage space has contributed significantly to the current
development of computer technology. Almost all developments are based on CD-DA (Compact
Disc-Digital Audio). On the other side, networks, with their higher bandwidth and their capacity for
S
y
n
c
h
r
o
n
i
s
a
t
i
o
n
Tools and Applications
Documents Programming Interface
Application Layer
Computer Technology
Database Commands O. S.
System Layer
Device Layer
Compression
Applications Audio Video Graphics
Storage
Network
178
transmitting all media types, have led to networked multimedia systems. The development is also
taking place towards a full digital working system.
System Layer
The interface between the device layer and the system layer is specified by the computer
technology. To utilize the device layer, several system services are required. Three such services
exist. These services are mostly implemented in software.
• The operating system serves as an interface between computer hardware/ system
software and all other software components. It provides the user with a programming and
computational environment, which should be easy to operate. In its function as an interface, the
operating system provides different services that relate to the computer resources, such as:
processor, main memory, secondary memory, input and output devices and network
• The database system allows a an access to the data stored and a management of large
databases
• The communication system is responsible for data transmission according to the timing
and reliability requirements of the networked multimedia application.
Application Layer
The services of the system layer are offered to the application layer through proper programming
abstractions. Application layer is also capable of handling documents, a document consists of a set
of structured information, represented in different media, and generated or recorded at the time
of presentation. Many functions of document handling and other applications are accessible and
presented to the user through a user interface.
4.7.9 Properties of Multimedia System
Multimedia system is any system which supports more than a single kind of media. Not only text
and graphics there are several other Medias like animation, sound and video. A multimedia system
uses all these different Medias in any combination. A multimedia system distinguishes itself from
other systems through several properties.
The properties are:
Combination of Media
Not every arbitrary combination of media justifies the usage of the term multimedia. A simple text
processing program with incorporated images is often called a multimedia application because two
media are processed through one program. But one should talk about multimedia only when both
continuous and discrete media are utilized. A text processing program with incorporated images is
therefore not a multimedia application.
179
Independence
An important aspect of different media is their level of independence from each other. In general,
there is a request for independence of different media, but multimedia may require several levels
of independence. The media are dependent or independent depends on application. For example,
video recorder stores audio and video information, but there is an inherently tight connection
between the two type of media.
Computer Supported Integration
The multimedia system should support all Media that are being used should provide the possibility
of combining media in arbitrary forms. Therefore, it must be emphasized in terms of integrated
multimedia system. Simply say, in such systems, everything can be presented with video and sound
that is presented with text and graphics today. For example in conventional systems, a text
message can be sent to the other users, but, a multimedia system with a high level of integration
allows this function also for audio messages or even for a combination of audio and text.
Communication Systems
Communication capable multimedia systems must be approached. A reason for this is that most of
today's computers are interconnected, considering multimedia functions from only the local
processing viewpoint would be a restriction. Another reason is that distributed environments
enable particularly interesting multimedia applications. Here multimedia information cannot only
be created, processed, presented and stored, but also be distributed above the single computer’s
boundary.
4.8 Hypotheses
1. There is no significant difference between post-test mean scores of students under
multimedia method of teaching and conventional method of teaching in Biology.
2. There is no significant difference between post-test mean scores boys students under
multimedia method of teaching and conventional method of teaching in Biology.
3. There is no significant difference between post-test mean scores of girls’ students under
multimedia method of teaching and conventional method of teaching in Biology.
4. There is no significant difference between post-test mean scores of boys and girls
students under multimedia method of teaching and conventional method of teaching in Biology.
5. There is no significant difference between pre-test and post-test mean scores of
students under conventional method of teaching and multimedia method of teaching in Biology.
6. There is no significant difference between pre-test and post-test mean scores of boy
students under conventional method of teaching and multimedia method of teaching in Biology.
180
7. There is no significant difference between pre-test and post-test mean scores of girl
students under conventional method of teaching and multimedia method of teaching in Biology.
8. There is no significant difference between pre-test and post-test mean scores of boys
and girls students under conventional method of teaching and multimedia method of teaching in
Biology.
9. There is no significant difference between post-test mean scores of boys and girls
students under conventional method of teaching in the topic The Living World.
10. There is no significant difference between post-test mean scores of boys and girls
students under multimedia method of teaching in the topic The Living World.
11. There is no significant difference between post-test mean scores of boys and girls
students under conventional method of teaching in the topic The Study of Cells.
12. There is no significant difference between post-test mean scores of boys and girls
students under multimedia method of teaching in the topic The Study of Cells.
13. There is no significant difference between pre and post-test mean scores of boys
students under conventional method of teaching in the topic The Living World.
14. There is no significant difference between pre and post-test mean scores of boys
students under multimedia method of teaching in the topic The Living World.
15. There is no significant difference between pre and post-test mean scores of girls
students under conventional method of teaching in the topic The Living World.
16. There is no significant difference between pre and post-test mean scores of girls
students under multimedia method of teaching in the topic The Living World.
17. There is no significant difference between pre and post-test mean scores of boys
students under conventional method of teaching in the topic The Study of Cells.
18. There is no significant difference between pre and post-test mean scores of boys
students under multimedia method of teaching in the topic The Study of Cells.
19. There is no significant difference between pre and post-test mean scores of girls
students under conventional method of teaching in the topic The Study of Cells.
20. There is no significant difference between pre and post-test mean scores of girls
students under multimedia method of teaching in the topic The Study of Cells.
21. There is no significant difference between pre and post-test mean scores of students
under conventional method of teaching in the topic The Living World.
22. There is no significant difference between pre and post-test mean scores of students
under multimedia method of teaching in the topic The Living World.
181
23. There is no significant difference between pre and post-test mean scores of students
under conventional method of teaching in the topic The Study of Cells.
24. There is no significant difference between pre and post-test mean scores of students
under multimedia method of teaching in the topic The Study of Cells.
4.9 Materials and Tools Used for Experiment and Data Collection
Instruments were developed to measure the dependent variables and to record
perception, personal, and situational data.
Data was collected by using:
• Raven’s Standard Progressive Matrices (R-SPM) were used to measure the intellectual
capacity of the students for paired matching.
• Achievement test has been used as pre-test and post-test.
• Multimedia package was used to teach the experimental group.
• Observation schedule for teachers has been used to evaluate the quality of multimedia
package.
• Opinionnaire to collect learners’ opinion towards multimedia package.
4.9.1 Raven’s Standard Progressive Matrices (Raven’s SPM)
Standard Progressive Matrices (1983 edition) is a test of a person’s capacity at the time of the test
to apprehend meaningless figures presented for his observation, see the relations between them,
conceive the nature of the figure completing each system of relations present end, and by doing so,
develop a systematic method of reasoning. Standard Progressive Matrices was designed to cover
the widest possible range of mental ability and to be equally useful with persons of all ages,
whatever their education, nationality or physical condition. For comparative purposes Standard
Progressive Matrices is used internationally, it can be given either as an individual, a self-
administered or a group test (Raven, Court and Raven, 1983).
If total score of person on Standard Progressive Matrices and his age is known, his
percentile point can be found on tables given in the norm of the instrument. Percentile point helps
to determine the intellectual capacity grade of a person. If total score of person on Standard
Progressive Matrices classify the respondents into five intellectual capacity grades according to the
criteria as given below:
GRADE I “Intellectually Superior”, if the score lies at or above the 95th percentile for the people
of his age group.
182
GRADE II “Definitely above the average in intellectual capacity”, if the score lies at or above the
75th percentile; II+ if score lies at or above the 90th percentile.
GRADE III “Intellectually average”, if the score lies between 25th and 75th percentiles; III+, if the
score is the greater than the median or 50th percentile; III-, if the score is less than the median.
GRADE IV “Definitely below average in intellectual capacity”, if the score lies at or below the 25th
percentile; IV-, if the score lies at or below 10th percentile.
GRADE V “Intellectually defective”, if the score lies at or below the 5th percentile for his age
group.
(Source: Raven, Court and Raven, 1983)
4.9.2 Achievement Test
Achievement test (Appendix-ii) has been used as pre-test and post-test was developed by the
investigator. Test comprised of sixty multiple choice items. This test was based on the text material
and vocal explanation included in the multimedia package instruction and conventional method of
instruction. A comprehensive table of specification (Appendix-i) for the test was framed. Cells in
the two way chart of specification gave the detail of number of test items by content and
instructional objectives. The criterion for instructional objectives was worked out by the
investigator. This criterion was developed by classifying the objectives of teaching Biology as given
in the curriculum of Biology for class IX. Objectives were classified in terms of the categories in
cognitive domain of the taxonomy of educational objectives. Proportion of items to be included in
the test was computed by relative proportion of emphasis laid in the objectives. Pre-test and post-
test comprising sixty multiple choice items have 22 items to measure knowledge, 18 items to
measure understanding, 12 items to measure application and 8 items to assess the skill ability of
the students.
Validation and Pilot Testing
A panel of seven experienced teachers (two field experienced high school teachers who taught
Biology, three teacher educators who deal method of teaching Biology and one subject expert in
zoology and one teacher educator in English methodology) validated the test. Pilot test was
containing 130 items it was conducted by administering the test to 20 students of IX standard who
were not included in the study. On the basis of item analysis, 70 items were deleted and slight
modifications were made in some items. The final form of the test contained 60 objective type
multiple choice items and the duration of the test was one hour. After item analysis, the reliability
coefficient alpha was computed on Predictive Analysis Software (PASW). Reliability coefficient
alpha (Cronbach alpha) is model of internal consistency based on average inter-item correlations.
183
This coefficient is a general form of the Kuder Richardson-20 (KR-20) formula. Pilot test data
revealed the reliability coefficient of the sixty items test to be 0.74 it was considered acceptable
according to a thumb rule suggested by Fraenkel and Wallen (1993) that reliability of a test for
research purposes should be at least 0.70 and preferably higher.
Validity
A logical examination of instructional objectives and the contents to be taught was done by a panel
of experts, one associate professor in the field of subject, three assistant professors in the field of
education and two senior teachers of the subject concerned from the high schools and one teacher
educator in English methodology. The agreement of the views of seven experts was taken as the
index of the content validity of the achievement test.
Preparation of the Final Test
More than required number of items was included in the test under each objective and content
unit. This was done to get enough items for the final test. Out of 117 items included in the pilot
test, 60 items were selected for the final test based on the difficulty index and discriminative
power. The test items were prepared based a blue print, by giving due weightage to content,
objective, and difficulty level which were fixed in concurrence with a number of general and special
teachers who are expert in the content, methodology and field experience. A question booklet with
instructions was given to the students on how to answer the questions in the final form question
booklet (Appendix-B). The items were arranged in the order of difficulty level and the time limit
was fixed to 60 minutes. Separate answer sheets (Appendix-C) were provided for writing the
correct response.
Weightage to Content
The weightage to different units and sub units in the content of the achievement test are given in
Table-4.1.
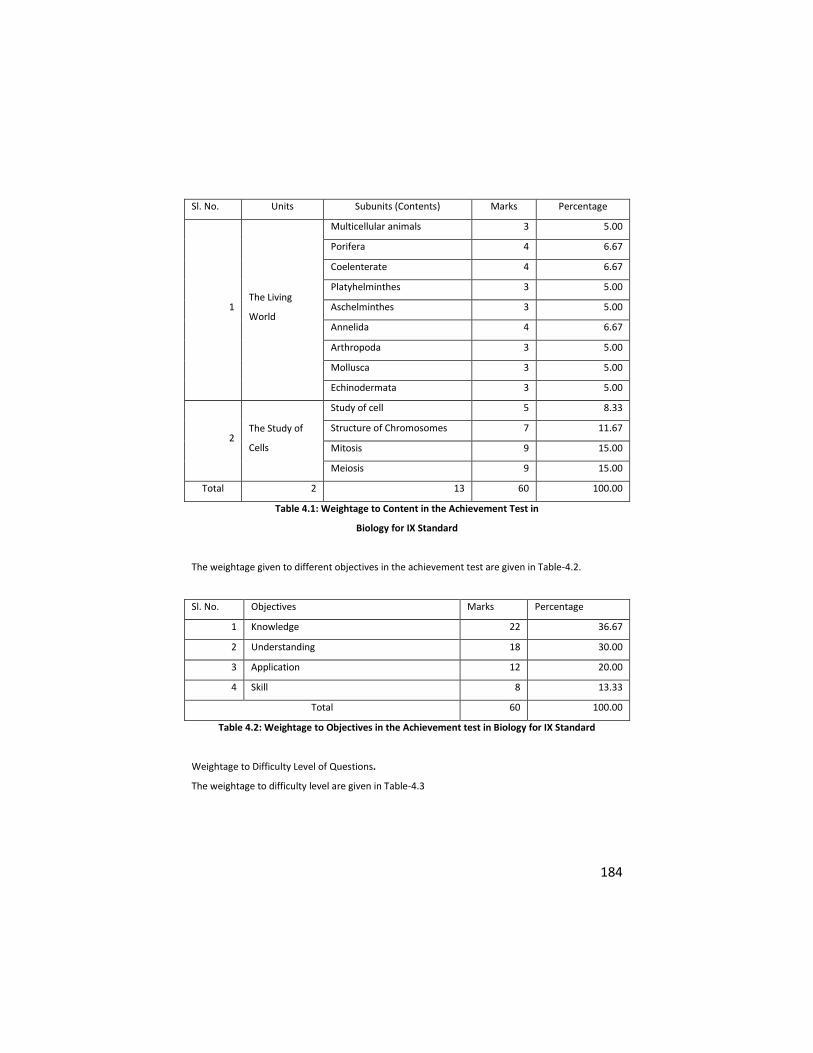
184
Sl. No. Units Subunits (Contents) Marks Percentage
1 The Living
World
Multicellular animals 3 5.00
Porifera 4 6.67
Coelenterate 4 6.67
Platyhelminthes 3 5.00
Aschelminthes 3 5.00
Annelida 4 6.67
Arthropoda 3 5.00
Mollusca 3 5.00
Echinodermata 3 5.00
2 The Study of
Cells
Study of cell 5 8.33
Structure of Chromosomes 7 11.67
Mitosis 9 15.00
Meiosis 9 15.00
Total 2 13 60 100.00
Table 4.1: Weightage to Content in the Achievement Test in
Biology for IX Standard
The weightage given to different objectives in the achievement test are given in Table-4.2.
Sl. No. Objectives Marks Percentage
1 Knowledge 22 36.67
2 Understanding 18 30.00
3 Application 12 20.00
4 Skill 8 13.33
Total 60 100.00
Table 4.2: Weightage to Objectives in the Achievement test in Biology for IX Standard
Weightage to Difficulty Level of Questions.
The weightage to difficulty level are given in Table-4.3
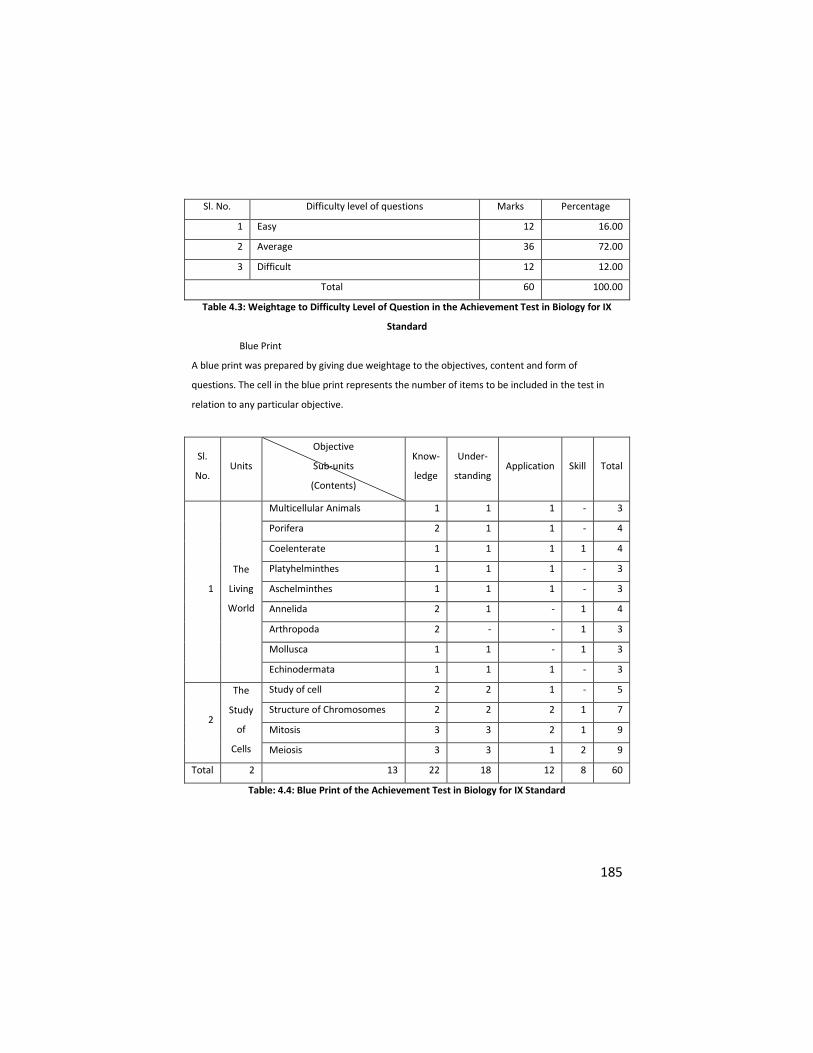
185
Sl. No. Difficulty level of questions Marks Percentage
1 Easy 12 16.00
2 Average 36 72.00
3 Difficult 12 12.00
Total 60 100.00
Table 4.3: Weightage to Difficulty Level of Question in the Achievement Test in Biology for IX
Standard
Blue Print
A blue print was prepared by giving due weightage to the objectives, content and form of
questions. The cell in the blue print represents the number of items to be included in the test in
relation to any particular objective.
Sl.
No. Units
Objective
Sub-units
(Contents)
Know-
ledge
Under-
standing Application Skill Total
1
The
Living
World
Multicellular Animals 1 1 1 - 3
Porifera 2 1 1 - 4
Coelenterate 1 1 1 1 4
Platyhelminthes 1 1 1 - 3
Aschelminthes 1 1 1 - 3
Annelida 2 1 - 1 4
Arthropoda 2 - - 1 3
Mollusca 1 1 - 1 3
Echinodermata 1 1 1 - 3
2
The
Study
of
Cells
Study of cell 2 2 1 - 5
Structure of Chromosomes 2 2 2 1 7
Mitosis 3 3 2 1 9
Meiosis 3 3 1 2 9
Total 2 13 22 18 12 8 60
Table: 4.4: Blue Print of the Achievement Test in Biology for IX Standard
186
Difficulty Index and Discriminative Power
Difficulty index and Discriminative power were computed. According to Ebel and Frisbie (1986)
items with discrimination power of 0.40 and above are very good ones, items with discrimination
power of 0.30 to 0.39 are reasonably good but possibly subject to improvement and items with
discrimination power of 0.20 to 0.29 are marginal items and usually need improvement. Similarly,
difficulty index of multiple choice items having four distracters should be from0.375 to 0.625.
keeping in view the above mentioned criteria items having discrimination power less than 0.30 and
having difficulty index below 0.20 (very difficult items) and above 0.80 (very easy items) were
improved. Difficulty index criterion was relaxed for items having good discrimination power. Items
with good discrimination power and with difficulty index from 0.20 to 0.80 were accepted.
Finalized sixty items achievement test is composed of two sub tests:
a) Sub test with respect to topic: The Living World, it contains 30 items with respect to
content areas and instructional objectives.
b) Sub test with respect to topic: The Study of Cells, it contains 30 items with respect to
content areas and instructional objectives.
4.9.3 Opinionnaire
Learners’ Opinion towards Multimedia Package: The investigator had used opinionnaire to collect
learners’ opinion towards multimedia package (Appendix-v) support for Biology learning from the
experimental group.
It was constructed by the investigator and comprising twenty statements related to
various educational aspects. The opinionnaire comprised twenty statements inviting response on
five point scale i.e. from strongly agree to strongly disagree. Scoring was done by assigning values
of one to five for strongly disagree to strongly agree responses. Eight statements invited the
respondents to opine about the content presentation in multimedia package, four statements
invited opinion about questioning in multimedia package, another four statements sought
response about individualization and self-pacing of multimedia package and another four
statements invited the respondents to compare multimedia package with the conventional method
of instruction and opine in favor of multimedia package or vice versa. Scoring was done by
assigning values of one to five for strongly disagree to strongly agree responses. This instrument
elicits student opinion about content presentation, questioning (multiple choice items with
immediate feedback) individualization and on the whole impact of multimedia package in terms of
liking and disliking as compared with the traditional method of instruction.
187
4.9.4 Observation Schedule
The structured observation schedule for teachers has been designed by the investigator to evaluate
the quality of multimedia package (Appendix-iv). This observation schedule has observed on three
point scale from agree no opinion (neutral) and disagree, the space was provided for response to
each statement. It comprises 12 statements which refer to the technical aspects of the software.
Their aim was to evaluate its technical adequacy to the learning objectives of the program. They
deal mainly with statements related to the general structure of the package navigation,
interactivity, design and other aspects that can favor or hinder the learning process. Overall, 22
statements refer to curricular design aspects, usefulness and intend to evaluate the integration
capacity of the program in the learning process of Biology.
4.10 Procedure of Experiment
To compare multimedia method of instruction with conventional method of instruction on
students achievement in Biology, an experiment was conducted at BDE Society’s PDJ high school ‘A’
Raven’s Standard Progressive Matrices (R-SPM) was administered to 117 students of IX standard
students, who were present on the day of test administration. Two matched groups of 40 (20 boys
+ 20 girls) students each were taken to conduct the experiment. Experimental group students
received treatment in the form of multimedia method of instruction in the computer laboratory of
the school while the control group students received instruction as usual from the investigator
every day during the second period; this arrangement was made by the Head mistress of the
school, on investigators’ request. Investigator himself supervised the students of experimental
group while receiving multimedia method of instruction in the laboratory everyday evening.
Investigator remained present in the computer laboratory all the time during the treatment
sessions.
Role of the investigator was to:
• Keep record of students’ daily progress.
• Keep the students busy in purposeful activities by advising them to follow the
instructions strictly.
• Observe the behavior of each student in the laboratory and keep record of interest,
sense of responsibility and attitude towards learning through multimedia method of instruction.
• Maintain disciple in the laboratory during treatment sessions.
• Help students if they had any problem with the usage of multimedia software.
There was no chance of mixing of the students of the control group with students of the
experimental group. Treatment given in two weeks continuously, after immediate completion of
188
the treatment a post test was administered to both the groups and an opinionnaire to multimedia
method instruction group to elicit their opinion at the end of the treatment.
The structured observation schedule for teachers has been designed by the investigator
to evaluate the quality of multimedia package. This observation schedule contains 12 statements
which refer to the technical aspects of the software. Their aim was to evaluate its technical
adequacy to the learning objectives of the program. They deal mainly with statements related to
the general structure of the package navigation, interactivity, design and other aspects that can
favor or hinder the learning process. Overall, 22 statements refer to curricular design aspects,
usefulness and intend to evaluate the integration capacity of the program in the learning process of
Biology. Observation schedule w
point scale where the space was provided for response to each statement.
4.11 Procedure of Data Collection
The experimental group students received treatment in the form of multimedia method of
instruction in the computer laboratory of the school while the control group students received
instruction as usual from the investigator everyday second period of school time. Investigator
himself supervised the students of experimental group while receiving multimedia method of
instruction in the laboratory everyday evening. Investigator remained present in the computer
laboratory all the time during treatment sessions.
The pre-test was administered to both the group just before the beginning of treatment
(Appendix-ii). Both groups were equated on the basis of Raven’s SPM test scores. After the
completion of treatment (teaching), the post test (Appendix-ii) was administered immediately.
Data were collected from 80 students, 40-(20 boys + 20 girls) from each group. The
purpose of this test was to measure the achievement of students, constituting the sample of the
study.
Opinionnaire (Appendix-v) was administered to the students of the experimental group
after immediate completion of the treatment (multimedia method instruction), to collect their
opinion towards the multimedia method of instruction, this data were collected from 40 students
of experimental group, (20 boys + 20 girls).
The structured observation schedule (Appendix-iv) for teachers has been used by the
investigator to evaluate the quality of multimedia package. Observation schedule was given to 10
adequacy to the learning objectives of the multimedia package.
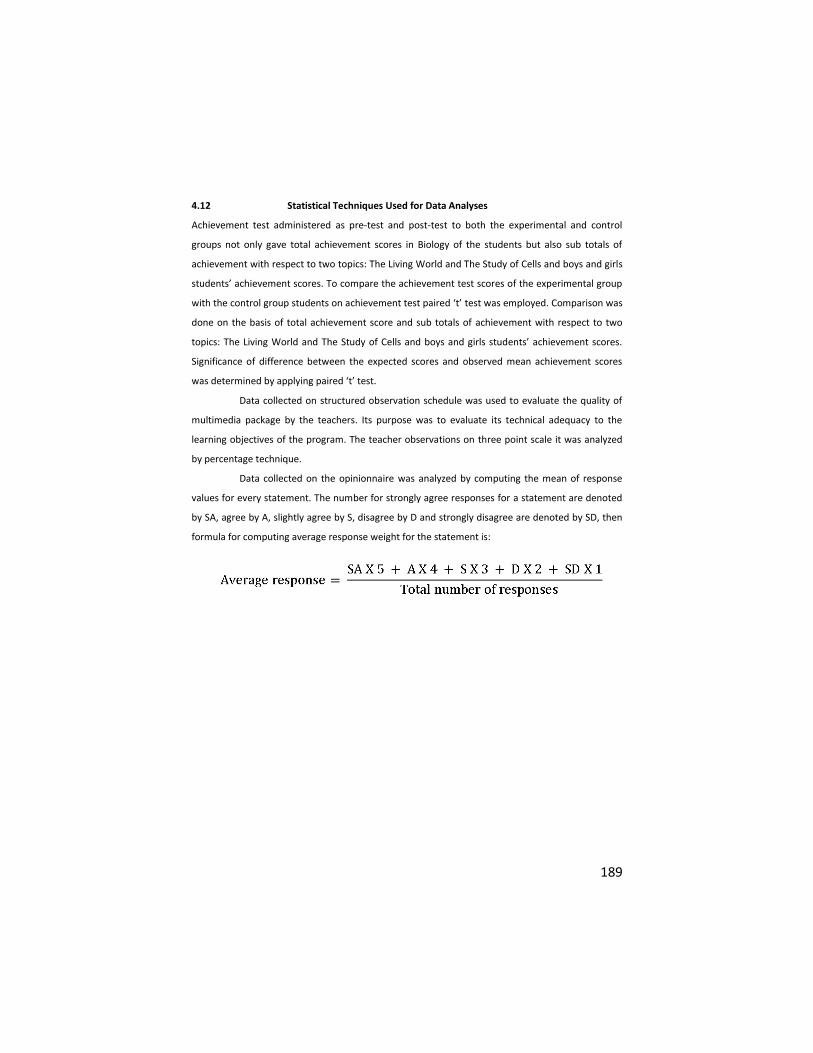
189
4.12 Statistical Techniques Used for Data Analyses
Achievement test administered as pre-test and post-test to both the experimental and control
groups not only gave total achievement scores in Biology of the students but also sub totals of
achievement with respect to two topics: The Living World and The Study of Cells and boys and girls
students’ achievement scores. To compare the achievement test scores of the experimental group
with the control group students on achievement test paired ‘t’ test was employed. Comparison was
done on the basis of total achievement score and sub totals of achievement with respect to two
topics: The Living World and The Study of Cells and boys and girls students’ achievement scores.
Significance of difference between the expected scores and observed mean achievement scores
was determined by applying paired ‘t’ test.
Data collected on structured observation schedule was used to evaluate the quality of
multimedia package by the teachers. Its purpose was to evaluate its technical adequacy to the
learning objectives of the program. The teacher observations on three point scale it was analyzed
by percentage technique.
Data collected on the opinionnaire was analyzed by computing the mean of response
values for every statement. The number for strongly agree responses for a statement are denoted
by SA, agree by A, slightly agree by S, disagree by D and strongly disagree are denoted by SD, then
formula for computing average response weight for the statement is:
190
Analyses and interpretation of data
5.1 Introduction
The main objective of the study was development and validation of multimedia package by
determining the effectiveness in the teaching of Biology. Experimental method was found to be the
best method to test the effectiveness of this multimedia package by comparing with the
conventional method of teaching Biology to the students of high school studying in IX standard. A
sample of 80 students was selected for the experiment, from which experimental group of 40
students (20boys and 20girls) and a control group of 40 students, (20 boys and 20 girls) were
formed. A pre-test for achievement in Biology was administered to know the initial status of
students before the introduction of the treatment variables. To classify the students according to
their level of intelligence, an intelligent test Raven’s Standard Progressive Matrices (Raven’s-SPM)
was also administered to these students for pairs matched group making and further analyses.
After the treatment, a post-test was conducted by administering the same achievement
test used in the pre-test. The scores were consolidated for statistical analyses. Observation
schedule for teachers to evaluate the quality of multimedia package, was used to evaluate its
technical adequacy to the learning objectives of the program, Opinionnaire to elicit student opinion
towards multimedia package was also used.
The analyses and interpretation of data were made in this chapter.
Data were collected on four instruments.
1. Raven’s Standard Progressive Matrices
2. Achievement test
3. Observation schedule
4. Opinionnaire
5.2 Scores on Raven’s Standard Progressive Matrices
Raven’s Standard Progressive Matrices (Raven’s-SPM) yielded the intellectual capacity of the
students for paired matching of the experimental and the control groups. Raven’s-SPM classifies
the respondents into five grades that is Grade I (Intellectually Superior), Grade II (Definitely above
the average in intellectual capacity), Grade III (intellectually average), Grade IV (Definitely below
average in intellectual capacity), and Grade V (Intellectually defective). Raven’s-SPM was
5
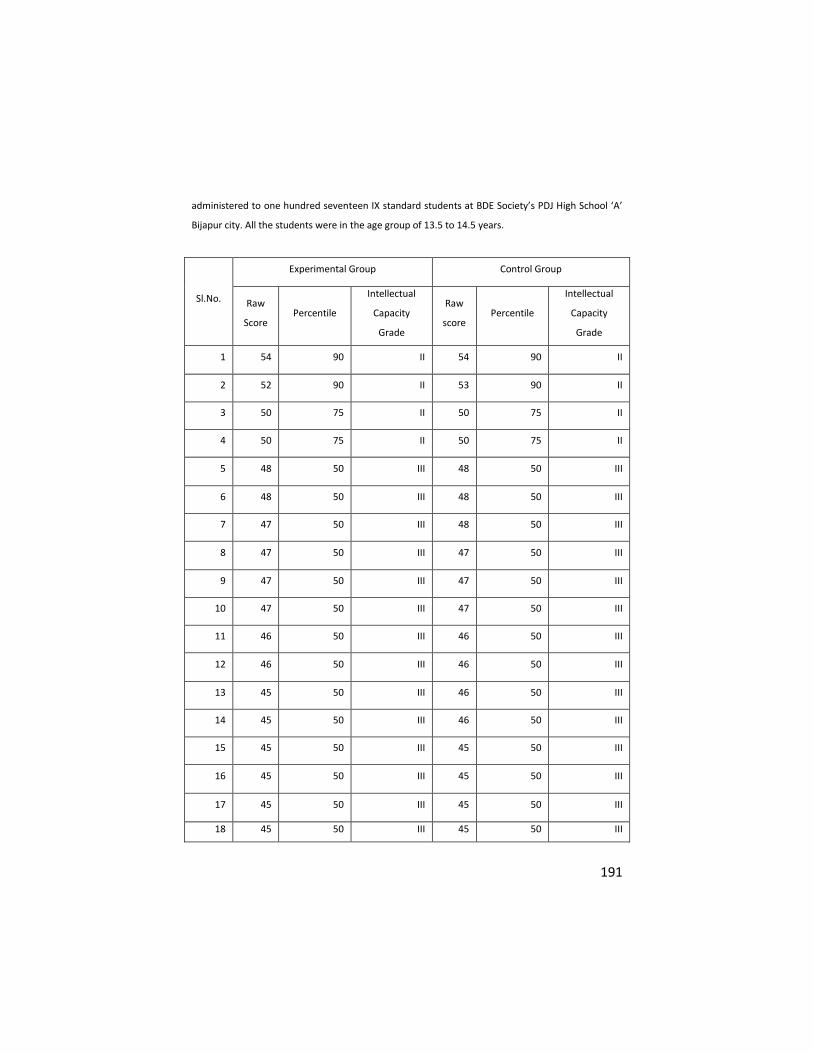
191
administered to one hundred seventeen IX standard students at BDE Society’s PDJ High School ‘A’
Bijapur city. All the students were in the age group of 13.5 to 14.5 years.
Sl.No.
Experimental Group Control Group
Raw
Score Percentile
Intellectual
Capacity
Grade
Raw
score Percentile
Intellectual
Capacity
Grade
1 54 90 II 54 90 II
2 52 90 II 53 90 II
3 50 75 II 50 75 II
4 50 75 II 50 75 II
5 48 50 III 48 50 III
6 48 50 III 48 50 III
7 47 50 III 48 50 III
8 47 50 III 47 50 III
9 47 50 III 47 50 III
10 47 50 III 47 50 III
11 46 50 III 46 50 III
12 46 50 III 46 50 III
13 45 50 III 46 50 III
14 45 50 III 46 50 III
15 45 50 III 45 50 III
16 45 50 III 45 50 III
17 45 50 III 45 50 III
18 45 50 III 45 50 III
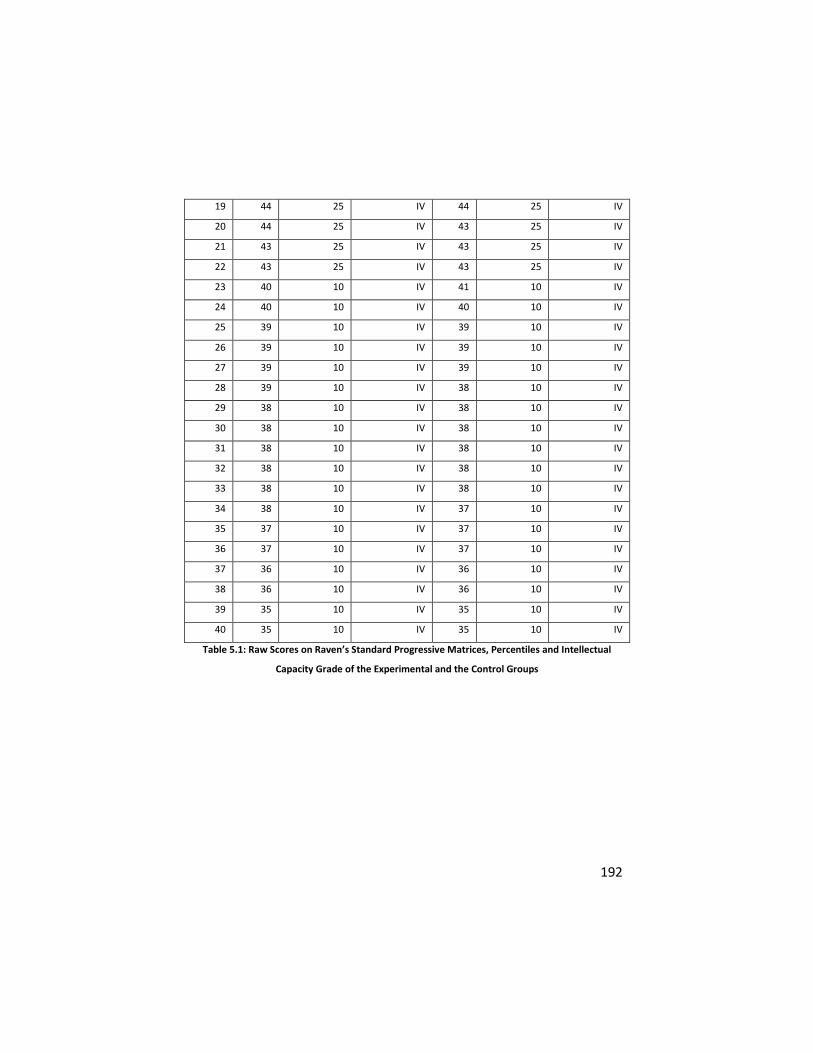
192
19 44 25 IV 44 25 IV
20 44 25 IV 43 25 IV
21 43 25 IV 43 25 IV
22 43 25 IV 43 25 IV
23 40 10 IV 41 10 IV
24 40 10 IV 40 10 IV
25 39 10 IV 39 10 IV
26 39 10 IV 39 10 IV
27 39 10 IV 39 10 IV
28 39 10 IV 38 10 IV
29 38 10 IV 38 10 IV
30 38 10 IV 38 10 IV
31 38 10 IV 38 10 IV
32 38 10 IV 38 10 IV
33 38 10 IV 38 10 IV
34 38 10 IV 37 10 IV
35 37 10 IV 37 10 IV
36 37 10 IV 37 10 IV
37 36 10 IV 36 10 IV
38 36 10 IV 36 10 IV
39 35 10 IV 35 10 IV
40 35 10 IV 35 10 IV
Table 5.1: Raw Scores on Raven’s Standard Progressive Matrices, Percentiles and Intellectual
Capacity Grade of the Experimental and the Control Groups
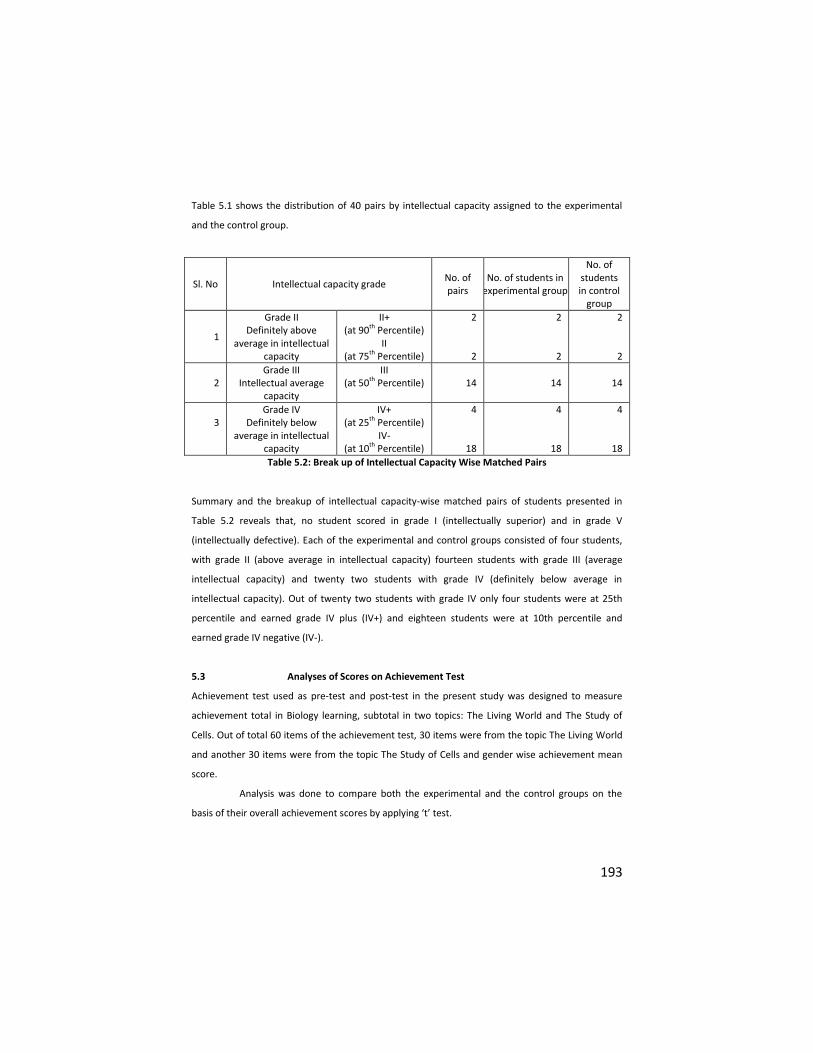
193
Table 5.1 shows the distribution of 40 pairs by intellectual capacity assigned to the experimental
and the control group.
Sl. No Intellectual capacity grade No. of pairs
No. of students in experimental group
No. of students in control
group
1
Grade II Definitely above
average in intellectual capacity
II+ (at 90th Percentile)
II (at 75th Percentile)
2
2
2
2
2
2
2 Grade III
Intellectual average capacity
III (at 50th Percentile) 14 14 14
3
Grade IV Definitely below
average in intellectual capacity
IV+ (at 25th Percentile)
IV- (at 10th Percentile)
4
18
4
18
4
18
Table 5.2: Break up of Intellectual Capacity Wise Matched Pairs
Summary and the breakup of intellectual capacity-wise matched pairs of students presented in
Table 5.2 reveals that, no student scored in grade I (intellectually superior) and in grade V
(intellectually defective). Each of the experimental and control groups consisted of four students,
with grade II (above average in intellectual capacity) fourteen students with grade III (average
intellectual capacity) and twenty two students with grade IV (definitely below average in
intellectual capacity). Out of twenty two students with grade IV only four students were at 25th
percentile and earned grade IV plus (IV+) and eighteen students were at 10th percentile and
earned grade IV negative (IV-).
5.3 Analyses of Scores on Achievement Test
Achievement test used as pre-test and post-test in the present study was designed to measure
achievement total in Biology learning, subtotal in two topics: The Living World and The Study of
Cells. Out of total 60 items of the achievement test, 30 items were from the topic The Living World
and another 30 items were from the topic The Study of Cells and gender wise achievement mean
score.
Analysis was done to compare both the experimental and the control groups on the
basis of their overall achievement scores by applying ‘t’ test.
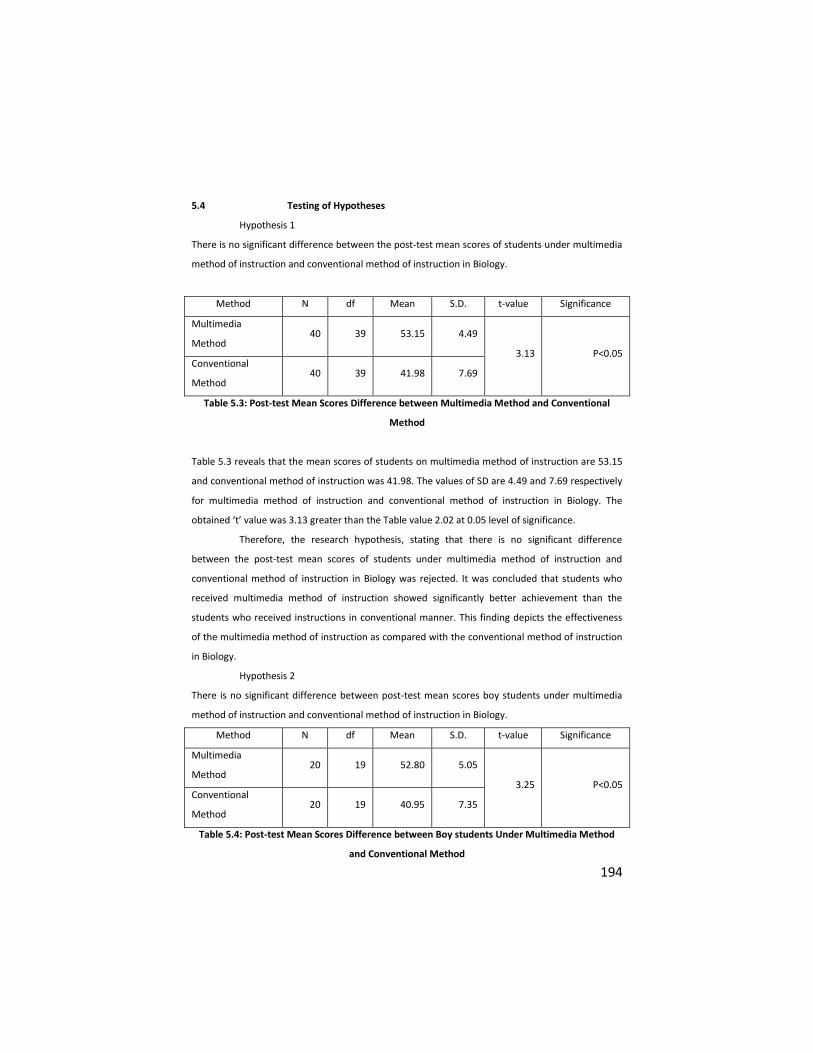
194
5.4 Testing of Hypotheses
Hypothesis 1
There is no significant difference between the post-test mean scores of students under multimedia
method of instruction and conventional method of instruction in Biology.
Method N df Mean S.D. t-value Significance
Multimedia
Method 40 39 53.15 4.49
3.13 P<0.05 Conventional
Method 40 39 41.98 7.69
Table 5.3: Post-test Mean Scores Difference between Multimedia Method and Conventional
Method
Table 5.3 reveals that the mean scores of students on multimedia method of instruction are 53.15
and conventional method of instruction was 41.98. The values of SD are 4.49 and 7.69 respectively
for multimedia method of instruction and conventional method of instruction in Biology. The
obtained ‘t’ value was 3.13 greater than the Table value 2.02 at 0.05 level of significance.
Therefore, the research hypothesis, stating that there is no significant difference
between the post-test mean scores of students under multimedia method of instruction and
conventional method of instruction in Biology was rejected. It was concluded that students who
received multimedia method of instruction showed significantly better achievement than the
students who received instructions in conventional manner. This finding depicts the effectiveness
of the multimedia method of instruction as compared with the conventional method of instruction
in Biology.
Hypothesis 2
There is no significant difference between post-test mean scores boy students under multimedia
method of instruction and conventional method of instruction in Biology.
Method N df Mean S.D. t-value Significance
Multimedia
Method 20 19 52.80 5.05
3.25 P<0.05 Conventional
Method 20 19 40.95 7.35
Table 5.4: Post-test Mean Scores Difference between Boy students Under Multimedia Method
and Conventional Method
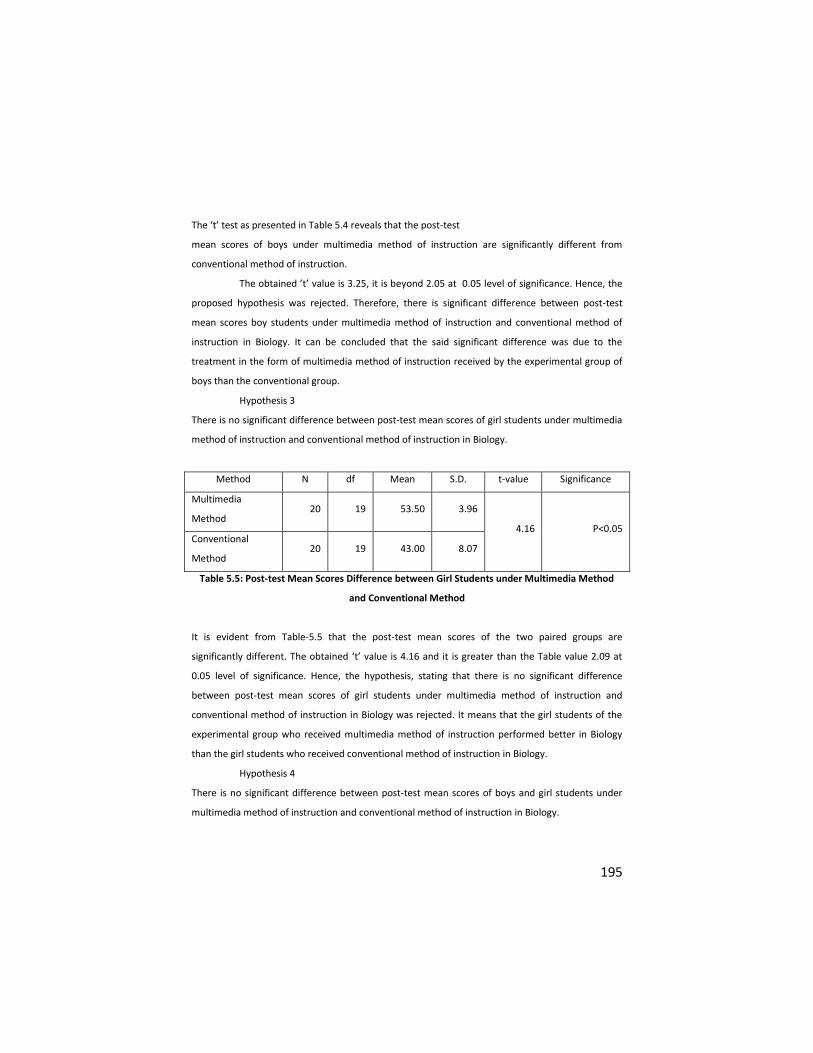
195
The ‘t’ test as presented in Table 5.4 reveals that the post-test
mean scores of boys under multimedia method of instruction are significantly different from
conventional method of instruction.
The obtained ’t’ value is 3.25, it is beyond 2.05 at 0.05 level of significance. Hence, the
proposed hypothesis was rejected. Therefore, there is significant difference between post-test
mean scores boy students under multimedia method of instruction and conventional method of
instruction in Biology. It can be concluded that the said significant difference was due to the
treatment in the form of multimedia method of instruction received by the experimental group of
boys than the conventional group.
Hypothesis 3
There is no significant difference between post-test mean scores of girl students under multimedia
method of instruction and conventional method of instruction in Biology.
Method N df Mean S.D. t-value Significance
Multimedia
Method 20 19 53.50 3.96
4.16 P<0.05 Conventional
Method 20 19 43.00 8.07
Table 5.5: Post-test Mean Scores Difference between Girl Students under Multimedia Method
and Conventional Method
It is evident from Table-5.5 that the post-test mean scores of the two paired groups are
significantly different. The obtained ‘t’ value is 4.16 and it is greater than the Table value 2.09 at
0.05 level of significance. Hence, the hypothesis, stating that there is no significant difference
between post-test mean scores of girl students under multimedia method of instruction and
conventional method of instruction in Biology was rejected. It means that the girl students of the
experimental group who received multimedia method of instruction performed better in Biology
than the girl students who received conventional method of instruction in Biology.
Hypothesis 4
There is no significant difference between post-test mean scores of boys and girl students under
multimedia method of instruction and conventional method of instruction in Biology.
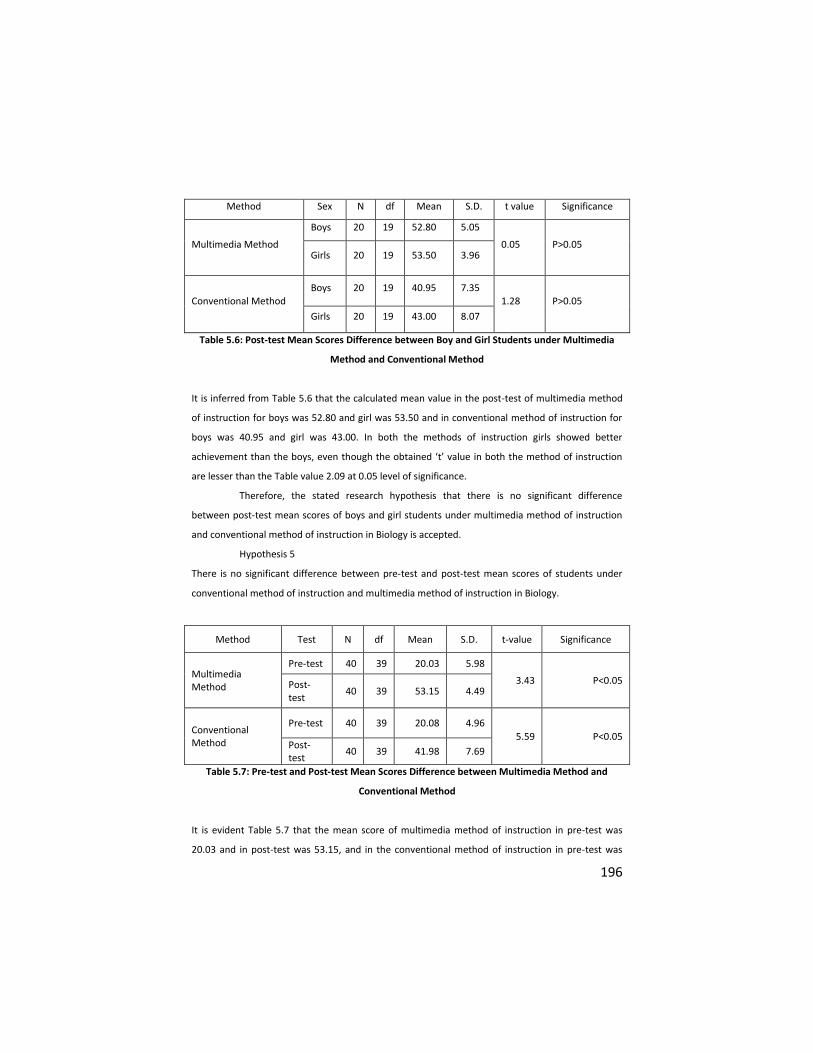
196
Method Sex N df Mean S.D. t value Significance
Multimedia Method
Boys 20 19 52.80 5.05
0.05 P>0.05 Girls 20 19 53.50 3.96
Conventional Method Boys 20 19 40.95 7.35
1.28 P>0.05
Girls 20 19 43.00 8.07
Table 5.6: Post-test Mean Scores Difference between Boy and Girl Students under Multimedia
Method and Conventional Method
It is inferred from Table 5.6 that the calculated mean value in the post-test of multimedia method
of instruction for boys was 52.80 and girl was 53.50 and in conventional method of instruction for
boys was 40.95 and girl was 43.00. In both the methods of instruction girls showed better
achievement than the boys, even though the obtained ‘t’ value in both the method of instruction
are lesser than the Table value 2.09 at 0.05 level of significance.
Therefore, the stated research hypothesis that there is no significant difference
between post-test mean scores of boys and girl students under multimedia method of instruction
and conventional method of instruction in Biology is accepted.
Hypothesis 5
There is no significant difference between pre-test and post-test mean scores of students under
conventional method of instruction and multimedia method of instruction in Biology.
Method Test N df Mean S.D. t-value Significance
Multimedia Method
Pre-test 40 39 20.03 5.98
3.43 P<0.05 Post-test
40 39 53.15 4.49
Conventional Method
Pre-test 40 39 20.08 4.96
5.59 P<0.05 Post-test
40 39 41.98 7.69
Table 5.7: Pre-test and Post-test Mean Scores Difference between Multimedia Method and
Conventional Method
It is evident Table 5.7 that the mean score of multimedia method of instruction in pre-test was
20.03 and in post-test was 53.15, and in the conventional method of instruction in pre-test was
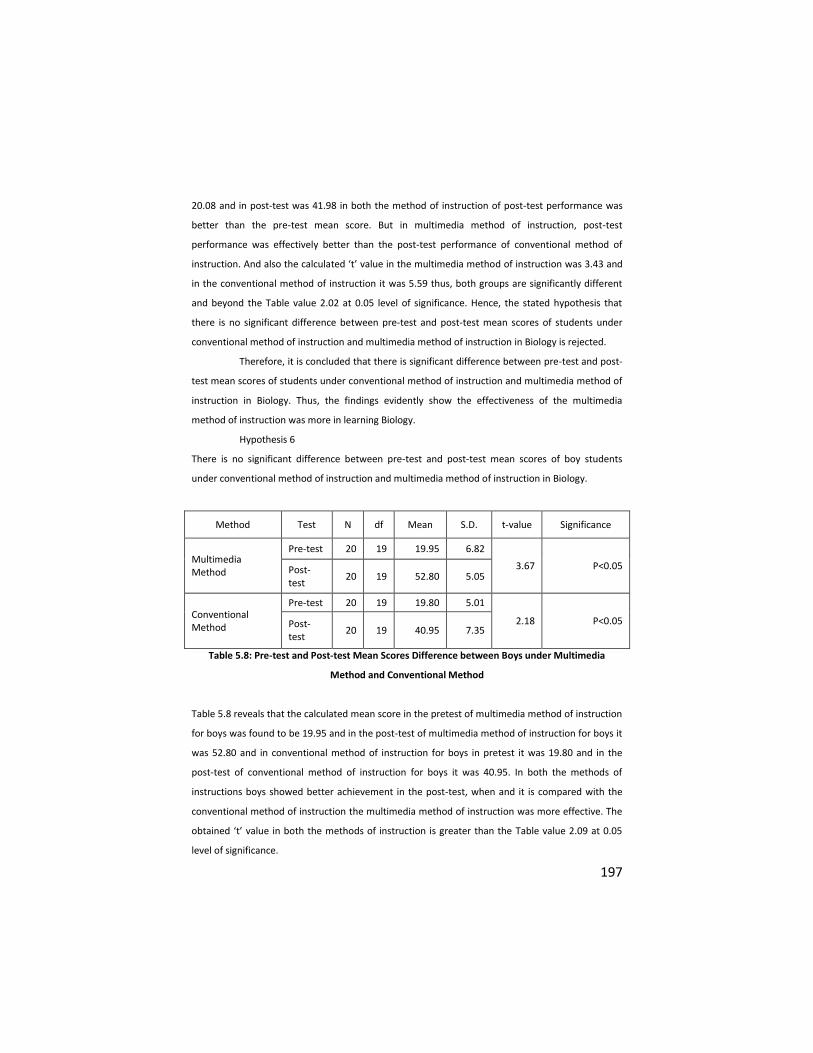
197
20.08 and in post-test was 41.98 in both the method of instruction of post-test performance was
better than the pre-test mean score. But in multimedia method of instruction, post-test
performance was effectively better than the post-test performance of conventional method of
instruction. And also the calculated ‘t’ value in the multimedia method of instruction was 3.43 and
in the conventional method of instruction it was 5.59 thus, both groups are significantly different
and beyond the Table value 2.02 at 0.05 level of significance. Hence, the stated hypothesis that
there is no significant difference between pre-test and post-test mean scores of students under
conventional method of instruction and multimedia method of instruction in Biology is rejected.
Therefore, it is concluded that there is significant difference between pre-test and post-
test mean scores of students under conventional method of instruction and multimedia method of
instruction in Biology. Thus, the findings evidently show the effectiveness of the multimedia
method of instruction was more in learning Biology.
Hypothesis 6
There is no significant difference between pre-test and post-test mean scores of boy students
under conventional method of instruction and multimedia method of instruction in Biology.
Method Test N df Mean S.D. t-value Significance
Multimedia Method
Pre-test 20 19 19.95 6.82
3.67 P<0.05 Post-test
20 19 52.80 5.05
Conventional Method
Pre-test 20 19 19.80 5.01
2.18 P<0.05 Post-test
20 19 40.95 7.35
Table 5.8: Pre-test and Post-test Mean Scores Difference between Boys under Multimedia
Method and Conventional Method
Table 5.8 reveals that the calculated mean score in the pretest of multimedia method of instruction
for boys was found to be 19.95 and in the post-test of multimedia method of instruction for boys it
was 52.80 and in conventional method of instruction for boys in pretest it was 19.80 and in the
post-test of conventional method of instruction for boys it was 40.95. In both the methods of
instructions boys showed better achievement in the post-test, when and it is compared with the
conventional method of instruction the multimedia method of instruction was more effective. The
obtained ‘t’ value in both the methods of instruction is greater than the Table value 2.09 at 0.05
level of significance.
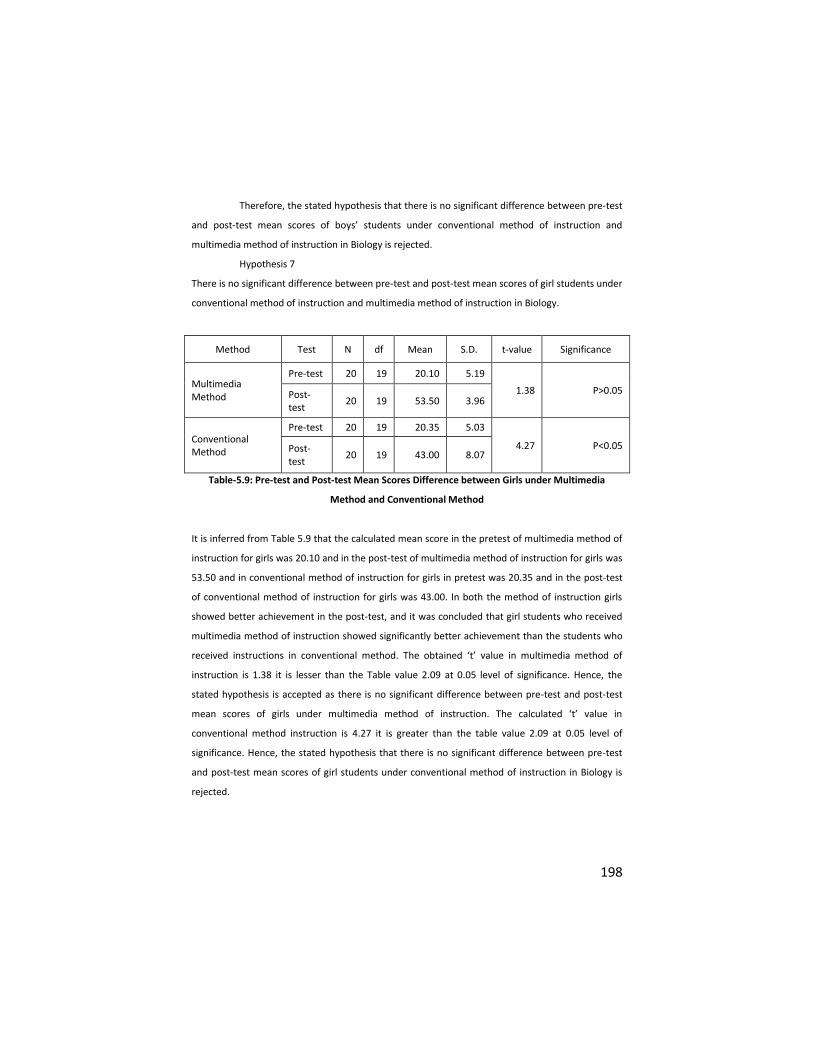
198
Therefore, the stated hypothesis that there is no significant difference between pre-test
and post-test mean scores of boys’ students under conventional method of instruction and
multimedia method of instruction in Biology is rejected.
Hypothesis 7
There is no significant difference between pre-test and post-test mean scores of girl students under
conventional method of instruction and multimedia method of instruction in Biology.
Method Test N df Mean S.D. t-value Significance
Multimedia Method
Pre-test 20 19 20.10 5.19
1.38 P>0.05 Post-test
20 19 53.50 3.96
Conventional Method
Pre-test 20 19 20.35 5.03
4.27 P<0.05 Post-test
20 19 43.00 8.07
Table-5.9: Pre-test and Post-test Mean Scores Difference between Girls under Multimedia
Method and Conventional Method
It is inferred from Table 5.9 that the calculated mean score in the pretest of multimedia method of
instruction for girls was 20.10 and in the post-test of multimedia method of instruction for girls was
53.50 and in conventional method of instruction for girls in pretest was 20.35 and in the post-test
of conventional method of instruction for girls was 43.00. In both the method of instruction girls
showed better achievement in the post-test, and it was concluded that girl students who received
multimedia method of instruction showed significantly better achievement than the students who
received instructions in conventional method. The obtained ‘t’ value in multimedia method of
instruction is 1.38 it is lesser than the Table value 2.09 at 0.05 level of significance. Hence, the
stated hypothesis is accepted as there is no significant difference between pre-test and post-test
mean scores of girls under multimedia method of instruction. The calculated ‘t’ value in
conventional method instruction is 4.27 it is greater than the table value 2.09 at 0.05 level of
significance. Hence, the stated hypothesis that there is no significant difference between pre-test
and post-test mean scores of girl students under conventional method of instruction in Biology is
rejected.
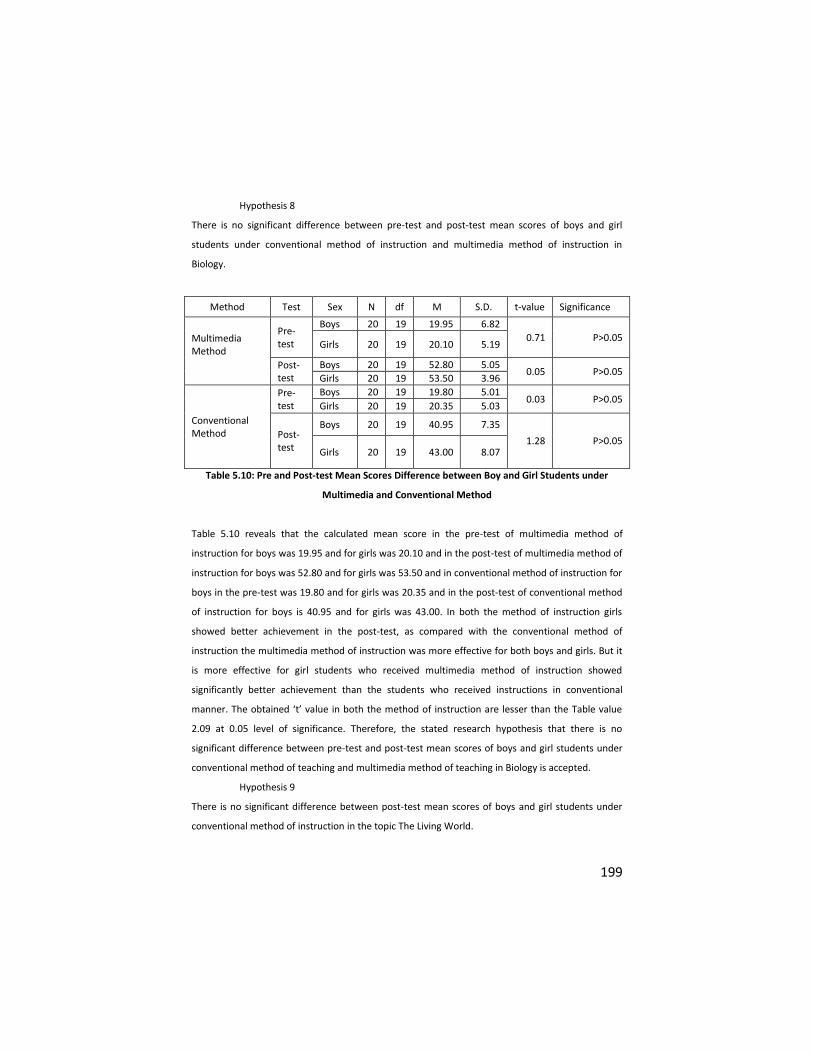
199
Hypothesis 8
There is no significant difference between pre-test and post-test mean scores of boys and girl
students under conventional method of instruction and multimedia method of instruction in
Biology.
Method Test Sex N df M S.D. t-value Significance
Multimedia Method
Pre-test
Boys 20 19 19.95 6.82
0.71 P>0.05 Girls 20 19 20.10 5.19
Post-test
Boys 20 19 52.80 5.05 0.05 P>0.05
Girls 20 19 53.50 3.96
Conventional Method
Pre-test
Boys 20 19 19.80 5.01 0.03 P>0.05
Girls 20 19 20.35 5.03
Post-test
Boys 20 19 40.95 7.35
1.28 P>0.05 Girls 20 19 43.00 8.07
Table 5.10: Pre and Post-test Mean Scores Difference between Boy and Girl Students under
Multimedia and Conventional Method
Table 5.10 reveals that the calculated mean score in the pre-test of multimedia method of
instruction for boys was 19.95 and for girls was 20.10 and in the post-test of multimedia method of
instruction for boys was 52.80 and for girls was 53.50 and in conventional method of instruction for
boys in the pre-test was 19.80 and for girls was 20.35 and in the post-test of conventional method
of instruction for boys is 40.95 and for girls was 43.00. In both the method of instruction girls
showed better achievement in the post-test, as compared with the conventional method of
instruction the multimedia method of instruction was more effective for both boys and girls. But it
is more effective for girl students who received multimedia method of instruction showed
significantly better achievement than the students who received instructions in conventional
manner. The obtained ‘t’ value in both the method of instruction are lesser than the Table value
2.09 at 0.05 level of significance. Therefore, the stated research hypothesis that there is no
significant difference between pre-test and post-test mean scores of boys and girl students under
conventional method of teaching and multimedia method of teaching in Biology is accepted.
Hypothesis 9
There is no significant difference between post-test mean scores of boys and girl students under
conventional method of instruction in the topic The Living World.
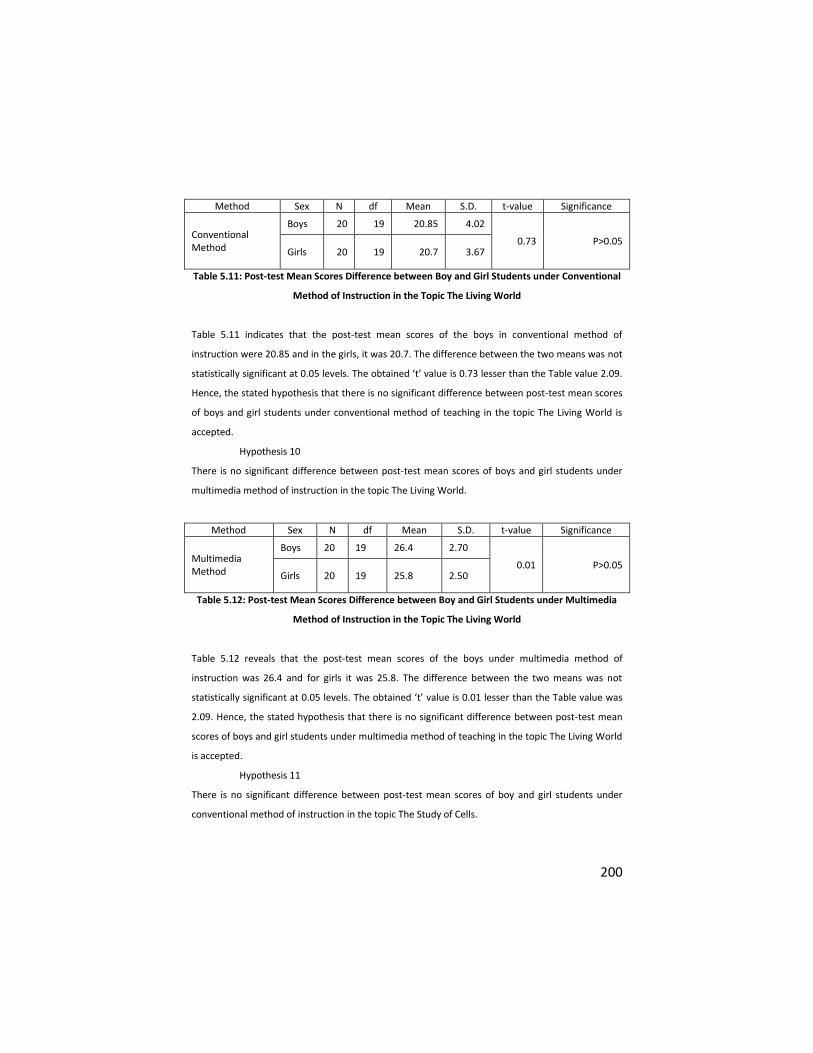
200
Method Sex N df Mean S.D. t-value Significance
Conventional Method
Boys 20 19 20.85 4.02
0.73 P>0.05 Girls 20 19 20.7 3.67
Table 5.11: Post-test Mean Scores Difference between Boy and Girl Students under Conventional
Method of Instruction in the Topic The Living World
Table 5.11 indicates that the post-test mean scores of the boys in conventional method of
instruction were 20.85 and in the girls, it was 20.7. The difference between the two means was not
statistically significant at 0.05 levels. The obtained ‘t’ value is 0.73 lesser than the Table value 2.09.
Hence, the stated hypothesis that there is no significant difference between post-test mean scores
of boys and girl students under conventional method of teaching in the topic The Living World is
accepted.
Hypothesis 10
There is no significant difference between post-test mean scores of boys and girl students under
multimedia method of instruction in the topic The Living World.
Method Sex N df Mean S.D. t-value Significance
Multimedia Method
Boys 20 19 26.4 2.70
0.01 P>0.05 Girls 20 19 25.8 2.50
Table 5.12: Post-test Mean Scores Difference between Boy and Girl Students under Multimedia
Method of Instruction in the Topic The Living World
Table 5.12 reveals that the post-test mean scores of the boys under multimedia method of
instruction was 26.4 and for girls it was 25.8. The difference between the two means was not
statistically significant at 0.05 levels. The obtained ‘t’ value is 0.01 lesser than the Table value was
2.09. Hence, the stated hypothesis that there is no significant difference between post-test mean
scores of boys and girl students under multimedia method of teaching in the topic The Living World
is accepted.
Hypothesis 11
There is no significant difference between post-test mean scores of boy and girl students under
conventional method of instruction in the topic The Study of Cells.
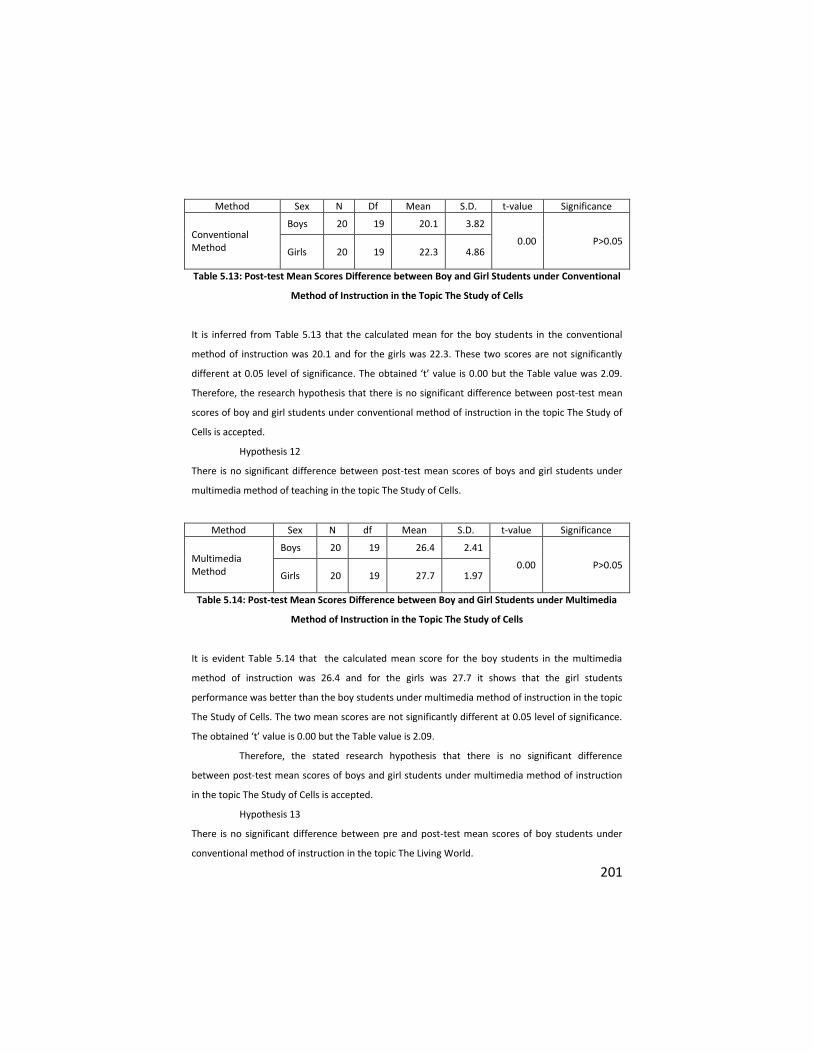
201
Method Sex N Df Mean S.D. t-value Significance
Conventional Method
Boys 20 19 20.1 3.82
0.00 P>0.05 Girls 20 19 22.3 4.86
Table 5.13: Post-test Mean Scores Difference between Boy and Girl Students under Conventional
Method of Instruction in the Topic The Study of Cells
It is inferred from Table 5.13 that the calculated mean for the boy students in the conventional
method of instruction was 20.1 and for the girls was 22.3. These two scores are not significantly
different at 0.05 level of significance. The obtained ‘t’ value is 0.00 but the Table value was 2.09.
Therefore, the research hypothesis that there is no significant difference between post-test mean
scores of boy and girl students under conventional method of instruction in the topic The Study of
Cells is accepted.
Hypothesis 12
There is no significant difference between post-test mean scores of boys and girl students under
multimedia method of teaching in the topic The Study of Cells.
Method Sex N df Mean S.D. t-value Significance
Multimedia Method
Boys 20 19 26.4 2.41
0.00 P>0.05 Girls 20 19 27.7 1.97
Table 5.14: Post-test Mean Scores Difference between Boy and Girl Students under Multimedia
Method of Instruction in the Topic The Study of Cells
It is evident Table 5.14 that the calculated mean score for the boy students in the multimedia
method of instruction was 26.4 and for the girls was 27.7 it shows that the girl students
performance was better than the boy students under multimedia method of instruction in the topic
The Study of Cells. The two mean scores are not significantly different at 0.05 level of significance.
The obtained ‘t’ value is 0.00 but the Table value is 2.09.
Therefore, the stated research hypothesis that there is no significant difference
between post-test mean scores of boys and girl students under multimedia method of instruction
in the topic The Study of Cells is accepted.
Hypothesis 13
There is no significant difference between pre and post-test mean scores of boy students under
conventional method of instruction in the topic The Living World.
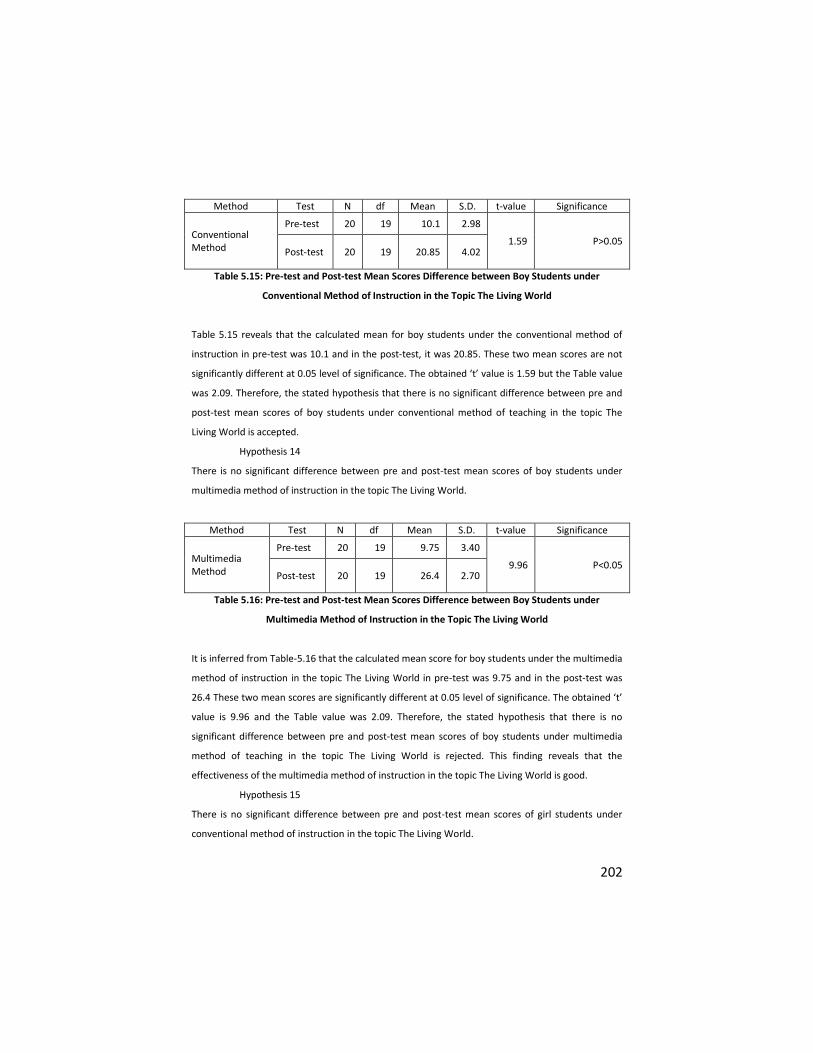
202
Method Test N df Mean S.D. t-value Significance
Conventional Method
Pre-test 20 19 10.1 2.98
1.59 P>0.05 Post-test 20 19 20.85 4.02
Table 5.15: Pre-test and Post-test Mean Scores Difference between Boy Students under
Conventional Method of Instruction in the Topic The Living World
Table 5.15 reveals that the calculated mean for boy students under the conventional method of
instruction in pre-test was 10.1 and in the post-test, it was 20.85. These two mean scores are not
significantly different at 0.05 level of significance. The obtained ‘t’ value is 1.59 but the Table value
was 2.09. Therefore, the stated hypothesis that there is no significant difference between pre and
post-test mean scores of boy students under conventional method of teaching in the topic The
Living World is accepted.
Hypothesis 14
There is no significant difference between pre and post-test mean scores of boy students under
multimedia method of instruction in the topic The Living World.
Method Test N df Mean S.D. t-value Significance
Multimedia Method
Pre-test 20 19 9.75 3.40
9.96 P<0.05 Post-test 20 19 26.4 2.70
Table 5.16: Pre-test and Post-test Mean Scores Difference between Boy Students under
Multimedia Method of Instruction in the Topic The Living World
It is inferred from Table-5.16 that the calculated mean score for boy students under the multimedia
method of instruction in the topic The Living World in pre-test was 9.75 and in the post-test was
26.4 These two mean scores are significantly different at 0.05 level of significance. The obtained ‘t’
value is 9.96 and the Table value was 2.09. Therefore, the stated hypothesis that there is no
significant difference between pre and post-test mean scores of boy students under multimedia
method of teaching in the topic The Living World is rejected. This finding reveals that the
effectiveness of the multimedia method of instruction in the topic The Living World is good.
Hypothesis 15
There is no significant difference between pre and post-test mean scores of girl students under
conventional method of instruction in the topic The Living World.
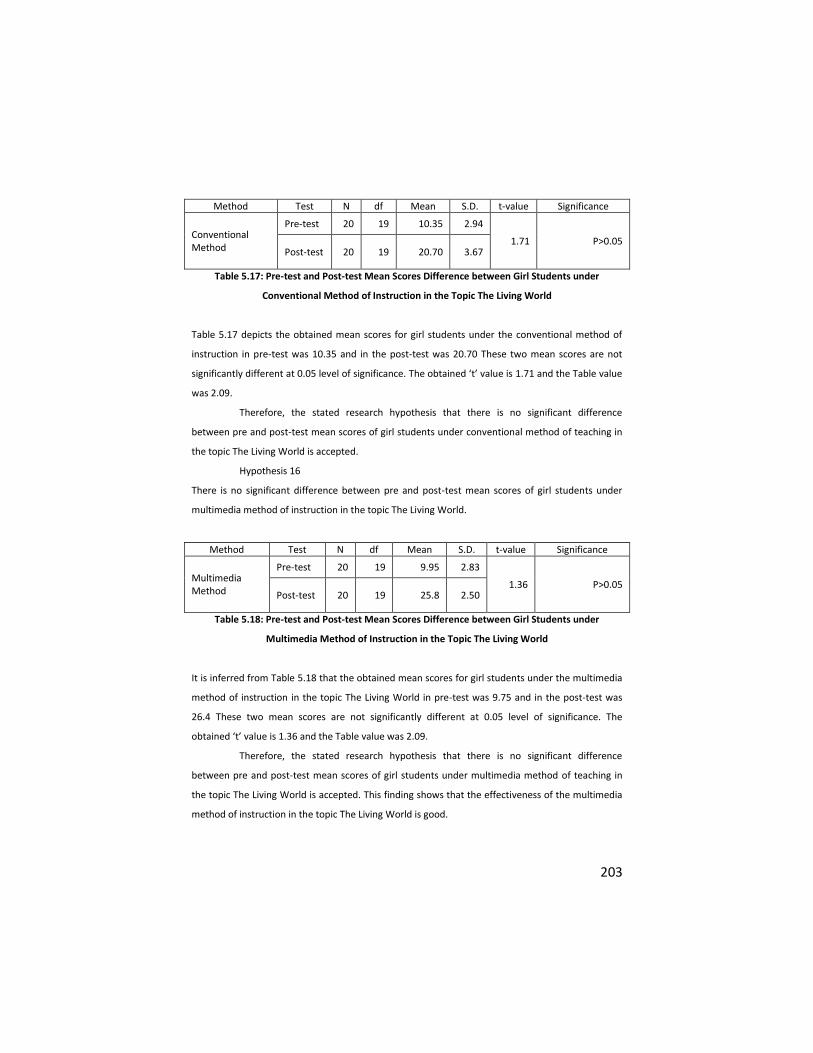
203
Method Test N df Mean S.D. t-value Significance
Conventional Method
Pre-test 20 19 10.35 2.94
1.71 P>0.05 Post-test 20 19 20.70 3.67
Table 5.17: Pre-test and Post-test Mean Scores Difference between Girl Students under
Conventional Method of Instruction in the Topic The Living World
Table 5.17 depicts the obtained mean scores for girl students under the conventional method of
instruction in pre-test was 10.35 and in the post-test was 20.70 These two mean scores are not
significantly different at 0.05 level of significance. The obtained ‘t’ value is 1.71 and the Table value
was 2.09.
Therefore, the stated research hypothesis that there is no significant difference
between pre and post-test mean scores of girl students under conventional method of teaching in
the topic The Living World is accepted.
Hypothesis 16
There is no significant difference between pre and post-test mean scores of girl students under
multimedia method of instruction in the topic The Living World.
Method Test N df Mean S.D. t-value Significance
Multimedia Method
Pre-test 20 19 9.95 2.83
1.36 P>0.05 Post-test 20 19 25.8 2.50
Table 5.18: Pre-test and Post-test Mean Scores Difference between Girl Students under
Multimedia Method of Instruction in the Topic The Living World
It is inferred from Table 5.18 that the obtained mean scores for girl students under the multimedia
method of instruction in the topic The Living World in pre-test was 9.75 and in the post-test was
26.4 These two mean scores are not significantly different at 0.05 level of significance. The
obtained ‘t’ value is 1.36 and the Table value was 2.09.
Therefore, the stated research hypothesis that there is no significant difference
between pre and post-test mean scores of girl students under multimedia method of teaching in
the topic The Living World is accepted. This finding shows that the effectiveness of the multimedia
method of instruction in the topic The Living World is good.
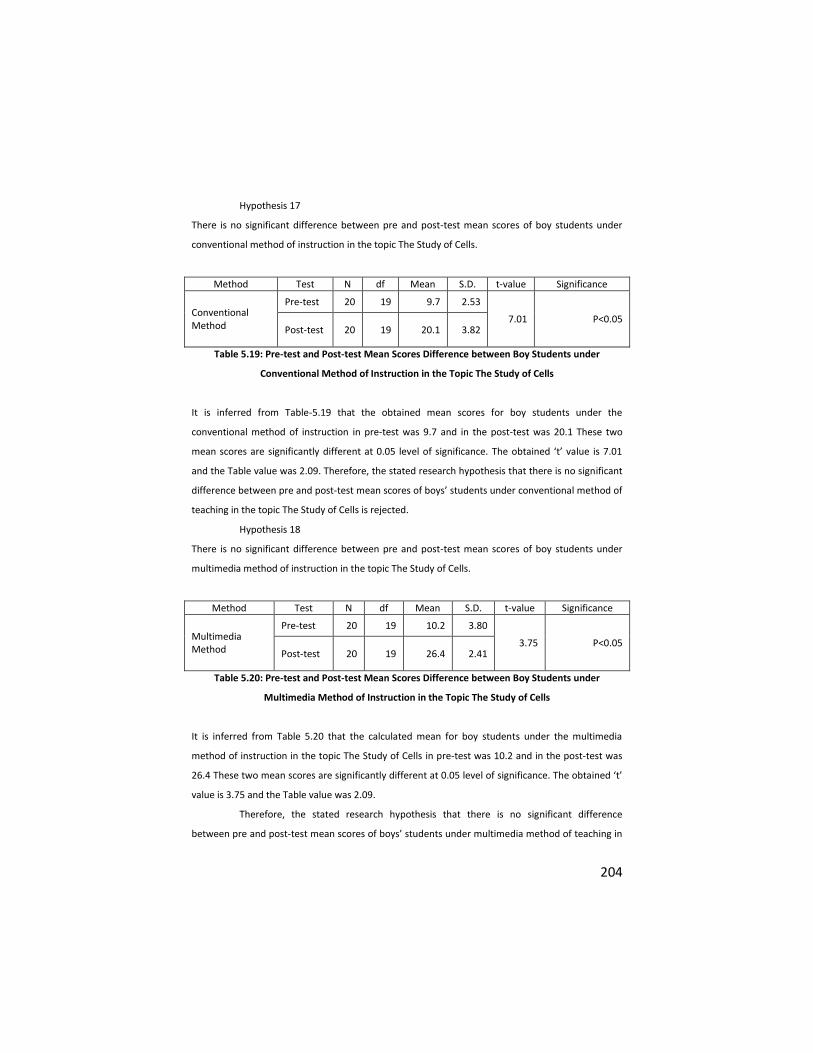
204
Hypothesis 17
There is no significant difference between pre and post-test mean scores of boy students under
conventional method of instruction in the topic The Study of Cells.
Method Test N df Mean S.D. t-value Significance
Conventional Method
Pre-test 20 19 9.7 2.53
7.01 P<0.05 Post-test 20 19 20.1 3.82
Table 5.19: Pre-test and Post-test Mean Scores Difference between Boy Students under
Conventional Method of Instruction in the Topic The Study of Cells
It is inferred from Table-5.19 that the obtained mean scores for boy students under the
conventional method of instruction in pre-test was 9.7 and in the post-test was 20.1 These two
mean scores are significantly different at 0.05 level of significance. The obtained ‘t’ value is 7.01
and the Table value was 2.09. Therefore, the stated research hypothesis that there is no significant
difference between pre and post-test mean scores of boys’ students under conventional method of
teaching in the topic The Study of Cells is rejected.
Hypothesis 18
There is no significant difference between pre and post-test mean scores of boy students under
multimedia method of instruction in the topic The Study of Cells.
Method Test N df Mean S.D. t-value Significance
Multimedia Method
Pre-test 20 19 10.2 3.80
3.75 P<0.05 Post-test 20 19 26.4 2.41
Table 5.20: Pre-test and Post-test Mean Scores Difference between Boy Students under
Multimedia Method of Instruction in the Topic The Study of Cells
It is inferred from Table 5.20 that the calculated mean for boy students under the multimedia
method of instruction in the topic The Study of Cells in pre-test was 10.2 and in the post-test was
26.4 These two mean scores are significantly different at 0.05 level of significance. The obtained ‘t’
value is 3.75 and the Table value was 2.09.
Therefore, the stated research hypothesis that there is no significant difference
between pre and post-test mean scores of boys’ students under multimedia method of teaching in

205
the topic The Study of Cells is rejected. This finding reveals that the effectiveness of the multimedia
method of instruction in the topic The Study of Cells is good.
Hypothesis 19
There is no significant difference between pre and post-test mean scores of girl students under
conventional method of instruction in the topic The Study of Cells.
Method Test N df Mean S.D. t-value Significance
Conventional Method
Pre-test 20 19 10.0 2.53
3.99 P<0.05 Post-test 20 19 22.3 4.86
Table 5.21: Pre-test and Post-test Mean Scores Difference between Girl Students under
Conventional Method of Instruction in the Topic The Study of Cells
It is inferred from Table 5.21 that the obtained mean scores for girl students under the
conventional method of instruction in the topic The Study of Cells in pre-test was 10.0 and in the
post-test was 22.3 These two mean scores are significantly different at 0.05 level of significance.
The obtained ‘t’ value is 3.99 and the Table value was 2.09.
Therefore, the stated research hypothesis that there is no significant difference
between pre and post-test mean scores of girls’ students under conventional method of teaching in
the topic The Study of Cells is rejected.
Hypothesis 20
There is no significant difference between pre and post-test mean scores of girl students under
multimedia method of instruction in the topic The Study of Cells.
Method Test N df Mean S.D. t-value Significance
Multimedia Method
Pre-test 20 19 10.15 2.71
1.33 P>0.05 Post-test 20 19 27.7 1.97
Table 5.22: Pre-test and Post-test Mean Scores Difference between Girl Students under
Multimedia Method of Instruction in the Topic The Study of Cells
It is evident from Table-5.22 that the obtained mean scores for girl students under the multimedia
method of instruction in the topic The Study of Cells in pre-test was 10.15 and in the post-test was
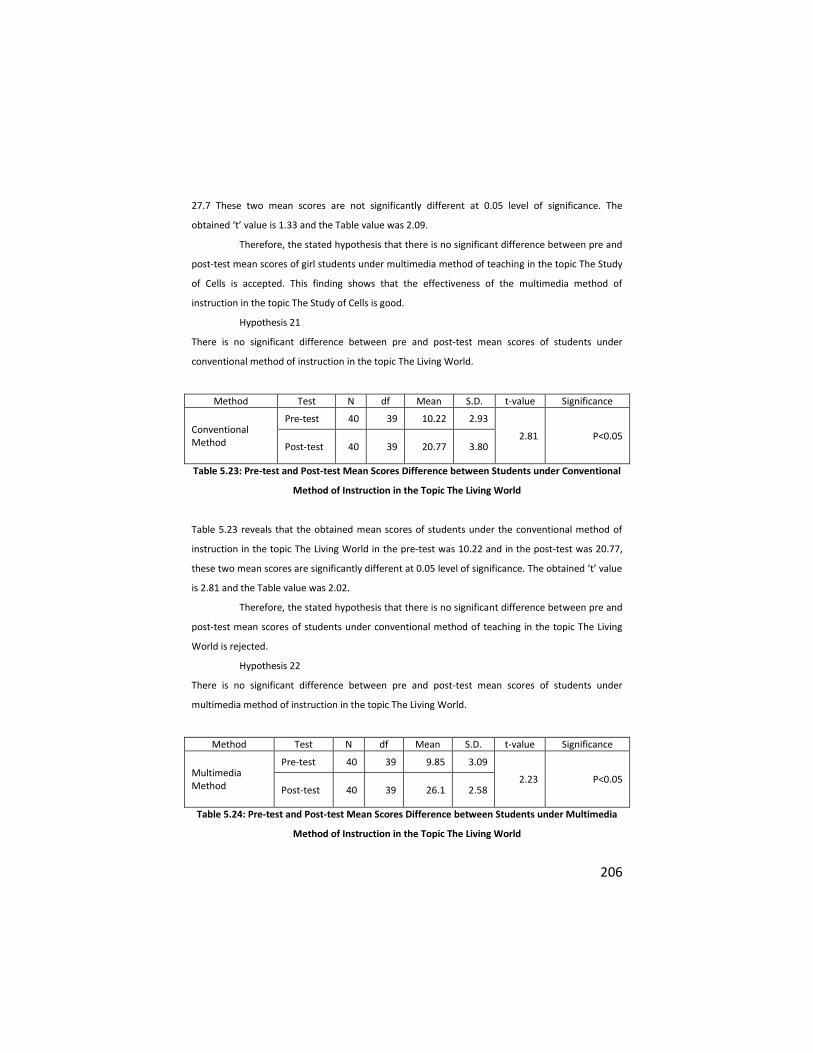
206
27.7 These two mean scores are not significantly different at 0.05 level of significance. The
obtained ‘t’ value is 1.33 and the Table value was 2.09.
Therefore, the stated hypothesis that there is no significant difference between pre and
post-test mean scores of girl students under multimedia method of teaching in the topic The Study
of Cells is accepted. This finding shows that the effectiveness of the multimedia method of
instruction in the topic The Study of Cells is good.
Hypothesis 21
There is no significant difference between pre and post-test mean scores of students under
conventional method of instruction in the topic The Living World.
Method Test N df Mean S.D. t-value Significance
Conventional Method
Pre-test 40 39 10.22 2.93
2.81 P<0.05 Post-test 40 39 20.77 3.80
Table 5.23: Pre-test and Post-test Mean Scores Difference between Students under Conventional
Method of Instruction in the Topic The Living World
Table 5.23 reveals that the obtained mean scores of students under the conventional method of
instruction in the topic The Living World in the pre-test was 10.22 and in the post-test was 20.77,
these two mean scores are significantly different at 0.05 level of significance. The obtained ‘t’ value
is 2.81 and the Table value was 2.02.
Therefore, the stated hypothesis that there is no significant difference between pre and
post-test mean scores of students under conventional method of teaching in the topic The Living
World is rejected.
Hypothesis 22
There is no significant difference between pre and post-test mean scores of students under
multimedia method of instruction in the topic The Living World.
Method Test N df Mean S.D. t-value Significance
Multimedia Method
Pre-test 40 39 9.85 3.09
2.23 P<0.05 Post-test 40 39 26.1 2.58
Table 5.24: Pre-test and Post-test Mean Scores Difference between Students under Multimedia
Method of Instruction in the Topic The Living World
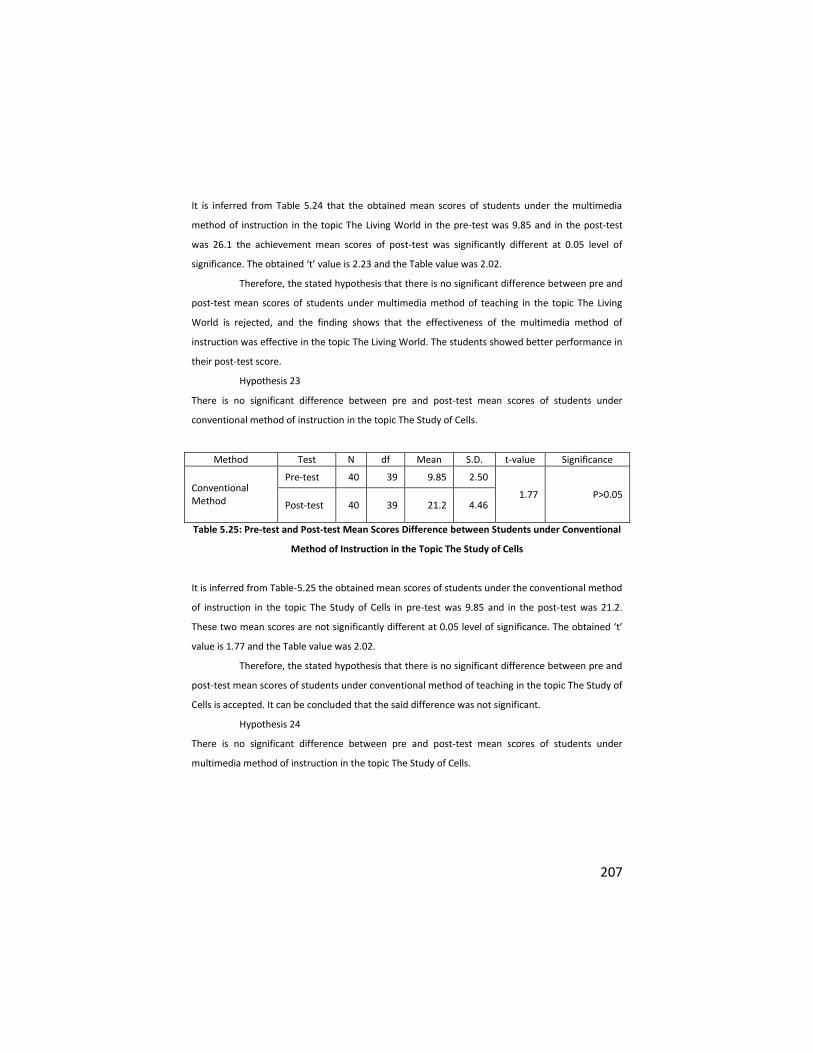
207
It is inferred from Table 5.24 that the obtained mean scores of students under the multimedia
method of instruction in the topic The Living World in the pre-test was 9.85 and in the post-test
was 26.1 the achievement mean scores of post-test was significantly different at 0.05 level of
significance. The obtained ‘t’ value is 2.23 and the Table value was 2.02.
Therefore, the stated hypothesis that there is no significant difference between pre and
post-test mean scores of students under multimedia method of teaching in the topic The Living
World is rejected, and the finding shows that the effectiveness of the multimedia method of
instruction was effective in the topic The Living World. The students showed better performance in
their post-test score.
Hypothesis 23
There is no significant difference between pre and post-test mean scores of students under
conventional method of instruction in the topic The Study of Cells.
Method Test N df Mean S.D. t-value Significance
Conventional Method
Pre-test 40 39 9.85 2.50
1.77 P>0.05 Post-test 40 39 21.2 4.46
Table 5.25: Pre-test and Post-test Mean Scores Difference between Students under Conventional
Method of Instruction in the Topic The Study of Cells
It is inferred from Table-5.25 the obtained mean scores of students under the conventional method
of instruction in the topic The Study of Cells in pre-test was 9.85 and in the post-test was 21.2.
These two mean scores are not significantly different at 0.05 level of significance. The obtained ‘t’
value is 1.77 and the Table value was 2.02.
Therefore, the stated hypothesis that there is no significant difference between pre and
post-test mean scores of students under conventional method of teaching in the topic The Study of
Cells is accepted. It can be concluded that the said difference was not significant.
Hypothesis 24
There is no significant difference between pre and post-test mean scores of students under
multimedia method of instruction in the topic The Study of Cells.
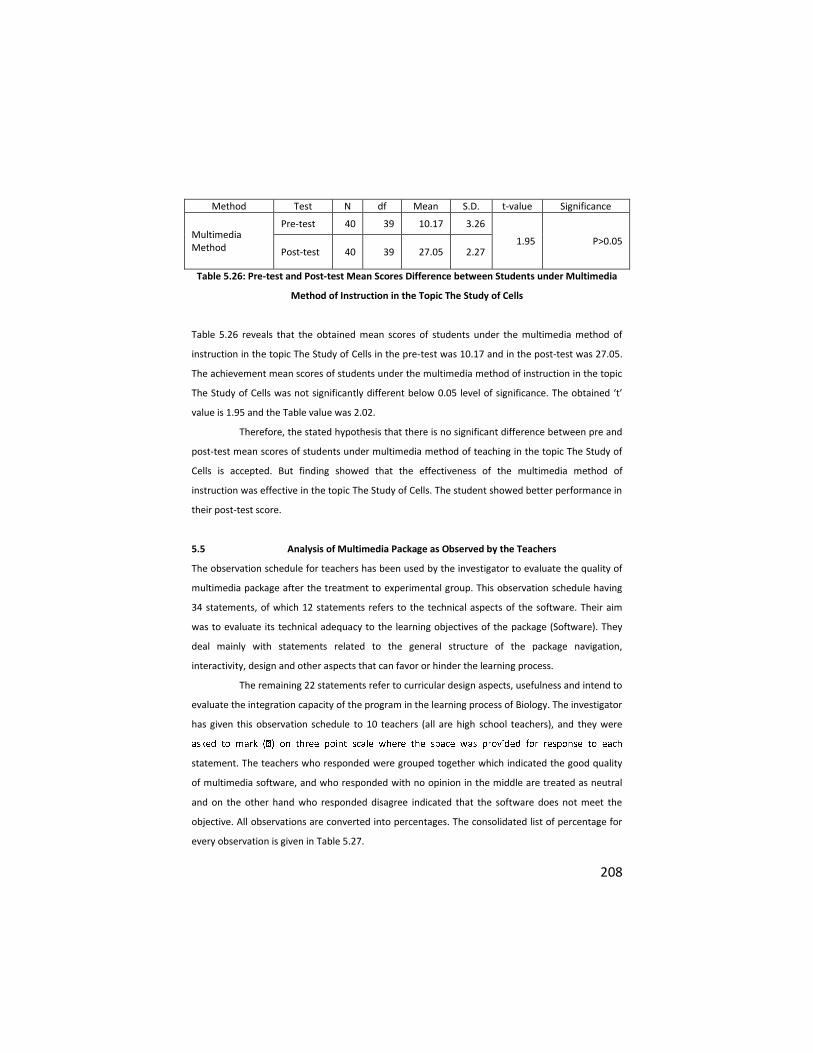
208
Method Test N df Mean S.D. t-value Significance
Multimedia Method
Pre-test 40 39 10.17 3.26
1.95 P>0.05 Post-test 40 39 27.05 2.27
Table 5.26: Pre-test and Post-test Mean Scores Difference between Students under Multimedia
Method of Instruction in the Topic The Study of Cells
Table 5.26 reveals that the obtained mean scores of students under the multimedia method of
instruction in the topic The Study of Cells in the pre-test was 10.17 and in the post-test was 27.05.
The achievement mean scores of students under the multimedia method of instruction in the topic
The Study of Cells was not significantly different below 0.05 level of significance. The obtained ‘t’
value is 1.95 and the Table value was 2.02.
Therefore, the stated hypothesis that there is no significant difference between pre and
post-test mean scores of students under multimedia method of teaching in the topic The Study of
Cells is accepted. But finding showed that the effectiveness of the multimedia method of
instruction was effective in the topic The Study of Cells. The student showed better performance in
their post-test score.
5.5 Analysis of Multimedia Package as Observed by the Teachers
The observation schedule for teachers has been used by the investigator to evaluate the quality of
multimedia package after the treatment to experimental group. This observation schedule having
34 statements, of which 12 statements refers to the technical aspects of the software. Their aim
was to evaluate its technical adequacy to the learning objectives of the package (Software). They
deal mainly with statements related to the general structure of the package navigation,
interactivity, design and other aspects that can favor or hinder the learning process.
The remaining 22 statements refer to curricular design aspects, usefulness and intend to
evaluate the integration capacity of the program in the learning process of Biology. The investigator
has given this observation schedule to 10 teachers (all are high school teachers), and they were
statement. The teachers who responded were grouped together which indicated the good quality
of multimedia software, and who responded with no opinion in the middle are treated as neutral
and on the other hand who responded disagree indicated that the software does not meet the
objective. All observations are converted into percentages. The consolidated list of percentage for
every observation is given in Table 5.27.
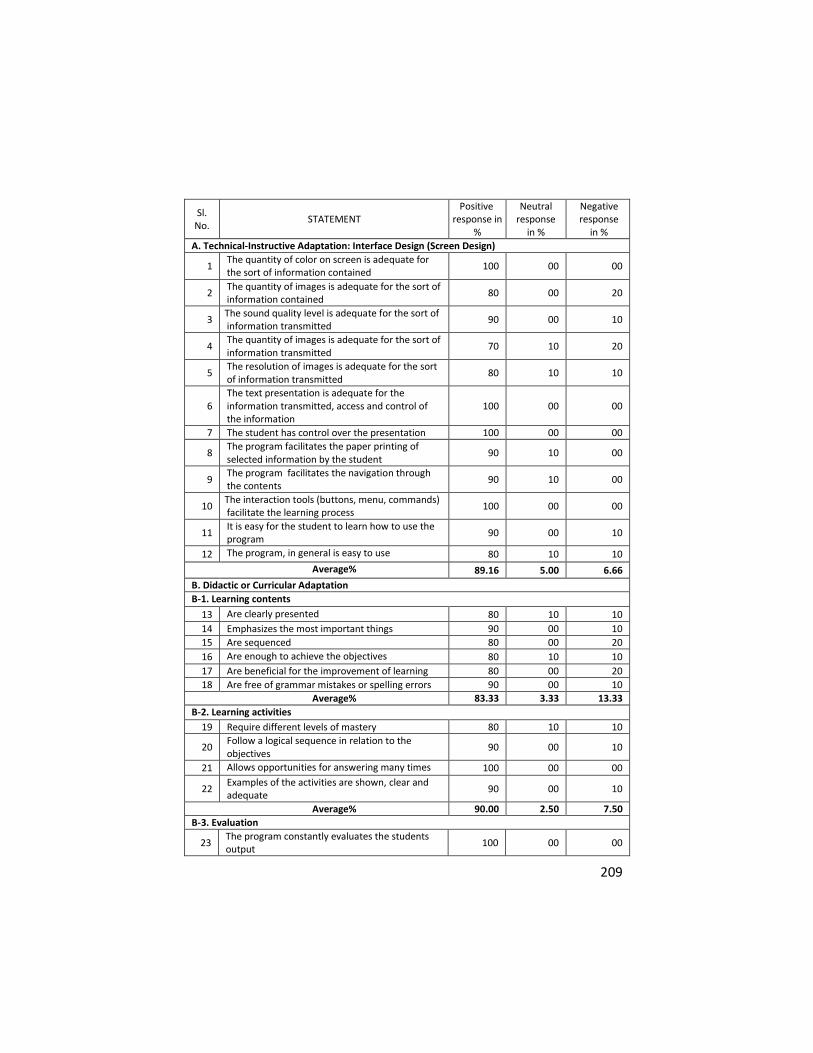
209
Sl. No.
STATEMENT Positive
response in %
Neutral response
in %
Negative response
in %
A. Technical-Instructive Adaptation: Interface Design (Screen Design)
1 The quantity of color on screen is adequate for the sort of information contained
100 00 00
2 The quantity of images is adequate for the sort of information contained
80 00 20
3 The sound quality level is adequate for the sort of
information transmitted 90 00 10
4 The quantity of images is adequate for the sort of information transmitted
70 10 20
5 The resolution of images is adequate for the sort of information transmitted
80 10 10
6 The text presentation is adequate for the information transmitted, access and control of the information
100 00 00
7 The student has control over the presentation 100 00 00
8 The program facilitates the paper printing of selected information by the student
90 10 00
9 The program facilitates the navigation through the contents
90 10 00
10 The interaction tools (buttons, menu, commands)
facilitate the learning process 100 00 00
11 It is easy for the student to learn how to use the program
90 00 10
12 The program, in general is easy to use 80 10 10
Average% 89.16 5.00 6.66
B. Didactic or Curricular Adaptation
B-1. Learning contents
13 Are clearly presented 80 10 10
14 Emphasizes the most important things 90 00 10
15 Are sequenced 80 00 20
16 Are enough to achieve the objectives 80 10 10
17 Are beneficial for the improvement of learning 80 00 20
18 Are free of grammar mistakes or spelling errors 90 00 10
Average% 83.33 3.33 13.33
B-2. Learning activities
19 Require different levels of mastery 80 10 10
20 Follow a logical sequence in relation to the objectives
90 00 10
21 Allows opportunities for answering many times 100 00 00
22 Examples of the activities are shown, clear and adequate
90 00 10
Average% 90.00 2.50 7.50
B-3. Evaluation
23 The program constantly evaluates the students output
100 00 00
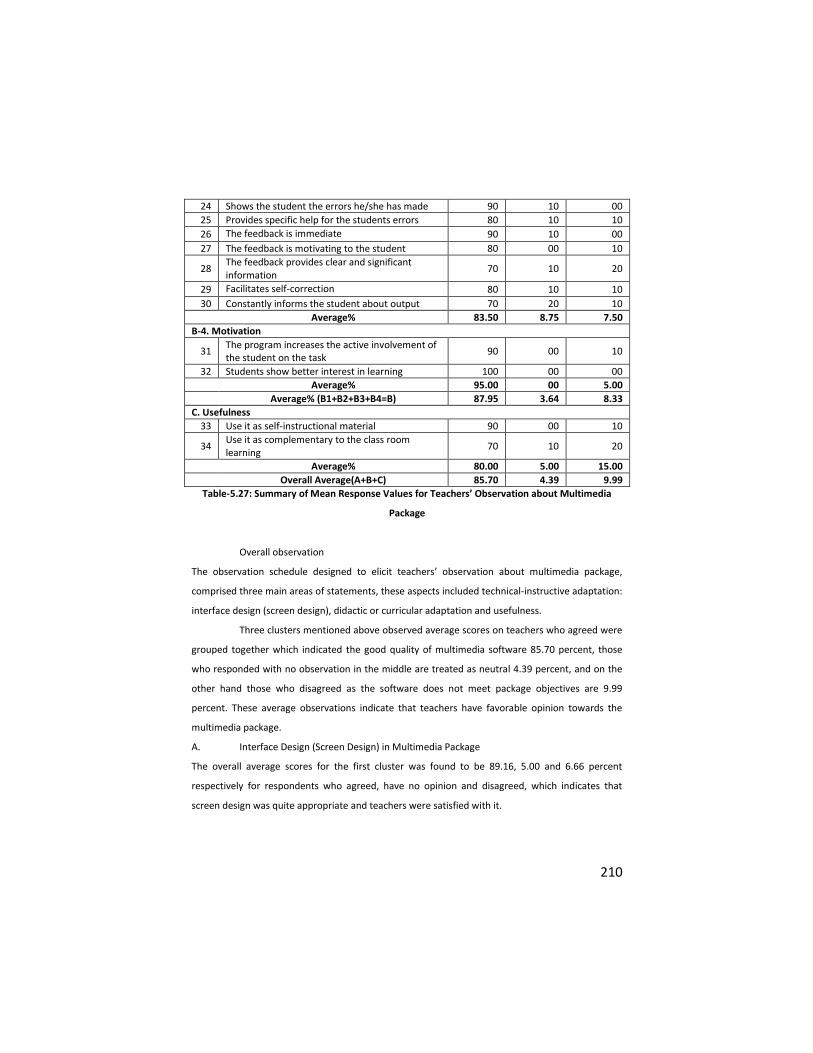
210
24 Shows the student the errors he/she has made 90 10 00
25 Provides specific help for the students errors 80 10 10
26 The feedback is immediate 90 10 00
27 The feedback is motivating to the student 80 00 10
28 The feedback provides clear and significant information
70 10 20
29 Facilitates self-correction 80 10 10
30 Constantly informs the student about output 70 20 10
Average% 83.50 8.75 7.50
B-4. Motivation
31 The program increases the active involvement of the student on the task
90 00 10
32 Students show better interest in learning 100 00 00
Average% 95.00 00 5.00
Average% (B1+B2+B3+B4=B) 87.95 3.64 8.33
C. Usefulness
33 Use it as self-instructional material 90 00 10
34 Use it as complementary to the class room learning
70 10 20
Average% 80.00 5.00 15.00
Overall Average(A+B+C) 85.70 4.39 9.99
Table-5.27: Summary of Mean Response Values for Teachers’ Observation about Multimedia
Package
Overall observation
The observation schedule designed to elicit teachers’ observation about multimedia package,
comprised three main areas of statements, these aspects included technical-instructive adaptation:
interface design (screen design), didactic or curricular adaptation and usefulness.
Three clusters mentioned above observed average scores on teachers who agreed were
grouped together which indicated the good quality of multimedia software 85.70 percent, those
who responded with no observation in the middle are treated as neutral 4.39 percent, and on the
other hand those who disagreed as the software does not meet package objectives are 9.99
percent. These average observations indicate that teachers have favorable opinion towards the
multimedia package.
A. Interface Design (Screen Design) in Multimedia Package
The overall average scores for the first cluster was found to be 89.16, 5.00 and 6.66 percent
respectively for respondents who agreed, have no opinion and disagreed, which indicates that
screen design was quite appropriate and teachers were satisfied with it.
211
B. Didactic or Curricular Adaptation
The overall average scores for the second cluster was found to be 87.95, 3.64 and 8.33 percent
respectively for respondents who agreed, have no opinion and disagreed, it reveals that the style of
curricular adoption was systematic as felt by the observers.
B1. Learning contents
The six statements gained the average response of 83.33, 3.33 and 13.33 percent respectively for
respondents who agreed, have no opinion and disagreed, which indicate that learning content was
clearly presented in the multimedia package.
B2. Learning activities
The four statements pertaining to learning activities gained the average scores 90.00, 2.50 and 7.50
percent respectively for teacher who agreed, have no opinion and who disagreed, which reflects
the learning activities are emphasized in multimedia package.
B3. Evaluation
This sub cluster having eight statements average scores are 83.50, 8.75 and 7.50 percent
respectively for teacher who agreed, have no opinion and disagreed, which depicts that
comprehensive evaluation takes place throughout the multimedia package.
B4. Motivation
Only two statements in this sub cluster the average score was 95.00, 00.00 and 5.00 percent
respectively for respondents who agreed, have no opinion and who disagreed, it shows that the
students have motivates to learn the content properly.
C. Usefulness
The average scores for the third cluster were found to be 80.00, 5.00 and 15.00 percent
respectively for respondents who agreed, have no opinion and who disagreed; it reveals that the
multimedia package was useful to high school students.
5.6 Opinion of Experimental Group Students about Multimedia Package
(Multimedia Method of Instruction)
On the day of administration of the post-test, an opinionnaire was administered to the
students of experimental group to elicit their opinion about multimedia package. The opinionnaire
comprised twenty statements inviting response on five point scales that is from strongly agreed to
strongly disagree.
Scoring was done by assigning values of one to five for strongly disagreed to strongly
agreed responses. Eight statements invited the respondents to opine about the content
presentation in multimedia package, four statements invited opinion about questioning in
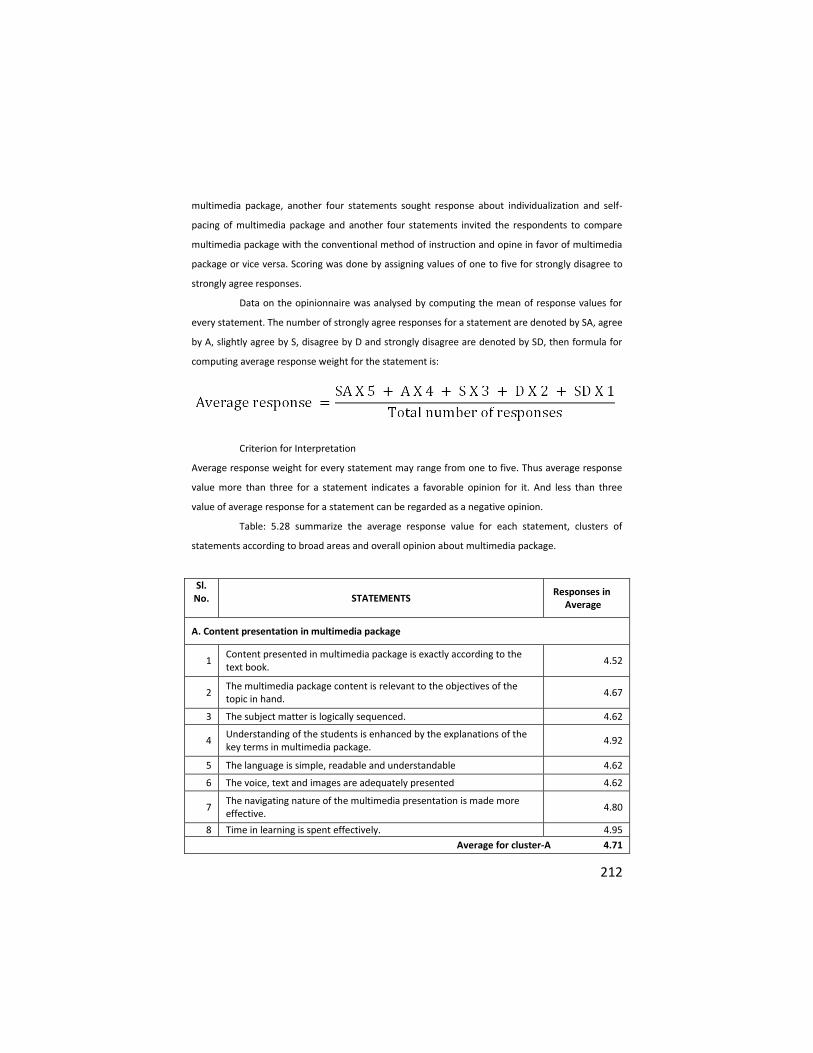
212
multimedia package, another four statements sought response about individualization and self-
pacing of multimedia package and another four statements invited the respondents to compare
multimedia package with the conventional method of instruction and opine in favor of multimedia
package or vice versa. Scoring was done by assigning values of one to five for strongly disagree to
strongly agree responses.
Data on the opinionnaire was analysed by computing the mean of response values for
every statement. The number of strongly agree responses for a statement are denoted by SA, agree
by A, slightly agree by S, disagree by D and strongly disagree are denoted by SD, then formula for
computing average response weight for the statement is:
Criterion for Interpretation
Average response weight for every statement may range from one to five. Thus average response
value more than three for a statement indicates a favorable opinion for it. And less than three
value of average response for a statement can be regarded as a negative opinion.
Table: 5.28 summarize the average response value for each statement, clusters of
statements according to broad areas and overall opinion about multimedia package.
Sl. No. STATEMENTS
Responses in Average
A. Content presentation in multimedia package
1 Content presented in multimedia package is exactly according to the text book.
4.52
2 The multimedia package content is relevant to the objectives of the topic in hand.
4.67
3 The subject matter is logically sequenced. 4.62
4 Understanding of the students is enhanced by the explanations of the key terms in multimedia package.
4.92
5 The language is simple, readable and understandable 4.62
6 The voice, text and images are adequately presented 4.62
7 The navigating nature of the multimedia presentation is made more effective.
4.80
8 Time in learning is spent effectively. 4.95
Average for cluster-A 4.71
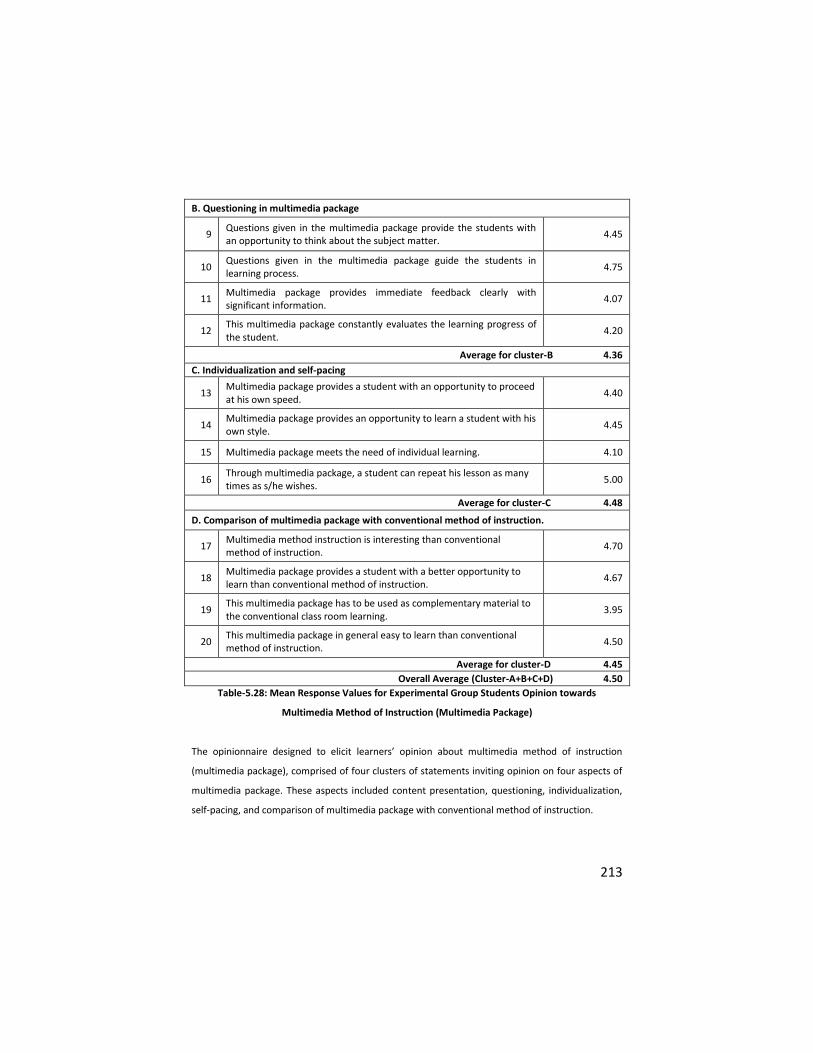
213
B. Questioning in multimedia package
9 Questions given in the multimedia package provide the students with an opportunity to think about the subject matter.
4.45
10 Questions given in the multimedia package guide the students in learning process.
4.75
11 Multimedia package provides immediate feedback clearly with significant information.
4.07
12 This multimedia package constantly evaluates the learning progress of the student.
4.20
Average for cluster-B 4.36
C. Individualization and self-pacing
13 Multimedia package provides a student with an opportunity to proceed at his own speed.
4.40
14 Multimedia package provides an opportunity to learn a student with his own style.
4.45
15 Multimedia package meets the need of individual learning. 4.10
16 Through multimedia package, a student can repeat his lesson as many times as s/he wishes.
5.00
Average for cluster-C 4.48
D. Comparison of multimedia package with conventional method of instruction.
17 Multimedia method instruction is interesting than conventional method of instruction.
4.70
18 Multimedia package provides a student with a better opportunity to learn than conventional method of instruction.
4.67
19 This multimedia package has to be used as complementary material to the conventional class room learning.
3.95
20 This multimedia package in general easy to learn than conventional method of instruction.
4.50
Average for cluster-D 4.45
Overall Average (Cluster-A+B+C+D) 4.50
Table-5.28: Mean Response Values for Experimental Group Students Opinion towards
Multimedia Method of Instruction (Multimedia Package)
The opinionnaire designed to elicit learners’ opinion about multimedia method of instruction
(multimedia package), comprised of four clusters of statements inviting opinion on four aspects of
multimedia package. These aspects included content presentation, questioning, individualization,
self-pacing, and comparison of multimedia package with conventional method of instruction.
214
Four clusters mentioned above received average score values of 4.71, 4.36, 4.48 and
4.45, respectively. These average scores indicated learner’s favorable opinion on all the four
aspects.
The overall average score computed on all the twenty statements in the opinionnaire
was found to be 4.50. Hence, it was concluded that students had a great deal of appreciation and
favorable opinion for multimedia package they experienced.
The Cluster-wise Interpretation of the Opinionnaire
A. Content Presentation in Multimedia Package
The overall average score for the first cluster was found to be 4.71, which indicated that content
and its presentation were quite appropriate the students were satisfied with it. The first part of the
opinionnaire comprising eight statements solicited the opinion of the respondents about the
content and presentation its presentation through multimedia package. The eight statements
gained the average response values of 4.52, 4.67 4.62, 492, 462 4.62, 4.80 and 4.95, which
indicated that respondents had a positive opinion about content presentation through multimedia
package in this software. First statement asking the students ‘where the content presented in
multimedia package is exactly in accordance with the text book’ gained the average response value
of 4.52; it reveals that the respondents found the content in accordance with the text book.
Respondents had a positive opinion with an average response value of 4.67 for statement No.2,
which state that multimedia package content is relevant to the objectives of the topic in hand. This
indicates that the content is in accordance with the objectives of the topic. ‘The subject matter is
logically sequenced’ is the statement that received an average response value of 4.62. Hence, it is
concluded that multimedia package content was logically arranged.
Respondents had a positive opinion with a maximum average response value of 4.92 for
the statement ‘Understanding of the students is enhanced by the explanations of the key terms in
multimedia package’ in the form of hyperlinks in glossary. The language in multimedia package is
simple readable and understandable and voice, text and images are adequately presented in the
multimedia package. These both statements received an average response value of 4.62. Hence, it
was concluded that language is simple and text, images are adequate and understandable by the
learner. The navigating nature of the multimedia presentation is made more effective where in the
statement received an average response value of 4.80. It shows that the multimedia package was
user friendly; students could easily operate and proceed through the multimedia presentation.
The last statement in the first cluster was ‘time in learning is spent effectively’ maximum
respondents agreed for this statement the gained mean value of 4.95. It reveals that all are actively
engaged in learning.

215
B. Questioning in Multimedia Package
Each segment of the text in multimedia package was incorporated with multiple choice items with
immediate feedback for students’ response. Students were asked to opine about these questions
on four statements. The overall average score for this second part of opinionnaire was found to be
4.36. The positive opinion about questions and the feedback incorporated in multimedia package
indicates that learners benefited from this aspect of multimedia presentation. The four statements
inviting students’ opinion about questioning in multimedia package gained average response values
of 4.45, 4.75, 4.07 and 4.20. These values indicated positive opinion about questioning technique
used in the package. Hence, it could be concluded that questions in multimedia package provided a
student with an opportunity to think. Questions in multimedia package guided the students in
learning process. Feedback to the response in the questions also guided the students in learning
process and finally the questions in multimedia package added to the understanding of the learners
and constantly evaluating the progress of the students throughout the package.
C. Individualization and self-pacing
Students were invited to opine about the individualization and self-pacing of the
multimedia package on four statements. The overall average score for this part of opinionnaire was
found to be 4.48, which indicated that students liked self-pacing and facility to repeat lessons
according to their needs. Average response value of 4.40, 4.45, 4.10 and 5.00, on these statements
reveals that majority of the students strongly agreed to these statements. Hence, it was concluded
that students were of the opinion that while learning through multimedia package one could
precede with ones own speed and pace. One could repeat the lesson as many times as one needed
to do so.
D. Comparison of Multimedia Package and Conventional Method of Instruction
In this cluster also four statements in the opinionnaire inviting the students to compare multimedia
package with conventional method of instruction. The overall average score of this cluster was
found to be 4.45, which led to the conclusion that students favored multimedia package. These
statements gained average response values of 4.70, 4.67, 3.95 and 4.50. Average response values
for these statements indicated that students rated multimedia package better than conventional
method of instruction. They regarded multimedia package more interesting, informative, and easy
to learn and operate. They liked multimedia package and opined that they more through this mode
of instruction.
216
Summary and conclusions
6.1 Introduction
The present study was conducted to develop and validate a multimedia package and to assess the
effectiveness of developed multimedia package instruction as compared with the conventional
method of instruction in the subject of science part-2 (Biology) for high school classes.
The purpose of the study were two fold, firstly the development of a multimedia
package (software) and secondly to validation of multimedia package (software). Comparison of
multimedia method instruction and conventional method of instruction is not only a comparison of
two modes of instruction but of two theoretical paradigms. Conventional method represents a
paradigm whereby knowledge is transmitted from teacher to student. Something is poured in
learners mind and the learner is a passive recipient of knowledge. Teacher plays an active part in
this mode of instruction.
Multimedia method of instruction represents a paradigm where knowledge is
constructed and sought by the learner. Learner plays an active role in learning process. Learning is
individualized, self-paced and hands on.
This study was completed in two phases; during the first phase, multimedia method
instruction software was developed by the investigator. The second phase of the study was
experimentation with multimedia method instruction software to determine its effectiveness in
terms of student learning or gain. Investigator also constructed three instruments to be used in the
study. These instruments included an observation schedule for teachers has been used to evaluate
the quality of multimedia package, achievement test was used as pre-test and post-test
performance measurement and opinionnaire was used to collect learners’ opinion towards
multimedia package, support for learning Biology.
6.2 Statement of the Study
The present study is an attempt to develop a multimedia package for the teaching of Biology to
high school students and its validation in academic achievements as well as finding out its
effectiveness in learning Biology. The investigator had to prepare multimedia packages on two
topics: The Living World and The Study of Cells, which gives emphasis on computer assisted
6
217
instruction. Hence, the study is entitled “Development and Validation of Multimedia Package in
Biology”.
6.3 Objectives of the Study
1. To develop and validate a multimedia package on the topics: The Living World and The
Study of Cells, in IX Standard Biology (science part-2) of the Karnataka State Board Text Book.
2. To find out the significant difference between post-test mean scores of students under
multimedia method of instruction and conventional method of instruction in Biology.
3. To find out the significant difference between post-test mean scores of boys under
multimedia of instruction and conventional method of instruction in Biology.
4. To find out the significant difference between post-test mean scores of girls under
multimedia of instruction and conventional method of instruction in Biology.
5. To find out the significant difference between post-test mean scores of boys and girls
students under conventional method of instruction and multimedia method of instruction in
Biology.
6. To find out the significant difference between pre-test and post-test mean scores of
students under conventional method of instruction and multimedia method of instruction in
Biology.
7. To find out the significant difference between pre-test and post-test mean scores of
boys students under conventional method of instruction and multimedia method of instruction in
Biology.
8. To find out the significant difference between pre-test and post-test mean scores of girls
students under conventional method of instruction and multimedia method of instruction in
Biology.
9. To find out the significant difference between pre-test and post-test mean scores of
boys and girls students under conventional method of instruction and multimedia method of
instruction in Biology.
10. To find out the significant difference between post-test mean scores of conventional
method of instruction of the boys and girls students on the topic of The Living World.
11. To find out the significant difference between post-test mean scores of multimedia
method of instruction of the boys and girls students on the topic The Living World.
12. To find out the significant difference between post-test mean scores of conventional
method of instruction of the boys and girls students on the topic of The Study of Cells.
218
13. To find out the significant difference between post-test mean scores of multimedia
method of instruction of the boys and girls students on the topic The of Study of Cells.
14. To find out the significant difference between pre-test and post-test mean scores of
conventional method of instruction of the boys students on the topic of The Living World.
15. To find out the significant difference between pre-test and post-test mean scores of
multimedia method of instruction of the boys students on the topic of The Living World.
16. To find out the significant difference between pre-test and post-test mean scores
conventional method of instruction of the girls’ students on the topic The of Living World.
17. To find out the significant difference between pre-test and post-test mean scores of
multimedia method of instruction of the girls students on the topic of The Living World.
18. To find out the significant difference between pre-test and post-test mean scores of
conventional method of instruction of the boys students on the topic of The Study of Cells.
19. To find out the significant difference between pre-test and post-test mean scores of
multimedia method of instruction of the boys students on the topic of The Study of Cells.
20. To find out the significant difference between pre-test and post-test mean scores
conventional method of instruction of the girls’ students on the topic of The Study of Cells.
21. To find out the significant difference between pre-test and post-test mean scores of
multimedia method of instruction of the girls students on the topic of The Study of Cells.
22. To find out the significant difference between pre-test and post-test mean scores of
students under conventional method of instruction on the topic of The Living World.
23. To find out the significant difference between pre-test and post-test mean scores of
students under multimedia method of instruction on the topic of The Living World.
24. To find out the significant difference between pre-test and post-test mean scores of
students under conventional method of instruction on the topic of The Study of Cells.
25. To find out the significant difference between pre-test and post-test mean scores of
students under multimedia method of instruction on the topic of The Study of Cells.
26. To know students’ opinions towards multimedia method of instruction (multimedia
package software).
27. To know teachers’ observation towards multimedia package.
6.4 Hypotheses
1. There is no significant difference between post-test mean scores of students under
multimedia method of instruction and conventional method of teaching in Biology.
219
2. There is no significant difference between post-test mean scores boy students under
multimedia method of instruction and conventional method of instruction in Biology.
3. There is no significant difference between post-test mean scores of girl students under
multimedia method of instruction and conventional method of instruction in Biology.
4. There is no significant difference between post-test mean scores of boy and girl
students under multimedia method of instruction and conventional method of instruction in
Biology.
5. There is no significant difference between pre-test and post-test mean scores of
students under conventional method of instruction and multimedia method of instruction in
Biology.
6. There is no significant difference between pre-test and post-test mean scores of boy
students under conventional method of instruction and multimedia method of instruction in
Biology.
7. There is no significant difference between pre-test and post-test mean scores of girl
students under conventional method of instruction and multimedia method of instruction in
Biology.
8. There is no significant difference between pre-test and post-test mean scores of boy
and girl students under conventional method of instruction and multimedia method of instruction
in Biology.
9. There is no significant difference between post-test mean scores of boy and girl
students under conventional method of instruction in the topic The Living World.
10. There is no significant difference between post-test mean scores of boy and girl
students under multimedia method of instruction in the topic The Living World.
11. There is no significant difference between post-test mean scores of boy and girl
students under conventional method of instruction in the topic The Study of Cells.
12. There is no significant difference between post-test mean scores of boy and girl
students under multimedia method of instruction in the topic The Study of Cells.
13. There is no significant difference between pre and post-test mean scores of boy
students under conventional method of instruction in the topic The Living World.
14. There is no significant difference between pre and post-test mean scores of boy
students under multimedia method of instruction in the topic The Living World.
15. There is no significant difference between pre and post-test mean scores of girl students
under conventional method of instruction in the topic The Living World.
220
16. There is no significant difference between pre and post-test mean scores of girl students
under multimedia method of instruction in the topic The Living World.
17. There is no significant difference between pre and post-test mean scores of boy
students under conventional method of instruction in the topic The Study of Cells.
18. There is no significant difference between pre and post-test mean scores of boy
students under multimedia method of instruction in the topic The Study of Cells.
19. There is no significant difference between pre and post-test mean scores of girl students
under conventional method of instruction in the topic The Study of Cells.
20. There is no significant difference between pre and post-test mean scores of girl students
under multimedia method of instruction in the topic The Study of Cells.
21. There is no significant difference between pre and post-test mean scores of students
under conventional method of instruction in the topic The Living World.
22. There is no significant difference between pre and post-test mean scores of students
under multimedia method of instruction in the topic The Living World.
23. There is no significant difference between pre and post-test mean scores of students
under conventional method of instruction in the topic The Study of Cells.
24. There is no significant difference between pre and post-test mean scores of students
under multimedia method of instruction in the topic The Study of Cells.
6.5 Design of the Study
The design found to be most useful for the purpose of this study was the pre-test, post-
test experimental, and control groups design. These groups were obtained through paired
matching on the basis of intellectual capacity of the students. Raven’s Progressive Matrices were
used to measure the intellectual capacity of the students. Forty pairs matched on intellectual
capacity were selected and assigned randomly to the experimental and control groups.
6.5.1 Sample of the Study
Sample of the study was 80 students (40 boys and 40 girls) out of total 117 students in
the age group 13.5 to 14.5 who are studying in IX standard, in PDJ high school Bijapur city,
Karnataka. Sample of the study was selected on the basis of intellectual capacity measured on
Raven’s Standard Progressive Matrices (Raven’s SPM), the instrument to measure intellectual
capacity. Raven’s SPM was administered to all 117 students in the IX standard, those all are present
on the day of administration of the instrument.
221
Forty pairs of equal intellectual capacity were to be taken as a sample of the study. It
could be done in three ways that is proportionately, randomly and selectively. Scores on SPM
revealed that six percent students were intellectually superior, eight percent students were above
the average in intellectual capacity, thirty two students were intellectually average and fifty one
percent students were found to be below average in intellectual capacity. In case of proportionate
selection twenty eight pairs out of forty would have been selected from below average intellectual
capacity students, eight from average and two pair from above average students, and only two
pairs from students were intellectually superior. Similarly, random selection also might have
increased the number of below average students.
Excessive number of similar category that is below average intellectual capacity
students could cause decreased variability in achievement scores. Therefore, keeping in view the
composition of the group, all possible pairs form superior, above average and average students
were selected to maximize their representation. In spite of that, selected forty pairs included forty
five percent superior, above average and average students and fifty five percent below average
students.
6.5.2 Development of Multimedia Package (Software)
As no multimedia package (software), covering the topics of high school level Biology
was available, multimedia package (software) to be used in the experiment was developed by the
researcher. It was decided to develop the multimedia package (software) in English medium IX
standard Biology of Karnataka state board syllabus.
The investigator:
a. Identified a list of instructional objectives for the content of the units ‘The Living World’
and ‘The Study of Cells’.
b. Prepared the multimedia (text, animated pictures and back-voice) scripts, based on the
instructional objectives. The script for the multimedia instruction was produced in two stages.
The draft script and the final script
The draft script was scrutinizes and the final script was produces by incorporating the
changes perceived as necessary in the draft script.
c. Developed the multimedia package with the assistance of expertise in the field of
computer multimedia animation.
Medium of Presentation
Medium is defined as a means of physical formats and media relationship with time, and
different criteria like perception, distribution and presentation of information, representation, and
222
storage. There are two classes of media: static and dynamic (or time continuous). Static media do
not have a time dimension , and their contents and meanings do not depend on the
presentation time. dynamic media have a time dimension, and their meanings and correctness
depend on the rate at which they are presented. Dynamic media include animation, audio, and
video. These media have their intrinsic unit interval or rate. For example, to have a perceptually
smooth movement, video must be played back at 25 frames per second, sometimes 30 frames per
second. Similarly, where the playback a recorded voice message and music, playback at a slower or
faster rate distorts the meaning or the quality of the sound. Because these media must be played
back continuously at a fixed rate, they are often called continuous media.
The final multimedia presentation package (text, animated-picture with voice-over the
topic for better understanding and retention of the content) had objectives of the topic, a
beginning (introduction), a middle (presentation of the content), end (summary of the content),
and at last assessment (multiple choice items). The objectives of the topic related to learning of the
content. The beginning was attractive and attention catching and interesting to the learners. The
middle part of the presentation was instructional in nature. Thus, a rich variety of stimuli were
presented to the learners in the form of icons such as home, menu, print, search, glossary, notes,
exit, back-next, pause, reply and sound off/on. The material was presented in an academic style
rather than an entertaining one. There was a wealth of audio-visual interactive material occurring
on the screen, along with voice/commentary over the presentation. When the presentation moved
from page to page, the learners were given linking information about the thread of continuity
underlying the progressive sequence of the pages.
6.5.3 Materials and Tools Used for Experiment and Data Collection
Instruments were developed to measure the dependent variables and to record perception,
personal, and situational data.
Data was collected by using:
• Raven’s Standard Progressive Matrices (Raven’s-SPM) were used to measure the
intellectual capacity of the students for paired matching.
• Achievement test has used as pre-test and post-test.
• Multimedia package used to teach the experimental group.
• Observation schedule for teachers has used to evaluate the quality of multimedia
package.
• Opinionnaire to collect learners’ opinion towards multimedia package.
223
6.5.4 Variables involved in the Study
Controlled variables: Age of the students, Intelligence and Treatment (Conventional Method of
Instruction and Multimedia Method of Instruction)
Dependent variable: Achievement means scores
Independent variables: Sex of the students
6.5.5 Experiment Conducted
To compare multimedia method of instruction with conventional method of instruction on
students achievement in Biology, an experiment was conducted at BDE Society’s PDJ high school ‘A’
Raven’s Standard Progressive Matrices (Raven’s-SPM) was administered to 117 students of IX
standard students who were present on the day of test administration. Two matched groups of 40
(20 boys + 20 girls) students each were taken to conduct the experiment.
Experimental group students received treatment in the form of multimedia method of
instruction in the computer laboratory of the school while the control group students received
instruction as usual from the investigators everyday second period of school time, this
arrangement was made by the Head mistress of the school, on investigator request. Investigator
himself supervised the students of experimental group while receiving multimedia method of
instruction in the laboratory everyday evening. Investigator remained present in the computer
laboratory all the time during treatment sessions.
6.5.6 Data Collection
The experimental group students received treatment in the form of multimedia method of
instruction in the computer laboratory of the school while the control group students received
instruction as usual from the investigator everyday second period of school time. Investigator
himself supervised the students of experimental group while receiving multimedia method of
instruction in the laboratory everyday evening. Investigator remained present in the computer
laboratory all the time during treatment sessions.
The pre-test was administered to both the group just before the beginning of treatment.
Both groups were equated on the basis of Raven’s SPM test scores. After the completion of
treatment (teaching), the post-test was administered immediately.
Data were collected from 80 students, 40-(20 boys + 20 girls) from each group. The
purpose of this test was to measure the achievement of students constituting the sample of the
study.
224
Opinionnaire was administered to the students of the experimental group after
immediate completion of the treatment (multimedia method instruction), to collect their opinion
towards the multimedia method of instruction, this data were collected from 40 students of
experimental group (20 boys + 20 girls).
The structured observation schedule for teachers has used by the investigator to
evaluate the quality of multimedia package. Observation schedule was given to 10 teachers and
learning objectives of the multimedia package.
6.5.7 Analyses of Data
Data were analyzed through Microsoft excel program. To compare the achievement test
scores of the experimental group with the control group students on achievement test paired ‘t’
test was employed. Comparison was done on the basis of total achievement score and sub totals of
achievement with respect to two topics: The Living World and The Study of Cells and boys and girls
students’ achievement scores. Significance of difference between the expected scores and
observed mean achievement scores was determined by applying paired ‘t’ test.
Data were collected on structured observation schedule to evaluate the quality of
multimedia package by the teachers. Its purpose was to evaluate its technical adequacy to the
learning objectives of the program. The teacher observations on three point scale it was analyzed
by percentage technique.
Data collected on opinionnaire to elicit student opinion towards multimedia package
were analyzed by computing statement-wise response and over all mean response.
6.6 Findings of the Study
The findings of the study are the following:
1. The post-test mean scores of students on multimedia method of instruction were high
as compared with the conventional method of instruction. It was concluded that students who
received multimedia method of instruction showed significantly better achievement than the
students who received instructions in conventional manner. This finding depicts the effectiveness
of the multimedia method of instruction as compared with the conventional method of instruction
in Biology.
2. The post-test mean scores of boys under multimedia method of instruction are
significantly different from conventional method of instruction. Therefore, there is significant
difference between post-test mean scores of boy students under multimedia method of instruction
225
and conventional method of instruction in Biology. It can be concluded that the said significant
difference was due to the treatment in the form of multimedia method of instruction received by
the experimental group boys than the conventional group.
3. The post-test mean scores of the two paired groups are significantly different. It means
that the girl students of the experimental group who received multimedia method of instruction
performed better achievement in Biology than the girl students who received conventional method
of instruction in Biology.
4. The mean value in the post-test of multimedia method of instruction for boys were high
and girls were very high and in conventional method of instruction for boys were high and girls
were very high in both the method of instruction girls shows better achievement than the boy
students.
5. The mean score of multimedia method of instruction in post-test was very high, and in
the conventional method of instruction in post-test was high. But in multimedia method of
instruction, post-test performance was effectively better than the post-test performance of
conventional method of instruction. The finding depicts the effectiveness of the multimedia
method of instruction is more in Biology learning.
6. The mean score in the pretest of multimedia method of instruction for boys were very
low and in the post-test of multimedia method of instruction for boys was very high and in
conventional method of instruction for boys in pretest were very low and in the post-test of
conventional method of instruction for boys was very high in both the method of instruction boys
shows better achievement in the post-test, and it is compared with the conventional method of
instruction the multimedia method of instruction is more effective.
7. The mean score in the pretest of multimedia method of instruction for girls were very
low and in the post-test of multimedia method of instruction for girls were very high and in
conventional method of instruction for girls in pretest were low and in the post-test of
conventional method of instruction for girls was high in both the method of instruction girls
showed better achievement in the post-test, and it was concluded that girl students who received
multimedia method of instruction shows significantly better achievement than the students who
received instructions in conventional method.
8. The mean score in the pretest of multimedia method of instruction for boys and girls
were low and in the post-test of multimedia method of instruction for boys and girls was high and
in conventional method of instruction for boys and girls in the pretest were low and in the post-test
of conventional method of instruction for boys and girls showed better performance, and in both
the method of instruction girls shows better achievement in the post-test, and it is compared with
226
the conventional method of instruction the multimedia method of instruction is more effective for
both boys and girls, but it is more effective for girls students who received multimedia method of
instruction showed significantly better achievement than the students who received in
conventional manner.
9. The post-test mean scores of the boys in conventional method of instruction was high as
compared to the girls, so difference between the two means was not statistically significant.
10. The post-test mean scores of the boys under multimedia method of instruction was high
as compared to the girls, therefore, difference between the two means was not statistically
significant.
11. The mean scores for the boy students in the conventional method of instruction were
low as compared to the girls. These two scores are not significantly different.
12. The calculated mean score for the boy students in the multimedia method of instruction
were low as compared to the girls. It shows that the girl students performance is better than the
boy students under multimedia method of instruction in the topic The Study of Cells The above two
mean scores are not significantly different.
13. The mean score for boy students under the conventional method of instruction in pre-
test was very low as compared to the post-test mean score; these two mean scores are not
significantly different.
14. The mean scores for boy students under the multimedia method of instruction in the
topic The Living World in pre-test was low as compared to the post-test scores, these two mean
scores are significantly different. This finding reveals that the effectiveness of the multimedia
method of instruction in the topic The Living World is good.
15. The mean scores for girl students under the conventional method of instruction in pre-
test was low as compared to the post-test scores, these two mean scores are not significantly
different.
16. The mean scores for girl students under the multimedia method of instruction in the
topic The Living World in pre-test was low as compared to the post-test scores, these two mean
scores are not significantly different. This finding shows that the effectiveness of the multimedia
method of instruction in the topic The Living World is good.
17. The obtained mean scores for boy students under the conventional method of
instruction in pre was low as compared to the post-test scores, these two mean scores are
significantly different.
18. The mean scores for boy students under the multimedia method of instruction in the
topic The Study of Cells in pre-test was low as compared to the post-test scores, these two mean
227
scores are significantly different. This finding reveals that the effectiveness of the multimedia
method of instruction in the topic The Study of Cells is good.
19. The obtained mean scores for girl students under the conventional method of
instruction in the topic The Study of Cells in was low as compared to the post-test scores, these two
mean scores are significantly different.
20. The obtained mean scores for girl students under the multimedia method of instruction
in the topic The Study of Cells in pre-test was low as compared to the post-test scores, these two
mean scores are not significantly. This finding shows that the effectiveness of the multimedia
method of instruction in the topic The Study of Cells is good.
21. The mean scores of students under the conventional method of instruction in the topic
The Living World in the pre-test was low as compared to the post-test scores, these two mean
scores are significantly different.
22. The obtained mean scores of students under the multimedia method of instruction in
the topic The Living World in the pre-test was low as compared to the post-test scores, the
achievement mean scores of post-test is significant. The finding showed that the effectiveness of
the multimedia method of instruction was effective in the topic The Living World. The students
showed that better performance in their post-test score.
23. The mean scores of students under the conventional method of instruction in the topic
The Study of Cells in pre-test was low as compared to the post-test scores, these two mean scores
are not significant. It can be concluded that the said difference was not significant.
24. The obtained mean scores of students under the multimedia method of instruction in
the topic The Study of Cells in the pre-test was low as compared to the post-test scores, The
achievement mean scores of students under the multimedia method of instruction in the topic The
Study of Cells was not significantly different. But finding shows that the effectiveness of the
multimedia method of instruction was effective in the topic The Study of Cells The students showed
that better performance in their post-test score.
6.7 Analysis of Multimedia Package Observed by the Teachers
Overall observation
The observation schedule designed to elicit teachers’ observation about multimedia
package, comprised three main areas of statements, these aspects included technical-instructive
adaptation: interface design (screen design), didactic or curricular adaptation and usefulness.
The overall average scores for the first cluster show that screen design was quite
appropriate and teachers were fully satisfied with it.
228
The overall average scores for the second cluster revealed the style of curricular
adoption in multimedia software was systematic as felt by the observers.
Learning contents
The overall average scores for this cluster were also high, which indicates that learning
content was clearly presented in the multimedia package.
Learning activities
The four statements pertaining to learning activities gained the good opinion, which reflects the
learning activities are emphasized in multimedia package.
Evaluation
This sub cluster having eight statements average scores depicts that comprehensive evaluation
takes place throughout the multimedia package.
Motivation
Two statements in this sub cluster the average score shows that the students are motivated to
learn the content properly.
Usefulness
The average scores for the third cluster revealed that the multimedia package was useful for high
school students for their individual learning and at their own pace.
6.8 Experimental Group Students’ Opinion about Multimedia Package
Students in the experimental group responded on an opinionnaire to rate the multimedia method
of instruction software. The findings of the students’ opinions are summarized as under:
• The multimedia method of instruction package imparts instruction according to the
material given in the text book.
• The multimedia package content presented here is relevant to the objectives of the
secondary school Biology.
• The subject matter was logically sequenced and language simple readable and
understandable.
• Voice, text and images are adequately presented in the multimedia package.
• The navigating nature of the multimedia presentation was more effective and it is user
friendly package. Students can easily operate and proceed through it.
• It is an instructional package enriched with thought provoking multiple choice items
along with feedback to guide and foster learning.
• This multimedia package constantly evaluates the learning progress of the student.
• This package provides the student with a facility to proceed at with ones own pace.
229
• This package brings clarity to the concepts of the students.
• Students like this package than conventional method and learn more through this
package than the other method of instruction.
• Students opined that the multimedia package is an individualized instructional package
as it provides the students with multiple choice paths to proceed on according to their own ability
and choice.
• Study through multimedia package is more interesting than the conventional method of
instruction.
• This multimedia package has to be used as complementary material to the conventional
class room learning.
6.9 Discussion and Conclusion
The basic purpose of the present study was to development and validation of multimedia package
that is twofold purposes, firstly the development of a multimedia package (software) and secondly
validation of the multimedia package by comparison of multimedia method instruction and
conventional method of instruction. It is not only a comparison of two modes of instruction but of
two theoretical paradigms. Conventional method represents a paradigm whereby knowledge is
transmitted from teacher to student. Something is poured in learners mind and the learner is a
passive recipient of knowledge. Teacher plays an active part in this mode of instruction. Multimedia
method of instruction represents a paradigm where knowledge is constructed and sought by the
learner. Learner plays an active role in learning process. Learning is individualized, self-paced and
hands on.
These two groups, experimental and control group matched by intellectual capacity
were randomly assigned to the experimental group and control group to receive multimedia
package instruction and conventional instruction, respectively. Students’ learning was measured in
terms of scores on pre and post achievement test. Findings of the experiment revealed that
students of the multimedia method of instruction group outperformed the matched students of
the conventional method of instruction group. Students who encountered multimedia package
(software) learned more than those who encountered conventional method of instruction.
Results of the present study demonstrated that multimedia method of instruction was
an effective for knowledge, understanding, application and skill domains of learning as well as for
learning in all content areas of Biology. Mean achievement scores of the students in their post-test
in both the topics are equal in experimental group, but in conventional it is different.
230
The results of the present study was in consonance with the results of many of the
experimental studies demonstrating preparation and validation of computer software and
effectiveness of effectiveness of computer assisted instruction for better student achievement in
Biology.
Thus, to ascertain the effectiveness of multimedia it would be reasonable to compare it
with classroom instruction. A number of studies (Najjar, 1996) have been conducted in the area to
ascertain the effectiveness of multimedia instruction. Analysis has been done by Bosco, 1986;
Fletcher, 1989, 1990; Khalili and Shashaani, 1994; Kulik, et al. 1983; Kulik, Kulik, and Bangert-
Drowns, 1985; Kulik, et al. 1980; Kulik, et al. 1986; Schmidt, et al. 1985 by examining 200 over
studies. The information included general science and bio-sciences. The control group normally
learnt the information via classroom or lecture combined with hands-on experiments. The
comparison group learnt information via interactive video discs or computer based instruction. The
achievement of learning was measured via tests taken at the end of the lessons. Over this wide
range of students, meta-analysis found that learning was higher when computer-based education
was used. Learning also appeared to take less time when multimedia instruction was used.
Computer multimedia are highly promising educational tools but it is the way computers
are used rather than the actual machines themselves that contribute to learning. Investigator is of
the opinion that effectiveness of multimedia package instruction for improved student learning as
demonstrated by the present study may be attributed to the multimedia software used in the
experiment and the way it was used.
The multimedia package software used in the study was developed by the investigator
as no software was available to serve the purpose effectively. Educational multimedia package
software development is not the task of an individual. It requires a team effort and host of
resources. In spite of these limitations software used in the experiment proved effective for
student learning as compared to conventional classroom instruction. The salient features of the
multimedia package software that might have caused better student learning are discussed in the
preceding part.
a. Mode of Presentation
Tutorial mode of presentation was employed in the multimedia package as it was to be used to
deliver the entire instructional sequence similar to the teachers’ classroom instruction on the
topics. To enrich learning the unfamiliar terms and concepts were explained through in glossary by
hyperlinks. Multiple choice questions along with their feedback followed each text segment so that
students may keep track of their own learning. These questions also provided the students with a
facility of drill and practice.
231
b. Underlying Learning Theory
Some theorists like Melinda (1991) and Bereuter (1990) believe that approaches from various
learning theories can be combined in a particular instructional program for the purpose to enhance
and improve student learning. Tutorial programs are generally classified into two categories that is
linear based on behaviorist approach and branching based on cognitive approach (Allies and Trollip,
1991). A simple linear tutorial gives the same instructional sequence of explanation, practice and
feedback to all the learners regardless their individual differences. A branching tutorial directs
learning along alternative paths depending on learners’ performance and ability. Although the
tutorial software mainly adopts cognitive approach to learning but behaviorist and constructivist
approaches can also be incorporated in it. The software used in the present study employs
cognitive approach to learning.
A large number of multiple choice items not only provoke thought processes of the
student but also provide them with a facility to drill and practice. Drill and practice facility employs
behaviorist approach in the package. Incorporation of hyperlinks made the software interactive
that is an exclusive characteristic of constructivist approach.
c. Multiple choice items
A distinguishing characteristic of the software is multiple choice items incorporated in it. A
conscious effort was made to make the items explore knowledge, understanding, application and
skill of the learners. Students utilizing the multimedia package encounter these items; this
experience certainly provokes their thought process and hence improves the quality of their
learning.
Like any other tool multimedia package can be used beautifully, efficiently and
effectively. Worth of any tool depends upon its utilization. Worth of multimedia package to
enhance student learning is not unprecedented but it depends upon the way it is used to support
and enhance learning. Fortunately, the potential of multimedia package in teaching-learning
process is underutilized in India; moreover, there is consistency in education policies. National
Curriculum Framework 2005 has emphasized the use of computers and ICT to improve the quality
of instruction and aimed at providing the schools with necessary facilities to use computers for
instructional purposes.
The National Policy on Education 1986, as modified in 1992, stressed upon employing
educational technology to improve the quality of education. The policy statement led to two major
centrally sponsored schemes, namely, Educational Technology (ET) and Computer Literacy and
Studies in Schools (CLASS) paving the way for a more comprehensive centrally sponsored scheme –
Information and Communication Technology @ Schools in 2004.
232
Educational technology also found a significant place in another scheme on up-
gradation of science education. The significant role of ICT in school education been highlighted in
the National Curriculum Framework (NCF, 2005). Use of ICT for quality improvement also figures in
Government of India's flagship programme on education, Sarva Shiksha Abhiyan (SSA). Again, ICT
figured comprehensively in the norm of schooling recommended by Central Advisory Board of
Education (CABE), in its report on Universal Secondary Education, in 2005.
With the convergence of technologies, it has become imperative to take a
comprehensive look at all possible information and communication technologies for improving
school education in the country. The comprehensive choice of ICT for holistic development of
education can be built only on a sound policy. The initiative of ICT Policy in School Education is
inspired by the tremendous potential of ICT for enhancing outreach and improving quality of
education. This policy endeavors to provide guidelines to assist the States in optimizing the use of
ICT in school education within a national policy framework.
The National Task Force on Information Technology and Software Development (IT Task
Force, 1998), made specific recommendations on introduction of IT in the education sector
including schools for making computers accessible through the Vidyarthi Computer Scheme,
Shikshak Computer Scheme and School Computer Schemes. Smart Schools were recommended on
a pilot basis in each State for demonstration purposes. It was also stipulated that 1 to three percent
of the total budget was to be spent on provision of computers to all educational Institutions upto
Secondary and Higher Secondary level during the next five years. Based on the experience gained
so far, a need for a revision of the scheme of ICT @ Schools was felt on the following grounds.
• Expansion with emphasis on quality and equity: A need was felt to expand the outreach
of the scheme to cover all Government and Government aided secondary and higher secondary
schools in the country with emphasis on educationally backward blocks and areas with
concentration of SC, ST, minority and weaker sections. Along with that, there is a need for ensuring
dependable power supply where the electricity supply is erratic and internet connectivity, including
broadband connection.
• Demonstration effect: There is a need to set up smart schools at the district level to
serve as demonstration models for neighboring schools.
• Teacher engagement and better in-service and pre-service training: Since ICT education
will be imparted to all secondary and higher secondary students, an exclusive ICT teacher is
required for each school. Similarly, there is a need for pre service as well as in service training of all
teachers in effective use of ICT in teaching and learning process.
233
• Development of e-content: There is also a need to develop and use appropriate e-
content to enhance the comprehension levels of children in various subjects.
• A strong mechanism for monitoring and management needs to be set in place at all
levels for ensuring optimal delivery of set targets.
• The Scheme envisages that the School Management Committee, Parents Teachers
Association and local bodies would be involved in the program management along with the setting
up of an online web-based portal for real-time monitoring and transparency. In addition,
independent monitoring and evaluation is envisaged.
Indian experiments in taking computers to schools involved the participation of a large
number of institutions for tasks such as the supply of hardware and software, the development of
Computer Assisted Learning (CAL) packages, and the training of teachers. A project called
Computer Literacy and Studies (CLASS) launched in 1984 was a joint initiative of MHRD,
Department of Electronics, and NCERT. It covered 42 Resource Centres and 2,582 schools. It made
use of microcomputers provided by the BBC. The evaluation of the project by SAC revealed the
need for greater interaction between resource centers and project schools, the need to reduce the
time gap between the training of teachers, the installation of systems, and the initiation of
activities in schools, the imparting of adequate hands-on experience to teachers and students, and
the provision of computer literacy programs in the timetable. The project had only a limited
success, and has been described at best as a “spectator sport”.
A revised CLASS project during 1993–2004 saw the introduction of PC machines in
keeping with broad global trends. Subsequently, the government initiated the CLASS 2000 program
with the aim of providing computer literacy in 10,000 schools, computer-assisted learning in 1,000
schools, and computer-based learning in 100 schools. These 100 schools were called smart schools,
and were designed to be agents of change seeking to promote the extensive use of computers in
the teaching-learning process. This, too, has not yielded the expected results. In the words of
(Mallik, 1993), “Ambiguity of purpose, tentative policies and faltering practices marked the major
computing initiatives in India during the last two decades… Schools are using IT as an add-on, not as
an integral part of a new pedagogy.”
Though all these interventions did make some impact, where the schools and teachers
went the extra mile to avail of the facilities provided using their own ingenuity, many of these
schemes have been half-hearted attempts even at the conceptual level. Computer literacy is not so
much about knowing the technical jargon, but rather learning to use computers in a meaningful
way, that is, meaningful to children.
234
Biology occupies a unique position in the school curriculum. Biology is central to many
science related courses such as medicine, pharmacy, agriculture, nursing, biochemistry and
genetics so on. It is obvious that no student intending to study these disciplines can do without
Biology. These factors, among others, have drawn attention of researchers and curriculum planners
towards Biology as a subject in the school curriculum (Kareem, 2003). In spite of the importance
and popularity of Biology among students, performance at senior secondary school level had been
poor (Ahmed, 2008). The desire to know the causes of the poor performance in Biology has been
the focus of researchers for some time now. It has been observed that poor performance in the
sciences is caused by the poor quality of teaching strategies and science teachers, overcrowded
classrooms, and lack of suitable and adequate science equipment, among others (Abdullahi, 1982;
Bajah, 1979; Kareem, 2003; Ogunniyi, 1979). Students perform poorly in Biology because the
Biology classes are usually too large and heterogeneous in terms of ability level. In addition, the
laboratories are ill-equipped and the Biology syllabus is over loaded (Ahmed, 2008; Ajayi, 1998).
As multimedia teaching technologies become more widely advocated and employed in
education, researchers strive to understand the influence of such technologies on student learning.
Advances in technology enable pedagogical enhancements that some believe can revolutionize
traditional methods of teaching and learning. Advanced technologies, especially multimedia
instruction, which often involves introducing or enhancing the visual aspects of the presentation of
course contents, created an active learning environment, improved students' performance,
fostered positive attitudes toward learning complex concepts, increased communication, and could
be adapted to all learning styles and levels of instruction (Harris, 2002). Researchers suggest that,
compared to classes with a traditional teacher-leading approach, those using multimedia are better
liked by students and yield slight but statistically significant improvements in student learning as
measured by both student self-report and objective outcome testing. Such encouraging findings
have precipitated the adoption of these technologies on a widespread basis. Despite many studies
suggesting that multimedia instruction benefits students, also some found no significant
differences between multimedia classes and traditional classes.
Thus, to ascertain the effectiveness of multimedia it would be reasonable to compare it
with classroom instruction. The achievement of learning was measured via tests taken at the end of
the lessons. Over this wide range of students, meta-analysis found that learning was higher when
computer-based education was used. Learning also appeared to take less time when multimedia
instruction was used.
235
Findings of this experimental study lead to the following conclusions:
a. Multimedia method of instruction is a better method of instruction for high school level
students as compared with the conventional method of instruction.
b. Multimedia method of instruction proved as a more effective method as compared with
conventional method of instruction to enhance student learning in Biology at secondary school.
c. Multimedia method of instruction proved to be a better mode of instruction than the
conventional method of instruction in both the topic of Biology.
d. While developing multimedia software it was assumed that hyperlinks and questions in
multimedia software will enhance learning. Students supported the assumptions that hyperlinks
and questions in multimedia software direct and foster learning.
e. Students benefited from the individualization, self-pacing and interactive nature of the
multimedia software.
f. Interactive self-paced and individualized mode of presentation as used in the present
study is better strategies to enhance student learning than the conventional method of instruction.
g. Incorporation of questions and feedback in instructional process has a better impact on
student learning.
h. Girls student shows their better performance in multimedia method of instruction as
well as conventional method of instruction.
i. Learner’s active participation in instructional process results for better student
achievement.
j. Multimedia method of instruction is a powerful, useful and interesting mode of
instruction.
6.10 Educational Implications of the Study
Combining research and theory with practical and useful ideas to our students learning is a
challenge to many teachers with mission and vision. Teachers can help the learners to learn by
discovering the key to their individual learning styles. Still, teachers seem to be reluctant to switch
over to new instructional strategies, because of their ignorance about the comparative
effectiveness of these strategies even in the context of an ICT era.
The findings of the present study are related to the effectiveness of multimedia package
(software) based on individualized instructional strategies. It also gives a view on the performance
of the students in their achievement. Teachers are therefore able to select the most appropriate
method for classroom teaching in accordance with the needs and caliber of the students.
236
The scope of the present study was extended to comparison of multimedia method of
instruction and conventional method of instruction by total achievement in Biology and subtotal in
two topics and gender wise achievement. It shows that multimedia method of instruction was
more effective than conventional method of instruction in learning of Biology.
6.11 Possibilities of Multimedia Method of Instruction in Indian Schools
Government of India has decided in its revised scheme of information and communication
technology in schools (ICT in schools) during the 11th Five Year Plan: The scheme of educational
technology (ET) was started in 1972 during the 4th Five Year Plan. Under the scheme, 100%
assistance was given to six state institutes of educational technology (SIET) and the states/ UTs
were assisted for procurement of radio cum cassette players and color TVs. Further, in recognition
of the importance of role of ICT in education, the computer literacy and studies in schools (CLASS)
project was introduced as a pilot project in 1984-85 with the use of BBC micros. The project was
adopted as a centrally sponsored scheme during the 8th Five Year Plan (1993-98) and its scope was
widened to provide financial grants to educational institutions and also to cover new Government
and government aided secondary and higher secondary schools. The use and supply of software
was limited with coverage confined only to higher secondary Schools.
The national task force on information technology and software development (IT Task
Force, 1998), made specific recommendations on introduction of IT in the education sector
including schools for making computers accessible through the vidyarthi computer scheme,
Shikshak computer scheme and school Computer schemes. Smart schools were recommended on a
pilot basis in each state for demonstration purposes. It was also stipulated that 1 to three percent
of the total budget was to be spent on provision of computers to all educational institutions up to
secondary and higher secondary level during the next five years. Based on the experience gained so
far, a need for a revision of the scheme of ICT @ schools was felt on the following grounds.
• Expansion with emphasis on quality and equity: A need was felt to expand the outreach
of the scheme to cover all Government and Government aided secondary and higher secondary
schools in the country with emphasis on educationally backward blocks and areas with
concentration of SC, ST, minority and weaker sections. Along-with that, there is a need for ensuring
dependable power supply where the electricity supply is erratic and internet connectivity, including
broadband connection.
• Demonstration effect: There is a need to set up smart schools at the district level to
serve as demonstration models for neighboring schools.
237
• Regarding teacher engagement and better in-service and pre-service training, ICT
education will be imparted to all secondary and higher secondary students, an exclusive ICT
teacher is required for each school. Similarly, there is a need for pre service as well as in service
training of all teachers in effective use of ICT in teaching and learning process.
• Development of e-content: There is also a need to develop and use appropriate e-
content to enhance the comprehension levels of children in various subjects.
• A strong mechanism for monitoring and management needs to be set in place at all
levels for ensuring optimal delivery of set targets.
• The scheme envisages that the School Management Committee, Parents Teachers
Association and local bodies would be involved in the program management along-with the setting
up of an online web-based portal for real-time monitoring and transparency. In addition,
independent monitoring and evaluation is envisaged.
6.12 Suggestions for Further Research
The present study brings to light a number of new areas to be covered by future researchers. The
following problems, if studied would help to broaden the perspective of the present study.
1. The present study is limited to development and validation of multimedia package in
Biology of IX standard Karnataka State Board Syllabus. Hence, different types of packages can be
developed and validated on different subjects, which are helpful to different stages of students.
2. Interactive multimedia instructional tool can be developed to evaluate its effectiveness
in learning Biology at secondary level.
3. The study could be replicated on a large sample giving adequate coverage to different
variables like gender, locality, management, socio economic status and personality variables on a
state wide or a nationwide basis.
4. The study can be repeated at primary, higher secondary and college level of education.
5. This study was tested for teaching of only two topics in Biology for IX standard students.
This can be extended to whole subject and different subjects and at different levels of education.
6. Further research is needed to investigate use of other types of multimedia instead of
solely using different colors, and sound or combination of visual and audible media.
7. To study the effects of visual and verbal prompts in multimedia instruction at secondary
level teaching Biology.
8. Multimedia packages on practical oriented content can be developed at different level
of learning.
238
9. The effects of multimedia technologies to improve student knowledge and
understanding of Biology concepts can be studied.
10. Effectiveness of multimedia packages in virtual practical can be studied.
11. To study the effectiveness of innovative method of instruction and traditional method of
instruction.
12. Comparative study can be conducted to evaluate the effectiveness between multimedia
methods of instruction versus conventional method of instruction for Biology teaching at high
school level.
13. Surveys can be conducted to identify the learning difficulties of traditional method of
instruction, effectiveness of present system of education and difficulties faced by the teachers who
teach different subjects in different levels.
14. Studies are required to know technological competency of teachers who handle
different apparatus OHP, Slide projectors, Film projectors and Computers etc., and how the
teachers teach with the amount and specification of technologies available in different schools.
The researcher wishes to put on record the humble efforts and the scholarly guidance
which converted itself in present form, which, it is hoped, may be useful for one and all.
239
Bibliography
1. Achuthan, S. (1993) Computer Technology for Higher Education. (Vol II).New Delhi:
Concept Publishing Company.
2. Adamson, J.M. (1997) Co-operative Learning with Interactive Multimedia: The Effect of
Gender and Group Composition on Attitude and Interaction. Dissertation Abstracts
International, 58(3), Pp. 829-830 A.
3. Aggarwal, J.C. (1991) Educational Research. New Delhi: Arya Book Depot.
4. Ahmad, M. I. (2010) Effectiveness of Innovative and Traditional Method of Teaching
Biology in Junior College Students. Shodh Samiksha Aur Mulyankan, 2010, 2(18), Pp. 35-36.
5. Ahmed, A. (2008) Video Representation and Processing for Multimedia Data Mining, book
chapter in “Semantic Mining Technologies for Multimedia Databases”.
6. Albon, S. (1997) Experimenting with Computer Assisted Instruction. Retrieved from
http://www.cc.ube.ca/ccande
7. Alessi, S.M. and Trollip, S.R. (1991) Computer Based Instruction Methods and
Development. Englewood Cliffs: Prentice Hall, Inc.
8. Ali Ahmed, et al. (2004) Examining Students Performance and Attitudes towards the Use of
Information Technology in a Virtual Conventional Setting. The Journal of Interactive Online
Learning. 2(3), Winter 2004. Retrieved from http://search.line.com
9. Ambron, S. and Hooper, K. (1990) Learning with Interactive Multimedia: Developing and
Using Multimedia Tools in Education (Redmond, WA, Microsoft Press).
10. American Association for the Advancement of Science (2005) High School Biology
Textbooks: A Benchmark-Based Evaluation. Retrieved from the AAAS Project 2061
Textbook Evaluations Website: http://www.project2061.org/publications/textbook
11. American Distance Education Consortium (2007) Guiding Principles for Distance Teaching
and Learning. Retrieved from http://www.adec.edu/admin/papers/distance-teaching
12. Amthor, G.R. (1991) Interactive Multimedia in Education. IBM Multimedia! Pp. 2-5.
13. Andrews, D. H., and Goodson, L. A. (1995) A Comparative Analysis of Models of
Instructional Design. In G. Anglin (Ed.) Instructional Technology. Past, Present, and Future,
Pp. 161-182.
14. Ann H. F., Barbara N. C., and Deborah D. G. (2009) Effectiveness of Computer Assisted
Instruction for Teaching Consumer Credit. Instructional development for Distance
Learning. Retrieved from http://www.uidaho.edu/eo

240
15. Atkinson, R.C. (1968) Computer Based Instruction in Initial Reading. In Proceedings of the
1967 Invitational Conference on Testing Problems. In J.H. Block (Ed.) Mastery Learning:
Theory and Practice (1971), 145, New York: Holt, Rinehart and Winston, Inc.
16. Atkinson, R.C., and Mayer, R. E. (2004) Five Ways to Reduce PowerPoint Overload.
Retrieved from http://www. sociablemedia.com /thebio_articles.php4
17. Ayers, P., and Paas, F. (2007) Can the Cognitive Load Approach Make Instructional
Animations More Effective? Applied Cognitive Psychology, 21, 811-820.
18. Ayres, R. and Melear, C. (1998) Increased Learning of Physical Science Concepts Via
Multimedia Exhibit Compared to Hands on Exhibit in a Science Museum. Reports-
Research (143). (ERIC Information Services, Washington DC).
19. Bagdonis, A. and Salisbury, D. (April 1994). Development and Validation of Models in
Instructional Design. Educational Technology, 34(4), pp. 26-32.
20. Bagui, S. (1998). Reasons for Increased Learning Using Multimedia. Journal of Educational
Multimedia and Hypermedia, 7 (1), 3-18. Retrieved from http://www.editlib.org
21. Bailey, Debra H. (1996) Constructivism and Multimedia: Theory and Application;
Innovation and Transformation. International Journal of Instructional Media, 23 (2),
Pp.161
22. Barad, S.A. (2010) Effectiveness of Computer Assisted Instruction for Science Teaching in
Urban Area. Research Analysis and Evaluation, 2010, 1(12), pp. 19-21.
23. Barker, J. (2000) Sophisticated Technology Offers Higher Education Options. The Journal of
Technology Horizons in Education, 28 (4), Pp. 58. Retrieved from http://www.nwrel.org
24. Basu, M.K. (1981) Effectiveness of Multimedia Programmed Materials in the Teaching of
Physics. New Delhi: In M.B. Buch (Ed.) Fourth Survey of Research in Education, NCERT
25. Bates Tony, (2000) Teaching, Learning and the Impact of Multimedia Technologies.
Australian Journal of Educational Technology, 14(2), Pp. 98-106.
26. Bawden, D. (2001) Information and Digital Literacies: A Review of Concepts. Journal of
Documentation, 57(2), Pp. 218-259.
27. Beichner, R.J. (1994) Multimedia Editing to Promote Science Learning. Journal of
Computers in Mathematics and Science Learnings, Washington DC: ERIC Information
Services.
28. Bell, R., Bell, L. (2003) A Bibliography of Articles on Technology in Science Education.
Contemporary Issues in Technology and Teacher Education, 2 (4), Pp. 427-447.
29. Best John W. and Khan, J.V. (1995) Research in Education (7th Ed.). New Delhi: Prentice-
Hall of India Pvt. Ltd.

241
30. Bingimlas, K.A. (2009) Barriers to the Successful Integration of ICT in Teaching and Learning
Environments: A Review of the Literature. EURASIA Journal of Mathematics, Science and
Technology Education, 5(3), Special Issue: Australia. Pp. 235-245.
31. Bloom, B.S. (1956) Taxonomy of Educational Objectives: The Classification of Educational
Goals, Handbook I: Cognitive Domain. NY: David McKay Co.
32. Bodemer, D. Ploetzner, R. Feuerlein, I. and Spada, H. (2004) The Active Integration of
Information During Learning with Dynamic and Interactive Visualizations. Learning and
Instruction, 14, Pp. 325-341.
33. Bodzin, A., and Cates, W. (2002) Inquiry dot com: Web-based Activities Promote Scientific
Inquiry Learning. The Science Teacher, 69 (9), Pp. 48-52.
34. Boyle, T. (1997) Design for Multimedia Learning. London: Prentice Hall.
35. Brahler, C. J. (2005) Developing On-Line Learning Materials for Higher Education.
Washington: An Overview of Current Issues, Washington State University, Pullman.
36. Branson, R.K. (1971) Formative Evaluation Procedures Used in Designing a Multi-media
Physics Course. Paper Presented at the Annual Meeting of the American Educational
Research Association, New York, ERIC Document ED 050140.
37. Brooks, D. W. (1997) Lecturing; Multimedia Classrooms. In: K. C. Cohen, Harvard (Ed.),
Web-teaching: A Guide to Designing Interactive Teaching for the World Wide Web,
Cambridge, MA: Plenum Press, pp. 165-171.
38. Brown, J.W., Lewis R.B. and Harcleroad, F.F. (1985) An Instructions; Technology, Media
and Methods. (6th Ed.). Singapore: McGraw-Hill Book Co.
39. Bruner, J.S. (1969) “Eye, Hand and Mind”. In: D.Elkind and J.H. Flavell, Editors. New York:
Study in Cognitive Development: Essays in Honor of Jean Piaget. Oxford University Press,
Inc., Pp. 223-35.
40. Bui, K.P. (1999) Hyper Lexicon, a Hypermedia-Based Lexicon for Vocabulary Acquisition. In
H. Maurer (Ed.) Lecture Notes in Computer Science. Proceedings of the 2nd International
Conference on Computer Assisted Learning (Pp. 14). Dallas, TX.
41. Burton, B.S. (1995) The Effect of Computer Assisted Instruction and Other Selected
Variables on the Academic Performance of Adult Students in Mathematics and Reading.
Dissertation Abstracts International, 57(7), Pp. 2798 A.
42. Callaway, J.A. (1996) An Interactive Multimedia Computer Package on Photosynthesis for
High School Students Based on a Matrix of Cognitive and Learning Styles. Dissertation
Abstracts International, 57 (7), 2951 A.
242
43. Campbell, J.O. and Lison, C.A. (1995) Using Computer and Video Technologies to Develop
Interpersonal Skills. Computers in Human Behaviour, 11(20), Pp. 223-239.
44. Capper, J. and Copple, C. (1985) Computer Use in Education: Research Review and
Instructional Implications. Washington DC: Center for Research into Practice.
45. Carlson, S. (2005) The Net Generation Goes to College. The Chronicle of Higher Education,
52(7), A34. Retrieved from http://chronicle.com/free/v52/i07/ 07a03401
46. Carmigani, G. (1973) Learning Activities Modules for High School Driver and Traffic
Safety Education: Their Development and Evaluation. Dissertation Abstracts
International, 1974(8), 795 A.
47. Carter, F.L (1999) The Effect of Computer Assisted Instruction of Vocational Education High
School Students. Online Master Thesis www.oclc.com California State University,
Fullerton.MAI.37/06, Pp.1602.
48. Casey, C. (1996). Incorporating Cognitive Apprenticeship in Multi-Media. Educational
Technology Research and Development, 44(1), Pp. 71-84.
49. Casey, P. (1997) Computer Programming: a Medium for Teaching Problem Solving.
Computers in the Schools, 13(1-2), Pp. 41-51.
50. Cavender, J.F. and Rutter, S.M. (1997) Multimedia: Bringing the Sciences to Life experience
with Multimedia. Reports-Descriptive (141). Washington DC: ERIC Information Services.
51. Chabay, R.W. and Sherwood, B.A. (1992) Computer-Assisted Instruction and Intelligent
Tutoring Systems: Shared Goals and Complementary Approaches Hillsdale, NJ:
Lawrence Erlbaum Associates, pp. 151-186.
52. Christmann, E.P. and Badgett, J.L. (2000) Progressive Comparison of the Effectiveness of
Computer-Assisted Instruction on Science Achievement: A Meta-Analysis. In Proceedings
of International Conference on Mathematics / Science Education and Technology 2000,
Pp.118-123. AACE. Retrieved from http://www.editlib.org
53. Clark, J.M. and Paivio, A. (1991) Dual Coding Theory and Education, Educational
Psychology Review 3, Pp. 149-210.
54. Collier Ebenezer S. O. (2004) The Enhancement of the Teaching and the Learning of the
Sciences in Secondary Schools Using Computer Assisted Instruction. Retrieved from http://
www.members.aol.com
55. Collins, Hammond and Wellington (1997) Teaching and Learning with Multimedia.London
and New York: Ront Ledge.

243
56. Collis, B. and Moonen, J. (1997) Flexibility as a Key Construct in European Training:
Experiences from the Telescopia Project. British Journal of Educational Technology, 28 (3),
Pp. 199-217. Retrieved from http:// www.concentric.net
57. Cotton, K. (2001) Computer Assisted Instruction. Retrieved from http://www.nwrel.org
58. Couch, J.D. (1993). Interdisciplinary Study with Computer Based Multimedia. Reports-
Research (143), Washington DC: ERIC Information Services.
59. Crain, L. (1994) Effects of Instructional Media On Immediate and Long Term Recall.
Interpersonal Computing and Technology Journal, 19, 27. Washington DC: ERIC
Information Services.
60. Criswel, E.L. (1989). The Design of Computer-Based Instruction. New York: Macmillan
Publishing Co.
61. Crosby, M.E. and Iding, M.K. (1997). The Influence of a Multimedia Physics tutor and user
Differences on the Development of Scientific Knowledge. Computers and education, 29 (2-
3), pp. 127-136
62. Dale, E.A. (1969) Audio Visual Methods in Teaching. New York: Holt, Rinehart and Winston.
63. Dancy, M. and Beichner, R. (2006) Impact of Animation on Assessment of Conceptual
Understanding in Physics. Physical Review Special Topics - Physics Education Research,
2(1). Retrieved from http://prstper.aps.org/ pdf/PRSTPER/v2/i1/e010104
64. Dasdemir, I. Doymus, K. Simsek, U. and Karacop, A. (2008) The Effects of Animation
Technique on Teaching of Acids and Bases Topics. Journal of Turkish Science Education,
5(2), Pp. 60-69.
65. Desai, B.Y. (2004) A Comparative Study of the Efficacy of Teaching through the Traditional
Method and the Multimedia Approach in the Subject of Home Science, A Ph.D.
Thesis. South Gujarat University, Surat.
66. Dewhurst, D.G. and Meehan, A.S. (1993) Evaluation of the Use of Computer Simulations of
Experiments in Teaching Undergraduate Student, Pp. 235-238.
67. Donald, A. (2001) Biology Exploration through Technology: Taking the Leap from Theory to
Practice. Tech Trends, 45, 5, Pp. 27-34
68. Donovan, M. and Bransford, J. (2005) How Students Learn: Science in the Classroom.
Retrieved from the National Academies of Science Press Web site: http://books.nap.edu/
openbook. php?record_id =11102&page=1
69. Dordrecht, and Goldberg, F. (1997) Constructing Physics Understanding in a Computer
Supported Learning Environment. In Rigden, J. (Ed.) Proceedings of the International
Conference on Undergraduate Physics Education, II. American Institute of Physics.

244
70. Ebel, R.L. (1969) Measuring Educational Achievement. New Delhi: Prentice-Hall of India
Pvt. Ltd.
71. Ebert, E. and Strudler, N. (1996) Improving Science Learning Using Low Cost Multimedia.
Learning and Leading with Technology. Washington DC: ERIC Information Services.
72. Ediger, M. (2002) Assessing Teacher Attitudes in Teaching Science. Online: Retrieved from
http://www.encyclopedia.com doc/1G1-84667404
73. Emerson, J.D. and Mosteller, F. (1998) Interactive Multimedia in College Teaching Part 2:
Lessons from Research in the Science. Educational Media and technology, Washington DC:
ERIC Information Services.
74. Fletcher, J. D. (1990) "Effectiveness and Cost of Interactive Videodisc Instruction in
Defense Training and Education." Multimedia Review 2 (Spring 1991): Pp. 33-42.
75. Flick, L. and Bell, R. (2000) Preparing Tomorrow's Science Teachers to Use Technology:
Guidelines for Science Educators. Contemporary Issues in Technology and Teacher
Education [Online serial], 1(1). Retrieved from
http://www.citejournal.org/vol1/iss1/currentissues/science
76. Fraenkel, J.K. and Wallen, N.E. (1993) How to Evaluate Design and Evaluate Research in
Education. New York: McGraw-Hill International editions.
77. Fraenkel, J.R. and Wallen, N.E. (1993) How to Design Evaluate Research. (2nd Ed.), New
York: McGraw-Hill Inc.
78. Garrette, H.E. (2005) Statistics in Psychology and Education. New Delhi: Paragon
International Publishers.
79. Garrison, R. and Vaughan, H. (2008). Blended Learning in Higher Education: Framework,
principles and guidelines. San Francisco: Jossey-Bass.
80. Gentry, Mary Annie Marshal. (1998) Deaf Readers: Transfer of factual Information Using
Multimedia and Multimedia Presentation Options. Dissertation Abstracts International, 60
(7), p.3755.
81. Gerlach, V.S and Ely, D.P. (1980) Teaching and Media. New Jersey: Prentice-Hall, Inc:
Englewood Cliffs.
82. Gokhale, A. A. (1996) Effectiveness of Computer Simulation for Enhancing Higher Order
Thinking. Journal of Industrial Teacher Education, 33(4), Pp. 36-46.
83. Greenberg, M.A. and Kusche, C.A. (1989) Effectiveness of Computer Assisted video
Cassette Module for Reading Instruction. Dissertation Abstracts International, 45(9),
2766 A.

245
84. Gunstone, R. (2003) Science and Computer Based Technology: Attitudes of Secondary
Science Teachers. Research in Science and Technological Education, 21 (2), Pp. 243-264.
85. Hardy, R.D. and Jost, K.L. (1996) The Use of Music in the Instructional Design of
Multimedia. Washington DC: ERIC Information Services.
86. Haunsel, P.B., Hill, R.S. (1989) The Microcomputer and Achievement and Attitudes in High
School Biology. Journal of Research in Science Teaching 26: Pp. 543–549.
87. Hawkins, R. J. (2002) Ten Lessons for ICT and Education in the Developing World. In: Eds.
Kirkman G. Cornelius P. K., Sachs J. D., Schwab K. The Global Information Technology
Report 2001-2002: Readiness for the Networked World. World Economic Forum. Oxford
University Press: Pp. 38-43.
88. Hedberg, J. et al. (1997) Employing Cognitive Tools within Interactive Multimedia
Applications. Reports-Descriptive (141). Washington DC: ERIC Information Services.
89. Hefzallah, I.M. (1999) The New Educational Technologies and Learning Empowering
Teachers to Teach and Students to Learn in the Information Age. Springfield. Charles C
Thomas Publishers Ltd.
90. Heimann, M. et al. (1995) Increasing Reading and Communication Skills in Children with
Autism through and Interactive Multimedia Computer Programme. Journal of Autism and
Developmental Disorders, Washington DC: ERIC Information Services.
91. Heinich, R., Molenda, M., and Russel, J.D. (1990) Instructional Media and New
Technologies of Instruction. (3rd Ed.) Canada: Collier Macmillan Publishers.
92. Hepp, P.K. Hinostroza, E.S. Laval, E.M. Rehbein, L.F. (2004) Technology in Schools:
Education, ICT and the Knowledge Society. World Bank. Online: Retrieved from
http://www1.worldbank.org/education/pdf/ICT_report_oct 04
93. Herrington, J. et al. (2004) Designing Authentic Activities in Web-Based Courses. Journal of
Computing in Higher Education, 16 (1), Pp. 3-29.
94. Homer, C. et al. (2000) An Evaluation of an Innovative Multimedia Educational Software
Program for Asthma Management: Report of a Randomized, Controlled Trial. Pediatrics,
106(1), Pp. 210-215.
95. Hopper, W.A.F. (1998) Biology Teaching: Modular Approach. Madras: The Christian
Literature Society.
96. Jenkins, R. (2004). Virtual Unknown Microbiology. Journal of Biological Education, 38(4),
Pp. 187-197.
246
97. Joel K. K. et al. (2004) Effectiveness of a Computer-Mediated Simulations Program in
School Biology on Pupils’ Learning Outcomes in Cell Theory. Journal of Science
Education and Technology, 13 (2).
98. Johnson, D.W. and Stanne, M. (1985) Effects of Cooperative, Competitive, and
Individualistic Goal Structures on Computer-Assisted Instruction. Journal of Educational
Psychology 77, Pp. 668-77.
99. Joyce, B and Weil, M. (1996) Models of Teaching. Boston: Allyn and Bacon.
100. Juhani, E. (n.d.) Congnition Research and Educational Multimedia, Retrieved from
http://www.gscit.monash.edu.au/ seminar/ 2000/ juhani.pdf
101. Kaiser Family Foundation. (2005) Generation M: Media in the Lives of 8-18 Year-olds.
Retrieved from http://www.kff.org/ entmedia/ entmedia030905pkg.cfm
102. Kanning, R.G. (1994) What Multimedia can do in Our Classroom. Educational Leadership.
Washington DC: ERIC Information Services.
103. Kareem, A. (2003) Computer-Assisted Learning: Cyber Patient-A Step in the Future of
Surgical Education. J Invest Surg, 12(6), Pp. 307-317.
104. Katz, L. and Pyryt, M. (1992) Multimedia Technology and Kid TV: A New Approach to
Learning. Guides-Classroom-Teacher (52). Washington DC: ERIC Information Services.
105. Kealy, W. A. (2003) Review of Physical Chemistry: A Tale of Two Contexts. International
Journal of Instructional Media, 30, Pp. 329-334.
106. Kearsley, G. (2002) Exploration in Learning and Instruction: The Theory into Practice
Database. Retrieved from http://tip.psychology.org
107. Kent, T.W. and Mc Nergnay, R.F. (1999) Will Technology Really Change Education? From
Blackboard to Web. California: Crown Press, Inc.
108. Khoo, G. and Koh, T. (1998) Using Visualization and Simulation Tools in Tertiary Science
Education. Journal of Computers in Mathematics and Science Teaching, 17(1), Pp. 5-20.
109. Kinnear, J.F. et al. (1982) Computer Simulation and Concept Development in Students of
Genetics. Research in Science Education. 12, Pp. 89-96.
110. Klein, J. and Koroghlanian, C. (2004) The Effect of Audio and Animation in Multimedia
Instruction. Journal of Educational Multimedia and Hypermedia, 13(1), Pp. 23-46.
Retrieved from http://www.editlib.org
111. Koul, L. and Bhadwal, S.C. (1991) Effect of formative evaluation on the Test Anxiety of High
School Students Following Programmed Instructional Material in General Science. Journal
of Psychological Researches, 35(1), Pp. 34-41.

247
112. Kozma, R.B. (1991) Learning with Media. Review of Educational Research. 61 (2), Pp. 179-
211
113. Krishnan, S.S. (1983) Development of Multimedia Package for Teaching a Course on Audio
Visual Education. New Delhi: In M.B. Buch (Ed.) Fourth Survey of Research in Education.
NCERT.
114. Kubiatko, M. Halakova, Z. (2009) Slovak High School Students' Attitudes to ICT Using in
Biology Lesson. Computers in Human Behaviour, 25(3), Pp. 743-748.
115. Kuhlemeier, H. and Hemker, B. (2007) The Impact of Computer Use at Home on Students'
Internet Skills. Computers and Education, 49 (2), Pp. 460-480.
116. Kulik, J.A. and Kulik, C.C. (1985) Effectiveness of Computer-Based Education in Elementary
Schools. Computers in Human Behaviour, 1, Pp. 59-74.
117. Kulik, J.A. and Williams, G.W. (1983) Effects of Computer Based Teaching on Secondary
School Students. Journal of Educational Psychology, 75, Pp. 19-26.
118. Kulik, J.A. et al. (1980). Effectiveness of Computer Based College Teaching: A Meta-Analysis
of Findings. Review of Educational Research, 50, Pp. 525-544.
119. Lavonen, L. Aksela, M. Juti, K. and Meisalo, V. (2003) Designing a User-Friendly
Microcomputer-Based Laboratory Package through the Factor Analysis of Teacher
Evaluations. International Journal of Science Education, 25 (12), Pp. 1471-1487.
120. LeDuff, R. (2004) Enhancing Biology Instruction via Multimedia Presentations. Proceedings
of Society for Information Technology and Teacher Education International Conference
2004, Pp. 4693-4695.
121. Lee, A. Y. et al. (1996) Assessing the Effectiveness of a Multimedia-Based Lab for Upper
Division Psychology Students. Behavior Research Methods, Instruments and Computers,
28, Pp. 295-299.
122. Leedham, (1967) Aspects of Educational Technology: The Proceedings of the Programmed
Learning Conference held at Loughborough, 15-18 April 1966 by Programmed Learning
Conference( Book) published in 1967 in English and held by 160 libraries worldwide
123. Leon and Leon, (1990) Fundamentals of Information Technology. New-Delhi: Vikas
Publishing House, ISBN 10: 8125907890
124. Li, P. Santhanam, R. and Carswell, C. M. (2009) Effects of animations in learning: A
Cognitive Fit Perspective. Decision Sciences Journal of Innovative Education, 7(2), Pp. 377–
410.
125. Liao, Y. C. (1999) Effects of Hypermedia on Students' Achievement: A Meta- Analysis.
Journal of Educational Multimedia and Hypermedia, 8(3), Pp. 255-277.
248
126. Linkels, S. et al. (2006) Better Results in Mathematics Lessons with a Virtual Personal
Teacher. Proceedings of the 34th Annual ACM SIGUCCS Conference on User Services
SIGUCC’06. Pp. 201-209. Retrieved from http://www. athemacademy.org
127. Liou, H.C. (1994) Practical Considerations for Multimedia Courseware Development: an EFL
IVD Experience, CALICO Journal, 11(3), Pp. 47-74.
128. Lokesh, K. (2007) Methodology of Educational Research. New Delhi: Vikas Publishing
House Pvt Ltd.
129. MacLachlan, K. (1996) Web Evaluation. Retrieved from: the Adventures of Cyber bee Web
site: http://www.cyberbee.com/ guides.html
130. Macromedia Flash player: White Paper for Developers and Publishers. 2002b. Retrieved
from http://www.macromedia.com/ software/ flash/survey.
131. Madhu, G. (1988) Two Strategies of Computer Assisted Instruction in Chemistry. In M.
Mukhopadhyay (Ed.), Educational Technology Year Book, (1988). New Delhi: All India
Association for Educational Technology.
132. Mahmood, M.K. (2004) A Comparison of Traditional Method and Computer Assisted
Instruction on Students Achievement in General Science. Lahore: Unpublished Ph.D.
Thesis, University of Punjab.
133. Mallik, U. (1993) A study of CLASS, As Part of a Larger International Study Entitled
“Schools, Teachers, Students, and Computers”: A Cross-National Perspective, IEA 1993.
University of Twente.
134. Marrison, D. L., and Frick, M. J. (1993) Computer Multimedia Instruction versus Traditional
Instruction in Post-Secondary Agricultural Education. Journal of Agricultural Education,
34(4), 31-38.
135. Mautone, P. D., and Mayer, R. E. (2001) Signaling as a Cognitive Guide in Multimedia
Learning. Journal of Educational Psychology, 93(2), Pp. 377-389.
136. Mayer, R. E. (2001) Multimedia Learning. Cambridge, UK: Cambridge University Press, Pp.
403-405
137. Mayer, R. E. (2002) Cognitive Theory and the Design of Multimedia Instruction: An
Example of the Two-Way Street between Cognition and Instruction [Electronic Version].
New Directions for Teaching and Learning, 89, Pp. 55-71.
138. Mayer, R. E., and Anderson, R. B., (1991) Animations Need Narrations: An Experimental
Test of a Dual-Coding Hypothesis. Journal of Educational Psychology, 83(4), Pp. 484-490.

249
139. Mayer, R. E., and Moreno, R. (1998) A Split-attention Effect in Multimedia Learning:
Evidence for dual Processing Systems in Working Memory. Journal of Educational
Psychology, 90(2), Pp. 312-320.
140. Mayer, R. E., and Moreno, R. (2000) A Learner-Centered Approach to Multimedia
Explanations: Deriving Instructional Design Principles from Cognitive Theory. Interactive
Multimedia Electronic Journal of Computer-Enhanced Learning, 2(2).
141. Mayer, R. E., and Moreno, R. (2003) Nine Ways to Reduce Cognitive Load in Multimedia
Learning. Educational Psychologist, 38(1), Pp. 43-52.
142. McFarlane, A. and Sakellariou, S. (2002) The Role of ICT in Science Education. Cambridge
Journal of Education, 32(2), Pp. 219-232.
143. McKethan, R. and Everhart, B. (2001) The Effects of Multimedia Software Instruction and
Lecture-Based Instruction on Learning and Teaching Cues of Manipulative Skills on
Pre-service Physical Education Teachers. Physical Educators, 58(1), Pp. 2-13.
144. McLaughlin, J. (2006). The CHANCE Program: Promoting Learning for Teachers and
Students through Experiences and Inquiry. The American Biology Teacher, 68(4), Pp. 17-
24.
145. McLaughlin, J. Arbeider, D. A. (2008) Evaluating multimedia-Learning Tools Based on
Authentic Research Data that Teach Biology Concepts and Environmental Stewardship.
Contemporary Issues in Technology and Teacher Education, 8 (1).Retrieved from
http://www.citejournal.org/vol8/iss1/science/article1.cfm
146. McLean, M. (2000) Introducing Computer Aided Instruction into a Traditional Histology
Course: Student Evaluation of the Educational Value. Journal of Audiovisual Media in
Medicine, 23(4), Pp. 153-160.
147. Mehryar, N. (1998) The Effectiveness of a Web-Based Interactive Multimedia System in
Tertiary Education. Washington DC: ERIC Information Services.
148. Menon, M.B. (1984) Evolving a Multimedia Approach to Teaching at Post Graduate Level.
In M.B. Butch (Ed.), Fourth Survey of research in Education, (1994). New Delhi: NCERT.
149. Meyer, A. (2002) Teaching every student in the Digital Age: Universal Design for Learning.
Alexandria, VA: ASCD. Retrieved from http://www.cast.org
150. Michael Heim. (1993) The Metaphysics of Virtual Reality. OUP. Oxford. Retrieved from
http://services.exeter.ac.uk/ cmit/ modules/ cyberspace
151. Milheim, W.D. and Martin B.L. (1991) Theoretical Bases for the Use of Learner Control:
Three Different Perspectives. Journal of Computer Based Instruction, 18(3), Pp. 99-105.
250
152. Moreno, R. and Valdez, A. (2005) Cognitive Load and Learning Effects of Having Students
Organize Pictures and Words in Multimedia Environments: The Role of Student
Interactivity and Feedback. Educational Technology Research and Development, 53(3), Pp.
35-45.
153. Moreno, R., Mayer, and R. E. (2003) The Case for Social Agency in Computer-Based
Teaching: Do Students Learn More Deeply when they Interact with Animated Pedagogical
Agents? Cognition and Instruction, 19, Pp. 177-213.
154. Mukhopadhyaya, A. et al. (1993) Utilization of Media Facilities in Schools: An Evaluative
Study of the ET Scheme of the Ministry of HRD.
155. Nadia, C. et al. (1997) The Evaluation of Electronic book Guidelines from Two Practical
Experience. Journal of Educational Multimedia and Hypermedia, 6, Pp. 91-114.
Washington DC: ERIC Information Services.
156. Najjar, L. J. (1996) Multimedia Information and Learning. Journal of Educational
Multimedia and Hypermedia, 5, Pp. 129-150.
157. Najjar, L. J. (1996) The Effects of Multimedia and Elaborative Encoding on Learning (GIT-
GVU-96-05). Atlanta: Georgia Institute of Technology, Graphics, Visualization and Usability
Center.
158. Najjar, L. J. (1998) Principles of Educational Multimedia User Interface Design. Human
Factors, 40(2), Pp.311-324.
159. National Curriculum Framework 2005 (NCF, 2005) Retrieved from http//:www.ncert.nic.in
160. National Education Association. (2007) NCLB/ESEA: It’s Time for a Change – Voices from
America’s Classrooms. Retrieved from http://www.nea.org/esea/nclbstories/images/
classroom voices
161. National Research Council (1996) National Science Education Standards. Retrieved from
the National Academies Press Web site: http://books.nap.edu.
162. Neuhoff, J. (2000) Classroom Demonstrations in Perception and Cognition Using
Presentation Software. Teaching of Psychology, 27(2), Pp. 142-144.
163. Newton, R.L. (2000) Data Logging in Practical Science: Research and Reality. International
Journal of Science Education 22(12), Pp. 1247-1259.
164. O'Byrne, P.J., Patry, A., Carnegie, J.A. (2008) The Development of Interactive Online
Learning Tools for the Study of Anatomy. Medical Teacher, 30(8), Pp. 260-271.
165. Oliver, R. Orami, A. and Herrington (1998) Exploring Student Interactions in Collaborative
World Wide Web Computer Based Learning Environments. Journal of Educational
Multimedia and Hypermedia, Pp. 263-287.
251
166. Owusu, K.A. (2010) Effects of Computer Assisted Instruction on Performance of Senior
High School Biology Students in Ghana. Computers and Education, 2010, 55(2), Pp. 904-
910
167. Pandian, S. S. (2004) Effectiveness of Computer Assisted Instruction in Biology at
Secondary School Level. New Delhi: Unpublished Ph.D. Thesis, University of Delhi.
168. Paris, P.G. (2004) E-Learning: A Study on Secondary Students’ Attitudes towards Online
Web Assisted Learning. International Education Journal, 5(1), Pp. 98-112
169. Persin, R. (2002) Web-Assisted Instruction in Physics: An Enhancement to Block
Scheduling. American Secondary Education, 30(3), Pp. 61-69.
170. Ploetzner, R. and Loweb, R. (2004) Dynamic visualizations and learning. Learning and
Instruction, 14(3), Pp. 235-240.
171. Raven, J.C. (1960) Guide to the Standard Progressive Matrices Sets A, B, C, D, and E.
London: H.K.Lews and Co. Ltd.
172. Ravindranath, M.J. (1982) Development of Multimedia Instructional Strategy for Teaching
Science at Secondary School Level. In M.B. Buch (Ed.), Third Survey of Research in
Education, New Delhi: NCERT.
173. Reddy, G.L. and Ramar, R. (1995) Effectiveness of Multimedia Based Modular Approach in
Teaching of Science to Low Achievers’. Journal of Research in Educational Media, 2, Pp. 41-
52.
174. Reddy, L. (1997) Effectiveness of Multimedia Instructional Strategy in Teaching Science to
the Slow Learners. Journal of Indian Education, 23(2), Pp. 50-59.
175. Reeves, T. C. (1998) The Impact of media and Technology in Schools. A research Report
Prepared for Bertelsmann Foundation. Retrieved from www.athemacademy.org
176. Reeves, T.C. (1991) Ten Commandments for the Evaluation of Interactive Multimedia in
Higher Education. Journal of Computing in Higher Education, 2(2), Pp. 84-113.
177. Riffell, S. and Sibley, D. (2005) Using Web-Based Instruction to Improve Large
Undergradu¬ate Biology Courses: An Evaluation of a Hybrid Course Format. Computers
and Education, 44 (3), Pp. 217-35.
178. Roden, S. (1991) Multimedia: The Future of Training. Multimedia Solutions, 5(l), Pp. 17-19.
179. Rodrigues, S. (2000) The Interpretive Zone between Software Designers and a Science
Educator. Journal of Research on Computing in Education, 33 (1).
180. Russell, J. D. (1974) Modular Instruction: A Guide to the Design, Selection, Utilization and
Evaluation of Modular Materials. Minneapolis, MN: Burgess Publishing Company.
252
181. Sampath, K., Paneerselvam, A. and Santhanam, S. (1990) Introduction to Educational
Technology, New Delhi: Sterling Publishers Pvt. Ltd.
182. Sangodoyin, A. (2010) Computer Animation and the Academic Achievement of Nigerian
Senior Secondary School Students in Biology. Journal of the Research Center for
Educational Technology. 2010, 6(2), Pp. 148-157.
183. Sanjna, (2001) A Comparative Study of the Effectiveness of CAI and CMI on Pupils
Achievement in Science, their Self Concept and Study Involvement. Rohtak: Unpublished
Ph.D. Thesis, M.D. University.
184. Schramm, W. (1997) Big Media, Little Media. California: Institute for Communication
Research.
185. Science Part-2 (Biology) Textbook for 9th Standard (2003). Bangalore: DSERT.
186. Selvaraj, B. (1995) Media Production in Operational Aspects. New Delhi: IGNOU Text book.
187. Selwyn, N. (1997). Students' Attitudes toward Computers: Validation of a Computer
Attitude Scale for 16-19 Education. Computers and Education. 28(1), Pp. 35-41.
188. Sewell, R.D.E. et al. (1995) Multimedia Computer Technology as a tool for teaching and
Assessment of Biological Science. Journal of Biological Education, 29(1), Pp. 27-32.
189. Shah, S.G. (1979) Development and Tryout of Multimedia Package on Effective
Questioning in the Context of Micro Teaching. In M.B.Buch (Ed.), Third Survey of Research
in Education (1986). New Delhi: NCERT.
190. Silvinn, K. and Bialo, (2000) Critical Issues: Using Technology to Improve Student
Achievement. Retrieved from http://www.ncrel.org
191. Singh, U. (1983) Effectiveness of Media with reference of classroom Ethos. In M.B. Butch
(Ed.), Fourth Survey of Research in Education (1994). New Delhi: NCERT.
192. Sinnathambi, V. (1991) Developing a Video Programme on Energetics in Chemistry for
Higher Secondary students. In A.K. Sharm, et al. Fifth Survey of Research in Education.
New Delhi: NCERT.
193. Smith, M.U. (1991) Teaching Cell Division: Student Difficulties and Teaching
Recommendations. Journal of College Science Teaching. 21 (1), p. 28.
194. Smith, P.S. Banilower, E.R. McMahon, K.C. and Weiss, I.R. (2002) The National Survey of
Science and Mathematics Education: Trends from 1977 to 2000. Chapel Hill, NC: Horizon
Research.
195. Smith, S.G. and Jones, L.L.(1991) The Acid Test: Five Years of Multimedia Chemistry. IBM
Multimedia Supplement to T.H.E. Washington DC: ERIC Information Services.
253
196. Sorgo, A. and Kocijancic, S. (2006) Demonstration of Biological Processes in Lakes and
Fishponds through Computerized Laboratory Practice. The International Journal of
Engineering Education 22(6), Pp. 1224-1230.
197. Sorgo, A. and Logar, D. (2006) Relationship in Teamwork between Cooperation and
Parasitism. International Journal of Instructional Media, 33(1), Pp. 113-118.
198. Sorgo, A. et al. (2010) Information and Communication Technologies in Biology Teaching in
Slovenian Secondary Schools. Eurasia Journal of Mathematics, Science and Technology
Education, 2010, 6(1), Pp. 37-46
199. Squizzero,W.E. (1976) A Comparative Study of a Traditional Approach and a Multimedia
Approach to Teaching the Accounting Cycle. Unpublished Ph.D. Thesis in Education (Nova
University, ERIC Document ED 157585).
200. Staninger, S. (1994) Hypertext Technology: Educational Consequences. Educational
Technology, Pp. 51-53.
201. Starbek, P. Starcic, E. M. and Peklaj, C. (2010) Teaching Genetics with Multimedia Results
in Better Acquisition of Knowledge and Improvement in Comprehension. Journal of
Computer Assisted Learning, 26. Pp. 214–224.
202. Susanne M. B. et al. (2002) Cancer Cell Biology: A Student-Centered Instructional Module
Exploring the Use of Multimedia to Enrich Interactive, Constructivist Learning of Science.
Retrieved from www.unc.edu/cell/cancer/instructor
203. Swain, J. Monk, M. and Johnson, S. (2000) Developments in Science Teachers’ Attitudes to
Aims for Practical Work: Continuity and Change. Teacher Development, 4(2), Pp. 281 -292.
204. Tempelman-Kluit, N. (2006) Multimedia Learning Theories and Online Instruction. College
and Research Libraries, 67, Pp. 364-369.
205. Terry, K.P. Doolittle, P.E. Scheer, S.B. and McNeill, A.B. (2004) Designing Multimedia for
Meaningful Online Teaching and Learning. Journal on Excellence in College Teaching, 15
(1/2), Pp. 87-104.
206. Thomas, L.G. and Livingston, M. (2004) Using Video Exhibits to Support Technology
Integration in Teacher Preparation and P-12 Student Learning. Retrieved from
http://osx.latech.edu/dedge/docs/ bellsouthprop.pdf
207. Tondeur, J. Hermans, R. Braak, J. and Valcke, M. (2008) Exploring the Link between
Teachers’ Educational Belief Profiles and Different Types of Computer Use in the
Classroom. Computers in Human Behavior, 24, Pp. 2541–2553
254
208. Trail, M.A. Gutierrez C. and Lechner, D. (2006) Reconsidering a Traditional Instruction
Technique: Reassessing the print workbook. Journal of Academic Librarianship. 32, Pp.
632-640.
209. Vardhini, V.P. (1983) Development of Multimedia Instructional Strategy for Teaching
Science at Secondary Level. In M.B. Buch (Ed.), Fourth Survey of Research in Education
(1994). New Delhi: NCERT.
210. Varghese, R.T. (1981). Comparison of Teacher Assisted Programmed Approach with
Textbook Approach in the Teaching of Biology in High Schools of Keral. Un-Published M.Ed.
Dissertation. University of Keral.
211. Vedensyagam, E.G. (1988) Teaching Technology for College Teachers. New Delhi: Sterling
Publishers Private Ltd.,
212. Veenakumar, (1998) Media Options for Teachers. New Delhi: Atlantic Publishers and
Distributors.
213. Wan Fatimah, et al. (2006) Development of a Multimedia Courseware for Visualization on
Teaching and Learning: Area and Volume Proceedings of 19th Malaysian Educational
Technology Convention, Pp. 220-224.
214. Wang, Ling. (2008) Developing and Evaluating an Interactive Multimedia Instructional
Tool: Learning Outcomes and User Experiences of Optometry Students. Journal of
Educational Multimedia and Hypermedia. 4, Pp. 98-106.
215. Watts, N. (1997) A Learner Based Design Model for Interactive Multimedia Language
Learning Packages. Washington DC: ERIC Information Services.
216. Whatannarang, K. (2002) The Effects of Internet-Based Teaching and Learning System on
Learners. Retrieved from http://www.thefreelibrary.com
217. Whetzel, D. and Felker, D. (1996) A Real World Comparison of the Effectiveness of Satellite
Training and Classroom Training. Educational Technology Research and Development,
Retrieved from http://www.aect.org
218. White, Andrew Charles (1998) Students Use of Technology in an Interdisciplinary
Multimedia Course and the Implication for Teaching Multimedia Technology. Dissertation
Abstracts International, 59(2), p. 118.
219. Willis, J. (1995) A Recursive, Reflective Instructional Design Model Based on Constructivist
Interpretive Theory. Educational Technology, 35(6), pp. 5-23.
220. Willis, J. (2000) The Maturing of Constructivist Instructional Design: Some Basic Principles
that can Guide Practice. Educational Technology, 40(1), Pp. 5-16.
255
221. Wilson, B. (1997) Reflections on constructivism and instructional design. In C. Dills and A.
Romiszowski (Eds.), Instructional Development Paradigms. Englewood Cliffs, NJ:
Educational Technology Publications.
222. Wilson, B. G. (1993). Constructivism and Instructional Design: Some Personal Reflections.
Proceedings of Selected Research and Development Presentations at the Convention of
the Association for Educational Communications and Technology Sponsored by the
Research and Theory Division. 15th, New Orleans, Louisiana, January Pp. 13-14.
223. Windelspecht, Michael. (2001) Technology in the Freshmen Biology Classroom: Breaking
the Dual Learning Curve. The American Biology Teacher, 63(2), Pp. 96-101.
224. Wolf, M. (1993) Mentoring middle-aged women in the classroom. Adult Learning, 4(5), Pp.
8-9.
225. Yasmin, K. et al. (1998) Collaborative Educational Multimedia Design by Children.
Washington DC: ERIC Information Services.
226. Yildiz, R. and Atkins, M. (1993) Evaluating Multimedia Applications. Computers and
Education, 21(1/2), Pp. 133-139.
227. Young, K. (1972) Validation of Individualized Instructional Materials, ERIC Document ED
TMOOI885.
228. YunHee, C. (1991) A Study on the Development of the Coursework for Geography
Education and its Educational Effects under the Viewpoint of Cognitive Approach.
Journal of Geography Education, 25, Pp.1-23.
229. Zhang, P. Aikman, S. and Sun, H.S. (2008) Two Types of Attitudes in ICT Acceptance and
Use. International Journal of Human-Computer Interaction, 24 (7), Pp. 628-648.


![Index [link.springer.com]978-1-4302-4255...NuGet dependency management, 112, 114 jQuery.Validation package, 113 Microsoft jQuery Unobtrusive Validation package, 112–113 package installation,](https://img.pdfslide.net/doc/110x75/611e581fab5d6409d83688a7/index-link-978-1-4302-4255-nuget-dependency-management-112-114-jqueryvalidation.jpg)


![7547643 Validation of Debt Package Payoff Balance 01102003[1#2]](https://img.pdfslide.net/doc/110x75/577d34ca1a28ab3a6b8edd2e/7547643-validation-of-debt-package-payoff-balance-0110200312.jpg)