Embed Size (px)
Citation preview
Discovering Favourable Gene Resources for Crop Improvement
Ruilian [email protected]
The National Key Facility for Crop Gene Resources and Genetic Improvement/Institute of Crop ScienceChinese Academy of Agricultural Sciences (CAAS)
Development of Agricultural Science
Specific Topic for Student Abroad • Oct. 20, 2011
Why ?Where ?How ?
Phenotyping Genotyping Utilization
Outline
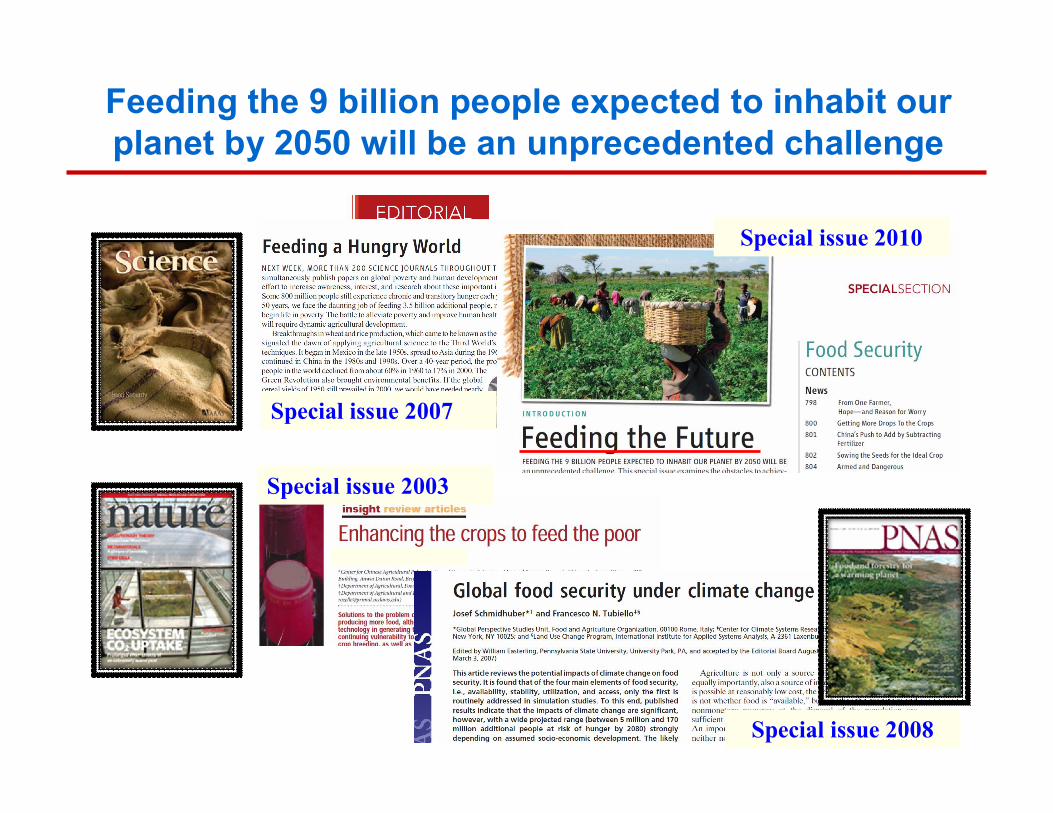
Special issue 2007
Special issue 2010
Special issue 2008
Special issue 2003
Feeding the 9 billion people expected to inhabit our planet by 2050 will be an unprecedented challenge

“Take one world already being exhausted by 6 billion people. Find the ingredients to feed another 2 billion people. Add demand for more food, more animal feed and more fuel. Use only the same amount of water the planet has had since creation. And don’t forget to restore the environment that sustains us. Stir very carefully.”
Margaret Catley-Carlson2008-2009 Chair of World Economic Forum Global Agenda Council on Water Security
World Economic Forum, DavosJanuary 2009
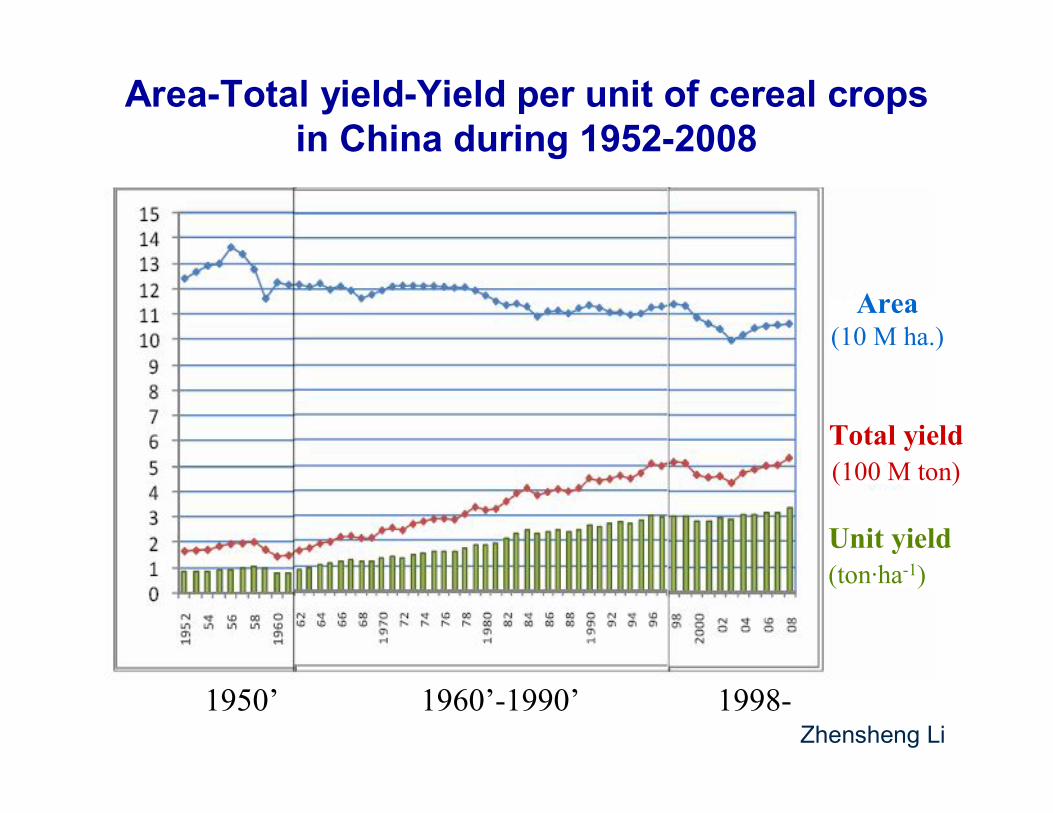
1950’ 1960’-1990’ 1998-
Area(10 M ha.)
Total yield(100 M ton)
Area-Total yield-Yield per unit of cereal crops in China during 1952-2008
Zhensheng Li
Unit yield(ton·ha-1)
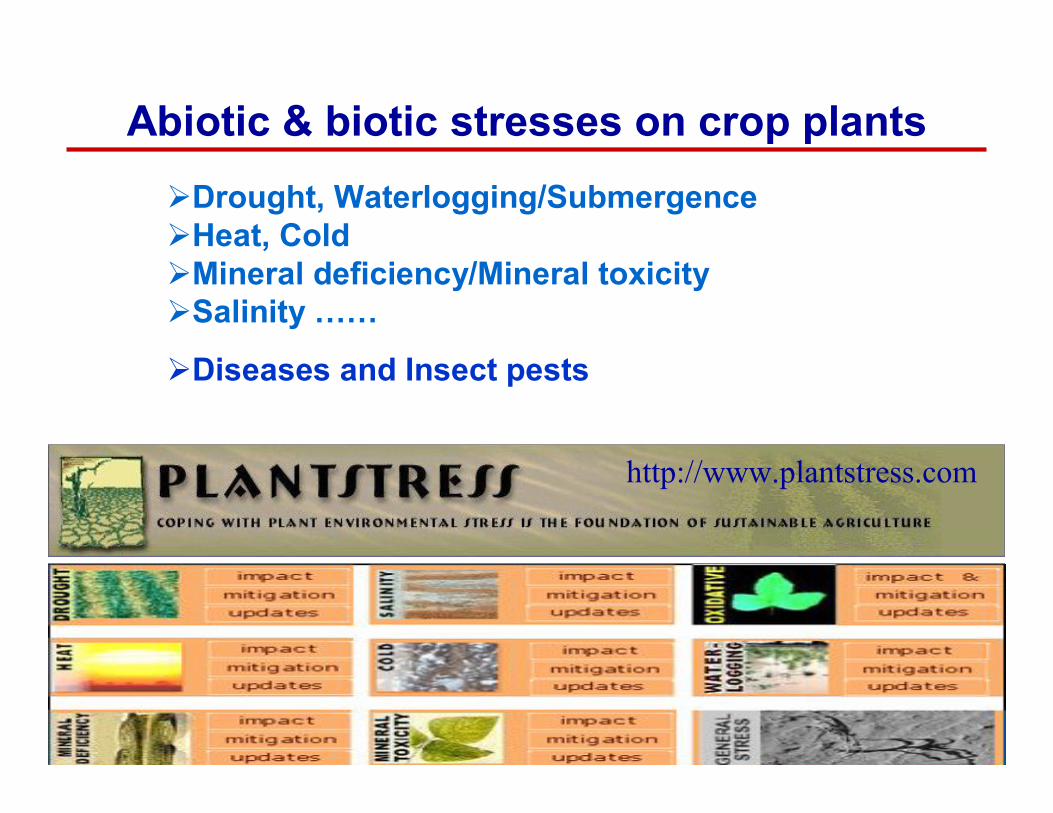
Abiotic & biotic stresses on crop plantsDrought, Waterlogging/SubmergenceHeat, ColdMineral deficiency/Mineral toxicitySalinity ……
Diseases and Insect pests
http://www.plantstress.com
To keep pace with food consumer demand, muti-favourable genes should be pyramided in crop cultivars.
To discover favourable gene resources for improving crop plants.
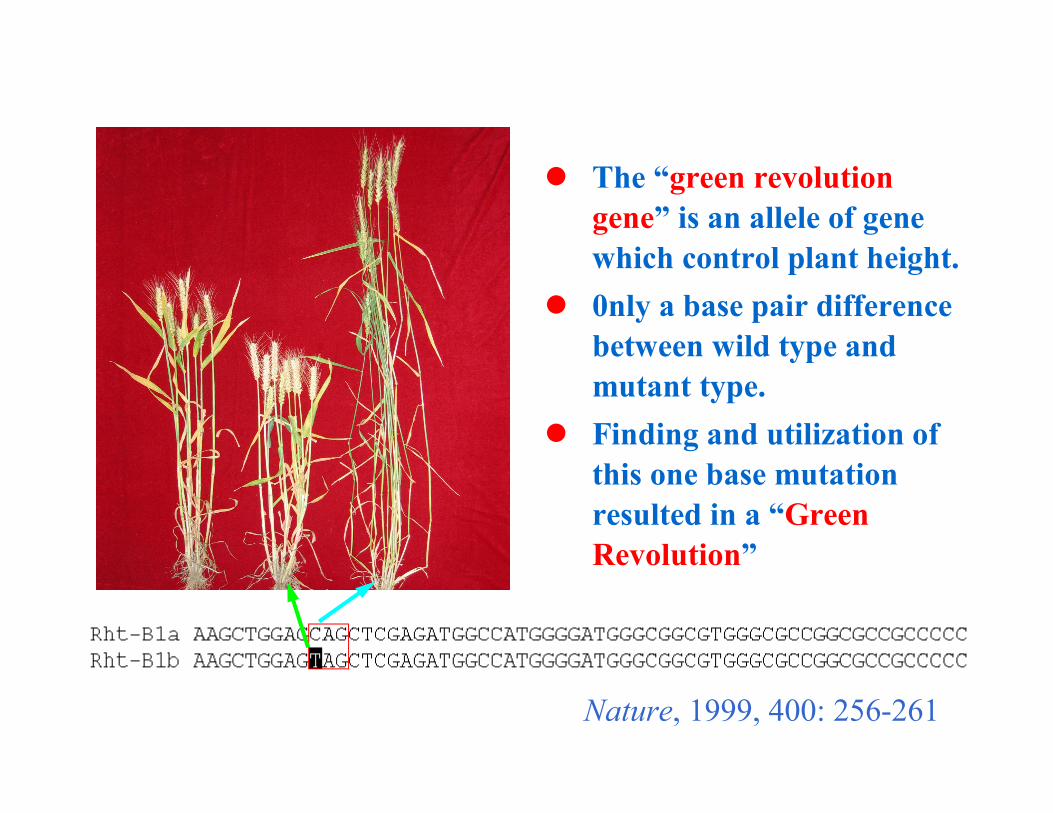
The “green revolution gene” is an allele of gene which control plant height.
0nly a base pair difference between wild type and mutant type.
Finding and utilization of this one base mutation resulted in a “GreenRevolution”
Nature, 1999, 400: 256-261
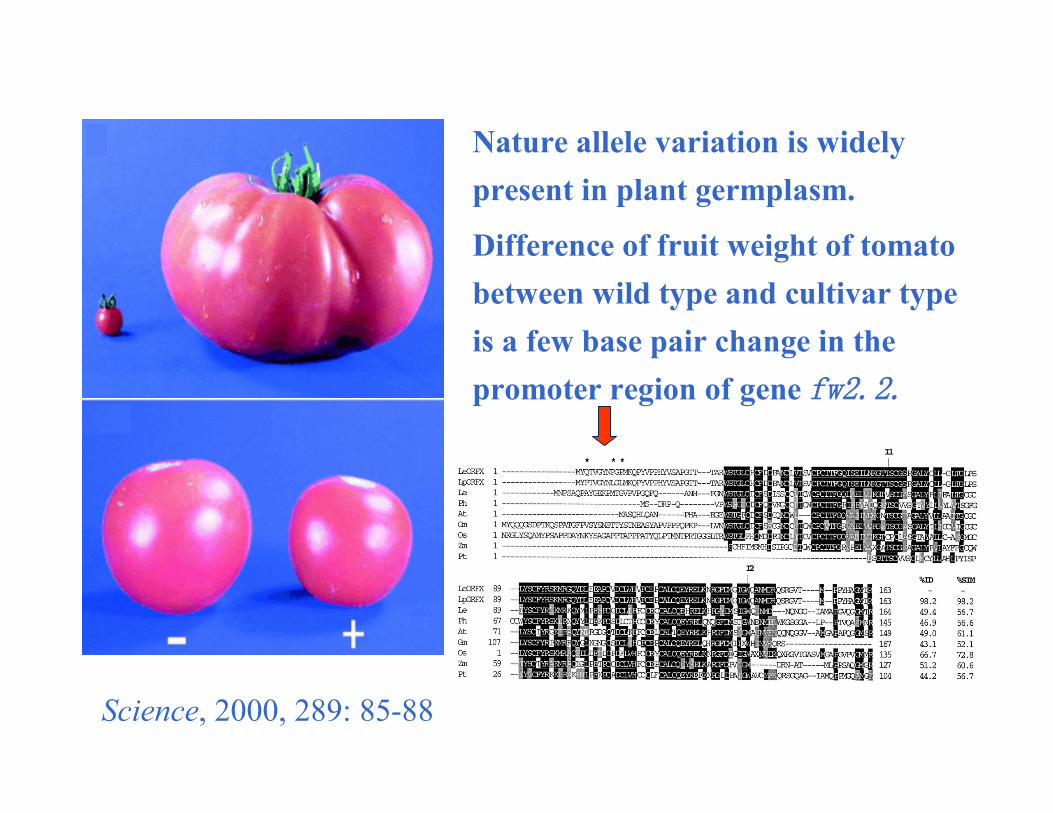
Nature allele variation is widely present in plant germplasm.
Difference of fruit weight of tomato between wild type and cultivar type is a few base pair change in the promoter region of gene fw2.2.
Science, 2000, 289: 85-88
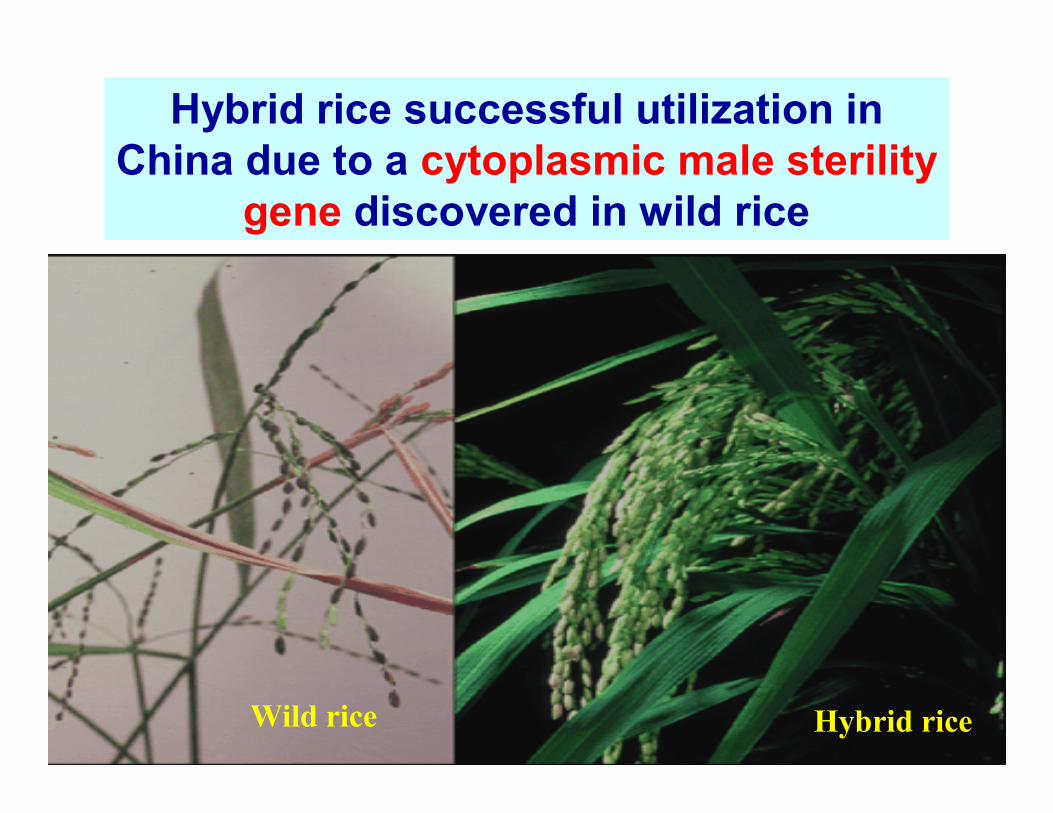
Wild rice Hybrid rice
Hybrid rice successful utilization in China due to a cytoplasmic male sterility
gene discovered in wild rice
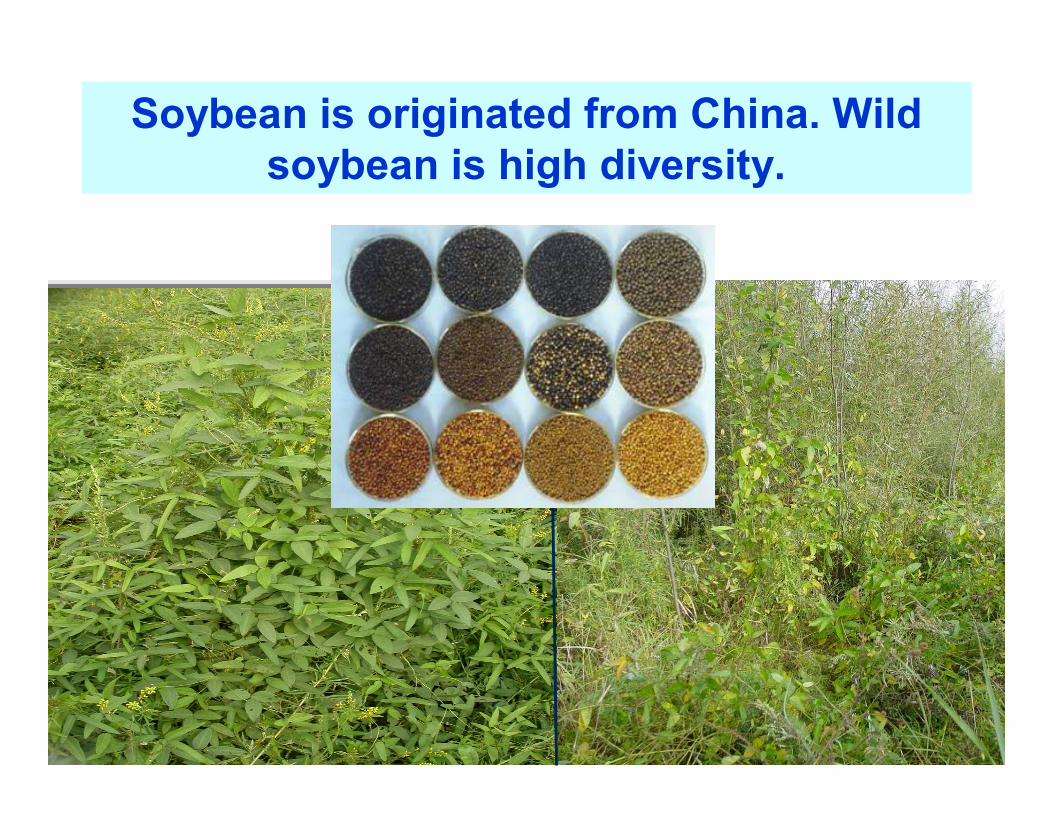
Soybean is originated from China. Wild soybean is high diversity.
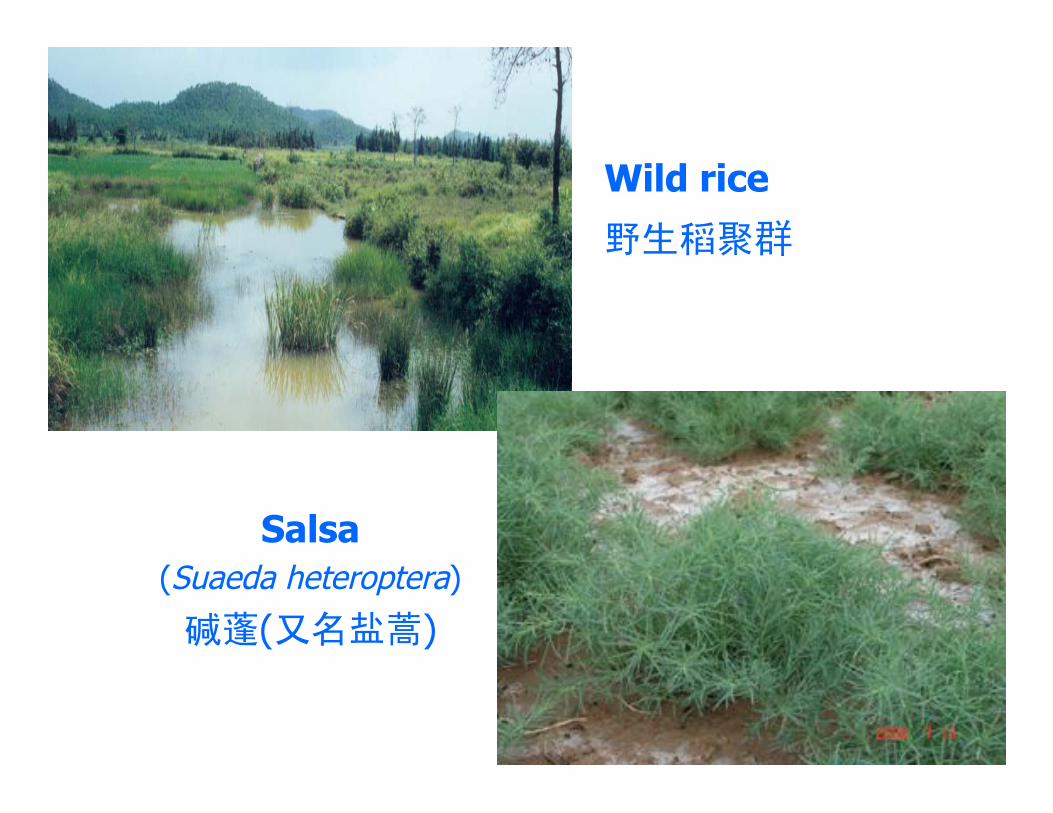
Salsa(Suaeda heteroptera)
碱蓬(又名盐蒿)
Wild rice
野生稻聚群
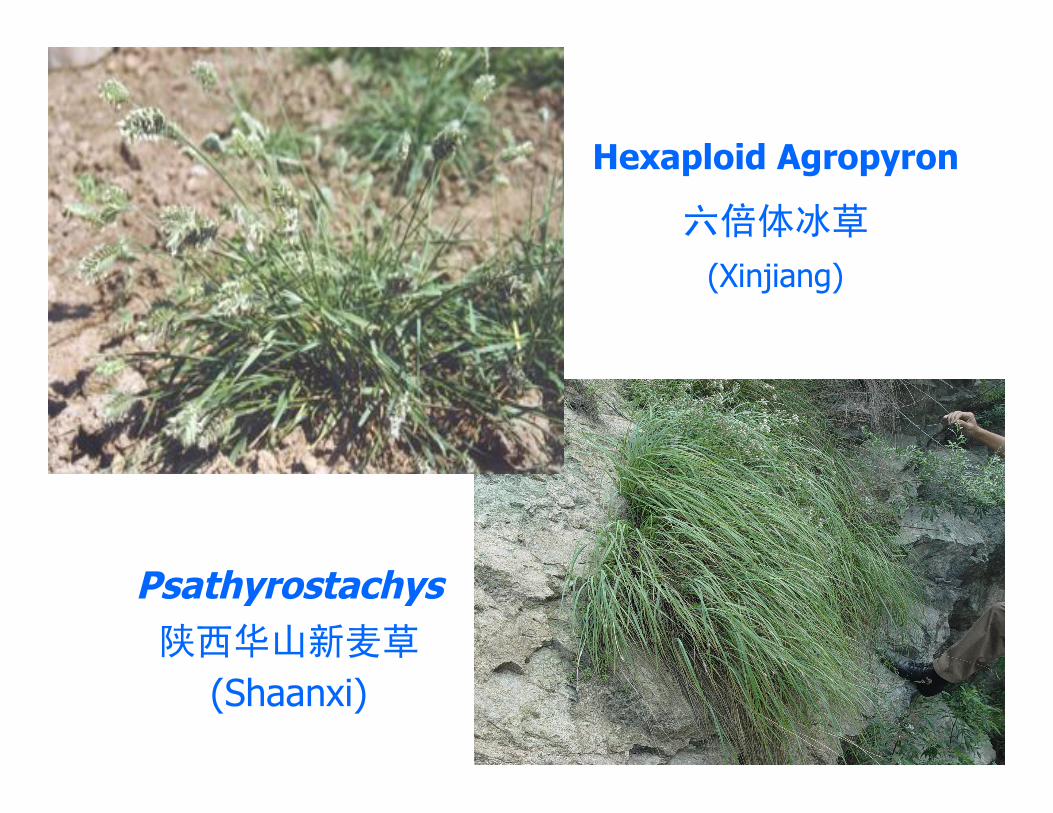
Hexaploid Agropyron
六倍体冰草
(Xinjiang)
Psathyrostachys陕西华山新麦草
(Shaanxi)
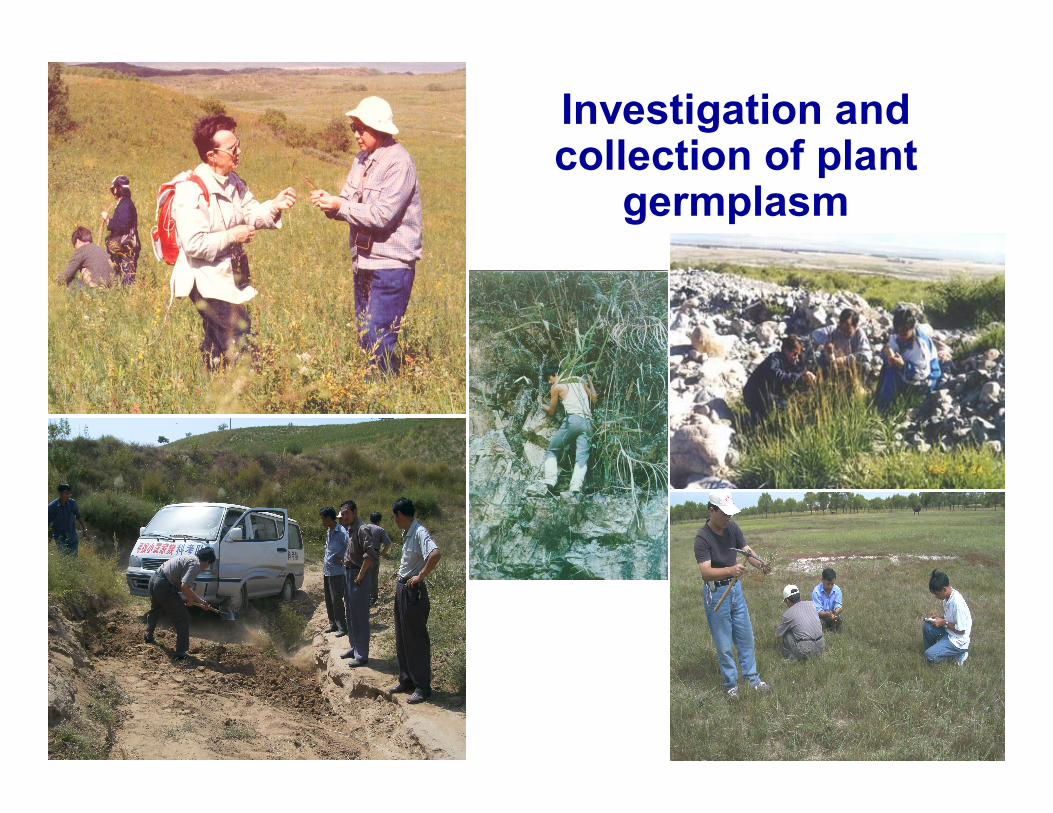
Investigation and collection of plant
germplasm
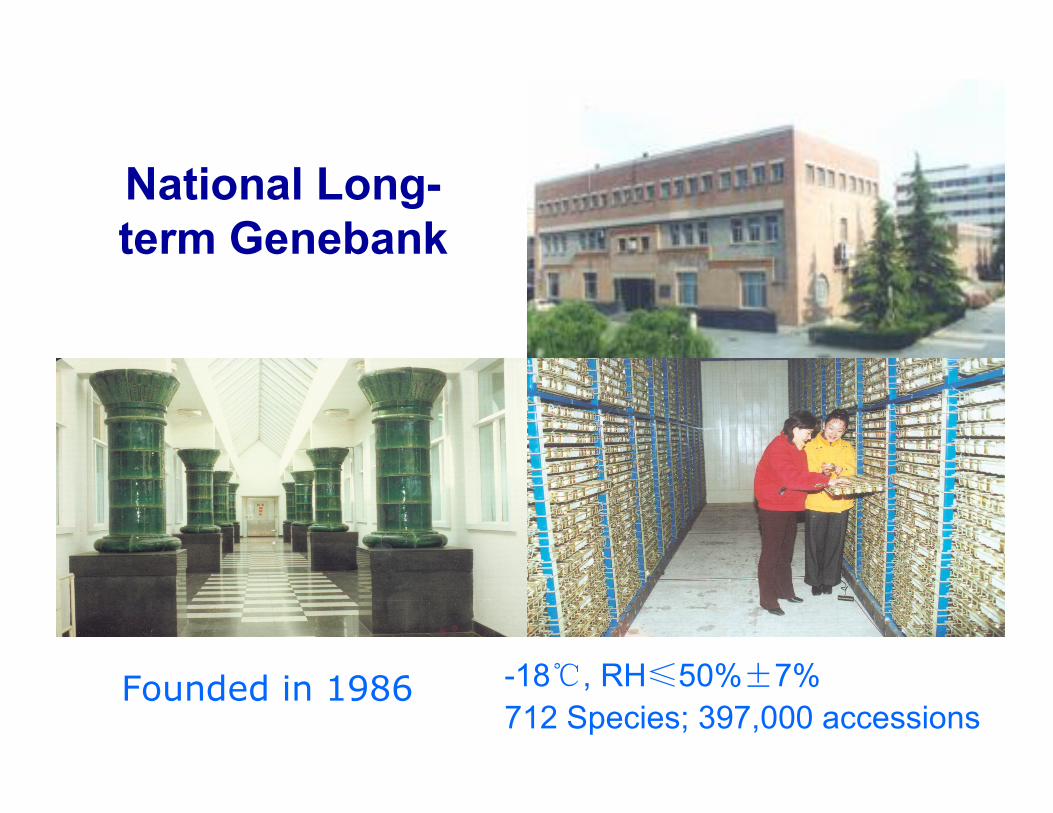
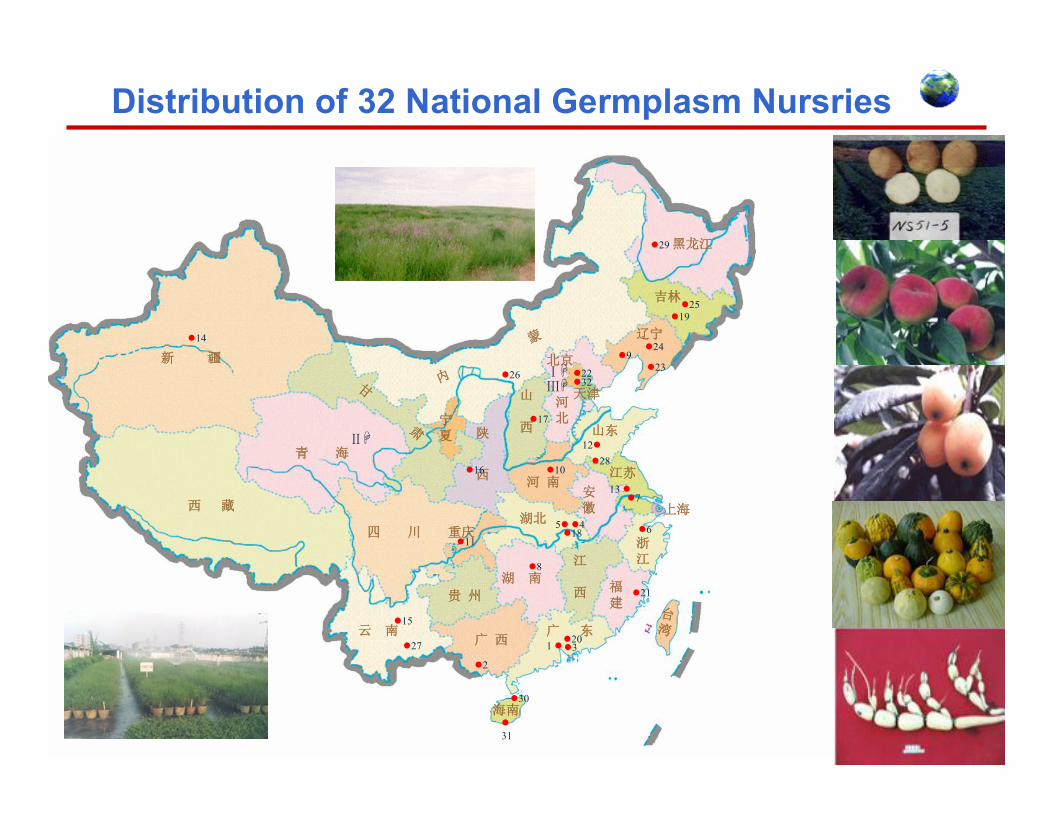
National Long-term Genebank
Founded in 1986 -18℃, RH≤50%±7%712 Species; 397,000 accessions
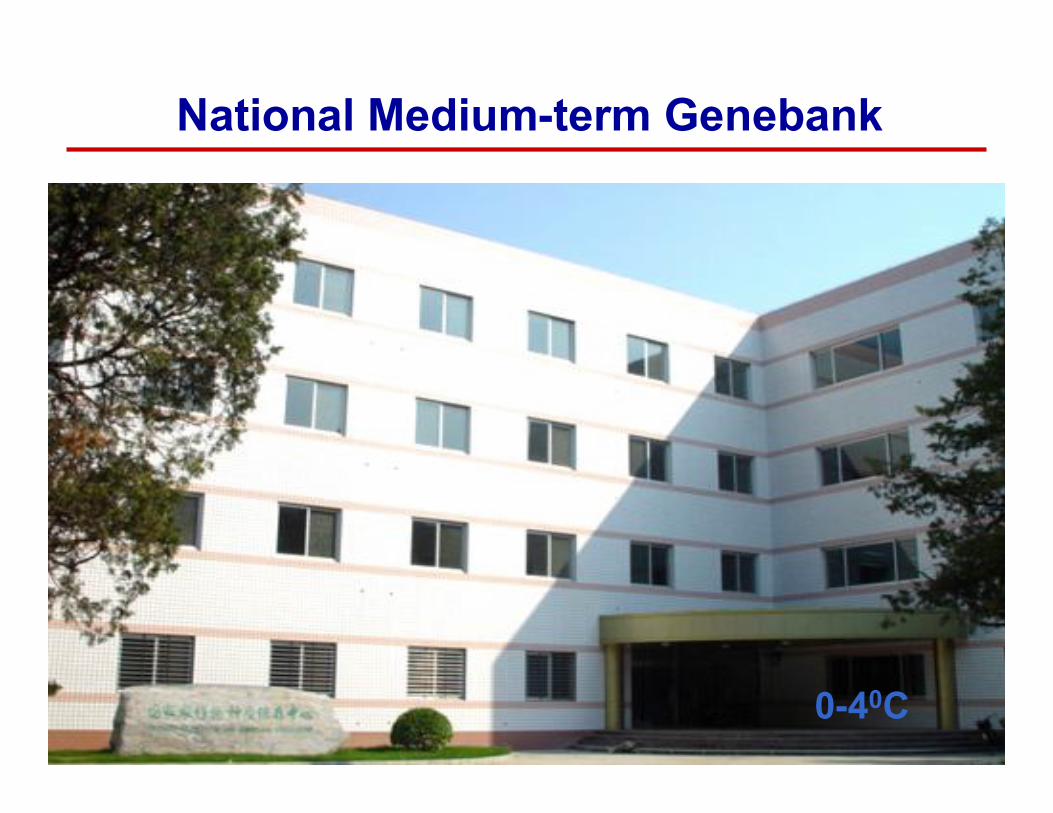
National Medium-term Genebank
0-40C
吉林
内
蒙
新 疆
四 川
青 海
西 藏
云 南 广 东
甘
肃
贵 州
广 西
湖 南
江
西 福建
浙江
湖北
陕
西河 南
安徽
江苏
山东
山
西
河北
辽宁
海南
台湾
上海
宁夏
天津
北京
黑龙江
南海诸岛
15
ⅢⅠ
Ⅱ
27
30
31
31 20
2
8
4518
116
21
16 10
12
17
14
26 2232
923
24
1925
29
重庆
713
28
图例:
资源库
资源圃
Distribution of 32 National Germplasm Nursries
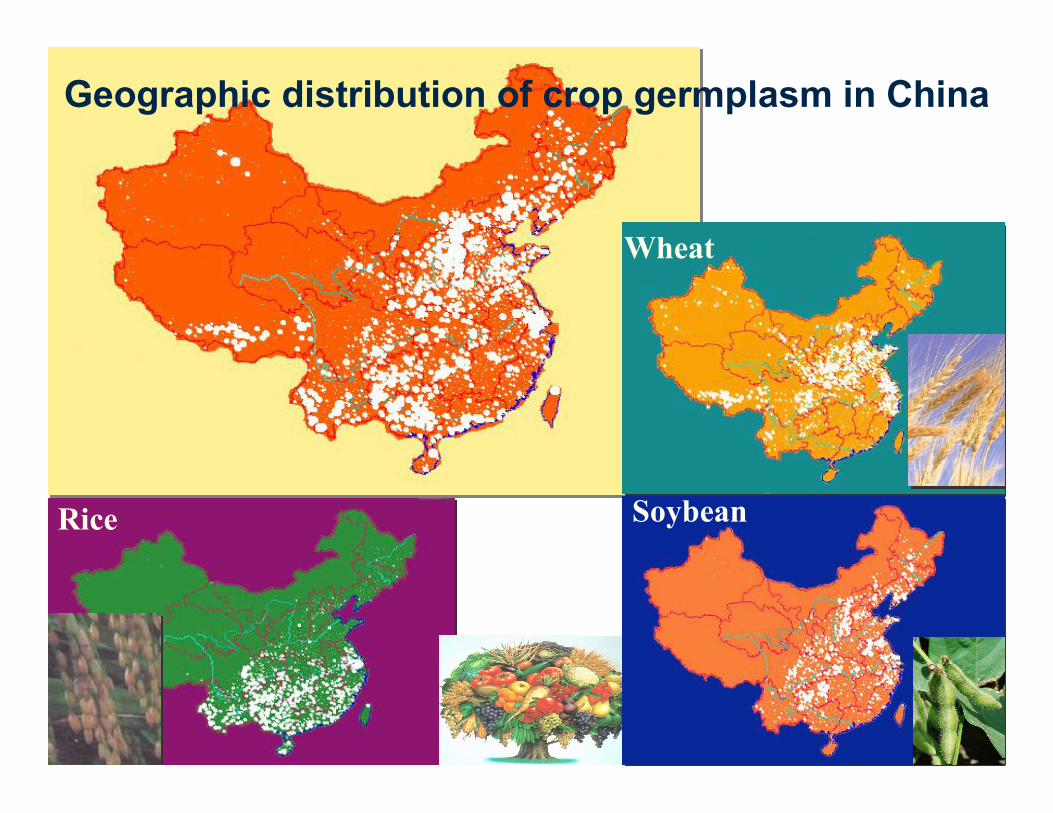
Geographic distribution of crop germplasm in China
Wheat
Rice Soybean
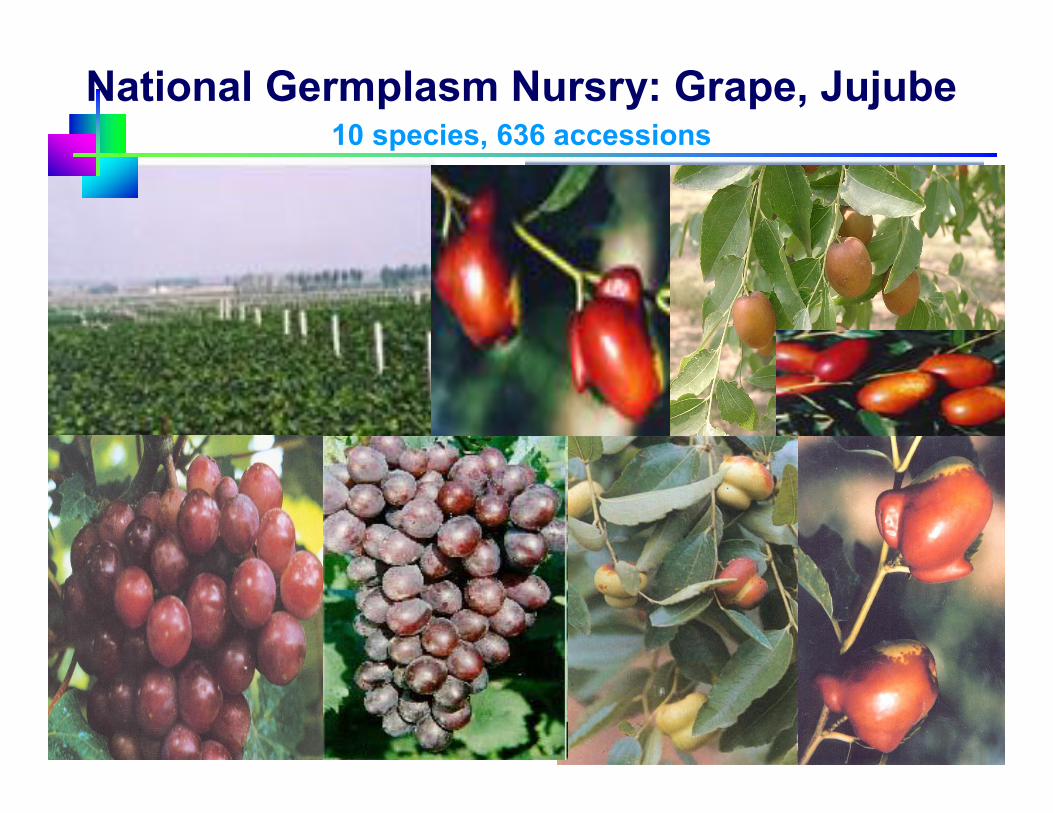
National Germplasm Nursry: Grape, Jujube10 species, 636 accessions
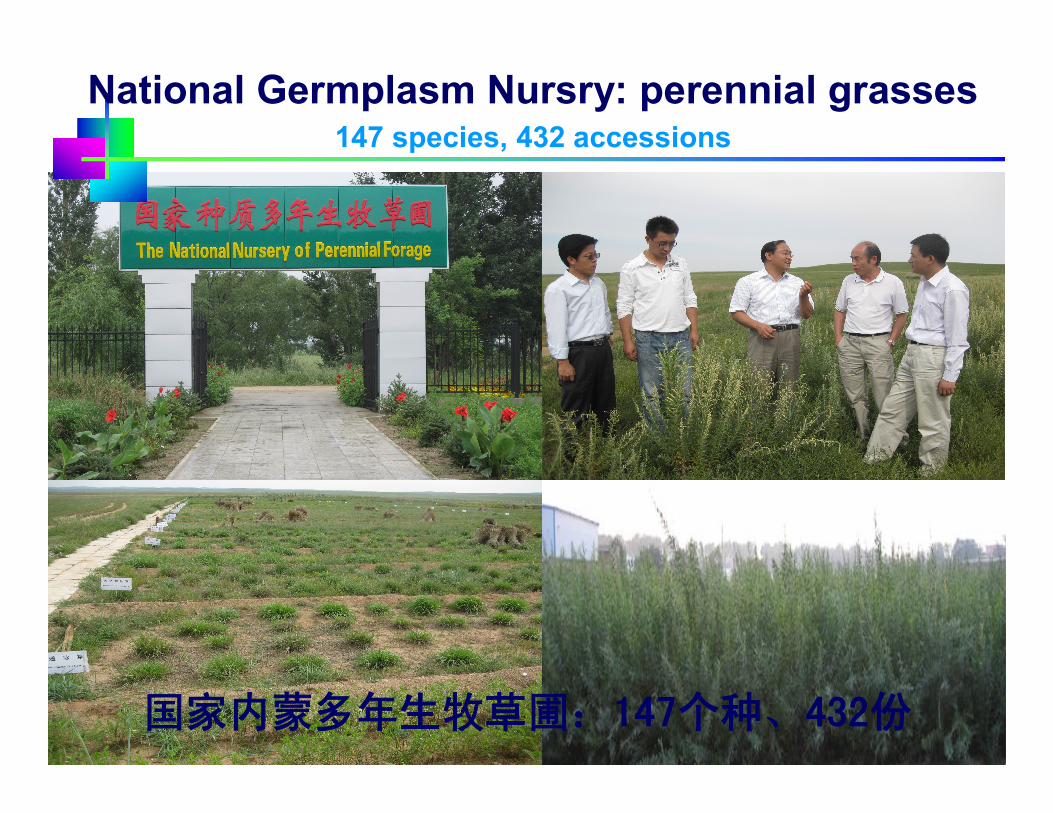
National Germplasm Nursry: perennial grasses147 species, 432 accessions
国家内蒙多年生牧草圃:147个种、432份
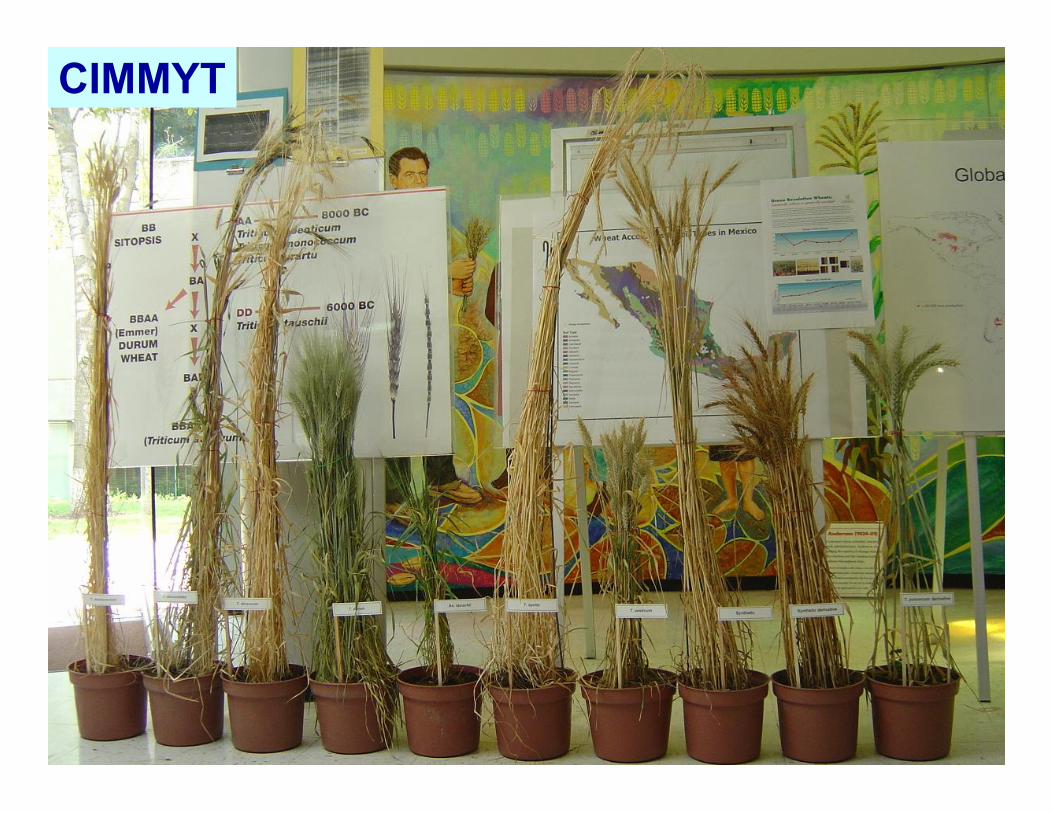
CIMMYT
?
?
???
?
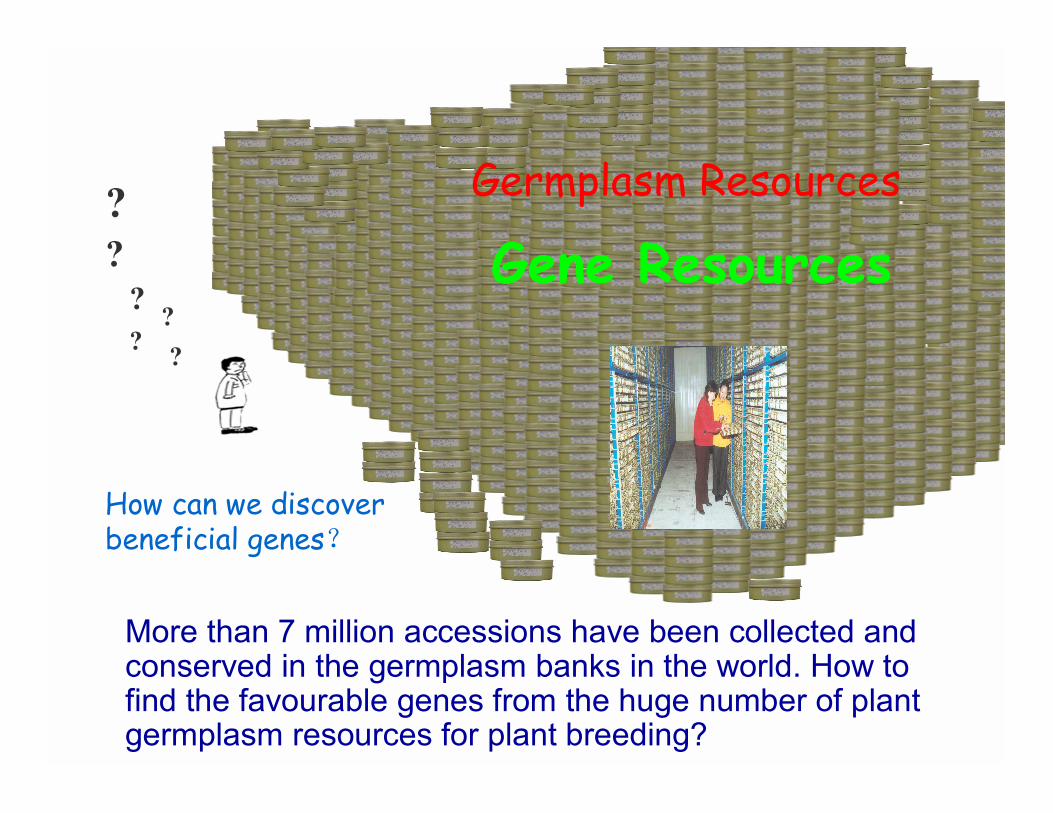
How can we discover beneficial genes?
More than 7 million accessions have been collected and conserved in the germplasm banks in the world. How to find the favourable genes from the huge number of plant germplasm resources for plant breeding?
Germplasm Resources
Gene Resources
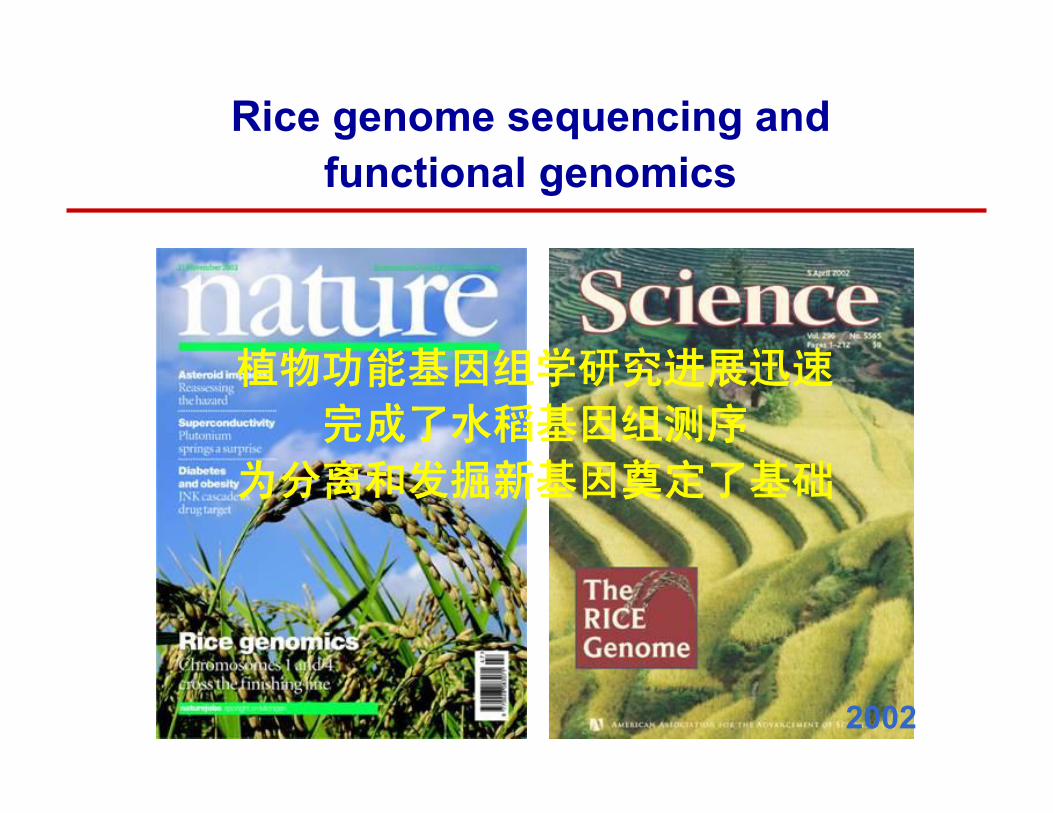
植物功能基因组学研究进展迅速
完成了水稻基因组测序
为分离和发掘新基因奠定了基础
Rice genome sequencing and functional genomics
2002
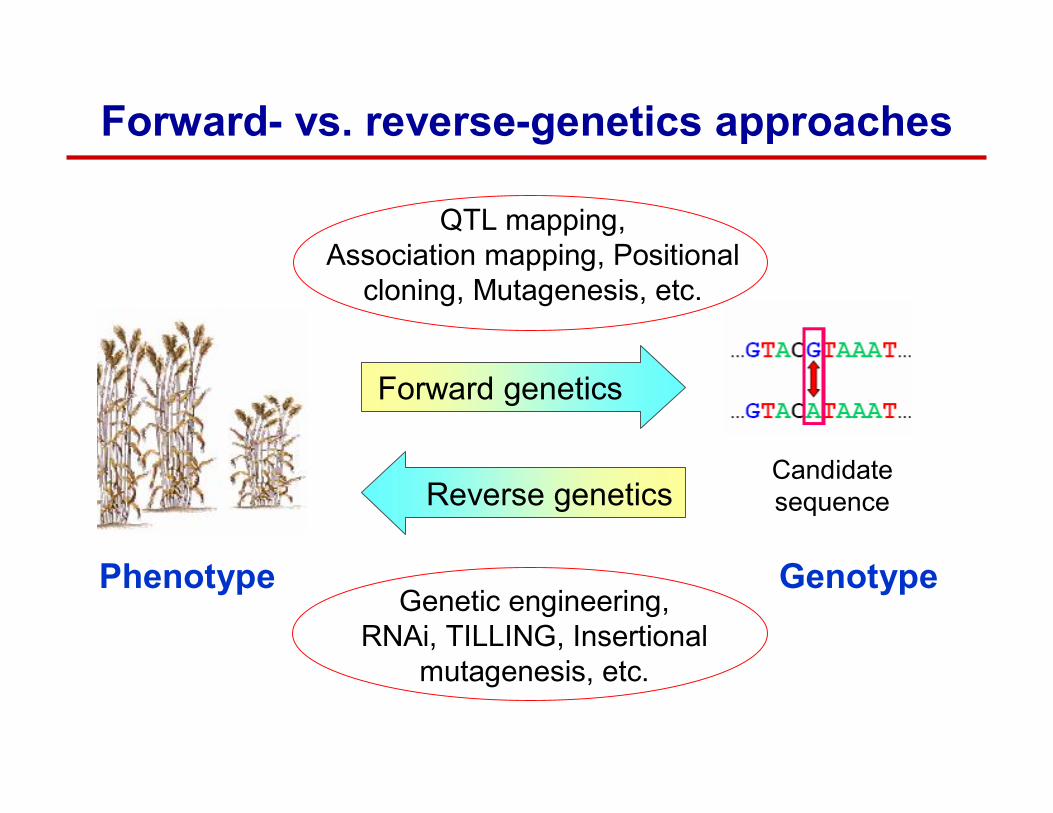
Forward- vs. reverse-genetics approaches
Forward genetics
Reverse geneticsCandidate sequence
QTL mapping, Association mapping, Positional
cloning, Mutagenesis, etc.
Phenotype GenotypeGenetic engineering,
RNAi, TILLING, Insertionalmutagenesis, etc.
Phenotyping
--- base for discovering genes
(Case: drought tolerance)
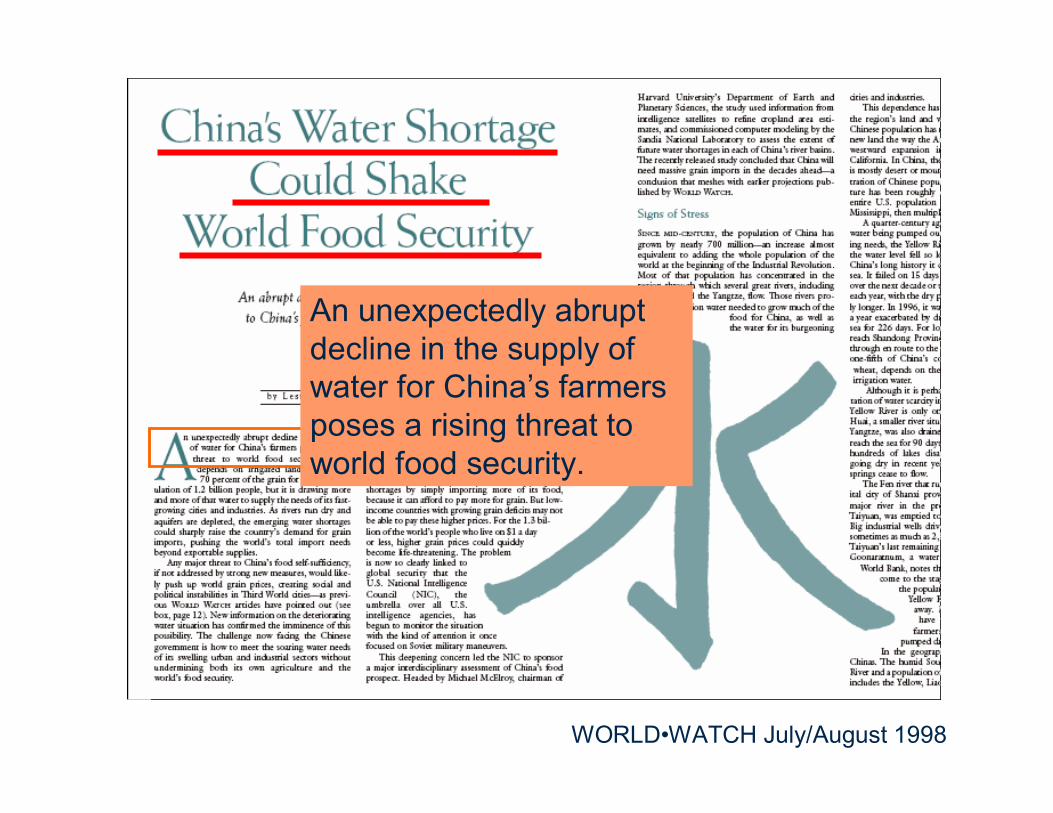
WORLD•WATCH July/August 1998
An unexpectedly abrupt decline in the supply of water for China’s farmers poses a rising threat to world food security.
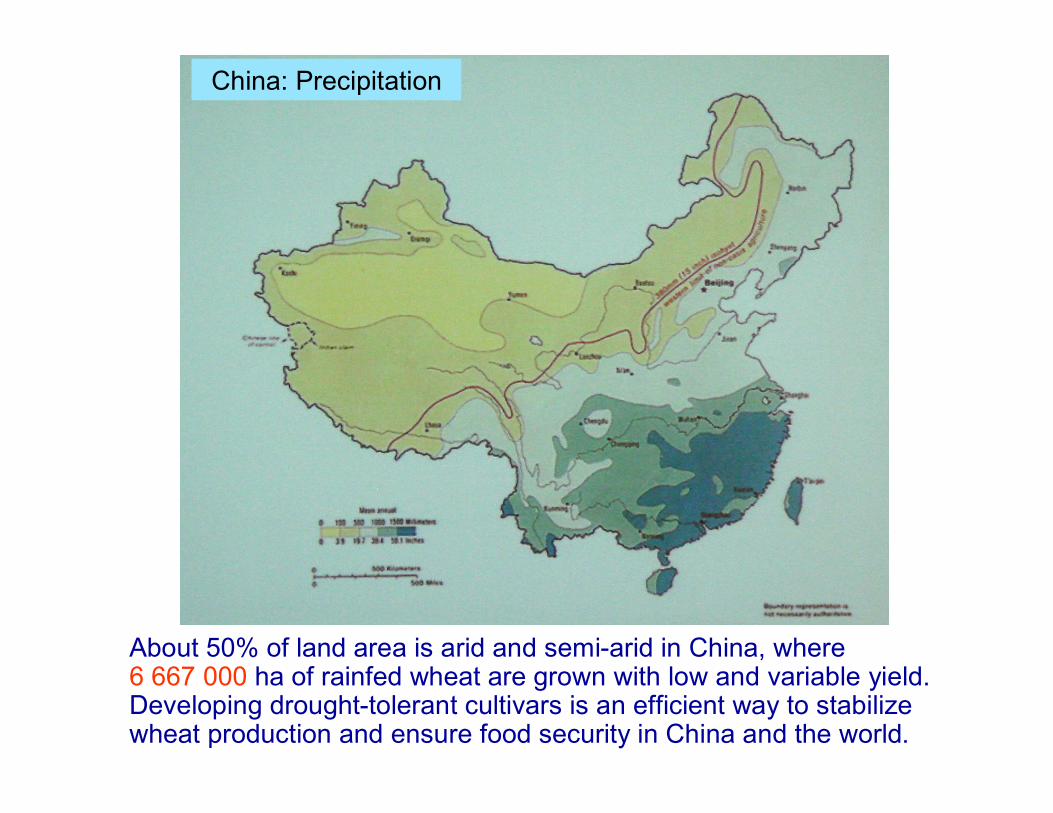
China: Precipitation
About 50% of land area is arid and semi-arid in China, where 6 667 000 ha of rainfed wheat are grown with low and variable yield. Developing drought-tolerant cultivars is an efficient way to stabilize wheat production and ensure food security in China and the world.
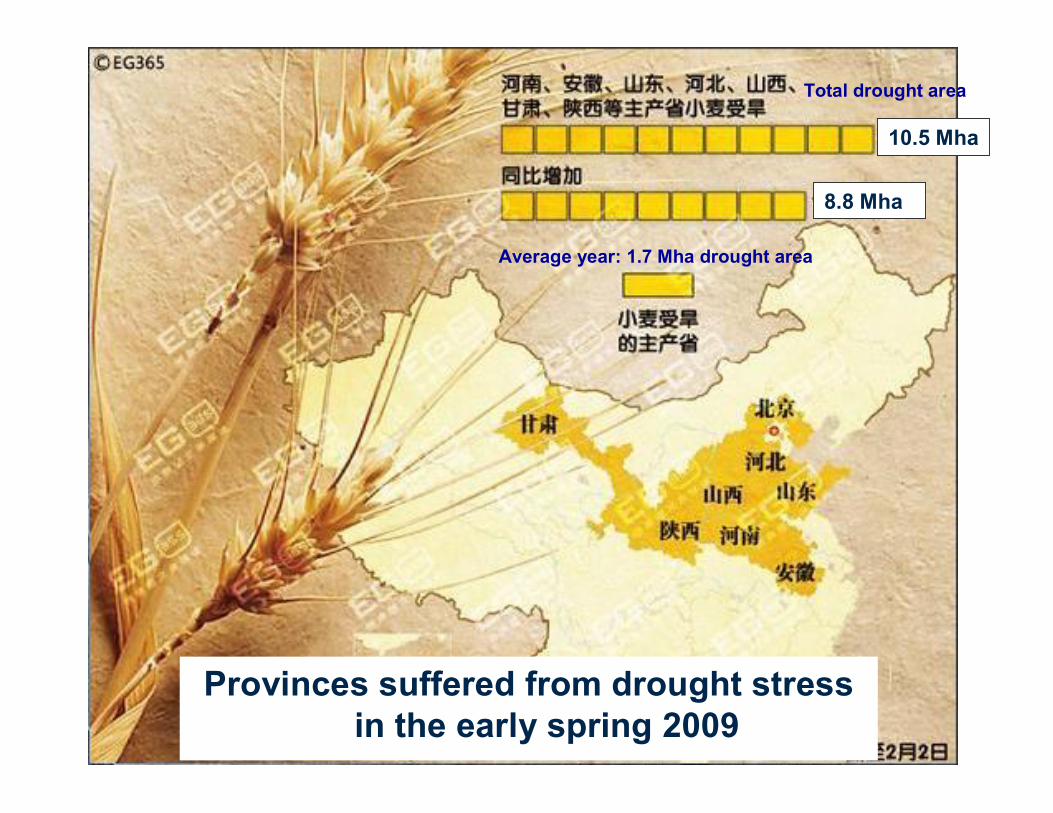
10.5 Mha
8.8 Mha
Provinces suffered from drought stress in the early spring 2009
Total drought area
Average year: 1.7 Mha drought area
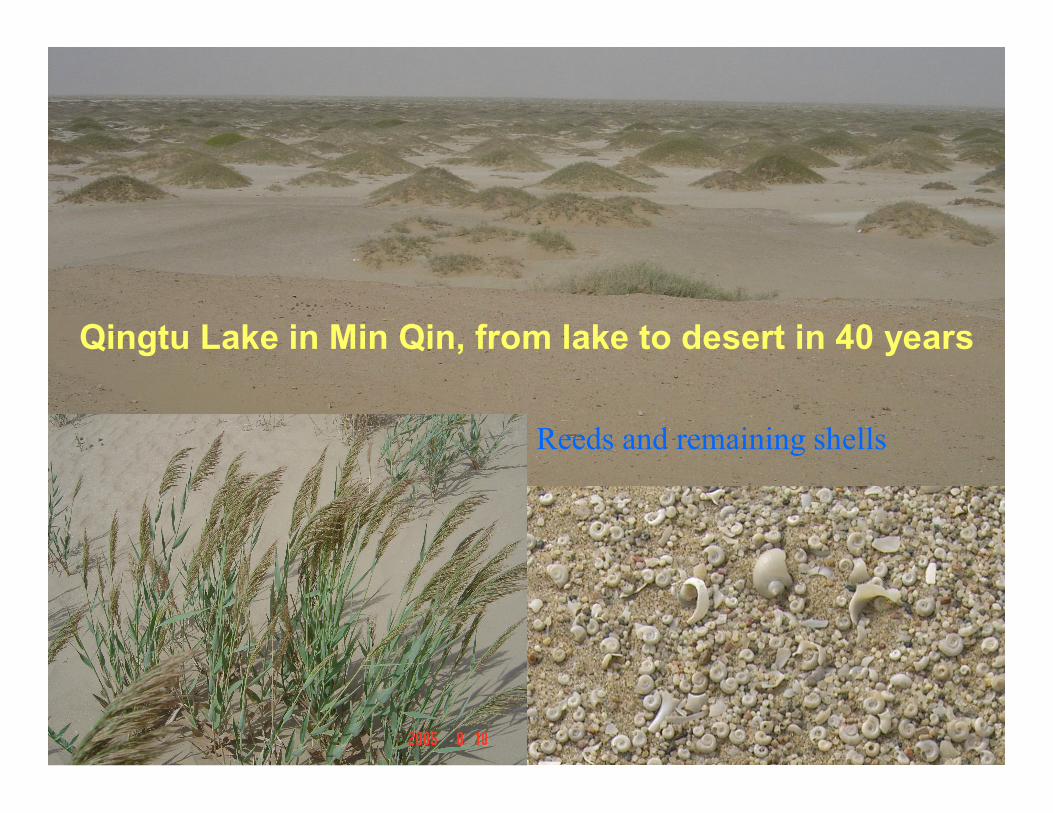
Qingtu Lake in Min Qin, from lake to desert in 40 years
Reeds and remaining shells
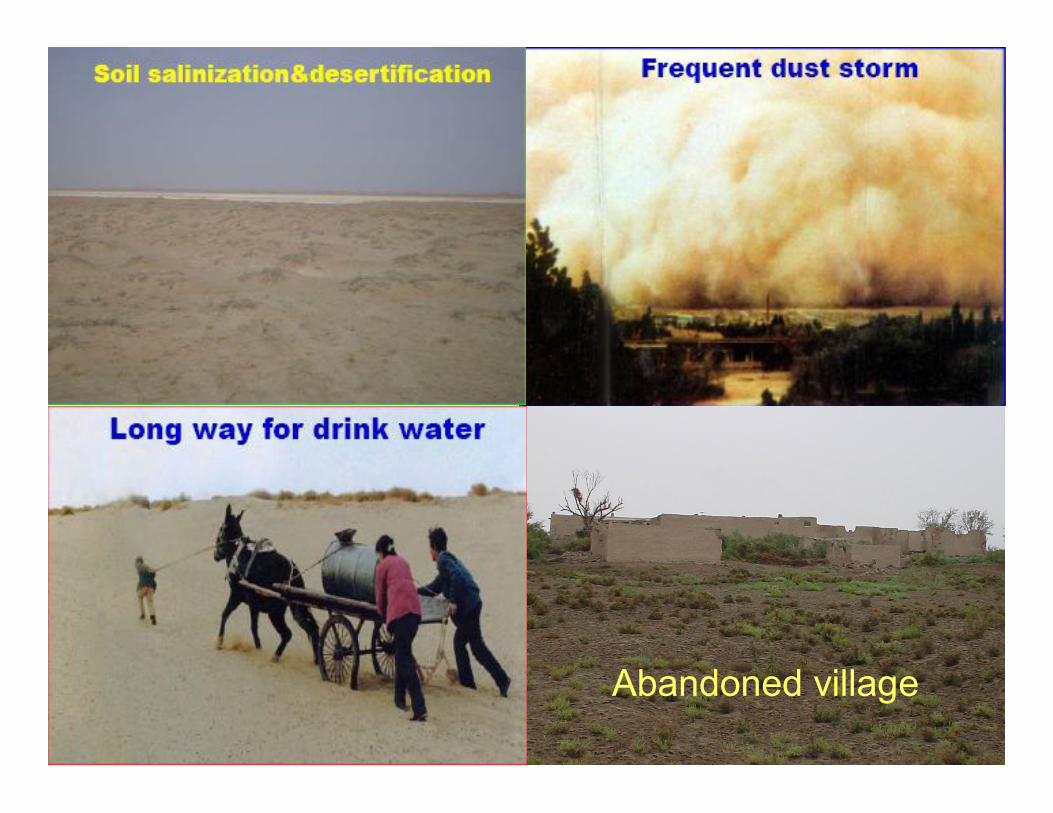
Abandoned village
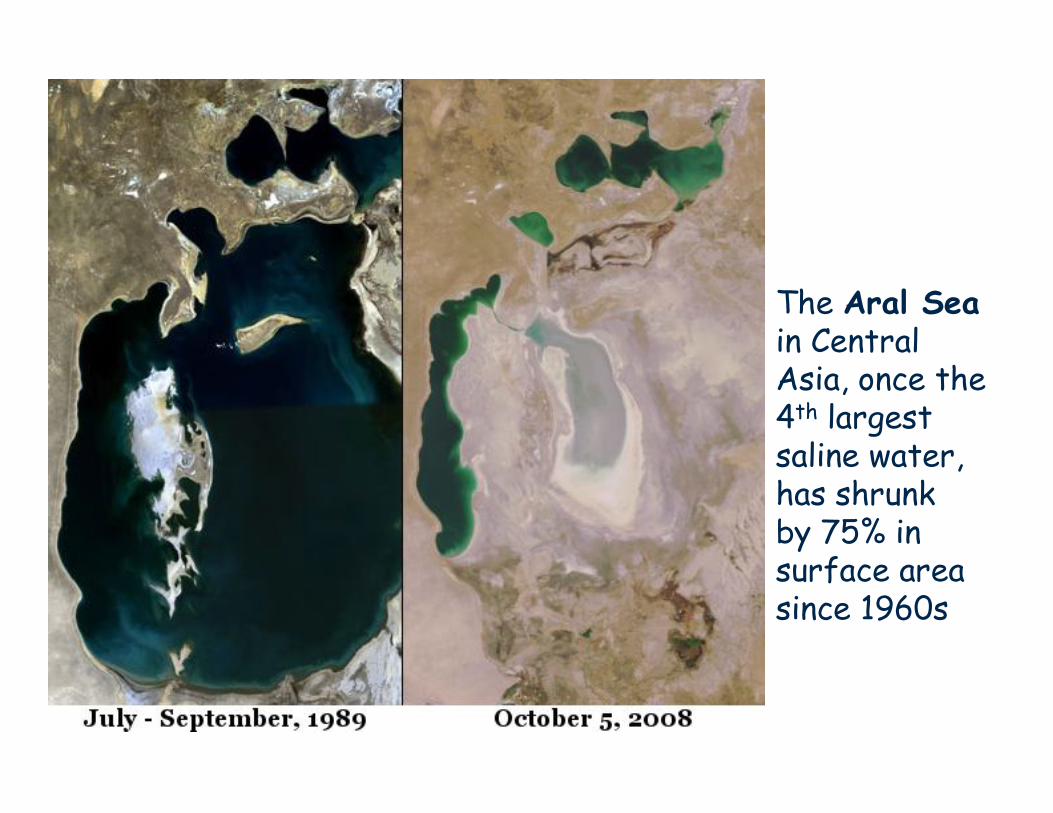
The Aral Seain Central Asia, once the 4th largest saline water, has shrunk by 75% in surface area since 1960s
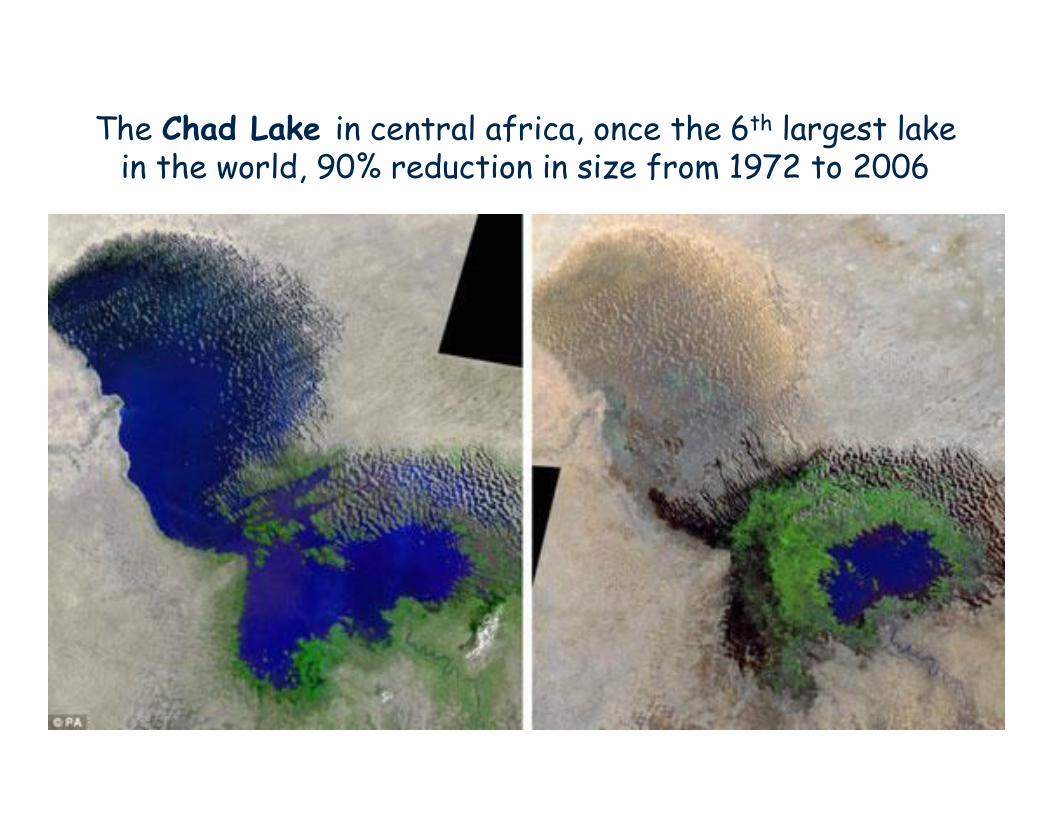
The Chad Lake in central africa, once the 6th largest lake in the world, 90% reduction in size from 1972 to 2006
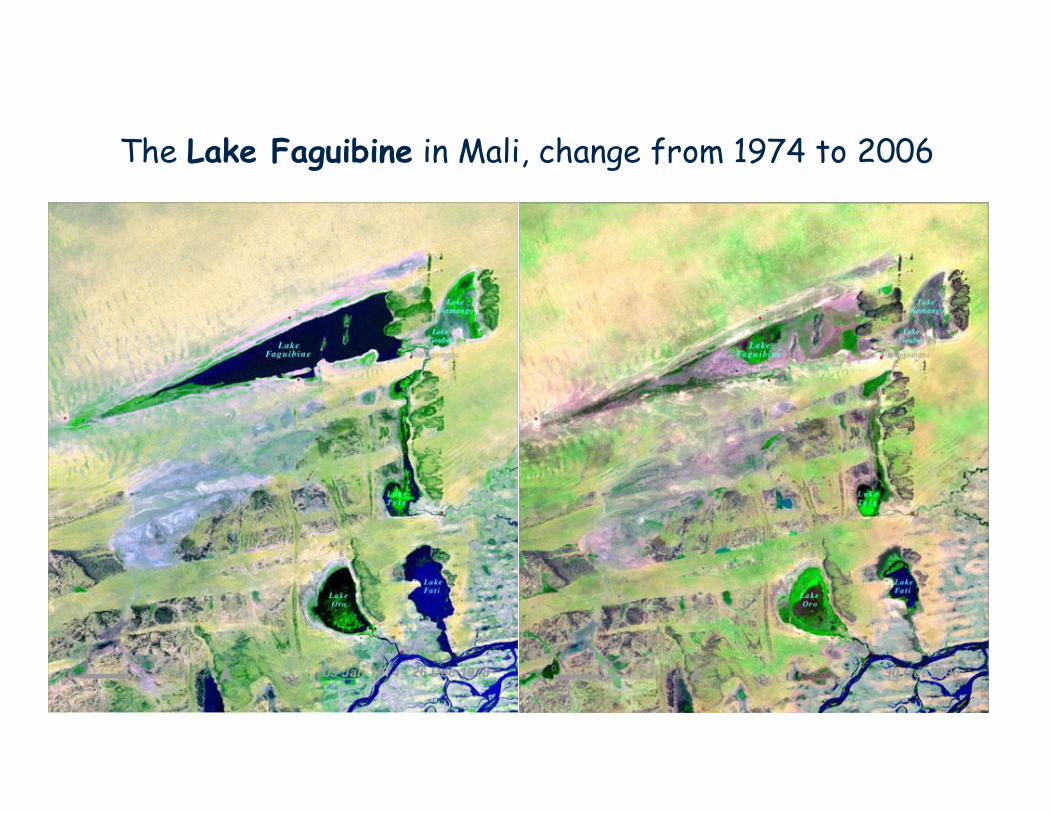
The Lake Faguibine in Mali, change from 1974 to 2006
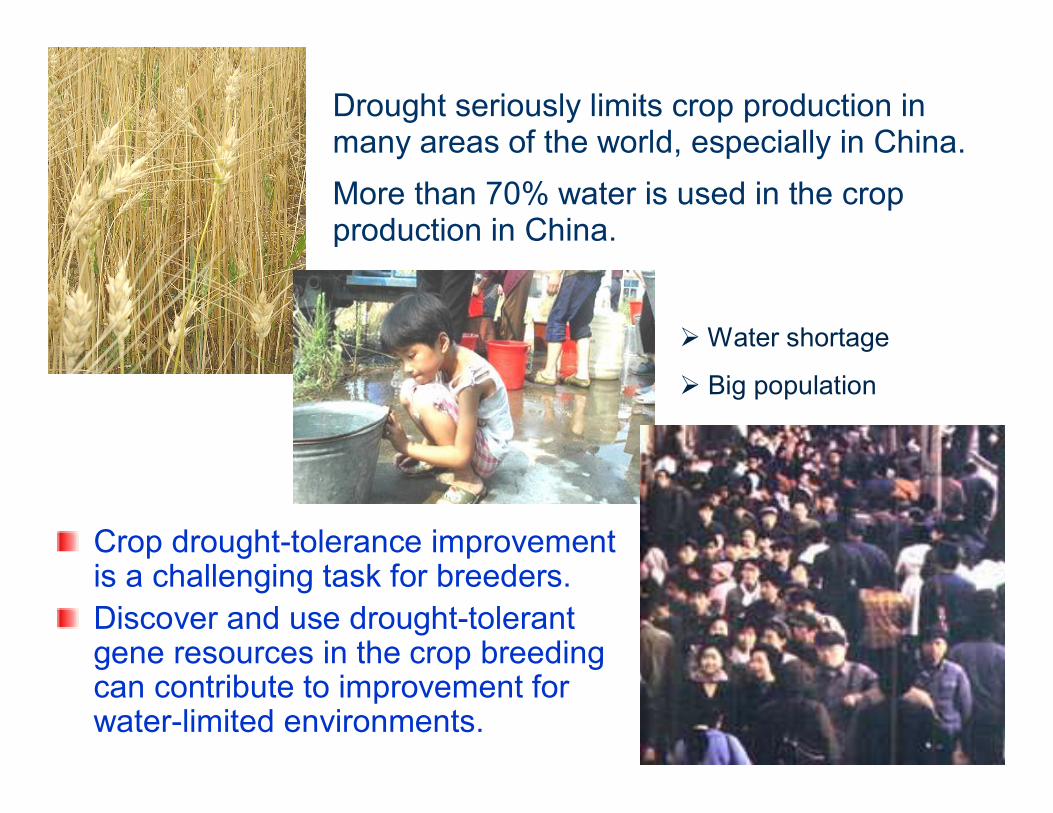
Drought seriously limits crop production in many areas of the world, especially in China.More than 70% water is used in the crop production in China.
Water shortage
Big population
Crop drought-tolerance improvement is a challenging task for breeders. Discover and use drought-tolerant gene resources in the crop breeding can contribute to improvement for water-limited environments.
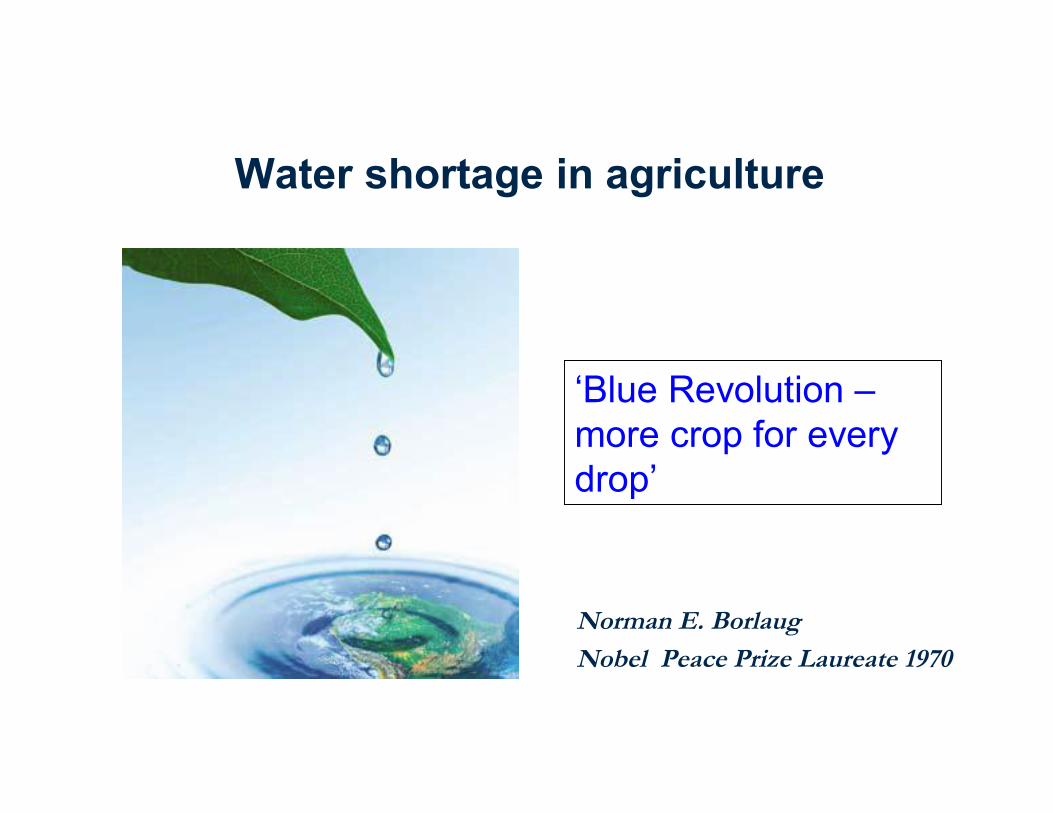
‘Blue Revolution –more crop for every drop’
Water shortage in agriculture
Norman E. BorlaugNobel Peace Prize Laureate 1970
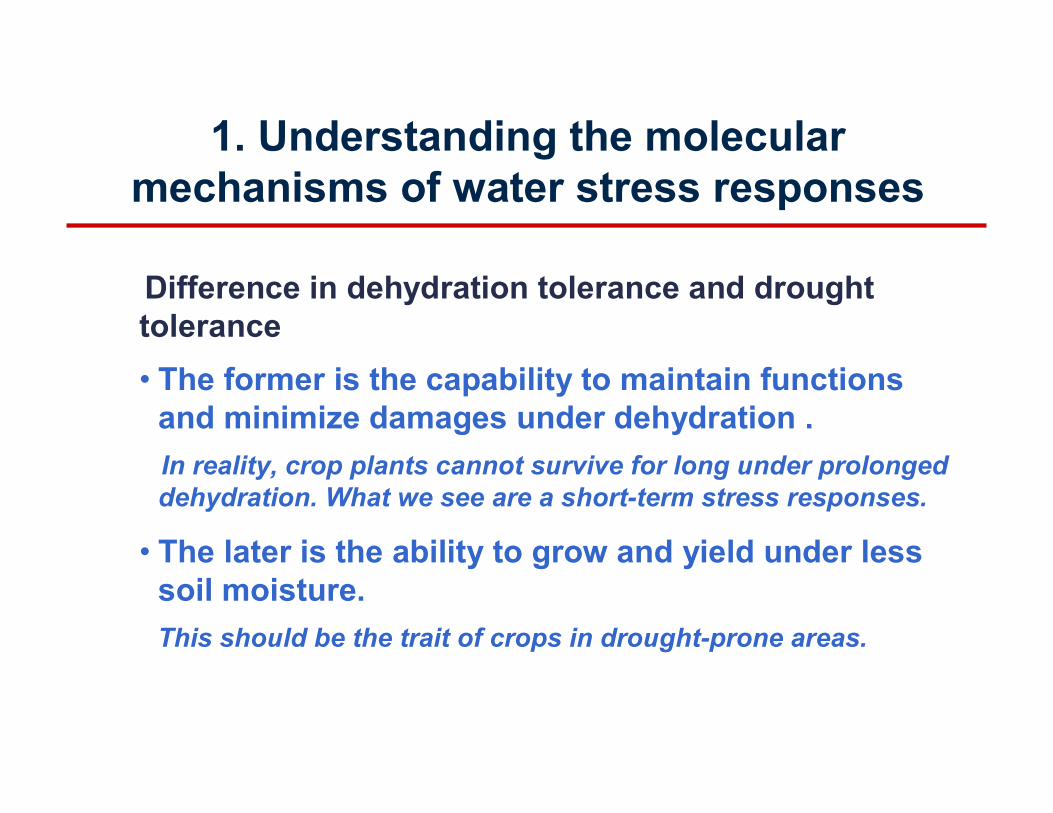
Difference in dehydration tolerance and drought tolerance• The former is the capability to maintain functions
and minimize damages under dehydration .In reality, crop plants cannot survive for long under prolonged dehydration. What we see are a short-term stress responses.
• The later is the ability to grow and yield under less soil moisture.This should be the trait of crops in drought-prone areas.
1. Understanding the molecular mechanisms of water stress responses
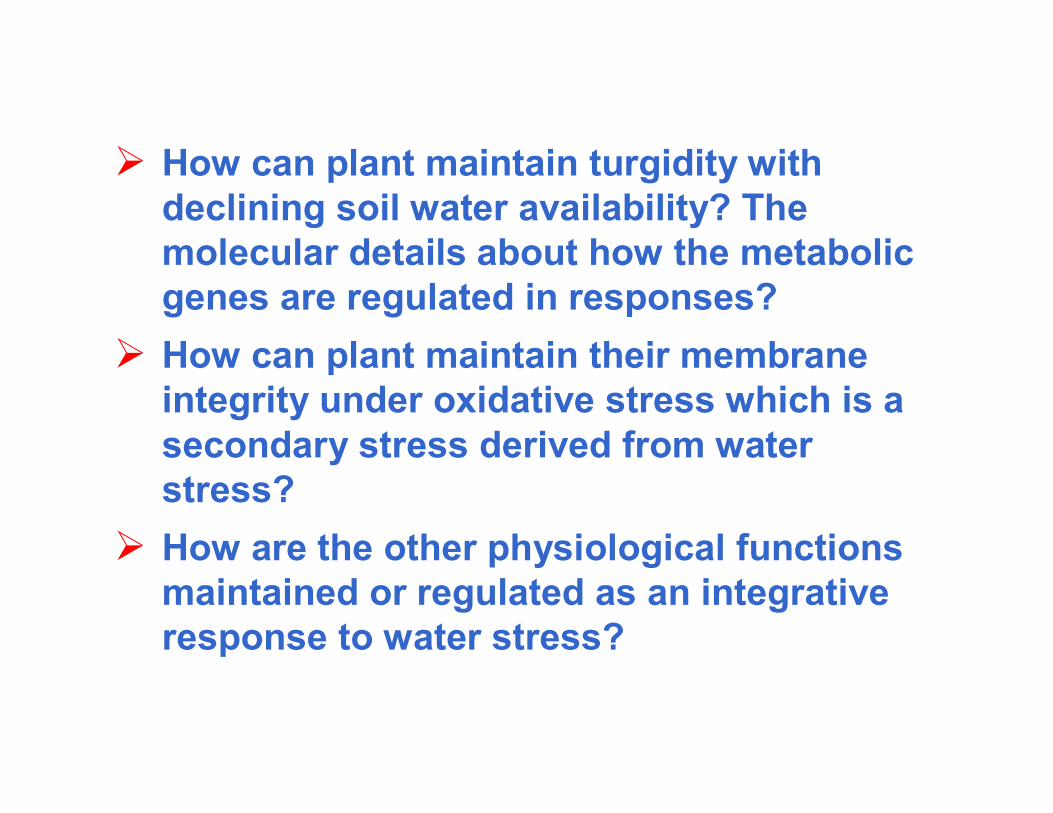
How can plant maintain turgidity with declining soil water availability? The molecular details about how the metabolic genes are regulated in responses?
How can plant maintain their membrane integrity under oxidative stress which is a secondary stress derived from water stress?
How are the other physiological functions maintained or regulated as an integrative response to water stress?
Drought breeding should be localized with specific objectives to specific areas, such as less irrigation, rainfed in semi-arid.Conventional breeding is time consuming and labor costly since it is a natural selection under drought condition. However, large scale gene recombination can be easily achieved.
2. Breeding cultivars to cope with specific objectives
Molecular breeding is more efficient but the available magic drought-resistant genes are very limited. Genes for root traits should be tapped.
Drought tolerance is fundamentally related to the capability to maintain water balance, much less to the ability to tolerate dehydration.
2. Breeding cultivars to cope with specific objectives
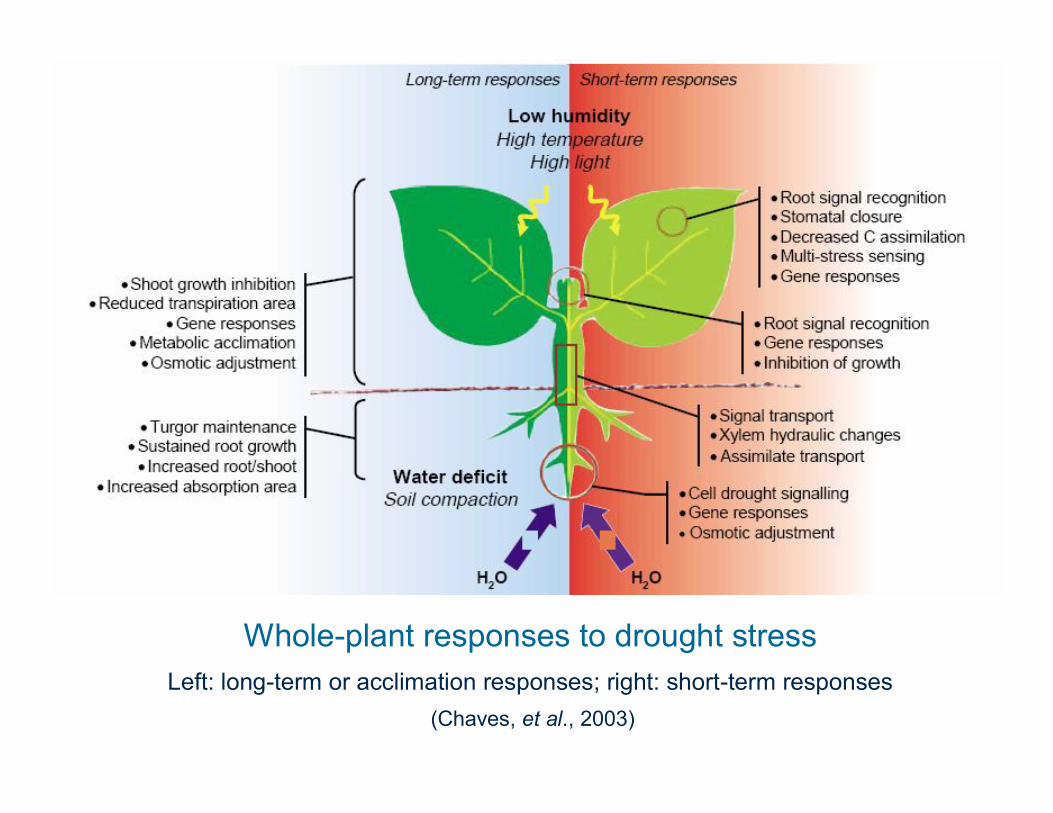
Whole-plant responses to drought stressLeft: long-term or acclimation responses; right: short-term responses
(Chaves, et al., 2003)
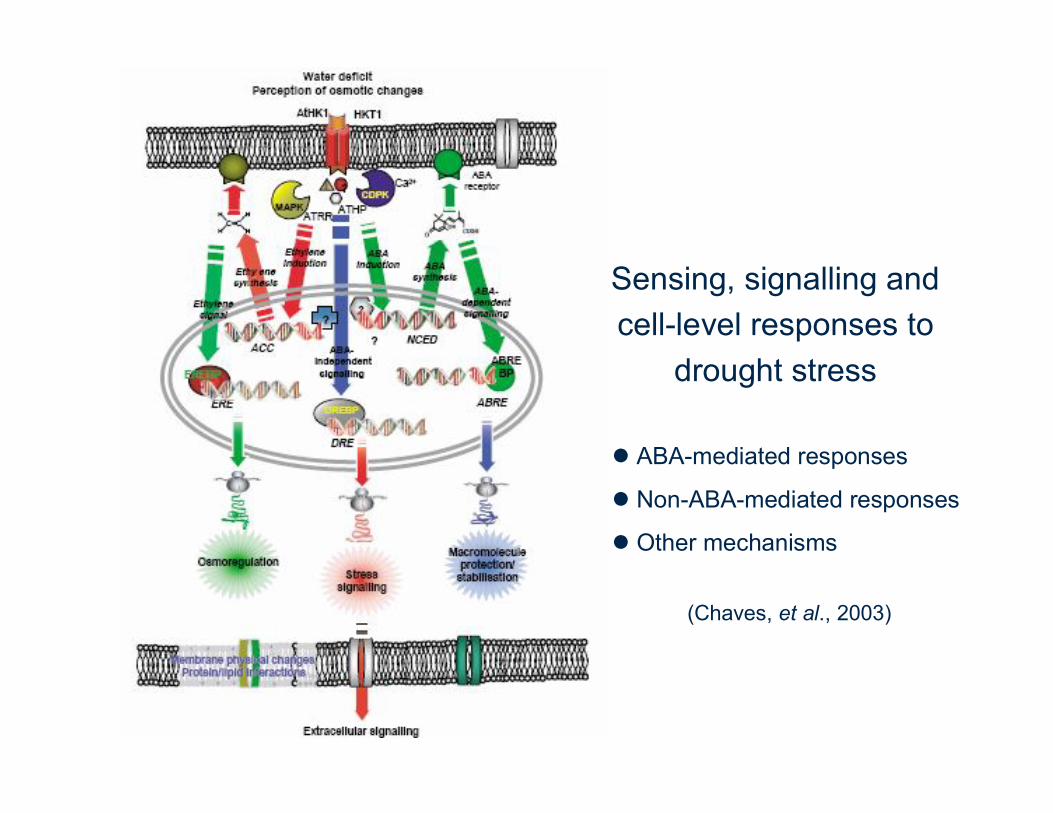
Sensing, signalling and cell-level responses to
drought stress
ABA-mediated responses
Non-ABA-mediated responses
Other mechanisms
(Chaves, et al., 2003)
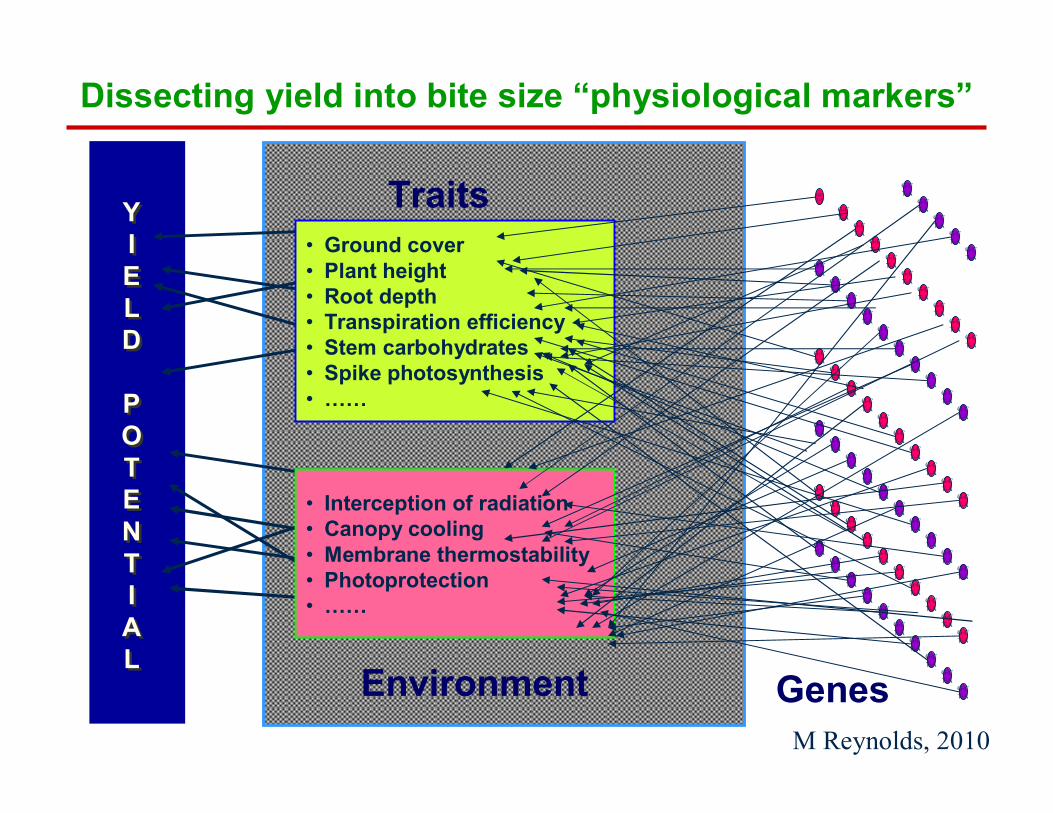
Dissecting yield into bite size “physiological markers”
• Ground cover• Plant height• Root depth• Transpiration efficiency• Stem carbohydrates• Spike photosynthesis• ……
YIELD
POTENTIAL
YIELD
POTENTIAL
• Interception of radiation• Canopy cooling• Membrane thermostability• Photoprotection• ……
G-CT-A
G-CT-A
G-CT-A
G-CT-A
G-CT-A
G-CT-A
G-CT-A
G-CT-A
G-CT-A
G-CT-A
G-CT-A
G-CT-A
G-CT-A
G-CT-A
G-CT-A
G-CT-A
G-CT-A
G-CT-A
G-CT-A
G-CT-A
G-CT-A
G-CT-A
G-CT-A
G-CT-A
G-CT-A
G-CT-A
G-CT-A
G-CT-A
G-CT-A
G-CT-A
G-CT-A
G-CT-A
G-CT-A
G-CT-A
G-CT-A
G-CT-A
G-CT-A
G-CT-A
G-CT-A
G-CT-A
G-CT-A
G-CT-A
G-CT-A
G-CT-A
G-CT-A
G-CT-A
G-CT-A
G-CT-A
G-CT-A
G-CT-A
G-CT-A
G-CT-A
G-CT-A
G-CT-A
G-CT-A
G-CT-A
G-CT-A
G-CT-A
G-CT-A
G-CT-A
G-CT-A
G-CT-A
G-CT-A
G-CT-A
G-CT-A
Traits
GenesEnvironmentM Reynolds, 2010
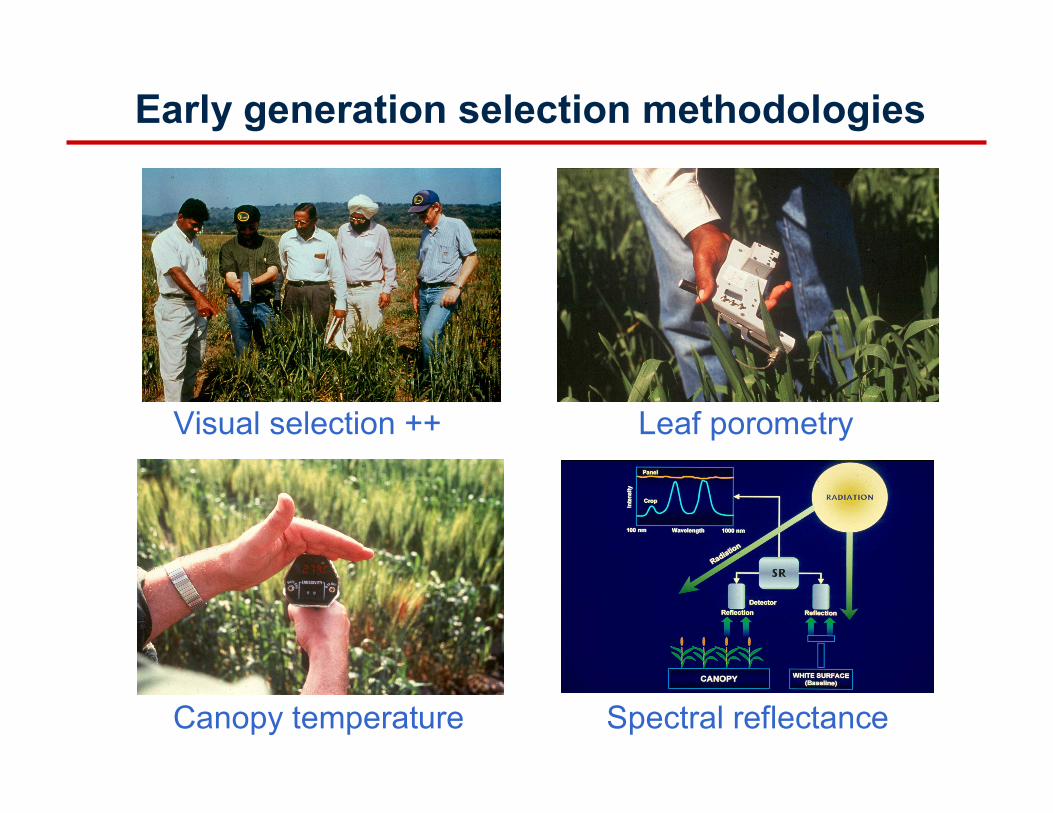
Early generation selection methodologies
Visual selection ++ Leaf porometry
Spectral reflectanceCanopy temperature
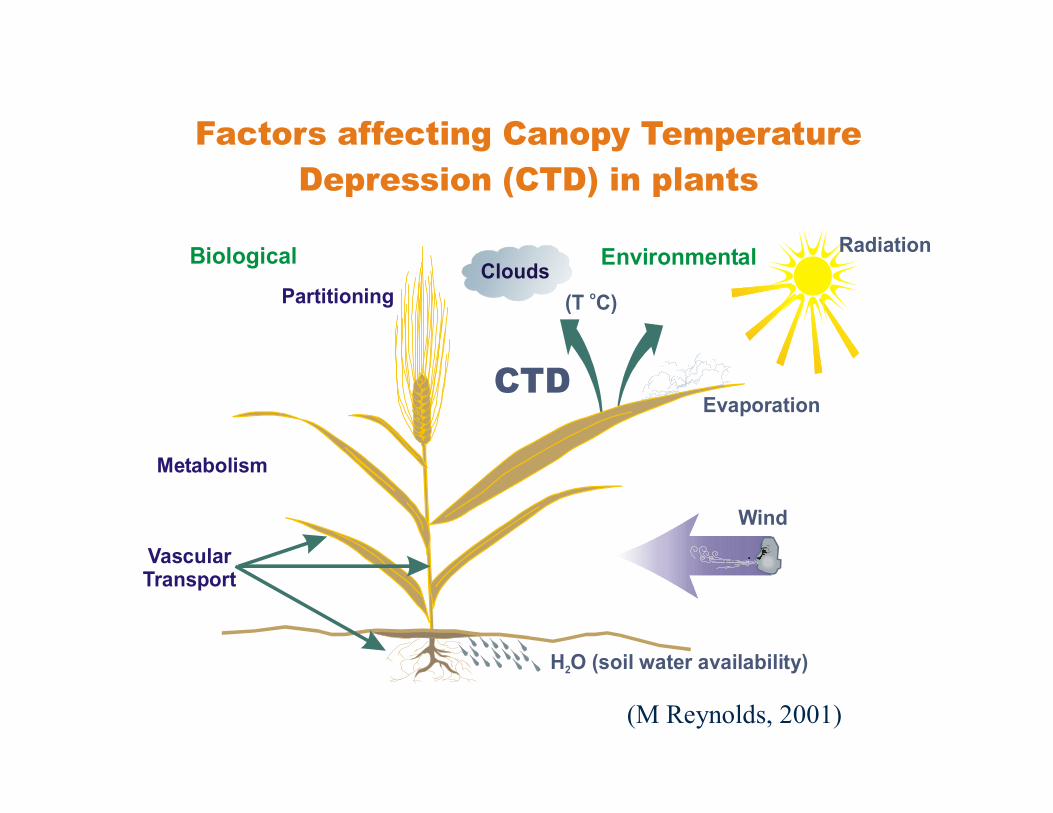
Factors affecting Canopy Temperature Depression (CTD) in plants
Biological EnvironmentalPartitioning
Metabolism
VascularTransport
Wind
CloudsRadiation
(T C)o
H O2
Evaporation
H O (soil water availability)2
CTD
(M Reynolds, 2001)
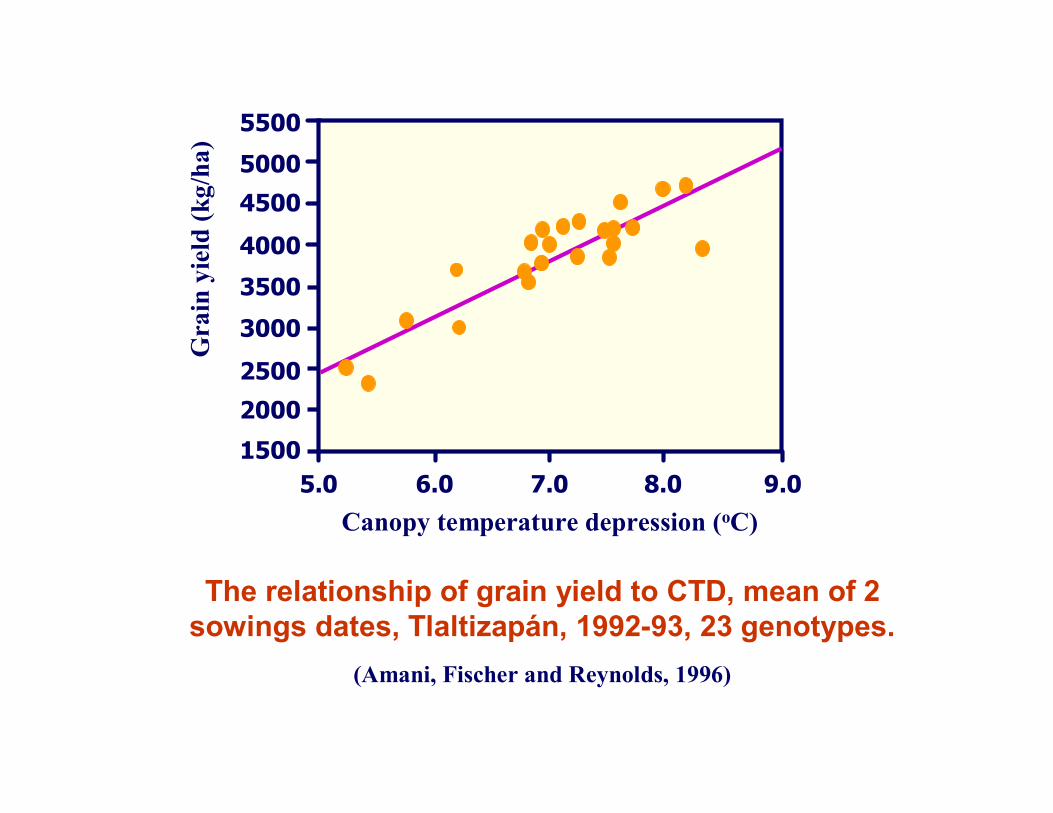
The relationship of grain yield to CTD, mean of 2sowings dates, Tlaltizapán, 1992-93, 23 genotypes.
(Amani, Fischer and Reynolds, 1996)
5500
5000
4500
4000
3500
3000
2500
2000
15005.0 6.0 7.0 8.0 9.0
Canopy temperature depression (oC)
Gra
in y
ield
(kg/
ha)
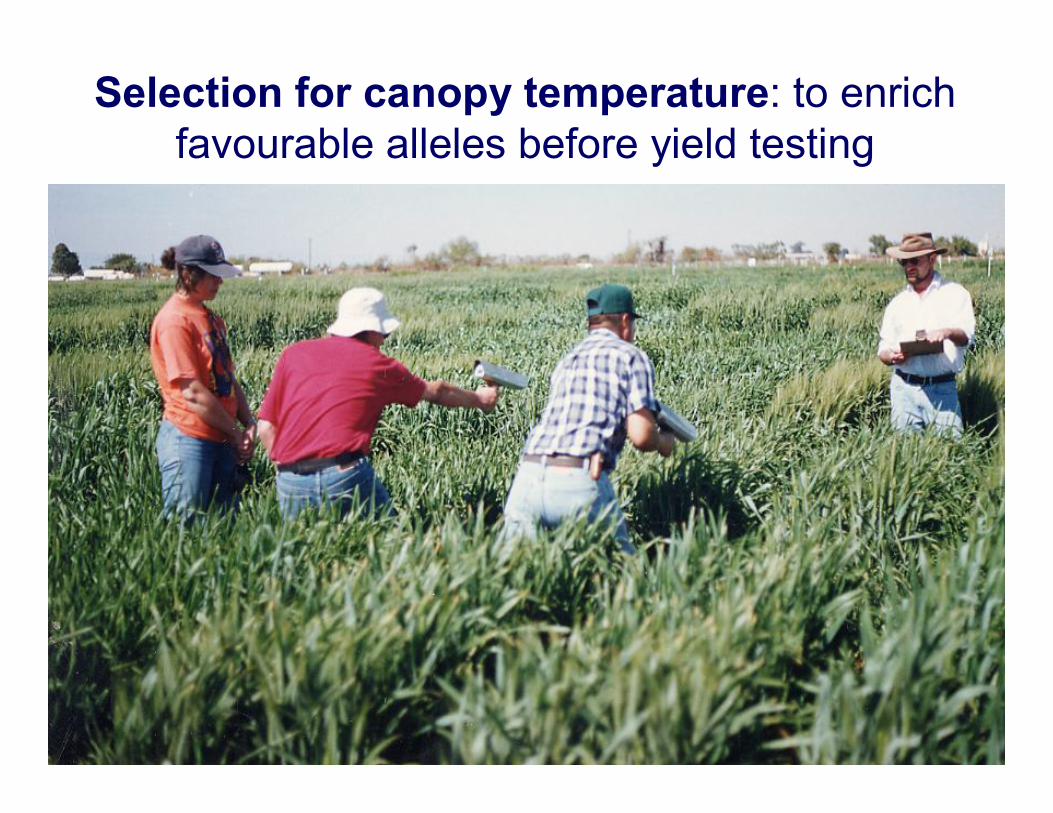
Selection for canopy temperature: to enrich favourable alleles before yield testing
24.525
25.526
26.527
27.528
28.529
20 21 22 23 24 25 26
Canopy temperature vegetative
Can
opy
tem
p po
st
flow
erin
g
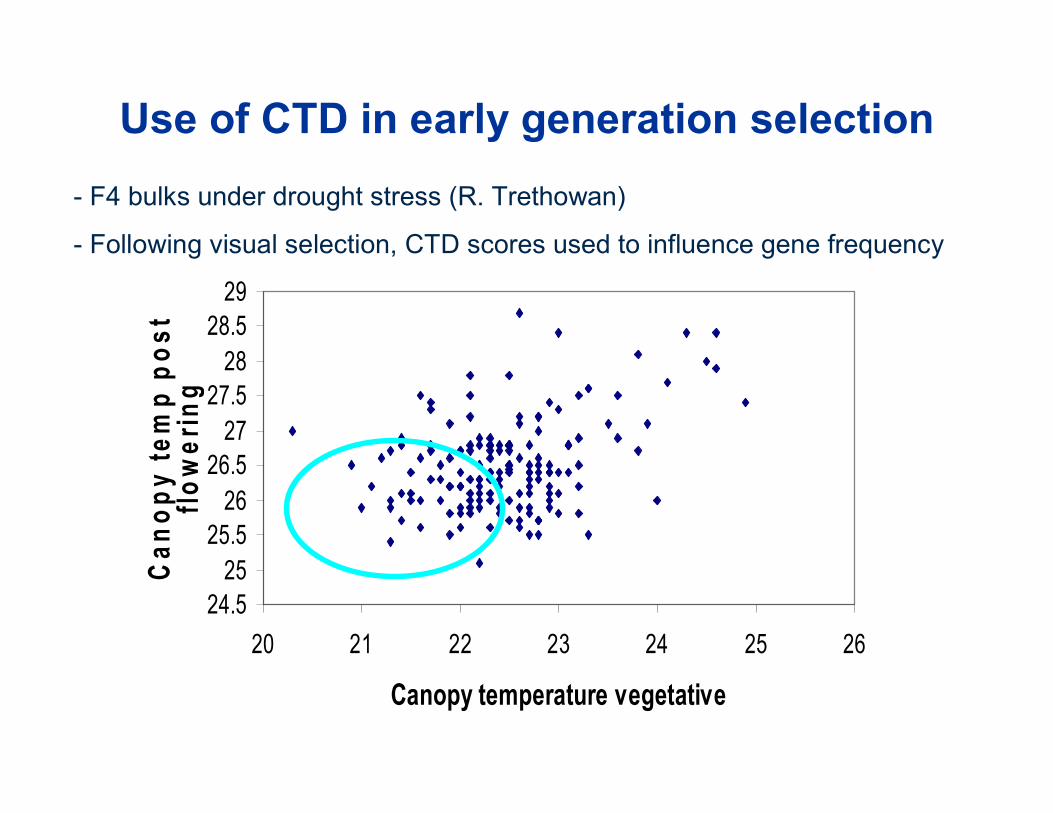
Use of CTD in early generation selection - F4 bulks under drought stress (R. Trethowan)
- Following visual selection, CTD scores used to influence gene frequency
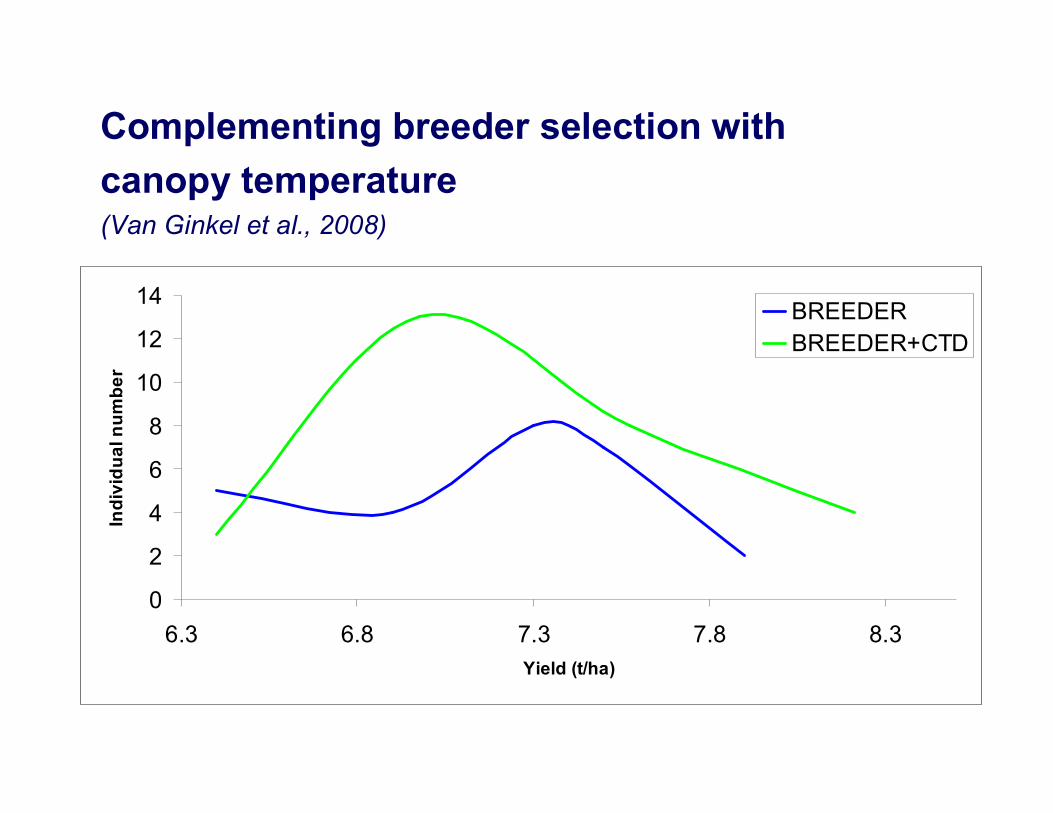
Complementing breeder selection with canopy temperature(Van Ginkel et al., 2008)
0
2
4
6
8
10
12
14
6.3 6.8 7.3 7.8 8.3Yield (t/ha)
Indi
vidu
al n
umbe
r
BREEDERBREEDER+CTD
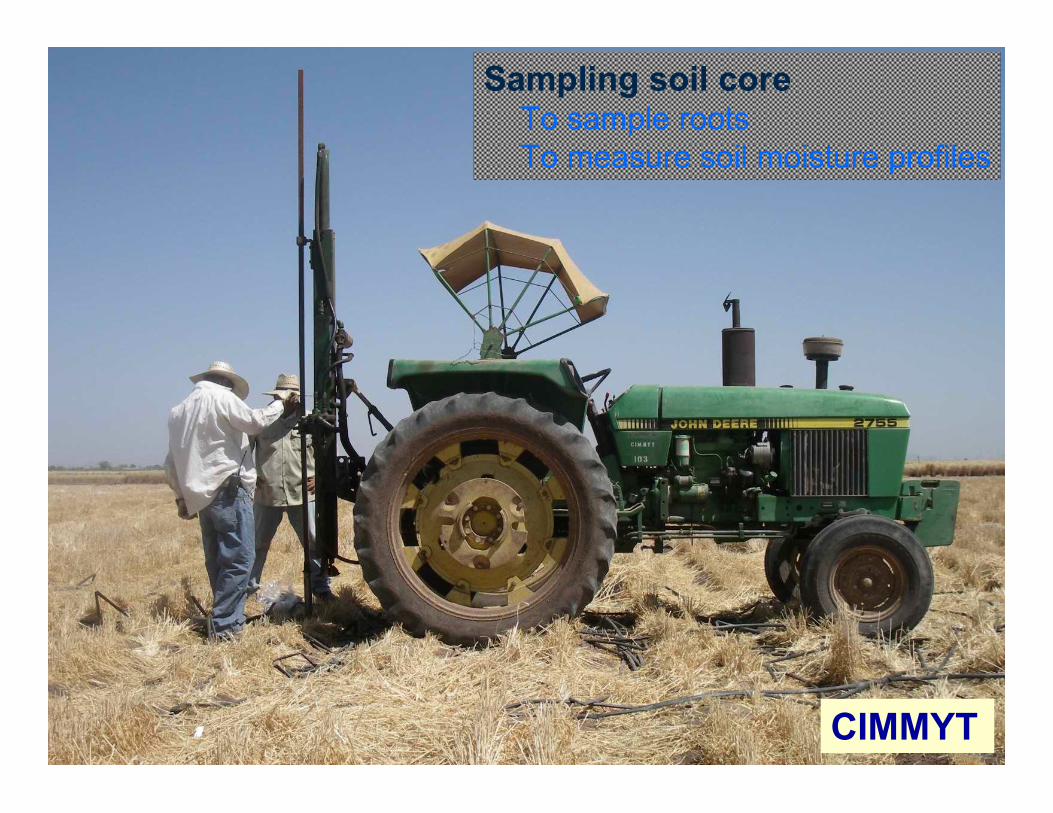
CIMMYT
Sampling soil coreTo sample roots To measure soil moisture profiles
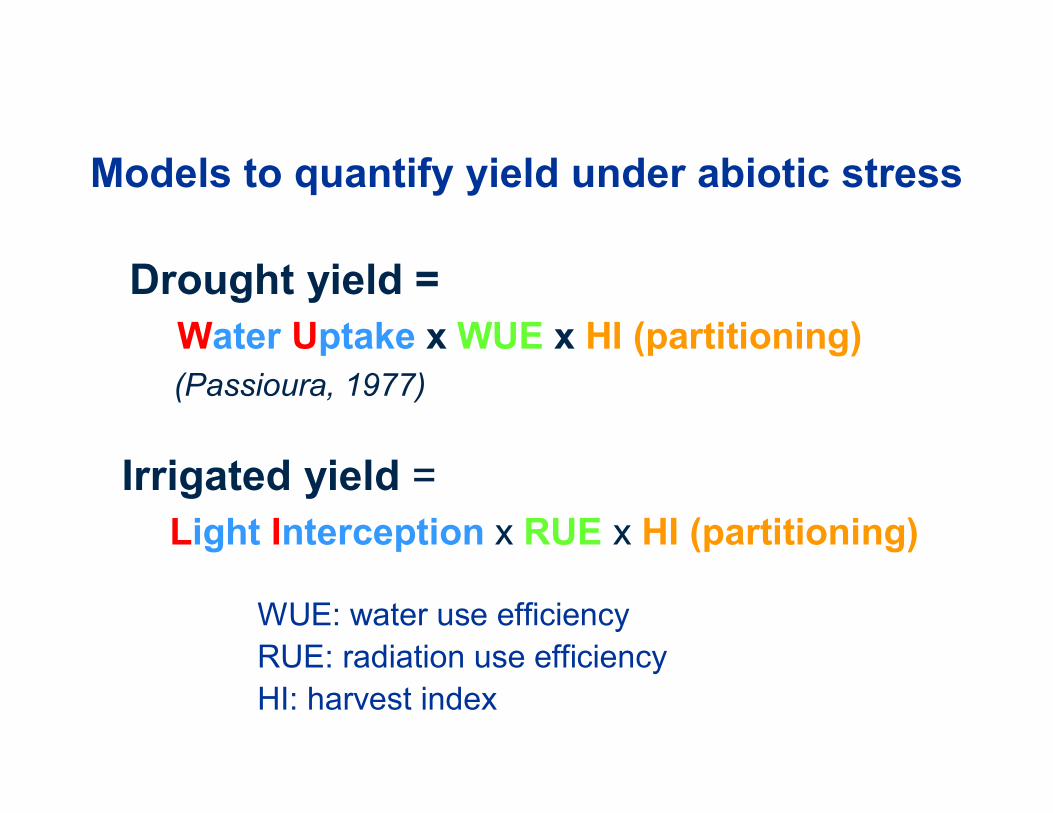
Models to quantify yield under abiotic stress
Drought yield = Water Uptake x WUE x HI (partitioning)(Passioura, 1977)
WUE: water use efficiencyRUE: radiation use efficiencyHI: harvest index
Irrigated yield =Light Interception x RUE x HI (partitioning)
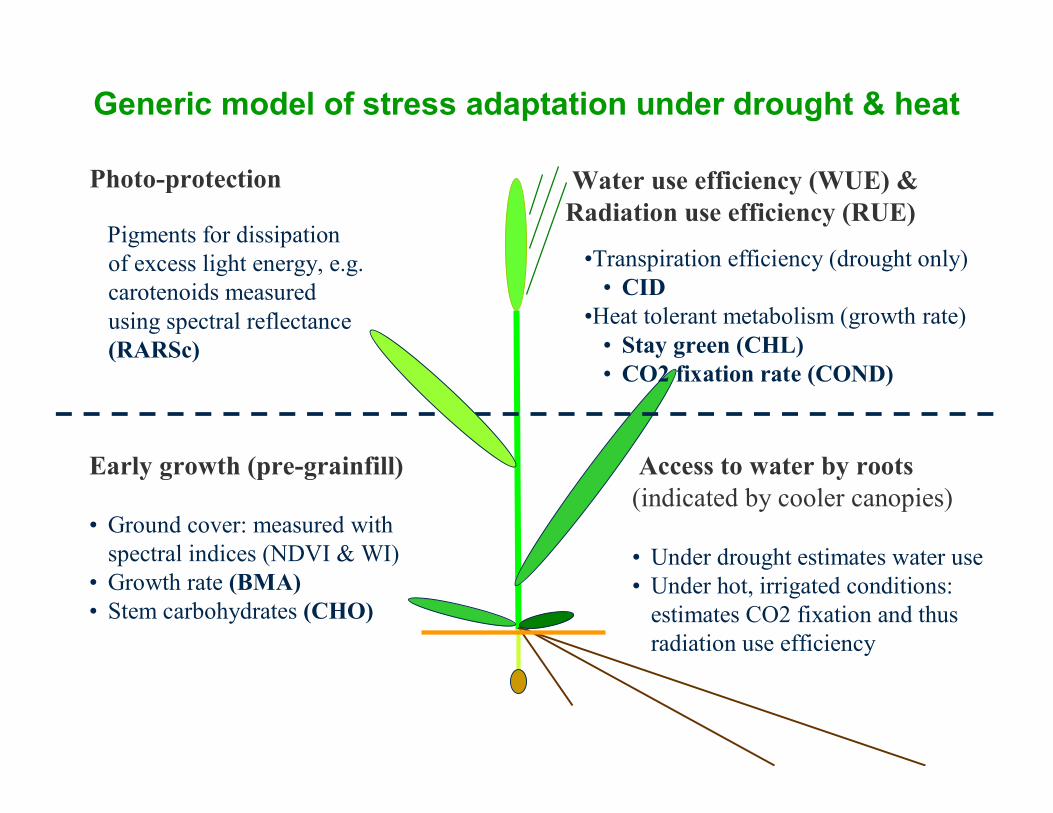
Water use efficiency (WUE) & Radiation use efficiency (RUE)
Access to water by roots (indicated by cooler canopies)
• Under drought estimates water use• Under hot, irrigated conditions:
estimates CO2 fixation and thus radiation use efficiency
•Transpiration efficiency (drought only)• CID
•Heat tolerant metabolism (growth rate)• Stay green (CHL)• CO2 fixation rate (COND)
Early growth (pre-grainfill)
• Ground cover: measured with spectral indices (NDVI & WI)
• Growth rate (BMA) • Stem carbohydrates (CHO)
Pigments for dissipation of excess light energy, e.g. carotenoids measured using spectral reflectance (RARSc)
Photo-protection
Generic model of stress adaptation under drought & heat
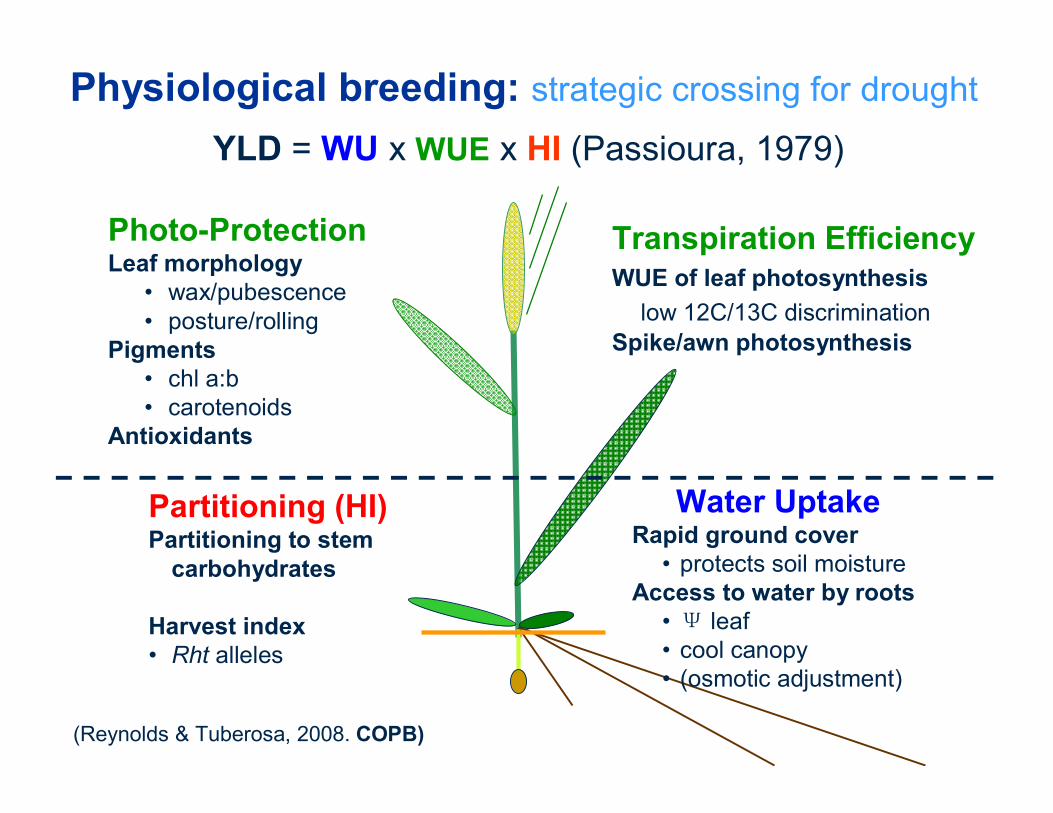
Transpiration EfficiencyWUE of leaf photosynthesis
low 12C/13C discrimination Spike/awn photosynthesis
Physiological breeding: strategic crossing for drought
YLD = WU x WUE x HI (Passioura, 1979)
Partitioning (HI)Partitioning to stem
carbohydrates
Harvest index • Rht alleles
Photo-ProtectionLeaf morphology
• wax/pubescence• posture/rolling
Pigments • chl a:b• carotenoids
Antioxidants
Water Uptake Rapid ground cover
• protects soil moistureAccess to water by roots
• Ψ leaf• cool canopy• (osmotic adjustment)
(Reynolds & Tuberosa, 2008. COPB)
2001
Plant phenotypingmethodology
Drought phenotypingin crops: from theory to practicewww.generationcp.org/drought_phenotyping
2011
Genotyping
--- to discover gene resources
(Case: drought tolerance)
Outline
Linkage mapping
Association mapping
Functional marker mapping
Perspective of MAS
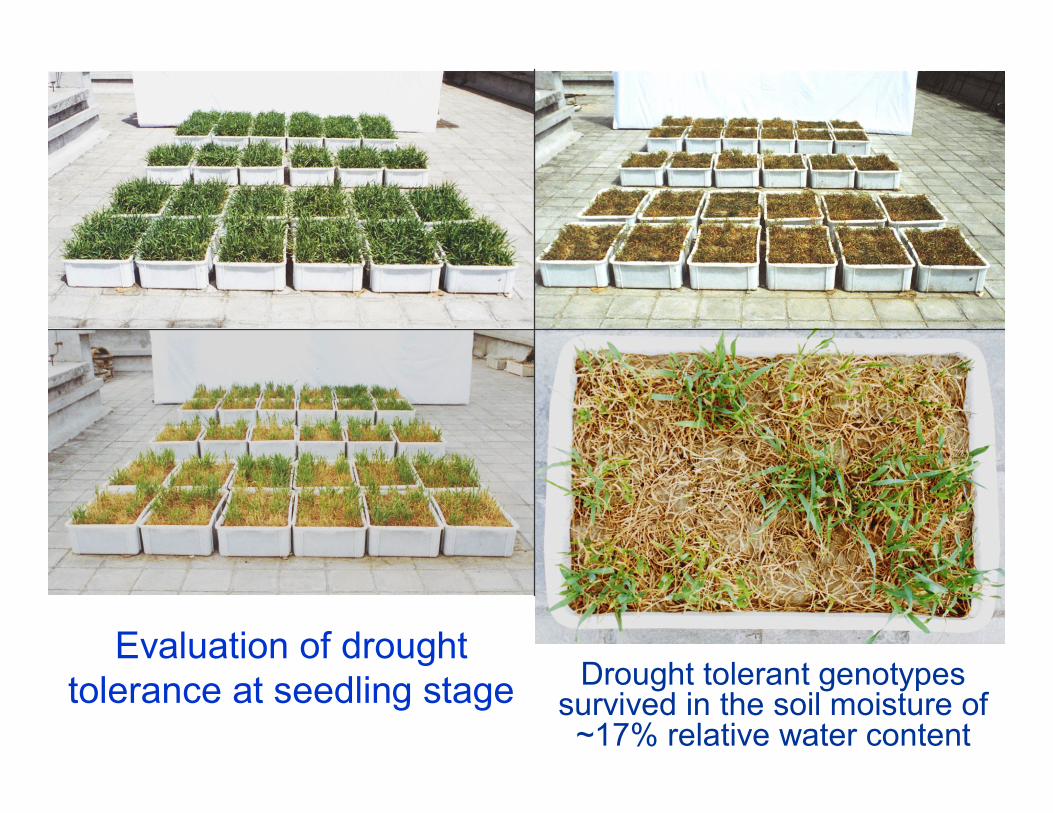
Evaluation of drought tolerance at seedling stage Drought tolerant genotypes
survived in the soil moisture of ~17% relative water content
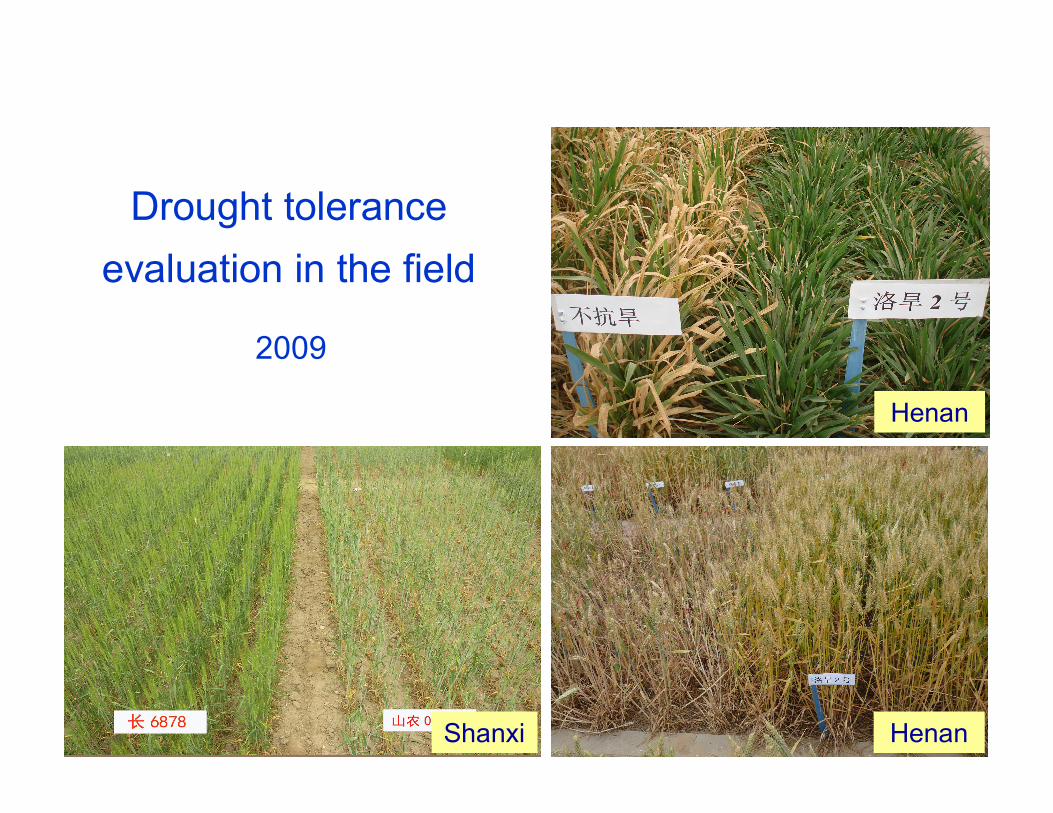
Drought tolerance evaluation in the field
2009
Henan
Shanxi Henan
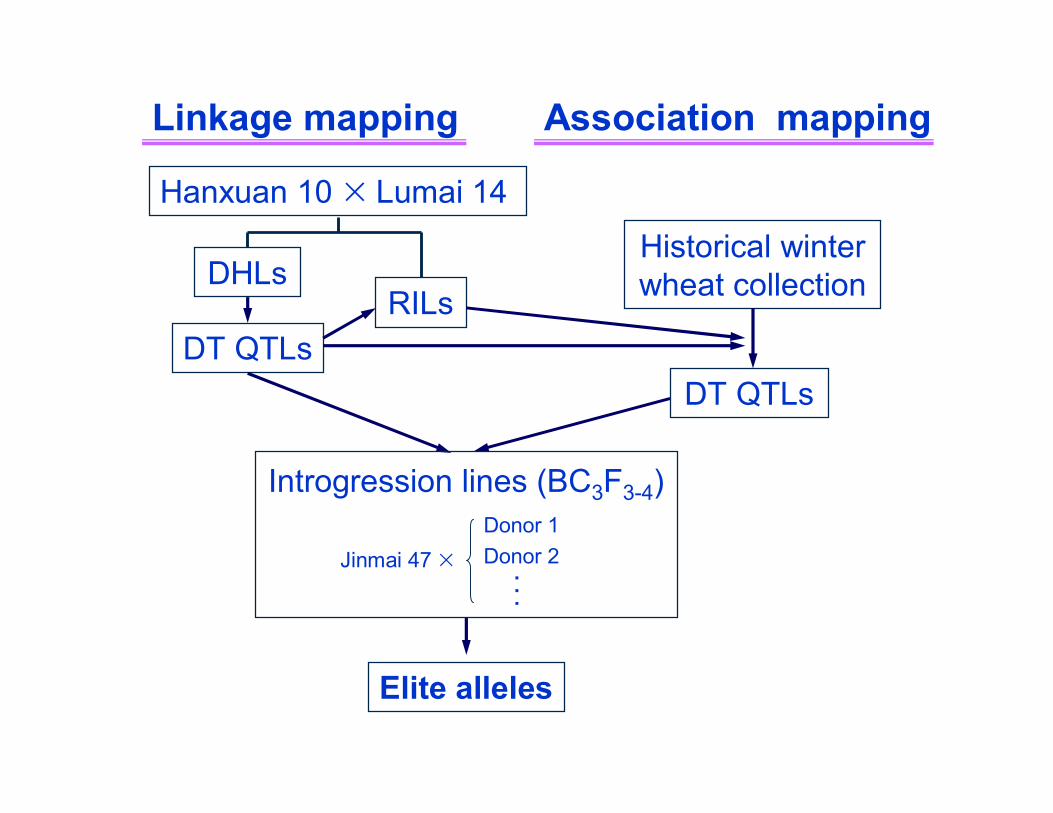
DHLs
Linkage mapping
DT QTLs
Hanxuan 10 × Lumai 14
Association mapping
Historical winter wheat collection
DT QTLs
Jinmai 47 ×
Introgression lines (BC3F3-4)Donor 1Donor 2
...
RILs
Elite alleles
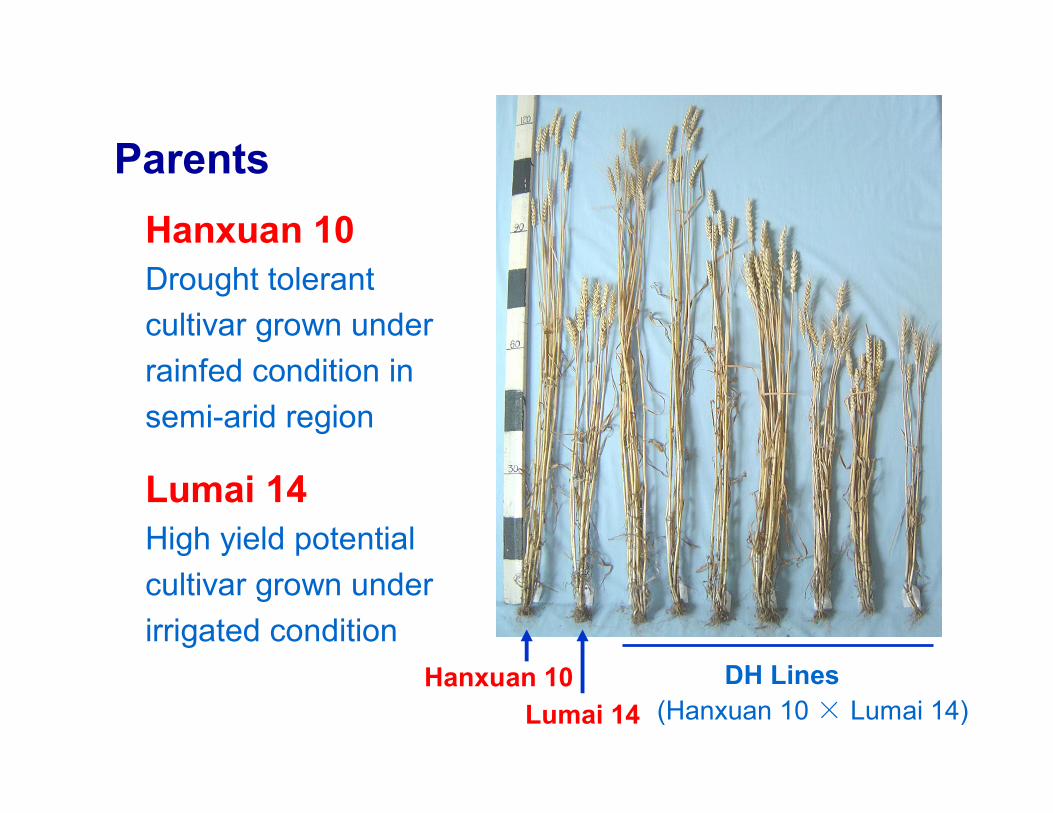
Lumai 14Hanxuan 10
Hanxuan 10Drought tolerant cultivar grown under rainfed condition in semi-arid region
Lumai 14High yield potential cultivar grown under irrigated condition
DH Lines
Parents
(Hanxuan 10 × Lumai 14)
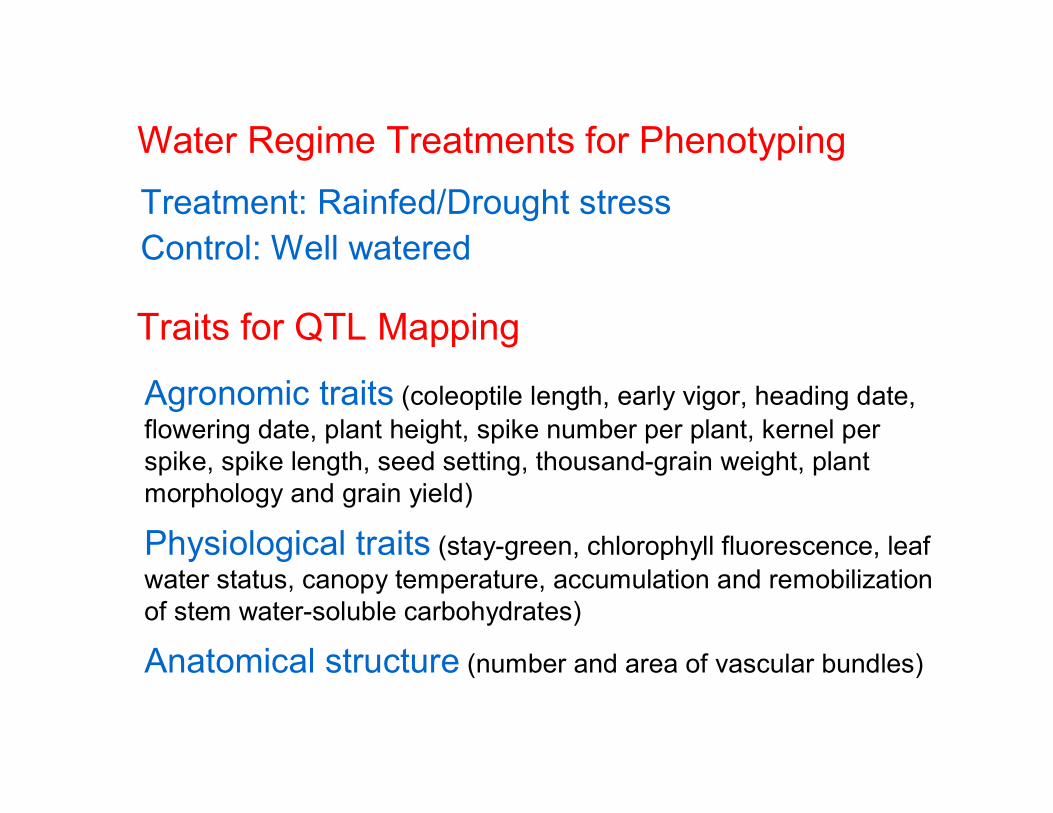
Water Regime Treatments for Phenotyping
Traits for QTL Mapping
Agronomic traits (coleoptile length, early vigor, heading date, flowering date, plant height, spike number per plant, kernel perspike, spike length, seed setting, thousand-grain weight, plant morphology and grain yield)
Physiological traits (stay-green, chlorophyll fluorescence, leaf water status, canopy temperature, accumulation and remobilization of stem water-soluble carbohydrates)
Anatomical structure (number and area of vascular bundles)
Treatment: Rainfed/Drought stressControl: Well watered
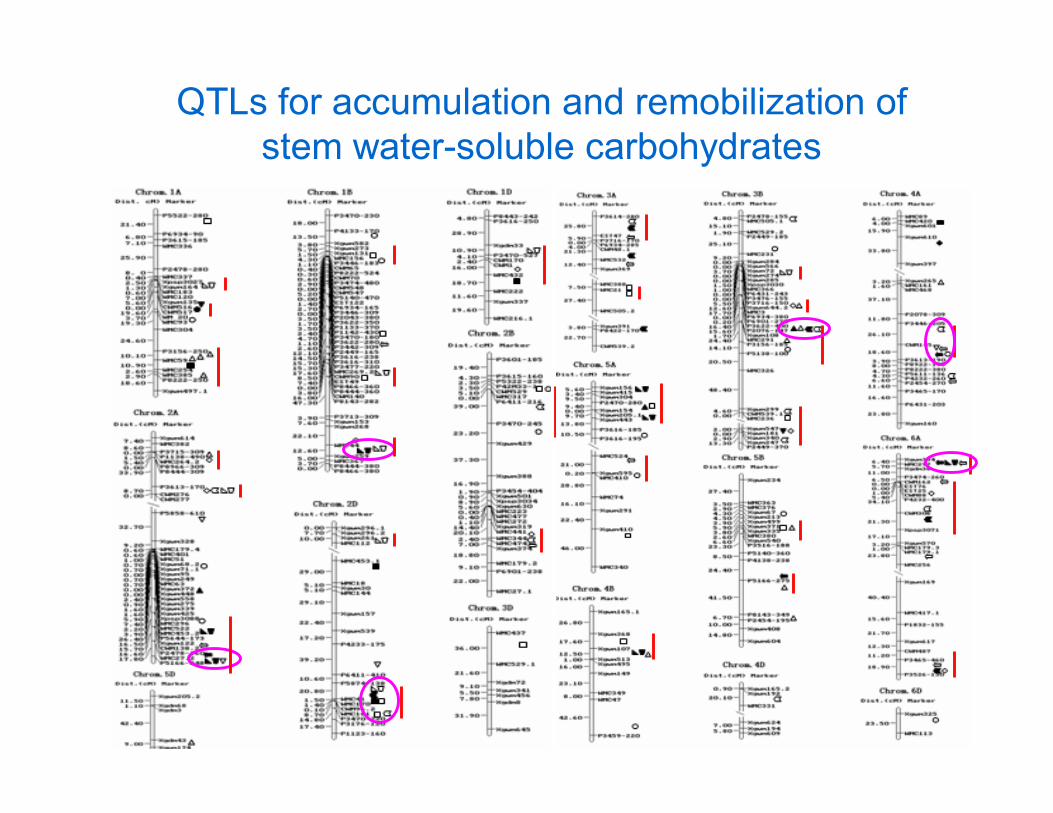
QTLs for accumulation and remobilization of stem water-soluble carbohydrates
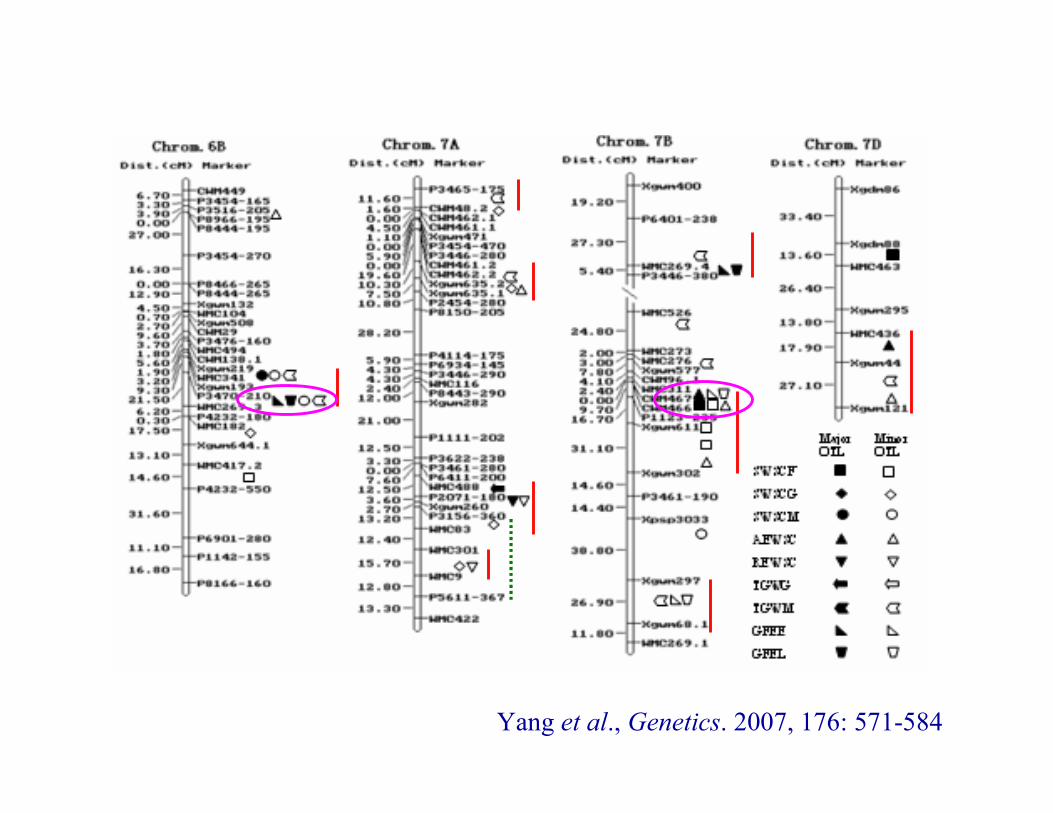
Yang et al., Genetics. 2007, 176: 571-584

K w e (3 3 .3 9 % )K g n (1 5 .5 5 % ~ 2 9 .0 6 % )T s p (1 0 .0 7 % ~ 1 2 .2 5 )H e i (9 .3 9 % ~ 2 1 .1 3 % )P y i (1 0 .6 2 % ~ 1 9 .2 3 % )S le (1 3 .6 2 % )S s p (8 .8 6 % )
S le : 7 re p e a ta tio n(1 7 .4 3 % ~ 2 2 .4 4 % )
N U P -H N 2 (1 4 .0 % )N U P -L N 1 (6 .0 % )R D W -H (1 1 .0 % )
F v /F o -W W (1 2 .0 9 % )R A L V B -D S (1 3 .1 6 % )H e i (8 .4 9 % ~ 3 1 .0 4 % )S le (9 .1 5 % ~ 1 8 .7 3 % )K w e i (1 4 .0 6 % )P y i (8 .5 7 % )
C h lC (1 1 .6 8 % )N S V B (2 1 .3 8 % )N T V B (2 0 .3 6 % )T sp (8 .0 9 % ~ 3 4 .9 3 % ) S sp (1 0 .8 9 % ~ 3 0 .9 7 % )H e i (9 .3 2 % ~ 2 1 .7 9 )
T s p (1 5 .7 1 % ~ 2 4 .5 3 % )H e i (2 4 .5 3 % ~ 4 3 .4 5 % )
R P A T V B (1 3 .2 3 % )S le (7 .8 % ~ 2 1 .9 7 % )S p i (6 .5 9 ~ 1 0 .3 7 % )
K g n (2 2 .6 2 % )S s p (6 .4 3 % ~ 1 4 .3 8 % )S p i (9 .3 7 % )
N L V B -D S (1 6 .0 5 % )F m -D S (2 6 .5 8 % )F v -D S (2 2 .9 9 % )R F W (1 0 .3 7 % )N U P -H (4 .3 % )
K w e (3 3 .3 9 % )K g n (1 5 .5 5 % ~ 2 9 .0 6 % )T s p (1 0 .0 7 % ~ 1 2 .2 5 )H e i (9 .3 9 % ~ 2 1 .1 3 % )P y i (1 0 .6 2 % ~ 1 9 .2 3 % )S le (1 3 .6 2 % )S s p (8 .8 6 % )
S le : 7 re p e a ta tio n(1 7 .4 3 % ~ 2 2 .4 4 % )
N U P -H N 2 (1 4 .0 % )N U P -L N 1 (6 .0 % )R D W -H (1 1 .0 % )
K w e (3 3 .3 9 % )K g n (1 5 .5 5 % ~ 2 9 .0 6 % )T s p (1 0 .0 7 % ~ 1 2 .2 5 )H e i (9 .3 9 % ~ 2 1 .1 3 % )P y i (1 0 .6 2 % ~ 1 9 .2 3 % )S le (1 3 .6 2 % )S s p (8 .8 6 % )
S le : 7 re p e a ta tio n(1 7 .4 3 % ~ 2 2 .4 4 % )
N U P -H N 2 (1 4 .0 % )N U P -L N 1 (6 .0 % )R D W -H (1 1 .0 % )
F v /F o -W W (1 2 .0 9 % )R A L V B -D S (1 3 .1 6 % )H e i (8 .4 9 % ~ 3 1 .0 4 % )S le (9 .1 5 % ~ 1 8 .7 3 % )K w e i (1 4 .0 6 % )P y i (8 .5 7 % )
F v /F o -W W (1 2 .0 9 % )R A L V B -D S (1 3 .1 6 % )H e i (8 .4 9 % ~ 3 1 .0 4 % )S le (9 .1 5 % ~ 1 8 .7 3 % )K w e i (1 4 .0 6 % )P y i (8 .5 7 % )
C h lC (1 1 .6 8 % )N S V B (2 1 .3 8 % )N T V B (2 0 .3 6 % )T sp (8 .0 9 % ~ 3 4 .9 3 % ) S sp (1 0 .8 9 % ~ 3 0 .9 7 % )H e i (9 .3 2 % ~ 2 1 .7 9 )
T s p (1 5 .7 1 % ~ 2 4 .5 3 % )H e i (2 4 .5 3 % ~ 4 3 .4 5 % )
C h lC (1 1 .6 8 % )N S V B (2 1 .3 8 % )N T V B (2 0 .3 6 % )T sp (8 .0 9 % ~ 3 4 .9 3 % ) S sp (1 0 .8 9 % ~ 3 0 .9 7 % )H e i (9 .3 2 % ~ 2 1 .7 9 )
T s p (1 5 .7 1 % ~ 2 4 .5 3 % )H e i (2 4 .5 3 % ~ 4 3 .4 5 % )
R P A T V B (1 3 .2 3 % )S le (7 .8 % ~ 2 1 .9 7 % )S p i (6 .5 9 ~ 1 0 .3 7 % )
K g n (2 2 .6 2 % )S s p (6 .4 3 % ~ 1 4 .3 8 % )S p i (9 .3 7 % )
N L V B -D S (1 6 .0 5 % )F m -D S (2 6 .5 8 % )F v -D S (2 2 .9 9 % )R F W (1 0 .3 7 % )N U P -H (4 .3 % )
R P A T V B (1 3 .2 3 % )S le (7 .8 % ~ 2 1 .9 7 % )S p i (6 .5 9 ~ 1 0 .3 7 % )
K g n (2 2 .6 2 % )S s p (6 .4 3 % ~ 1 4 .3 8 % )S p i (9 .3 7 % )
N L V B -D S (1 6 .0 5 % )F m -D S (2 6 .5 8 % )F v -D S (2 2 .9 9 % )R F W (1 0 .3 7 % )N U P -H (4 .3 % )
Integrated mapping of QTLs controlling drought tolerance in wheat
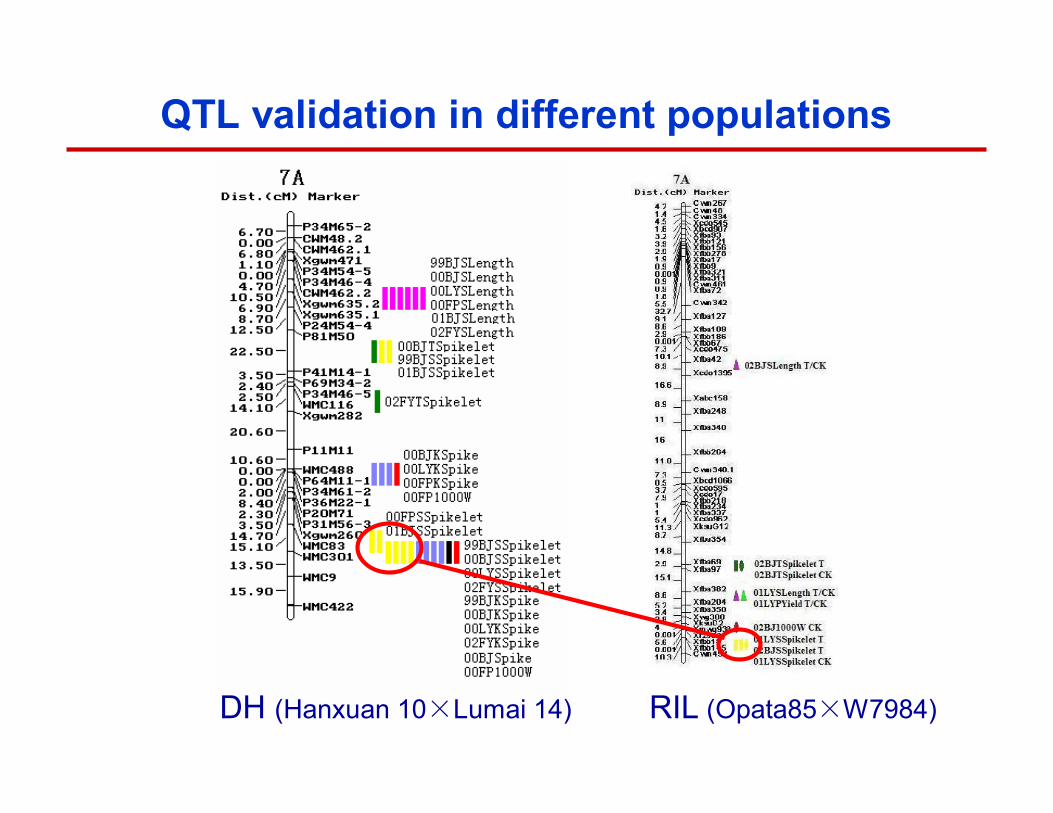
QTL validation in different populations
RIL (Opata85×W7984)DH (Hanxuan 10×Lumai 14)
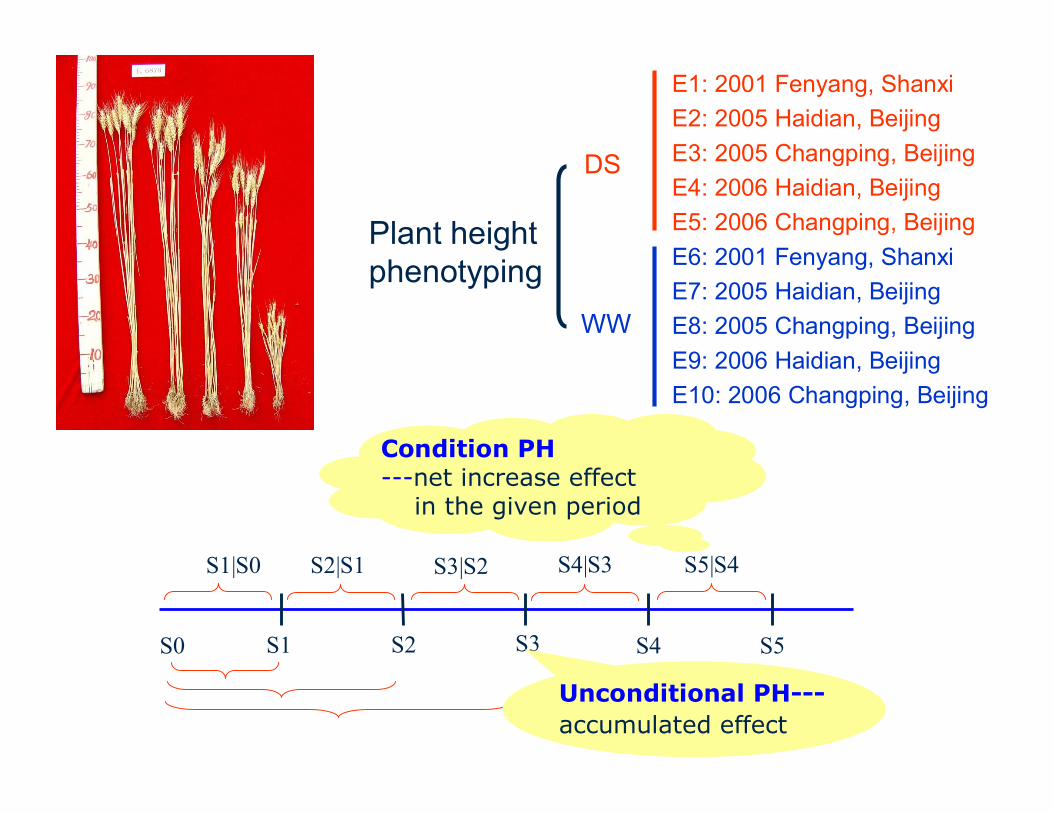
S0 S1 S2 S3 S4 S5
S1|S0 S5|S4S3|S2S2|S1 S4|S3
Condition PH---net increase effect
in the given period
Unconditional PH---accumulated effect
E1: 2001 Fenyang, ShanxiE2: 2005 Haidian, BeijingE3: 2005 Changping, BeijingE4: 2006 Haidian, BeijingE5: 2006 Changping, BeijingE6: 2001 Fenyang, ShanxiE7: 2005 Haidian, BeijingE8: 2005 Changping, BeijingE9: 2006 Haidian, BeijingE10: 2006 Changping, Beijing
DS
WW
Plant height phenotyping
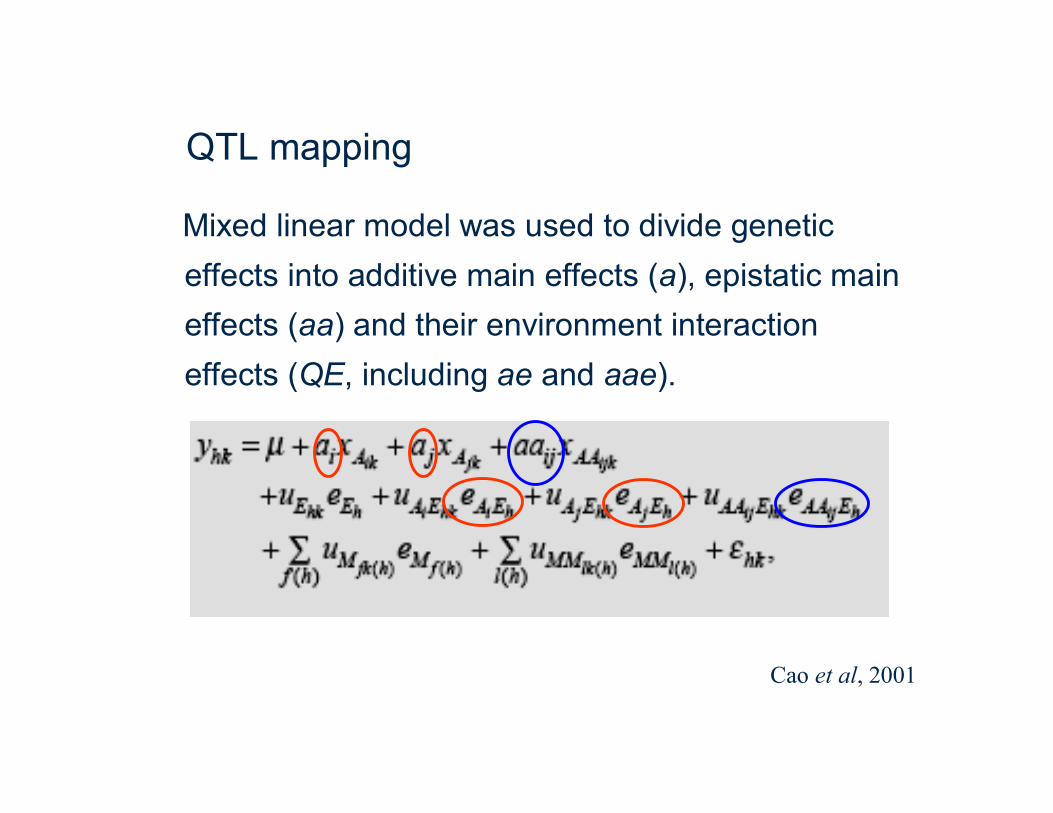
QTL mapping
Mixed linear model was used to divide genetic effects into additive main effects (a), epistatic main effects (aa) and their environment interaction effects (QE, including ae and aae).
Cao et al, 2001
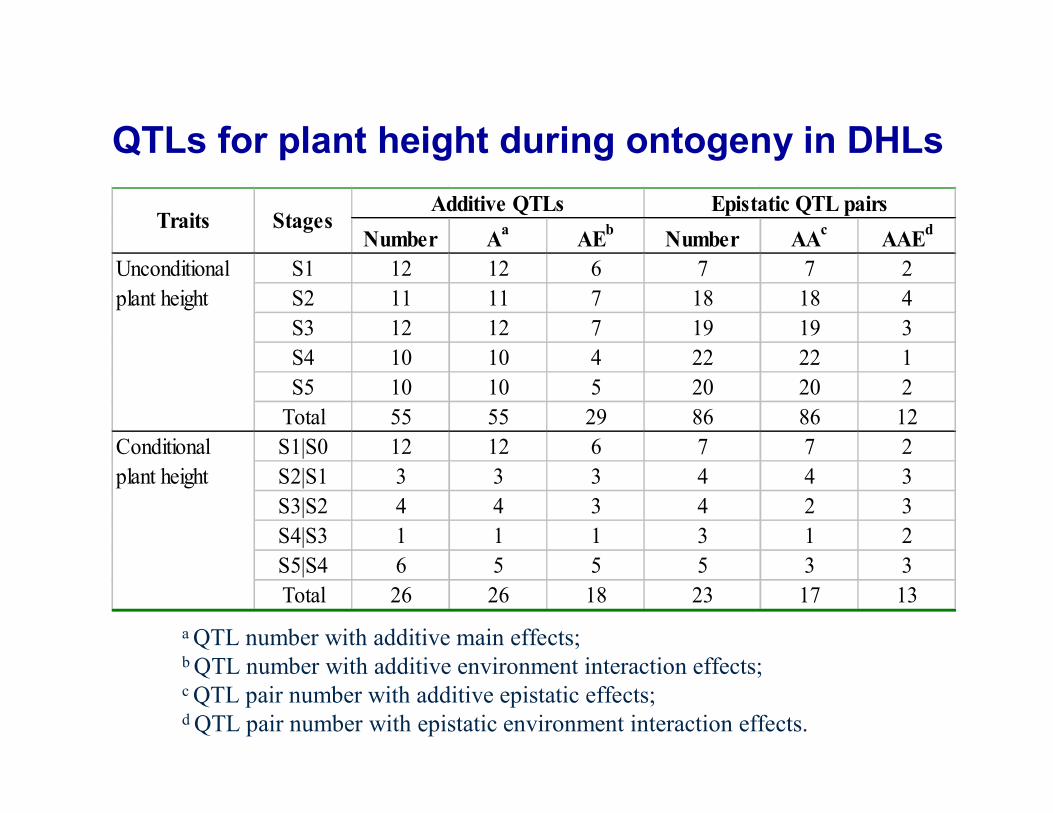
Number Aa AEb Number AAc AAEd
S1 12 12 6 7 7 2S2 11 11 7 18 18 4S3 12 12 7 19 19 3S4 10 10 4 22 22 1S5 10 10 5 20 20 2
Total 55 55 29 86 86 12S1|S0 12 12 6 7 7 2S2|S1 3 3 3 4 4 3S3|S2 4 4 3 4 2 3S4|S3 1 1 1 3 1 2S5|S4 6 5 5 5 3 3Total 26 26 18 23 17 13
Additive QTLs Epistatic QTL pairs
Unconditionalplant height
Conditionalplant height
Traits Stages
QTLs for plant height during ontogeny in DHLs
a QTL number with additive main effects; b QTL number with additive environment interaction effects; c QTL pair number with additive epistatic effects; d QTL pair number with epistatic environment interaction effects.
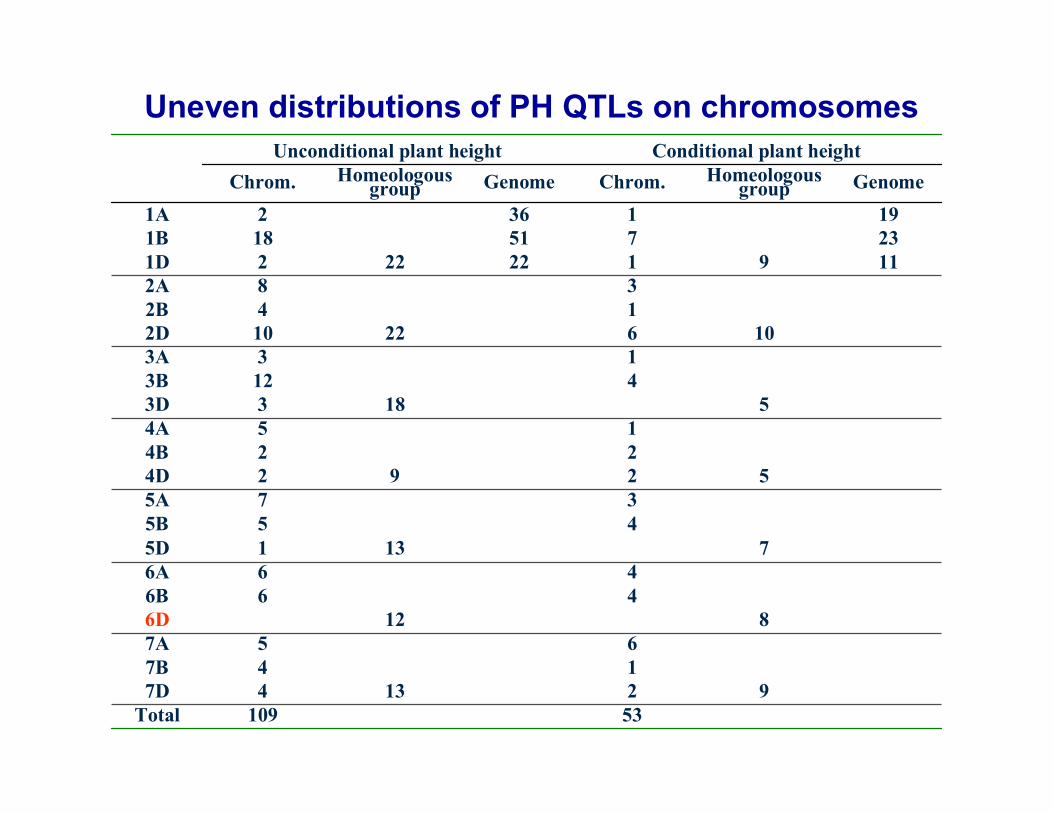
Uneven distributions of PH QTLs on chromosomes
53109Total921347D
147B657A
8126D466B466A
71315D455B375A
52924D224B154A
51833D4123B133A
10622102D142B382A
1191222221D23751181B1913621A
GenomeHomeologousgroupChrom.GenomeHomeologous
groupChrom.Conditional plant heightUnconditional plant height
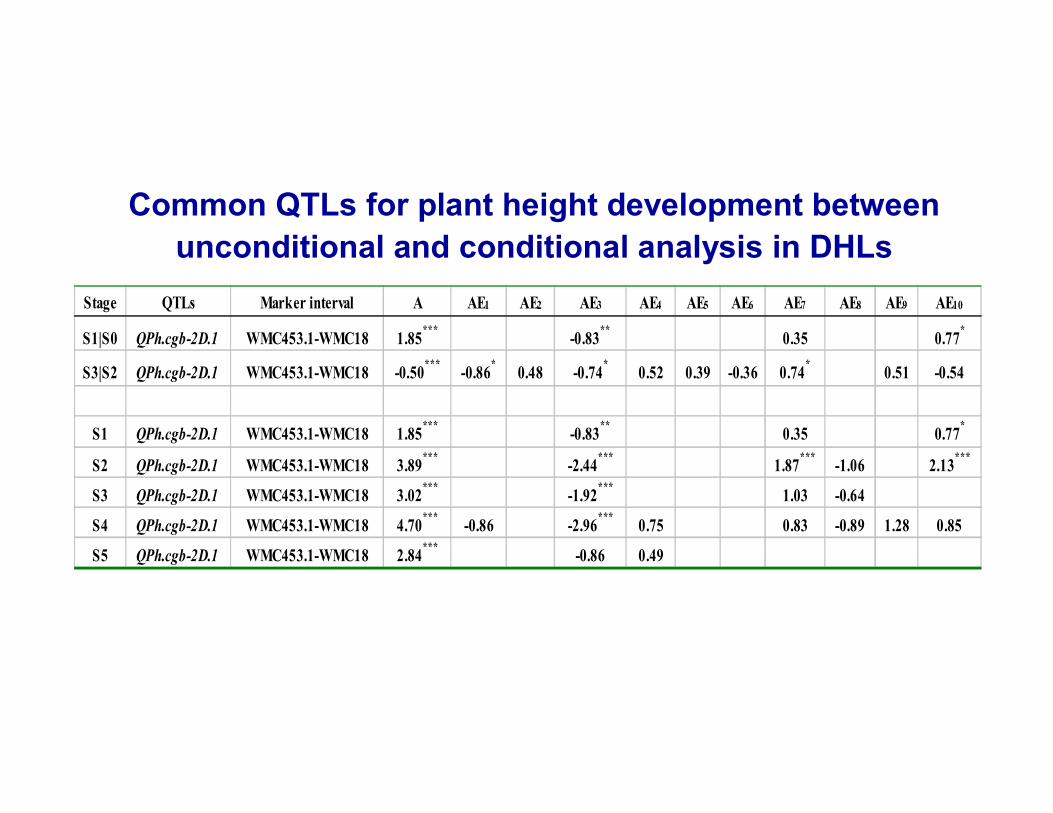
Common QTLs for plant height development between unconditional and conditional analysis in DHLs
Stage QTLs Marker interval A AE1 AE2 AE3 AE4 AE5 AE6 AE7 AE8 AE9 AE10
S1|S0 QPh.cgb-2D.1 WMC453.1-WMC18 1.85*** -0.83** 0.35 0.77*
S3|S2 QPh.cgb-2D.1 WMC453.1-WMC18 -0.50*** -0.86* 0.48 -0.74* 0.52 0.39 -0.36 0.74* 0.51 -0.54
S1 QPh.cgb-2D.1 WMC453.1-WMC18 1.85*** -0.83** 0.35 0.77*
S2 QPh.cgb-2D.1 WMC453.1-WMC18 3.89*** -2.44*** 1.87*** -1.06 2.13***
S3 QPh.cgb-2D.1 WMC453.1-WMC18 3.02*** -1.92*** 1.03 -0.64
S4 QPh.cgb-2D.1 WMC453.1-WMC18 4.70*** -0.86 -2.96*** 0.75 0.83 -0.89 1.28 0.85
S5 QPh.cgb-2D.1 WMC453.1-WMC18 2.84*** -0.86 0.49
0
0.1
0.2
0.3
0.4
0.5
Component contribution
S1 S2 S3 S4 S5
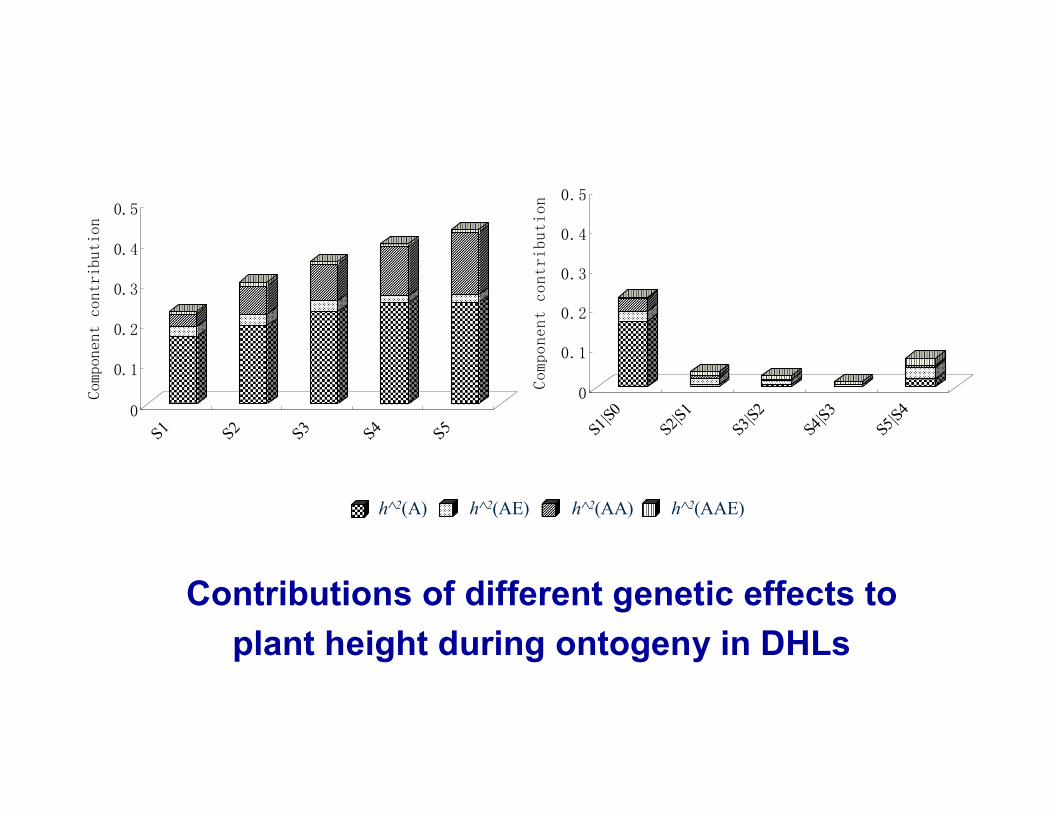
Contributions of different genetic effects to plant height during ontogeny in DHLs
h^2(A) h^2(AE) h^2(AA) h^2(AAE)
0
0.1
0.2
0.3
0.4
0.5
Component contribution
S1|S0
S2|S1S3|S2
S4|S3
S5|S4
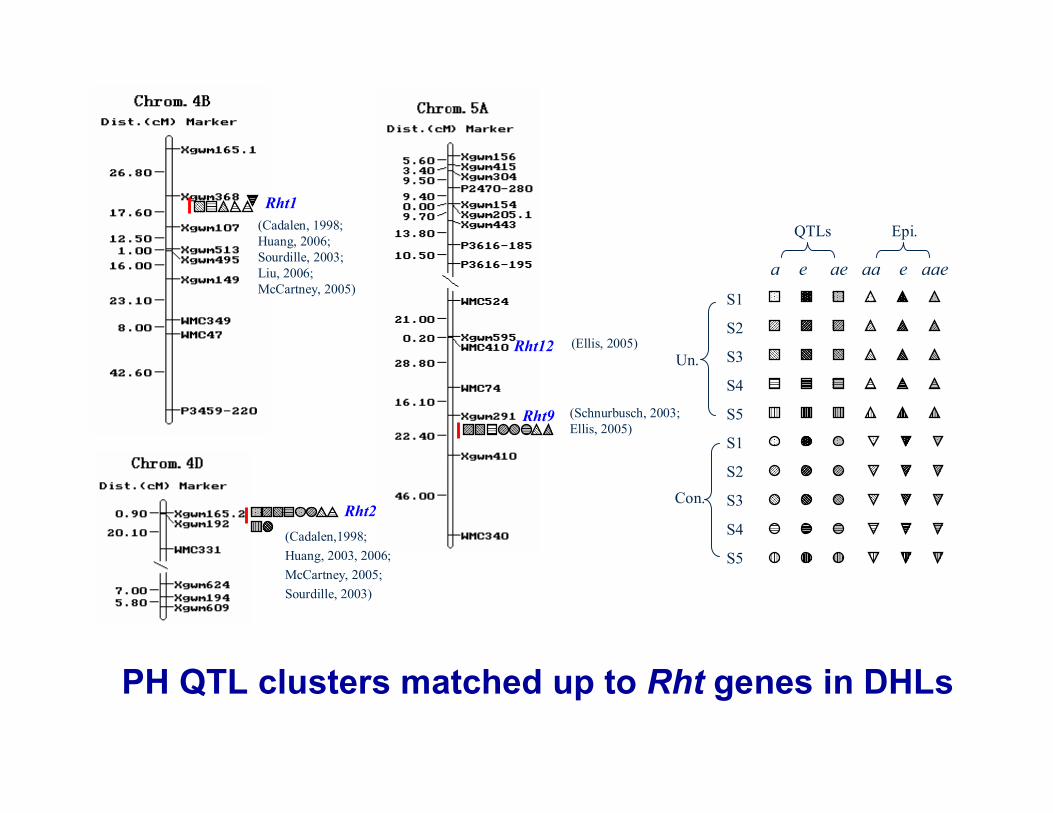
Rht12
Rht9 (Schnurbusch, 2003; Ellis, 2005)
(Ellis, 2005)
Rht1(Cadalen, 1998;Huang, 2006;Sourdille, 2003;Liu, 2006;McCartney, 2005)
Rht2(Cadalen,1998; Huang, 2003, 2006; McCartney, 2005; Sourdille, 2003)
a e ae aa e aaeS1
S2
S3
S4
S5
S1
S2
S3
S4
S5
Un.
Con.
QTLs Epi.
PH QTL clusters matched up to Rht genes in DHLs
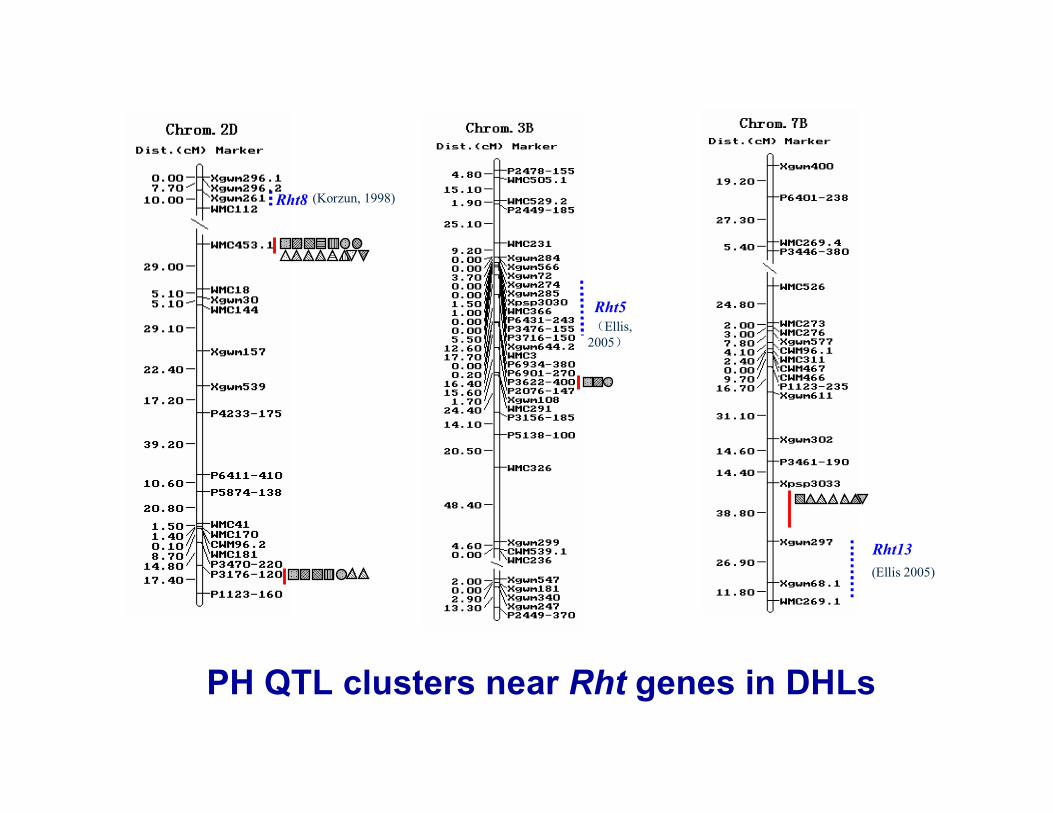
(Ellis, 2005)
Rht5
Rht8 (Korzun, 1998)
(Ellis 2005)
Rht13
PH QTL clusters near Rht genes in DHLs
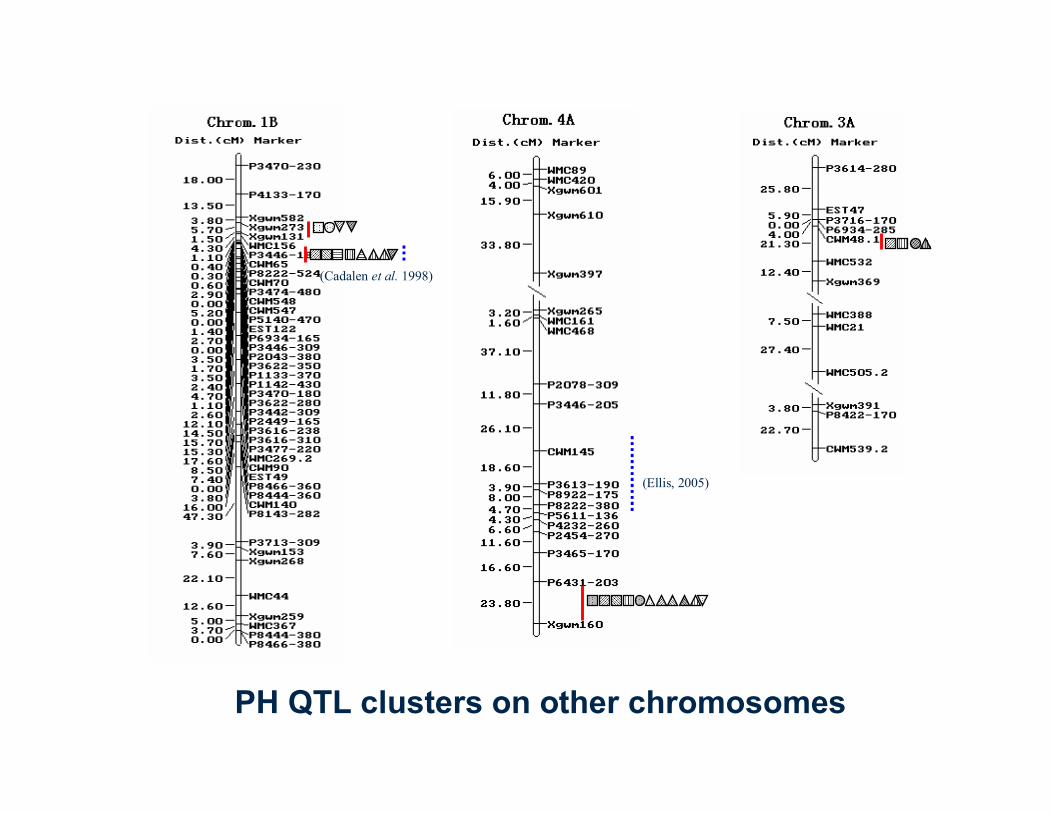
(Cadalen et al. 1998)
PH QTL clusters on other chromosomes
(Ellis, 2005)
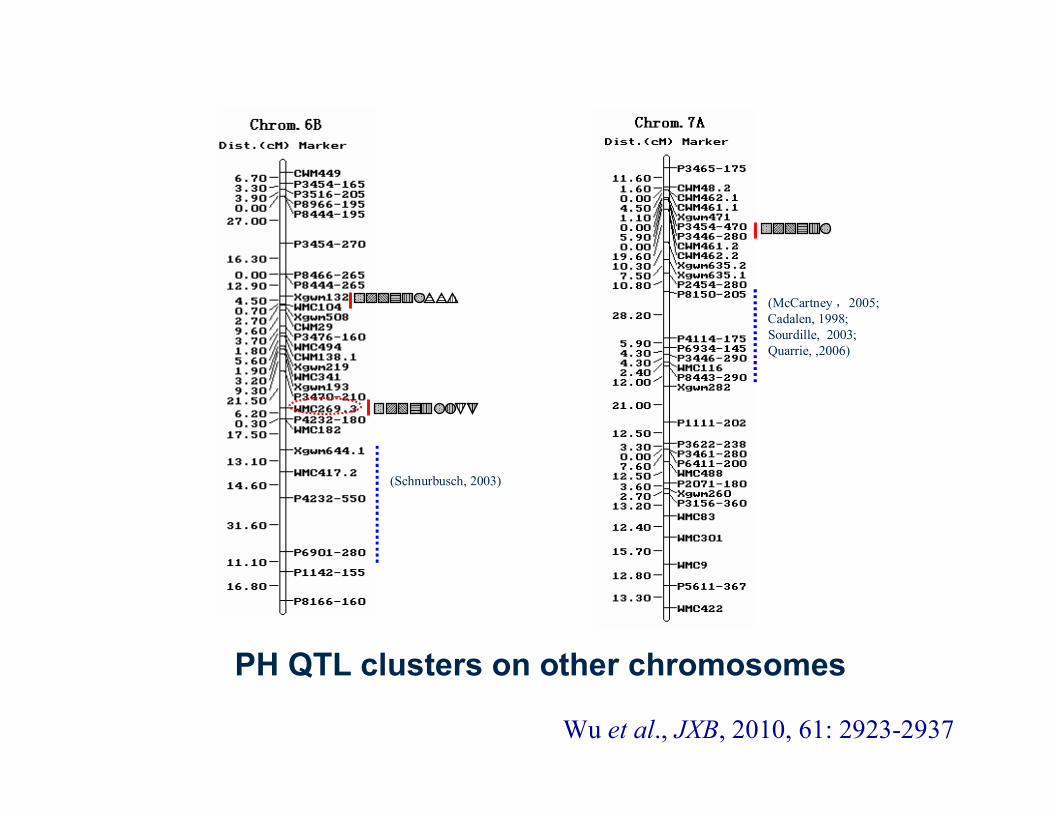
(Schnurbusch, 2003)
(McCartney ,2005;Cadalen, 1998;Sourdille, 2003;Quarrie, ,2006)
PH QTL clusters on other chromosomes
Wu et al., JXB, 2010, 61: 2923-2937
Rht12
Rht9
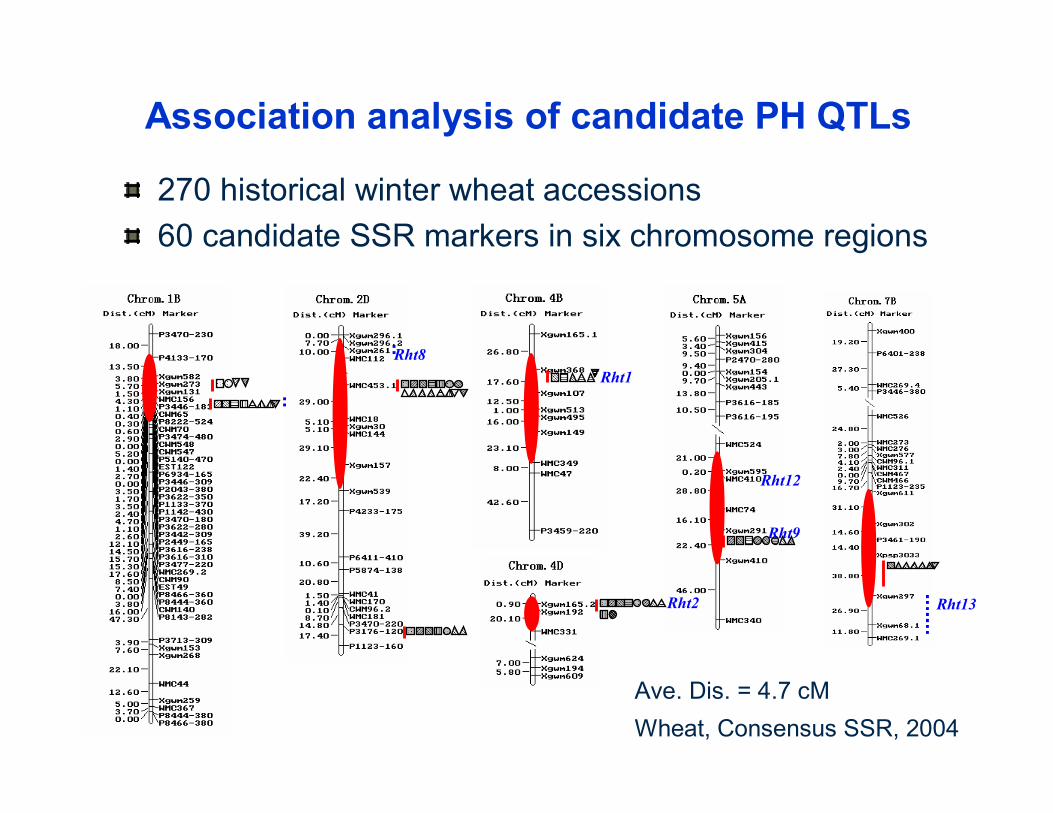
Association analysis of candidate PH QTLs
270 historical winter wheat accessions 60 candidate SSR markers in six chromosome regions
Rht8Rht1
Rht2 Rht13
Ave. Dis. = 4.7 cMWheat, Consensus SSR, 2004
2.0
2.5
3.0
3.5
4.0
4.5
5.0
5.5
6.0
6.5
Xcfd43
-PH2
Xcfd43
-DTC2
Xwmc349
-PHm
Xgwm30
2-PH3
Xgwm49
5-PH3
Xgwm49
5-PHm
Xgwm49
5-PH1
Xgwm24
9-PH3
Xgwm24
9-PH4
Xbarc1
09-P
H1Xba
rc109
-PH1
Xbarc1
09-P
H2Xba
rc109
-PH2
Associations
-Lg(
P va
lue)
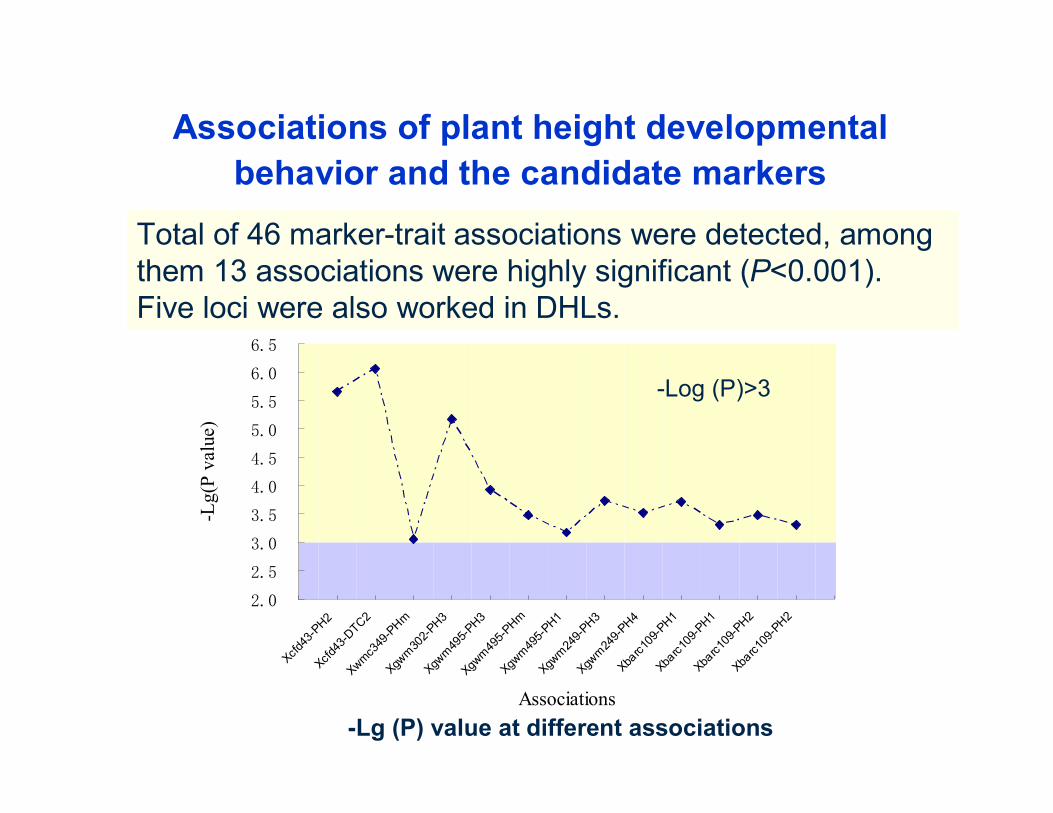
Associations of plant height developmental behavior and the candidate markers
Total of 46 marker-trait associations were detected, among them 13 associations were highly significant (P<0.001).Five loci were also worked in DHLs.
-Log (P)>3
-Lg (P) value at different associations
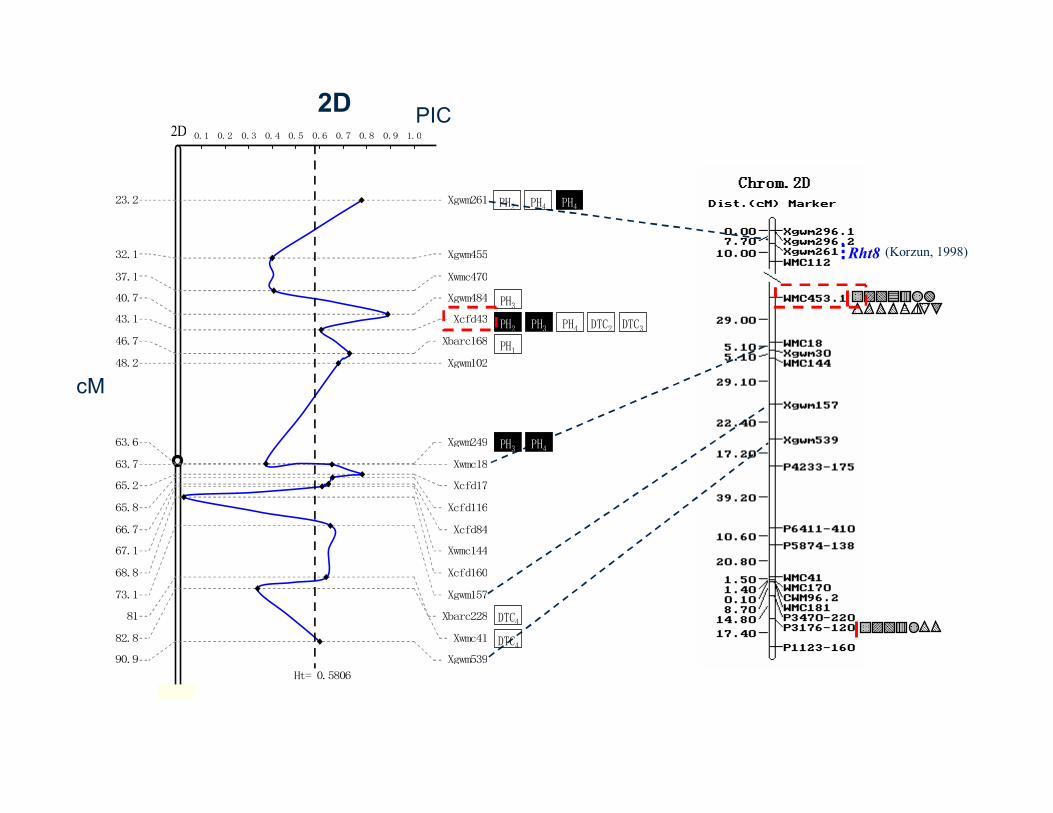
Rht8 (Korzun, 1998)
0.1 0.2 0.3 0.4 0.5 0.6 0.7 0.8 0.9 1.0
23.2 Xgwm261
32.1 Xgwm455
37.1 Xwmc470
40.7 Xgwm484
43.1 Xcfd43
46.7 Xbarc168
48.2 Xgwm102
63.6 Xgwm249
63.7 Xwmc18
65.2 Xcfd17
65.8 Xcfd116
66.7 Xcfd84
67.1 Xwmc144
68.8 Xcfd160
73.1 Xgwm157
81 Xbarc228
82.8 Xwmc41
90.9 Xgwm539
Ht= 0.5806
PH2 PH4 PH4
PH3
PH2 PH3 PH4 DTC2 DTC3
PH1
PH3 PH4
DTC4
DTC4
2D2D PIC
cM
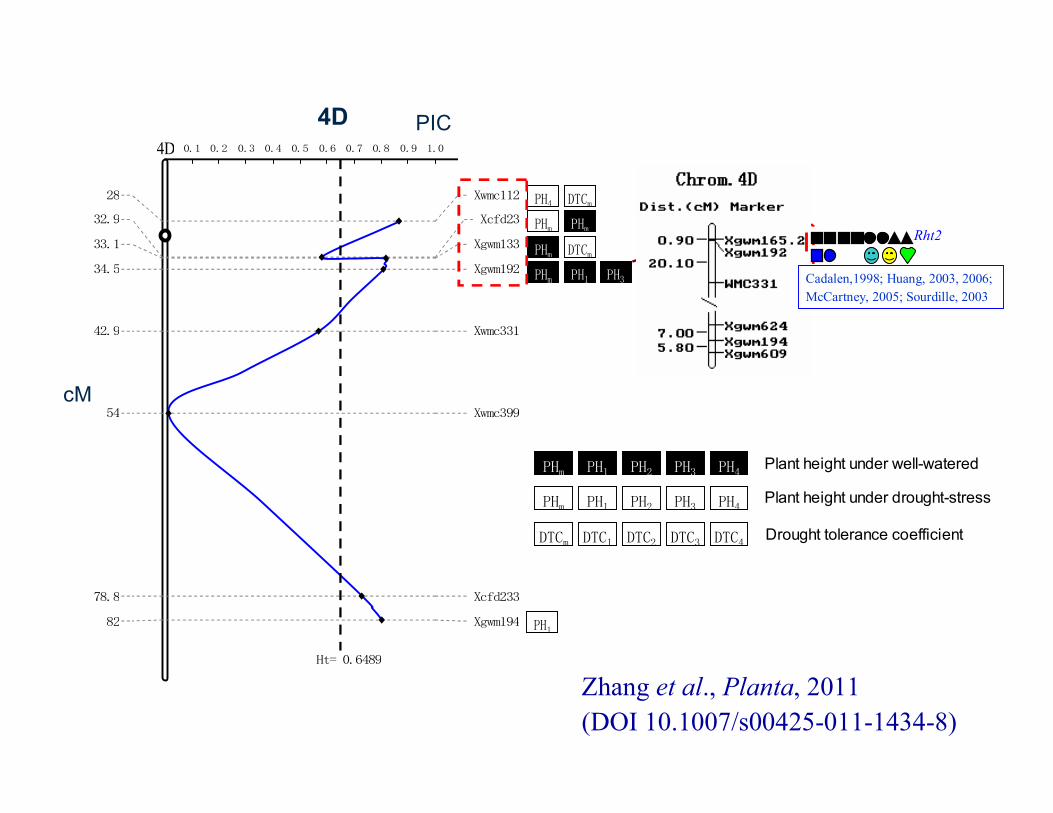
0.1 0.2 0.3 0.4 0.5 0.6 0.7 0.8 0.9 1.0
28 Xwmc112
32.9 Xcfd23
33.1 Xgwm133
34.5 Xgwm192
42.9 Xwmc331
54 Xwmc399
78.8 Xcfd233
82 Xgwm194
Ht= 0.6489
DTCm
PHm
PH4
PHm
PHm DTCm
PHm PH1 PH3
PH1
4D
4D
PHm PH1 PH2 PH3 PH4
PHm PH1 PH2 PH3 PH4
DTCm DTC1 DTC2 DTC3 DTC4
Plant height under well-watered
Plant height under drought-stress
Drought tolerance coefficient
cM
PIC
Rht2
Cadalen,1998; Huang, 2003, 2006;McCartney, 2005; Sourdille, 2003
Zhang et al., Planta, 2011 (DOI 10.1007/s00425-011-1434-8)
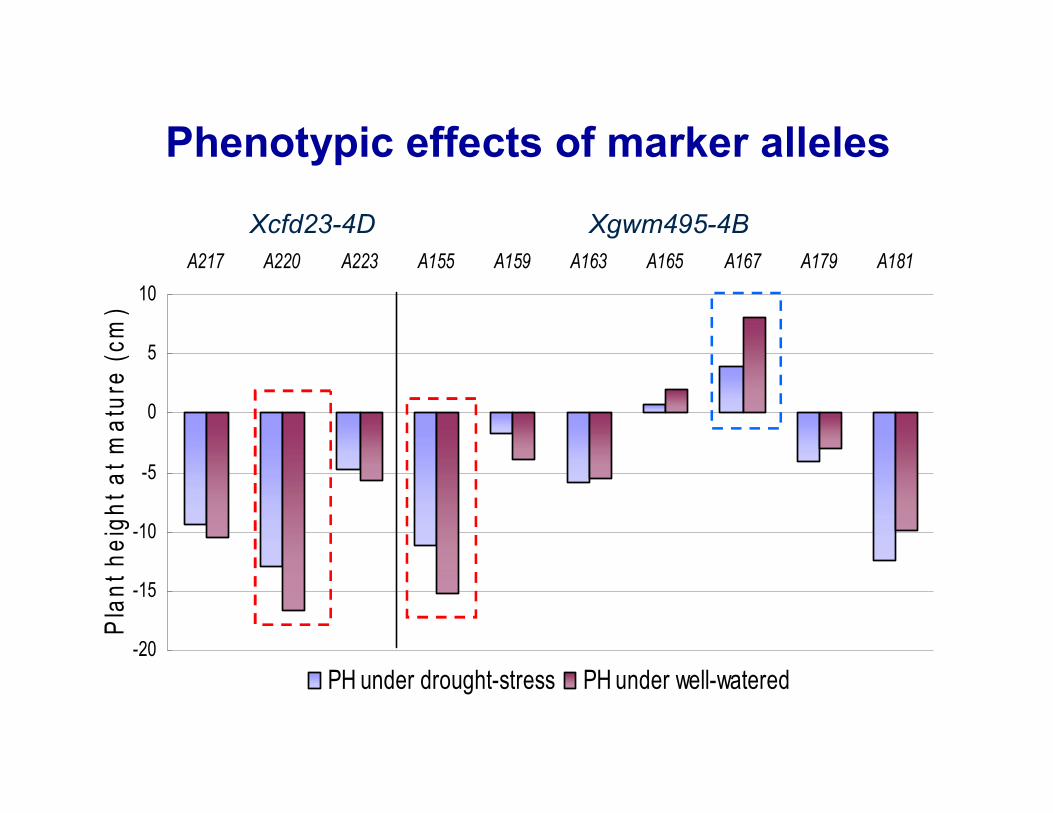
Phenotypic effects of marker alleles
-20
-15
-10
-5
0
5
10A217 A220 A223 A155 A159 A163 A165 A167 A179 A181
Plan
t hei
ght a
t mat
ure
(cm
)
PH under drought-stress PH under well-watered
Xcfd23-4D Xgwm495-4B
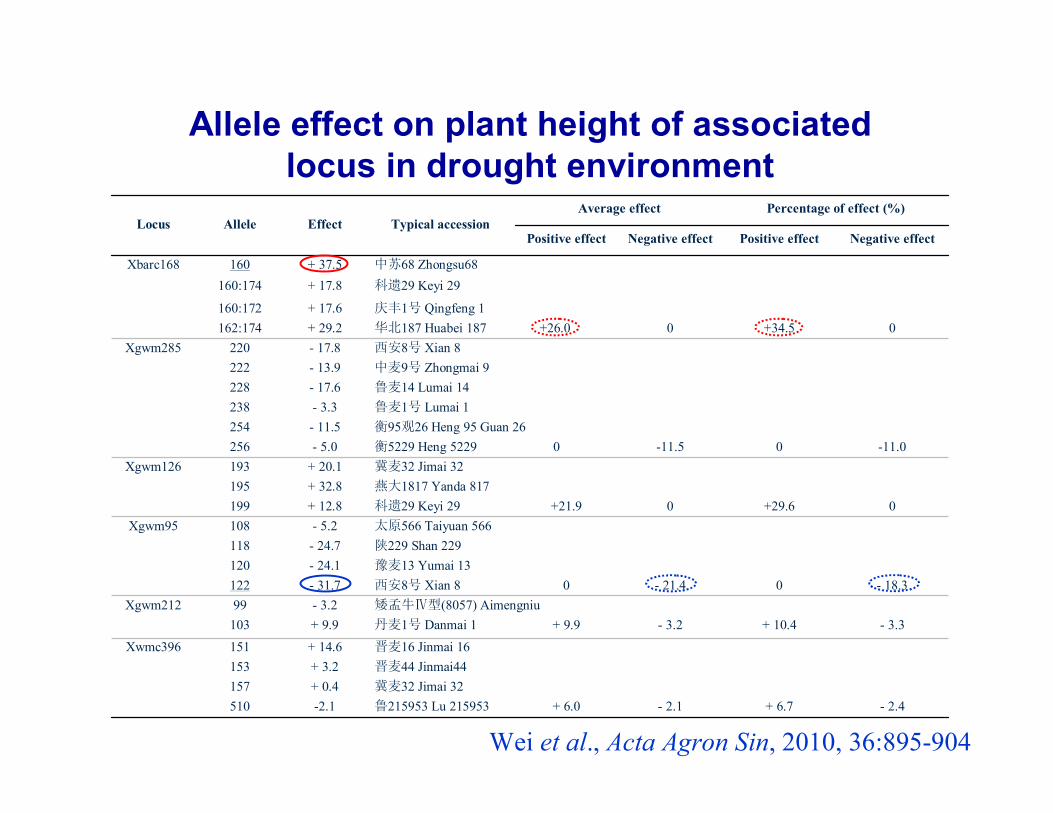
- 2.4+ 6.7- 2.1+ 6.0鲁215953 Lu 215953-2.1510冀麦32 Jimai 32+ 0.4157晋麦44 Jinmai44+ 3.2153晋麦16 Jinmai 16+ 14.6151Xwmc396
- 3.3+ 10.4- 3.2+ 9.9丹麦1号 Danmai 1+ 9.9103矮孟牛Ⅳ型(8057) Aimengniu- 3.299Xgwm212
- 18.30- 21.40西安8号 Xian 8- 31.7122豫麦13 Yumai 13- 24.1120陕229 Shan 229- 24.7118太原566 Taiyuan 566- 5.2108Xgwm95
0+29.60+21.9科遗29 Keyi 29+ 12.8199燕大1817 Yanda 817+ 32.8195冀麦32 Jimai 32+ 20.1193Xgwm126
-11.00-11.5衡5229 Heng 5229 0- 5.0256衡95观26 Heng 95 Guan 26 - 11.5254鲁麦1号 Lumai 1- 3.3238鲁麦14 Lumai 14- 17.6228中麦9号 Zhongmai 9- 13.9222西安8号 Xian 8- 17.8220Xgwm285
0+34.50华北187 Huabei 187 +26.0+ 29.2162:174庆丰1号 Qingfeng 1+ 17.6160:172
科遗29 Keyi 29+ 17.8160:174中苏68 Zhongsu68+ 37.5160Xbarc168
Negative effectPositive effectNegative effectPositive effect
Percentage of effect (%)Average effectTypical accessionEffectAlleleLocus
Allele effect on plant height of associated locus in drought environment
Wei et al., Acta Agron Sin, 2010, 36:895-904
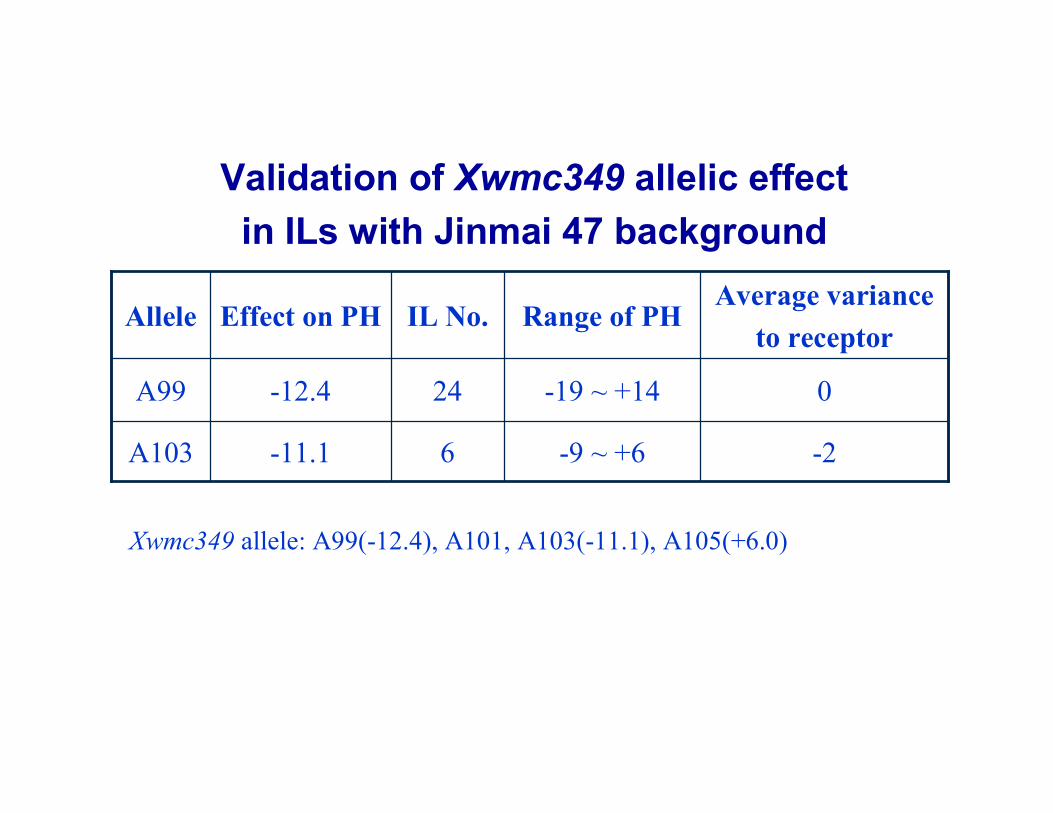
Validation of Xwmc349 allelic effect in ILs with Jinmai 47 background
-2-9 ~ +66-11.1A103
0-19 ~ +1424-12.4A99
Average variance to receptor
Range of PHIL No.Effect on PHAllele
Xwmc349 allele: A99(-12.4), A101, A103(-11.1), A105(+6.0)
Summary
Plant height is a typically quantitative trait controlled by additive effects and epistaticeffects.
A list of marker-PH association was identified in the chromosome regions of PH QTLs or Rht genes detected in DHLs.
Allele effects have to be validated in multi-genetic backgrounds.
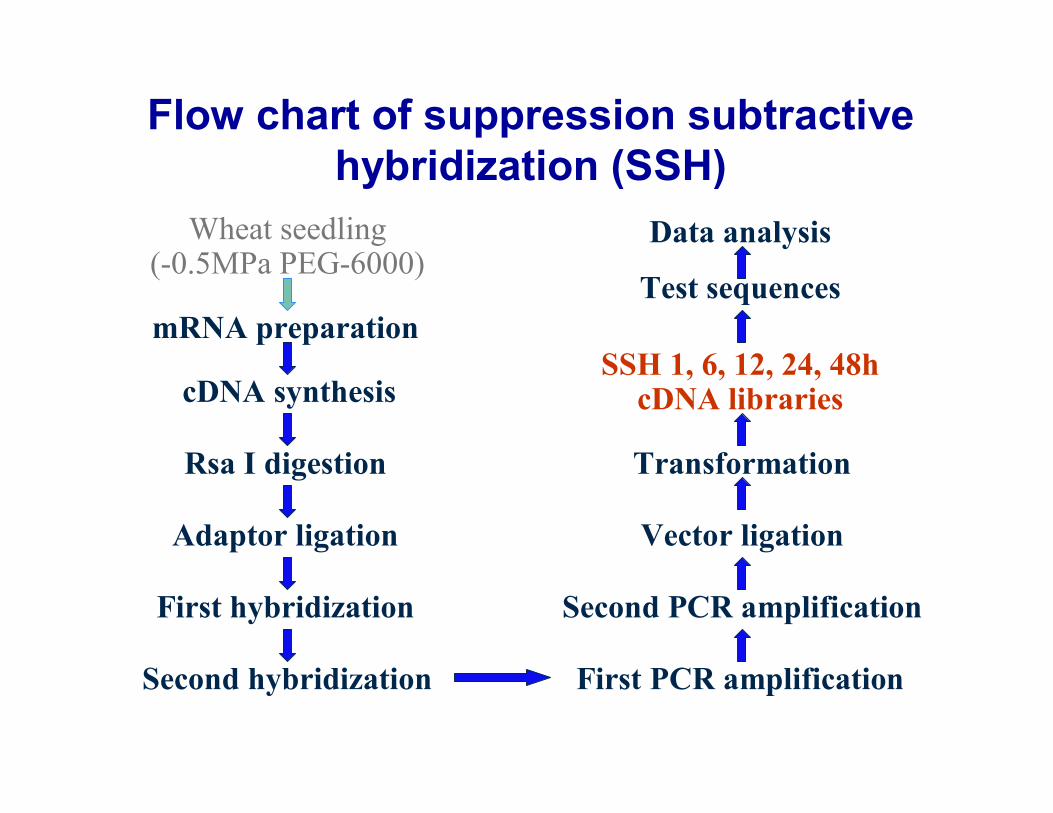
Flow chart of suppression subtractive hybridization (SSH)
Vector ligation
cDNA synthesis
Rsa I digestion
Adaptor ligation
Second hybridization
First hybridization
First PCR amplification
Second PCR amplification
Test sequences
Data analysis
Transformation
mRNA preparationSSH 1, 6, 12, 24, 48h
cDNA libraries
Wheat seedling(-0.5MPa PEG-6000)
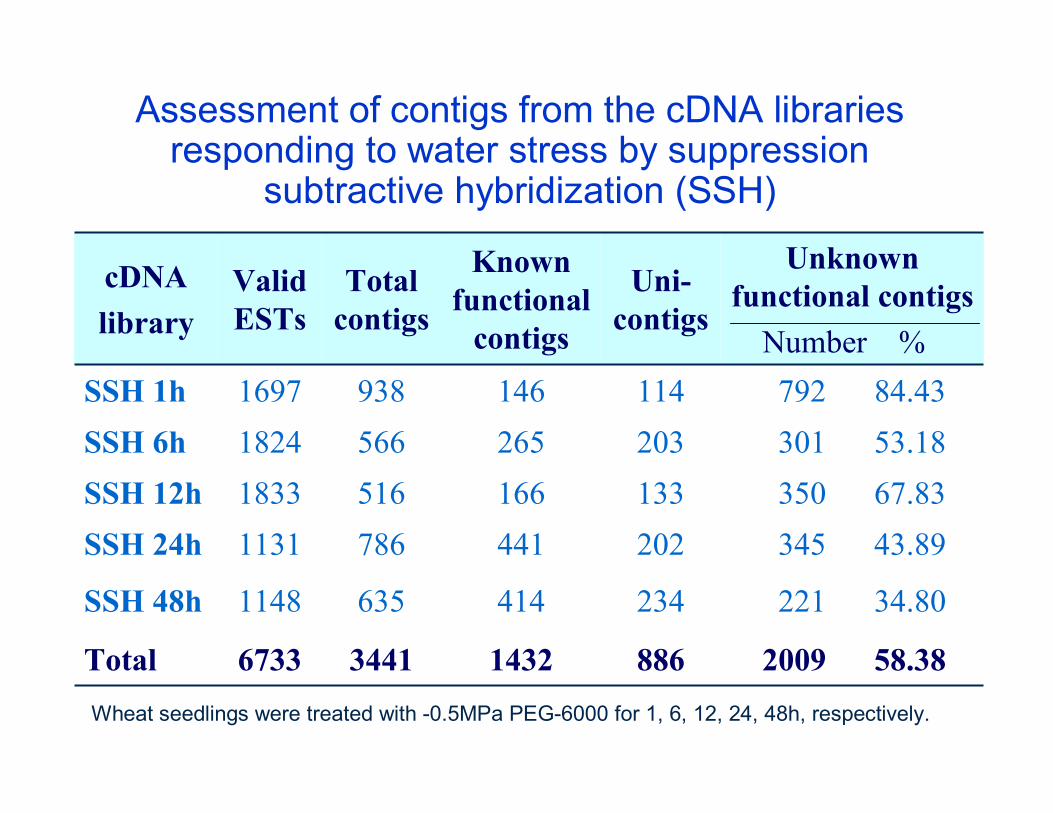
Assessment of contigs from the cDNA libraries responding to water stress by suppression
subtractive hybridization (SSH)
221 34.802344146351148SSH 48h
792 84.431141469381697SSH 1h301 53.182032655661824SSH 6h
345 43.892024417861131SSH 24h
2009 58.38886143234416733Total
166
Known functional
contigs
350 67.83
Unknown functional contigs
Number %
1335161833SSH 12h
Uni-contigs
Total contigs
Valid ESTs
cDNAlibrary
Wheat seedlings were treated with -0.5MPa PEG-6000 for 1, 6, 12, 24, 48h, respectively.
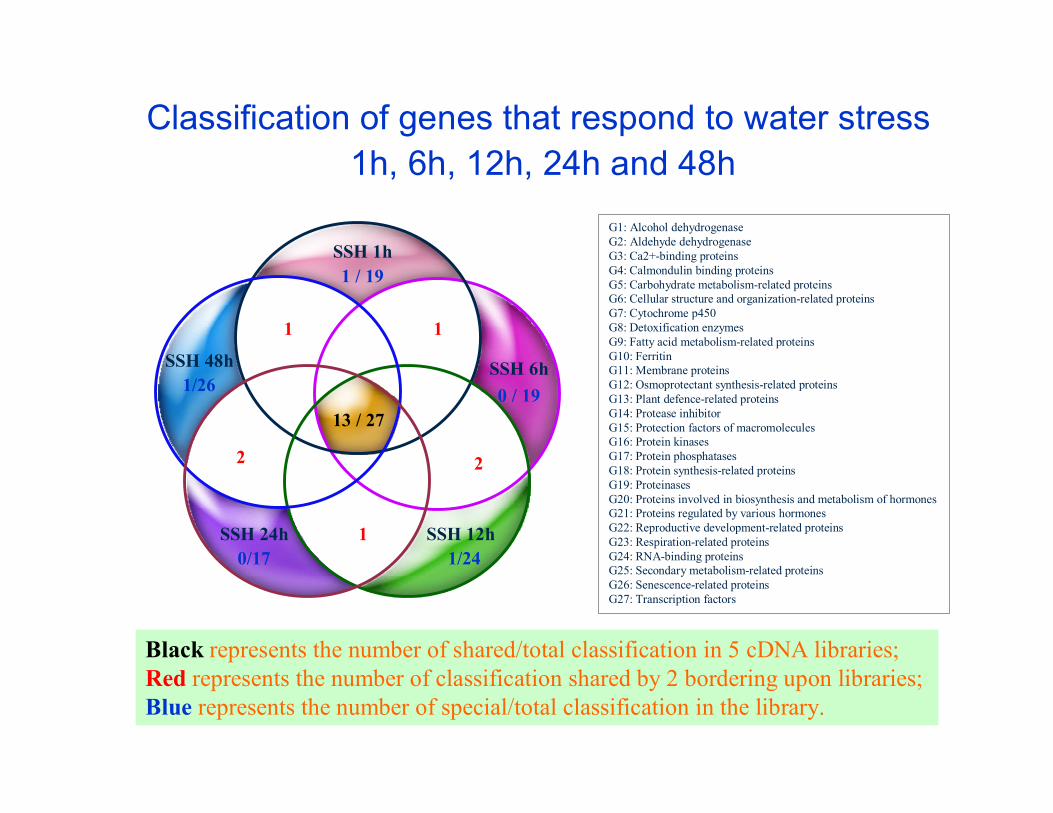
Classification of genes that respond to water stress1h, 6h, 12h, 24h and 48h
G1: Alcohol dehydrogenaseG2: Aldehyde dehydrogenaseG3: Ca2+-binding proteins G4: Calmondulin binding proteins G5: Carbohydrate metabolism-related proteins G6: Cellular structure and organization-related proteins G7: Cytochrome p450 G8: Detoxification enzymes G9: Fatty acid metabolism-related proteinsG10: FerritinG11: Membrane proteins G12: Osmoprotectant synthesis-related proteins G13: Plant defence-related proteins G14: Protease inhibitor G15: Protection factors of macromolecules G16: Protein kinasesG17: Protein phosphatasesG18: Protein synthesis-related proteins G19: ProteinasesG20: Proteins involved in biosynthesis and metabolism of hormones G21: Proteins regulated by various hormones G22: Reproductive development-related proteins G23: Respiration-related proteins G24: RNA-binding proteinsG25: Secondary metabolism-related proteins G26: Senescence-related proteins G27: Transcription factors
SSH 1h1 / 19
SSH 6h 0 / 19
SSH 12h 1/24
SSH 24h0/17
SSH 48h1/26
13 / 27
1 1
2
1
2
Black represents the number of shared/total classification in 5 cDNA libraries;Red represents the number of classification shared by 2 bordering upon libraries;Blue represents the number of special/total classification in the library.
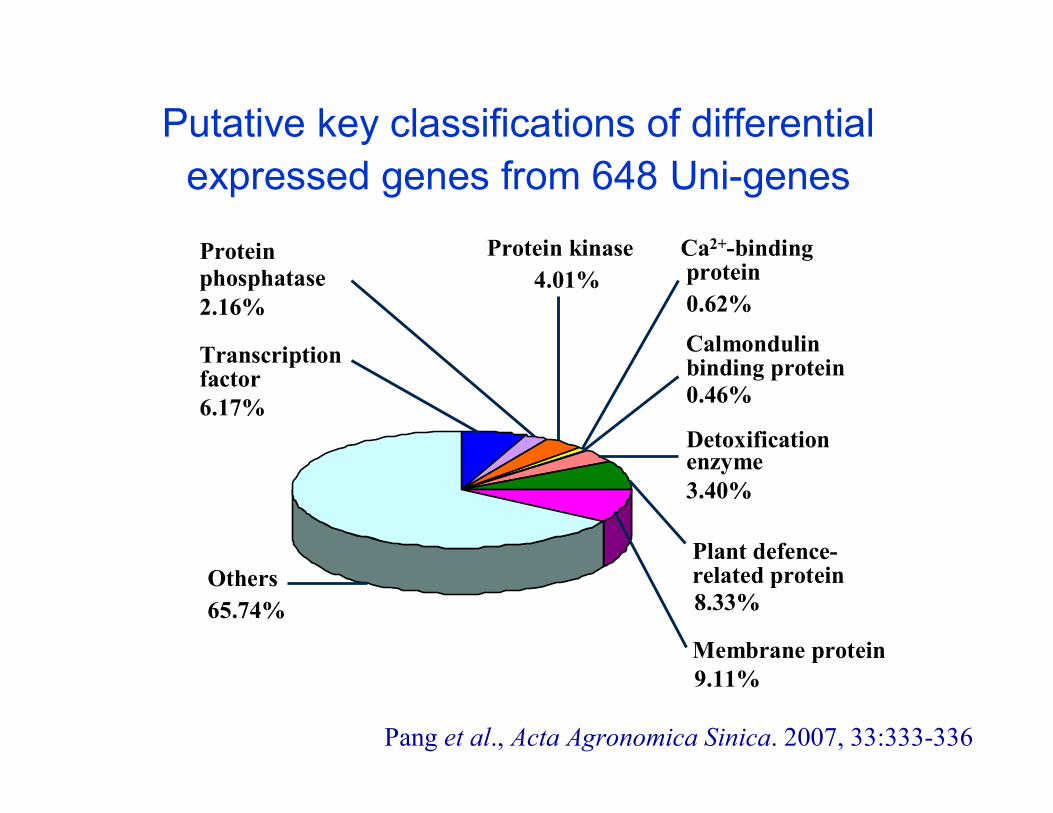
Putative key classifications of differential expressed genes from 648 Uni-genes
Others65.74%
Transcriptionfactor6.17%
Calmondulinbinding protein0.46%
Ca2+-bindingprotein0.62%
Proteinphosphatase2.16%
Detoxificationenzyme3.40%
Plant defence-related protein8.33%
Membrane protein9.11%
Protein kinase4.01%
Pang et al., Acta Agronomica Sinica. 2007, 33:333-336
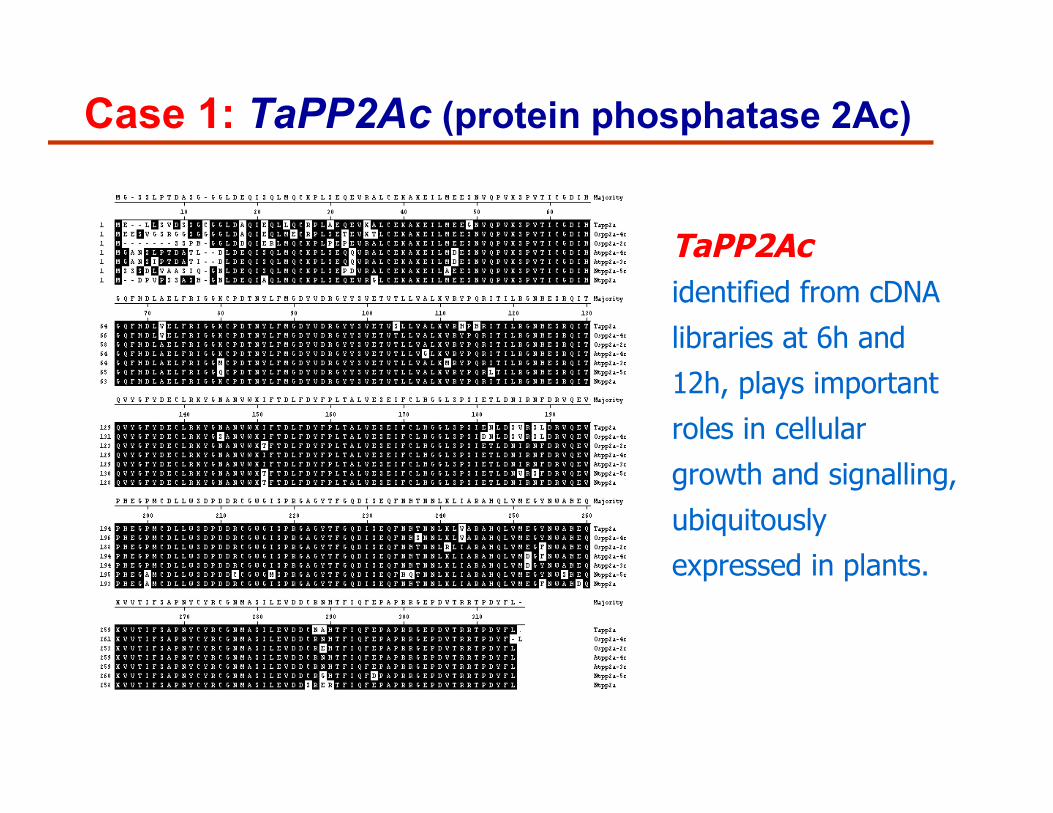
TaPP2Acidentified from cDNA
libraries at 6h and 12h, plays important
roles in cellular
growth and signalling,
ubiquitously expressed in plants.
Case 1: TaPP2Ac (protein phosphatase 2Ac)
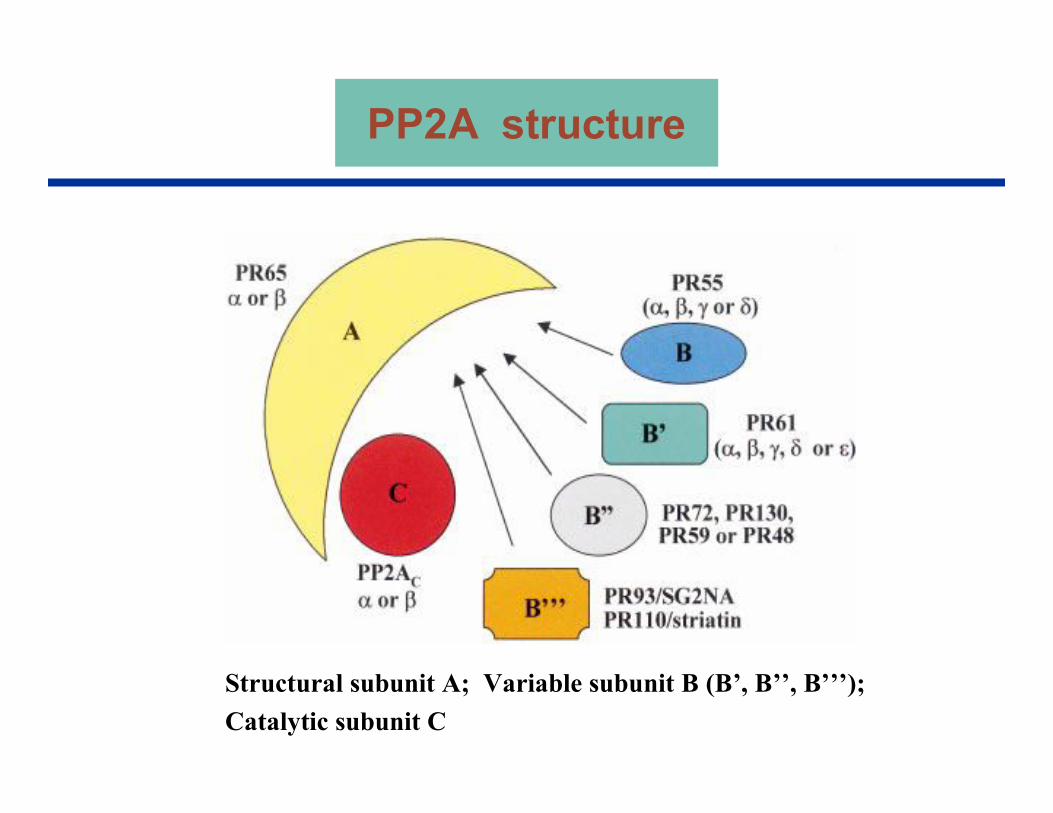
Structural subunit A; Variable subunit B (B’, B’’, B’’’); Catalytic subunit C
PP2A structure
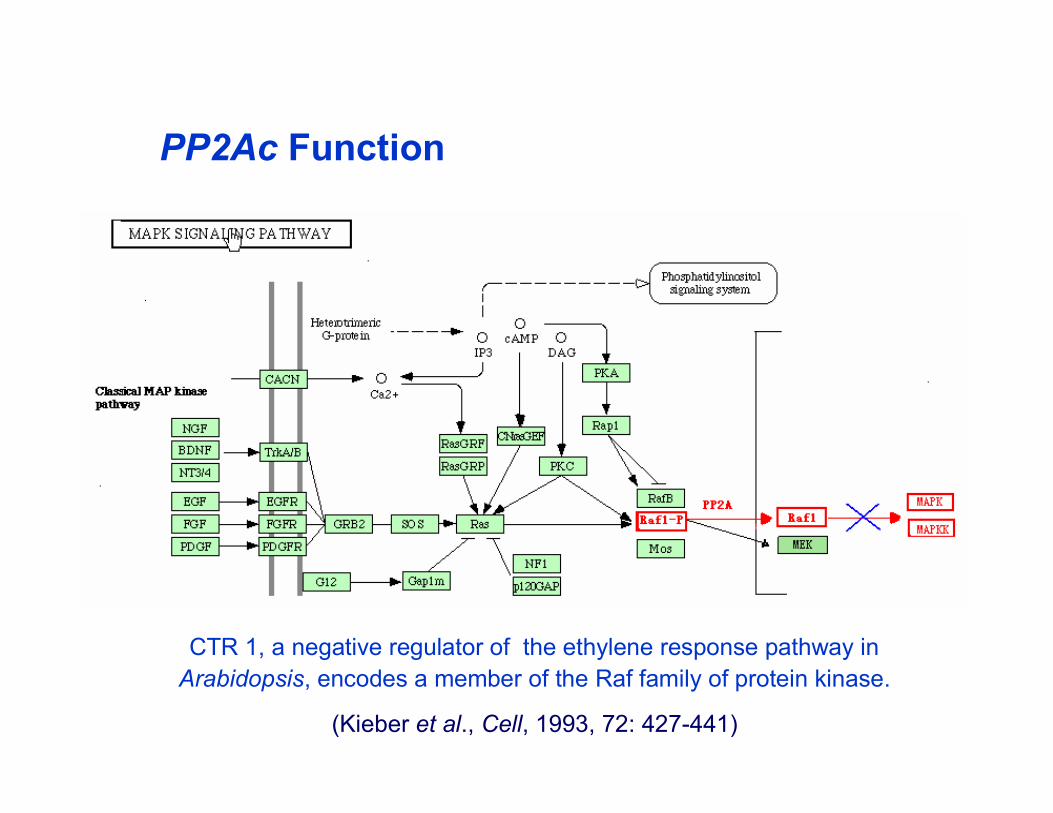
CTR 1, a negative regulator of the ethylene response pathway inArabidopsis, encodes a member of the Raf family of protein kinase.
(Kieber et al., Cell, 1993, 72: 427-441)
PP2Ac Function
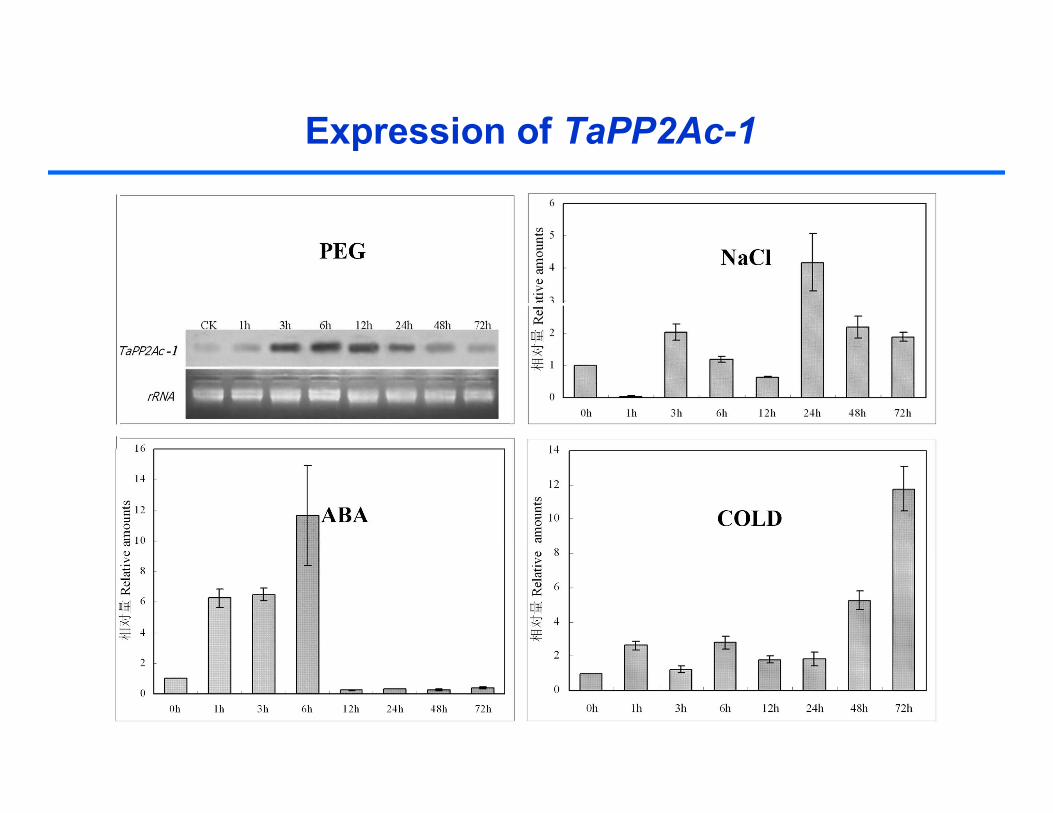
Expression of TaPP2Ac-1
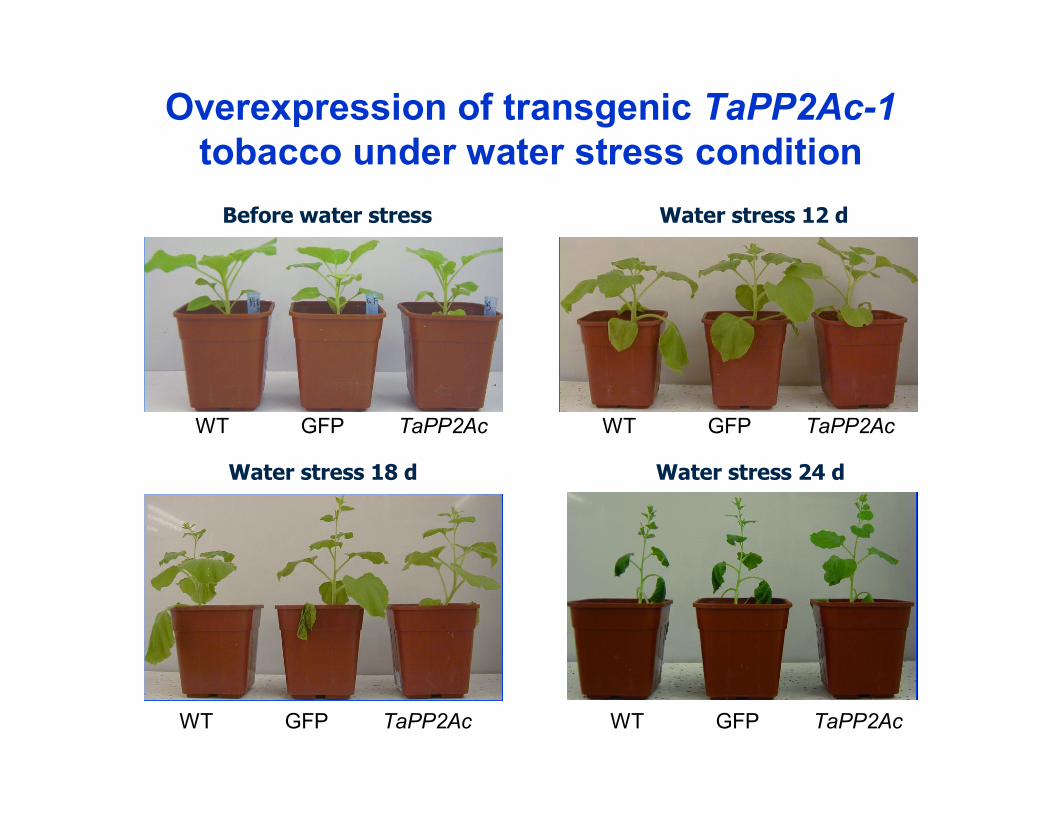
Overexpression of transgenic TaPP2Ac-1 tobacco under water stress condition
Water stress 12 d
WT GFP TaPP2Ac
Before water stress
WT GFP TaPP2Ac
WT GFP TaPP2Ac
Water stress 18 d Water stress 24 d
WT GFP TaPP2Ac
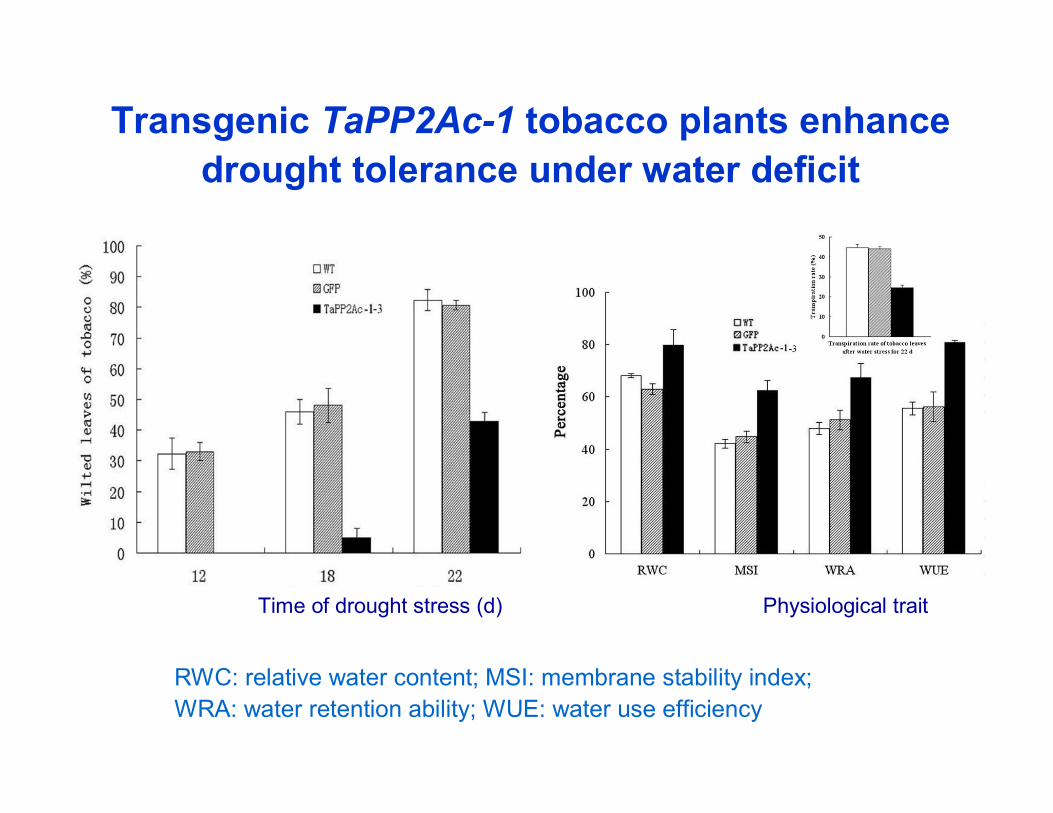
Transgenic TaPP2Ac-1 tobacco plants enhance drought tolerance under water deficit
RWC: relative water content; MSI: membrane stability index;WRA: water retention ability; WUE: water use efficiency
Time of drought stress (d) Physiological trait
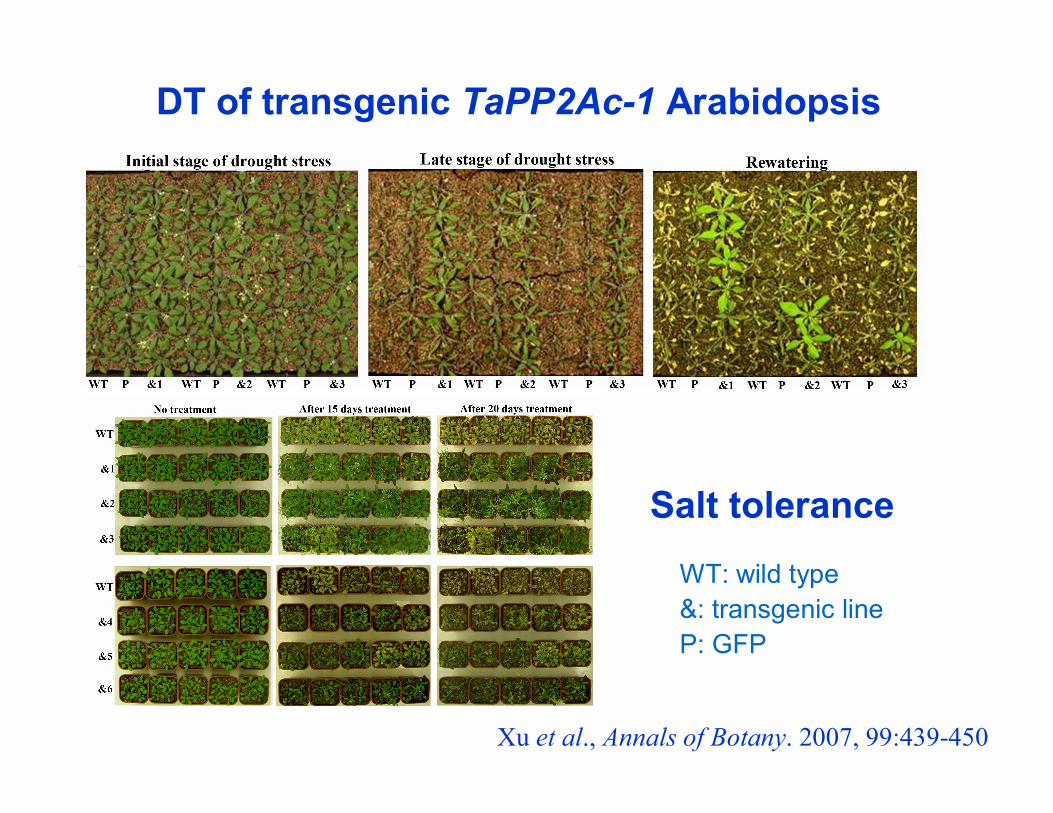
Xu et al., Annals of Botany. 2007, 99:439-450
Salt tolerance
WT: wild type &: transgenic lineP: GFP
DT of transgenic TaPP2Ac-1 Arabidopsis
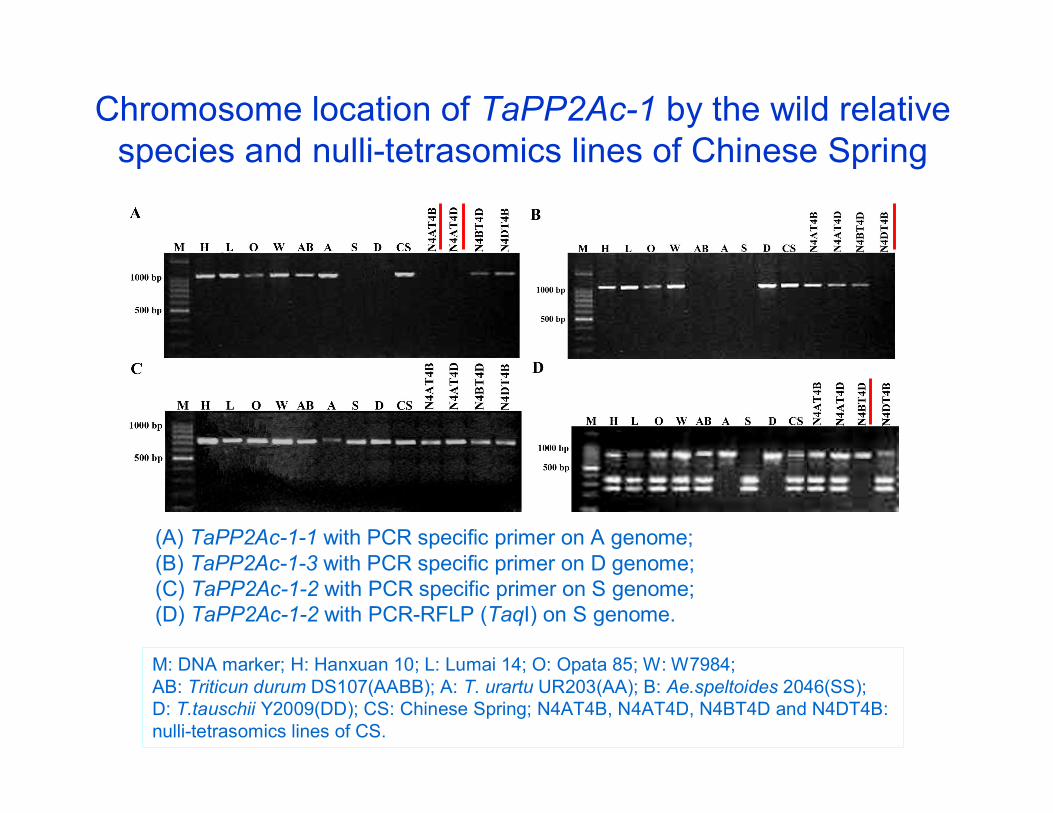
Chromosome location of TaPP2Ac-1 by the wild relative species and nulli-tetrasomics lines of Chinese Spring
(A) TaPP2Ac-1-1 with PCR specific primer on A genome; (B) TaPP2Ac-1-3 with PCR specific primer on D genome; (C) TaPP2Ac-1-2 with PCR specific primer on S genome; (D) TaPP2Ac-1-2 with PCR-RFLP (TaqI) on S genome.
M: DNA marker; H: Hanxuan 10; L: Lumai 14; O: Opata 85; W: W7984; AB: Triticun durum DS107(AABB); A: T. urartu UR203(AA); B: Ae.speltoides 2046(SS); D: T.tauschii Y2009(DD); CS: Chinese Spring; N4AT4B, N4AT4D, N4BT4D and N4DT4B: nulli-tetrasomics lines of CS.
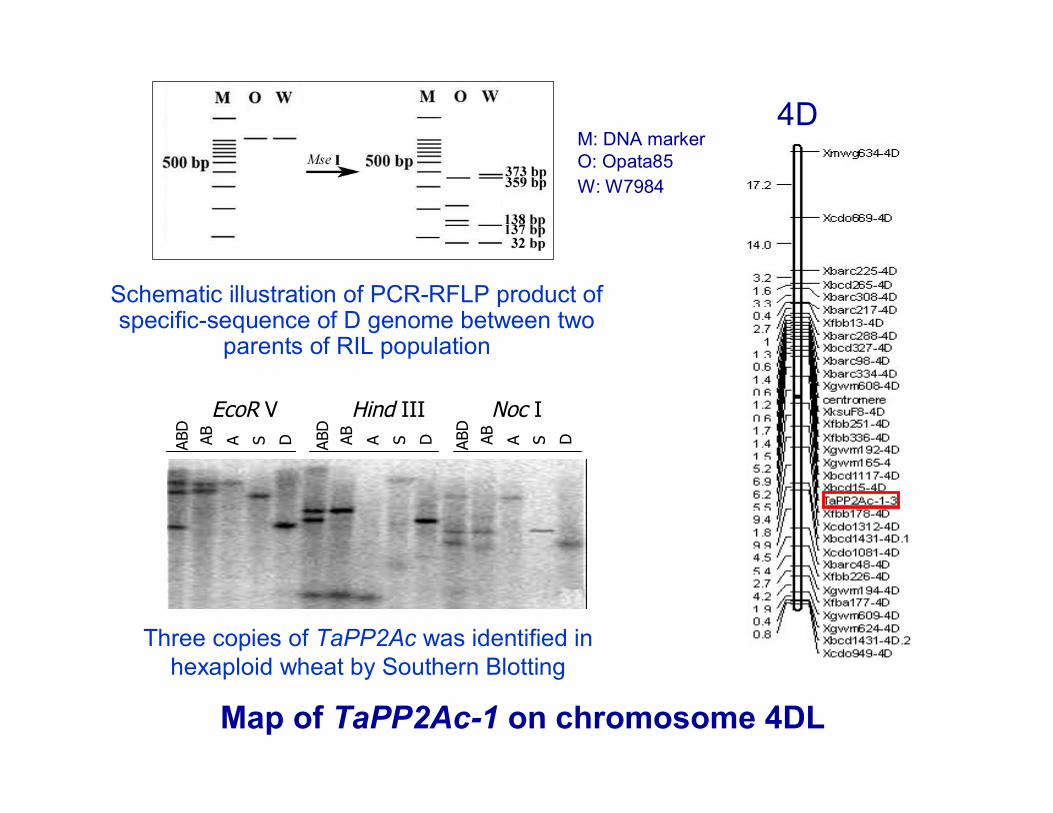
Map of TaPP2Ac-1 on chromosome 4DL
Three copies of TaPP2Ac was identified in hexaploid wheat by Southern Blotting
4D
Schematic illustration of PCR-RFLP product of specific-sequence of D genome between two
parents of RIL population
M: DNA markerO: Opata85 W: W7984
ABD
AB SA D ABD
AB SA D
Hind III Noc I
ABD
AB SA D
EcoR V
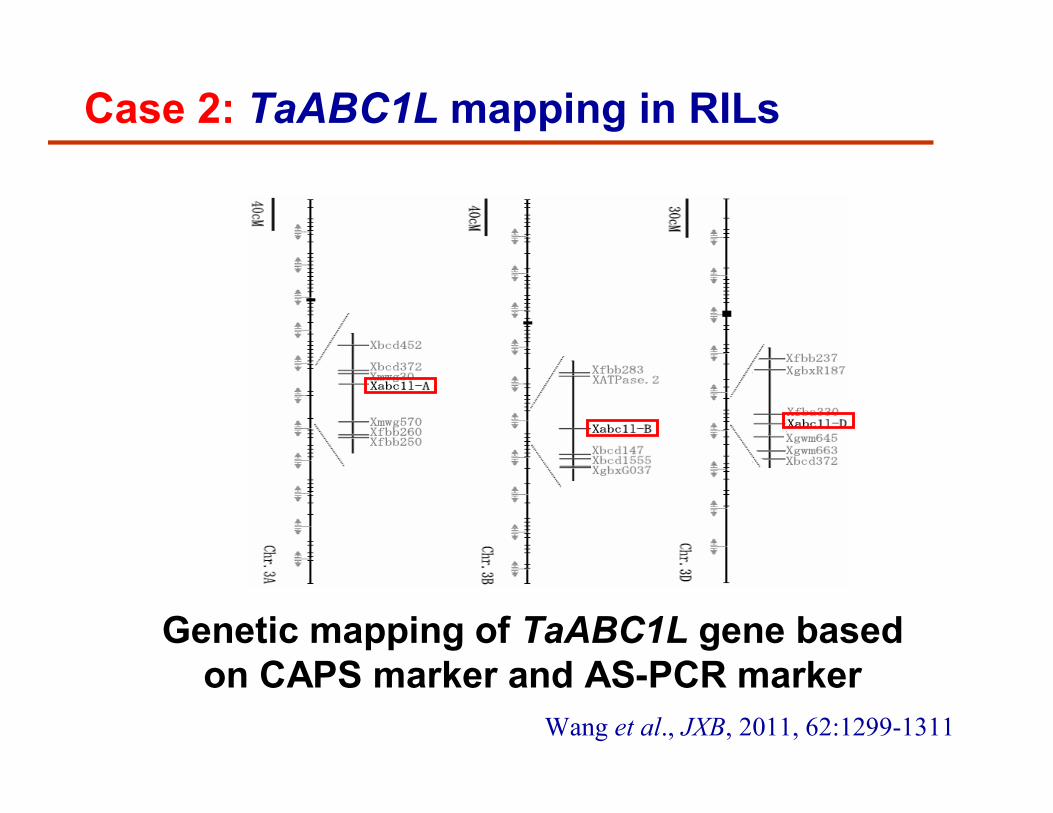
Genetic mapping of TaABC1L gene based on CAPS marker and AS-PCR marker
Case 2: TaABC1L mapping in RILs
Wang et al., JXB, 2011, 62:1299-1311
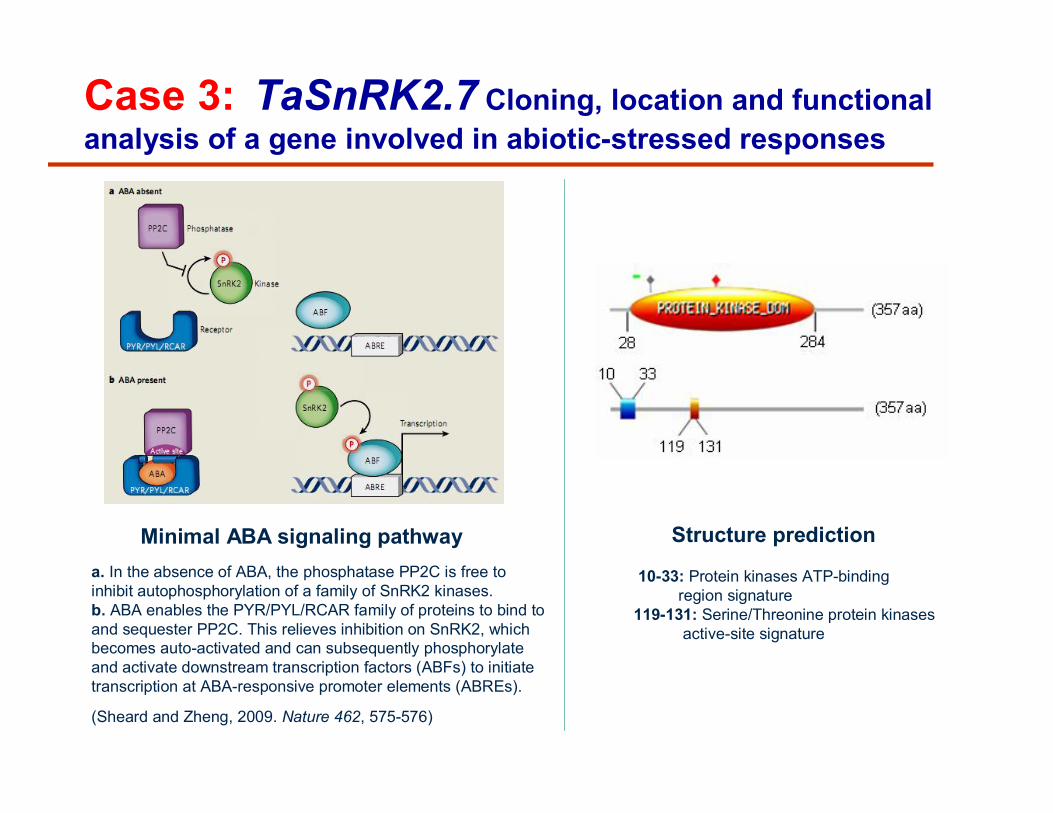
Case 3: TaSnRK2.7 Cloning, location and functionalanalysis of a gene involved in abiotic-stressed responses
a. In the absence of ABA, the phosphatase PP2C is free to inhibit autophosphorylation of a family of SnRK2 kinases. b. ABA enables the PYR/PYL/RCAR family of proteins to bind to and sequester PP2C. This relieves inhibition on SnRK2, which becomes auto-activated and can subsequently phosphorylateand activate downstream transcription factors (ABFs) to initiate transcription at ABA-responsive promoter elements (ABREs).
Minimal ABA signaling pathway Structure prediction
10-33: Protein kinases ATP-bindingregion signature
119-131: Serine/Threonine protein kinasesactive-site signature
(Sheard and Zheng, 2009. Nature 462, 575-576)
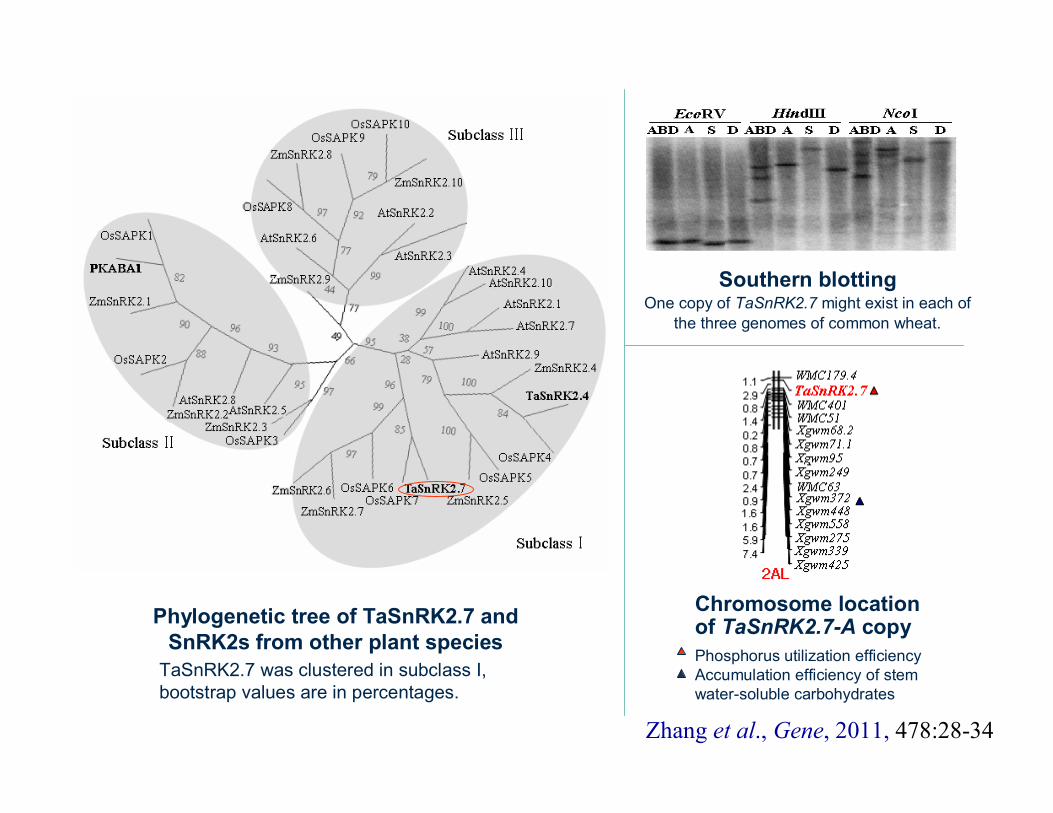
TaSnRK2.7 was clustered in subclass I, bootstrap values are in percentages.
Phylogenetic tree of TaSnRK2.7 and SnRK2s from other plant species
Southern blottingOne copy of TaSnRK2.7 might exist in each of
the three genomes of common wheat.
Chromosome location of TaSnRK2.7-A copyPhosphorus utilization efficiencyAccumulation efficiency of stem water-soluble carbohydrates
Zhang et al., Gene, 2011, 478:28-34
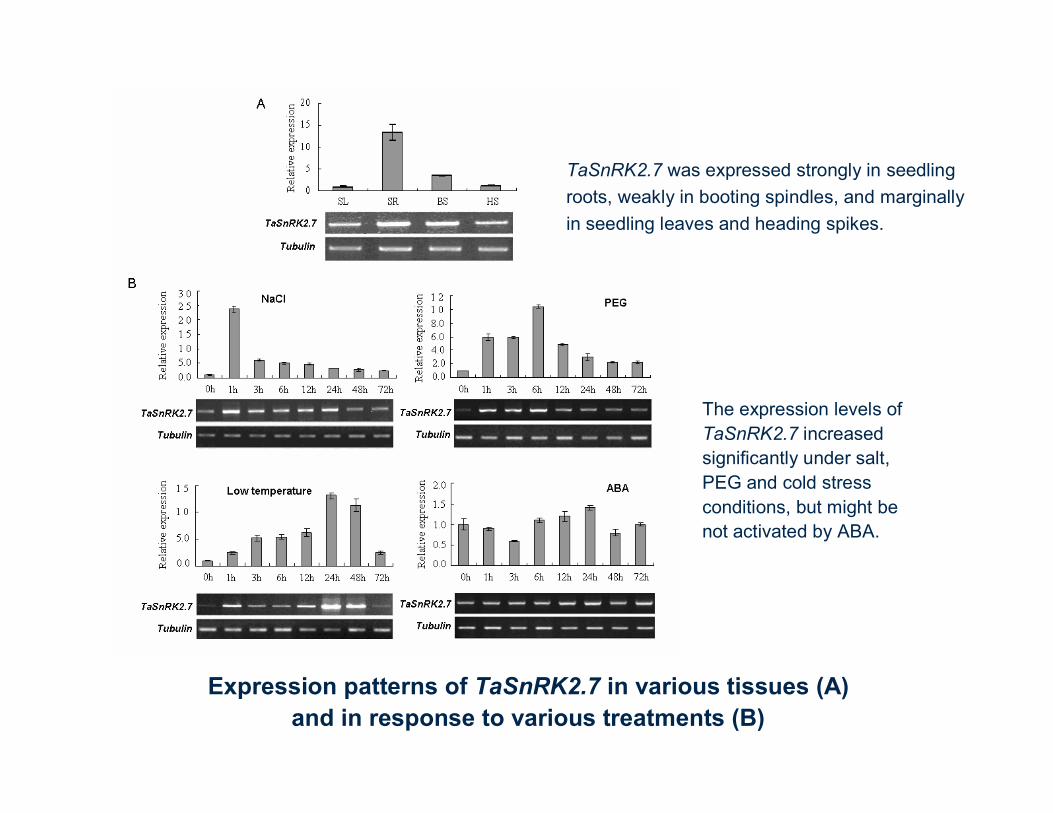
Expression patterns of TaSnRK2.7 in various tissues (A) and in response to various treatments (B)
TaSnRK2.7 was expressed strongly in seedling roots, weakly in booting spindles, and marginally in seedling leaves and heading spikes.
The expression levels of TaSnRK2.7 increased significantly under salt, PEG and cold stress conditions, but might benot activated by ABA.
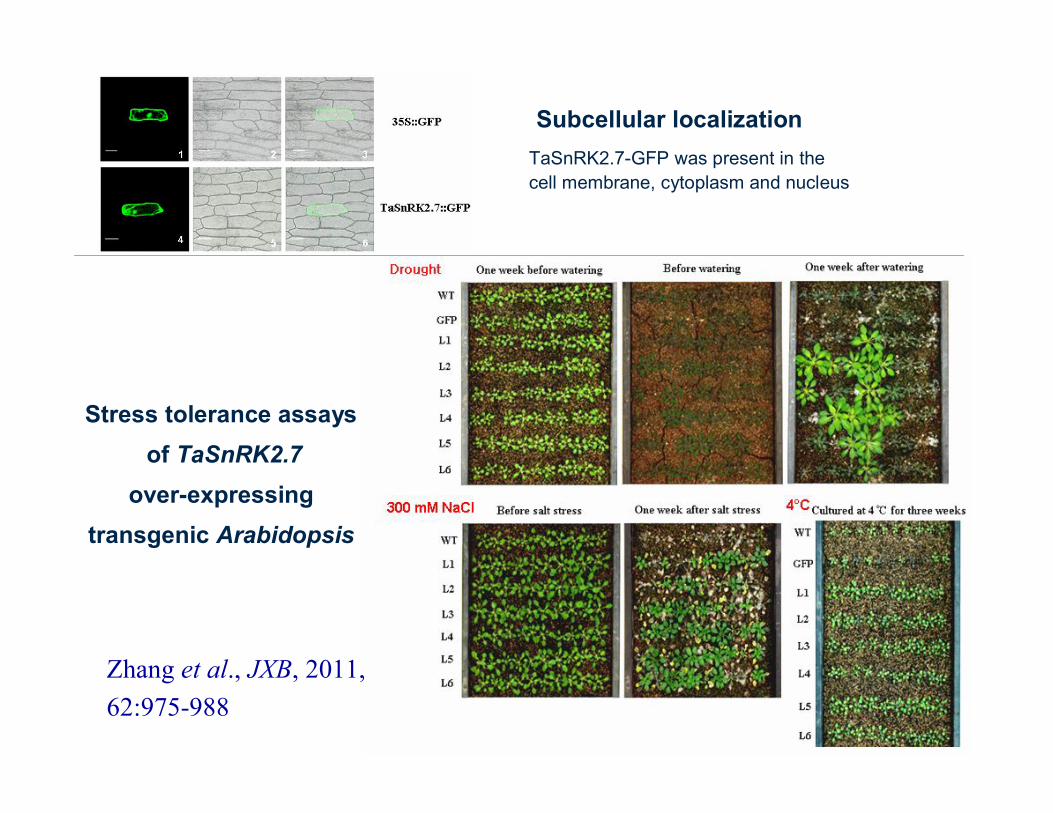
Subcellular localization
Stress tolerance assaysof TaSnRK2.7
over-expressing transgenic Arabidopsis
TaSnRK2.7-GFP was present in thecell membrane, cytoplasm and nucleus
Zhang et al., JXB, 2011, 62:975-988
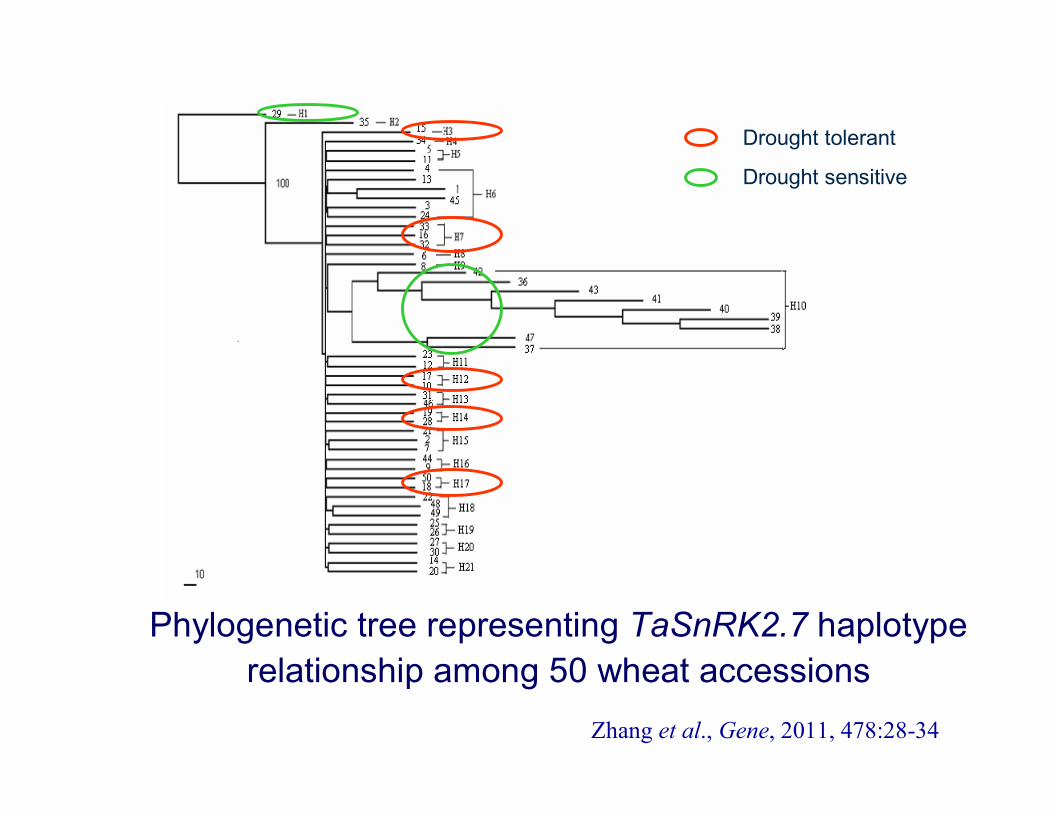
Drought tolerant
Drought sensitive
Phylogenetic tree representing TaSnRK2.7 haplotyperelationship among 50 wheat accessions
Zhang et al., Gene, 2011, 478:28-34
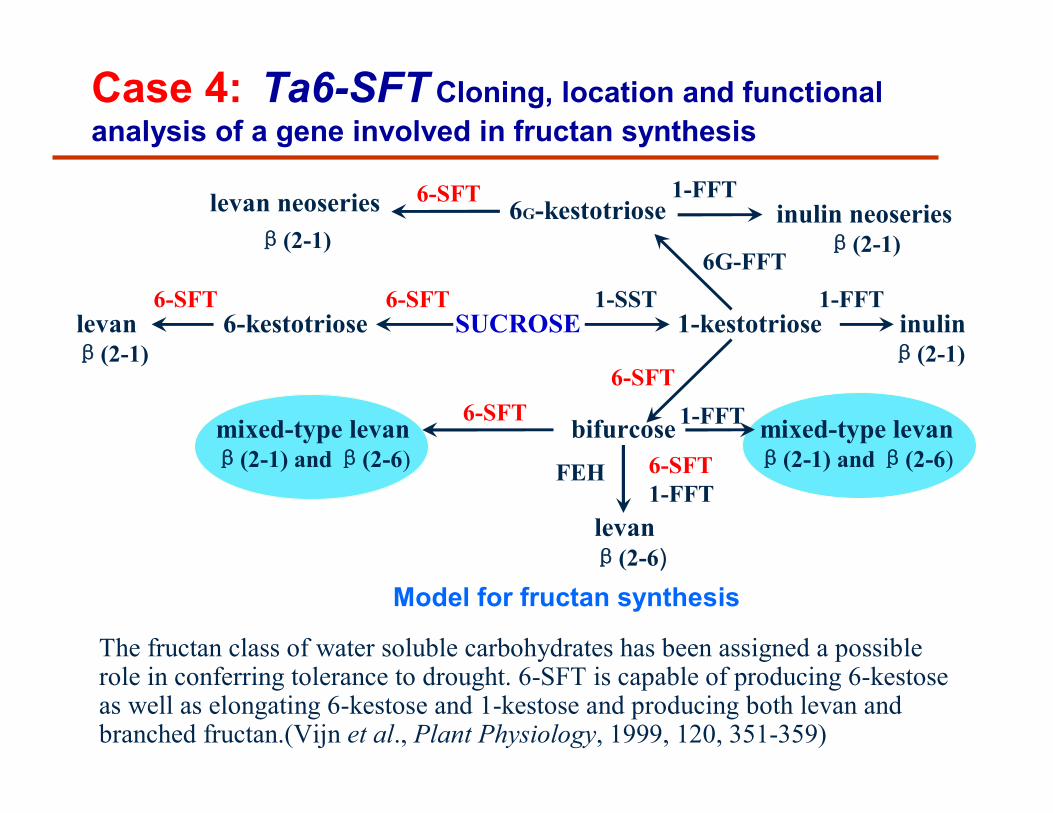
Model for fructan synthesis
levan neoseriesβ(2-1)
6G-kestotriose inulin neoseriesβ(2-1)
levanβ(2-1)
6-kestotriose SUCROSE 1-kestotriose inulinβ(2-1)
mixed-type levanβ(2-1) and β(2-6)
bifurcose mixed-type levanβ(2-1) and β(2-6)
levanβ(2-6)
1-SST6-SFT
6-SFT
6G-FFT
6-SFT
6-SFT
6-SFT1-FFT
1-FFT
FEH
1-FFT
1-FFT6-SFT
Case 4: Ta6-SFT Cloning, location and functional analysis of a gene involved in fructan synthesis
The fructan class of water soluble carbohydrates has been assigned a possible role in conferring tolerance to drought. 6-SFT is capable of producing 6-kestose as well as elongating 6-kestose and 1-kestose and producing both levan and branched fructan.(Vijn et al., Plant Physiology, 1999, 120, 351-359)
10 20 30 40 50
T A C C A A A C T C T C T T A G A G T T C A C G A G C G G C G C T G C G A T G G G G T C A C A C G G C A A G C C A C C
T A C C A A A C T C T C T T A G A G T T C A C G A G G G G C G C T G C G A T G G G G T C A C A C G G C A A G C C A C C
T A C C A A A C T C T C T T A G A G T T C A C G A G C G G C G C T G C G A T G G G G T C A C A C G G C A A G C C A C C
3380 3390 3400 3410 3420 3430
T G T C A C T G T G A A C T A C A G T A T A T T A C T T T G T T G G G C G T A G A A T C G A T A T A G T T T G G G T G G G T G G
T G T C A T A G T G A A C T - - - - - A T A T T A C T T T G T T G G G C G T A G A A T C A A T A T A G T T T G A G T G G G T G G
T G T C A C A G T G A A C T A - - - - - T A T T A C T T T G T T G G G T G T A G G A T C G A T A T A G T T T G G G T G G G T G G
550 560 570 580 590
A C G G G A T C T C T C T C T - - A G G C A T A A T C A A A A - - - - T T G C T T A A C T C A C A C C A A
A C G G G A T C T C T C T C T C T A G A C A T A A T C A A A A G G G A T T G T T T A A C T C A C A C C A A
A C G G G A T C T C T C T C T - - A G A C A T A A T C A A A A - - - - T T G C T T A A C T C G C A C C A A
6-SFT-A16-SFT-A26-SFT-D1
6-SFT-A2 specific primer
6-SFT-A1 specific primer
6-SFT-D1 specific primer
6-SFT-A16-SFT-A26-SFT-D1
6-SFT-A16-SFT-A26-SFT-D1
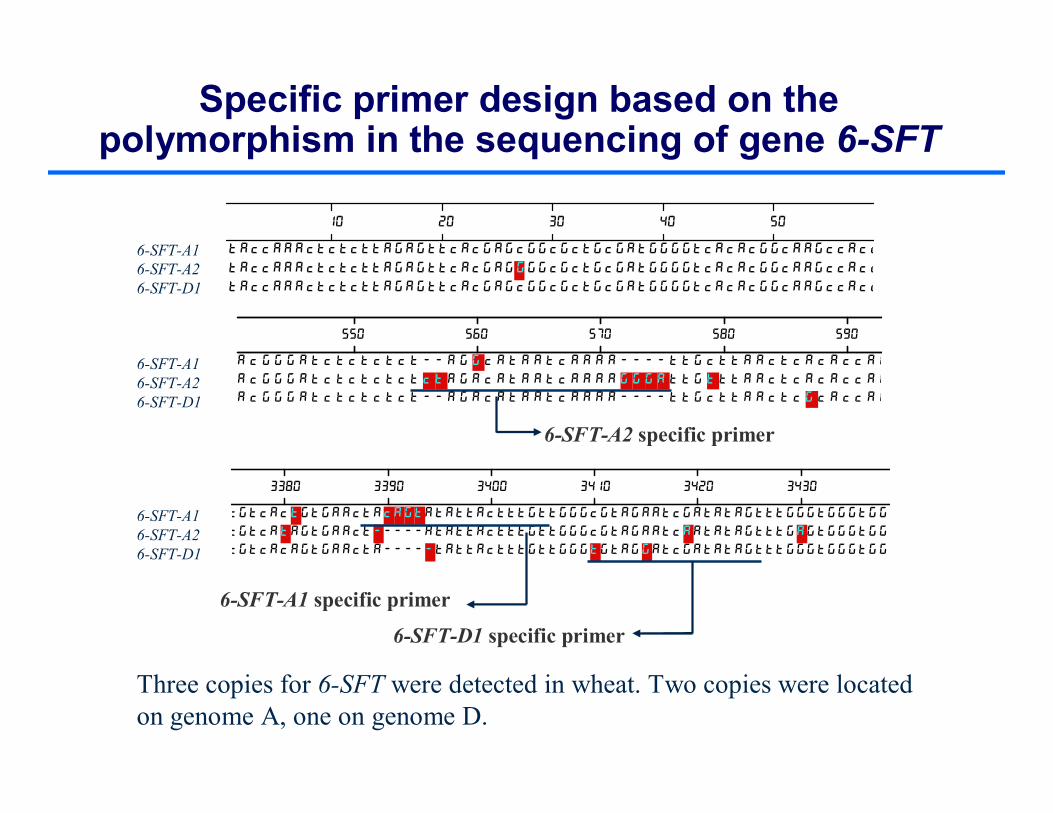
Specific primer design based on the polymorphism in the sequencing of gene 6-SFT
Three copies for 6-SFT were detected in wheat. Two copies were located on genome A, one on genome D.
T/0Indelintron3235814C/TSNPintron3231113
21572140183117831781172716091053563541333116
Site
G/TSNPintron312G/CSNPintron311T/CSNPexon310A/GSNPexon39
Thr/AlaA/GSNPexon38Asn /AspA/GSNPexon37
A/GSNPexon36A/GSNPintron25T/ASNPintron24G/CSNPintron23C/GSNPintron12C/TSNPexon11
Amino acid change ChangeType LocationNo.
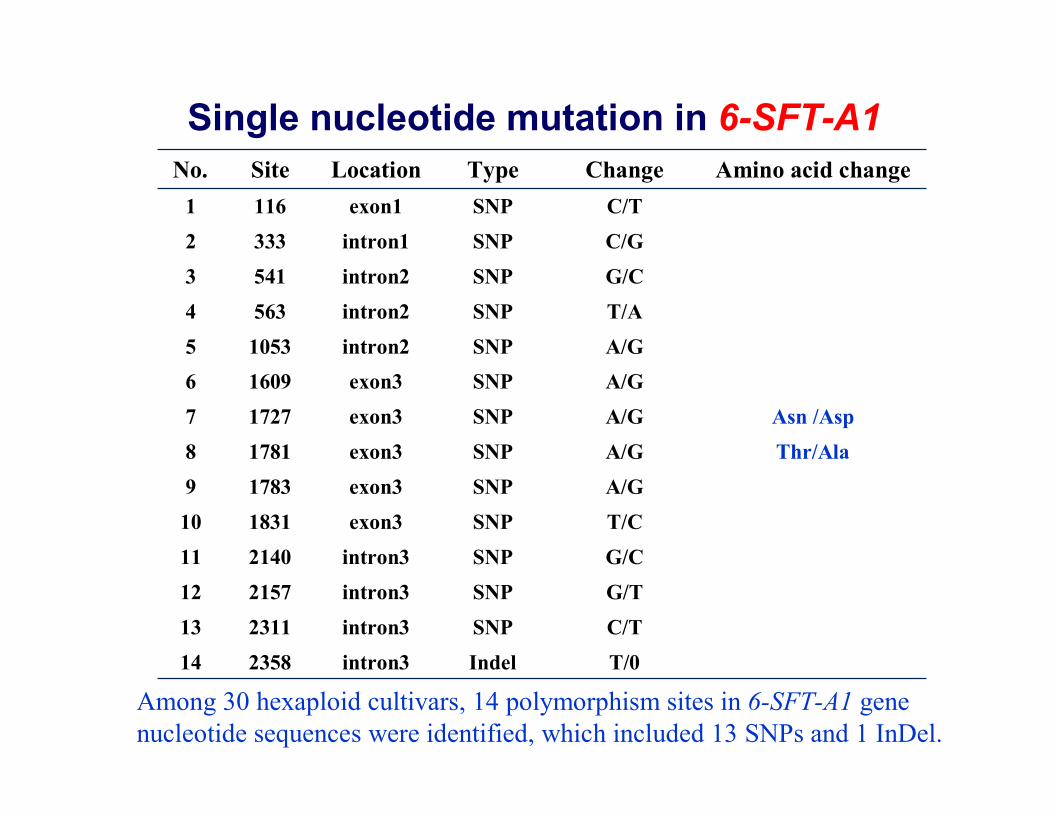
Single nucleotide mutation in 6-SFT-A1
Among 30 hexaploid cultivars, 14 polymorphism sites in 6-SFT-A1 gene nucleotide sequences were identified, which included 13 SNPs and 1 InDel.
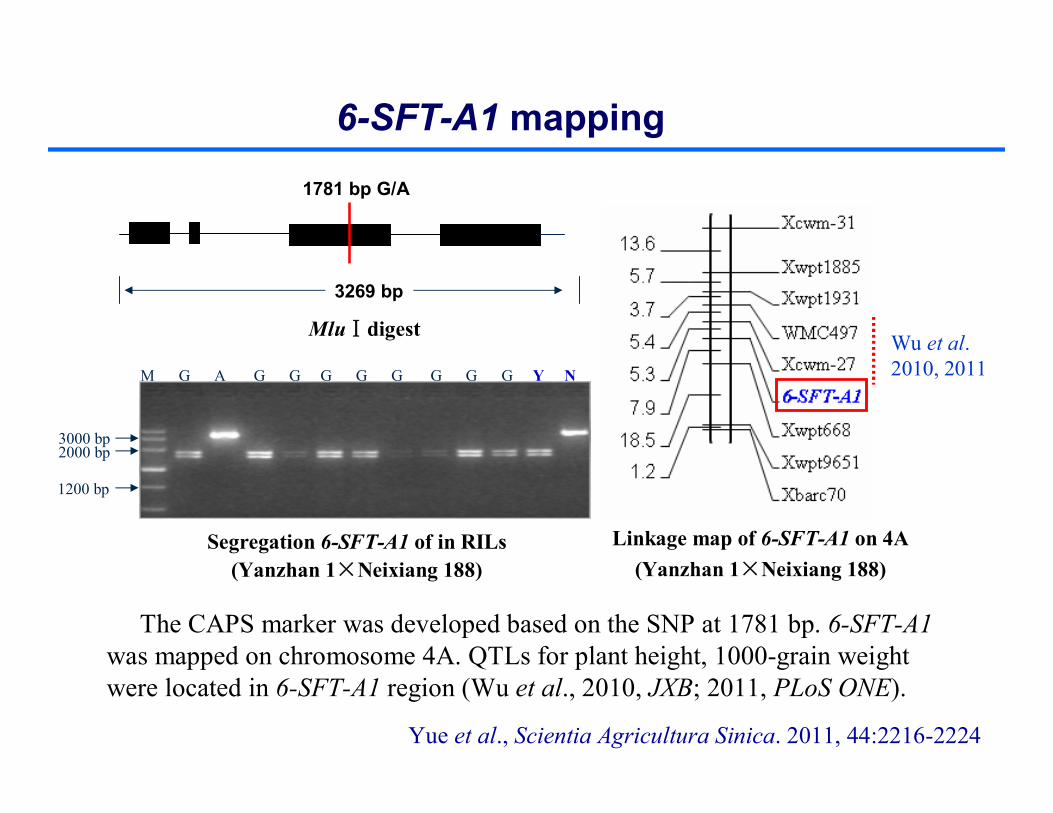
MluⅠdigest
M G A G G G G G G G G Y N
2000 bp3000 bp
1200 bp
Linkage map of 6-SFT-A1 on 4A (Yanzhan 1×Neixiang 188)
The CAPS marker was developed based on the SNP at 1781 bp. 6-SFT-A1 was mapped on chromosome 4A. QTLs for plant height, 1000-grain weight were located in 6-SFT-A1 region (Wu et al., 2010, JXB; 2011, PLoS ONE).
3269 bp
1781 bp G/A
Wu et al. 2010, 2011
Yue et al., Scientia Agricultura Sinica. 2011, 44:2216-2224
6-SFT-A1 mapping
Segregation 6-SFT-A1 of in RILs(Yanzhan 1×Neixiang 188)
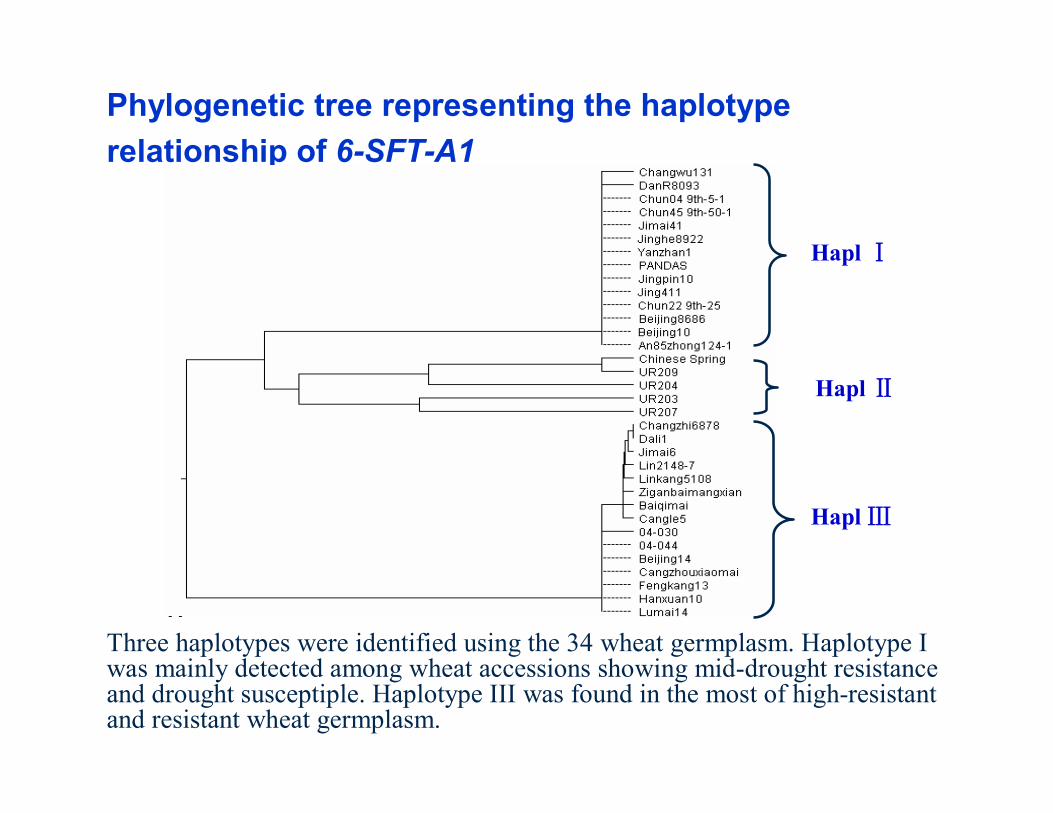
Three haplotypes were identified using the 34 wheat germplasm. Haplotype I was mainly detected among wheat accessions showing mid-drought resistance and drought susceptiple. Haplotype III was found in the most of high-resistant and resistant wheat germplasm.
Phylogenetic tree representing the haplotyperelationship of 6-SFT-A1
Hapl Ⅰ
Hapl Ⅲ
Hapl Ⅱ
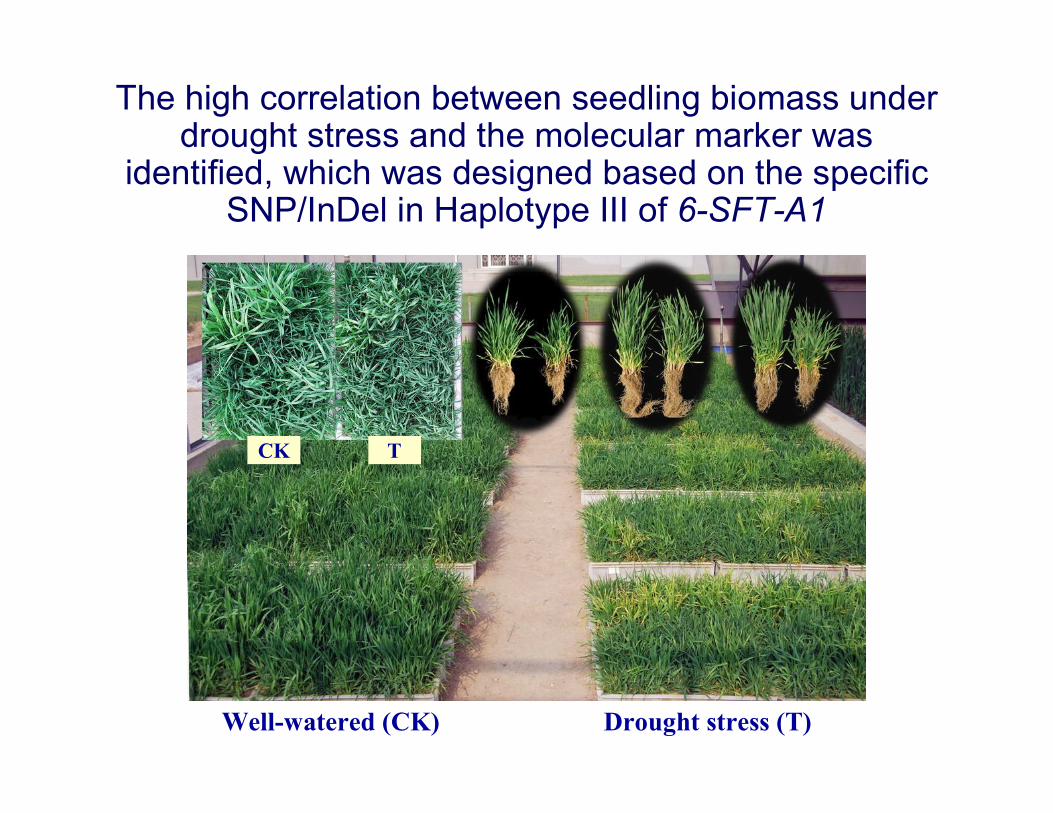
The high correlation between seedling biomass under drought stress and the molecular marker was
identified, which was designed based on the specific SNP/InDel in Haplotype III of 6-SFT-A1
Well-watered (CK) Drought stress (T)
CK T
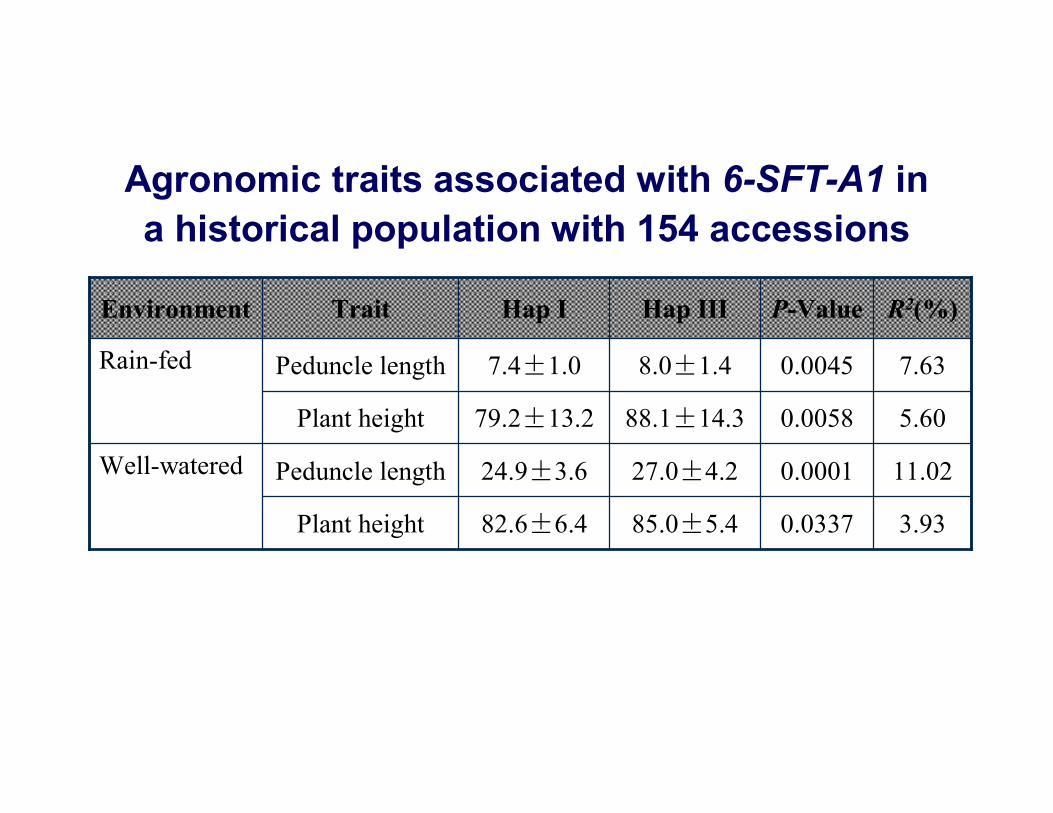
3.930.033785.0±5.482.6±6.4Plant height
11.020.000127.0±4.224.9±3.6Peduncle lengthWell-watered
5.600.005888.1±14.379.2±13.2Plant height
7.630.00458.0±1.47.4±1.0Peduncle lengthRain-fed
R2(%)P-ValueHap IIIHap ITraitEnvironment
Agronomic traits associated with 6-SFT-A1 in a historical population with 154 accessions
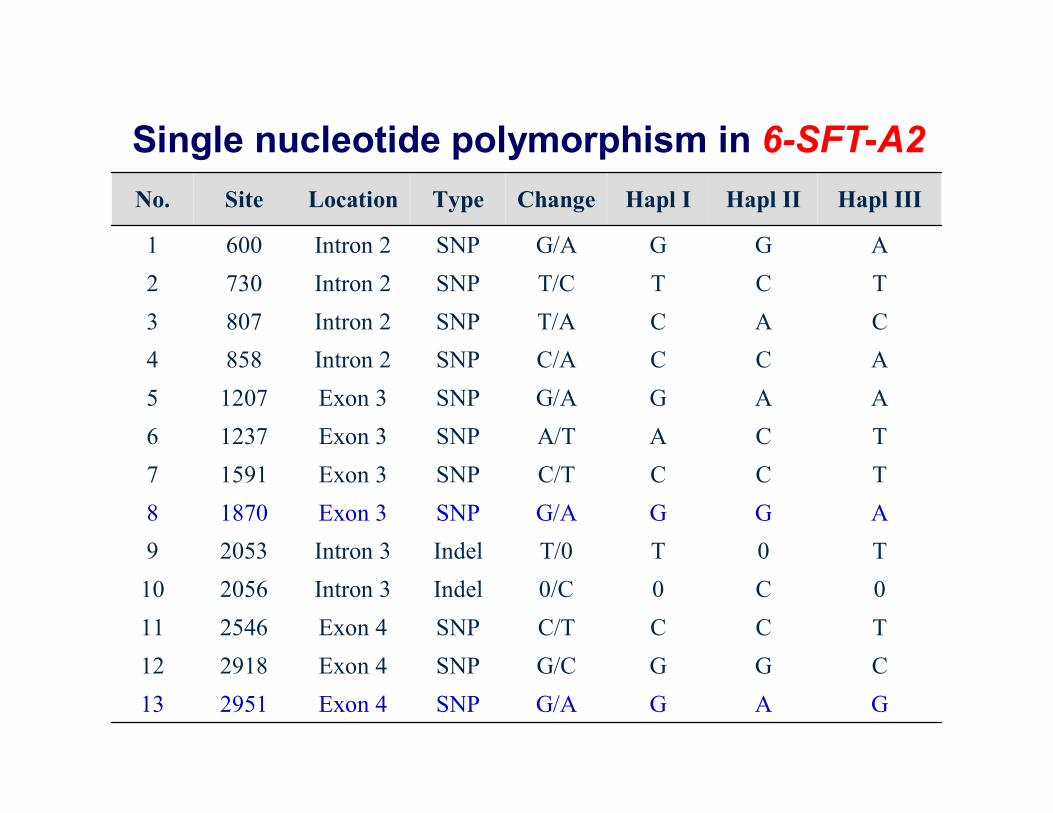
Single nucleotide polymorphism in 6-SFT-A2
GAGG/ASNPExon 4295113CGGG/CSNPExon 4291812TCCC/TSNPExon 42546110C00/CIndelIntron 3205610T0TT/0IndelIntron 320539AGGG/ASNPExon 318708TCCC/TSNPExon 315917TCAA/TSNPExon 312376AAGG/ASNPExon 312075ACCC/ASNPIntron 28584CACT/ASNPIntron 28073TCTT/CSNPIntron 27302AGGG/ASNPIntron 26001
Hapl IIIHapl IIHapl IChangeTypeLocationSiteNo.
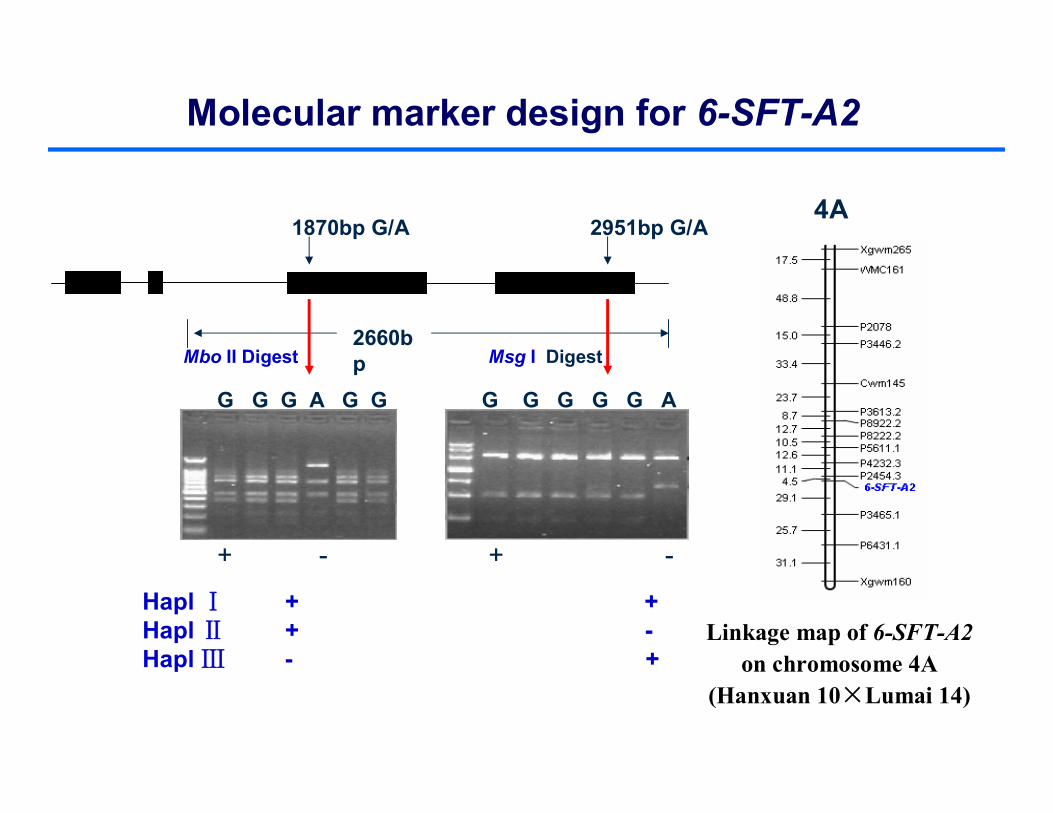
2660bp
1870bp G/A 2951bp G/A
G G G A G G G G G G G A
+ - + -
Hapl Ⅰ + +Hapl Ⅱ + -Hapl Ⅲ - +
Msg I DigestMbo II Digest
Molecular marker design for 6-SFT-A2
4A
Linkage map of 6-SFT-A2 on chromosome 4A
(Hanxuan 10×Lumai 14)
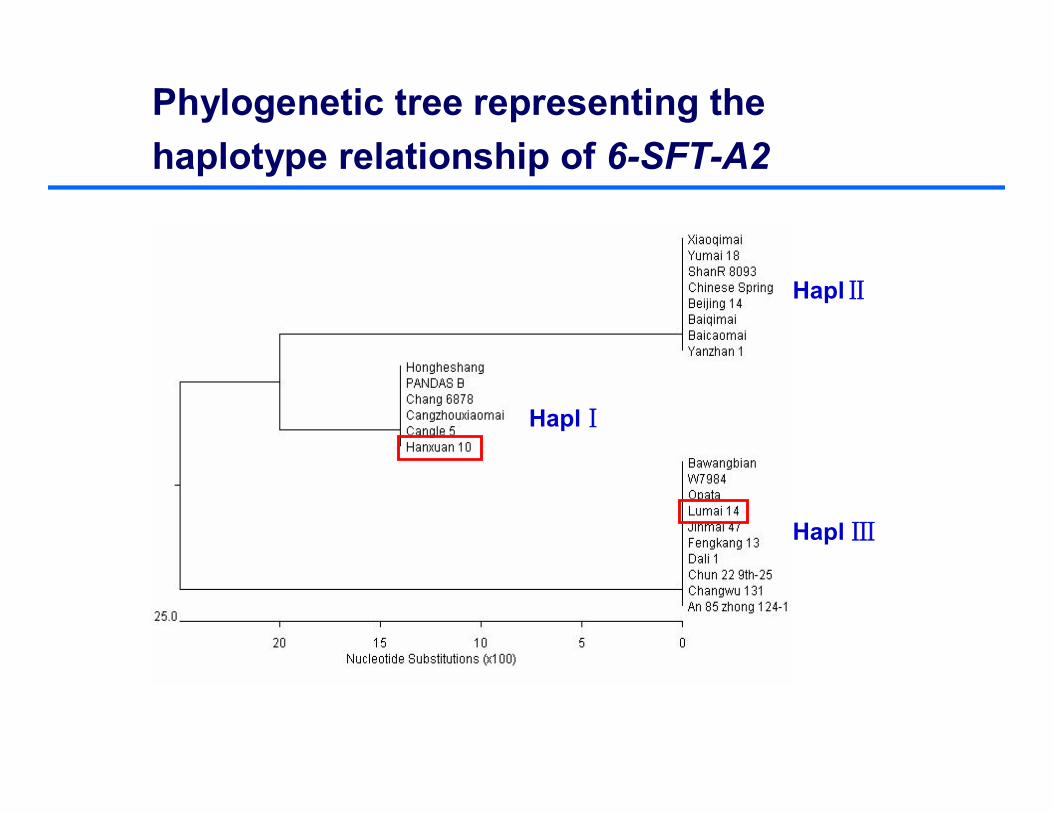
HaplⅠ
HaplⅡ
Hapl Ⅲ
Phylogenetic tree representing the haplotype relationship of 6-SFT-A2
Hapl I (Hanxuan 10) Hapl III (Lumai 14)
0
5
10
15
20
25
30
35
40
45
50
2001 2005 2006H 2006S 2009H 2009S 2010H 2010S
TGW
(g)
*
**
*
**
** * ****
2006DS 2009DS 2010DS 2010WW2009WW2006WW20052001
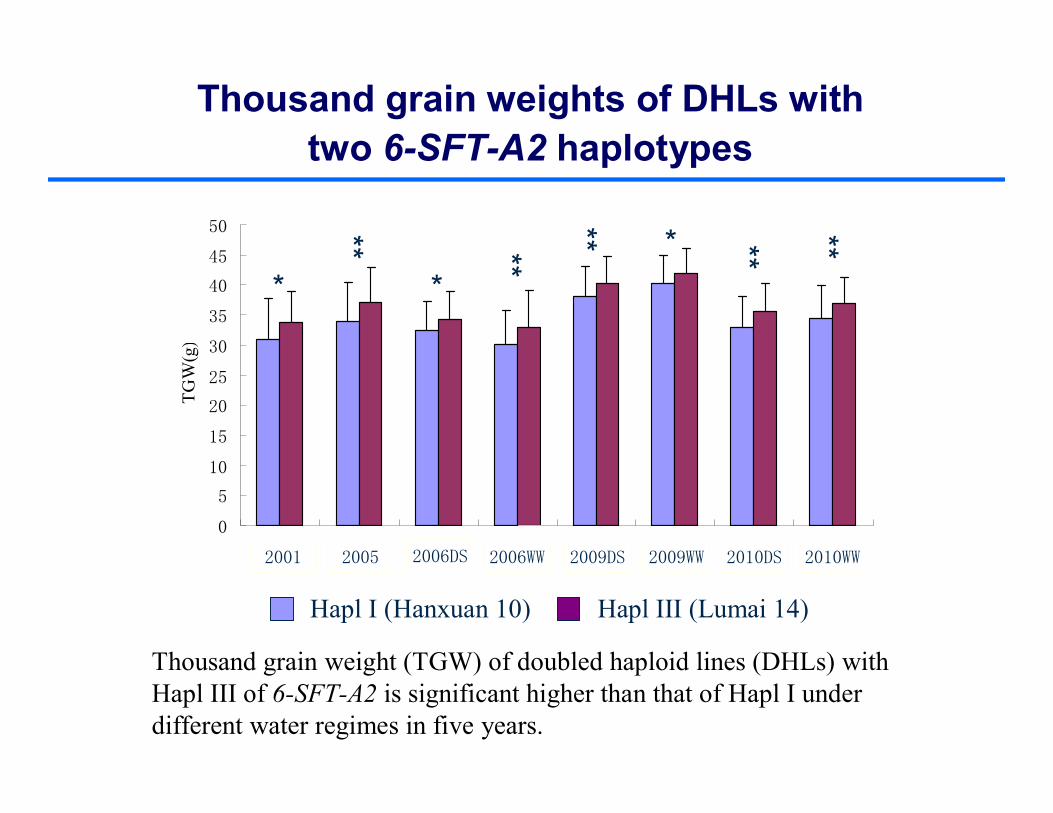
Thousand grain weights of DHLs with two 6-SFT-A2 haplotypes
Thousand grain weight (TGW) of doubled haploid lines (DHLs) with Hapl III of 6-SFT-A2 is significant higher than that of Hapl I under different water regimes in five years.
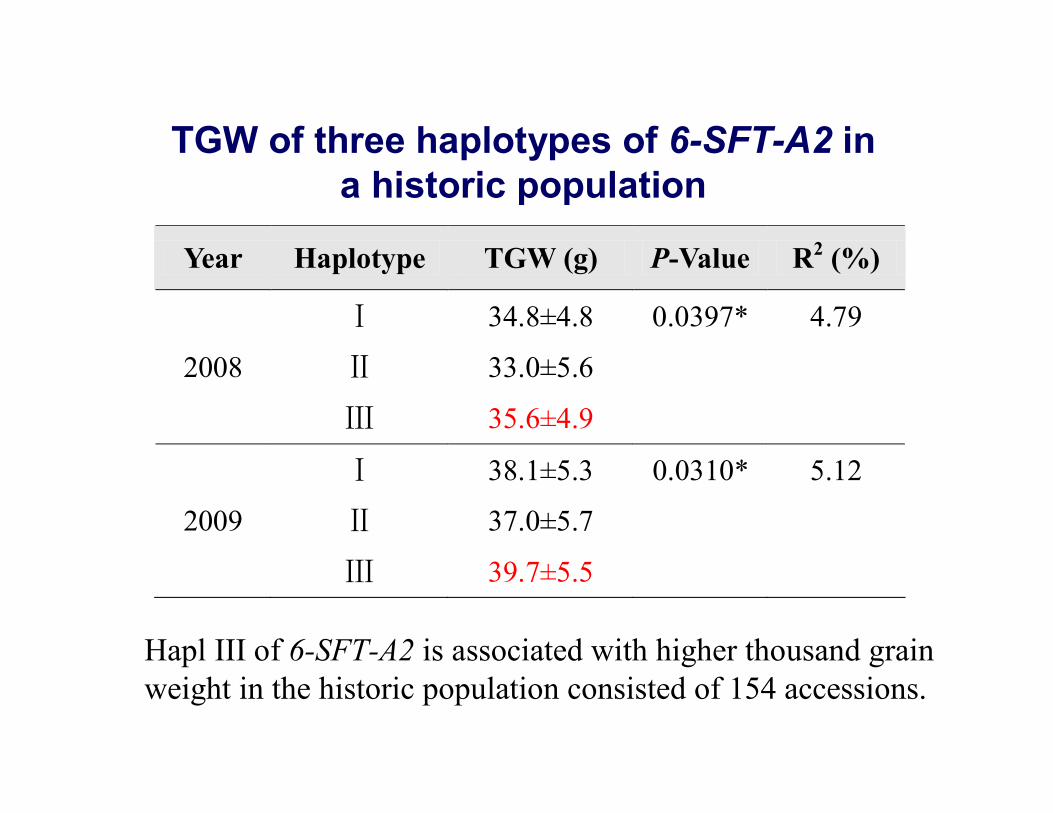
Year Haplotype TGW (g) P-Value R2 (%)
Ⅰ 34.8±4.8 0.0397* 4.79
2008 Ⅱ 33.0±5.6
Ⅲ 35.6±4.9
Ⅰ 38.1±5.3 0.0310* 5.12
2009 Ⅱ 37.0±5.7
Ⅲ 39.7±5.5
TGW of three haplotypes of 6-SFT-A2 in a historic population
Hapl III of 6-SFT-A2 is associated with higher thousand grain weight in the historic population consisted of 154 accessions.
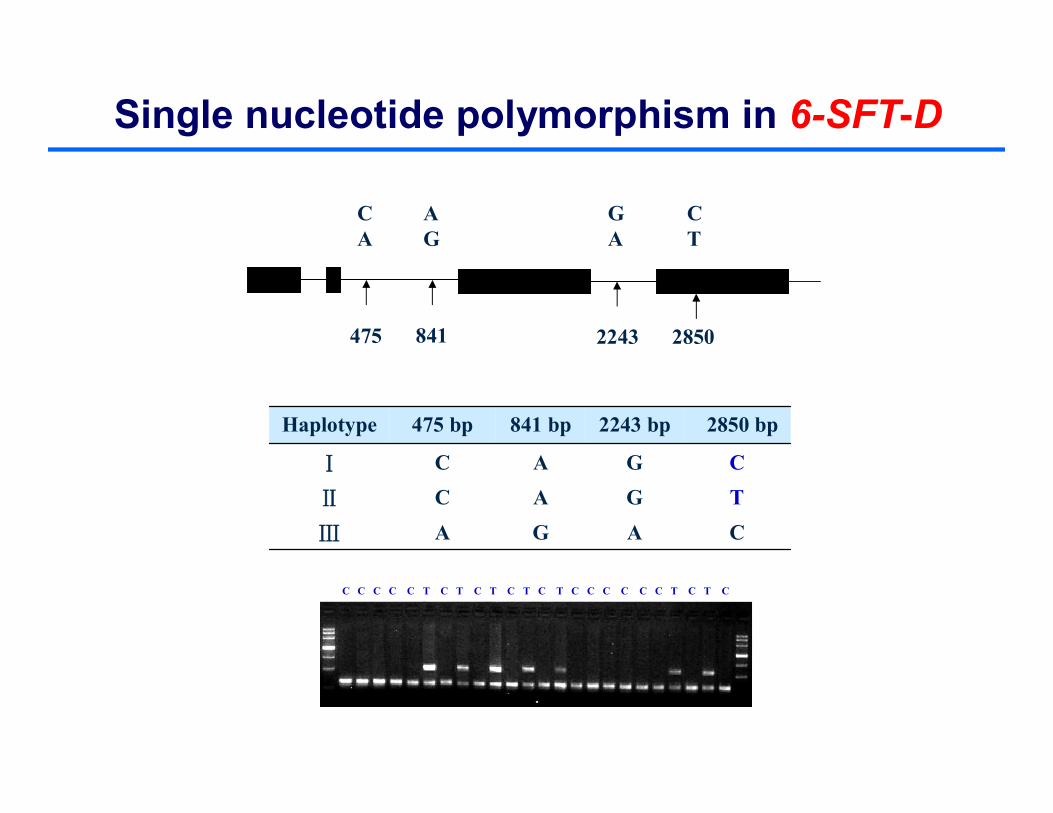
Single nucleotide polymorphism in 6-SFT-D
CAGAⅢ
TGACⅡ
CGACⅠ
2850 bp2243 bp841 bp475 bpHaplotype
475 841 2243 2850
CA
AG
GA
C T
C C C C C T C T C T C T C T C C C C C C T C T C
HaplⅡ
HaplⅠ
Hapl Ⅲ
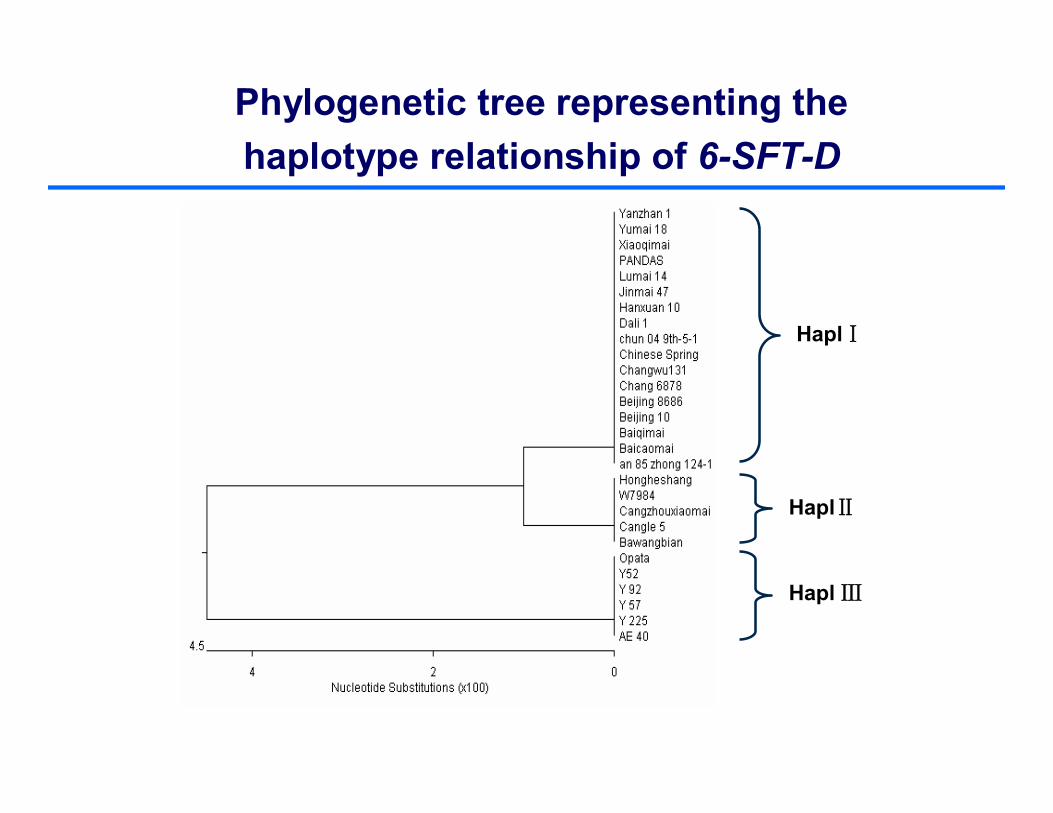
Phylogenetic tree representing the haplotype relationship of 6-SFT-D
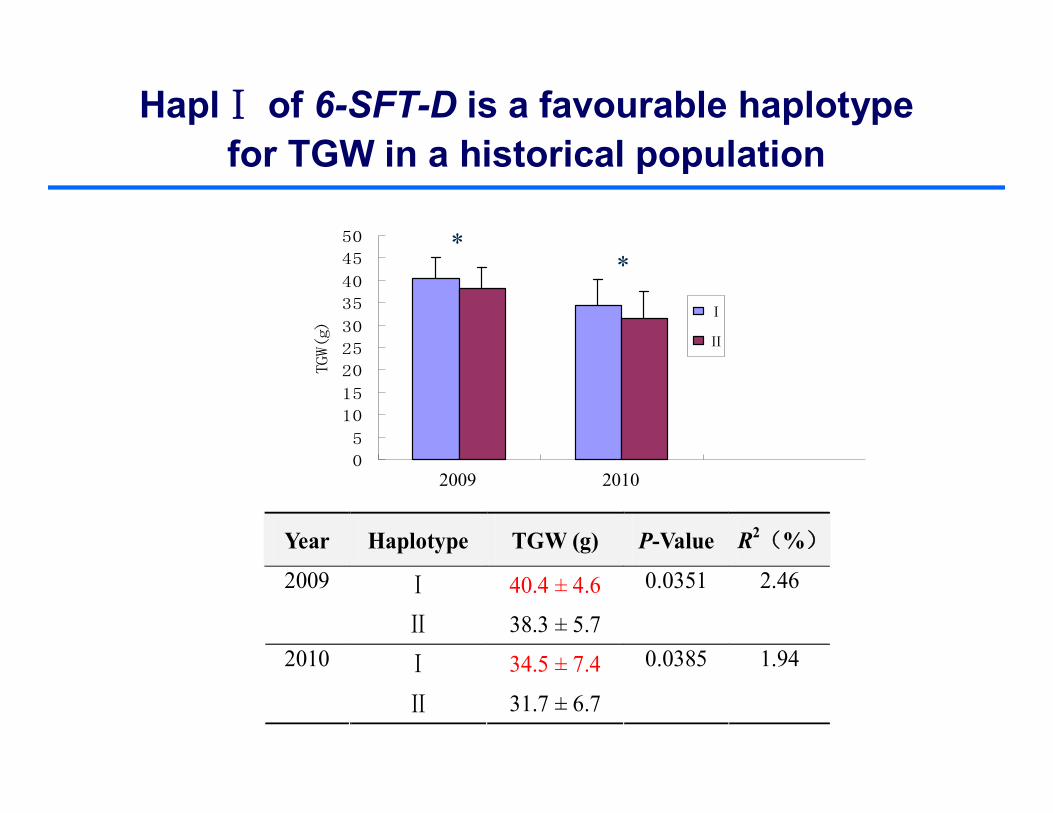
HaplⅠ of 6-SFT-D is a favourable haplotypefor TGW in a historical population
Year Haplotype TGW (g) P-Value R2(%)
Ⅰ 40.4 ± 4.6 2009
Ⅱ 38.3 ± 5.7
0.0351 2.46
Ⅰ 34.5 ± 7.4 2010
Ⅱ 31.7 ± 6.7
0.0385 1.94
0
5
10
15
20
25
30
35
40
45
50
TGW(g)
Ⅰ
Ⅱ
**
2009 2010
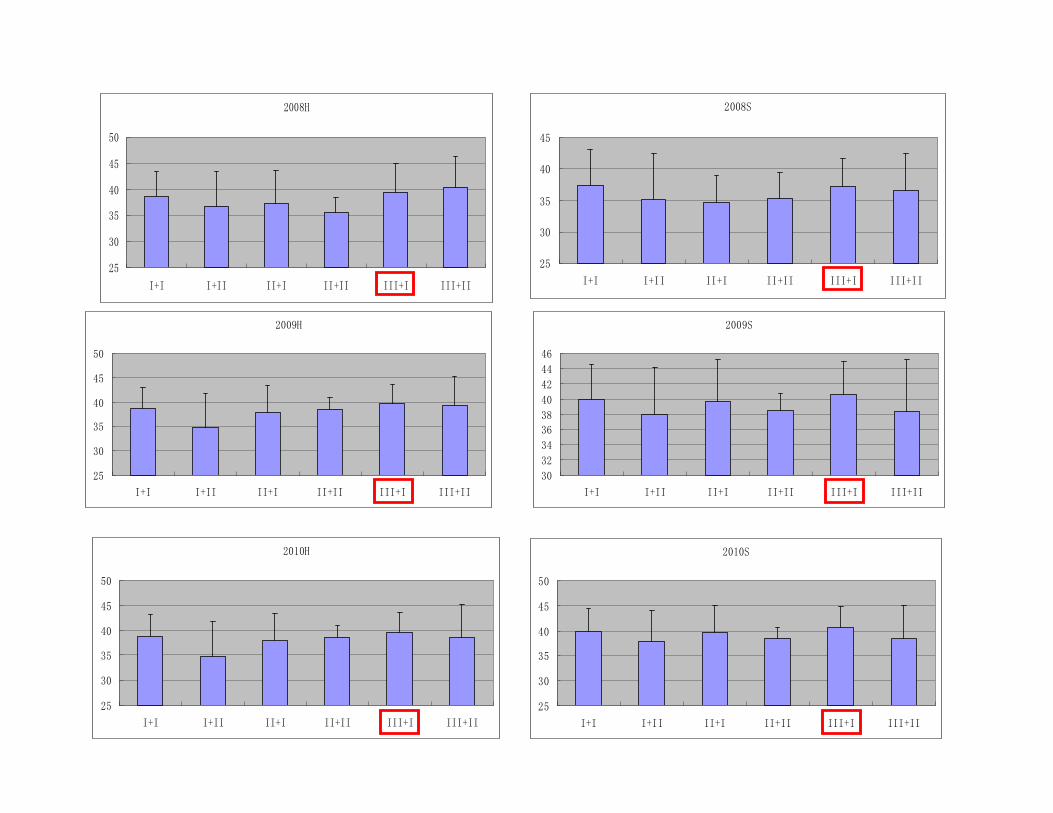
2008H
25
30
35
40
45
50
I+I I+II II+I II+II III+I III+II
2008S
25
30
35
40
45
I+I I+II II+I II+II III+I III+II
2009S
30
32
34
36
38
40
42
44
46
I+I I+II II+I II+II III+I III+II
2010S
25
30
35
40
45
50
I+I I+II II+I II+II III+I III+II
2009H
25
30
35
40
45
50
I+I I+II II+I II+II III+I III+II
2010H
25
30
35
40
45
50
I+I I+II II+I II+II III+I III+II
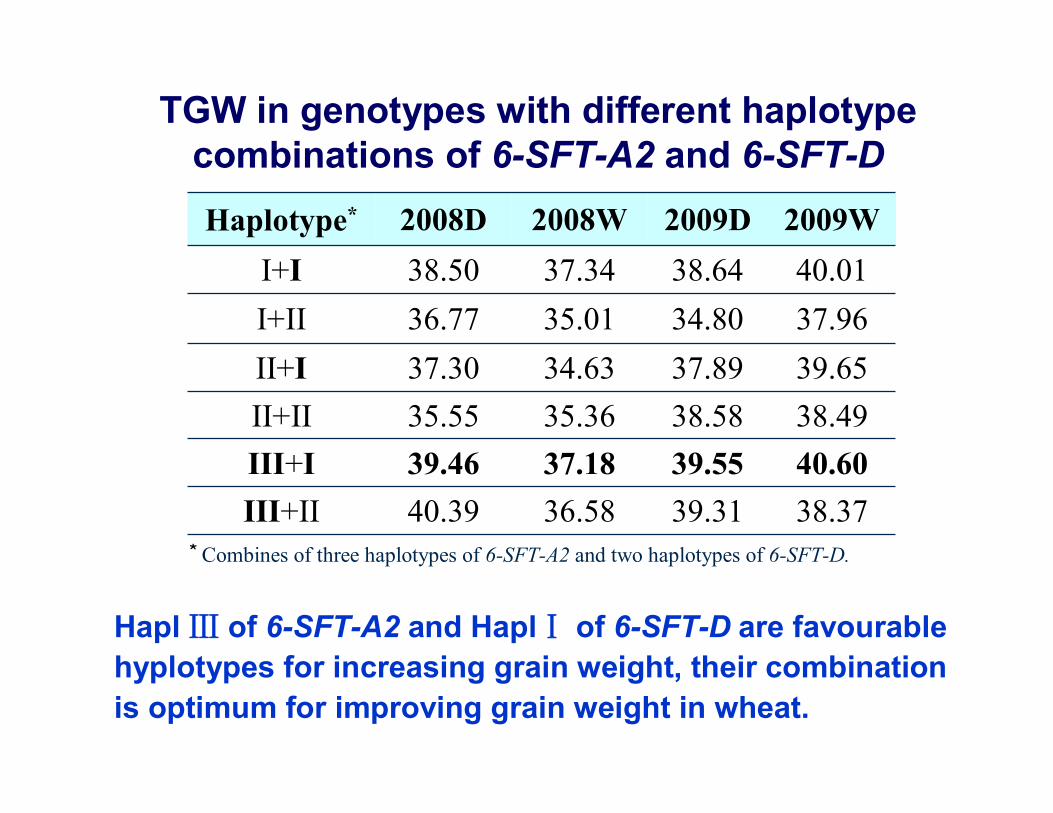
38.37 39.31 36.58 40.39 III+II40.60 39.55 37.18 39.46 III+I38.49 38.58 35.36 35.55 II+II39.65 37.89 34.63 37.30 II+I37.96 34.80 35.01 36.77 I+II40.01 38.64 37.34 38.50 I+I
2009W2009D2008W2008DHaplotype*
Hapl Ⅲ of 6-SFT-A2 and HaplⅠ of 6-SFT-D are favourablehyplotypes for increasing grain weight, their combination is optimum for improving grain weight in wheat.
* Combines of three haplotypes of 6-SFT-A2 and two haplotypes of 6-SFT-D.
TGW in genotypes with different haplotypecombinations of 6-SFT-A2 and 6-SFT-D
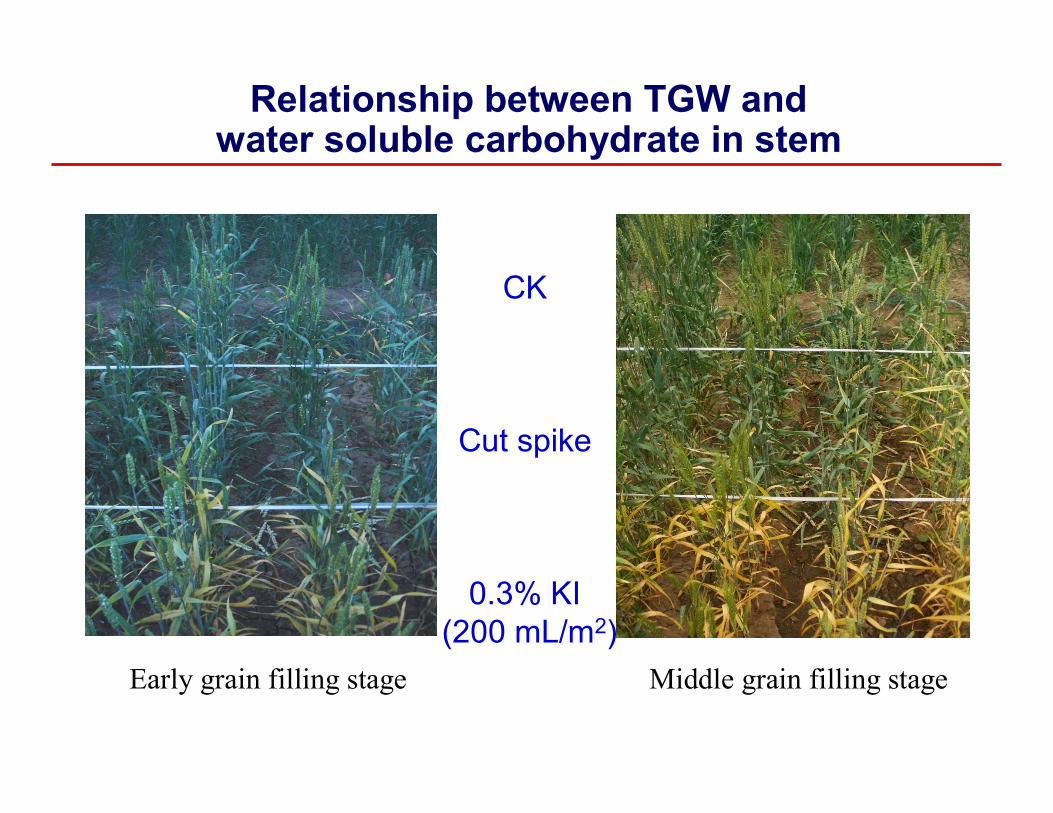
CK
Cut spike
0.3% KI(200 mL/m2)
Early grain filling stage Middle grain filling stage
Relationship between TGW and water soluble carbohydrate in stem
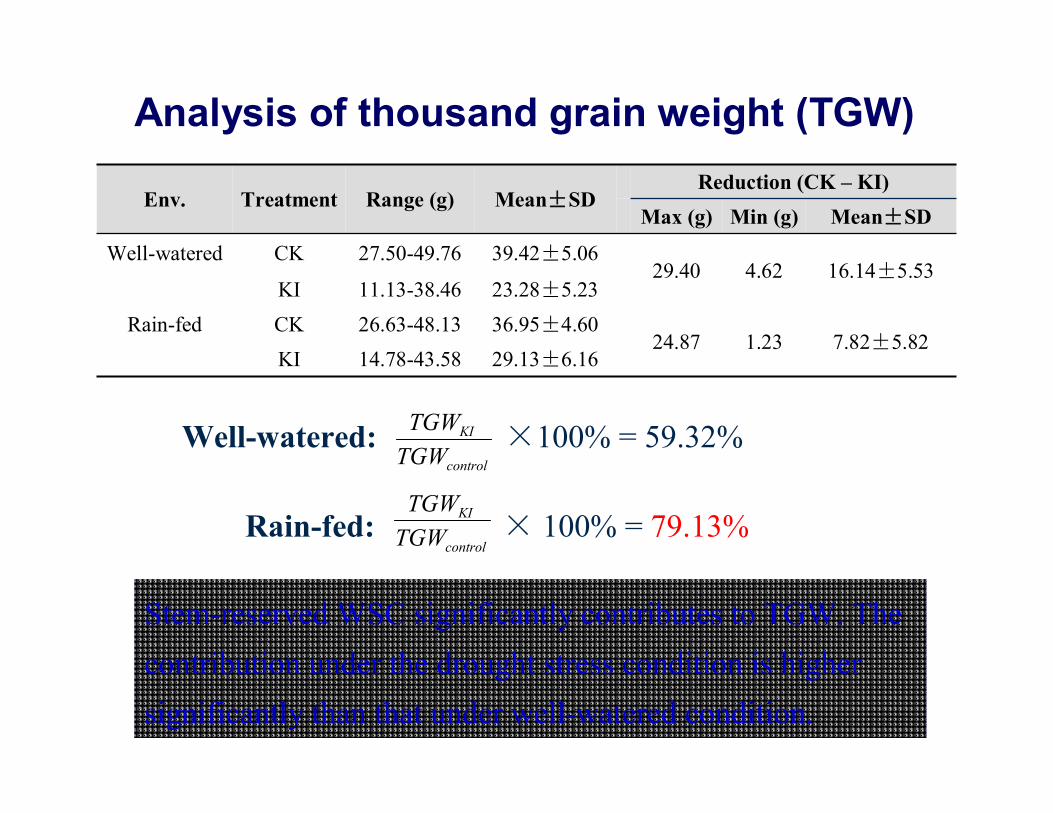
Analysis of thousand grain weight (TGW)
Env. Treatment Range (g) Mean±SDReduction (CK – KI)
Max (g) Min (g) Mean±SD
Well-watered CK 27.50-49.76 39.42±5.0629.40 4.62 16.14±5.53
KI 11.13-38.46 23.28±5.23Rain-fed CK 26.63-48.13 36.95±4.60
24.87 1.23 7.82±5.82KI 14.78-43.58 29.13±6.16
Well-watered: ×100% = 59.32%
Rain-fed: × 100% = 79.13%
Stem-reserved WSC significantly contributes to TGW. The contribution under the drought stress condition is higher significantly than that under well-watered condition.
control
KI
TGWTGW
control
KI
TGWTGW
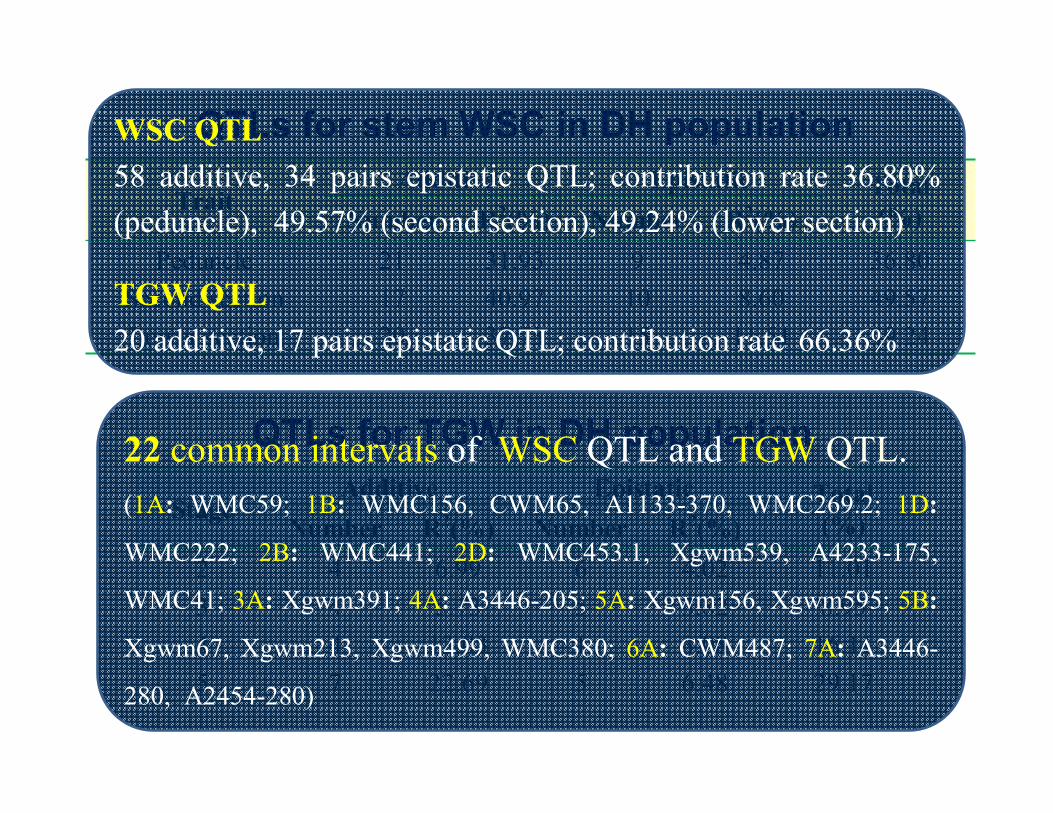
QTLs for stem WSC in DH population
QTLs for TGW in DH population
TraitAdditive Epistatic Total
(%)Number R2(%) Number R2(%)Peduncle 21 31.93 9 4.87 36.80
Second section 17 40.97 10 8.60 49.57Lower section 20 37.73 15 11.51 49.24
StageAdditive Epistatic Total
(%)Number R2(%) Number R2(%)2 4 6.99 6 4.02 11.013 4 5.13 5 3.82 8.954 4 13.03 1 3.08 16.115 7 22.69 5 6.48 29.17
WSC QTL58 additive, 34 pairs epistatic QTL; contribution rate 36.80% (peduncle), 49.57% (second section), 49.24% (lower section)
TGW QTL20 additive, 17 pairs epistatic QTL; contribution rate 66.36%
22 common intervals of WSC QTL and TGW QTL.(1A: WMC59; 1B: WMC156, CWM65, A1133-370, WMC269.2; 1D:
WMC222; 2B: WMC441; 2D: WMC453.1, Xgwm539, A4233-175,
WMC41; 3A: Xgwm391; 4A: A3446-205; 5A: Xgwm156, Xgwm595; 5B:
Xgwm67, Xgwm213, Xgwm499, WMC380; 6A: CWM487; 7A: A3446-
280, A2454-280)
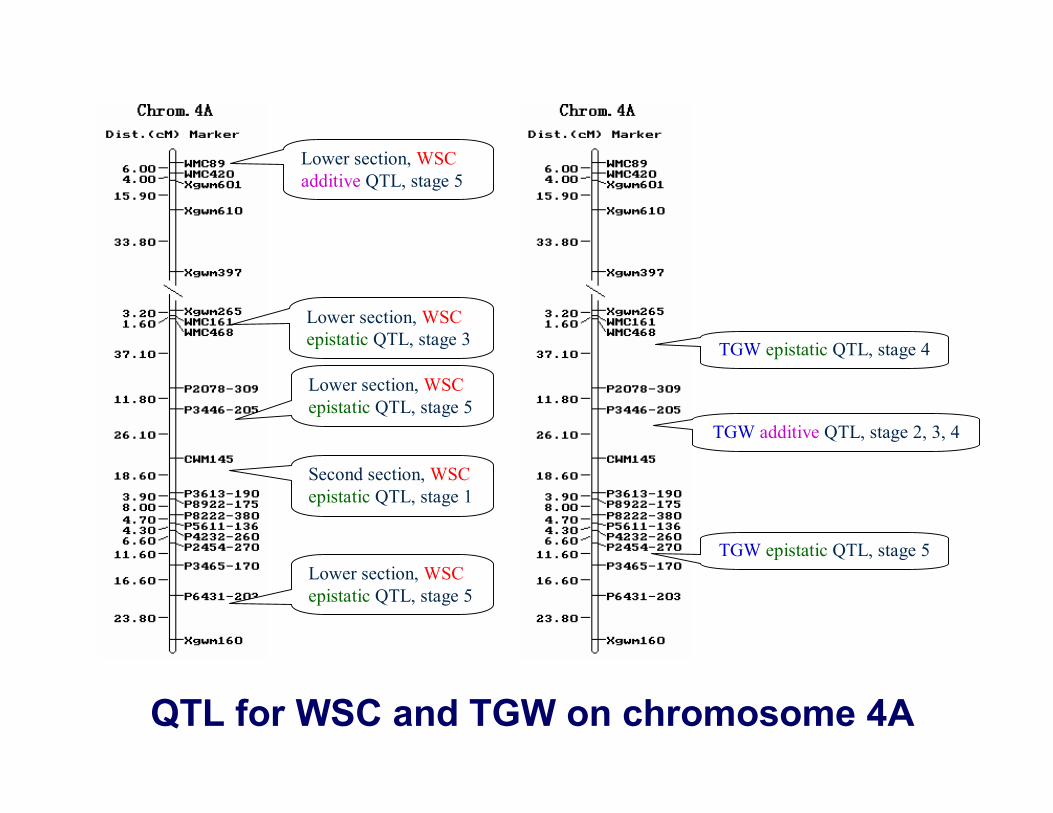
QTL for WSC and TGW on chromosome 4A
Lower section, WSCadditive QTL, stage 5
Lower section, WSCepistatic QTL, stage 3
Lower section, WSCepistatic QTL, stage 5
Second section, WSCepistatic QTL, stage 1
Lower section, WSCepistatic QTL, stage 5
TGW epistatic QTL, stage 4
TGW additive QTL, stage 2, 3, 4
TGW epistatic QTL, stage 5
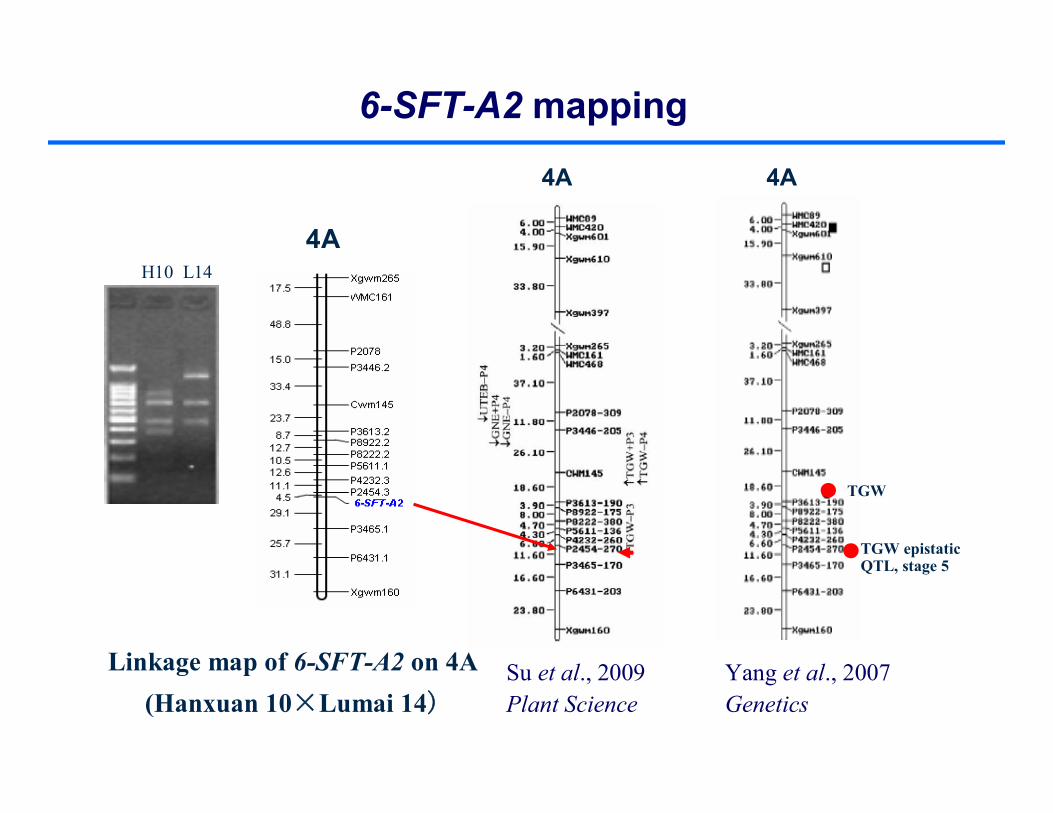
Linkage map of 6-SFT-A2 on 4A (Hanxuan 10×Lumai 14)
H10 L14
Su et al., 2009Plant Science
Yang et al., 2007Genetics
6-SFT-A2 mapping
4A
4A
TGW epistaticQTL, stage 5
TGW
4A
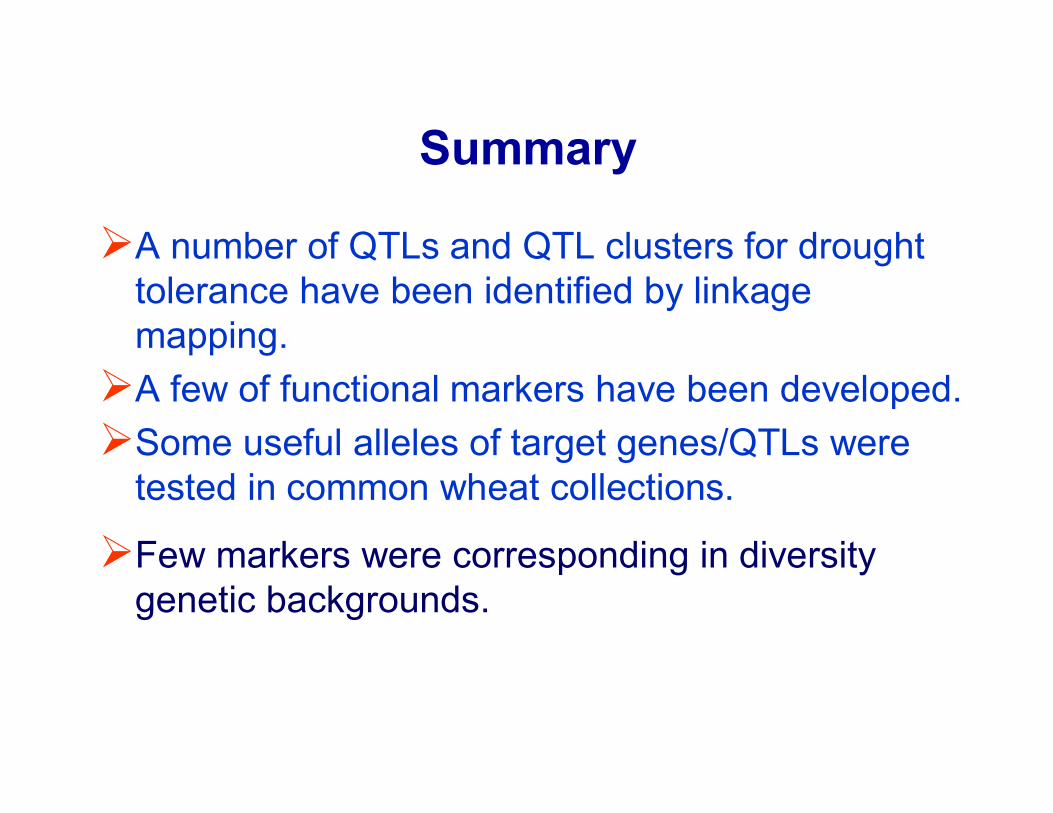
Summary
A number of QTLs and QTL clusters for drought tolerance have been identified by linkage mapping.A few of functional markers have been developed.Some useful alleles of target genes/QTLs were
tested in common wheat collections.
Few markers were corresponding in diversity genetic backgrounds.
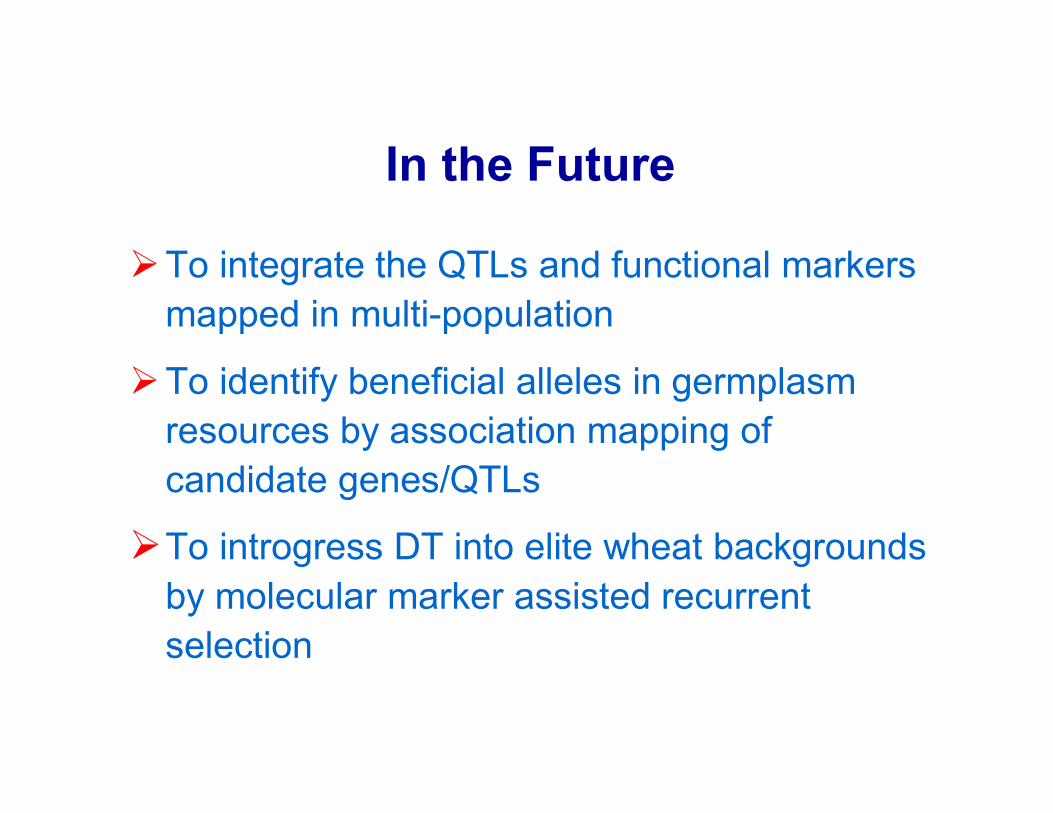
In the Future
To integrate the QTLs and functional markers mapped in multi-population
To identify beneficial alleles in germplasmresources by association mapping of candidate genes/QTLs
To introgress DT into elite wheat backgrounds by molecular marker assisted recurrent selection
Acknowledgements
Yuchen DONGJizeng JIAXueyong ZHANGXiuying KONGChenyang HAO
Collabrators
Financial SupportNational High Tech ProgramNational Key Program for Basic Research
Thank you!
“There’s no single gene that’s going to be the panacea to our drought problem. We’re trying to cherry-pick the various mechanisms and recombine them into one elite cultivar.”
--- Dr. Ryan Whitford, a scientist with the ACPFG’s Drought Focus Group, 2011
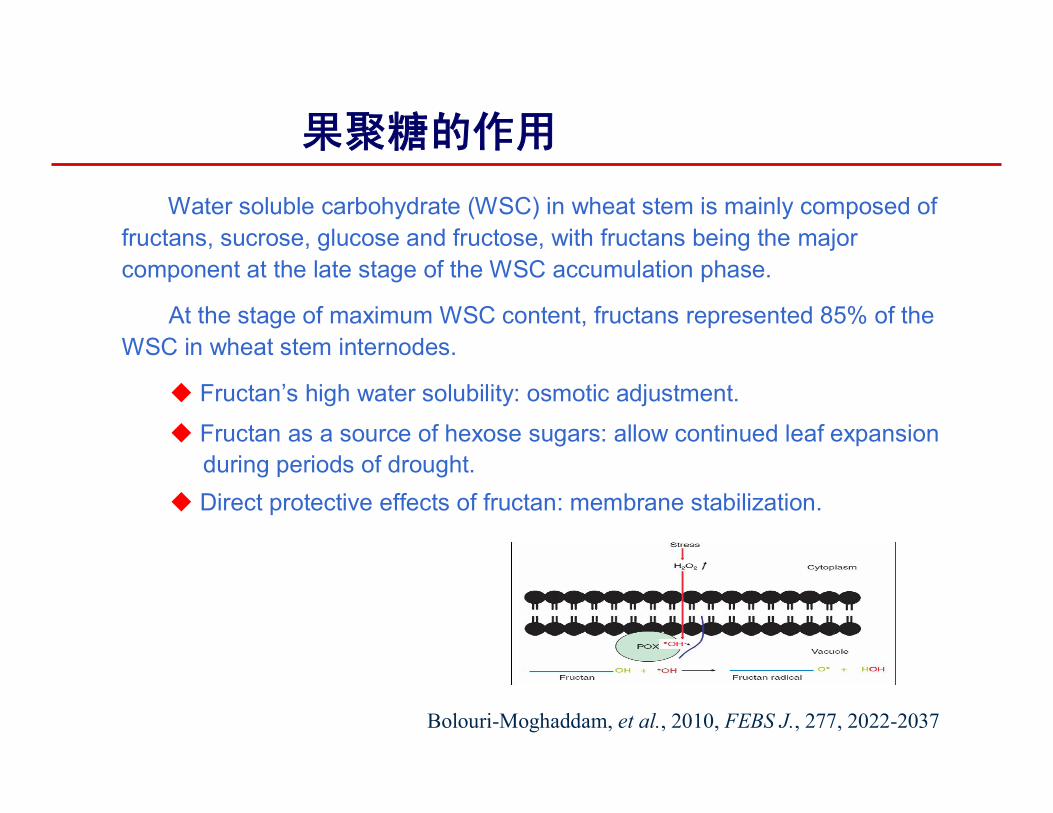
果聚糖的作用
Bolouri-Moghaddam, et al., 2010, FEBS J., 277, 2022-2037
Water soluble carbohydrate (WSC) in wheat stem is mainly composed of fructans, sucrose, glucose and fructose, with fructans being the major component at the late stage of the WSC accumulation phase.
At the stage of maximum WSC content, fructans represented 85% of the WSC in wheat stem internodes.
Fructan’s high water solubility: osmotic adjustment.
Fructan as a source of hexose sugars: allow continued leaf expansion during periods of drought.
Direct protective effects of fructan: membrane stabilization.