Embed Size (px)
Citation preview

1

University of South FloridaUniversity of Southern
University of Southern MaineUniversity of St. Thomas
University of Tennessee, KnoxvilleUniversity of Texas - Austin
University of Texas at DallasUniversity of Texas Health
University of Texas Rio Grande ValleyUniversity of the Sciences in Philadelphia
University of ToledoUniversity of Vermont
University of WashingtonUniversity of West Florida
University of Wisconsin - MadisonVanderbilt University
Virginia Commonwealth UniversityWake Forest University
Washburn UniversityWashington State University
Washington State University - Tri-Cities CampusWashington State University - Vancouver
Washington University in St. LouisWayne State University
Wellesley CollegeWesleyan University
West Chester UniversityWest Virginia Health Science Center
West Virginia UniversityWestern Oregon University
Westfield State UniversityWidener University
Williams CollegeWorcester Polytechnic Institute
Worcester State UniversityXavier University
Doing More with LessSolutions for Managing Facilities on a Limited Budget
September 28, 2017

© 2017 Sightlines, LLC. All Rights Reserved.3
Setting the Context
Three Proven Practices
Questions & Discussion
Service Demonstration (for those interested)
Introduction & Agenda
Pete ZurawVP, Market Strategy &
DevelopmentSightlines
Jay PearlmanAssociate Vice President
Sightlines

© 2017 Sightlines, LLC. All Rights Reserved.4
Join the Conversation
Enter questions here at any point during the webinar
Presentation slides and webinar recording
will be sent to each attendee following
today’s session

© 2017 Sightlines, LLC. All Rights Reserved.5
Leading provider of facilities
intelligence in higher
education helping to uncover
ways to use capital more
strategically and identify
opportunities to improve
operational effectiveness.
FACILITIES BENCHMARKING
& ANALYSIS
Take control of your
facilities and make the
case for change
without the guesswork
FACILITIES ASSESSMENT &
PLANNING
Plan and execute
capital investment
plans that are inclusive,
credible, flexible,
affordable and
sustainable
SPACE UTILIZATION
Ensure your space is
working up to its full
potential
SUSTAINABILITY SOLUTIONS
Measure and improve
environmental
stewardship

© 2017 Sightlines, LLC. All Rights Reserved.6
Sightlines by the NumbersRobust membership includes colleges, universities, consortiums, and state systems
Sightlines has advised state systems in:
• Alaska• California• Florida• Hawaii• Maine
• Massachusetts• Minnesota• Mississippi• Missouri• Nebraska
• New Hampshire• New Jersey• Pennsylvania• Texas• Washington
43States+DC
90%Memberretention
rate
360+ROPA
Members
450Colleges &
Universities
180New members
since 20135
Canadianprovinces

© 2017 Sightlines, LLC. All Rights Reserved.7
Sightlines is a Gordian CompanyData, software, and expertise for all phases of The Building Lifecycle

Setting the Context

Campuses
are closing
Enrollment
Struggles
Infrastructure
is aging Financial
AidAdmin
Costs
DM
© 2017 Sightlines, LLC. All Rights Reserved.9
Industry Challenges
Capital
funding is
unpredictable

0%
2%
4%
6%
8%
10%
12%
14%
16%
18%
% o
f C
on
stru
cte
d S
pac
eConstructed Space 1880-2015
Sightlines Database Texas
Building age in context
Pre-War Post-War Modern Complex

Space Growth and Enrollment
0%
1%
2%
3%
4%
5%
6%
7%
8%
9%
10%
2007 2008 2009 2010 2011 2012 2013 2014 2015
Pe
rce
nt
Ch
ange
Space and Enrollment TrendsNational Average
Space Enrollment

Facilities Backlogs Continue Rise
$81.72 $83.42 $87.19 $88.52 $90.73 $93.27 $95.31 $97.56 $100.07
$0.0
$20.0
$40.0
$60.0
$80.0
$100.0
$120.0
2007 2008 2009 2010 2011 2012 2013 2014 2015
$/G
SFBacklog $/GSF
The Sightlines backlog total includes maintenance/repair, modernization and infrastructure

13
Capital Investment in Existing Space
$1.12 $1.19 $1.28 $1.21$1.60 $1.67 $1.71 $1.59 $1.73
$3.10
$3.83 $3.88$3.63 $3.09
$3.37 $3.35$2.99
$3.32
$0.00
$1.00
$2.00
$3.00
$4.00
$5.00
$6.00
$7.00
2007 2008 2009 2010 2011 2012 2013 2014 2015
$/G
SF
Annual Capital One-Time Capital Average

$3.98$4.26 $4.33 $4.37 $4.41 $4.44 $4.54 $4.65 $4.74
$0.25$0.26 $0.26 $0.26 $0.27 $0.29 $0.29 $0.31 $0.33
$0.00
$1.00
$2.00
$3.00
$4.00
$5.00
$6.00
2007 2008 2009 2010 2011 2012 2013 2014 2015
$/G
SF
Facilities Operating Budget $/GSF
Daily Service Planned Maintenance
Modest Operating Budget Growth

Bright Spot - Energy Costs
$10.87 $11.62 $11.57 $9.95$9.22 $8.88 $8.37 $8.88 $8.45
$27.71$29.56
$29.88$29.36
$29.51$28.16
$27.67 $27.80$28.21
-8%
-6%
-4%
-2%
0%
2%
4%
6%
8%
10%
$0
$5
$10
$15
$20
$25
$30
$35
$40
2007 2008 2009 2010 2011 2012 2013 2014 2015
Pe
rce
nt
Ch
ange
$/M
MB
TU
Energy Unit Cost
Fossil Electric Percent Change

Integrated Campus Stewardship Challenge
Facilities intelligence that connects space, capital, and operating policies
© 2017 Sightlines, LLC. All Rights Reserved.16

Three Proven Practices

© 2017 Sightlines, LLC. All Rights Reserved.18
The Hidden Value in Existing Space
Cost Reduction Projects Offset Capital Investment
Reorganization to Eliminate Deferred Maintenance
Three Proven PracticesFacilities change through institutional action

© 2017 Sightlines, LLC. All Rights Reserved.19
The Hidden Value in Existing Space Don’t overlook the familiar resources already available
Investigate existing space
Align program and space
Renovate to optimize both
Exploit efficiency opportunities
Case Study – Seattle Pacific University http://www.sightlines.com/seattle-pacific-university-case-study/
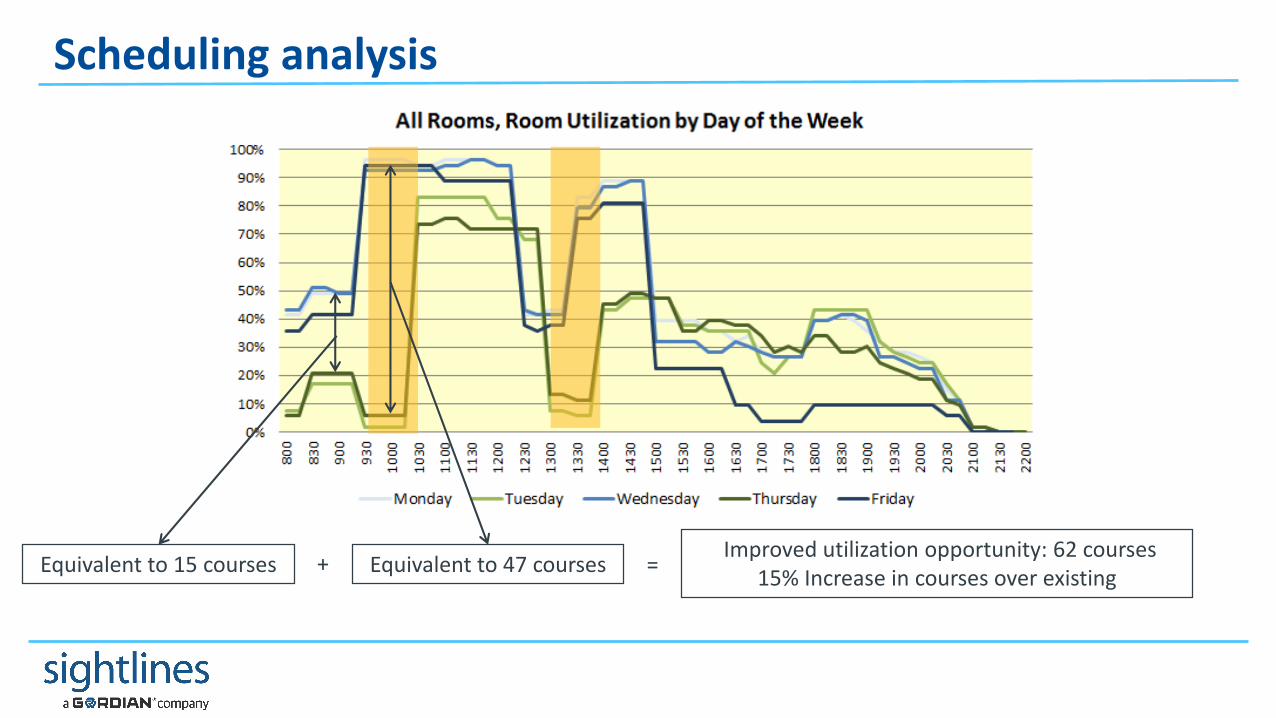
Scheduling analysis
Equivalent to 15 courses Equivalent to 47 coursesImproved utilization opportunity: 62 courses
15% Increase in courses over existing+ =

$26,873,000$15,264,000$13,920,000
40-Year “Value” of included teaching spaces
• If average utilization rate from 8am-4pm is 55%; then on average $25M of the capital costs of teaching spaces is not utilized.
• Each additional point of increased utilization puts $561,000 of this asset into use.
Funding stewardship using a 5% endowment draw would require an endowment of $6,960,000
Classroom square feet – 67,183 gsf
Capital cost of construction 40 year O&M costStewardship cost
Total cost of capital for classrooms
67,183 gsf x $400/gsf =67,183 gsf x $5.68/gsf x 40 yrs =67,183 gsf x $5.18/gsf x 40 yrs =
$56,057,000
© 2017 Sightlines, LLC. All Rights Reserved.22
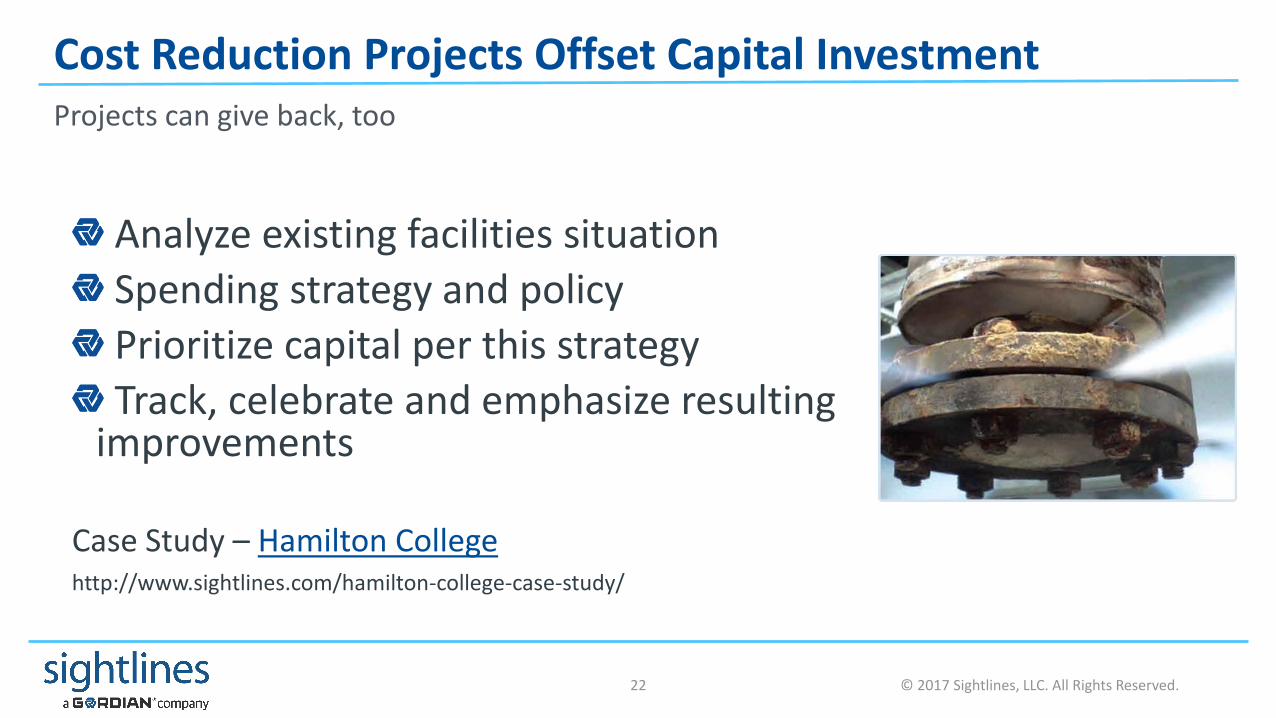
Analyze existing facilities situation
Spending strategy and policy
Prioritize capital per this strategy
Track, celebrate and emphasize resulting improvements
Case Study – Hamilton College http://www.sightlines.com/hamilton-college-case-study/
Cost Reduction Projects Offset Capital InvestmentProjects can give back, too

23
Catch-Up Funding Reaching the Target
$0.0
$2.0
$4.0
$6.0
$8.0
$10.0
$12.0
$14.0
$16.0
$18.0
$20.0
2003 2004 2005 2006 2007 2008 2009 2010
$ in
Mill
ion
s
Annual Stewardship Asset Reinvestment
Total Capital Investment vs. Target Need

24
Keep-up money replaces catch-up
$0.0
$2.0
$4.0
$6.0
$8.0
$10.0
$12.0
$14.0
$16.0
$18.0
$20.0
2003 2004 2005 2006 2007 2008 2009 2010 2011 2012 2013 2014
$ in
Mill
ion
s
Annual Stewardship Asset Reinvestment Equlibrium Need Target Need
450% increase in 10 years

25
Looking towards Future Needs
$0
$2
$4
$6
$8
$10
$12
$14
2017 2018 2019 2020 2021 2022 2023 2024 2025 2026
Mill
ion
s
10 Year Prediction of Needs
Mechanical Envelope Space Renewal
42%
18%
40%

26
Increase PM Now to Alleviate Demands in the Future
$0
$1
$2
$3
$4
$5
$6
$7
$8
2017 2018 2019 2020 2021 2022 2023 2024 2025 2026
Mill
ion
s
10 Year Prediction of Needs
Mechanical Envelope Space Renewal

© 2017 Sightlines, LLC. All Rights Reserved.27
Reorganization to Eliminate Deferred MaintenanceThe way into trouble isn’t always the best way back out
Facilities team for today…or yesterday?
Measure current and future performance
Great people, great structure
Disciplined focus on prioritized need
Case Study – Bowling Green State Universityhttp://www.sightlines.com/bowling-green-state-university-case-study/
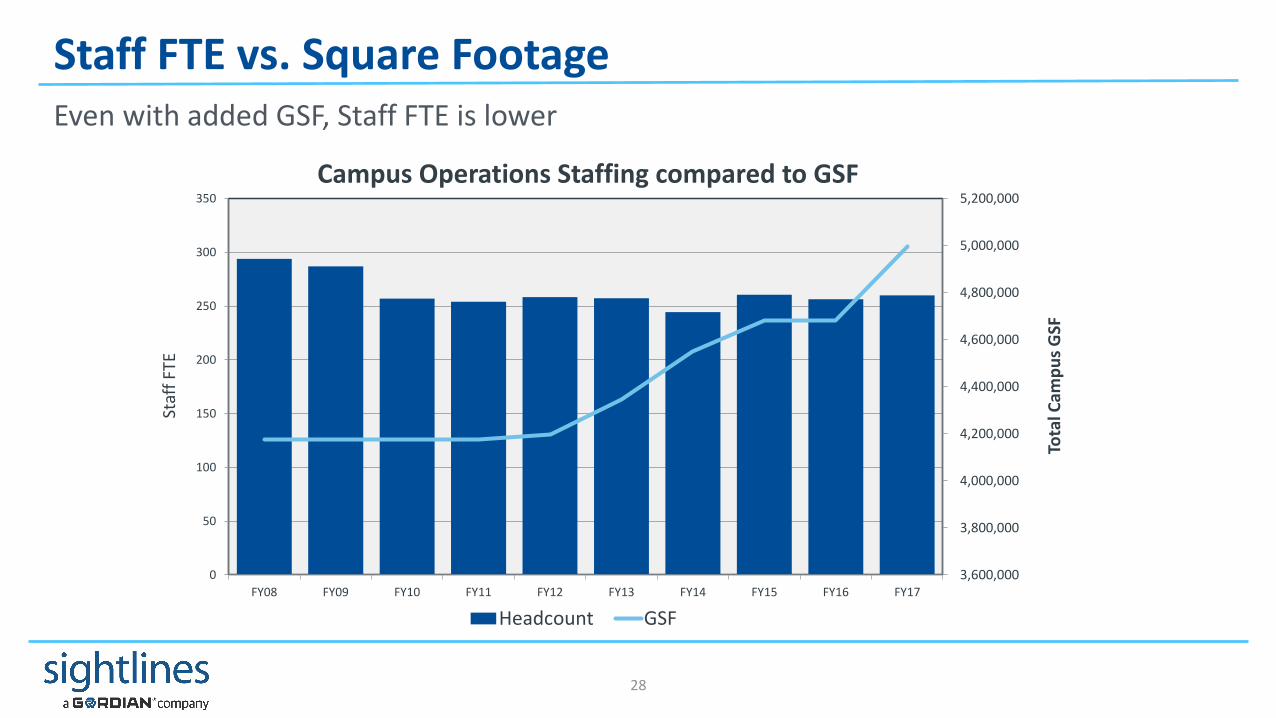
3,600,000
3,800,000
4,000,000
4,200,000
4,400,000
4,600,000
4,800,000
5,000,000
5,200,000
0
50
100
150
200
250
300
350
FY08 FY09 FY10 FY11 FY12 FY13 FY14 FY15 FY16 FY17
Tota
l Cam
pu
s G
SF
Staf
f FT
ECampus Operations Staffing compared to GSF
Headcount GSF
28
Staff FTE vs. Square FootageEven with added GSF, Staff FTE is lower

29
A Case for Centralization Might Include…
Preventative maintenance schedulingCapital plans establishmentProactivity focusProcurement optimizationLiability/accountability shiftTrend identificationCustomer coordination/planning/scheduling
30
Expectation management
Policy and procedure standardization
Budgetary and expenditure consistency
Releasing former responsibilities
Potential Challenges

31
Maintenance Work OrdersIncreased work order reporting has resulted in increased PM identification
0
5,000
10,000
15,000
20,000
25,000
# o
f W
ork
Ord
ers
# of Work Orders
Daily Service PM
0%
1%
2%
3%
4%
5%
6%
7%
% o
f W
ork
Ord
ers
% of Work Orders that are PM
% PM
32
Facilities department
Institutional leadership
Faculty, staff and students
Community
Other????
Communication is key
33
Questions & Discussion

© 2017 Sightlines, LLC. All Rights Reserved.34
What did you think?Please share your feedback by answering a few quick questions after the session to helps us get to know you better and improve our webinars for the future

Service Demonstration

Make the Case Without the Guesswork
Separate fact from fiction to identify and validate core issues
Analyze campus needs and develop plans in line with institutional goals
Align institutional need with investment strategy to
improve outcomes
Understand and identify future needs and risks
© 2017 Sightlines, LLC. All Rights Reserved.36

Primary Benefits
37
• Create alignment between space, capital, and operations needs
• Reduce risk of facilities failures
• Increase annual stewardship of aging physical assets
• Develop strategies to fund deferred maintenance
• Reduce overhead of facilities operations
• Create baseline for continuous measurement and improvement
© 2017 Sightlines, LLC. All Rights Reserved.

Sightlines collects and
assembles data on
campus to quantify, verify,
and qualify facility
performance.
Through benchmarking,
institutions can create
custom comparisons that
help them understand context and performance
Sightlines synthesizes the
institution's verified data
to provide expert insight,
perspective, and develop
strategic directions for change
Sightlines supports each campus
through our Member Portal,
thought leadership, Insights
Summit, educational webinars,
and ongoing campus consultation
Measure
BenchmarkAnalyze &Interpret
Membership
Change the Conversation with the ROPA Process
© 2017 Sightlines, LLC. All Rights Reserved.38

Vocabulary for Facilities Measurement, Benchmarking & Analysis
Asset Reinvestment
The accumulation of repair and modernization needs and the definition of resource capacity to correct them “Catch-Up Costs”
OperationalEffectiveness
The effectiveness of the facilities operating budget, staffing, supervision, and energy management.
Annual Stewardship
The annual investment needed to ensure buildings will properly perform and reach their useful life “Keep-Up Costs”.
Service
The measure of service process, the maintenance quality of space and systems, and the customers opinion of service delivery.
Asset Value Change Operations Success
© 2017 Sightlines, LLC. All Rights Reserved.39

© 2017 Sightlines, LLC. All Rights Reserved.40
Three Phases for Continuous Improvement
PERFORMANCE
PERFORMANCE
DISCOVERY
PREDICTION• Base data
• Trends & Benchmarking• Vocabulary
• Facility Relationship
• Track performance vs.Best-in-class institutions
• Highlight progress towardsset goals
• Predicting capital needs• Understanding facility risk• Identifying future operating
budgets

ROPA Data Collection SnapshotBuilding Information • Building construction date
• Major building renovations• Building function (resident hall, athletic, etc.)• Building gross square footage (GSF), land acres• Locations served by central systems (heating, cooling, electrical)
Deferred Maintenance • Deferred maintenance assessment (in-house or contracted)
Capital & Operating Project List • Completed projects both operating and capital funds• New construction costs
Cam
pu
s P
rofi
le
Staffing Table • Department organizational chart• Distribution of trades, custodial & grounds staff by shop (including supervisors)
Work Order Report • Total number of requested and completed• Completed work orders by shop and type (Repair, PM, Project, etc.)
Energy Profile • Monthly utility cost and consumption by fuel type (Gas, Oil, Electric)• Primary generation equipment profile Including hours of operation
Fin
ance
Institutional Financial Statement • Balance Sheet and Operating Budget
Facilities Operating Budget • Operating Budget and Actual by department and line item.
Capital Budget • Recurring Capital budget (Plant fund, R&R account) and CapitalOp
era
tio
ns
© 2017 Sightlines, LLC. All Rights Reserved.41
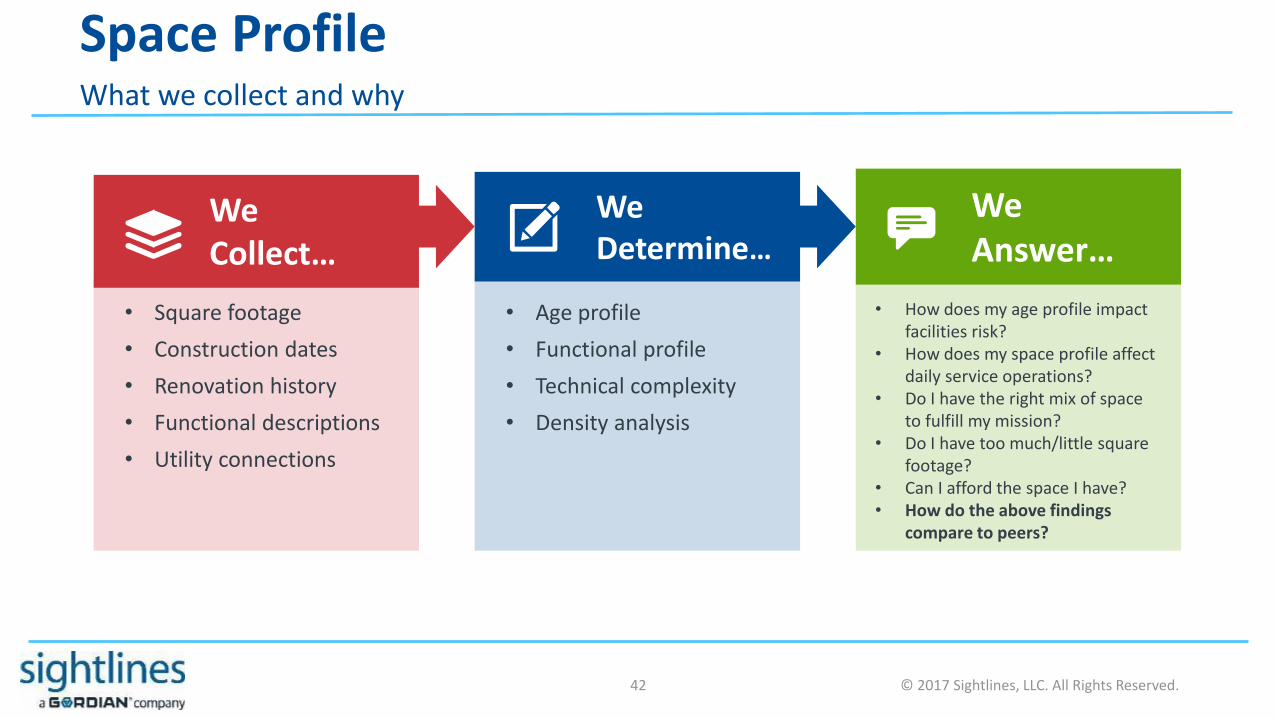
Space ProfileWhat we collect and why
• Age profile
• Functional profile
• Technical complexity
• Density analysis
We Determine…
• Square footage
• Construction dates
• Renovation history
• Functional descriptions
• Utility connections
We Collect…
• How does my age profile impact facilities risk?
• How does my space profile affect daily service operations?
• Do I have the right mix of space to fulfill my mission?
• Do I have too much/little square footage?
• Can I afford the space I have?• How do the above findings
compare to peers?
We Answer…
© 2017 Sightlines, LLC. All Rights Reserved.42
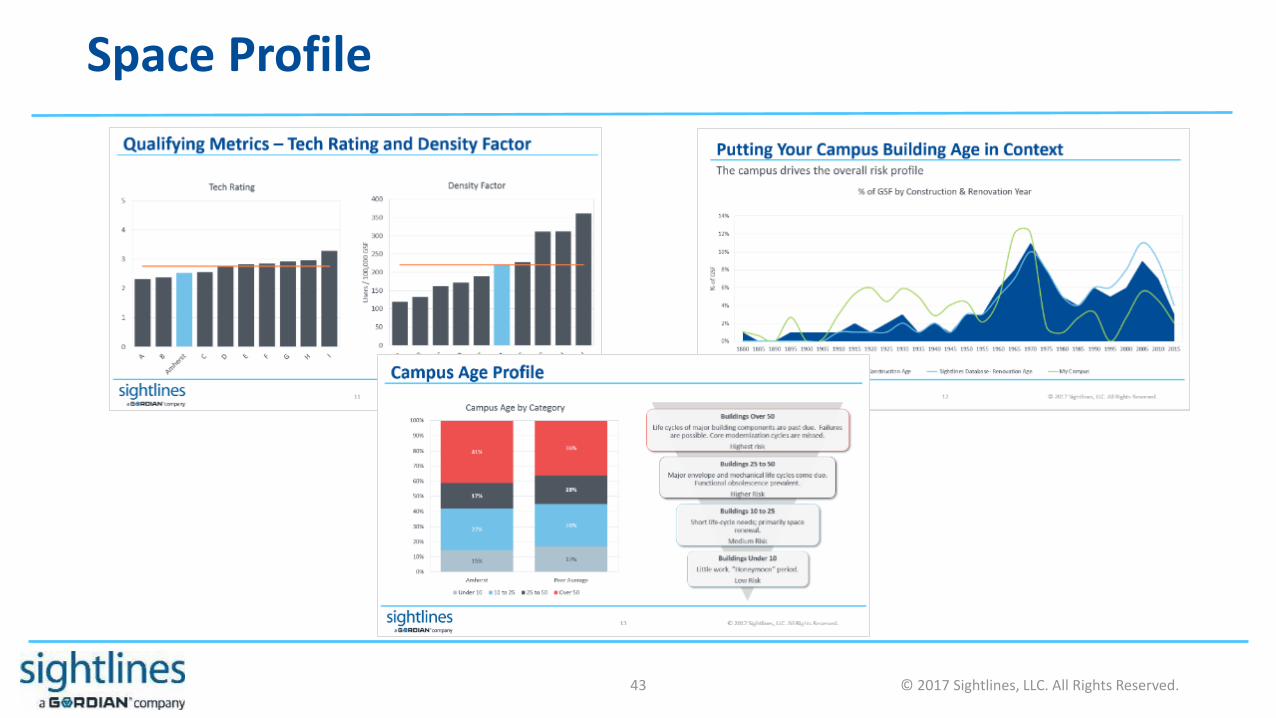
Space Profile
© 2017 Sightlines, LLC. All Rights Reserved.43

Capital ProfileWhat we collect and why
• Target investment level
• Annual funding to target
• Maintenance deferral rate
• Capital investment profile
We Determine..
• Historical project spending
• Deferred maintenance assessment
• R&R project list
• Campus master plan
• New building construction costs
We Collect…
• How much “should” I invest each year?
• Does my past investment align with needs?
• What are conditions on my campus?
• Am I gaining or losing ground with respect to backlog?
• How do the above findings compare to peers?
We Answer…
© 2017 Sightlines, LLC. All Rights Reserved.44

Capital Profile
© 2017 Sightlines, LLC. All Rights Reserved.45

Operations ProfileWhat we collect and why
• Daily service/PM costs
• Staffing profile
• Supervisor coverage
• Work order performance
• Customer service profile
• Utility cost and consumption
We Determine..
• Facilities budgets
• Staffing and org chart
• Trade distribution
• Work order reporting
• Utility invoices/history
We Collect…
• Is my facilities budget allocated appropriately?
• Is there effective planned or preventative maintenance?
• Do I have sufficient staffing?• Is my team supervised effectively?• Are there savings opportunities?• How well served does the
community feel?• How do the above findings
compare to peers?
We Answer…
© 2017 Sightlines, LLC. All Rights Reserved.46

Operations Profile
© 2017 Sightlines, LLC. All Rights Reserved.47

Predictive Analysis to Reduce Facilities Risk
• Effectively sequence investments with an understanding of future capital requirements
• Curtail the growth of critical deferred maintenance
• Develop actions plans to lower the risk of system failures
• Communicate the operating and capital impact of the addition and/or demolition of campus facilities $0
$10
$20
$30
$40
$50
$60
Tota
l Do
llars
(M
illio
ns)
Current Need Renewal Need
Modernization & Infrastructure Projected Investment
10 Year Capital Forecast
© 2017 Sightlines, LLC. All Rights Reserved.48
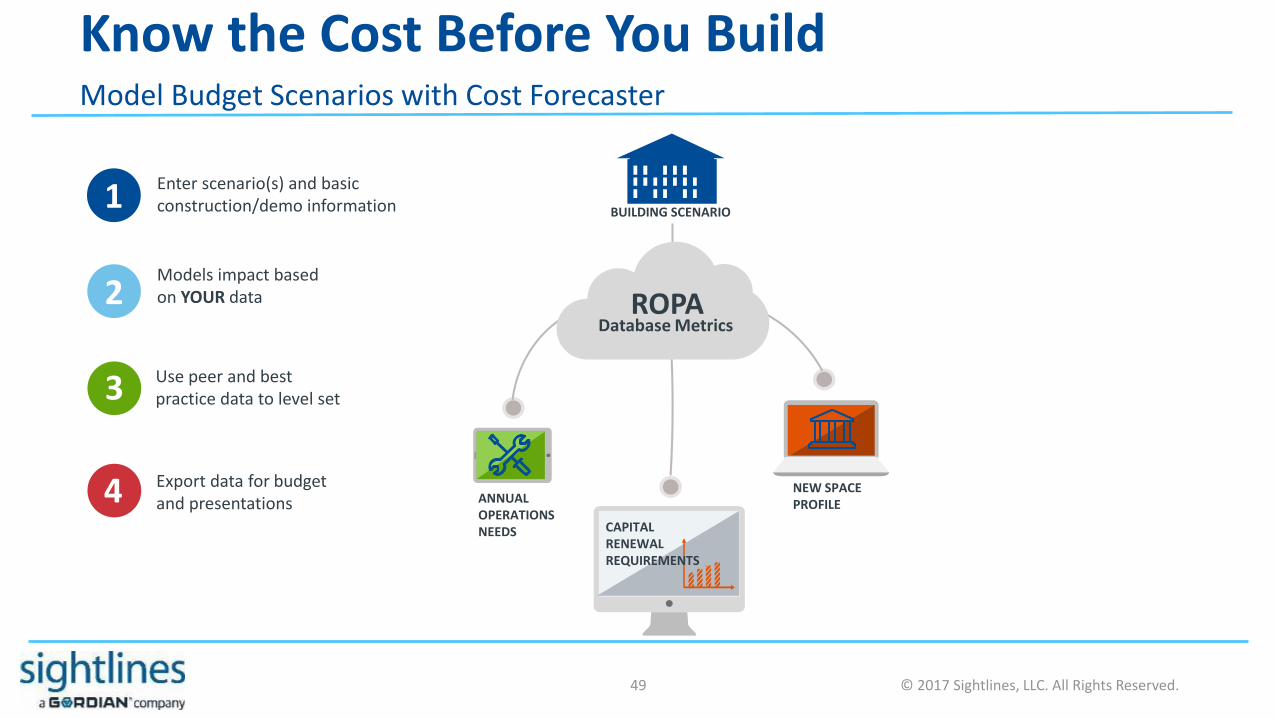
Know the Cost Before You BuildModel Budget Scenarios with Cost Forecaster
ROPADatabase Metrics
CAPITALRENEWALREQUIREMENTS
ANNUALOPERATIONSNEEDS
NEW SPACEPROFILE
BUILDING SCENARIO1
2
Enter scenario(s) and basic construction/demo information
Models impact based on YOUR data
3 Use peer and best practice data to level set
4 Export data for budgetand presentations
© 2017 Sightlines, LLC. All Rights Reserved.49
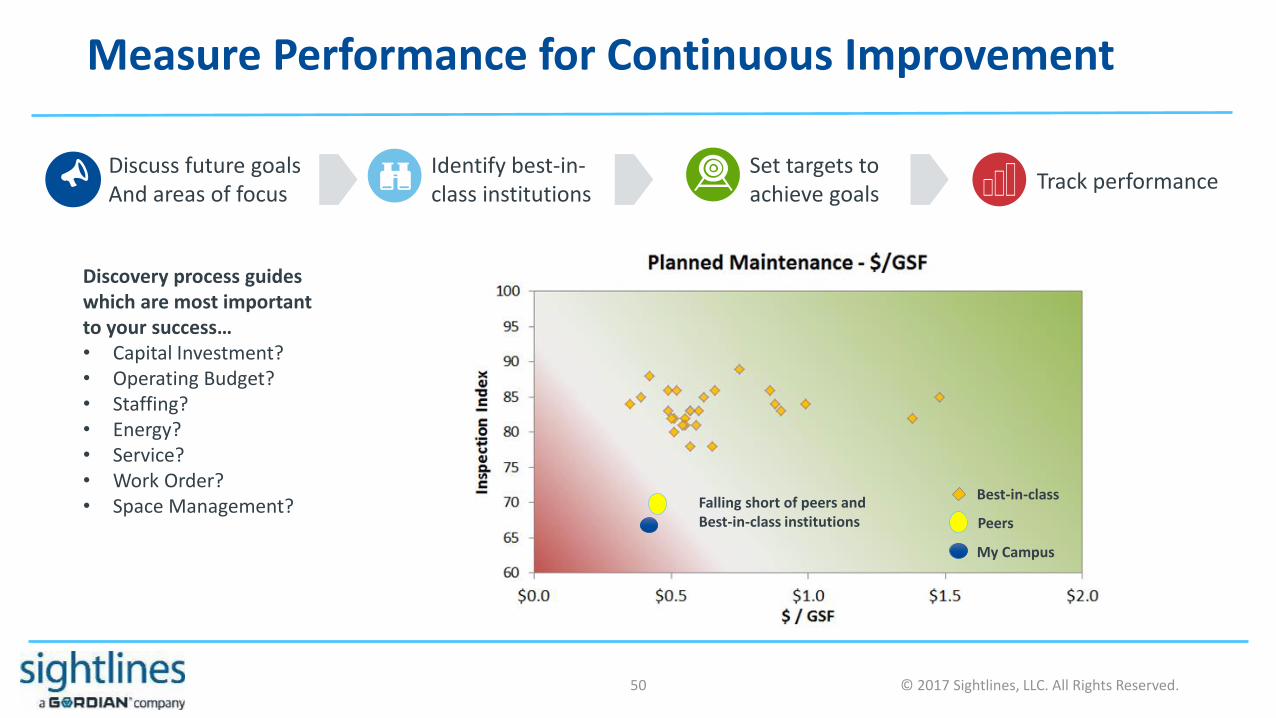
Measure Performance for Continuous Improvement
My Campus
Peers
Best-in-classFalling short of peers and Best-in-class institutions
Discuss future goalsAnd areas of focus
Discovery process guides which are most important to your success…• Capital Investment?• Operating Budget?• Staffing?• Energy?• Service?• Work Order?• Space Management?
Set targets to achieve goals
Identify best-in-class institutions
Track performance
© 2017 Sightlines, LLC. All Rights Reserved.50

What to Expect as a Sightlines Member
51

52
ROPA Annual Engagement TimelineData to knowledge in 18-20 weeks
Week Week Week Week Week Week Week Week Week Week Week Week Week
1 2 3 4 5 6 7 8 9 10 11 12 13
Cam
pu
s V
isit
- P
relim
inar
y P
rese
nta
tio
n
Finalize Data/
Modify
Presentation
Cam
pu
s V
isit
- F
Inal
Pre
sen
tati
on
Based on Your
Availability
Kickoff & Previsit
Data Collection
Data Analysis & Processing
Cam
pu
s V
isit
- D
ata
Co
llect
ion
Cam
pu
s V
isit
or
Web
Mee
tin
g -
Dat
a Q
ual
ific
atio
n
Pre
sen
tati
on
Data Revision
Five years of historical data collected for trending purposes
© 2017 Sightlines, LLC. All Rights Reserved.
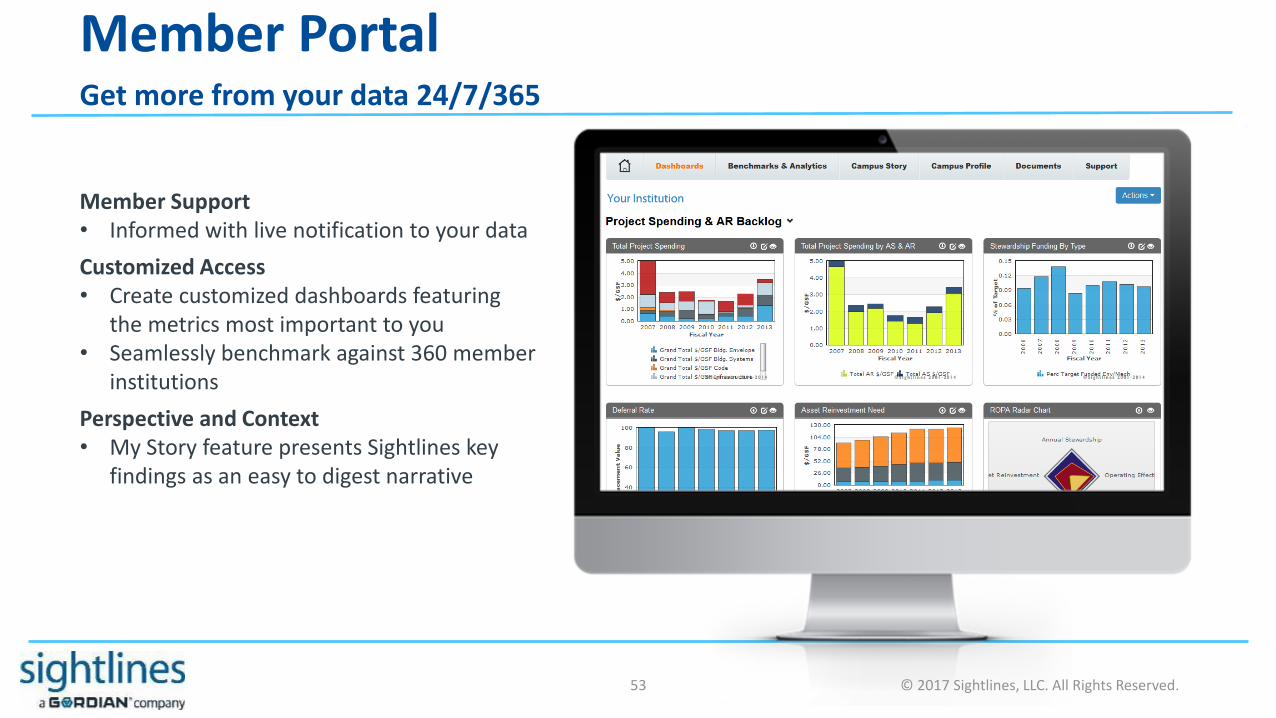
Member PortalGet more from your data 24/7/365
Member Support• Informed with live notification to your data
Customized Access• Create customized dashboards featuring
the metrics most important to you• Seamlessly benchmark against 360 member
institutions
Perspective and Context• My Story feature presents Sightlines key
findings as an easy to digest narrative
© 2017 Sightlines, LLC. All Rights Reserved.53

54
Thank you for your time.
@sightlinesllc
Sightlines
Sightlines360