Embed Size (px)
Citation preview

2Norwegian University of Life SciencesØstfold University College
Essays on the Russian Electricity and Capacity Market
Igor Pipkin
Outline• Introduction• Time regularities in the Russian power market• Market power issues in Northwest Russia• Market rules and market power in the Russian electricity
and capacity market• Regulatory obstacles to competition in the Russian power
market
3Norwegian University of Life SciencesØstfold University College
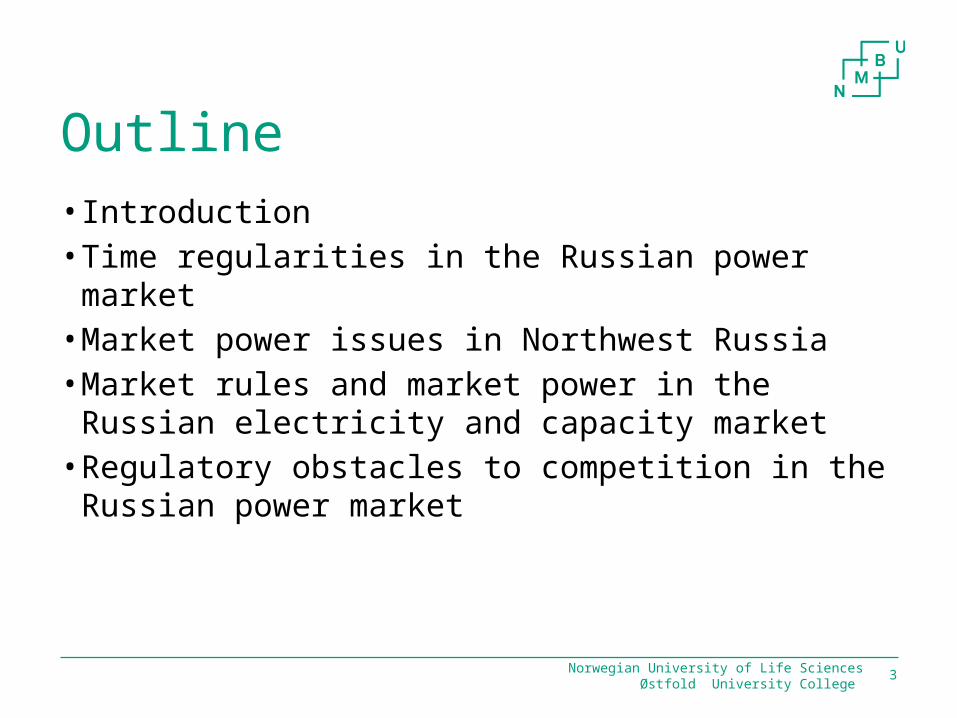
The Russian power sector prior to deregulation• Vertically integrated monopoly• Economic downturn after the
collapse of the USSR• Decrease in electricity consumption
• Ageing generation and transmission infrastructure
• Poor technological efficiency
• Pressing need for investments in the electricity sector to ensure growth in the economy
4Norwegian University of Life SciencesØstfold University College
Federal Law #35 “On Electricity”Objectives of the electricity reform (2003)• To create competitive markets in all regions of Russia• To create effective mechanisms to decrease costs in generation,
transmission and distribution• To promote energy savings/efficiency• To create favourable conditions for new investments• To improve the financial parameters of the sector• To eliminate cross-subsidization in a stepwise manner • To preserve and develop a unified electricity infrastructure system• To demonopolize fuel markets for thermal power plants• To reform the system of state regulation, control and supervision in
the power industry
Norwegian University of Life SciencesØstfold University College 5
The Russian Electricity and Capacity Market• The day-ahead market (DAM) was launched in 2006• Supporting markets:
–Unit Commitment auction (UC) – 3 days-ahead–Intraday/balancing market –Market for system services
• Financial market (Moscow Energy Exchange 2009) • Capacity market (2010)
• Regulated price for natural gas, railway transportation, tariffs for end-users, etc.
Norwegian University of Life SciencesØstfold University College 6
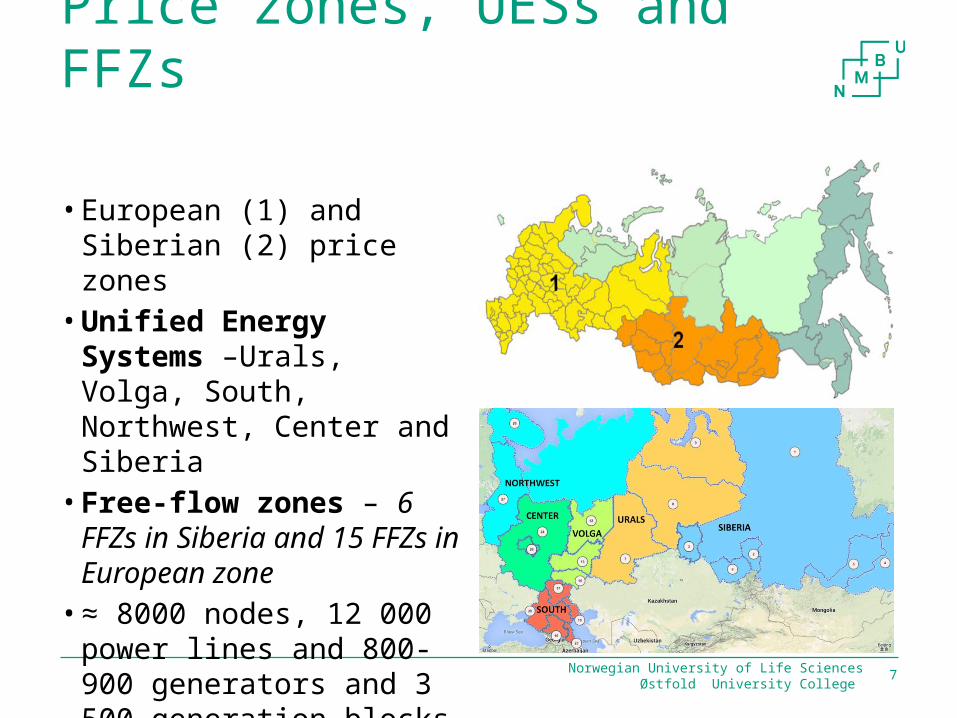
Price zones, UESs and FFZs
Norwegian University of Life SciencesØstfold University College 7
• European (1) and Siberian (2) price zones
• Unified Energy Systems –Urals, Volga, South, Northwest, Center and Siberia
• Free-flow zones – 6 FFZs in Siberia and 15 FFZs in European zone
• ≈ 8000 nodes, 12 000 power lines and 800-900 generators and 3 500 generation blocks
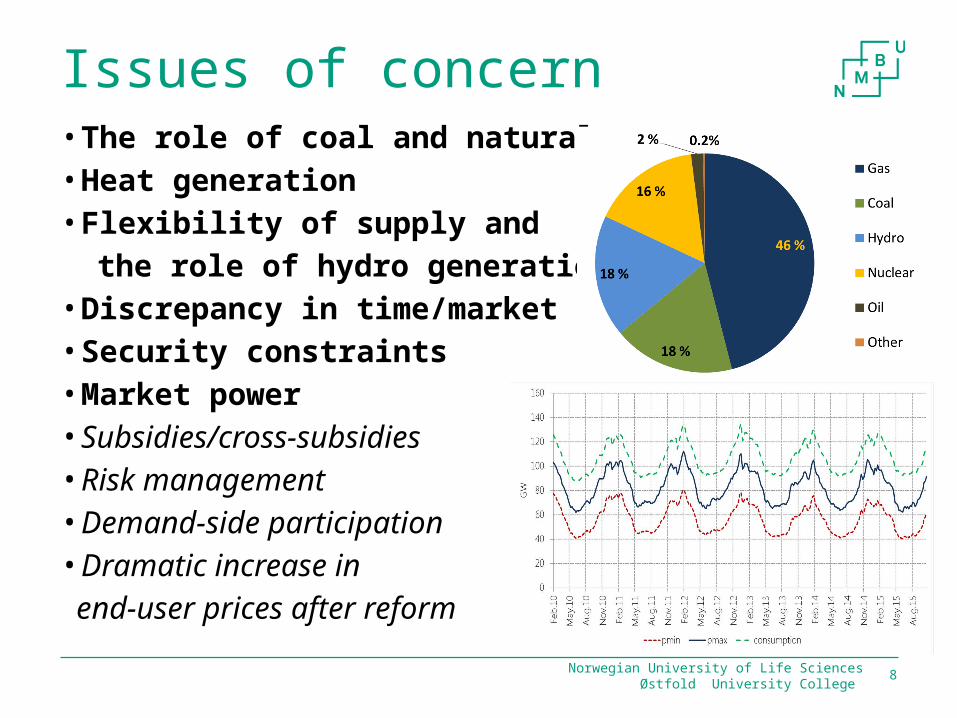
Issues of concern• The role of coal and natural gas• Heat generation • Flexibility of supply and the role of hydro generation• Discrepancy in time/market rules• Security constraints• Market power • Subsidies/cross-subsidies• Risk management• Demand-side participation• Dramatic increase in end-user prices after reform
Norwegian University of Life SciencesØstfold University College 8
Østfold University College 9Norwegian University of Life Sciences
Time regularities in the Russian power market
Igor Pipkin (2014)Journal of Energy Markets
Time regularities in the Russian power market
Introduction
10
• Demand for electricity exhibit time regularities• Time regularities reveal how technological, economic, structural and
physical aspects of the market are reflected in prices• Heavily influenced by economic/business activities• Unit commitment auctions constrain the minimum and maximum
available generation
• 65% of 215 GW was commissioned before 1980• Huge investment needs • Potential welfare gains by investing in the “right” technology
• Describe day-of-the-week and intraday patterns in price, and the price difference between European and Siberian price zones
Norwegian University of Life SciencesØstfold University College
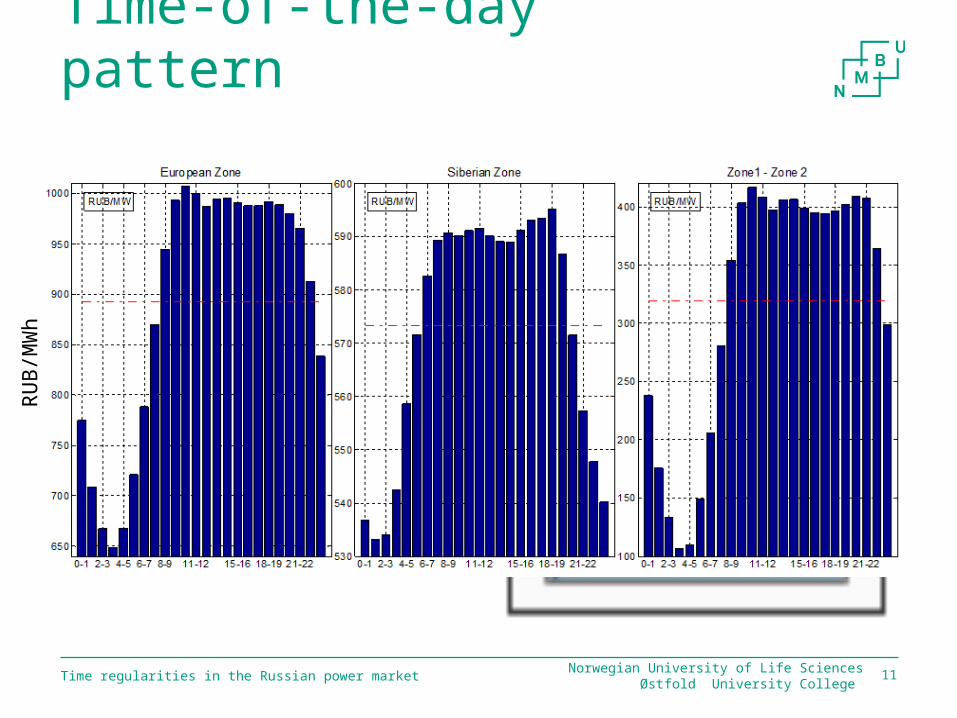
Time-of-the-day pattern
Norwegian University of Life SciencesØstfold University College Time regularities in the Russian power market 11
Click icon to add picture
RU
B/M
Wh
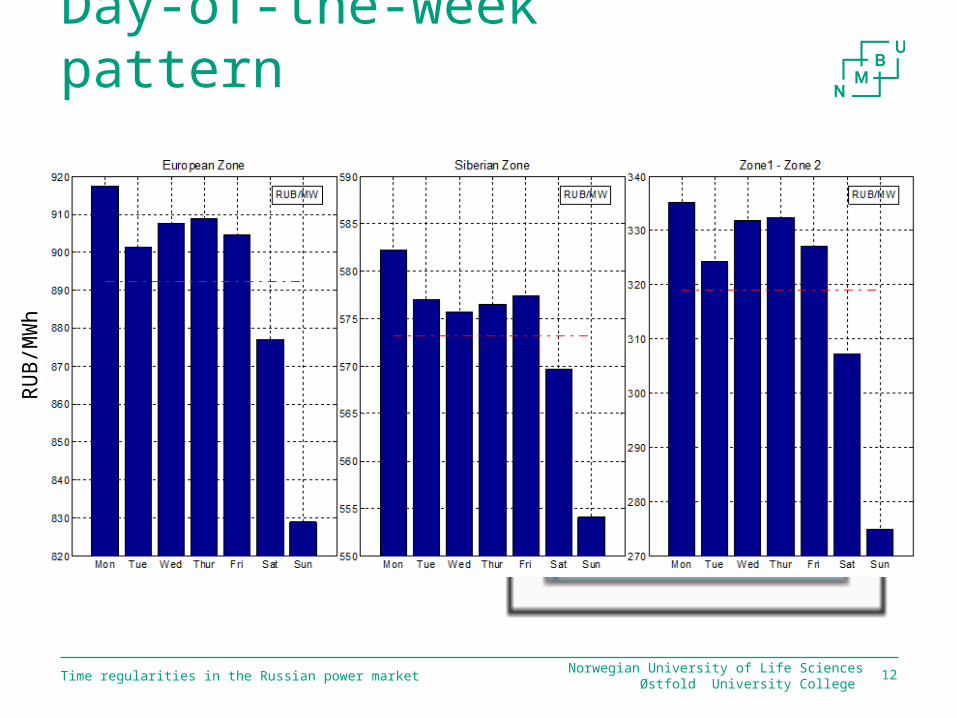
Day-of-the-week pattern
Norwegian University of Life SciencesØstfold University College Time regularities in the Russian power market 12
Click icon to add picture
RU
B/M
Wh
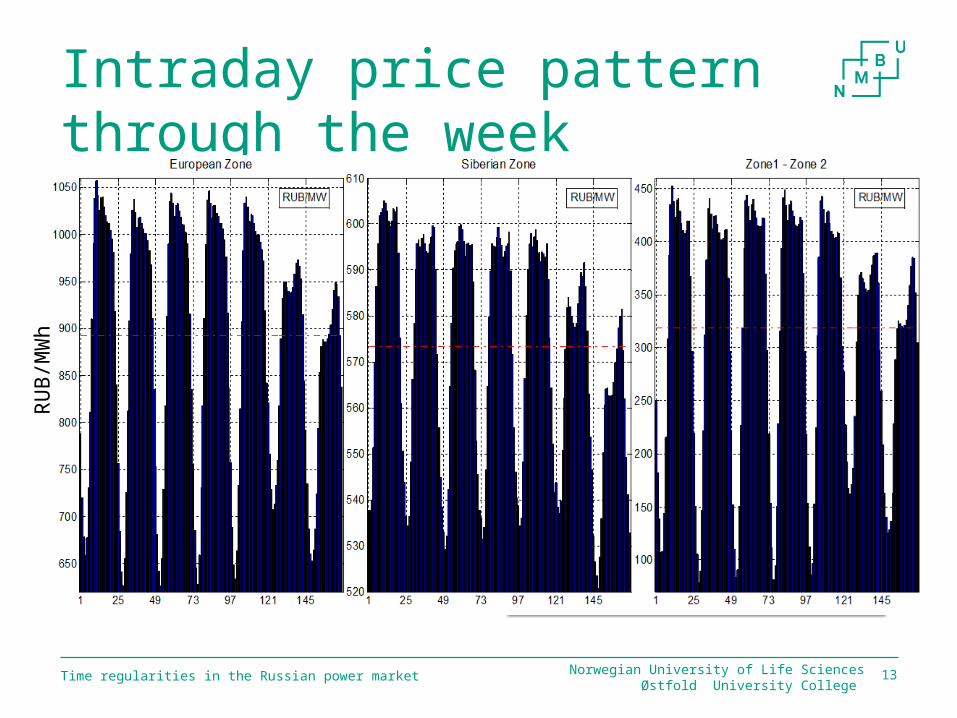
Time regularities in the Russian power market
Intraday price pattern through the week
13
Click icon to add picture
Norwegian University of Life SciencesØstfold University College
RU
B/M
Wh
Time regularities in the Russian power market
Potential for welfare gains
• Invest in technologies that allow for flexibility on either the supply side or the demand side
• Relax generation constraints in the Unit Commitment auction
• Extend transmission capacity between the Siberian and European price zones
• Connection to other areas with a different fuel mix
14Norwegian University of Life SciencesØstfold University College
Østfold University College 15Norwegian University of Life Sciences
Market power issues in Northwest Russia
Igor Pipkin
Introduction• Previous studies show high market concentration in the Russian
power market, especially in Northwest Russia• No econometric studies (to my knowledge) on the properties of
supply/demand in the Russian power market
• Examine market power in the energy sector in Northwest Russia, by estimating demand and supply curves using the Bresnahan–Lau framework
• Study the relationship between the price of electricity, thermal generation and the price of natural gas. The latter is regulated and expected to increase
Norwegian University of Life SciencesØstfold University College Market power issues in Northwest Russia 16
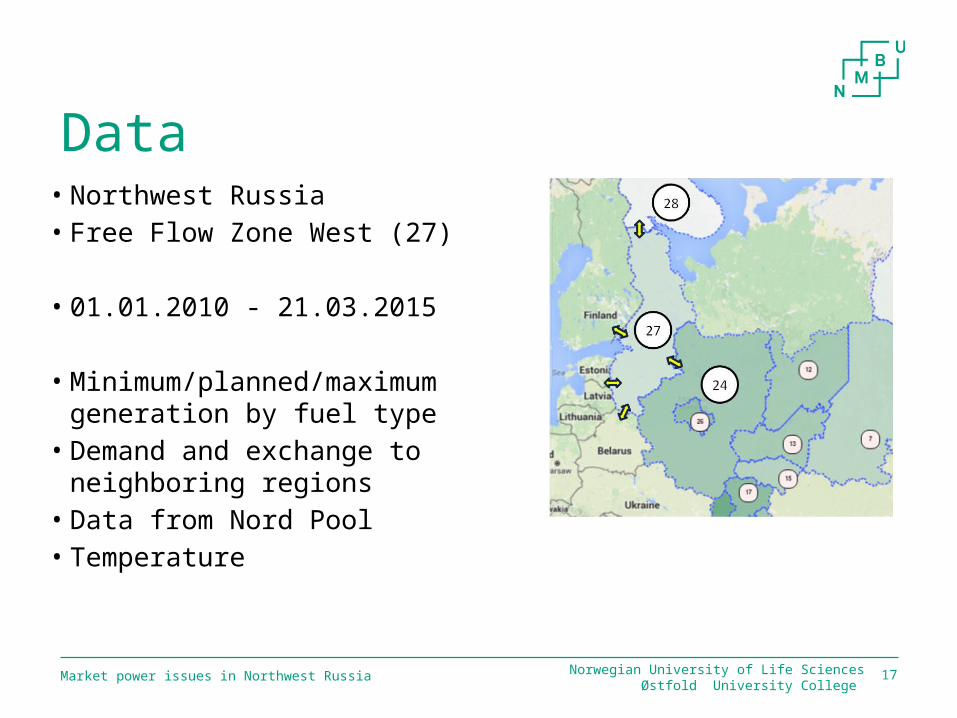
Data
Market power issues in Northwest Russia 17
• Northwest Russia • Free Flow Zone West (27)
• 01.01.2010 - 21.03.2015
• Minimum/planned/maximum generation by fuel type
• Demand and exchange to neighboring regions
• Data from Nord Pool• Temperature
Norwegian University of Life SciencesØstfold University College
18
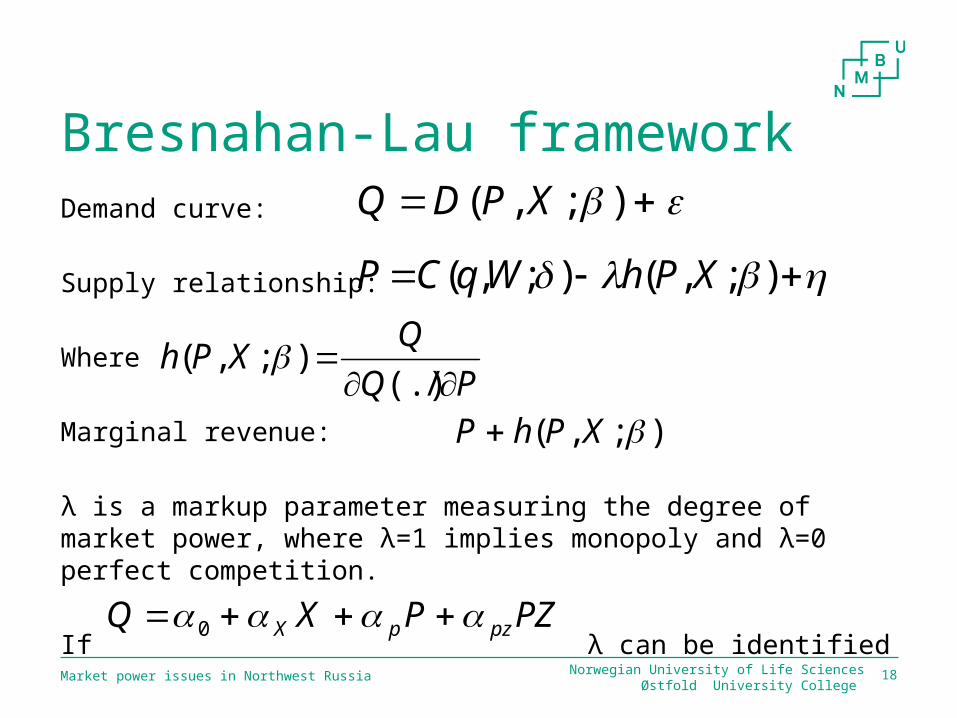
Bresnahan-Lau frameworkDemand curve:
Supply relationship:
Where
Marginal revenue:
λ is a markup parameter measuring the degree of market power, where λ=1 implies monopoly and λ=0 perfect competition.
If λ can be identified
Market power issues in Northwest Russia
);,( XPDQ
);,();,( XPhWqCP
PQQ
XPh
/(.)
);,(
);,( XPhP
Norwegian University of Life SciencesØstfold University College
PZPXQ pzpX 0
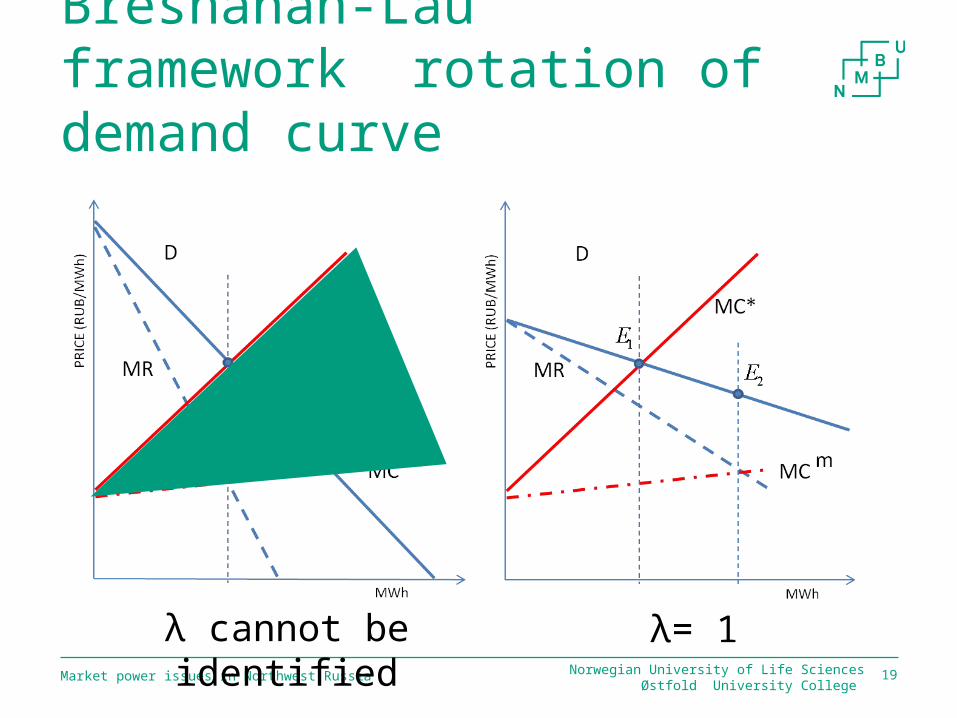
Bresnahan-Lau framework rotation of demand curve
Market power issues in Northwest Russia 19Norwegian University of Life SciencesØstfold University College
λ cannot be identified λ= 1
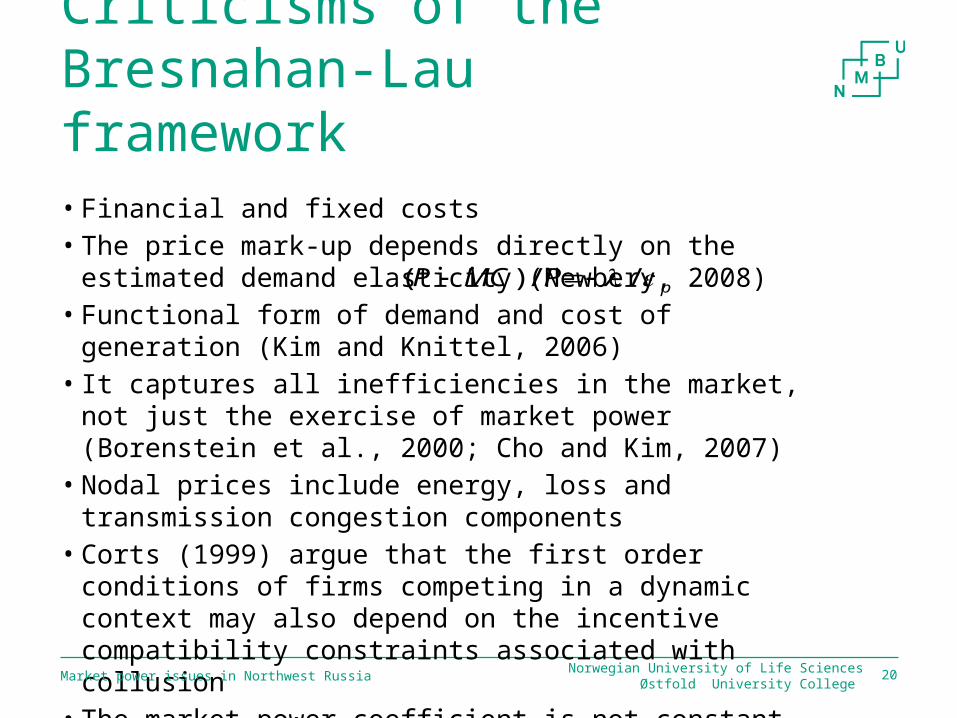
Criticisms of the Bresnahan-Lau framework• Financial and fixed costs• The price mark-up depends directly on the estimated demand
elasticity (Newbery, 2008)• Functional form of demand and cost of generation (Kim and
Knittel, 2006)• It captures all inefficiencies in the market, not just the exercise
of market power (Borenstein et al., 2000; Cho and Kim, 2007)• Nodal prices include energy, loss and transmission congestion
components• Corts (1999) argue that the first order conditions of firms
competing in a dynamic context may also depend on the incentive compatibility constraints associated with collusion
• The market power coefficient is not constantNorwegian University of Life Sciences
Østfold University College Market power issues in Northwest Russia 20
pPMCP //)(
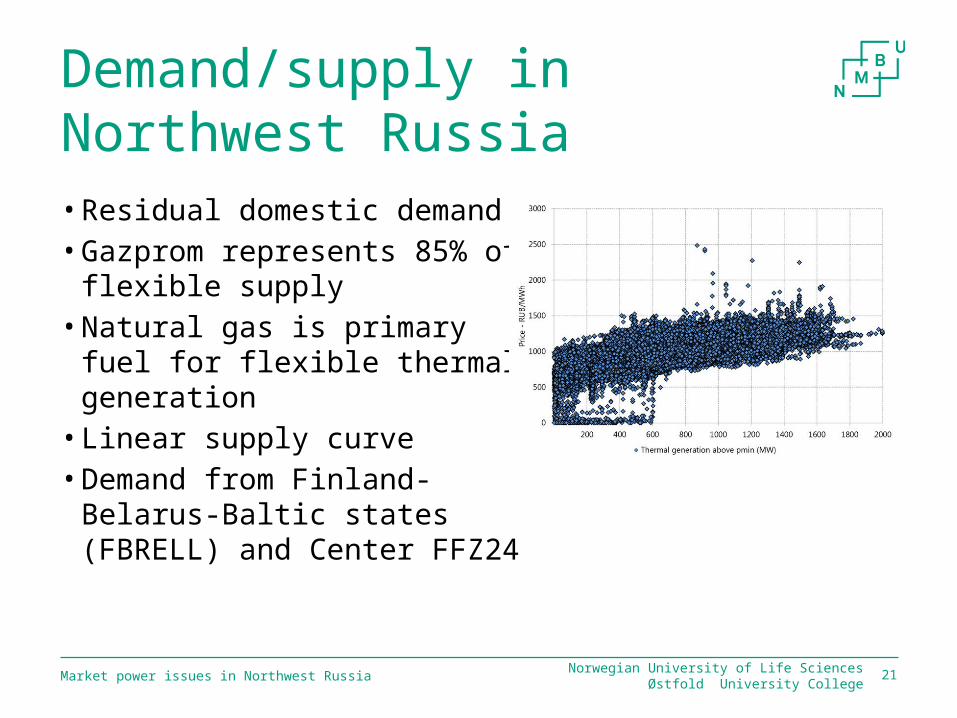
Demand/supply in Northwest Russia• Residual domestic demand• Gazprom represents 85% of
flexible supply• Natural gas is primary fuel for
flexible thermal generation • Linear supply curve• Demand from Finland-Belarus-
Baltic states (FBRELL) and Center FFZ24
Norwegian University of Life SciencesØstfold University CollegeMarket power issues in Northwest Russia 21
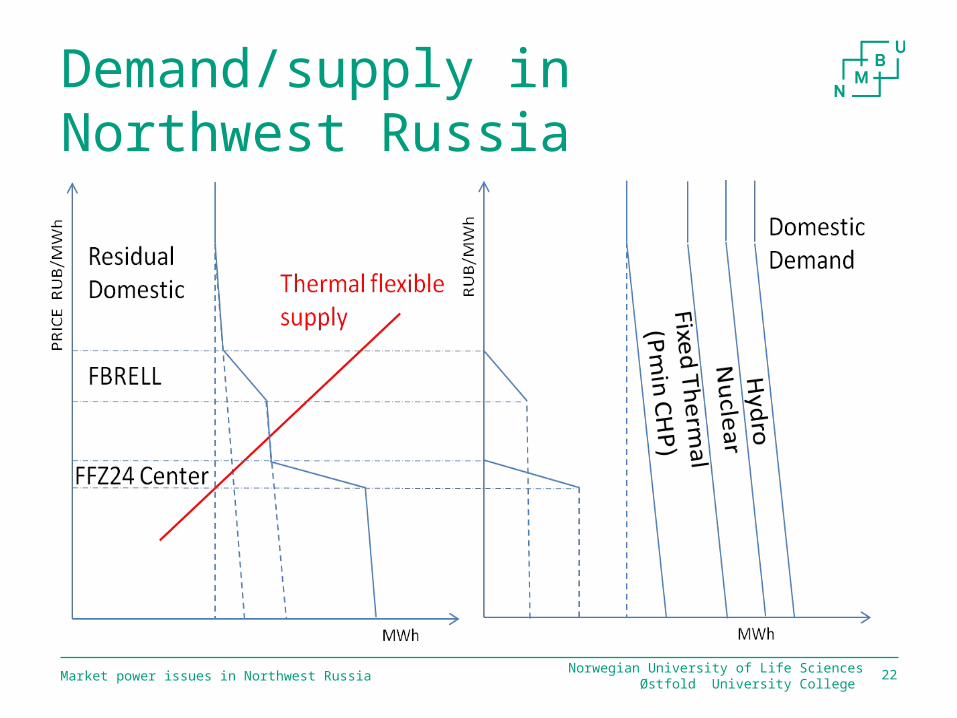
Demand/supply in Northwest Russia
Norwegian University of Life SciencesØstfold University College Market power issues in Northwest Russia 22
Click icon to add picture
Estimation of the demand and supply relationship
• 24 hour models for each hour of the day• Stationary data• Need to account for endogeneity (price and quantity)• Two-stage least squares (2SLS) for export demand (FBRELL and
FFZ Center-24)• Generalized method of moments (GMM) for residual domestic
demand and supply • Strong instruments/pass Hansen’s test of over-identifying restrictions• Heteroskedasticity and autocorrelation consistent standard errors
Norwegian University of Life SciencesØstfold University College Market power issues in Northwest Russia 23
Interesting findings• The colder it gets, the lower is residual domestic demand• Day length coefficient is negative – morning/evening hours• Price elasticity is relatively stable, except 9-10 am and 7-9 pm• NW Russia exports more to Center during the night and early
morning, lower flows when the number of daylight hours increases, trend coefficient is positive and stable throughout the day
• FBRELL is most price inelastic for the hours between 4-8 am Moscow time (2-6 am Oslo time). The colder it is in NW Russia, the less power is exported. Hydro balance and nuclear generation is negatively correlated with exports from NW Russia to FBRELL
• The coefficient for thermal flexible generation in the supply equation is 0.3 -0.4 RUB/MWh
• The coefficient for the natural gas price is 0.9Norwegian University of Life Sciences
Østfold University College Market power issues in Northwest Russia 24
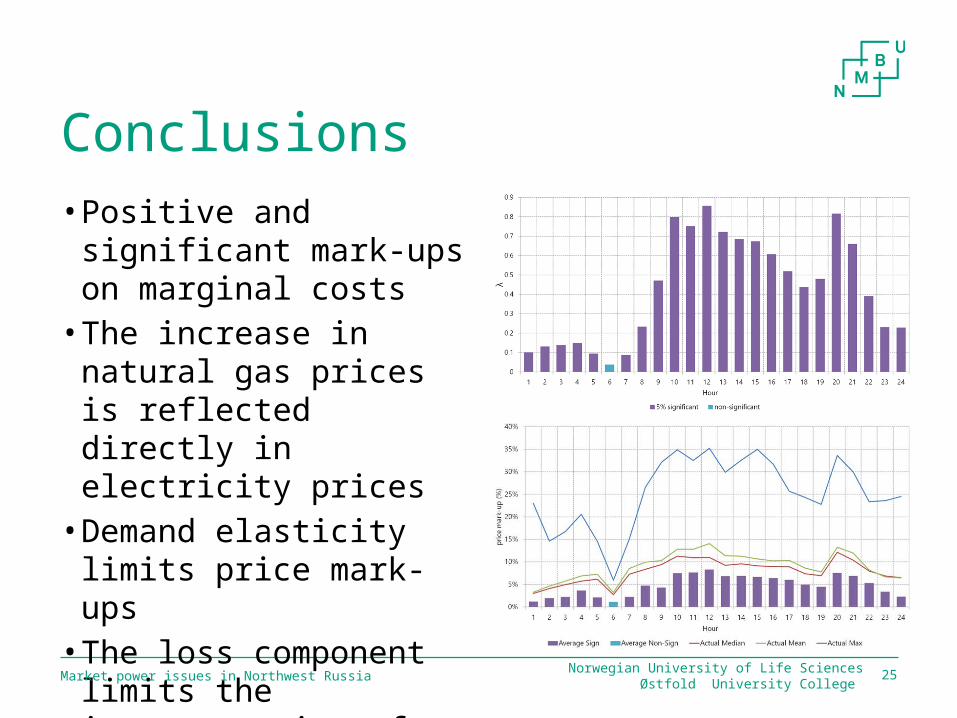
Conclusions• Positive and significant
mark-ups on marginal costs• The increase in natural gas
prices is reflected directly in electricity prices
• Demand elasticity limits price mark-ups
• The loss component limits the interpretation of the results
Norwegian University of Life SciencesØstfold University College Market power issues in Northwest Russia 25
Østfold University College 26Norwegian University of Life Sciences
Market rules and market power in the Russian electricity and capacity market
Igor Pipkin
Market rules and market power in the Russian electricity and capacity market
Introduction• The existing literature does not account for the specific
formulation of the clearing algorithm at the power plant level
• The formulation of the security constrained optimal power flow problem have a direct impact on the ability of dominant power producers to exert market power
Norwegian University of Life SciencesØstfold University College 27
Market rules and market power in the Russian electricity and capacity market
Introduction (ii)• Study market power in the Russian power markets by adjusting
the traditional market concentration indices to take market rules into account
• Illustrate the role of transmission capacity for market concentration, and investigate the relationship between the transmission constrained residual supply index (TCRSI) and price/price-cost mark-up
• Having and exercising market power
28Norwegian University of Life SciencesØstfold University College
Market rules and market power in the Russian electricity and capacity market
Data• All regime generation units/130+ gencos• Consumption and export/import• Ignore cross-ownership similar to the Federal
Antimonopoly Service (FAS)
• Time period: January 2012 - June 2015
Norwegian University of Life SciencesØstfold University College 29
Market rules and market power in the Russian electricity and capacity market 30
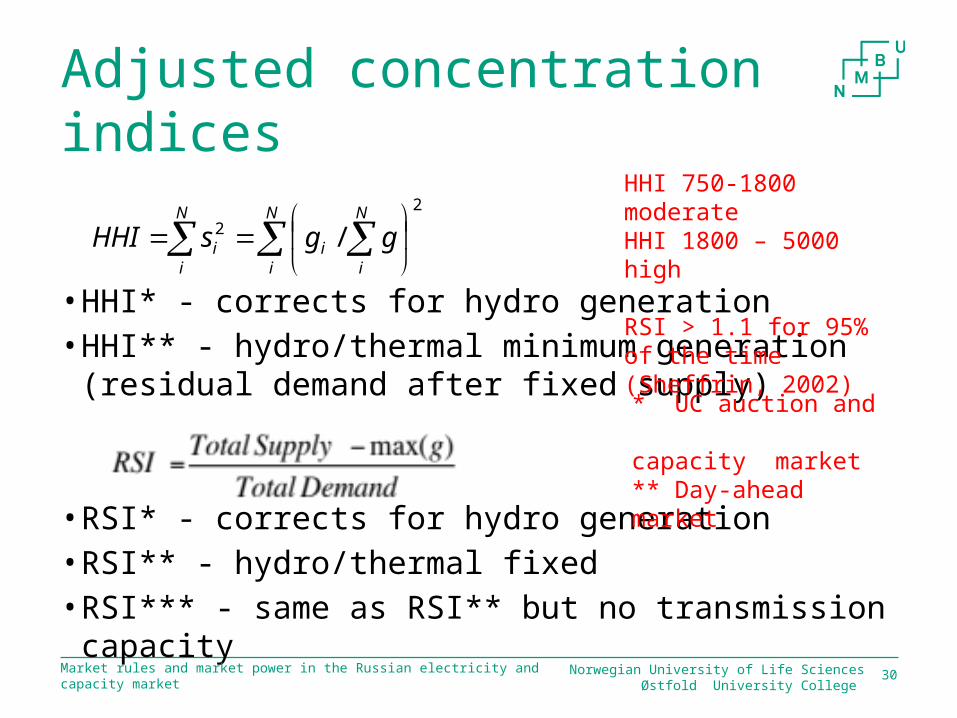
Adjusted concentration indices
• HHI* - corrects for hydro generation• HHI** - hydro/thermal minimum generation (residual
demand after fixed supply)
• RSI* - corrects for hydro generation • RSI** - hydro/thermal fixed• RSI*** - same as RSI** but no transmission capacity
22 /
N
i
N
ii
N
ii ggsHHI
Norwegian University of Life SciencesØstfold University College
HHI 750-1800 moderateHHI 1800 – 5000 high
RSI > 1.1 for 95% of the time (Sheffrin, 2002)
* UC auction and capacity market** Day-ahead market
Market rules and market power in the Russian electricity and capacity market 31
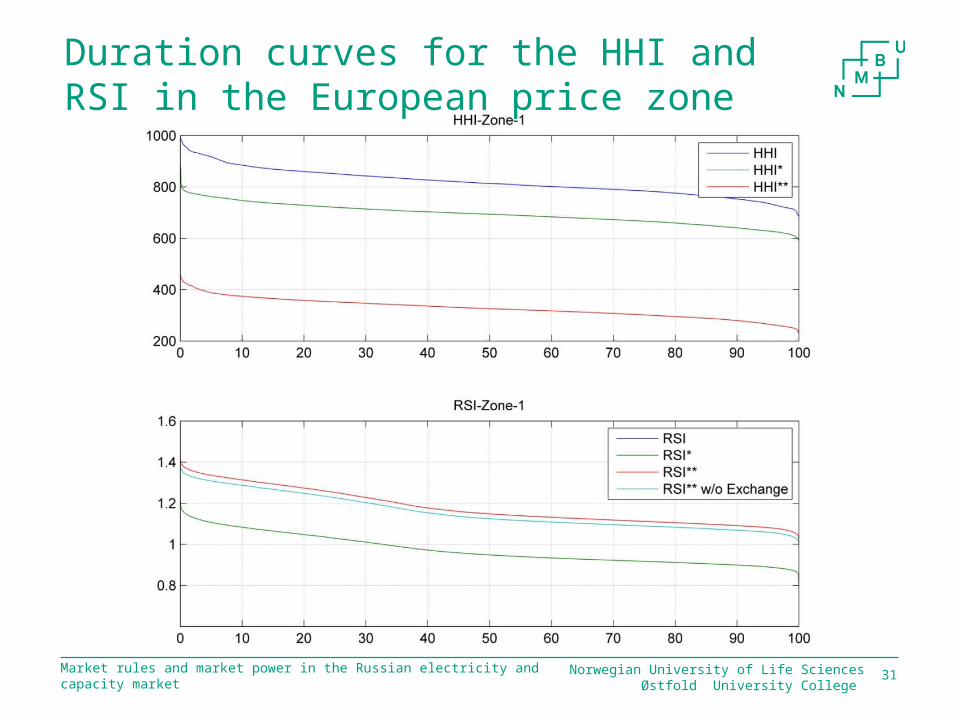
Duration curves for the HHI and RSI in the European price zone
Norwegian University of Life SciencesØstfold University College
Market rules and market power in the Russian electricity and capacity market 32
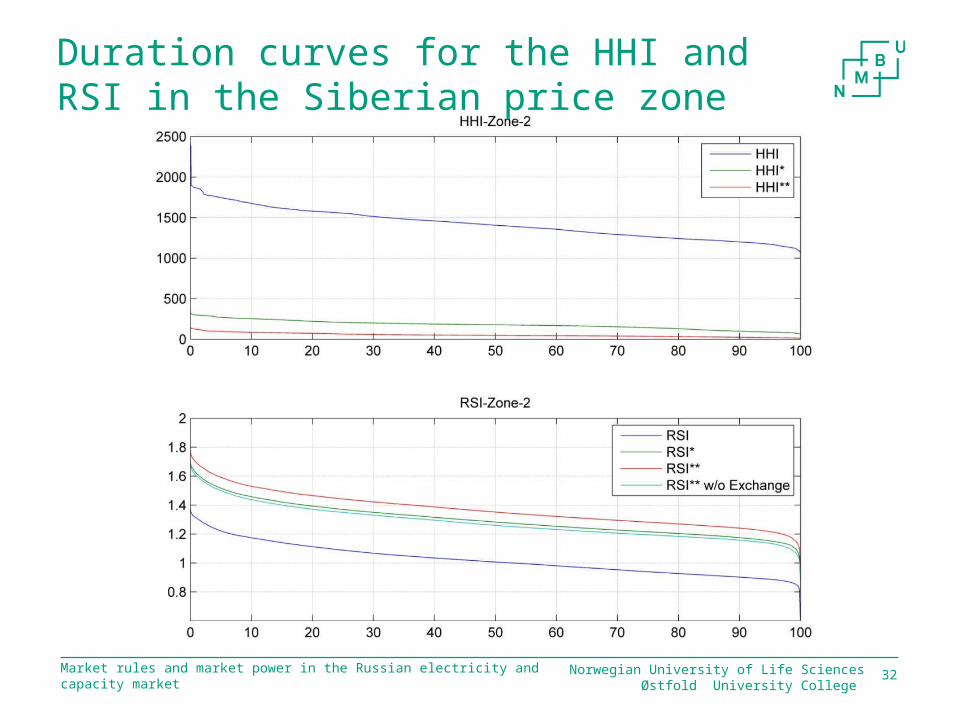
Duration curves for the HHI and RSI in the Siberian price zone
Norwegian University of Life SciencesØstfold University College
Market rules and market power in the Russian electricity and capacity market 33
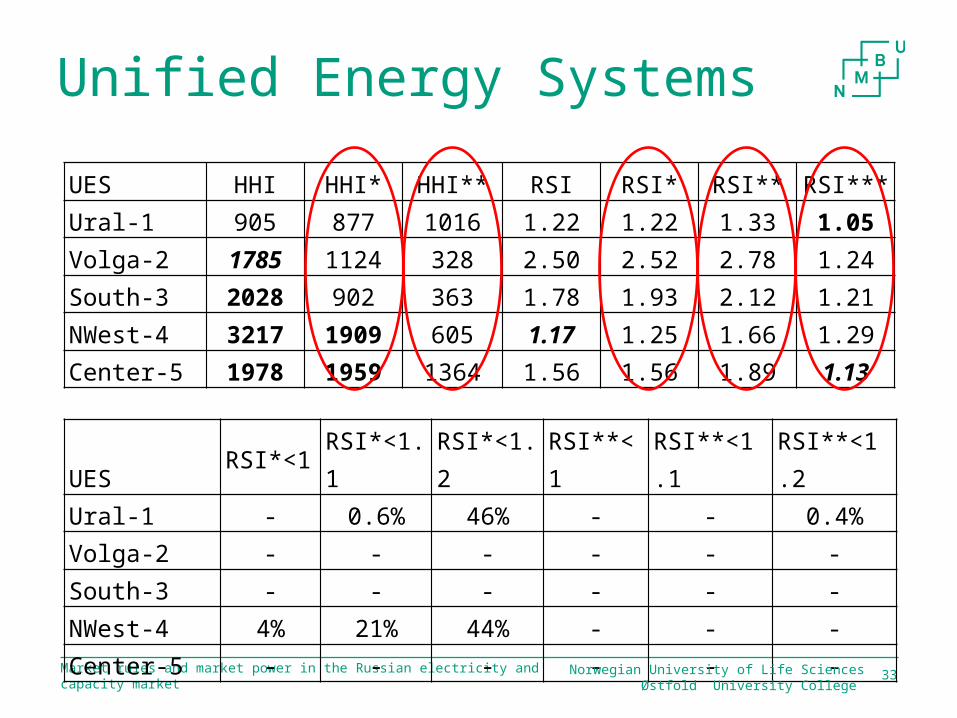
Unified Energy Systems
UES HHI HHI* HHI** RSI RSI* RSI** RSI***Ural-1 905 877 1016 1.22 1.22 1.33 1.05Volga-2 1785 1124 328 2.50 2.52 2.78 1.24South-3 2028 902 363 1.78 1.93 2.12 1.21NWest-4 3217 1909 605 1.17 1.25 1.66 1.29Center-5 1978 1959 1364 1.56 1.56 1.89 1.13
UES RSI*<1 RSI*<1.1 RSI*<1.2 RSI**<1 RSI**<1.1 RSI**<1.2
Ural-1 - 0.6% 46% - - 0.4%
Volga-2 - - - - - -
South-3 - - - - - -
NWest-4 4% 21% 44% - - -
Center-5 - - - - - -
Norwegian University of Life SciencesØstfold University College
Market rules and market power in the Russian electricity and capacity market 34
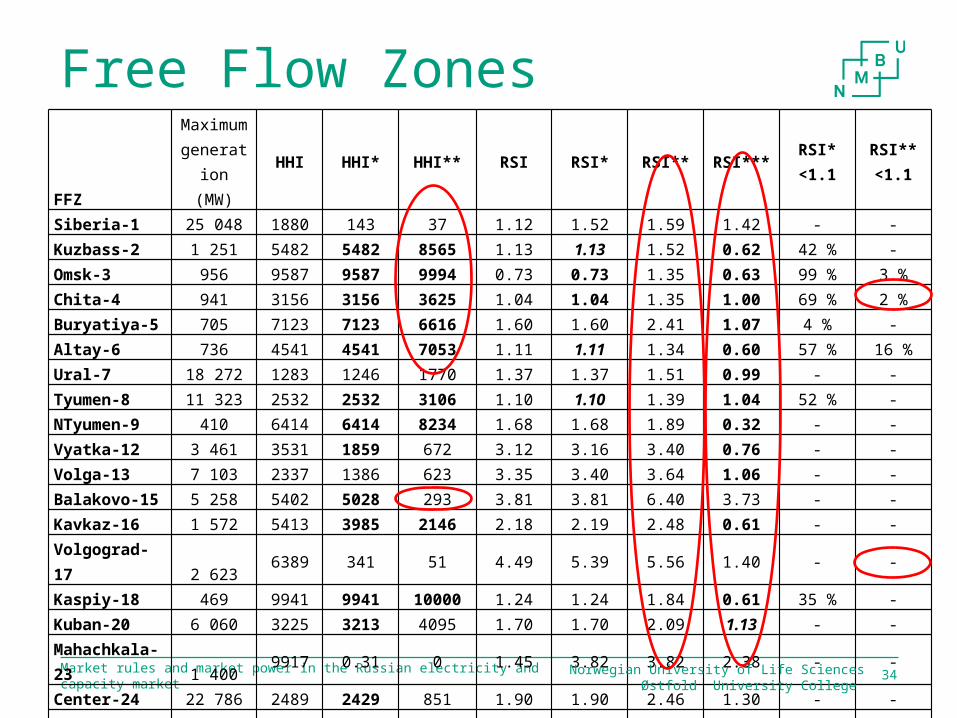
Free Flow ZonesFFZ
Maximum generation
(MW)HHI HHI* HHI** RSI RSI* RSI** RSI***
RSI*<1.1
RSI**<1.1
Siberia-1 25 048 1880 143 37 1.12 1.52 1.59 1.42 - -Kuzbass-2 1 251 5482 5482 8565 1.13 1.13 1.52 0.62 42 % -Omsk-3 956 9587 9587 9994 0.73 0.73 1.35 0.63 99 % 3 %Chita-4 941 3156 3156 3625 1.04 1.04 1.35 1.00 69 % 2 %Buryatiya-5 705 7123 7123 6616 1.60 1.60 2.41 1.07 4 % -Altay-6 736 4541 4541 7053 1.11 1.11 1.34 0.60 57 % 16 %Ural-7 18 272 1283 1246 1770 1.37 1.37 1.51 0.99 - -Tyumen-8 11 323 2532 2532 3106 1.10 1.10 1.39 1.04 52 % -NTyumen-9 410 6414 6414 8234 1.68 1.68 1.89 0.32 - -Vyatka-12 3 461 3531 1859 672 3.12 3.16 3.40 0.76 - -Volga-13 7 103 2337 1386 623 3.35 3.40 3.64 1.06 - -Balakovo-15 5 258 5402 5028 293 3.81 3.81 6.40 3.73 - -Kavkaz-16 1 572 5413 3985 2146 2.18 2.19 2.48 0.61 - -Volgograd-17 2 623 6389 341 51 4.49 5.39 5.56 1.40 - -Kaspiy-18 469 9941 9941 10000 1.24 1.24 1.84 0.61 35 % -Kuban-20 6 060 3225 3213 4095 1.70 1.70 2.09 1.13 - -Mahachkala-23 1 400
9917 0.31 0 1.45 3.82 3.82 2.38 - -
Center-24 22 786 2489 2429 851 1.90 1.90 2.46 1.30 - -Moscow-26 9 160 6668 6668 6378 0.69 0.69 1.17 0.64 98 % 47 %West-27 7 911 2833 2126 1899 1.31 1.36 1.71 1.18 5 % -Kolskaya-28 2 514 5131 2024 0.22 1.01 1.22 1.99 1.73 25 % -
Norwegian University of Life SciencesØstfold University College
Market rules and market power in the Russian electricity and capacity market 35
Transmission Constrained Residual Supply Index• Maximize consumption in the zone(s) while removing the
capacity (fixed capacity for **) of one market player• Transmission capacity as calculated by the system
operator • 35 generators• 22 000 hours
Norwegian University of Life SciencesØstfold University College
36
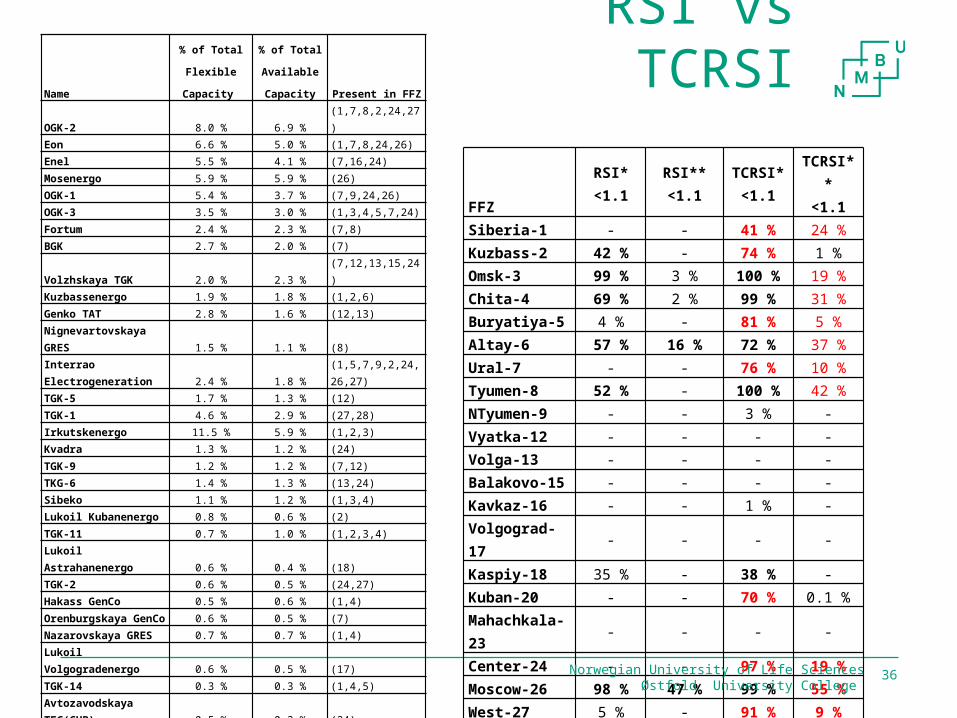
RSI vs TCRSIName
% of Total
Flexible
Capacity
% of Total
Available
Capacity Present in FFZOGK-2 8.0 % 6.9 % (1,7,8,2,24,27)Eon 6.6 % 5.0 % (1,7,8,24,26)Enel 5.5 % 4.1 % (7,16,24)Mosenergo 5.9 % 5.9 % (26)OGK-1 5.4 % 3.7 % (7,9,24,26)OGK-3 3.5 % 3.0 % (1,3,4,5,7,24)Fortum 2.4 % 2.3 % (7,8)BGK 2.7 % 2.0 % (7)Volzhskaya TGK 2.0 % 2.3 % (7,12,13,15,24)Kuzbassenergo 1.9 % 1.8 % (1,2,6)
Genko TAT 2.8 % 1.6 % (12,13)Nignevartovskaya GRES 1.5 % 1.1 % (8)
Interrao Electrogeneration 2.4 % 1.8 % (1,5,7,9,2,24,26,27)TGK-5 1.7 % 1.3 % (12)TGK-1 4.6 % 2.9 % (27,28)Irkutskenergo 11.5 % 5.9 % (1,2,3)Kvadra 1.3 % 1.2 % (24)TGK-9 1.2 % 1.2 % (7,12)TKG-6 1.4 % 1.3 % (13,24)
Sibeko 1.1 % 1.2 % (1,3,4)Lukoil Kubanenergo 0.8 % 0.6 % (2)TGK-11 0.7 % 1.0 % (1,2,3,4)Lukoil Astrahanenergo 0.6 % 0.4 % (18)TGK-2 0.6 % 0.5 % (24,27)Hakass GenCo 0.5 % 0.6 % (1,4)Orenburgskaya GenCo 0.6 % 0.5 % (7)Nazarovskaya GRES 0.7 % 0.7 % (1,4)Lukoil Volgogradenergo 0.6 % 0.5 % (17)TGK-14 0.3 % 0.3 % (1,4,5)
Avtozavodskaya TEC(CHP) 0.5 % 0.3 % (24)
RosEnergoAtom 1.1 % 13.9 % (7,15,16,2,24,27,28)TGK-16 0.3 % 0.6 % (12,13)Sanors 0.5 % 0.2 % (13)
Novoryazanskaya TEC(CHP) 0.2 % 0.2 % (24)Irkutenergosbyt EW 0.2 % 0.1 % (1,6)
FFZRSI*<1.1
RSI**<1.1
TCRSI*<1.1
TCRSI**<1.1
Siberia-1 - - 41 % 24 %Kuzbass-2 42 % - 74 % 1 %Omsk-3 99 % 3 % 100 % 19 %Chita-4 69 % 2 % 99 % 31 %Buryatiya-5 4 % - 81 % 5 %Altay-6 57 % 16 % 72 % 37 %Ural-7 - - 76 % 10 %Tyumen-8 52 % - 100 % 42 %NTyumen-9 - - 3 % -Vyatka-12 - - - -Volga-13 - - - -Balakovo-15 - - - -Kavkaz-16 - - 1 % -Volgograd-17 - - - -Kaspiy-18 35 % - 38 % -Kuban-20 - - 70 % 0.1 %Mahachkala-23
- - - -
Center-24 - - 97 % 19 %Moscow-26 98 % 47 % 99 % 55 %West-27 5 % - 91 % 9 %Kolskaya-28 25 % - 77 % 1 %
Norwegian University of Life SciencesØstfold University College
Market rules and market power in the Russian electricity and capacity market
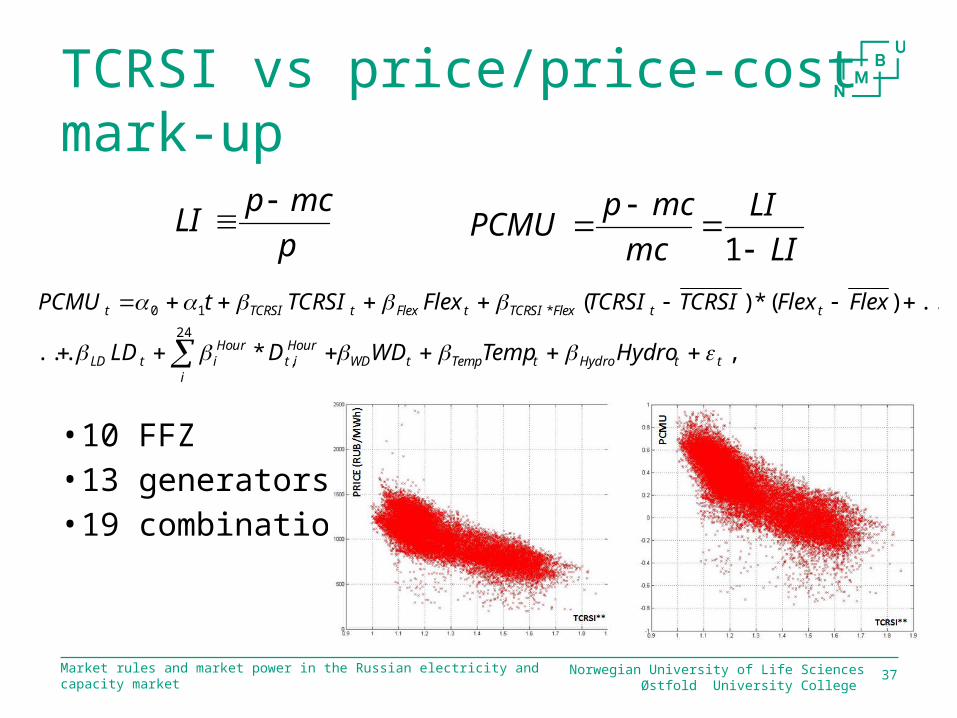
TCRSI vs price/price-cost mark-up
• 10 FFZ • 13 generators• 19 combinations
37
LILI
mcmcp
PCMU
1
,*...
...)(*)(24
,
*10
ttHydrotTemptWDi
Hourit
HouritLD
ttFlexTCRSItFlextTCRSIt
HydroTempWDDLD
FlexFlexTCRSITCRSIFlexTCRSItPCMU
pmcpLI
Norwegian University of Life SciencesØstfold University College
Market rules and market power in the Russian electricity and capacity market
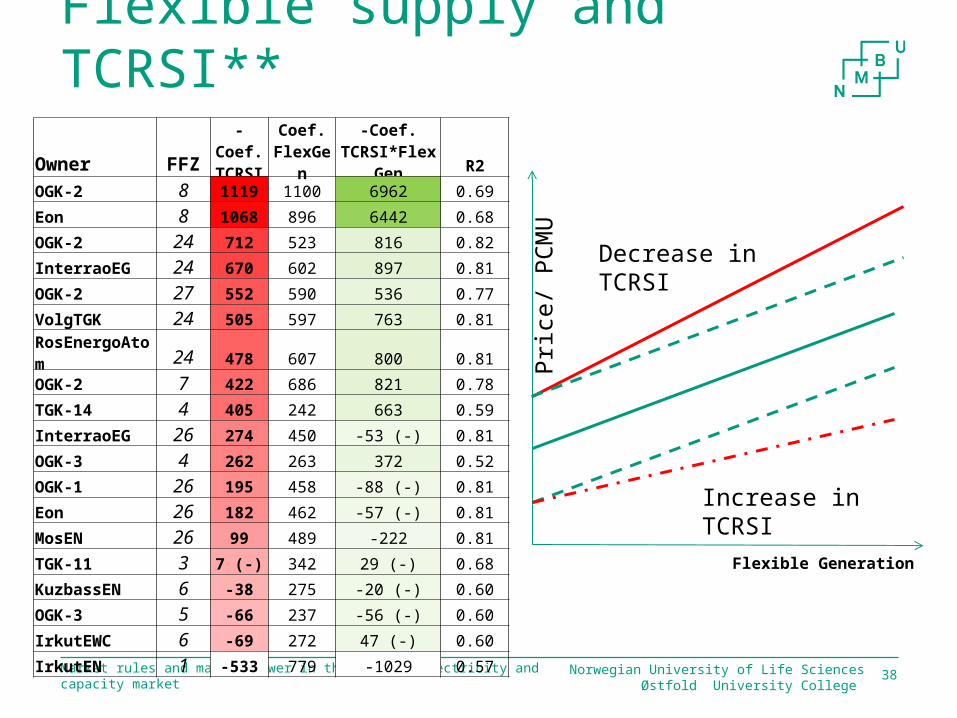
Flexible supply and TCRSI**
38
Flexible Generation
Decrease in TCRSI
Increase in TCRSI
Pric
e/ P
CM
U
Owner FFZ-Coef.TCRSI
Coef. FlexGen
-Coef. TCRSI*FlexGen R2
OGK-2 8 1119 1100 6962 0.69
Eon 8 1068 896 6442 0.68
OGK-2 24 712 523 816 0.82
InterraoEG 24 670 602 897 0.81
OGK-2 27 552 590 536 0.77
VolgTGK 24 505 597 763 0.81
RosEnergoAtom 24 478 607 800 0.81
OGK-2 7 422 686 821 0.78
TGK-14 4 405 242 663 0.59
InterraoEG 26 274 450 -53 (-) 0.81
OGK-3 4 262 263 372 0.52
OGK-1 26 195 458 -88 (-) 0.81
Eon 26 182 462 -57 (-) 0.81
MosEN 26 99 489 -222 0.81
TGK-11 3 7 (-) 342 29 (-) 0.68
KuzbassEN 6 -38 275 -20 (-) 0.60
OGK-3 5 -66 237 -56 (-) 0.60
IrkutEWC 6 -69 272 47 (-) 0.60
IrkutEN 1 -533 779 -1029 0.57
Norwegian University of Life SciencesØstfold University College
Market rules and market power in the Russian electricity and capacity market
Conclusions• HHI*/HHI** << HHI and RSI*/RSI** << RSI• RSI*/** is critical in 9/2 FFZs• TCRSI*/** is critical in 14/10 FFZs
• 13 of 35 dominating market participants were pivotal for more than 5% hours in DAM and 16 in UC auction/capacity market
• Strong correlation between TCRSI*/** and price/PCMU can be an indication that market players are aware of their dominant/pivotal position and exert market power
• Future research should focus on a detailed decomposition of nodal prices, the role of losses, transmission constraints in optimal power flow problem and estimation of the marginal costs of each market participant at the generator level
39Norwegian University of Life SciencesØstfold University College
Østfold University College 40Norwegian University of Life Sciences
Regulatory obstacles to competition in the Russian power market
Igor Pipkin
Regulatory obstacles to competition in the Russian power market
Introduction• Deregulation or re-regulation? (Gore et al. 2012)• Security vs optimality
• Describe the main regulatory challenges and obstacles to competition in the Russian power market, with emphasis on the role of the system operator (SO)
• Transmission constraints• Must-run generation and regime units• Demand curve in the capacity market
41Norwegian University of Life SciencesØstfold University College
Regulatory obstacles to competition in the Russian power market
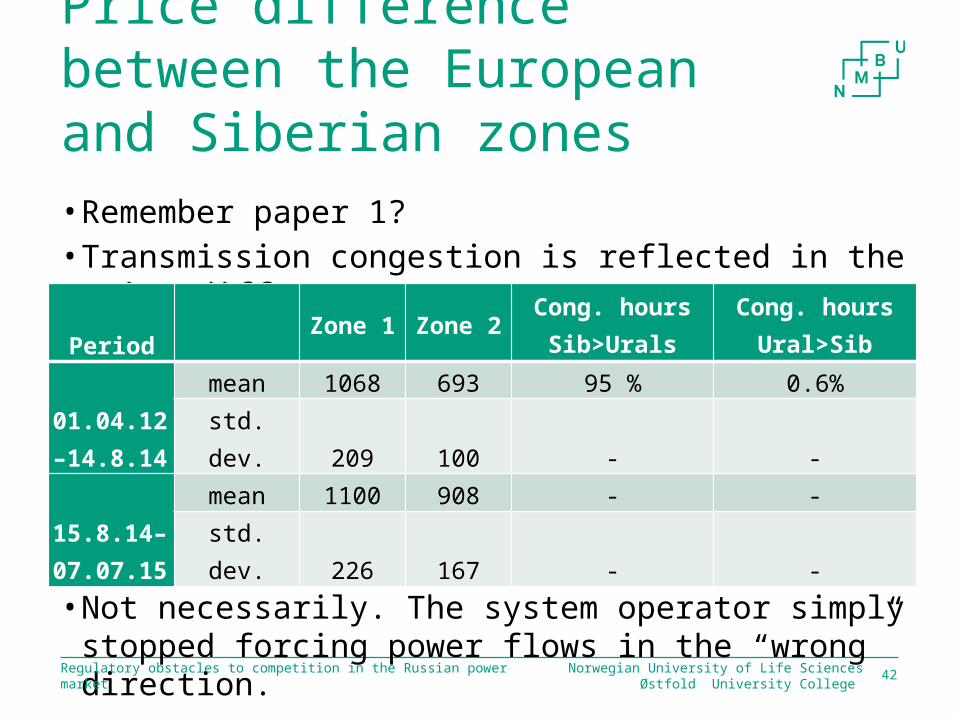
Price difference between the European and Siberian zones• Remember paper 1? • Transmission congestion is reflected in the price difference
• Less congestion after August 15, 2014? • Not necessarily. The system operator simply stopped
forcing power flows in the “wrong” direction.
Norwegian University of Life SciencesØstfold University College 42
Period Zone 1 Zone 2 Cong. hours
Sib>UralsCong. hours
Ural>Sib
01.04.12–14.8.14
mean 1068 693 95 % 0.6%
std. dev. 209 100 - -
15.8.14–07.07.15
mean 1100 908 - -
std. dev. 226 167 - -
Regulatory obstacles to competition in the Russian power market
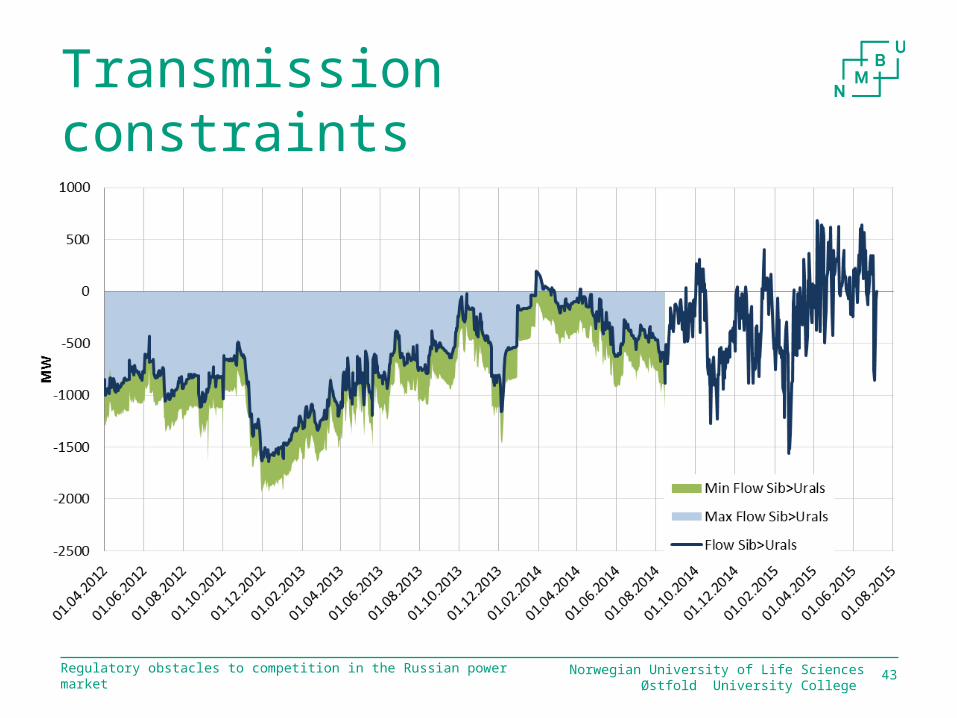
Transmission constraints
43Norwegian University of Life SciencesØstfold University College
Regulatory obstacles to competition in the Russian power market
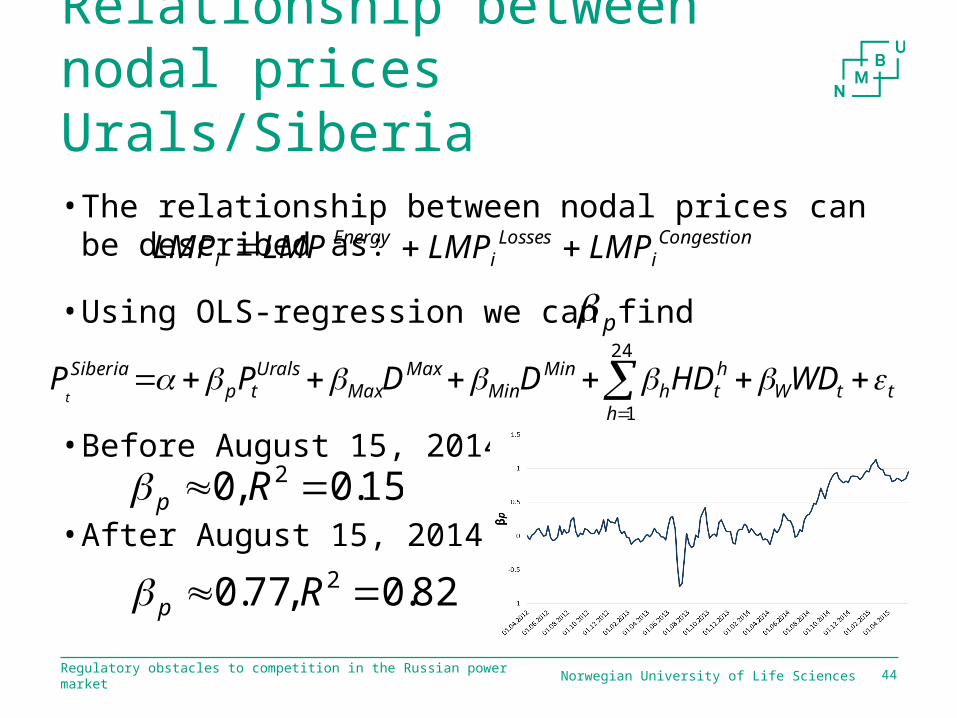
Relationship between nodal prices Urals/Siberia• The relationship between nodal prices can be described
as:
• Using OLS-regression we can find
• Before August 15, 2014
• After August 15, 2014
Norwegian University of Life Sciences 44
Congestioni
Lossesi
Energyi LMPLMPLMPLMP
ttWht
hh
MinMin
MaxMax
Uralstp
Siberia WDHDDDPPt
24
1
p
15.0,0 2 Rp
82.0,77.0 2 Rp
Regulatory obstacles to competition in the Russian power market
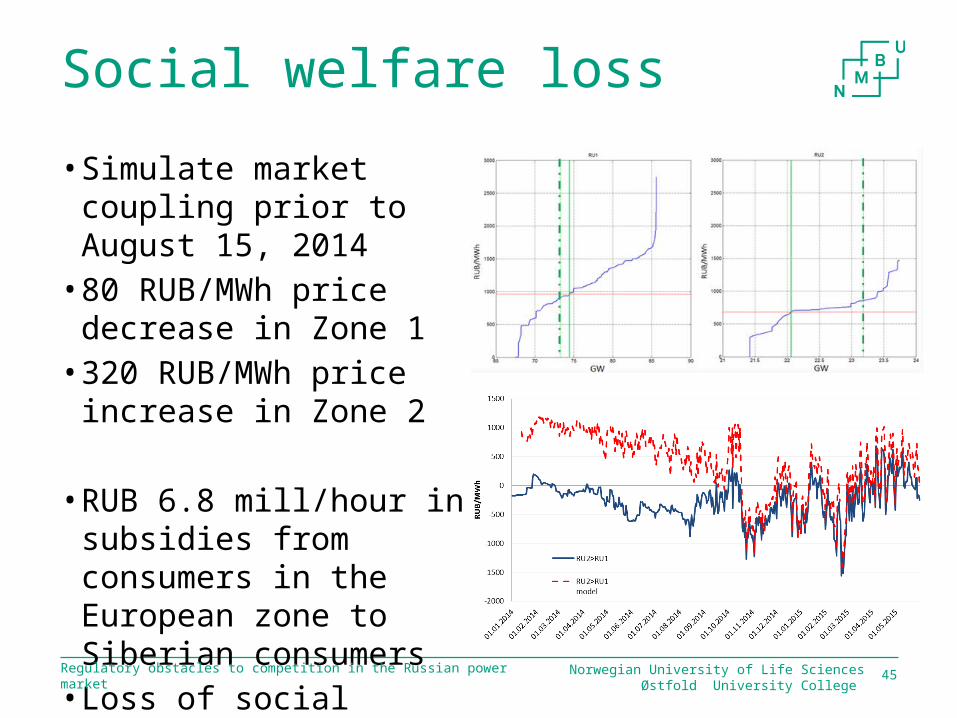
Social welfare loss
• Simulate market coupling prior to August 15, 2014
• 80 RUB/MWh price decrease in Zone 1
• 320 RUB/MWh price increase in Zone 2
• RUB 6.8 mill/hour in subsidies from consumers in the European zone to Siberian consumers
• Loss of social welfare45Norwegian University of Life Sciences
Østfold University College
Regulatory obstacles to competition in the Russian power market
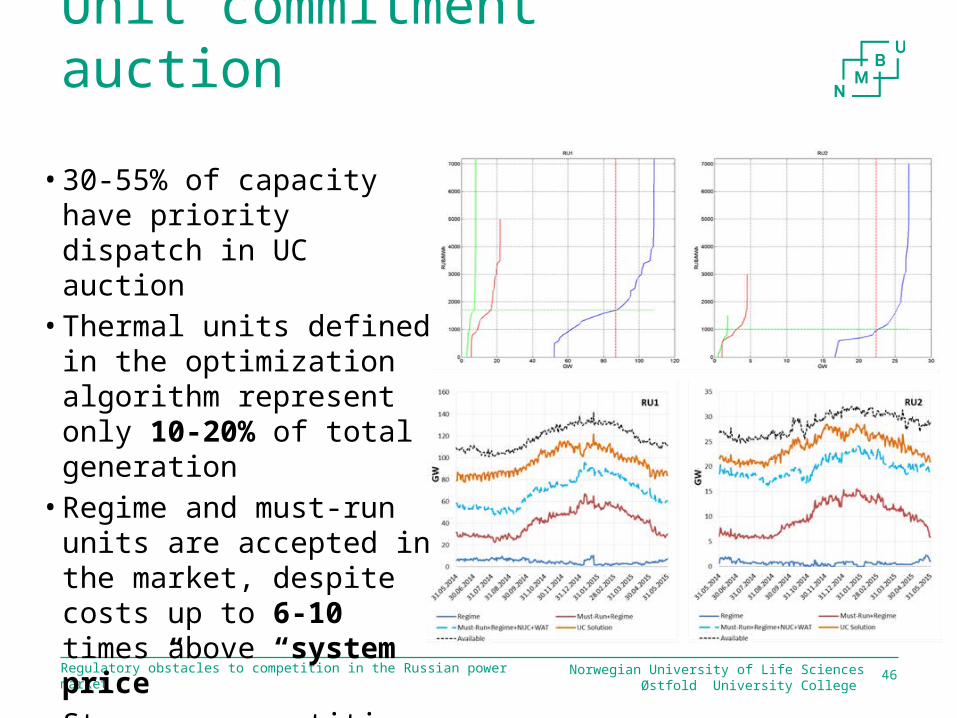
Unit commitment auction
46Norwegian University of Life SciencesØstfold University College
• 30-55% of capacity have priority dispatch in UC auction
• Thermal units defined in the optimization algorithm represent only 10-20% of total generation
• Regime and must-run units are accepted in the market, despite costs up to 6-10 times above “system price”
• Stronger competition for the remaining thermal units
Regulatory obstacles to competition in the Russian power market
Capacity market• Must-run generation increased from 3.4 GW in 2014 to
15.3 GW in 2015• This was due to commissioning of new power plants
through long term agreements, new nuclear/hydro power plants of 7.6 GW, and decrease in expected peak load
• Competitive prices in only 2-3 FFZs since the launch of the capacity market
• New market rules for the 2016 auction to deal with must-run generation, excess capacity and transmission constraints
• 2 price zones and linear demand curve with price capNorwegian University of Life Sciences
Østfold University College 47
Regulatory obstacles to competition in the Russian power market
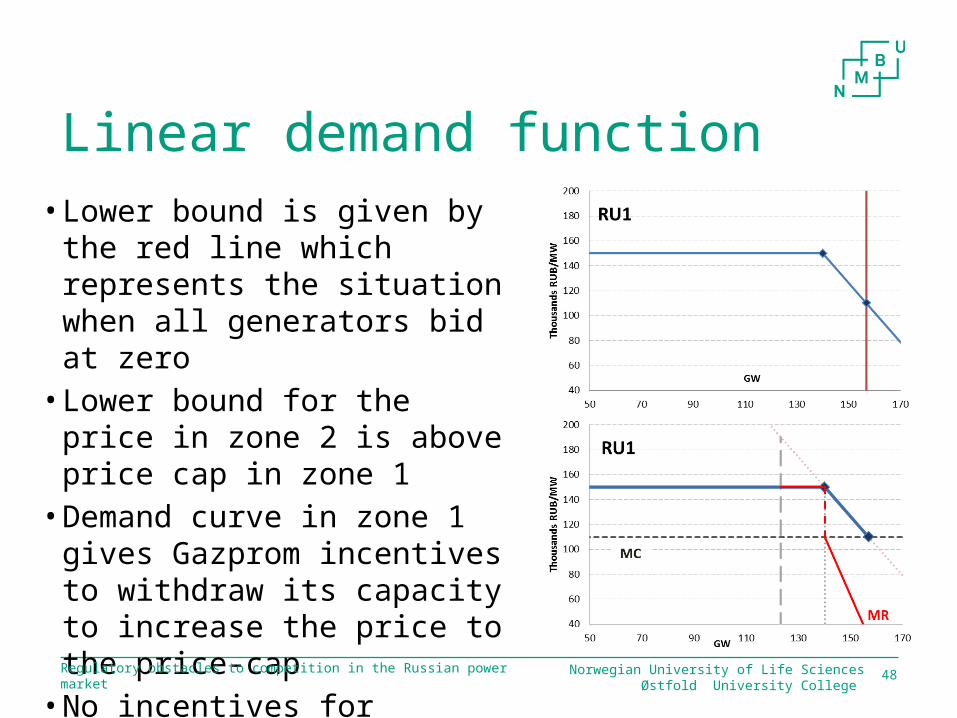
Linear demand function• Lower bound is given by the red
line which represents the situation when all generators bid at zero
• Lower bound for the price in zone 2 is above price cap in zone 1
• Demand curve in zone 1 gives Gazprom incentives to withdraw its capacity to increase the price to the price-cap
• No incentives for competition
48Norwegian University of Life SciencesØstfold University College
Regulatory obstacles to competition in the Russian power market
Conclusions• Functioning day-ahead market since August 2014, except
for the remaining 10-20% that receives FST tariffs• Issues to resolve in relation to the transparency of the UC
auctions that set the constraints for competition in the day-ahead market
• The capacity market remains a regulated, and potentially inefficient and inflexible, way to finance new capacity or maintain the existing capacity
• Current regulations on must-run capacity constrain further development of the industry and lead to inefficiencies between the heat and electricity/capacity markets
49Norwegian University of Life SciencesØstfold University College

Thank you for your attention!