Embed Size (px)
Citation preview

1
Does Ethnic Minority Parents’ Integration in Society Affect their Children’s School Performance?
Geert Driessen Frederik Smit
ITS – Institute for Applied Social Sciences, Radboud University Nijmegen, the Netherlands
Please address all correspondence to: Dr Geert Driessen ITS - Institute for Applied Social Sciences Radboud University Nijmegen P.O.Box 9048 6500 KJ Nijmegen The Netherlands E-mail: [email protected] Web: www.geertdriessen.nl
Paper presented at the
Annual Meeting American Educational Research Association New York City, March 24–28, 2008

2
Does Ethnic Minority Parents’ Integration in Society Affect their Children’s School Performance?
Geert Driessen Frederik Smit
ITS – Institute for Applied Social Sciences, Radboud University Nijmegen, the Netherlands
Integration of ethnic minorities into society often is operationalized as participation in societal institutions. Examples are cultural, political and labor participation. On the basis of the theoretical concepts of social and cultural capital, it is hypothesized that greater parental participation in society will lead to a better educational position for the children. To test this hypothesis, descriptive and multilevel analyses were conducted using data from the Dutch cohort study Primary Education. The sample included 11,000 students from 600 primary schools. In the analyses, ethnic minority parents and their children were compared to native Dutch parents and their children. After controlling for parental socioeconomic and ethnic background, the results showed only an effect of cultural participation on language and math skills. No effects on such non-cognitive outcomes as social position, individual well-being, or self-confidence were found. KEYWORDS: minority parents; cultural capital; integration; school performance Since the Second World War, most West European countries have been confronted with an influx of large groups of immigrants. These immigrants differ in a number of respects from not only the receiving society but also from each other. In general, three groups of immigrants can be distinguished: immigrants from former colonies, labor immigrants, and asylum seekers. Which categories migrate to which countries depends on the historical, political, and economic contexts of both the country of departure and the country of receipt. The manner in which the receiving countries react to the arrival of immigrants greatly varies (Koopmans and Statham, 2000; van het Loo et al., 2001). And there are also major differences in the manner in which immigrants deal with the expectations and demands of the receiving society (Portes and Rumbaut, 1996; Zhou, 1997). The manner in which immigrants seek and find their way within a receiving society has been discussed using widely varying terms. Gradual shifts of emphasis can also be detected in these discussions, which have their roots in the USA with its extended immigrant history (cf. Alba and Nee, 1997; Gans, 1997; Rumbaut, 1997). One of the pioneers within this domain, Gordon (1964), speaks of straight-line assimilation or different phases of assimilation occurring in a more or less fixed pattern. The assimilation process is assumed to be complete when the immigrant has been completely absorbed into the receiving society. This straight-line vision of integration has been the target of considerable critique, however.

3
Berry (2003), for example, has called for greater differentiation, used the term ‘acculturation’ to refer to the process of seeking and finding one’s way within a receiving society, and distinguished four possible strategies — assimilation, integration, marginalization, and separation. The end result is different gradations of immigrant adaptation to the receiving society. With respect to the preceding distinctions, the West European context strongly differs from the USA context where an assimilation concept of integration predominates. In Europe, a container concept of integration is typically employed. Relative to the concept of assimilation, this means greater tolerance, pluralism, and respect for ethno-cultural differences (Vermeulen and Penninx, 2000). No matter what the terms used to refer to the process of seeking and finding one’s way, the governments of receiving countries generally see a certain degree of adaptation as a sine quo non for the adequate functioning of both the immigrant and the society as a whole. A point of contention, however, is the exact extent to which such adaptation must occur (Lesthaeghe, 2000). In the present article, the integration of immigrants within the Netherlands stands central. An overview of the different groups of immigrants in the Netherlands and the policies pursued with respect to their integration will be presented. As will be seen, a key notion within such policy is that of participation. The assumption is that participation expands societal opportunities for not only immigrants but also their children, and this assumption is therefore tested with the aid of large-scale data. The results are reported in the following, and a more extended discussion of the most important findings will conclude the article.
Immigrants and Integration Policy in the Netherlands
The Netherlands is an example of a West European country in which one can speak of large-scale immigration for quite some time now. Depending on the definition used, the percentage immigrants in the Netherlands varies from 7% to 19% of the total Dutch population of 16,5 million. Application of the criterion ‘country of birth’ in 2007 showed the largest non-Western immigrant groups to have the following origins: Antillean (130,000), Surinamese (333,000), Turkish (369,000), and Moroccan (329,000) (CBS, 2007). The first two groups consist of immigrants from former colonies. And as a result of their colonial ties with the Netherlands, these two groups of immigrants are already familiar with the Dutch language and culture. The latter two groups consist of mostly labor immigrants arriving in the Netherlands in the 1960s and subsequent waves of immigration for purposes of family reunification and family formation.1 One characteristic shared by the latter groups of immigrants is their low level of education. Furthermore, their language and culture are very different from the Dutch language and culture. And a distinction that has received increased emphasis since the 9/11 catastrophe is that of religion: almost all of the Turkish and Moroccan immigrants to the Netherlands are Muslim (Driessen, 2007). The remainder of the immigrants in the Netherlands constitute a very heterogeneous group with respect to language, culture, and religion. Among this group are labor immigrants from such Mediterranean countries as Spain and Italy; Chinese people who have emigrated for economic or political reasons; and asylum seekers coming from Eastern Europe, Africa, and the Middle East.2

4
Immigration is increasingly being viewed as a problem in the Netherlands, and a number of different reasons for this can be cited. To start with, immigrants have become much more visible during the past few decades as a result of not only their increasing numbers but also as a result of primarily their outward characteristics and behavior. With respect to the latter, for example, considerable media attention has been paid to the fact that immigrants are strongly overrepresented within the domains of crime in general and particularly crime accompanied by physical violence (Bovenkerk, 2002; Overdijk-Francis and Smeets, 1998). Another contributor is the economic recession, which set in a few years ago, and growing recognition of the fact that the current welfare state — which immigrants disproportionately rely upon — cannot be maintained. In part because they are frequently lower educated, do not have sufficient mastery of the Dutch language, and are most certainly discriminated against at times, immigrants make a far greater use of such social services as unemployment, disability, and welfare (Hagendoorn, Veenman and Vollebergh, 2003). The 9/11 incident has undoubtedly been a catalyst for the increased negative view on immigration and shifted attention from ethnicity as the main reason for this view to religion (also see Driessen and Merry, 2006). A dramatic turnabout — in initially public opinion and later political thinking — can be seen to have occurred as a result of the terrorist attacks in the USA. While it was absolutely taboo to say anything negative about immigrants in the Netherlands prior to 9/11, the populistic right-wing Dutch politician Pim Fortuijn articulated the feelings of dissatisfaction shared by so many people in the Netherlands after the 9/11 attacks and particularly the native Dutch population living in depressed urban areas and thus confronted with the consequences of immigration on a daily basis.3 As a result of Fortuijn’s political efforts, in fact, the incumbent (leftist) political establishment in the Netherlands has been more or less done away with. Despite a long tradition of receiving immigrants, the concept of ‘integration’ was only used in the formulation of policy with respect to ethnic minorities in the Netherlands at the beginning of the 1980s. The relevant policy was aimed for quite some time at ‘integration with maintenance of own culture’, but a recent shift has occurred towards policy with more assimilatory characteristics.4 Whereas immigrants were previously accepted into the Dutch welfare state with little or no discussion, an undeniable problematization of immigration and hardening of policy has occurred over the past few years under the motto ‘compulsory integration, own responsibility’.5 The recent government standpoint is that too much emphasis has traditionally been placed upon acceptance of the differences between immigrants and the native Dutch population. The presence of immigrants has typically been viewed as a ‘value’ and as enriching the society in which we live. But, according to the recent government, everything that is different need not always be of value. In other words, cultural gaps cannot be bridged via the cultivation of own cultural identities.6 The unity of a society must be found in what the citizens have in common, which is being citizens of one and the same society. The objective of current integration policy is thus shared citizenship for immigrants and native inhabitants. Such shared citizenship presupposes mastery of the Dutch language and adherence to basic Dutch norms, with the latter including efforts to provide for oneself, law abidance, recognition of the right of each individual to say what he or she thinks, respect for the sexual preferences of others, and equality for men and women. Citizenship

5
thus means a willingness to actively contribute to society and participate in all facets of society (Tweede Kamer, 2003). When conceptualized in such a manner, integration is operationalized as the individual obligation to actively participate in a variety of societal domains (WRR, 2001). Engbersen and Gabriëls (1995) distinguish the following domains: law, politics, labor, housing, education, culture, and religion. In recent policy, the following domains have been distinguished: political-judicial, social-economic, ethnic-cultural, and religious (Penninx and Slijper, 1999). A division frequently used for research purposes is that between structural integration, measured as the level of education attained and position on the job market, and social-cultural integration, measured in terms of social contacts and participation in cultural institutions (Vermeulen and Penninx, 1994; WRR, 2001). The latter dichotomy is occasionally characterized as one between socio-economic versus cultural integration (Hagendoorn, Veenman and Vollebergh, 2003). In addition, a division is also sometimes made along the lines of participation versus orientation, informal participation versus normative orientation, or concrete behavior versus attitudes (Uunk, 2002; Odé, 2002; Dagevos and Veenman, 1996). For the Dutch government, participation in education and the job market stand central. In addition to these aspects of participation, the importance of social participation (e.g., membership in associations and clubs), political participation (e.g., the right to vote and have a say), cultural participation (e.g., artistic and cultural expression), societal participation (e.g., volunteer work), and athletic participation as different means to achieve citizenship is also often mentioned (van Boxtel, 1999, 2000; Tweede Kamer, 1998, 2003).7
Participation, Capital, and Educational Opportunity Integration does not pertain to only the immigrants themselves (i.e., the first generation) but also to their children (i.e., second and subsequent generations). To the extent that immigrant parents are better integrated into Dutch society, the more favorable the chances of integration and — in this connection — the educational and societal opportunities for their children. And for this reason, current integration policy emphasizes the responsibility of immigrant parents to support and promote the school careers of their children (Tweede Kamer, 2003). Viewed from such a perspective, participation can be construed as a form of ‘capital’ (cf. Gordon, 1964). The expectations with respect to the consequences of parental participation for the educational opportunities of their children can then be derived from the theoretical notions of social and cultural capital as formulated by, among others, Bourdieu (1986), Coleman (1990), Putnam (1995), and Sowell (1996). These notions were originally formulated in conjunction with social-economic status (SES) but also contain a clearly ethnic component (Driessen, 2001). Considered together, this means that both parents from lower social-economic milieus and immigrant parents who also participate in various sectors of society provide relatively greater social and cultural capital for their families and, in this manner, positively influence the child-rearing situation, educational opportunities, and societal opportunities of their children. An immigrant status generally coincides with a low

6
SES. That is, the majority of the immigrants being spoken of here can be characterized as having low levels of education, employment, and income (cf. Gowricharn, 2002; Muus, 2003). And on the basis of this information, it can be expected that the social-cultural capital of participation is of particular importance for immigrants to improve their societal opportunities. A few concrete examples may elucidate the assumptions underlying the aforementioned notions. Parents who regularly visit cultural manifestations — such as museums and concerts —(i.e., display cultural participation) may tell their children about this and thereby expand the experiences and interests of their children. Given that cultural participation is valued by many schools, the interest prompted by the experiences of the parents can favorably influence the school careers of children. This is of particular importance for immigrant children because their cultures are often further from the mainstream (i.e., white middle class) culture than the cultures of children from native Dutch lower social-economic environments. Immigrant parents who have a job (i.e., display labor participation) come into greater contact with native Dutch individuals than immigrant parents who do not have a job and are thus limited to their own ethnic (language) circle of contacts. Given the need to communicate using the Dutch language at work, moreover, the Dutch language skills of such immigrants will improve and be reflected in their Dutch-language communication with their children at home. Parents who participate in all kinds of organizations that are not specifically intended for immigrants (i.e., display societal participation) build a network of relations, thereby insure themselves of access to all kinds of information and gatekeepers, and can thus create more favorable conditions for the educational opportunities of their children. From the preceding, it can also be deduced that greater participation not only influences the child-rearing situation within the family via the introduction of all kinds of cultural-societal experiences (i.e., cultural capital) but also outside the family via the building of a social network including the family, school, and broader social connections (i.e., social capital). Empirical research on the connections between social-ethnic background milieu and participation is available for the Netherlands to varying degrees. In most cases, only one aspect or a small number of the different aspects of participation constitute the topic of analysis (RMO, 1998). Studies of the relations between background milieu and labor participation show undeniably low labor participation for immigrants and the low educated (Dagevos, Gijsberts and van Praag, 2003). Cultural participation similarly occurs much less frequently among immigrants and the low educated (de Hart, 2002; Driessen, 2001). Religious participation appears, in contrast, to occur more frequently among immigrants than among the native population, which is often proposed to be connected to the secularization of the native population and the marginal influence of modernization upon immigrants (Becker and de Wit, 2000; Dagevos, 2001). Participation in club life and volunteer work is clearly less frequent for immigrants than for the native population (de Hart, 2002; Penninx and Slijper, 1999; van Daal, 2001). The same holds for political participation (Fennema et al., 2000). It should be added that certain more specific differences can be found to occur and relate to age, generation, length of immigrant residence, and specific immigrant group. Research on the relations between social-ethnic milieu, participation of parents, and the educational positions of children is very limited (Driessen, Doesborgh and Claassen, 1999). One relevant finding is that of Tesser and Mulder (1990) who found cultural participation —

7
operationalized as museum and concert attendance — to have virtually no effect on educational achievement. Driessen (1993) also came to the conclusion that cultural participation does not contribute anything beyond what background milieu contributes to the explanation of achievement differences. Dijkstra and Veenstra (2000), however, reveal some effects stemming from religious background defined in terms of church membership and church attendance. Research on labor participation, operationalized in terms of having paid work or not, is virtually unavailable. Within the research by Oomens, Driessen and Scheepers (2003), however, no independent effects of labor participation were found. There is no research to our knowledge on the effects of social, societal, or political participation on educational results. In sum, there is very little research in which immigrant background, participation, and educational results are analyzed in conjunction with each other. In general, the analyses consider only one or a few aspects of participation at a time. With the availability of recent large-scale national figures, however, we hope to fill this gap. And in an initially exploratory manner, we will therefore attempt to answer the following questions. • What relations exist between aspects of parental participation and social-ethnic
background? • What relations exist between parental participation and the cognitive and non-cognitive
educational outcomes of their children? • To what extent can differences in the cognitive and non-cognitive educational outcomes
of children be explained by differences in the participation of their parents after social-ethnic background has been taken into consideration?
On the basis of the theoretical notions pertaining to the role of ‘capital’, we expect parents from lower social-economic milieus to generally participate less than parents from higher social-economic milieus and immigrant parents to participate even less than the parents from lower social-economic milieus. We further expect a stronger degree of parental participation to be associated with a more favorable educational position for their children. Finally, participation is expected to continue to have an effect on the educational position after social-ethnic background has been taken into consideration. In answering these questions, we hope to determine the extent of the empirical support for the position held by the current Dutch government with respect to ‘participation as capital’. Analyses of variance will be undertaken to answer the first two — descriptive — questions. Multilevel regression analyses will be undertaken to answer the last — explanatory — question.
Data and variables
Sample and Instruments
The present data stem from the cohort study Primary Education (Primair Onderwijs, PRIMA). Within the PRIMA study, students have been followed since the 1994/95 school year via the administration of various tests and questionnaires once every two years to the students and their parents, teachers, and school directorates. In this national research, a total

8
of about 60,000 students from kindergarten, grade 2, grade 4, and grade 6 from some 600 elementary schools or 10% of all Dutch elementary schools have been involved. For the present article, use is made of the figures from the third PRIMA measurement point during the school year 1998/99 (cf. Driessen, van Langen and Vierke, 2000; Driessen et al., 2003). The PRIMA sample is characterized by an overrepresentation of schools with students from disadvantaged social-ethnic circumstances. This was done intentionally in order to enable conclusions with regard to the functioning of children from different categories of low-educated immigrants. The analyses were aimed at the children in kindergarten, who were about 6 years of age, and their parents. The expectation was that the role of the school would be still rather limited for such young children while the influence of the home milieu (i.e., parental participation) would be greater. In such a manner, the effects of participation can be better isolated. The sample thus contains data from 583 schools and a total of 10,680 students. The information for the analyses came from four sources: a parent questionnaire to attain information on the social-ethnic background and participation of the parents; language and math tests to indicate the cognitive skills of the students; a teacher evaluation list to determine the non-cognitive positions of students; and information provided by the schools with regard to the parents. In the present analyses, the data from the parent questionnaire — which was developed for the PRIMA study on the basis of an extensive literature review — stand central. Despite the fact that the parent questionnaire was circulated with an accompanying Turkish and Arabic explanation, a number of parents did not return the questionnaire; the response rate was 73%. Analyses have shown that one can indeed speak of selective non-response: a relatively greater number of immigrant parents than native Dutch parents failed to return the questionnaire. Given that the PRIMA study in general contains an overrepresentation of immigrant groups, the final sample tends towards representativity (Driessen and Doesborgh, 2003). It can also be noted that the aim of the present study was not so much to generate representative statements but to explore associations. Virtually all of the information on social-ethnic background and those aspects of participation included in the analyses were available for both the mothers and the fathers. In order to characterize the level of the family, however, the data from the father was initially used; when such information was unavailable, as in a single-parent family, the data from the mother was used.
Variables
Three types of variables were distinguished: family structural characteristics, aspects of parental participation, and cognitive and non-cognitive outcome measures. In Figure 1, just how we think the different variables relate to each other is outlined schematically. The operationalizations of the variables are presented further below.
<< insert Figure 1 about here >>

9
Family Structural Characteristics • Parental education The following levels were distinguished: (1) elementary education; (2) vocational education; (3) professional education; (4) college education. • Parental ethnicity Based on the country of birth, the following categories were distinguished: (1) Dutch; (2) Surinamese or Antillean; (3) Turkish or Moroccan; (4) other.8 • Parental length of residence For the descriptive analyses, the following categories were distinguished: (1) less than 10 years; (2) 10-19 years; (3) 20 or more years; (4) from birth. For the multilevel explanatory analyses, only the first three categories were utilized. Participation • Labor participation Parents were asked whether they had paid work for 12 or more hours per week.9 The response categories were: yes (1) or no (0). For the descriptive analyses, this variable was transformed into ‘the percentage parents with paid work’. • Religious participation Parents were asked how often they attended a religious meeting, such as a church, synagogue, or mosque. The response categories were: (1) (virtually) never; (2) a few times a year; (3) one to three times a month; (4) weekly or more often. • Political participation Two questions were posed with regard to passive political participation (i.e., voting behavior). Whether the parents voted during the city council elections and whether they voted during the parliamentary elections were the questions asked. The number of occasions on which the parents voted was coded as: (0) no times; (1) one time; (2) two times. • Societal participation Parents were asked if they ever volunteered for an organization or a club, which could be in their neighborhood or involve athletics, the environment, the school, human rights, politics, or health issues. The response categories were: yes (1) or no (0). For the descriptive analyses, this variable was transformed into ‘the percentage parents doing volunteer work’. • Social participation Parents were asked if they were involved in any associations or clubs, and a few examples were provided. This could be: (a) athletic club; (b) music association, choir, music school; (c) youth club; neighborhood center, hobby center; (d) club from the church or mosque; (e) hobby, nature, or scouting club. The number of different associations and clubs in which the parents are involved was counted and coded as follows: (1) none; (2) one; (3) two or more. • Cultural participation For cultural participation, the information from three subquestions was used — namely whether the parents ever went to: (a) a concert, (b) a film, or (c) a museum. The responses were then coded as follows: (1) never, (2) less than once a year, (3) once a year; (4) twice or more a year.

10
Cognitive Outcome Measures • Language skill • Math skill Language and math skills were measured using two standardized tests developed by the National Institute for Educational Measurement (CITO) in the Netherlands. The tests provide an indication of the level of preparatory language and math skill, and they consisted of 60 and 42 multiple-choice items, respectively. Their reliabilities (K-R 20) were found to be 0.96 and 0.90, respectively. With the aid of a calibration procedure based on Item Response Theory, the test results were transposed into language and math scores along two separate one-dimensional metric scales (Vierke, 1995). Non-cognitive outcome measures • Social position • Self-confidence • Individual well-being These three characteristics were measured using the teacher evaluation list, which allows the teacher to indicate the extent to which a number of statements apply to a particular student along a scale of (1) ‘definitely untrue’ to (5) ‘definitely true’. Social position consists of four items and was found to have a reliability (Cronbach’s alpha) of 0.84. Sample items are: ‘This student is popular among classmates’ and ‘This student has few friends in the class’. Individual well-being consists of three items and was found to have a reliability (Cronbach’s alpha) of 0.79. Sample items are: ‘This student feels comfortable with me’ and ‘This student does not feel comfortable at school’. Self-confidence consists of four items and was found to have a reliability (Cronbach’s alpha) of 0.75. Sample items are: ‘This student is afraid and anxious’ and ‘This student is easily upset’. Separate scale scores were next created by averaging the various item scores. A low scale score for social position thus indicated a weak social position and a high scale score indicated a strong social position and so forth.
Results
Descriptive analyses In order to gain initial insight into the distributions of the different variables, we will first present an overview of the relations between parental ethnicity and parental education below. Thereafter, the relations of the family structural characteristics of parental ethnicity and parental education to parental length of residence, the different aspects of participation, and the different cognitive and non-cognitive outcome measures will be presented. In Table 1, the relations between the predictor variables of parental ethnicity and parental education are presented in the form of percentages.
<< insert Table 1 about here >>

11
As can be seen, at most 3% of the Dutch parents had no more than an elementary education while 47% of the Turkish and Moroccan parents had no more than an elementary education. For the category of ‘other immigrant’, a fairly varied pattern of education was found with a relatively large percentage lower educated parents (13%) but also a relatively high percentage higher educated parents and even more parents with a professional education (30%) than found for the Dutch group of parents. These findings clearly reflect the heterogeneous composition of this category of parents. In Table 2, an overview of parental ethnicity and parental education in relation to parental length of residence, the six aspects of participation, and the cognitive and non-cognitive outcome measures is presented. This is done in the terms of average percentages or scores and the nominal-metric correlation coefficient eta per category of variable to be predicted. Given the large number of students included in the analyses, the levels of significance provide little information; almost everything is found to be significant using the usual levels of significance. A better strategy is to inspect the effect sizes or, in other words, eta coefficients (e.g., Thompson, 1998; Wainer and Robinson, 2003). To interpret these coefficients, the criteria of Cohen (1988) were taken as a guideline: r=0.10 weak; r=0.30 medium; and r=0.50 strong.
<< insert Table 2 about here >> When parental ethnicity and parental length of residence are compared, the results in Table 2 show almost 50% of the Surinamese and Antillean parents to reside in the Netherlands 20 or more years. For the Turkish and Moroccan group of parents, this percentage is more than 33%. And for the category of other immigrant parents, the percentage is more than 25%. The relations of parental ethnicity to the different aspects of participation show large differences with respect to labor participation. Almost 90% of the Dutch parents have paid work while only about 50% of the immigrant parents report having paid work. With regard to active religious participation, it is striking that the Dutch parents score extremely low while Turkish and Moroccan parents score extremely high. Almost 60% of the Dutch parents studied here never attend a religious meeting while almost 50% of the Turkish and Moroccan parents visit a mosque on a weekly or more frequent basis. This finding is really not surprising in light of the process of secularization set into motion in the Netherlands in the 1960s and the fact that most Turks and Moroccans are Muslim and still strong believers — although generation differences can be found to occur (Becker and de Wit, 2000). With regard to active political participation, a large difference exists between the Dutch parents, who regularly vote in both local and parliamentary elections, and the three categories of immigrant parents, who frequently do not vote at all. This latter finding is not completely unexpected as different voting rights exist for non-Dutch individuals than for Dutch individuals.10 A similar contrast between the Dutch parents and immigrant categories of parents also occurs for societal participation measured in terms of volunteer work. The Dutch parents perform more than twice the amount of volunteer work performed by immigrant

12
parents. With regard to social participation in the form of club membership, the differences between the different ethnic groups were minimal. The Turkish and Moroccan parents reported being a member of a club almost as frequently as the Dutch parents. With regard to cultural participation, the observed differences are primarily caused by the fact that the Dutch parents attend such events relatively often while the Turkish and Moroccan parents, in particular, never do this. For the correlations between parental ethnicity and the outcome measures, significant differences are found for primarily language and math with the Dutch children scoring high and the Turkish and Moroccan children scoring low. Only marginal differences were detected for the non-cognitive outcome measures. The relations between parental education and parental length of residence show the differences to largely depend on the category of elementary education. From Table 1, we know that a relatively large number of immigrant parents (i.e., parents with a relatively shorter length of residence in the Netherlands) tend to fall within the category of individuals with only elementary education. The relations of parental education to the different aspects of participation show a clear relation to exist for having paid work: To the extent that parents are higher educated, they also tend to have paid work more often. Any differences with respect to religious participation can be traced back to the category of elementary education with the lower educated in the Netherlands being predominantly immigrants and thereby still quite religious. With regard to political participation, it is clear that the higher the level of parental education, the more frequently the parents vote. With respect to societal participation, a clearly positive relation can be seen to exist with parental level of education. This does not hold, however, for social participation, where only minimal differences are found with respect to the generally limited participation in clubs. Finally, there is a strong relation with cultural participation: The higher the parental level of education, the stronger the degree of cultural participation. Just as for parental ethnicity, parental education also related positively to the language and math skills of the children. The relations are not as strong as for parental ethnicity, however. And while parental education shows no differences between language and math, the eta’s for parental ethnicity show a considerably stronger relation for language than for math. Just as for parental ethnicity, moreover, there are no appreciable relations to the non-cognitive outcome measures. In the following section, the explanatory analyses stand central. Multilevel analyses will be undertaken for this purpose. And in preparation for these analyses, a few supplemental analyses were also conducted. To start with, the results in Table 2 show almost all of the Dutch parents to have a ‘from birth’ residence. In order to get a more reliable picture of the independent effects of parental length of residence, only the immigrant groups will be used in the subsequent analyses involving parental ethnicity in combination with parental length of residence. A second point in need of further consideration involves the possible interactions between parental ethnicity and parental education. In connection with this point, whether or not parental ethnicity and parental education interact with the participation and outcome variables was examined in addition to whether or not parental ethnicity and parental length of residence interact with the participation and outcome variables. This was not found to be the case with the exception of parental length of residence and labor participation, which

13
therefore can only be meaningfully interpreted within the immigrant groups. We also computed the total and partial effects of the different aspects of participation on the outcome measures. The analyses show no clear relations to the non-cognitive outcome measures and, for this reason, we limit ourselves to only consideration of the cognitive outcome measures (i.e., math and language skills) in the following.
Multilevel analyses Up until now, the relations between the aspects of parental participation and outcome measures have been analyzed bivariately using monolevel analysis techniques. In the present research, however, two levels can actually be distinguished — namely, a student and school level. In order to do justice to this level distinction, the presence of independent participation effects on the outcome variables will be examined with the aid of multilevel analyses (Snijders and Bosker, 1999) and — for this purpose — the MLn program (Rasbash and Woodhouse, 1996). Two sorts of models (A and B) will be tested which differ in the inclusion of the predictor ‘parental length of residence’ and — in relation to that predictor — the ethnic groups studied. In model A, parental ethnicity, parental education, participation, and their interaction are entered in a number of steps. All four categories of parental ethnicity are used in these analyses. In model B, parental length of residence is entered in the last step of the analyses and only the three immigrant categories of parental ethnicity are used. The multilevel analyses thus involve the testing of the following models: • With the aid of model 0, just how the variance is distributed across the student and
school levels is examined. • In model 1, parental ethnicity and parental education are added to model 0. Model A
involves ‘Dutch’ ethnicity as the reference group; model B involves ‘other’ ethnicity as the reference group. In each case, parental education was included in the form of three dichotomies with college education serving as the reference group.
• In model 2, the six participation variables are added to model 0. In contrast to the descriptive analyses, the relevant relations are calculated with the other participation variables held constant.
• In model 3, the six participation variables are added to model 1. In such a manner, whether or not one can speak of an independent contribution of participation to the effect sizes after control for parental ethnicity and parental education is examined.
• In model 4, the products of parental ethnicity and parental education and participation are added to model 3. In such a manner, the contributions of the interactions between parental ethnicity and participation and the interactions between parental education and participation to the effect sizes can be determined.
• In model 5, in model B, parental length of residence is added to model 3 to determine whether parental length of residence operates independent of parental ethnicity, parental education, and participation.
The unstandardized regression coefficients (B) and accompanying standard errors (SE) are reported in the tables. The degree to which the estimates differ significantly from 0 (sig.) is also indicated. The degree of significance can be derived by calculating a z score, namely z
14
= B/SE. The exact meaning of just significant and more strongly significant in terms of z scores depends on the number of units (here: schools) included in the analyses (cf. Cohen, 1988). For n < 120 schools, an effect is generally assumed to be just significant when the p value < .10 and thus in keeping with a z value > 1.65. For n = 200 schools, just significant is p < .05 or z > 1.96. For n = 500 schools, just significant is p < .001 or z > 3.29. Following Bosker, Mulder and Glas (2001), we adopted the following criteria. The total sample included 583 schools, which means a z value of 3.6 to 4.8 for just significant effects and greater than 4.8 for stronger effects. The sample with only immigrant students includes a total of 395 schools, which means a z value greater than 2.98 for just significant effects and greater than 3.97 for stronger effects. In the tables, just significant effects are indicated with a * and stronger effects with **. The tables are constructed as follows. In the part of the tables labeled ‘variance components’, the null model (model 0) indicates the distribution of the total variance in the outcome measure across the student and school levels. For the models thereafter, the percentages of the student and school variances explained by the predictor variables entered at that point are presented. The explained variances for models 1 and 2 are calculated with respect to model 0 and thus indicate how much parental ethnicity and parental education, on the one hand, and the six participation variables, on the other hand, help explain the variance in the outcome measure. Then, for model 3, the explanation provided by model 1 is subtracted, so that under this model the additional explanation stands after the introduction of parental ethnicity and parental education. The explained variance for model 4 is calculated with respect to model 3, which indicates the influence of any interactions between parental ethnicity and participation, on the one hand, and parental education and participation, on the other hand. And the explained variance for model 5 is also calculated with respect to model 3, which means that the effects of adding information on parental length of residence in addition to the previously included parental ethnicity, parental education, and participation are evaluated. The values after Chi2/df are used to test whether one model significantly differs from another. The reported Chi2 value is calculated by subtracting the Chi2 value of the model being tested from the Chi2 value for the reference model. The difference between the two Chi2 values is then divided by the difference in the degrees of freedom for the two models. For the total sample of n=583 schools and df=1, a final value >13 indicates a just significant difference; for df=6 (models 1, 2, 3, and 4), a final value >5 is needed; and for df=36 (model 4), a final value of >2 is needed. For the immigrant-only sample involving n=395 schools, the required values are: >7.8 for df=1; >3.1 for df=6 (models 1, 2, 3, and 5); and >1.7 for df=36 (model 4). In the following, the results of the analyses for the language and math skills of the students are presented: first for the total sample and then for the immigrant-only sample.
<< insert Table 3 about here >>

15
In Table 3, it can be seen that more than 80% of the variance in language skill occurs at the level of the student and 20% at the level of the school for model 0. The results for model 1 show strong effects of parental ethnicity and parental education. Compared to the reference category of Dutch, Turkish or Moroccan students score more than 25 points lower while the other two categories of immigrants score more than 15 points lower. (The standard deviation for language skill for the total sample was 37.) Any effect of parental education has been controlled for via simultaneous entry with parental ethnicity. The effect of parental education when parental ethnicity is similarly controlled for is weaker than the effect of parental ethnicity. Compared to the college educated, the children of parents with no more than an elementary education score more than 17 points lower. Parental ethnicity and parental education explain 6.4% of the student-level variance and 54% of the school-level variance. From the coefficients found for model 2, it can be deduced that virtually all of the aspects of participation with the exception of social participation (i.e., participation in associations and clubs) exert significant effects. As already noted, the contributions of the other five aspects of participation are controlled for in the analyses for one particular aspect. In the interpretation of these effects, one should note that that the different aspects of participation involve varying numbers of categories. In this light, the effect of cultural participation can be seen to be strongest: Children of parents who attend two or more cultural events a year score an average of 15.6 points higher than children of parents who never attend such events. The different aspects of participation explain 4.3% of the variance at the level of the student and 36.9% of the variance at the level of the school. When the family structural characteristics of parental ethnicity and parental education are entered simultaneously with the six aspects of participation, the effects of ethnicity and education can be seen to slightly drop but remain strongly significant. For the aspects of participation, however, only labor participation can be seen to remain weakly significant while political and cultural participation remain strongly significant. Note that these results reflect the influence of participation after parental ethnicity and parental education have been controlled for. Compared to model 1, moreover, the amount of additional variance explained by the aspects of participation is minimal: about 1% at the level of the student and 1% at the level of the school. When the interaction effects of parental ethnicity, on the one hand, and parental education, on the other hand, with the different aspects of participation were tested in model 4 (i.e., E/E x P), none of the interactions proved significant. This means that the effects of the various aspects of participation did not differ depending on the categories of parental ethnicity or parental education.
<< insert Table 4 about here >> Inspection of Table 4 shows the results with respect to math skill to be largely comparable to the results with respect to language skill. The coefficients are somewhat smaller, which is primarily due to a different distribution of the math scores. (The standard deviation for math

16
skill for the total sample was 17.) In the end, a minimal effect of cultural participation can be seen to remain after parental ethnicity and parental education have been controlled for. The amount of additional variance explained by the six aspects of participation considered together, however, only amounts to about 1% of the variance at the level of the student and 1.5% at the level of the school. Note that this result indicates the joint influence of all six aspects of participation or a virtually nonexistent effect, thus.
<< insert Table 5 about here >> When the sample is limited to immigrant-only students, very similar — in so far as they are comparable — results are found as for the total sample of students. Inspection of Table 5 shows the children of predominantly low educated and Turkish or Moroccan parents to score particularly low with regard to language skill. Significant effects are initially found for labor, religious, and cultural participation. After control for parental ethnicity, parental education, and parental length of residence, however, only a weak independent effect of cultural participation can be seen to remain. A single significant interaction effect is found, namely for Turkish/Moroccan parental ethnicity and labor participation. This means that the effect of labor participation for the category of Turkish and Moroccan parents is different than for the reference category of other immigrant parents: The regression coefficient for labor participation on language skill for Turkish and Moroccan students is about –1.0 while that for the other immigrant students is 11.0. Finally, a significant independent but marginal effect of parental length of residence is found: To the extent that immigrant parents have resided longer in the Netherlands, the better the language skills of their children. This effect does not mean much in absolute terms as it only explains an additional 1.9% of the variance at the level of the student and an additional 0.9% of the variance at the level of the school.
<< insert Table 6 about here >>
As can be seen from Table 6, the math skill results for the sample of immigrant-only students strongly resemble the language skill results for the same sample. Different aspects of participation are nevertheless found to play a role in math versus language skills. Whereas cultural participation appears to be the most important aspect of participation for language skill in the end, labor participation — or whether the parents have paid work or not — is found to be most important but only weakly significant for math skill in the end.

17
Conclusions and Discussion In this research, the influence of parental participation in various aspects of Dutch society on the educational positions of their children was examined. The analyses included both cognitive and non-cognitive outcome measures. The underlying assumption was that the different aspects of participation distinguished here provide an indication of the degree of integration and that greater parental integration in Dutch society will promote a more favorable educational position. The results showed a reasonably strong association to exist between parental ethnicity and parental level of education. Native Dutch parents were highest educated, and Turkish and Moroccan parents were lowest educated. Moderate to strong associations were also discerned for parental ethnicity and parental education, on the one hand, and the different aspects of participation and cognitive outcome measures, on the other hand. One can speak of two dichotomies in connection with these differences: A dichotomy between Dutch versus immigrant parents and a dichotomy between higher versus lower educated parents. With respect to the non-cognitive outcome measures, no differences were observed with respect to parental ethnicity or parental education. The analyses of the relations between the different aspects of participation and the various outcome measures revealed no connections to the non-cognitive measures. Participation of the parents does not appear to correlate with the social position of their children in the school class, their children’s well-being, or their children’s self-confidence. Clear connections were, however, found between parental participation and both the language and math skills of their children. In the relevant analyses for the total sample, strong effects of the different aspects of participation with the exception of social participation (i.e., participation in associations and clubs) are initially found. When ethnic and educational background are taken into consideration, however, only a strong effect of political and cultural participation (i.e., voting behavior and attendance of cultural events) on language skill remains. For math skill, only a strong effect of cultural participation and weak effects of labor, political, and societal participation (i.e., paid work, voting, and volunteer work) remain. In the relevant analyses for the immigrant-only sample, only a weak effect of cultural participation remains for language skill and a weak effect of labor participation remains for math skill. In light of the aforementioned effects, a few methodological comments are now called for. Information from the parents with regard to their participation in six different domains of Dutch society was used in the present analyses. For concrete formulation of the questions with regard to the different aspects of participation, the usual research procedures were followed (e.g., Dijkstra and Veenstra, 2000; Engbertsen and Gabriëls, 1995; van Daal, 2001). Fairly ‘flat’ operationalizations were used, however. In follow-up research, greater differentiation within the questions and more qualitative indicators should be sought (cf. Dagevos, 2001). With respect to social participation in particular, greater refinement is necessary. It is possible that not so much membership in an association or club but membership in an immigrant versus Dutch club is of particular relevance for social capital (de Hart, 2002). Stated more concretely: Whether one is a member of an immigrant-only soccer club or a Mosque appears to be less relevant than whether one comes into contact with Dutch individuals and their typically higher SES values and interests or not.

18
The present results show clear correlations to exist for the cognitive but not the non-cognitive indicators of educational position. The question is how this finding is best explained. Does the absence of non-cognitive correlations stem from the instrument employed or are such relations simply nonexistent? A student with considerable cultural capital can be expected to feel more at home at school (i.e., experience greater well-being), have greater self-confidence, and — as a result — achieve better at most schools where there is a standard middle-class culture and appreciation of such cultural capital aspects (cf. Olneck, 2000). With regard to the different aspects of participation, a rough distinction can be made between the social and cultural sides of integration. This distinction parallels the distinction between social capital and cultural capital. The finding of relations between cultural participation but not social participation may pertain to the age of the students studied here. The students were quite young, which means that the influence of social networks may not as yet be very relevant.11 Cultural capital, in contrast, may already be relevant as the child already comes into contact with this via the parents within the home situation at a very early age. The present results showed one aspect of participation to continually play a dominant role in the explanation of differences in math and language skills, namely ‘high brow’ cultural participation. The regular attendance of concerts, films, and museums by parents is consistently found to be associated with the cognitive skills of their children. It should be noted within this context that these findings refer to the independent influence of cultural participation after the influences of parental ethnicity, parental education, and parental length of residence have been taken into account. It should also be emphasized that these effects are found to occur in a very early stage of the educational careers of children — that is, already in the kindergarten years. The aforementioned findings appear to confirm the cultural capital thesis of Bourdieu (1986). According to this thesis, social inequality is reproduced generation after generation via culture transmission. According to the present results, moreover, cultural capital is divided along not only milieu but also ethnic lines. Given the interwoven nature of milieu and ethnicity, this means that predominantly low educated Turkish and Moroccan parents rarely or never attend the aforementioned cultural events. And according to the Dutch Secretary of Culture (MinOCW, 1999, 2000), this has recently been shown to indeed be the case. To promote the cultural participation of particularly these groups of immigrants in the form of not only theatre, concert, and museum attendance but also in the form of library use, an action plan has been formulated to expand the accessibility of such institutions. At the same time, more sustainable relations between schools and cultural institutions are being sought in order to foster greater attention to culture within the curriculum. The hope is that such activities will help reduce the educational delays found for, among others, the aforementioned groups in the long run.12 In conclusion, we would like to return to the expectation voiced by the Dutch government with regard to integration, namely that participation in various domains of society can be expected to favorably influence the societal opportunities of immigrants and their children. To start with, our analyses revealed major differences in the extent of participation across different groups of immigrants. In policy papers, however, the government adheres to ‘the

19
principle of proportionality’ without a clear indication of how this principle should be operationalized. This is troublesome when it comes to the implementation and evaluation of policy and also complicates the interpretation of the present findings. It is already known that integration proceeds in phases and that the degree of integration can differ per domain. In this connection, one often speaks of partial integration, delayed acculturation, differentiated integration, segmented assimilation, bumpy-line assimilation, heteropraxis, or hybridization. At the same time, it is clear that a strong orientation towards one’s own group need not stand in the way of social mobility and a favorable societal position (e.g., Lesthaeghe, 2000; Vermeulen and Penninx, 2000; WRR, 2001; Zhou, 1997). In other words, a more detailed and differentiated government vision of integration and participation is called for. The present findings show the assumption with regard to the chances of immigrant children to receive only partial confirmation. Not only was the number of — what can be considered relevant — participation effects found to be very small; the percentage of the variance in the language and math skills explained by participation was minimal. This means that expectations have been stretched too high and that greater realism is called for. In this paper we have focused on the Dutch situation. Our analyses showed that in the Netherlands the effect of minority parents’ societal participation on their children’s school performance is very limited. The question is whether this finding can be generalized to other European countries. In the introduction we have already pointed to the fact that the way receiving countries react to the arrival of immigrants varies greatly (Entzinger, 2000). Although European Union immigrant policies are in principle communitarian policies (i.e., policies of the whole community), integration policies are not: national authorities make their sovereign decision on policies in this domain. This means that the convergence in immigrant policies which has occurred during recent decades is accompanied by a diversity of integration policies. In general, integration policies at a national level have been developed late, or not at all, Sweden and the Netherlands being exceptions. If such policies were formulated, this was often done as a reaction to crisis situations, i.e., ad hoc, reactive and control oriented, and with piecemeal results. Basically, two orientations can be discerned. On the one hand, UK, Dutch and Swedish policies in the 1980s and 1990s have presented themselves as multiculturalist or pluralist. These policies presuppose not only political inclusion and equality in the socioeconomic domain, but also aim at cultural and religious equity. On the other hand, French, German and Austrian policies--insofar as they have been formulated at all--have traditionally been associated with assimilationism. This implies that the state and society are considered as given and immigrants are required to adapt to that society, at least to its public institutions (Penninx, 2005). Following events like ‘9/11’, however, a tendency towards convergence is observable in the domain of integration policies as well--though not to the same extent with regard to its various dimensions (e.g., legal-political, socioeconomic and cultural-religious). The entire Western world now faces a growing influence of right-wing, conservative and nationalist movements; especially in countries such as Belgium and France anti-immigrant parties have a large following (Prins & Slijper, 2002). As a consequence, in public debates and parliaments a call for assimilation as opposed to multiculturalism and diversity is increasingly being made (also see Brubaker, 2001).

20
Because of this variation in integration policies and national contexts it is very difficult to determine whether findings from one society can be generalized to another. A major problem of course is the fact that insofar as policies with regard to integration have been formulated, the goals of these policies are mostly ambiguous and not operationalized in concrete measurable terms. Undoubtedly, this is one reason why remarkably few systematic studies on the effectiveness and efficiency of immigration-related policies have been conducted. The analyses that have been performed suggest that the increased expenditures in this field have not produced a commensurate improvement in performance (van ‘t Loo et al., 2001). The above pertains to the integration in terms of participation of first generation immigrants. The present article focuses on effects of the first generation’s participation on the school performance of their children, i.e. the second generation. With regard to this aspect surprisingly little research has been conducted. The available studies concentrate on the relation between parental ethnicity/race, educational level and labour market and cultural participation on the one hand and their children’s school achievement on the other (e.g., Driessen, 2001; Gillborn and Gipps, 1996; Jencks and Mayer, 1990). Dimensions like religious, societal, social and political participation have--to our knowledge--not yet been included in such analyses, not separately and certainly not in conjunction to each other. Therefore, what would be helpful is the development of measures for integration that can be used across countries and also across generations of immigrants. Monitoring integration processes in different countries could lead to identifying best practices of integration (cf. Entzinger and Biezeveld, 2003). It is clear that significant knowledge gaps still remain and that many of the findings fail to be introduced into the policy debate in a systematic way and in relation to each other (Entzinger, 2000; van ‘t Loo et al., 2001). It is also important to realize that processes of integration of immigrants are long term by nature (Penninx, 2005). REFERENCE LIST Alba, R., & Nee, V. (1997). Rethinking Assimilation Theory for a New Era of Immigration,
International Migration Review, 31, 826-874. Becker, J., & de Wit, J. (2000). Secularisatie in de Jaren Negentig. Kerklidmaatschap,
Veranderingen in Opvattingen en een Prognose. Den Haag: SCP. Berry, J. (2003) Conceptual Approaches to Acculturation. In K. Chun, P. Balls Organista and
G. Marín (Eds.), Acculturation. Advances in Theory, Measurement, and Applied Research (pp. 17-37). Washington, DC: APA.
Bosker, R., Mulder, L., & Glas, C. (2001). Naar een Nieuwe Gewichtenregeling? Den Haag: Onderwijsraad.
Bourdieu, P. (1986). The Forms of Capital. In J. Richardson (Ed.), Handbook of Theory and Research for the Sociology of Education (pp. 241-258). New York: Greenwood Press.
Bovenkerk, F. (2002). Essay over Oorzaken van Allochtone Misdaad. In J. Lucassen and A. de Ruijter (Eds.), Nederland Multicultureel en Pluriform? Een aantal Conceptuele Studies (pp. 209-245). Amsterdam: Aksant.
21
Brubaker, R. (2001). The Return of Assimilation? Changing Perspectives on Immigration and its Sequels in France, Germany, and the United States. Ethnic and Racial Studies, 24, 531-548.
CBS (2007). www.statline.nl; accessed 16/11/07. Cohen, J. (1988). Statistical Power Analysis for the Behavioral Sciences. Hillsdale, NJ:
Erlbaum. Coleman, J. (1998). Social Capital in the Creation of Human Capital. American Journal of
Sociology 94, s95-s120. Dagevos, J. (2001). Perspectief op Integratie. Over de Sociaal-Culturele en Structurele
Integratie van Etnische Minderheden in Nederland. Den Haag: WRR. Dagevos, J., & Veenman, J. (1996). Sociale Netwerken en Hun Functionaliteit. In J.
Veenman (Ed.), Keren de Kansen? De Tweede-Generatie Allochtonen in Nederland (pp. 81-103). Assen; Van Gorcum.
Dagevos, J., Gijsberts, M., & van Praag, C. (Eds.) (2003). Rapportage Minderheden 2003. Onderwijs, Arbeid en Sociaal-Culturele Integratie. Den Haag: SCP.
de Hart, J. (Ed.) (2002). Zekere Banden. Sociale Cohesie, Leefbaarheid en Veiligheid. Den Haag: SCP.
Dijkstra, A., & Veenstra, R. (2000). Functionele Gemeenschappen, Godsdienstigheid en Prestaties in het Voortgezet Onderwijs. Mens & Maatschappij, 75, 129-150.
Driessen, G. (2001). Ethnicity, Forms of Capital, and Educational Achievement. International Review of Education, 47, 513-537.
Driessen, G. (2007). Trends in Religious Affiliation of Parents of Primary School Children in the Netherlands in the Period 1995-2005. Exploration of Correlation with Sex, Ethnicity and Socio-economic Background. Journal of Empirical Theology, 20, 232-249.
Driessen, G., & Doesborgh, J. (2003). Voor- en Vroegschoolse Educatie en Cognitieve en Niet-Cognitieve Competenties van Jonge Kinderen. Nijmegen: ITS.
Driessen, G., van Langen, A., & Vierke, H. (2000). Basisonderwijs: Veldwerkverslag, Leerlinggegevens en Oudervragenlijsten. Basisrapportage PRIMA-Cohortonderzoek. Derde Meting 1998/99. Nijmegen: ITS.
Driessen, G., & Merry, M. (2006). Islamic Schools in the Netherlands: Expansion or Marginalization? Interchange, 37, 201-223.
Driessen, G., Doesborgh. J., Ledoux, G., van der Veen, I., & Vergeer. M. (2003). Sociale Integratie in het Primair Onderwijs. Een Studie naar de Relatie tussen de Sociale, Etnische, Religieuze en Cognitieve Schoolcompositie en de Cognitieve en Niet-Cognitieve Positie van Verschillende Groepen Leerlingen. Nijmegen/Amsterdam: ITS/SCO-Kohnstamm Instituut.
Engbersen, G., & Gabriëls, R. (Eds) (1995). Sferen van Integratie. Naar een Gedifferentieerd Allochtonenbeleid. Amsterdam/Meppel: Boom.
Entzinger, H. (2000). The Dynamics of Integration Policies: A Multidimensional Model. In R. Koopmans and P. Statham (Eds.), Challenging Immigration and Ethnic Relations Politics: Comparative European Perspectives (pp. 97-118). New York: Oxford University Press.
Entzinger, H., & Biezeveld, R. (2003). Benchmarking in Immigrant Integration. Rotterdam: Erasmus University.
22
Fennema, M., Tillie, J., van Heelsum, A., Berger, M., & Wolff, R. (2000). Sociaal Kapitaal en Politieke Participatie van Etnische Minderheden. Amsterdam: IMES.
Gans, H. (1997). Toward a Reconciliation of “Assimilation” and “Pluralism”: The Interplay of Acculturation and Ethnic Retention. International Migration Review, 31, 875-892.
Gillborn, D., & Gipps, C. (1996). Recent Research on the Achievement of Ethnic Minority Pupils. London: OFSTED.
Gorard, S., Rees, G., & Salisbury, J. (1999). Reappraising the Apparent Underachievement of Boys at School. Gender and Education, 11, 441-454.
Gordon, M. (1964). Assimilation in American Life: The Role of Race, Religion, and National Origins. New York: Oxford University Press.
Gowricharn, R. (2002). Integration and Social Cohesion: The Case of the Netherlands. Journal of Ethnic and Migration Studies, 28, 259-273.
Hagendoorn, L., Veenman, J., & Vollebergh, W. (2003). Cultural Orientation and Socio-Economic Integration of Immigrants in the Netherlands. In L. Hagendoorn, J. Veenman and W. Vollebergh (Eds.), Integrating Immigrants in the Netherlands. Cultural versus Socio-Economic Integration (pp. 1-15). Aldershot: Ashgate.
Hooghiemstra, E. (2003). Trouwen over de Grens. Achtergronden van Partnerkeuze van Turken en Marokkanen in Nederland. Den Haag: SCP.
Jencks, C., & Mayer, S. (1990). The Social Consequences of Growing up in a Poor Neighborhood. In L. Lynn jr. and M. McGeary (Eds.), Inner-city Poverty in the United States (pp. 111-186). Washington, DC: National Academy Press.
Koopmans, R., & Statham, P. (Eds.) (2000). Challenging Immigration and Ethnic Relations Politics: Comparative European Perspectives. New York: Oxford University Press.
Lesthaeghe, R. (Ed.) (2000). Communities and Generations. Turkish and Moroccan Populations in Belgium. Brussels: VUB University Press.
Lubienski, S. (2003). Celebrating Diversity and Denying Disparities: A Critical Assessment, Educational Researcher, 32, 30-38.
MinBiZa (1998). Verkiezingen. Kiezen en Gekozen Worden. Den Haag: Ministerie van Binnenlandse Zaken.
MinJus (2004). Jaarnota Integratiebeleid 2004. Den Haag: Ministerie van Jusititie. MinOCW (1999). Ruim Baan voor Culturele Diversiteit. Zoetermeer: Ministerie van
Onderwijs, Cultuur en Wetenschappen. MinOCW (2000). Actieplan Cultuurbereik. Zoetermeer: Ministerie van Onderwijs, Cultuur
en Wetenschappen. Muus, P. (2003). An International Comparison of Migration and Immigrant Policy with
Respect to Immigrants from Turkey and their Participation in the Labour Market. In L. Hagendoorn, J. Veenman and W. Vollebergh (Eds.), Integrating Immigrants in the Netherlands. Cultural versus Socio-Economic Integration (pp. 17-40). Aldershot: Ashgate.
Odé, A. (2002). Ethnic-Cultural and Socio-Economic Integration in the Netherlands. A Comparative Study of Mediterranean and Caribbean Minority Groups. Assen: Van Gorcum.
Olneck, M. (2000). Can Multicultural Education Change What Counts as Cultural Capital? American Educational Research Journal, 37, 317-348.

23
Oomens, S., Driessen, G., & Scheepers, P. (2003). Integratie van Allochtone Ouders en Onderwijsprestaties van hun Kinderen: Enkele Allochtone Groepen Vergeleken. Tijdschrift voor Sociologie, 24, 289-311.
Overdijk-Francis, J., & Smeets, H. (Eds.) (1998). Criminaliteit en Integratie van Etnische Minderheden. Houten: Bohn Stafleu Van Loghum.
Penninx, R. (2005). Integration of Migrants: Economic, Social, Cultural and Political Dimensions. In M. Macura, A. McDonald and W. Haug (Eds.), The New Demographic Regime. Population Challenges and Policy Responses (pp. 137-151). Geneva: United Nations.
Penninx, R., & Slijper, B. (1999). Voor Elkaar? Integratie, Vrijwilligerswerk en Organisaties van Migranten. Amsterdam: IMES.
Portes, A., & Rumbaut, R. (1996). Immigrant America: A Portrait. Berkeley and Los Angeles: University of California Press.
Prins, B., & Slijper, B. (2002). Multicultural Society Under Attack: Introduction. Journal of International Migration and Integration, 3, 313-328.
Putnam, R. (1995). Bowling Alone: America’s Declining Social Capital. Journal of Democracy, 6, 65-78.
Rasbash, J., & Woodhouse, G. (1996). MLn Command Reference. Version 1.0a. London: University of London.
RMO (1998). Integratie in Perspectief. Integratie van Bijzondere Groepen en van Personen uit Etnische Groeperingen in het Bijzonder. Den Haag: Sdu Uitgevers.
Rumbaut, R. (1997). Assimilation and its Discontents: Between Rhetoric and Reality. International Migration Review, 31, 923-960.
Snijders, T., & Bosker, R. (1999). Multilevel Analysis. An Introduction to Basic and Advanced Multilevel Modeling. London: Sage.
Sowell, T. (1996). Migrations and Cultures. A World View. New York: Basic Books. Tesser, P., & Mulder, L. (1990). Cultureel Kapitaal en Schoolprestaties. In C. Klaassen and
P. Jungbluth (Eds.), OnderwijsResearchDagen 1990. Onderwijs en Samenleving (pp. 39-51). Nijmegen: ITS.
Thompson, B. (1998). Five Methodology Errors in Educational Research: The Pantheon of Statistical Significance and Other Faux Pas. Invited address AERA annual meeting, San Diego, US, April 15, 1998.
Tweede Kamer (1998). Integratiebeleid 1999-2000. Kansen Krijgen, Kansen Pakken. Tweede Kamer der Staten-Generaal. Vergaderjaar 1998-1999, 26333, nrs. 1-2. ’s-Gravenhage: Sdu Uitgevers.
Tweede Kamer (2003). Rapportage Integratiebeleid Etnische Minderheden. Tweede Kamer der Staten-Generaal. Vergaderjaar 2003-2004, 29203, nrs. 1-2. ‘s-Gravenhage: Sdu Uitgevers.
Uunk, W. (2003). The Cultural Integration of Immigrants in the Netherlands: A Description and Explanation of Modern Attitudes of Turks, Moroccans, Surinamese, Antilleans and the Indigenous Population. In L. Hagendoorn, J. Veenman and W. Vollebergh (Eds.), Integrating Immigrants in the Netherlands. Cultural versus Socio-Economic Integration (pp. 199-233). Aldershot: Ashgate.

24
van Boxtel, R. (1999). Godsdienst en Levensovertuiging in Relatie tot het Integratiebeleid Etnische Minderheden. ’s-Gravenhage: Ministerie van Binnenlandse Zaken en Koninkrijksrelaties.
van Daal, J. (2001). Het Middenveld als Smeltkroes ? Verschuivingen in Deelname aan Verenigingsleven en Vrijwilligerswerk in Multicultureel Rotterdam. Utrecht: Verwey-Jonker Instituut.
van het Loo, M, de Spiegeleire, S., Lindstrom, G., Kahan, J., & Vernez, G. (2001). A Comparison of American and Dutch Immigration and Integration Experiences. What Lessons Can Be Learned? The Hague: WRR.
Vermeulen, H., & Penninx, R. (Eds.) (2000). Immigrant Integration: The Dutch Case. Amsterdam: Het Spinhuis.
Vierke, H. (1995). De PRIMA-Toetsen Gekalibreerd. Nijmegen: ITS. Wainer, H., & Robinson, D. (2003). Shaping up the Practice of Null Hypothesis Significance
Testing. Educational Researcher, 32, 22-30. WRR (2001). Nederland als Immigratiesamenleving. Den Haag: Sdu Uitgevers. Zhou, M. (1997). Segmented Assimilation: Issues, Controversie, and Recent Research on the
New Second Generation. International Migration Review, 31,975-1008. AUTHOR NOTES Geert Driessen received his PhD on a study into the educational position of ethnic minority students. He is a senior educational researcher at the Institute for Applied Social Sciences (ITS) of Radboud University Nijmegen, the Netherlands. His research interests include ethnic and social inequality in education, parental participation in education, pre and early school education, first and second language acquisition, minority language and culture teaching, religion, denomination and education, and Islamic schools. Frederik Smit received his PhD on a study into the role of parents in primary education. He is a senior educational researcher at the Institute for Applied Social Sciences (ITS) of Radboud University Nijmegen, the Netherlands. He has published in the areas of parental involvement in education, culture differences in education, participation in decision-making by teachers, parents and students. ACKNOWLEDGEMENTS The authors would like to thank Jan Doesborgh for his help with the statistical analyses. The Netherlands Organization for Scientific Research (NWO) is gratefully acknowledged for funding the project on which this paper is based. The research was supported by grant # 411-20-005 from NWO’s Social Science Research Council.

25
NOTES 1 Some 75% of Turkish and Moroccan young people have a partner come over from the
country of origin (Hooghiemstra, 2003). While the total number of such marriage immigrants was 11,000 in 1995, the total in 2002 was 21,000. This form of immigration has undergone severe criticism because the integration process must be repeated from ground zero in such cases (WRR, 2001). Immigrants with little or no education, no mastery of the Dutch language, and unfamiliarity with the Western culture are most typically involved. This situation has, according to the government, not only adverse consequences for the marriage immigrants but also for any children they may have. Since 2006, the government has imposed severe restrictions on these so-called ‘import marriages’ (Driessen & Merry, 2006). As a consequence, since then less and less Turkish and Moroccan youngsters in the Netherlands have been marrying brides and bridegrooms fro Turkey and Morroco.
2 The number of asylum seekers has drastically decreased over the past few years. While there were 39,000 requests for asylum in 1999, this number was 13,000 in 2003.
3 Fortuijn was murdered before coming fully into power. 4 Independent of 9/11, one can also speak of a changed outlook on migration. As
Brubaker (2001) has observed, after the blossoming of differentialist integration policies in the 1980s and 1990s in all Western countries of immigration, signs of a modest return to assimilation appeared. According to Brubaker, however, it is no longer the old, analytically discredited, and politically disreputable ‘assimilationist’ understanding of assimilation but a more analytically complex and normatively defensible understanding that is being promoted.
5 According to David Pinto, who is himself an immigrant, this trend went so far in the Netherlands that the government basically deprived immigrants of all initiative and all responsibility or — in the words of Pinto — ‘cuddled them to death’.
6 An interesting parallel to social class differences and their explanation lies here. According to Lubienski (2003), one can speak of a revival of genetic and cultural deficit theory in the USA via a difference vision and following a period in which the deficit approach to social inequality predominated. The Dutch government has also apparently broken the taboo associated with speaking of differences as deficits.
7 It should be noted that the degree of participation needed to be indicative of integration is typically not specified in the form of a criterion. Such commonly used adjectives as ‘fully’, ‘proportionally’, or ‘equal’ provide little help in light of the lack of a clear and unequivocal reference point. The WWR (2001), which is an important advisory body for the Dutch government, suggests — in this connection — that ‘the principle of proportionality’ (all ethnic groups should participate to the same extent in all domains of Dutch society) as the objective of policy is simply a phantom. In light of the fact that immigration is a dynamic process, new immigrants with delays and disadvantages will continue to arrive and differences will thus continue to exist.
8 Surinamese and Antillean immigrants represent those coming from former colonies. Turkish and Moroccan immigrants represent the group of labor immigrants. The category of ‘other’ is fairly heterogeneous with respect to not only country of origin but

26
also parental level of education. In light of the varying and sometimes small numbers of immigrants coming from the other countries of origin and particularly in relation to the first three categories of parental ethnicity, further division of the category of ‘other’ was not undertaken.
9 According to the official definition of labor participation, individuals with a job of less than 12 paid hours a week do not work.
10 Non-Dutch residents cannot vote in the elections for the Lower House of Parliament. When they are citizens from a member country of the European Union, they can vote in the elections for the Municipality Council. When they are not citizens of a EU member country, they must have resided in the Netherlands for five years without interruption to be able to vote in these elections (MinBiZa, 1998).
11 Social capital may nevertheless be relevant for the choice of elementary school. In the Netherlands, parents are free to choose — among other things — the school for their child to attend.
12 The extent to which such policy will be maintained is unclear. The current government wants to pursue the most general policy possible. This means that policy specifically aimed at immigrants has been placed under considerable pressure. Immigrant Language and Culture Teaching, which is a form of bilingual education, has been done away with, for example, and the subsidies for various immigrant organizations have been withdrawn as no longer serving the general interest or not aimed at integration.
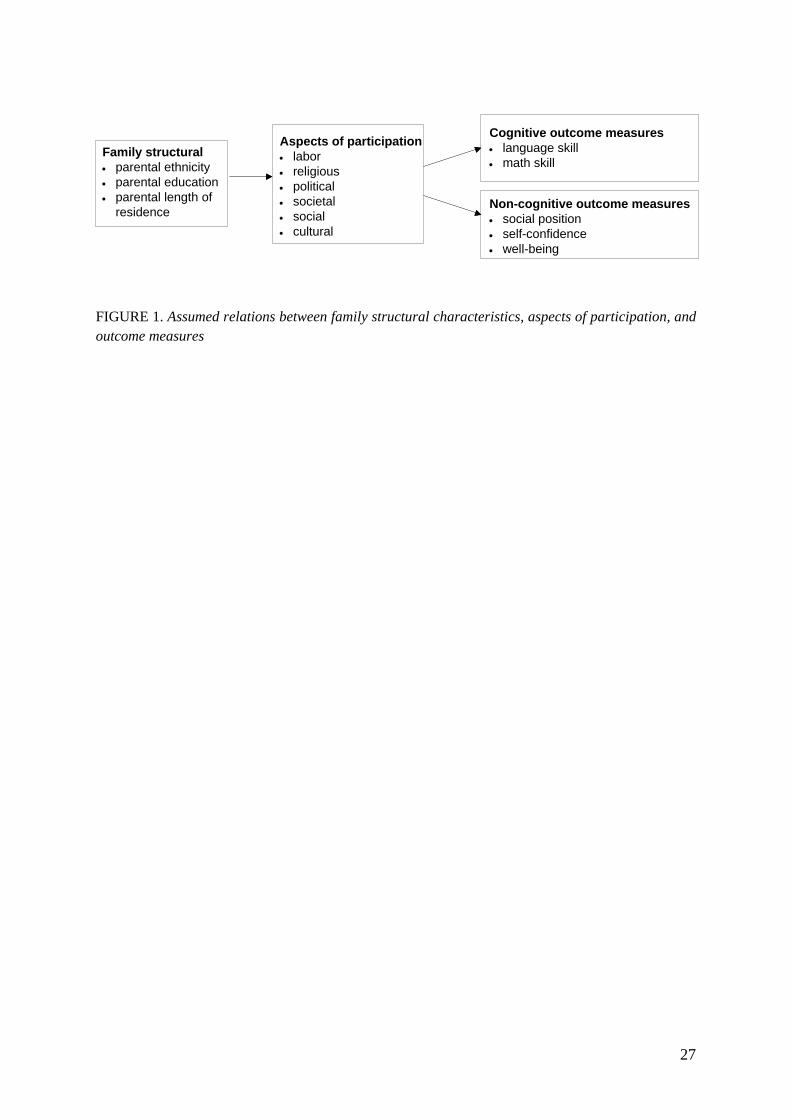
27
Family structural• parental ethnicity• parental education• parental length of
residence
Aspects of participation• labor• religious• political• societal• social• cultural
Cognitive outcome measures• language skill• math skill
Non-cognitive outcome measures• social position• self-confidence• well-being
FIGURE 1. Assumed relations between family structural characteristics, aspects of participation, and outcome measures

28
TABLE 1 Relations between parental ethnicity and parental education (in %) Ethnicity Education Dutch Sur/Ant Trk/Mor Other TotalElementary 3 10 47 17 11Vocational 24 27 18 13 23Professional 47 54 29 40 44College 26 9 5 30 22n=100% 7,797 431 1,651 801 10,680 Note: Sur=Surinamese; Ant=Antillean; Trk=Turkish; Mor=Moroccan; Other=other immigrant.

29
TABLE 2 Relations of parental ethnicity and parental education to parental length of residence, participation, and outcome measures (average scores) Family structural characteristics Ethnicity Education Total Dutch Sur/Ant Trk/Mor Other eta Elem Voc Prof Col eta Length of residence % <10 years 0 21 19 48 0.52 18 4 6 8 0.14 8% 10-19 years 0 32 47 26 0.58 36 8 9 4 0.30 11% ≥20 years 2 48 34 26 0.48 27 11 8 6 0.20 10% from birth 98 0 0 0 0.96 20 77 77 81 0.41 71Participation Labor % paid work 87 54 49 52 0.38 41 75 81 89 0.32 77Religious % (practically) never 58 36 15 45 0.31 28 57 50 50 0.16 49% few times a year 24 44 17 25 0.11 18 22 26 25 0.06 24% 1-3 times a month 9 13 20 13 0.12 17 9 11 13 0.07 11% ≥1 times a week 9 7 48 16 0.39 37 12 13 12 0.21 15Political % no times 21 45 43 58 0.28 49 39 25 12 0.26 28% one time 12 17 26 17 0.14 26 17 14 10 0.12 15% two times 67 38 30 25 0.33 25 44 61 78 0.32 57Societal % volunteer work 28 12 12 14 0.16 7 17 25 36 0.20 24Social % 0 48 63 48 65 0.10 59 57 48 43 0.12 50% 1 47 32 42 30 0.11 37 39 47 49 0.09 44% ≥2 5 5 9 5 0.06 4 4 6 8 0.06 6Cultural % never 14 15 73 24 0.49 67 30 18 7 0.41 24% <1 a year 42 60 18 47 0.20 27 50 46 23 0.22 40% 1 a year 30 16 8 21 0.19 4 16 26 44 0.28 25% ≥2 a year 13 9 1 9 0.14 1 4 9 26 0.28 11Effect measures Language 987 967 952 969 0.36 955 975 982 991 0.28 979Math 57 50 47 52 0.28 47 53 55 59 0.26 55Social position 3.8 3.7 3.7 3.7 0.12 3.7 3.8 3.8 3.9 0.11 3.8Self-confidence 3.6 3.6 3.6 3.6 0.02 3.5 3.5 3.6 3.6 0.06 3.6Well-being 4.1 4.0 4.0 4.0 0.05 4.0 4.0 4.1 4.1 0.06 4.1 Note: Sur=Surinamese; Ant=Antillean; Trk: Turkish; Mor=Moroccan; Other=other immigrant; Elem=Elementary; Voc=vocational; Prof=professional; Col=college.

30
TABLE 3 Results of multilevel analyses with language skill, total sample
Model 0 1 2 3 4 B SE sig. B SE sig. B SE sig. B SE sig.Regression coefficients Ethnicitya Sur/Ant -15.7 1.7 ** -13.3 1.8 ** Trk/Mor -25.4 1.1 ** -21.4 1.3 ** Other -15.7 1.3 ** -12.1 1.3 ** Educationb Elementary -17.1 1.3 ** -12.1 1.4 ** Vocational -12.8 1.0 ** -9.0 1.0 ** Professional -6.7 0.8 ** -4.5 0.9 ** Participation Labor 6.9 0.8 ** 3.7 0.8 * Religious -3.2 0.3 ** -0.7 0.4 Political 3.6 0.4 ** 2.0 0.4 ** Societal 4.2 0.8 ** 2.3 0.8 Social 0.2 0.6 0.4 0.5 Cultural 5.2 0.4 ** 2.4 0.4 ** Interactions E/E x P Variance components Student level (%) 80.9 6.4 4.3 +0.9 +0.7 School level (%) 19.1 54.0 36.9 +1.1 +1.3 Chi2/df 164 ** 108 ** 19 * 2 ns Notes: Sur=Surinamese; Ant=Antillean; Trk=Turkish; Mor=Moroccan; Other=other immigrant. Interactions E/E x P: interactions of parental ethnicity x aspects of participation and interactions of parental education x aspects of participation. Reference category a Dutch; b college education. B=unstandardized regression coefficients; SE=standard errors; sig.=significance: *just significant, **strongly significant, ns=not significant.
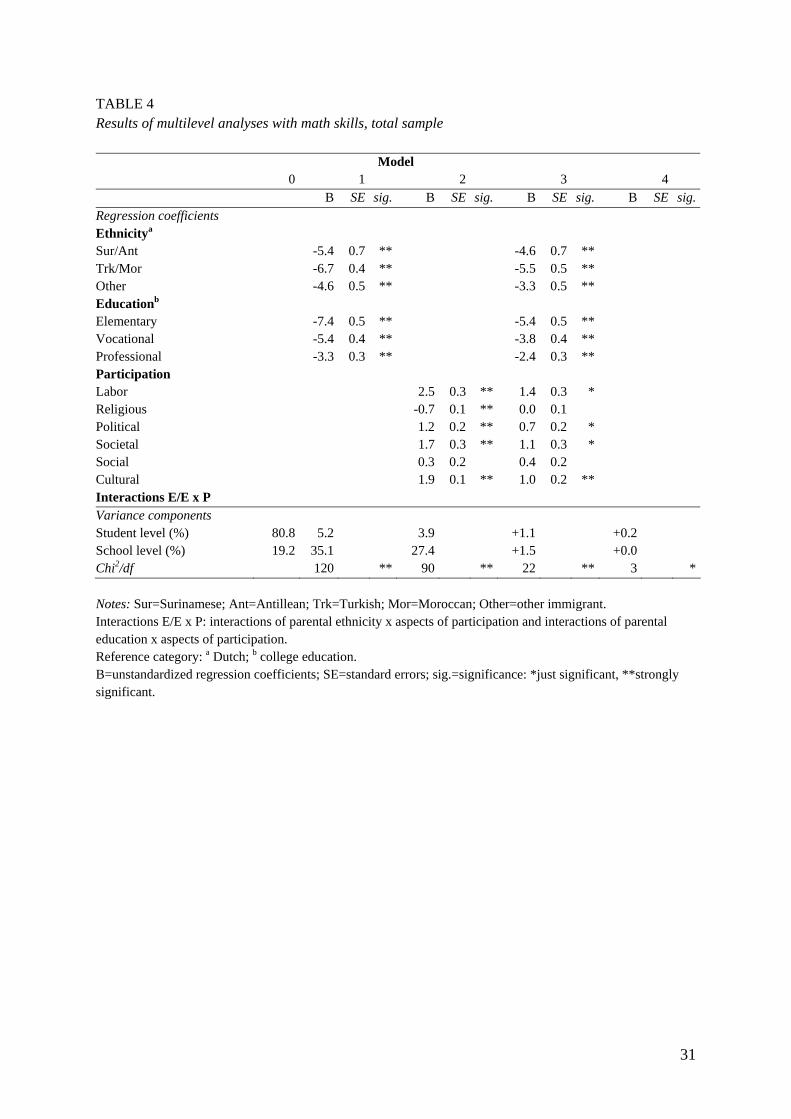
31
TABLE 4 Results of multilevel analyses with math skills, total sample
Model 0 1 2 3 4 B SE sig. B SE sig. B SE sig. B SE sig.Regression coefficients Ethnicitya Sur/Ant -5.4 0.7 ** -4.6 0.7 ** Trk/Mor -6.7 0.4 ** -5.5 0.5 ** Other -4.6 0.5 ** -3.3 0.5 ** Educationb Elementary -7.4 0.5 ** -5.4 0.5 ** Vocational -5.4 0.4 ** -3.8 0.4 ** Professional -3.3 0.3 ** -2.4 0.3 ** Participation Labor 2.5 0.3 ** 1.4 0.3 * Religious -0.7 0.1 ** 0.0 0.1 Political 1.2 0.2 ** 0.7 0.2 * Societal 1.7 0.3 ** 1.1 0.3 * Social 0.3 0.2 0.4 0.2 Cultural 1.9 0.1 ** 1.0 0.2 ** Interactions E/E x P Variance components Student level (%) 80.8 5.2 3.9 +1.1 +0.2 School level (%) 19.2 35.1 27.4 +1.5 +0.0 Chi2/df 120 ** 90 ** 22 ** 3 * Notes: Sur=Surinamese; Ant=Antillean; Trk=Turkish; Mor=Moroccan; Other=other immigrant. Interactions E/E x P: interactions of parental ethnicity x aspects of participation and interactions of parental education x aspects of participation. Reference category: a Dutch; b college education. B=unstandardized regression coefficients; SE=standard errors; sig.=significance: *just significant, **strongly significant.

32
TABLE 5 Results of multilevel analyses language, immigrant-only sample
Model 0 1 2 3 4 5 B SE sig. B SE sig. B SE sig. B SE sig. B SE sig.Regression coefficients
Ethnicitya Sur/Ant 0.0 1.9 -1.1 1.9 -2.4 1.9Trk/Mor -10.7 1.5 ** -8.4 1.6 ** -9.5 1.6 **Educationb Elementary -13.1 2.0 ** -9.4 2.2 ** -10.8 2.2 **Vocational -8.7 2.2 * -6.2 2.2 -8.1 2.2 *Professional -5.7 1.9 * -4.3 1.9 -5.5 1.9Participation Labor 3.5 1.2 * 3.1 1.2 2.9 1.2Religious -2.8 0.5 ** -1.6 0.5 * -1.4 0.5Political 1.3 0.7 1.6 0.7 0.9 0.7Societal 0.8 1.8 -0.3 1.8 -0.6 1.8Social -0.8 1.0 -0.5 1.0 -0.7 1.0Cultural 5.8 0.7 ** 3.0 0.8 * 3.0 0.8 *Interactions E/E x P
Trk/Mor x labor participation
-12.8 2.9 **
Length of residence
2.1 0.4 **
Variance components
Student level (%) 83.2 3.5 2.8 +1.0 +2.3 +1.9 School level (%) 16.8 32.2 29.9 +5.4 +4.4 +0.9 Chi2/df 33 ** 23 ** 7 * 3 * 30 ** Notes: Sur=Surinamese; Ant=Antillean; Trk=Turkish; Mor=Moroccan; Other=other immigrant. Interactions E/E x P: interactions of parental ethnicity x aspects of participation and interactions of parental education x aspects of participation. Reference category: a other immigrant; b college education. B=unstandardized regression coefficients; SE=standard errors; sig.=significance: *just significant, **strongly significant.

33
TABLE 6 Results of multilevel analyses math, immigrant-only sample
Model 0 1 2 3 4 5 B SE sig
. B SE sig
.B SE sig
.B SE sig
. B SE sig
.Regression coefficients
Ethnicitya Sur/Ant -1.2 0.7 -1.4 0.7 -1.7 0.7 Trk/Mor -2.8 0.5 ** -2.6 0.6 ** -2.8 0.6 **Educationb Elementary -4.7 0.7 ** -3.6 0.8 ** -3.9 0.8 **Vocational -2.4 0.8 * -1.6 0.8 -2.1 0.8 Professional -2.3 0.7 * -1.9 0.7 -2.1 0.7 *Participation Labor 1.8 0.4 ** 1.6 0.4 * 1.6 0.4 *Religious -0.5 0.2 -0.2 0.2 -0.1 0.2 Political 0.1 0.2 0.2 0.3 0.1 0.3 Societal 1.5 0.6 1.0 0.6 1.0 0.6 Social -0.2 0.4 -0.1 0.4 -0.1 0.4 Cultural 1.5 0.3 ** 0.6 0.3 0.6 0.3 Interactions E/E x P
Length of residence
0.5 0.1 *
Variance components
Student level (%) 81.9 3.0 1.9 +0.7 +3.0 +0.2 School level (%) 18.1 14.2 15.6 +4.2 +0.0 +1.4 Chi2/df 22 ** 14 * 5 * 3 * 10 * Notes: Sur=Surinamese; Ant=Antillean; Trk=Turkish; Mor=Moroccan; Other=other immigrant. Interactions E/E x P: interactions of parental ethnicity x aspects of participation and interactions of parental education x aspects of participation. Reference category: a other immigrant; b college education. B=unstandardized regression coefficients; SE=standard errors; sig.=significance: *just significant, **strongly significant.