Embed Size (px)
Citation preview

Impact Assessment of
Technology: Economic
Surplus Approach
Praduman Kumar
Hon. Professor, IARI

Impact assessment indicators
• Efficiency
• Food security
• Sustainability
• Employment generation
• Institutional capacity

Impact of technology is assessed
at:
• Farm level
• Regional level
• National level
• Global level

Impact indicators at farm level
– Increase in average yield
- Increase in net income
– Decline in unit cost of production
– Enhance employment and labor productivity
– Price premium due to quality
– Increase of improved seed demand
– Household food & nutritional security
– Gender related issues
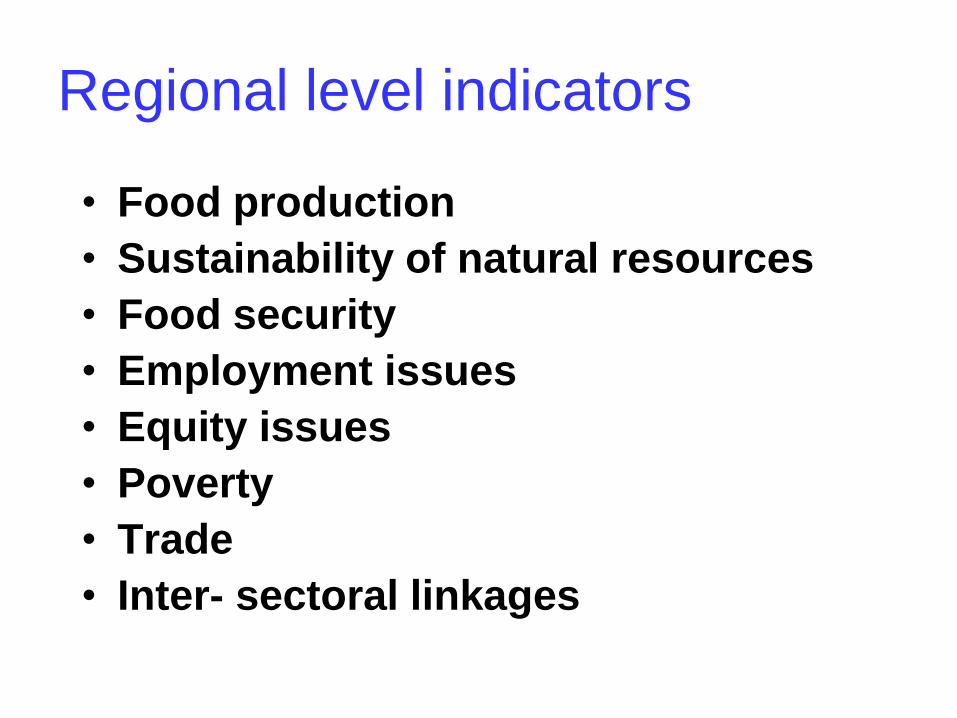
Regional level indicators
• Food production
• Sustainability of natural resources
• Food security
• Employment issues
• Equity issues
• Poverty
• Trade
• Inter- sectoral linkages

National level indicators
• Production
• Prices
• Trade
– Export
– Import
• Spill-over effect
• Sustainability of natural resources
Type of benefits
• Tangible benefits
• Intangible benefits
• Spillover benefits

Research Process
• When research started on new technology
• When the final product identified at
research station
• When the product was released on FLD
• When the seed production stared for large
scale adoption
• R& D gap period
• Adoption rate

Adoption Process
– When first adopted
– Extent of adoption pattern
– Adoption ceiling

Tracking adoption
• Breeder’s seed production
• Sale of improved seed.
• Farm level survey
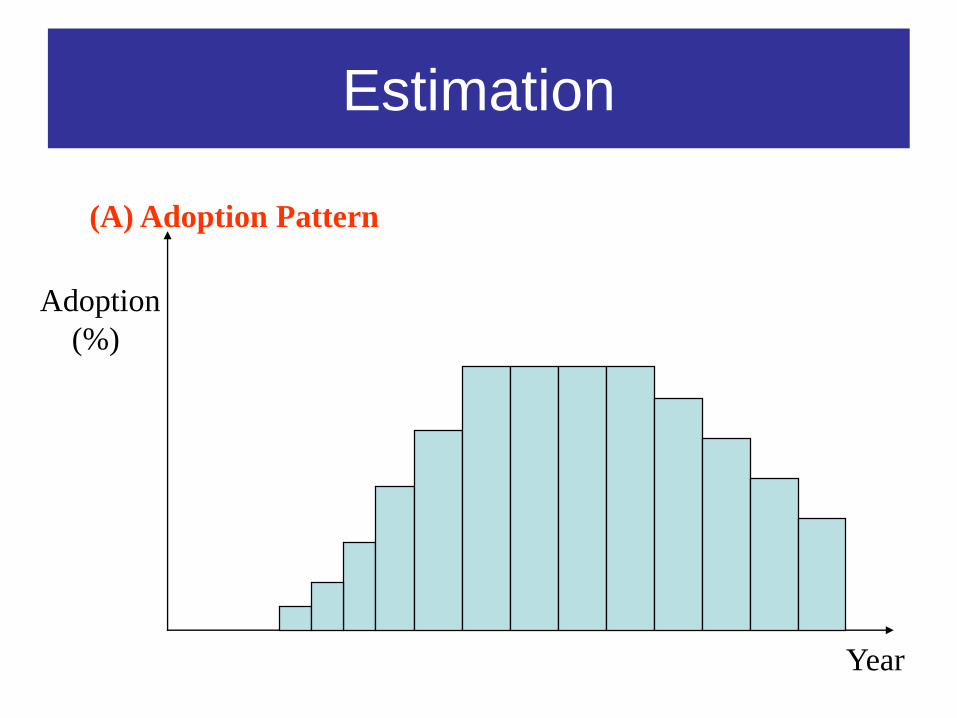
Estimation
Adoption
(%)
Year
(A) Adoption Pattern

Economic surplus approach
• ESM is widely used for evaluating the
impact of technology on the economic
welfare of households
• The model can be applied to the
small/large open/closed economy within
the target domain of production
environment

0 Q0 Q1
Surplus distribution in the basic model of research benefits
Source : Alston, Norton and Pardey, p209
PriceS0
S1
b
a
cd
P0
P1
I0
I1
Quantity
Change in Consumer surplus
(CS = area P0 ab P1)
e
Change in Producer surplus
(PS = area P1 b I1 - area P0 a I0)
D

Estimation of Benefits
0 0 1 0.5CS PQ Z Z
0 0 1 0.5PS PQ K Z Z
0 0 1 0.5TS CS PS PQ K Z
whereK is the vertical shift of supply function expressed as a proportion
of the initial price,
is the absolute value of the elasticity of demand
Z = Ke / (e + ) is the reduction in price, relative to its initial (i.e.,
pre-research) value, due to the supply shift.
e is the elasticity of supply.
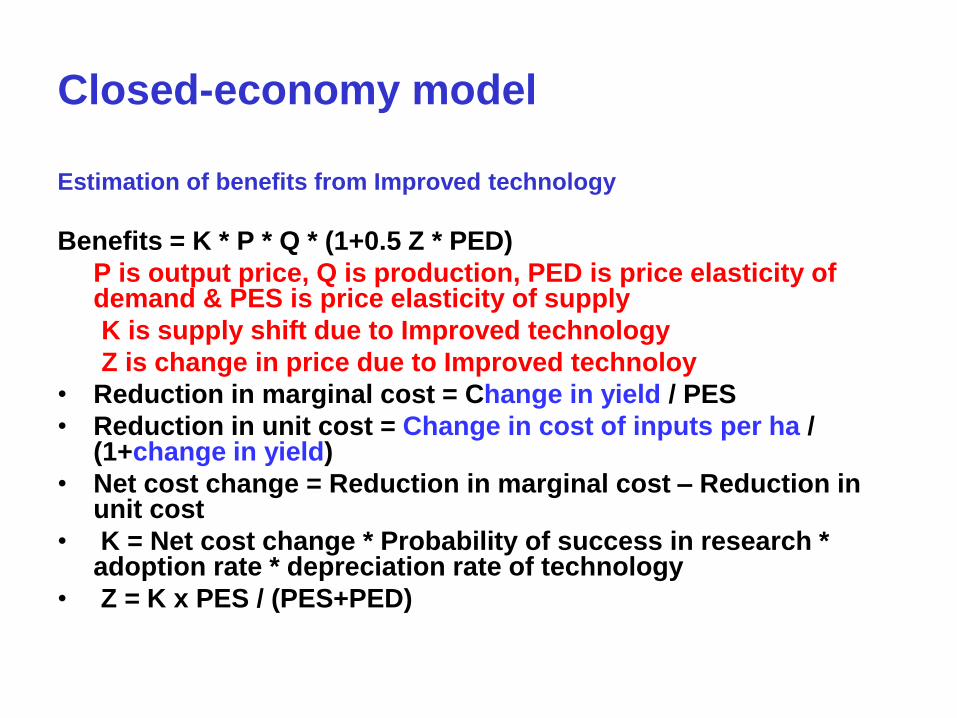
Closed-economy model
Estimation of benefits from Improved technology
Benefits = K * P * Q * (1+0.5 Z * PED)
P is output price, Q is production, PED is price elasticity of demand & PES is price elasticity of supply
K is supply shift due to Improved technology
Z is change in price due to Improved technoloy
• Reduction in marginal cost = Change in yield / PES
• Reduction in unit cost = Change in cost of inputs per ha / (1+change in yield)
• Net cost change = Reduction in marginal cost – Reduction in unit cost
• K = Net cost change * Probability of success in research * adoption rate * depreciation rate of technology
• Z = K x PES / (PES+PED)

Base line information
• Target domain
• Base year area, yield, production and price
• Research and development lag in years
• Adoption and ceiling levels of improved tech
• Depreciation rate of improved technology
• Probability of success of research
• Own price elasticity of supply and demand
• Life of the project
• Investment on research

Supply and Demand Elasticities
• Crop Demand Supply
• Wheat -0.19 0.54
• Rice -0.23 0.33
• Chickpea -0.69 0.11
• Pigenpea -0.69 0.11
• Mustard -0.55 0.19
• Jowar -0.24 0.20
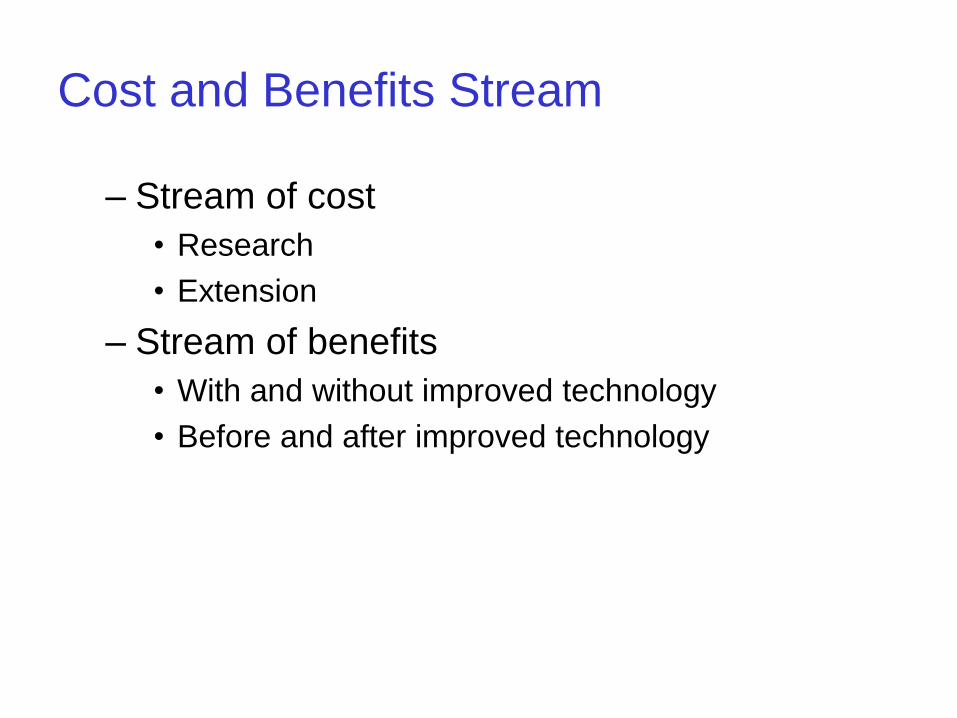
Cost and Benefits Stream
– Stream of cost
• Research
• Extension
– Stream of benefits
• With and without improved technology
• Before and after improved technology
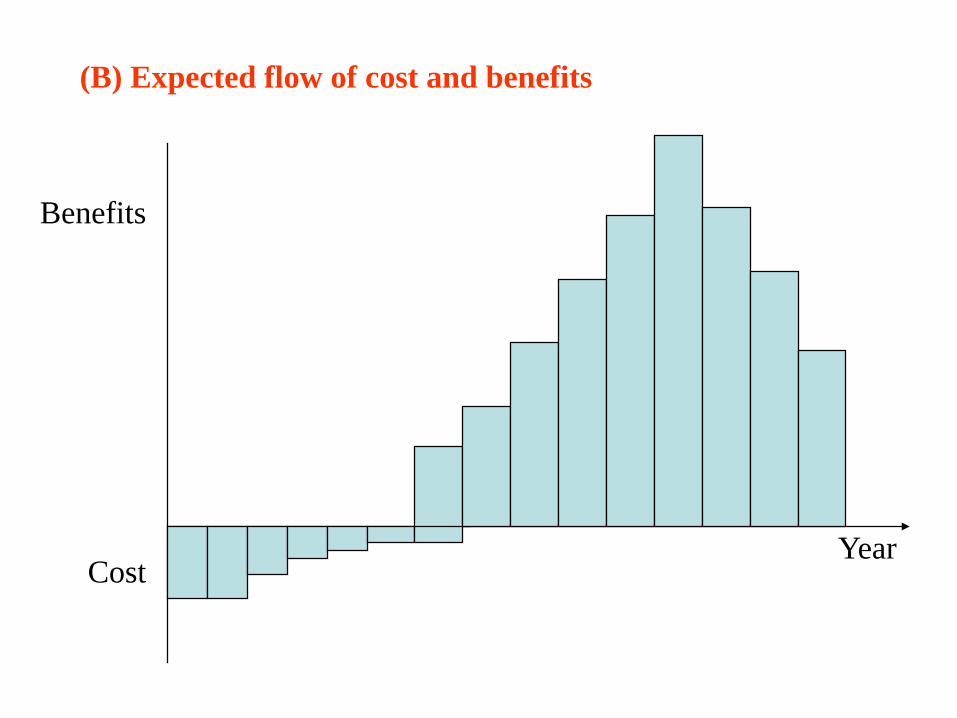
(B) Expected flow of cost and benefits
Cost
Benefits
Year

Analysis for impact assessment of
improved carp strains
• Benefit-cost ratio– Ratio of present worth of benefit stream and
the present worth of cost stream
• Net present value– Present worth of the incremental net benefit
stream
• Internal rate of return
– Discount rate where net present worth of
benefit and costs equal to zero
• Pay back period
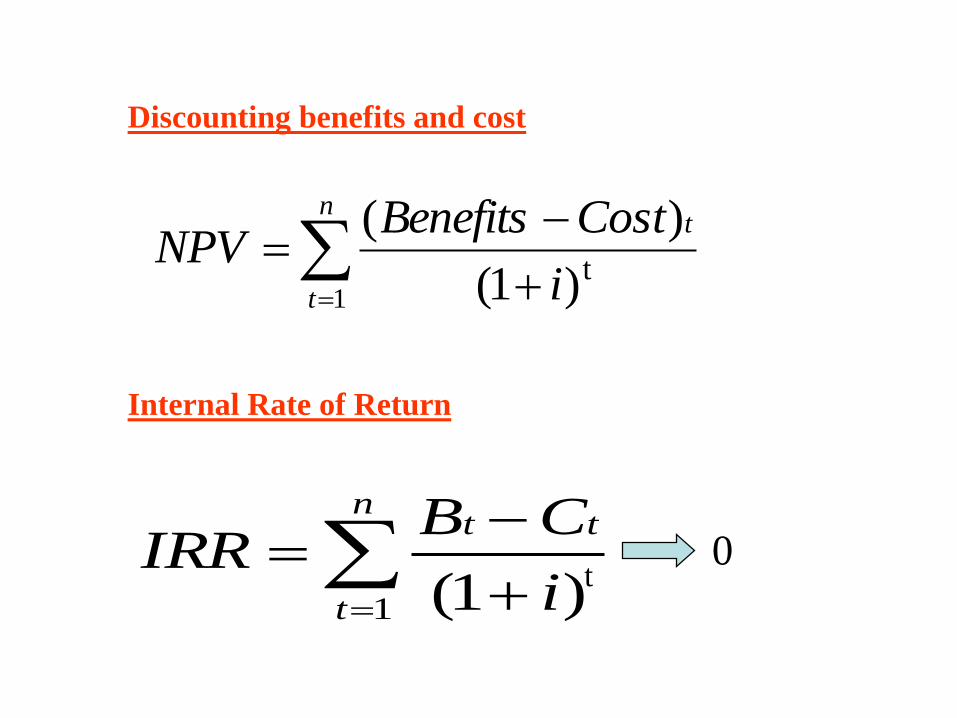
Discounting benefits and cost
n
t
t
i
CostBenefitsNPV
1 )1(
)(t
Internal Rate of Return
n
t
tt
i
CBIRR
1 )1( t0

Source of information
• Research investment to be obtained from various research station (by considering the salary of researchers, operational expenses and overhead costs of research institutions).
• Information on adoption rate, spread of adoption, ceiling levels, yield gain, cost savings and price premium.
• The data can be derived from the field survey and discussion with the research manager, extension group, scientists and traders.
• Supply and demand elasticity's of commodity can be taken from published literature.

• Small economy Economic Surplus.XLS
• Large economy Economic Surplus.XLS

Economic Surplus
(BT_Bringel_NCAP_Sankt
Kumar).xls

• Impact Assessment of Jayanti Rohu in
India.XLS
• Impact of Jayanti Rohu.XLS

Output of IVLP Project
Total villages
Total farmers
No. of tech. inter.
No. of tech. assessed
No of tech. Refined
2000 2001 2002
3 3 3
1000 1000 1000
23 21 21
21 21 21
21 21 21
Twenty usable technological
interventions identified:
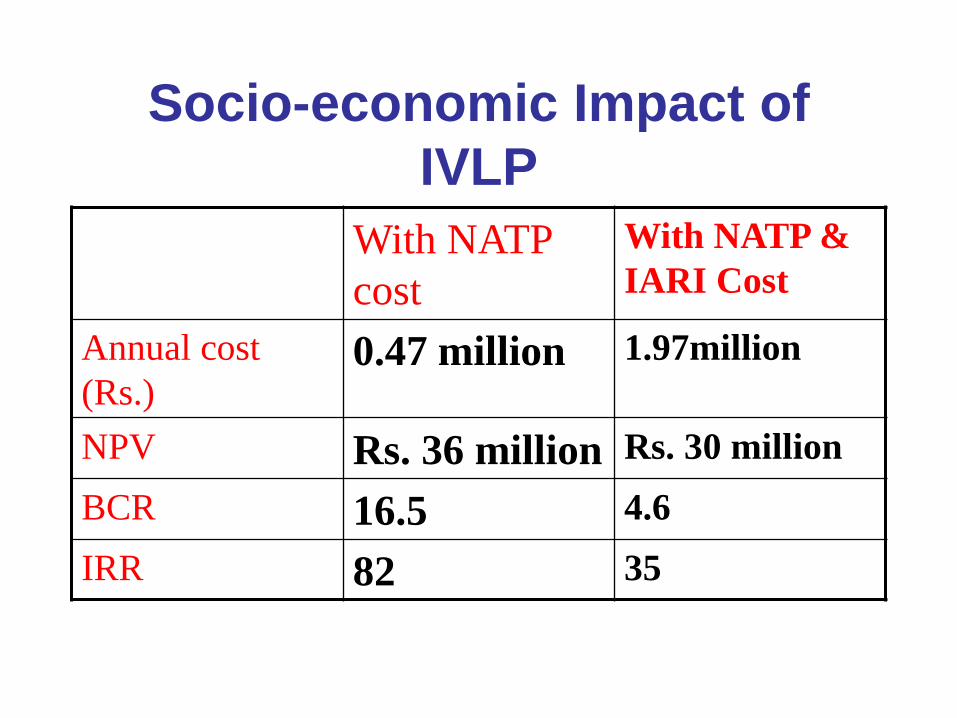
Socio-economic Impact of
IVLP
With NATP
cost
With NATP &
IARI Cost
Annual cost
(Rs.)0.47 million 1.97million
NPV Rs. 36 million Rs. 30 million
BCR 16.5 4.6
IRR 82 35

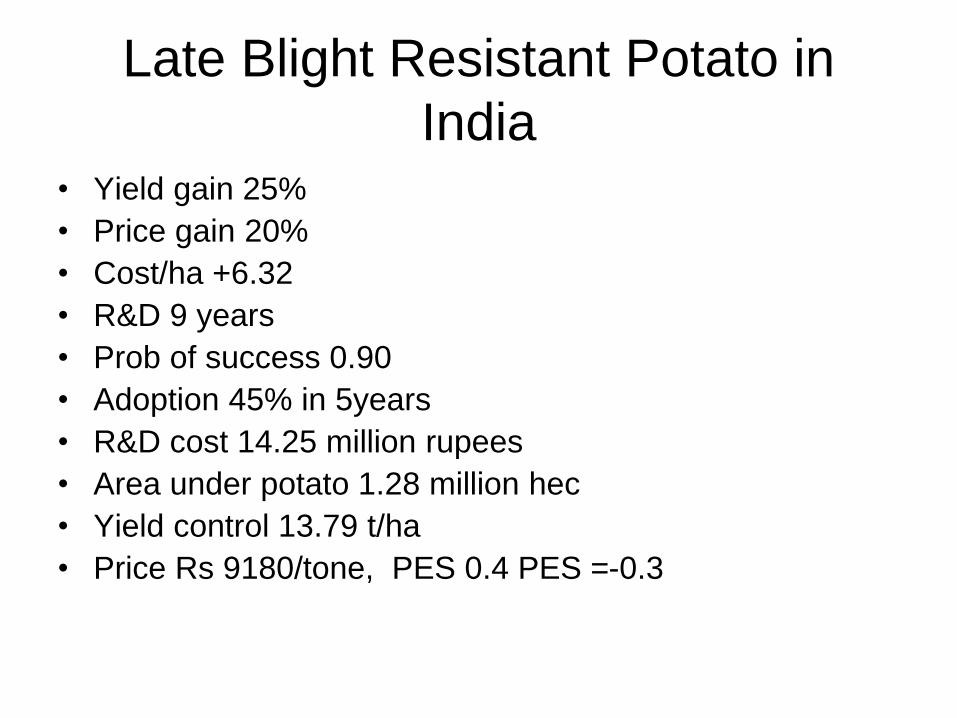
Late Blight Resistant Potato in
India• Yield gain 25%
• Price gain 20%
• Cost/ha +6.32
• R&D 9 years
• Prob of success 0.90
• Adoption 45% in 5years
• R&D cost 14.25 million rupees
• Area under potato 1.28 million hec
• Yield control 13.79 t/ha
• Price Rs 9180/tone, PES 0.4 PES =-0.3

Conclusions
•A number of promising technologies have been
refined/developed.
•Economic benefits presented for few projects
had shown that the rate of return from
investment in research under NATP are high.
•Provided policy guidance to research system

Limitation
•Close economy framework with
no spillover effects
•Data on production cost is week
•Analysis does not consider
research stock and its costs as
well extension cost
•Results are sensitive to demand
and supply elasticity
Late Blight Resistant Potato in
India• Yield gain 25%
• Price gain 20%
• Cost/ha +6.32
• R&D 9 years
• Prob of success 0.90
• Adoption 45% in 5years
• R&D cost 14.25 million rupees
• Area under potato 1.28 million hec
• Yield control 13.79 t/ha
• Price Rs 9180/tone, PES 0.4 PES =-0.3