Embed Size (px)
Citation preview
Impact of Extension on Production of
Paddy in 3 States of India
Avinash Kishore, Suresh Babu, Sunipa Dasgupta and PK Joshi
Source: http://indianexpress.com/article/opinion/columns/from-lab-to-land/99/
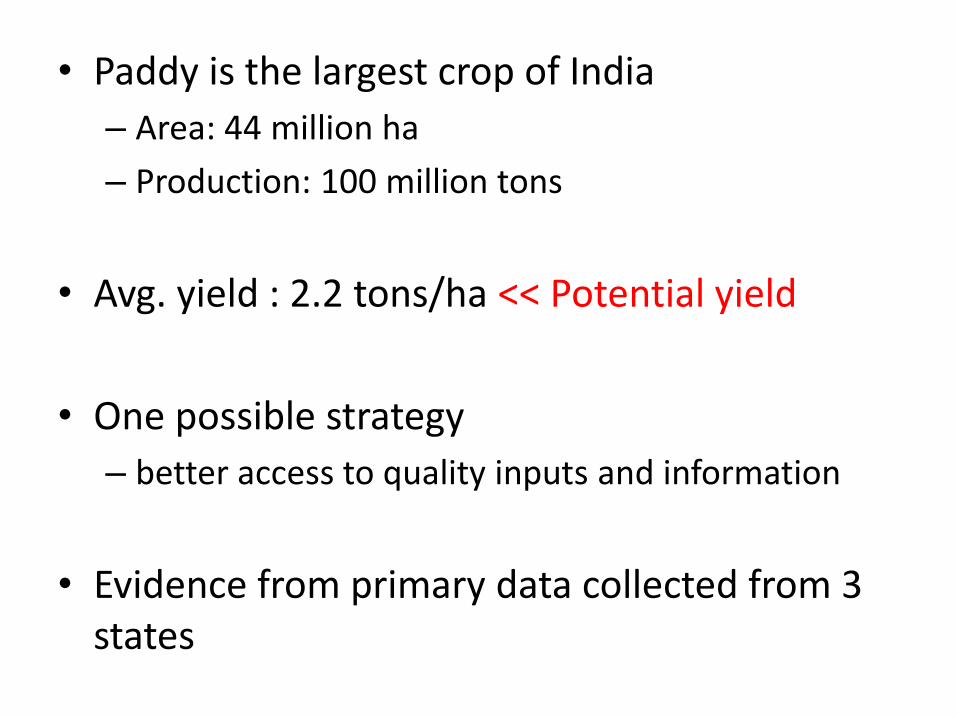
• Paddy is the largest crop of India
– Area: 44 million ha
– Production: 100 million tons
• Avg. yield : 2.2 tons/ha << Potential yield
• One possible strategy
– better access to quality inputs and information
• Evidence from primary data collected from 3 states
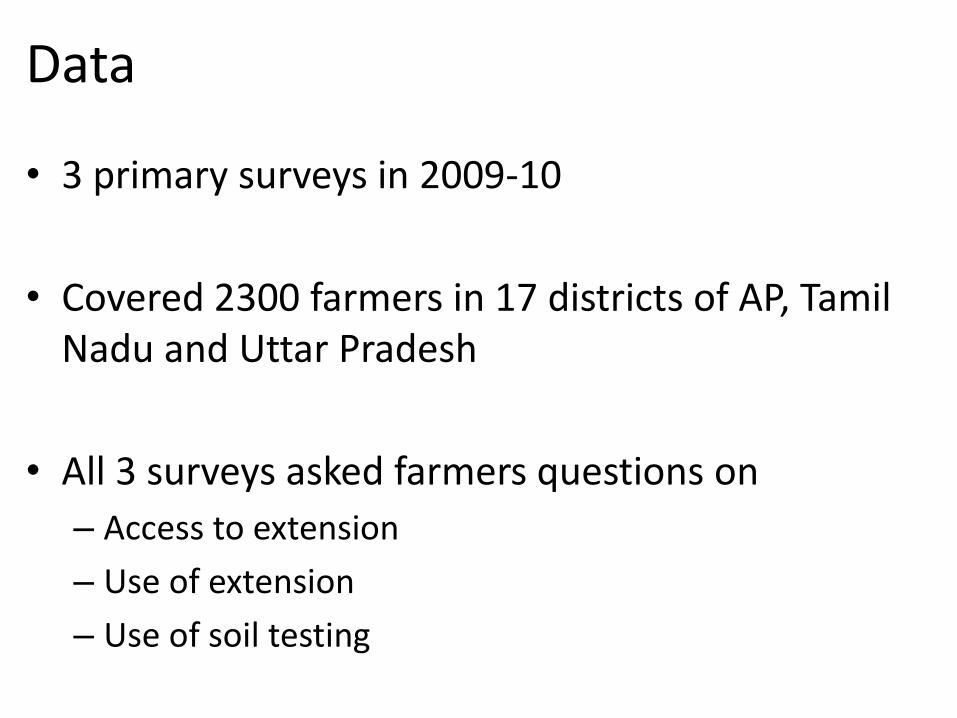
Data
• 3 primary surveys in 2009-10
• Covered 2300 farmers in 17 districts of AP, Tamil Nadu and Uttar Pradesh
• All 3 surveys asked farmers questions on
– Access to extension
– Use of extension
– Use of soil testing
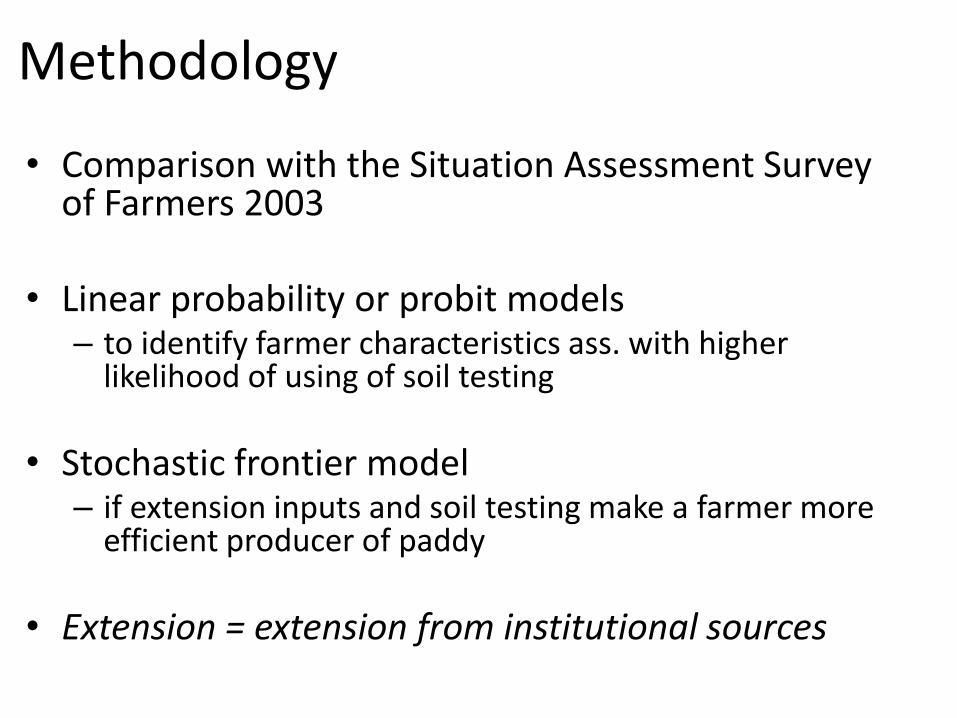
Methodology
• Comparison with the Situation Assessment Survey of Farmers 2003
• Linear probability or probit models
– to identify farmer characteristics ass. with higher likelihood of using of soil testing
• Stochastic frontier model – if extension inputs and soil testing make a farmer more
efficient producer of paddy
• Extension = extension from institutional sources
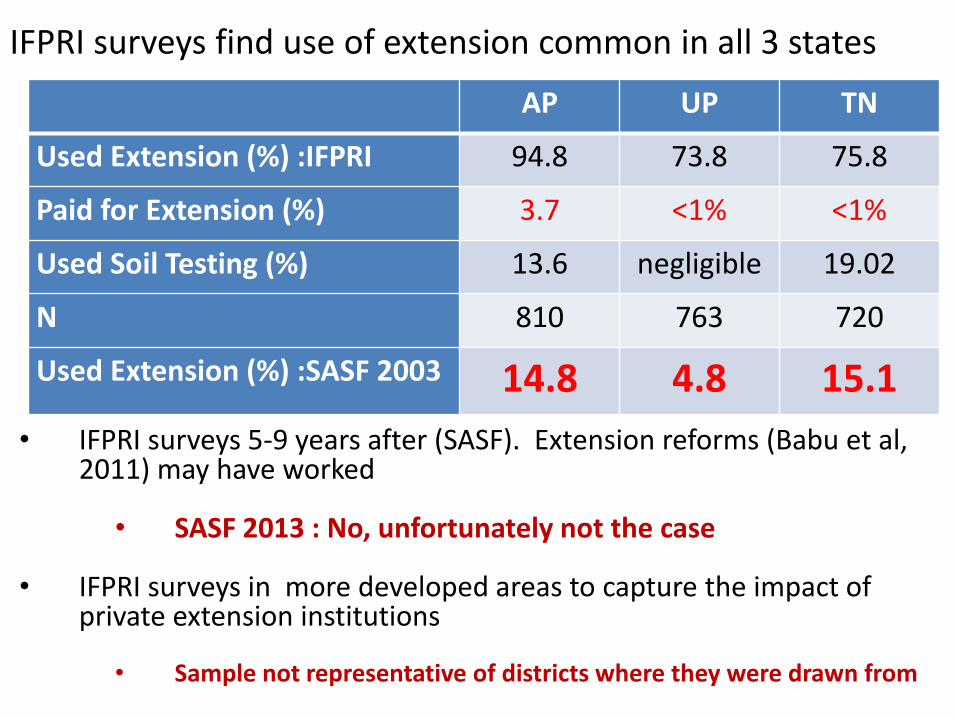
IFPRI surveys find use of extension common in all 3 states
AP UP TN
Used Extension (%) :IFPRI 94.8 73.8 75.8
Paid for Extension (%) 3.7 <1% <1%
Used Soil Testing (%) 13.6 negligible 19.02
N 810 763 720
Used Extension (%) :SASF 2003 14.8 4.8 15.1
• IFPRI surveys 5-9 years after (SASF). Extension reforms (Babu et al, 2011) may have worked
• SASF 2013 : No, unfortunately not the case
• IFPRI surveys in more developed areas to capture the impact of
private extension institutions
• Sample not representative of districts where they were drawn from
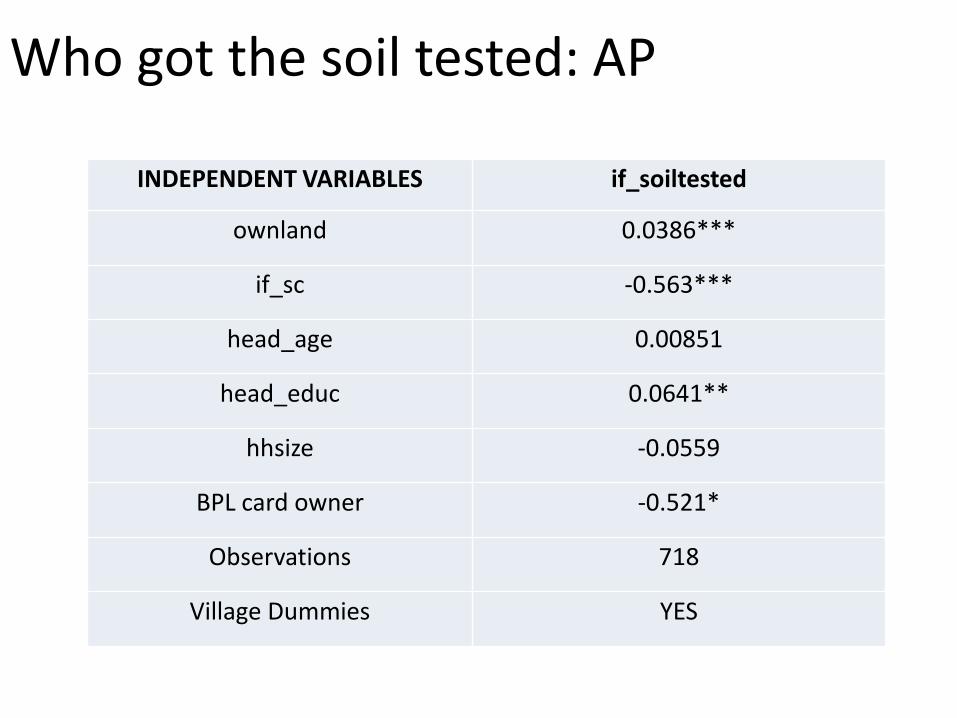
Who got the soil tested: AP
INDEPENDENT VARIABLES if_soiltested
ownland 0.0386***
if_sc -0.563***
head_age 0.00851
head_educ 0.0641**
hhsize -0.0559
BPL card owner -0.521*
Observations 718
Village Dummies YES
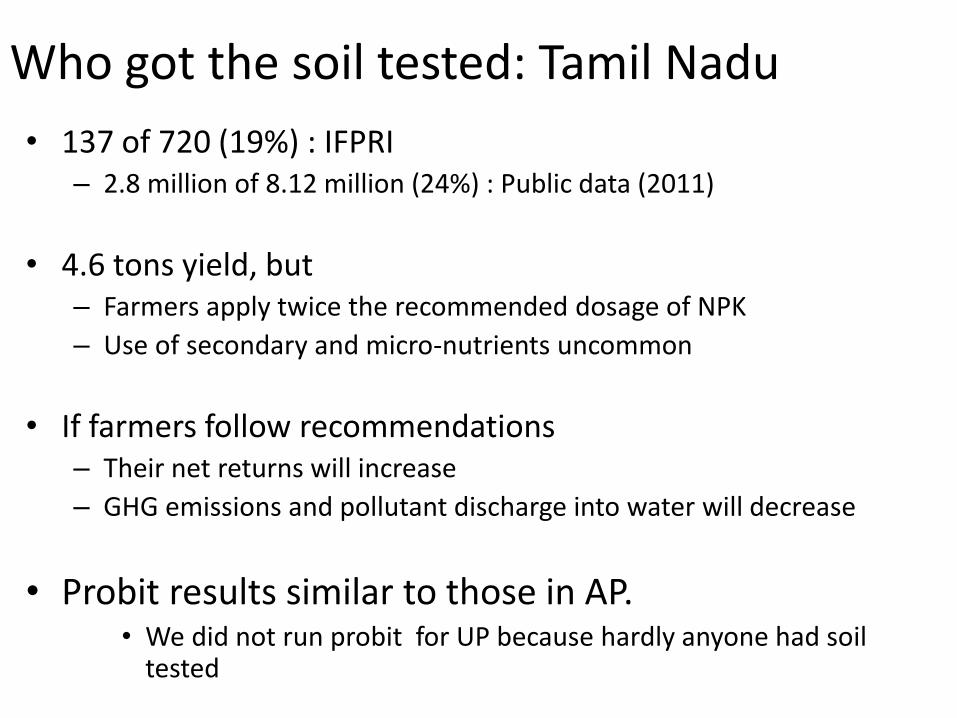
Who got the soil tested: Tamil Nadu
• 137 of 720 (19%) : IFPRI – 2.8 million of 8.12 million (24%) : Public data (2011)
• 4.6 tons yield, but – Farmers apply twice the recommended dosage of NPK
– Use of secondary and micro-nutrients uncommon
• If farmers follow recommendations – Their net returns will increase
– GHG emissions and pollutant discharge into water will decrease
• Probit results similar to those in AP. • We did not run probit for UP because hardly anyone had soil
tested

Stochastic Frontier Model Results
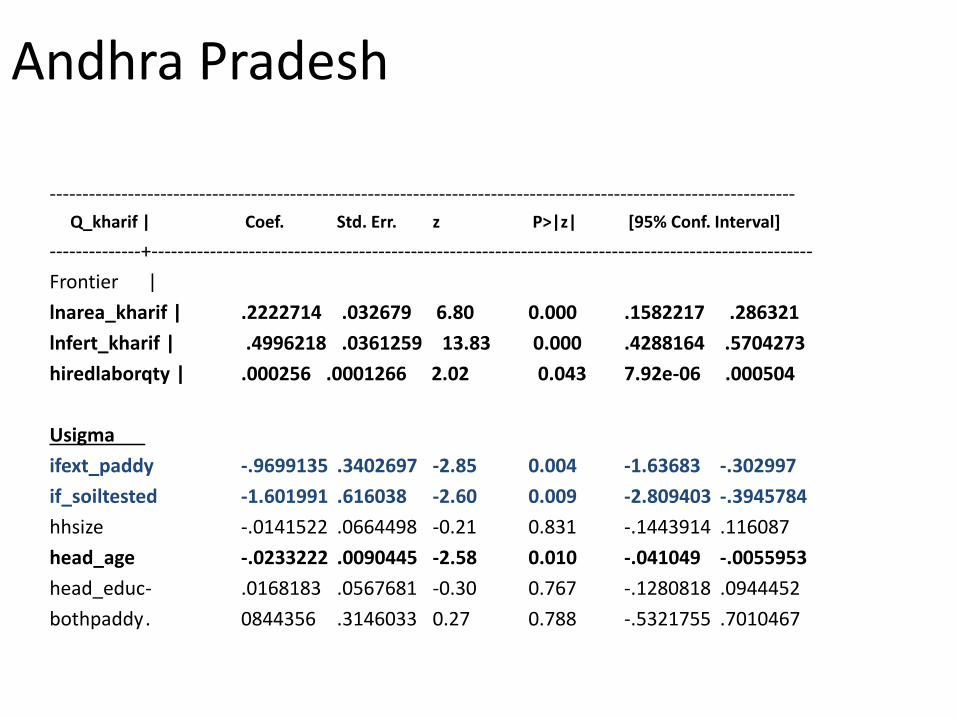
Andhra Pradesh
-------------------------------------------------------------------------------------------------------------------
Q_kharif | Coef. Std. Err. z P>|z| [95% Conf. Interval]
--------------+------------------------------------------------------------------------------------------------------
Frontier |
lnarea_kharif | .2222714 .032679 6.80 0.000 .1582217 .286321
lnfert_kharif | .4996218 .0361259 13.83 0.000 .4288164 .5704273
hiredlaborqty | .000256 .0001266 2.02 0.043 7.92e-06 .000504
Usigma
ifext_paddy -.9699135 .3402697 -2.85 0.004 -1.63683 -.302997
if_soiltested -1.601991 .616038 -2.60 0.009 -2.809403 -.3945784
hhsize -.0141522 .0664498 -0.21 0.831 -.1443914 .116087
head_age -.0233222 .0090445 -2.58 0.010 -.041049 -.0055953
head_educ - .0168183 .0567681 -0.30 0.767 -.1280818 .0944452
bothpaddy . 0844356 .3146033 0.27 0.788 -.5321755 .7010467
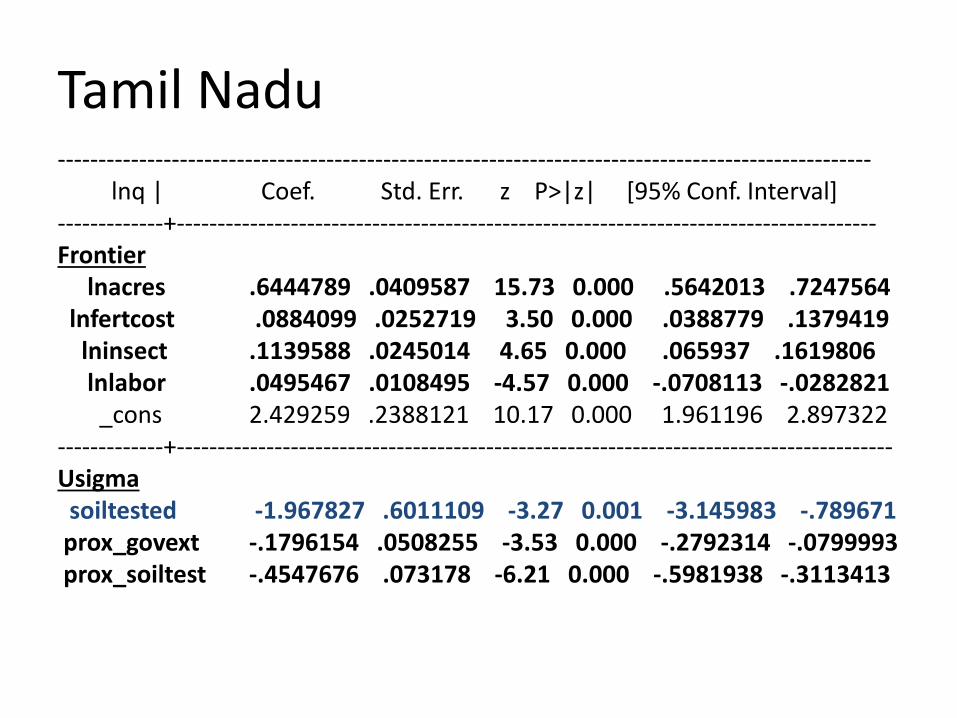
Tamil Nadu ---------------------------------------------------------------------------------------------------- lnq | Coef. Std. Err. z P>|z| [95% Conf. Interval] -------------+-------------------------------------------------------------------------------------- Frontier lnacres .6444789 .0409587 15.73 0.000 .5642013 .7247564 lnfertcost .0884099 .0252719 3.50 0.000 .0388779 .1379419 lninsect .1139588 .0245014 4.65 0.000 .065937 .1619806 lnlabor .0495467 .0108495 -4.57 0.000 -.0708113 -.0282821 _cons 2.429259 .2388121 10.17 0.000 1.961196 2.897322 -------------+---------------------------------------------------------------------------------------- Usigma soiltested -1.967827 .6011109 -3.27 0.001 -3.145983 -.789671 prox_govext -.1796154 .0508255 -3.53 0.000 -.2792314 -.0799993 prox_soiltest -.4547676 .073178 -6.21 0.000 -.5981938 -.3113413

Uttar Pradesh
----------------------------------------------------------------------------------------------------------- lnq | Coef. Std. Err. z P>|z| [95% Conf. Interval] -----------------+----------------------------------------------------------------------------------------- Frontier lnarea .8941873 .0509858 17.54 0.000 .794257 .9941176 lnfert_value .0797995 .0415332 1.92 0.055 -.0016042 .1612031 lnlabor .0663121 .0332818 1.99 0.046 .001081 .1315432 _cons 6.819046 .3410601 19.99 0.000 6.15058 7.487511 -----------------+--------------------------------------------------------------------------------------------- Usigma ifused_extension -.1785204 .288575 -0.62 0.536 -.7441171 .3870762 land fragments .0309609 .0167737 1.85 0.065 -.0019149 .0638367 memberofScorST -.8816122 .182565 -4.83 0.000 -1.239433 -.5237913 -----------------+------------------------------------------------------------------------------------------------
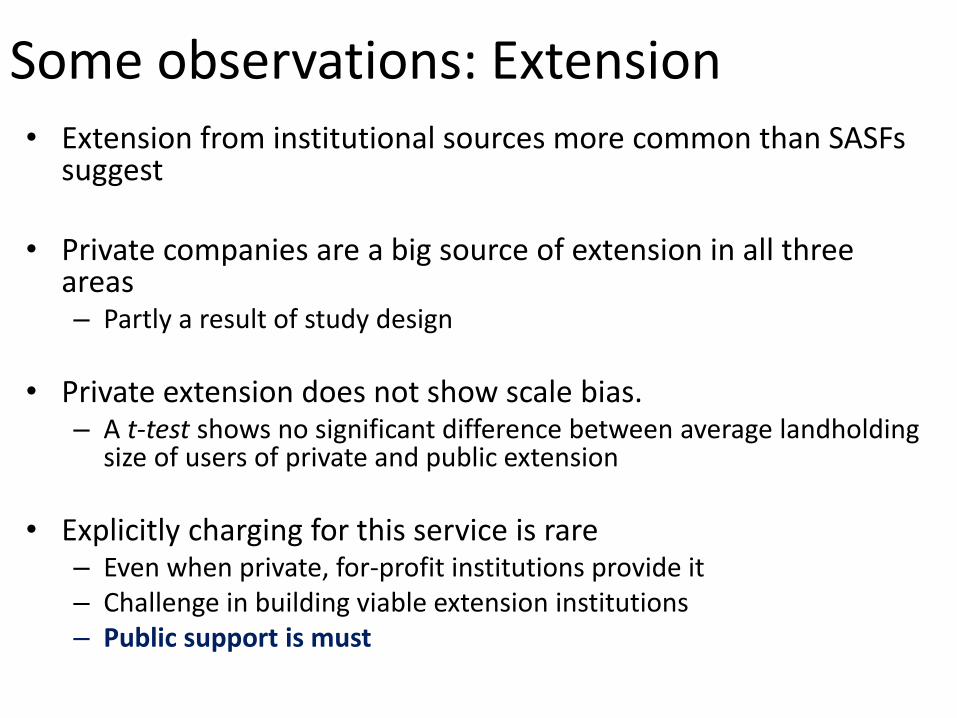
Some observations: Extension • Extension from institutional sources more common than SASFs
suggest • Private companies are a big source of extension in all three
areas – Partly a result of study design
• Private extension does not show scale bias. – A t-test shows no significant difference between average landholding
size of users of private and public extension
• Explicitly charging for this service is rare – Even when private, for-profit institutions provide it – Challenge in building viable extension institutions – Public support is must
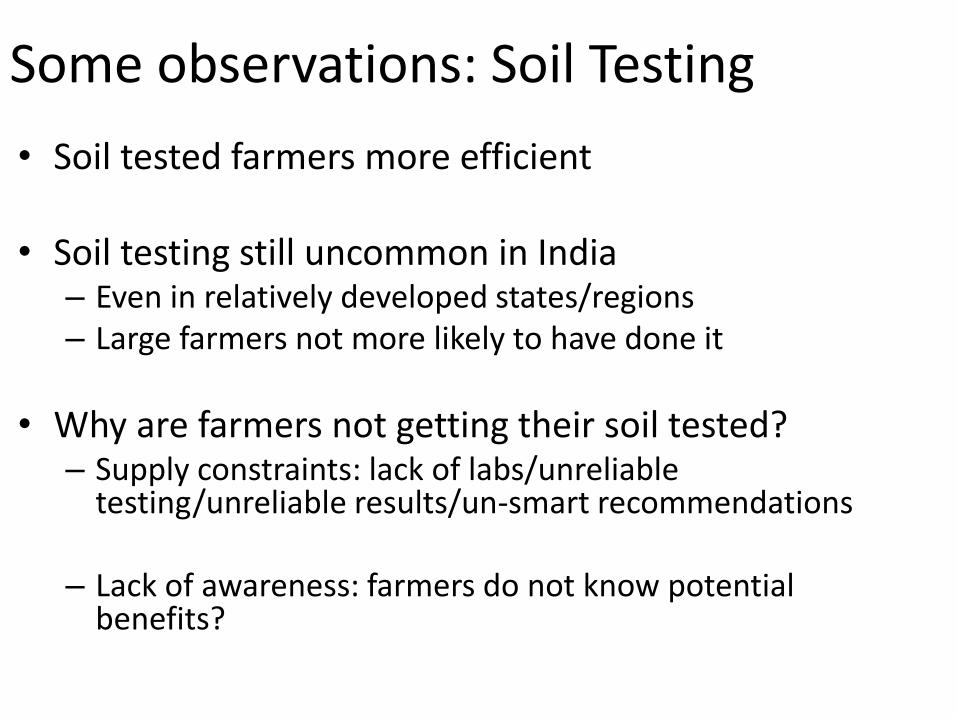
Some observations: Soil Testing
• Soil tested farmers more efficient
• Soil testing still uncommon in India – Even in relatively developed states/regions – Large farmers not more likely to have done it
• Why are farmers not getting their soil tested? – Supply constraints: lack of labs/unreliable
testing/unreliable results/un-smart recommendations – Lack of awareness: farmers do not know potential
benefits?