Embed Size (px)
Citation preview
Section 1-7Misleading Graphs and Statistics
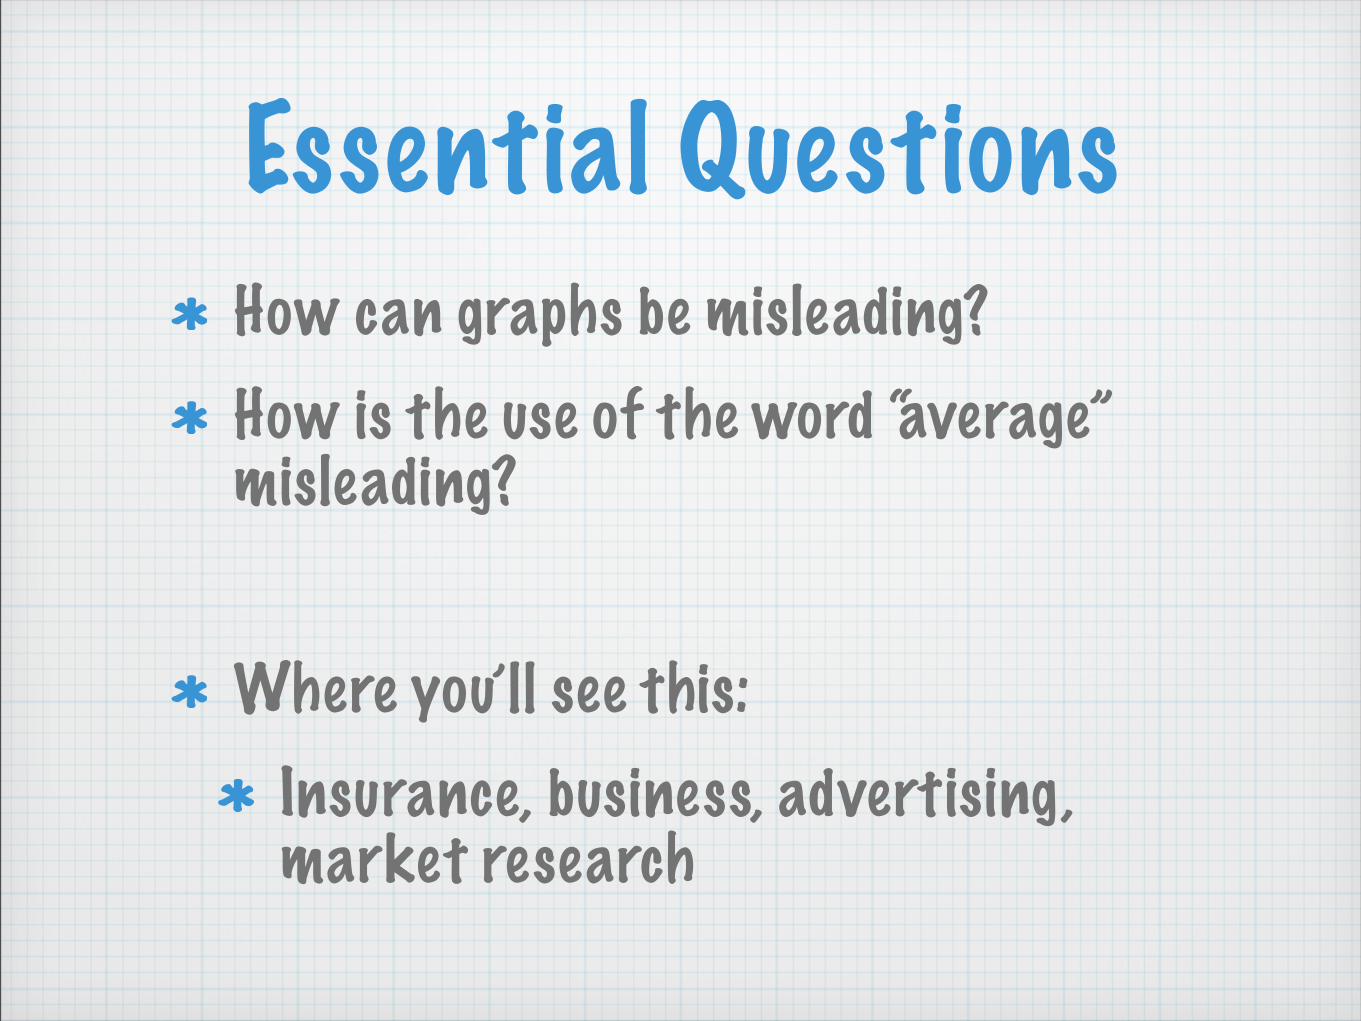
Essential QuestionsHow can graphs be misleading?How is the use of the word “average” misleading?
Where you’ll see this:Insurance, business, advertising, market research
Misleading Data
Misleading Data
Data the tries to make an impression by skewing the actual information
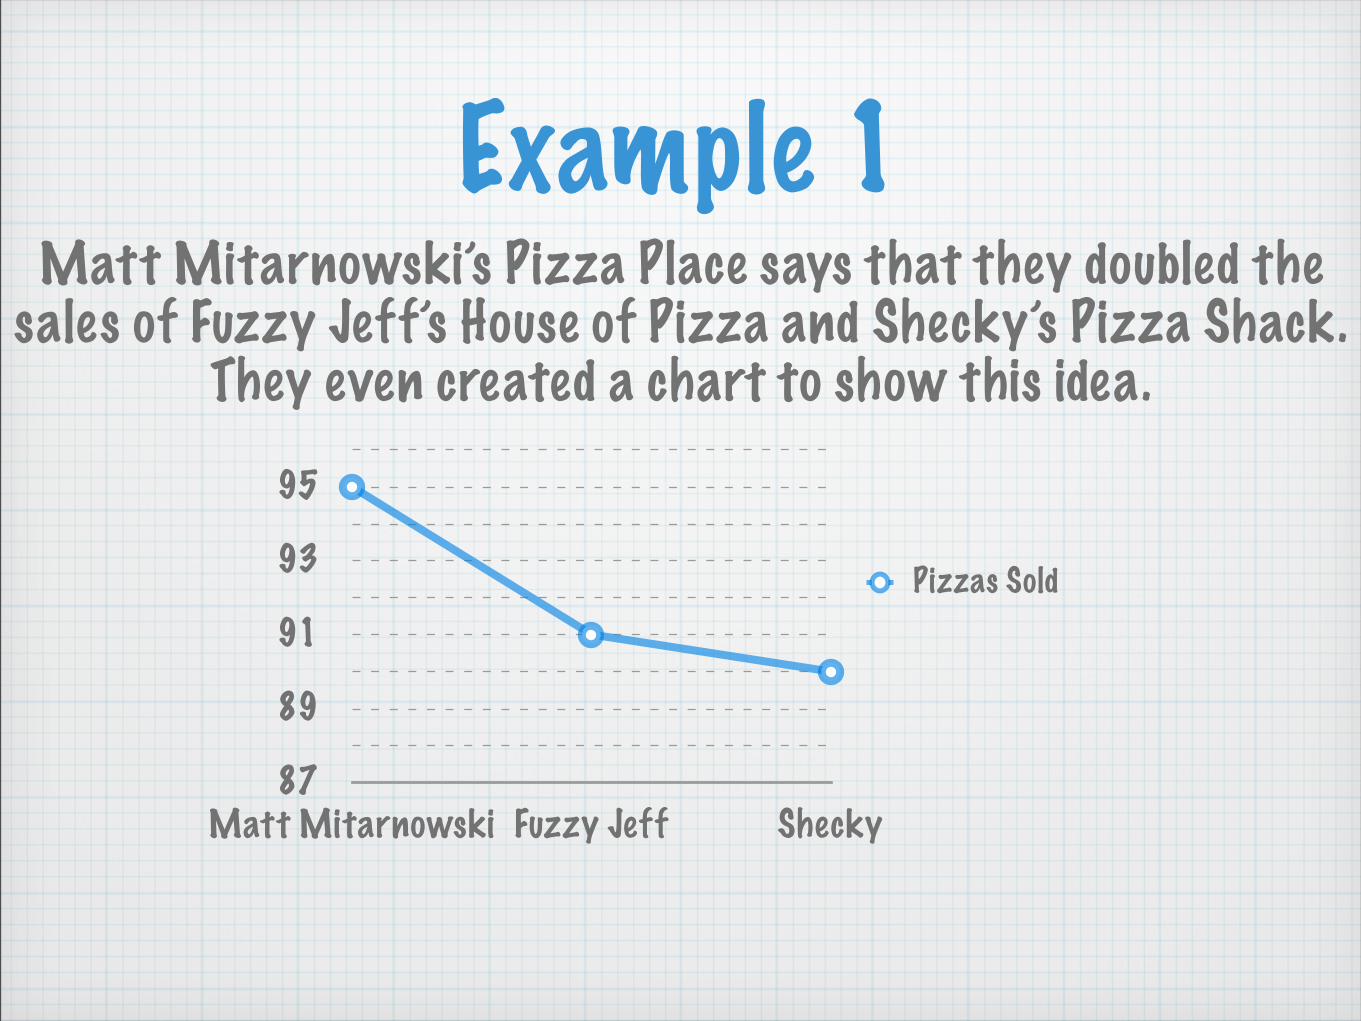
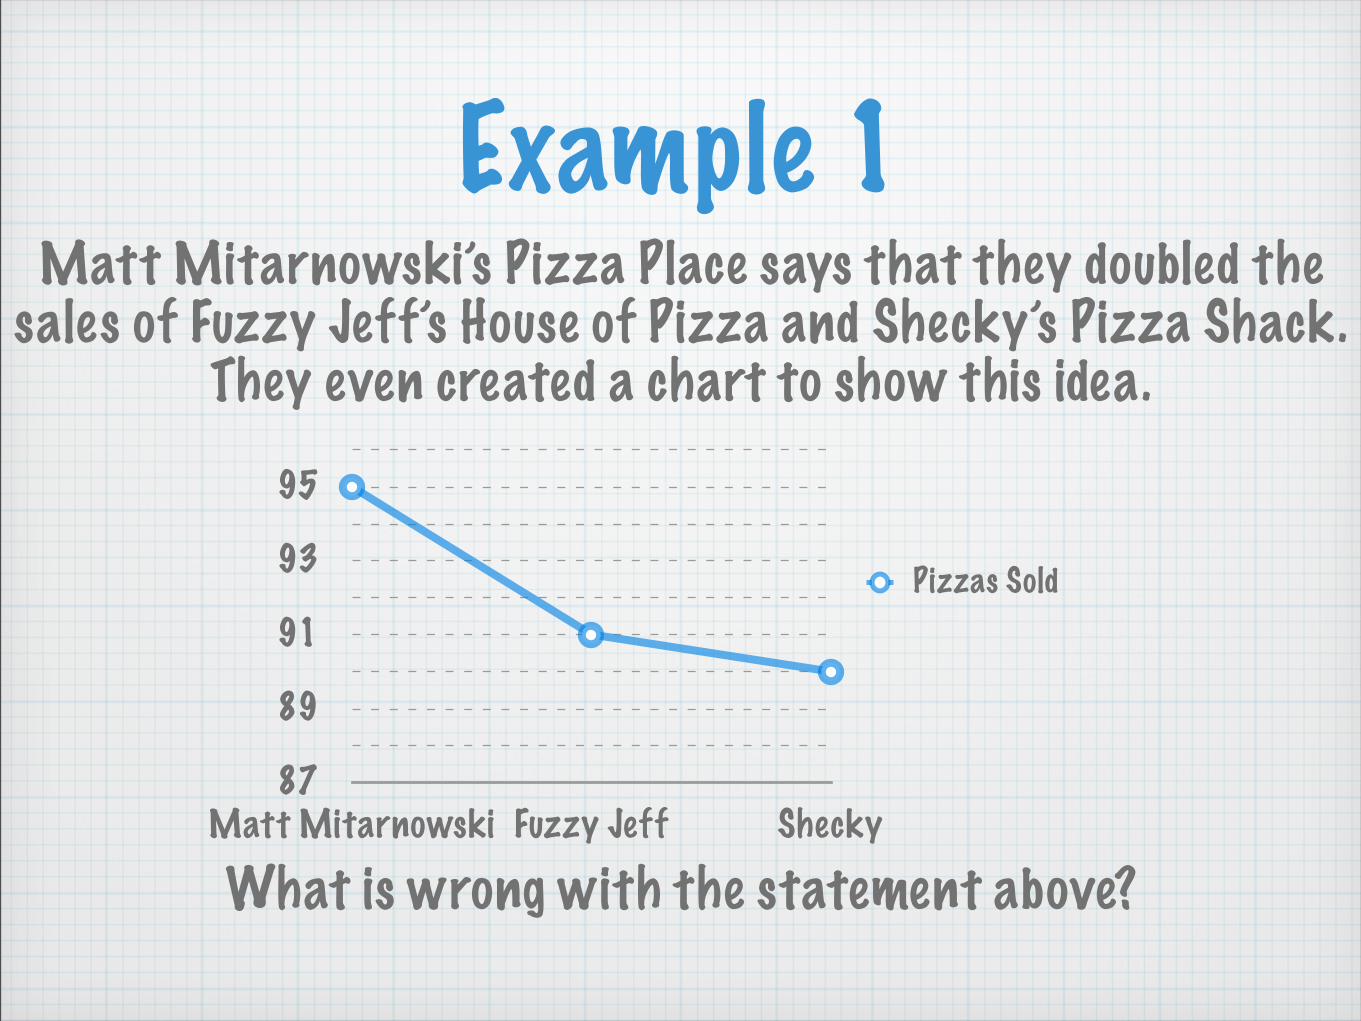
Example 1Matt Mitarnowski’s Pizza Place says that they doubled the
sales of Fuzzy Jeff’s House of Pizza and Shecky’s Pizza Shack. They even created a chart to show this idea.
87
89
91
93
95
Matt Mitarnowski Fuzzy Jeff Shecky
Pizzas Sold
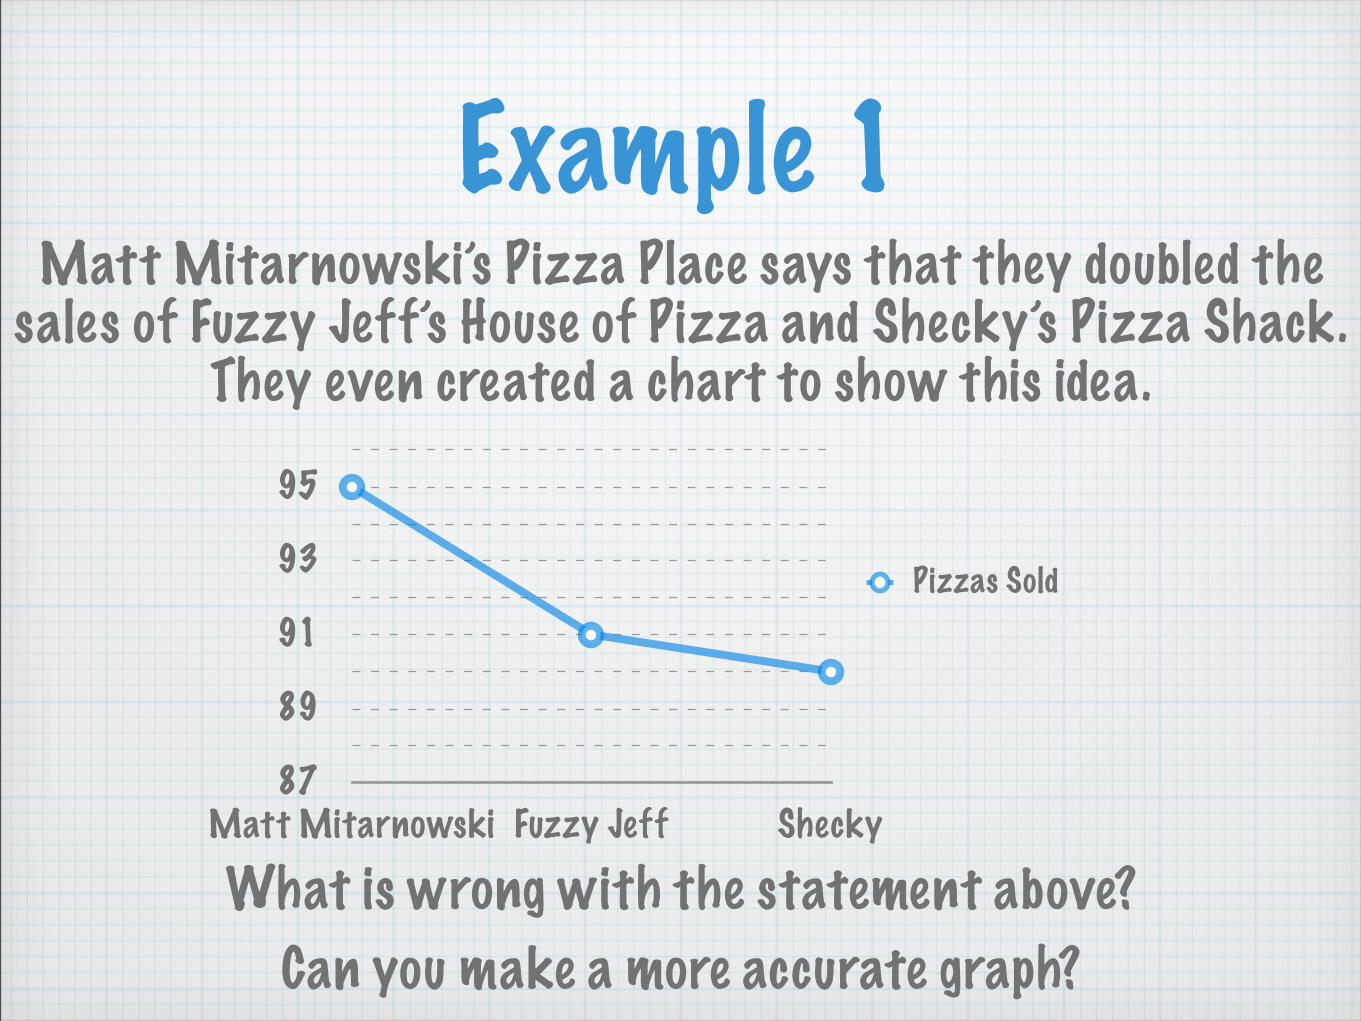
Example 1Matt Mitarnowski’s Pizza Place says that they doubled the
sales of Fuzzy Jeff’s House of Pizza and Shecky’s Pizza Shack. They even created a chart to show this idea.
87
89
91
93
95
Matt Mitarnowski Fuzzy Jeff Shecky
Pizzas Sold
What is wrong with the statement above?
Example 1Matt Mitarnowski’s Pizza Place says that they doubled the
sales of Fuzzy Jeff’s House of Pizza and Shecky’s Pizza Shack. They even created a chart to show this idea.
87
89
91
93
95
Matt Mitarnowski Fuzzy Jeff Shecky
Pizzas Sold
What is wrong with the statement above?Can you make a more accurate graph?
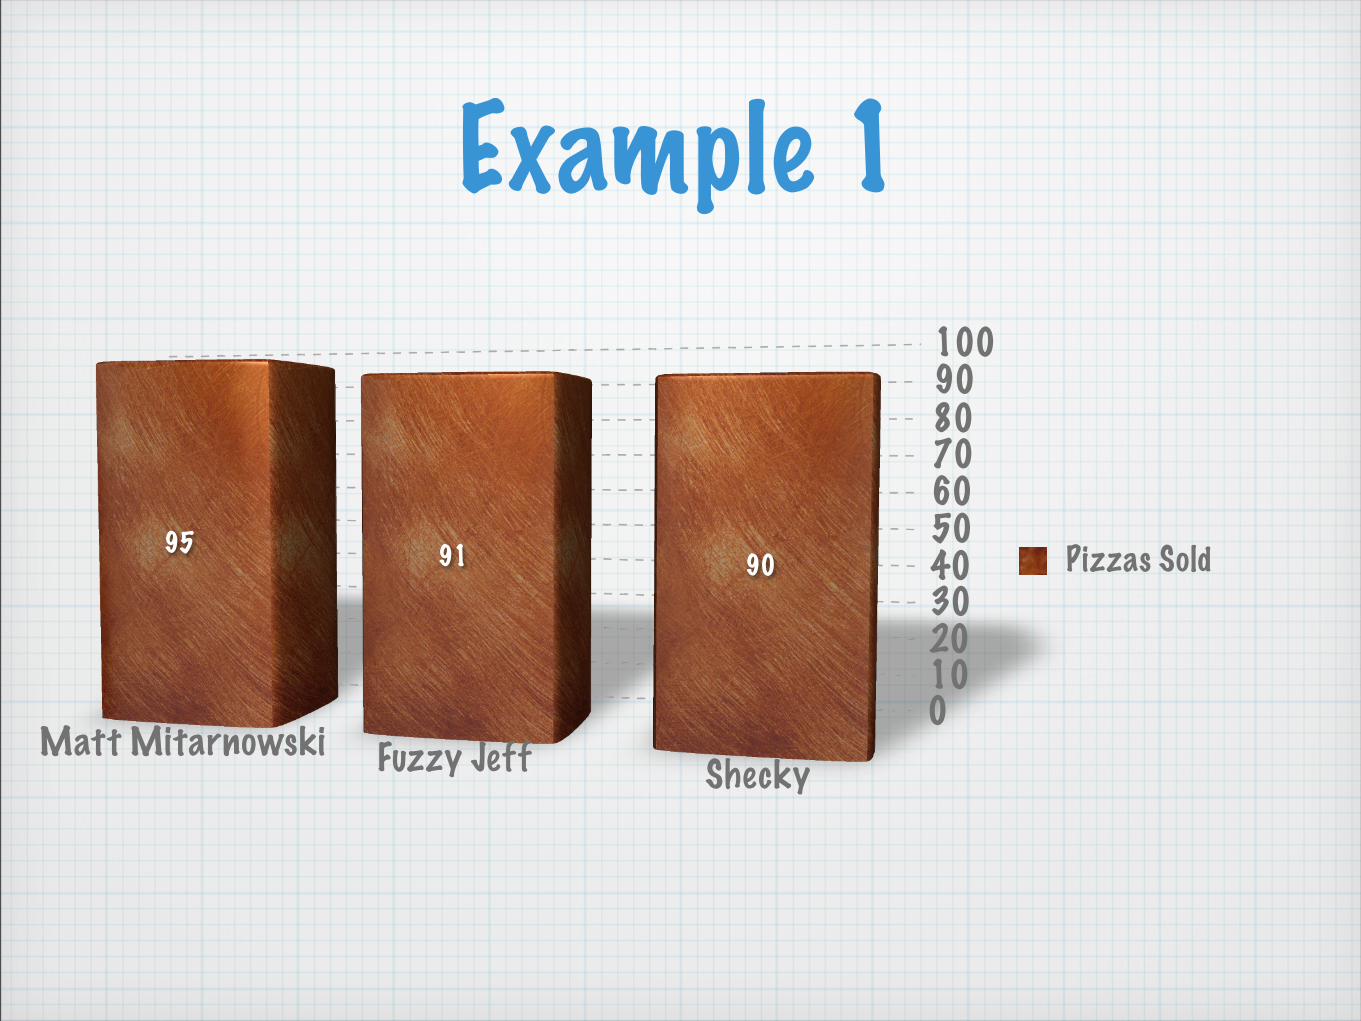
Example 1
0102030405060708090100
95 91 90
Matt Mitarnowski Fuzzy Jeff Shecky
Pizzas Sold
Edmodo Post
Find a graph online that is misleading. Copy and paste the link into a new post on edmodo (don’t
post one someone else already has). State why you believe it to be misleading. There are TONS of
graphs out there that are misleading!

Problem Set
Problem Set
p. 36 #1-19
“It is always easier to believe than to deny. Our minds are naturally affirmative.” - John Burroughs